Supercontinuum Generation in Photonic Crystal Fiber and Hollow Core Fiber for Sensing Applications Dr. Shyamal K. Bhadra Fiber Optics & Photonics Division CSIR-Central Glass & Ceramic Research Institute Kolkata, India Indo Indo Indo Indo- - -French International Workshop on Glasses and Glass French International Workshop on Glasses and Glass French International Workshop on Glasses and Glass French International Workshop on Glasses and Glass- - -ceramics ceramics ceramics ceramics June 6 June 6 June 6 June 6- - -8, 2012 8, 2012 8, 2012 8, 2012 Lille, France Lille, France Lille, France Lille, France Suported Suported Suported Suported by CEFIPRA by CEFIPRA by CEFIPRA by CEFIPRA- - -IFCPAR IFCPAR IFCPAR IFCPAR
Transcript
Supercontinuum Generation in Photonic Crystal Fiber and Hollow Core Fiber for
Sensing Applications
Dr. Shyamal K. BhadraFiber Optics & Photonics Division
CSIR-Central Glass & Ceramic Research InstituteKolkata, India
IndoIndoIndoIndo----French International Workshop on Glasses and GlassFrench International Workshop on Glasses and GlassFrench International Workshop on Glasses and GlassFrench International Workshop on Glasses and Glass----ceramicsceramicsceramicsceramics
June 6June 6June 6June 6----8, 20128, 20128, 20128, 2012
Lille, France Lille, France Lille, France Lille, France
SuportedSuportedSuportedSuported by CEFIPRAby CEFIPRAby CEFIPRAby CEFIPRA----IFCPARIFCPARIFCPARIFCPAR
Microstructured optical fibers (MOFs): a special class ofoptical fibers made up of only silica glass as the core and an arrayof air holes around the core that runs along the entire fiber length.
Guidance mechanism: Modified total internal reflection
Advantages & Applications:
•Large index contrast between silica andair gives rise to novel waveguidingproperties.
•Single material fiber no dopantsrequired.
•Enhanced design space compared tocylindrical silica fibers: high flexibilityin tailoring the design parameters.
•Extensively used for Supercontinuumgeneration, High power lasers, Bio-sensors etc.( ) 2/1222
FSMcoeff
PCF nna
V −=λ
π
( ) 2/1222clco nn
aV −=
λπ
Salient features & properties of MOFs
�Endlessly single mode behavior: Index difference between coreand cladding is smaller at shorter wavelengths whichcounteracts the trend for multimode behavior and only thefundamental mode is guided even at very short wavelengths.
�Unique dispersion properties: Zero dispersion at visiblewavelengths, multiple zero dispersion wavelengths, ultra-flattened dispersion over a very wide wavelength range.
�Enhanced nonlinearity: high-intensity light guidance in a verysmall core and strong modal confinement due to large indexcontrast between core and cladding.
Microstructured fiber fabrication: facilities at CGCRI
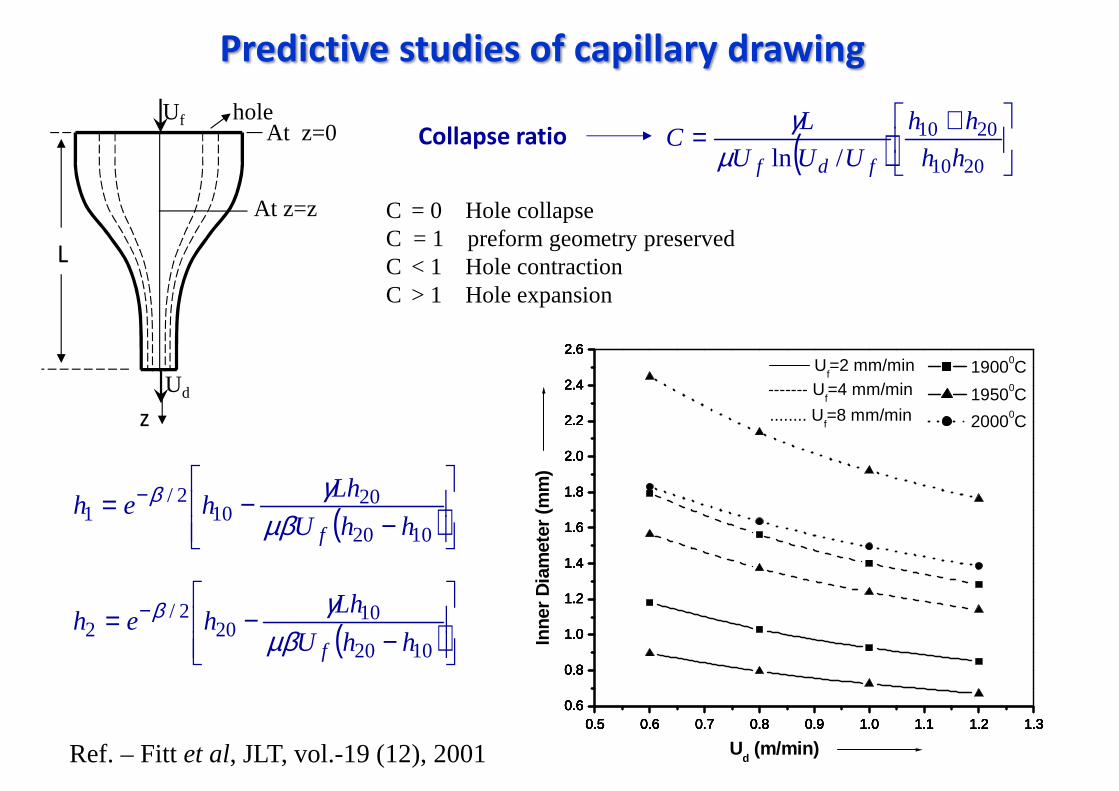
Capillaries of suitable dimensions are stacked in a hexagonal arrayaround a central silica rod using a customized V-groove assembly andput inside a silica jacketing tube. The whole arrangement forms themacroscopic preform.
V-groove assembly helps in compactstacking of capillaries to preventinterstitial spaces and obtain perfectgeometry
Ud (m/min)Ref. – Fitt et al, JLT, vol.-19 (12), 2001
Stacked capillaries in a hexagonal array
Stacked MOF preforms
PCF drawing from the existingconventional fiber drawing tower
3. MOF Drawing
Cane is inserted into a thick silica jacketing tube and thiscomposite arrangement is finally drawn down to fiber.
Final cross-section of a drawn MOF
Theoretical Modeling of MOFs by a commercial software COMSOLMultiphysics implementing the Finite Element Method (FEM).
Steps involved:•Micrograph of the fabricated MOF is traced by CAD software• Imported into the commercial module implementing FEM to solveMaxwell’s equation for that MOF structure
•Refractive index of silica taken into account through Sellmeier’s equation•Finally modal effective indices (neff) of guided modes are obtained
Dispersion in MOFs
•Novel dispersion properties achievable in MOFs: zero dispersionwavelength (ZDW) can be shifted to very short wavelengths, multipleZDWs, ultra-flattened dispersion over a very wide range of wavelength.
• Interplay of higher order dispersion coefficients and various nonlinearphenomena determines the spectral bandwidth and brightness of thegenerated Supercontinuum.
2
2
λλλλλλλλ
d
nd
cD
eff−=Dispersion is calculated using the expression:
Comparison of theoretical and experimental data of dispersion for two fabricated MOFs
Tailoring dispersion by tuning the design parameters
constant pitchand varying d/Λ
constant d/Λ and varying pitch
ΛΛΛΛd
Sunlight (/white light):
• Broad spectrum
• Low brightness
• Low directionality
• Low temporal coherence
Laser:
• Narrow spectrum
• High brightness
• High directionality
• High temporal coherence
• Broad spectrum
• High brightness
• High directionality
• High temporal coherence
Sunlight Laserknown as
Supercontinuum
Supercontinuum (SC) Generation: Phenomenon in which an ultra-short laser pulse undergoes extreme nonlinear spectral broadening togive a broadband spectrally continuous output due to the interplaybetween higher order dispersion and various nonlinear processes.
Applications: OCT, ultra-short pulse generation, designing multiwavelengthsources, optical frequency metrology, spectroscopy, etc.
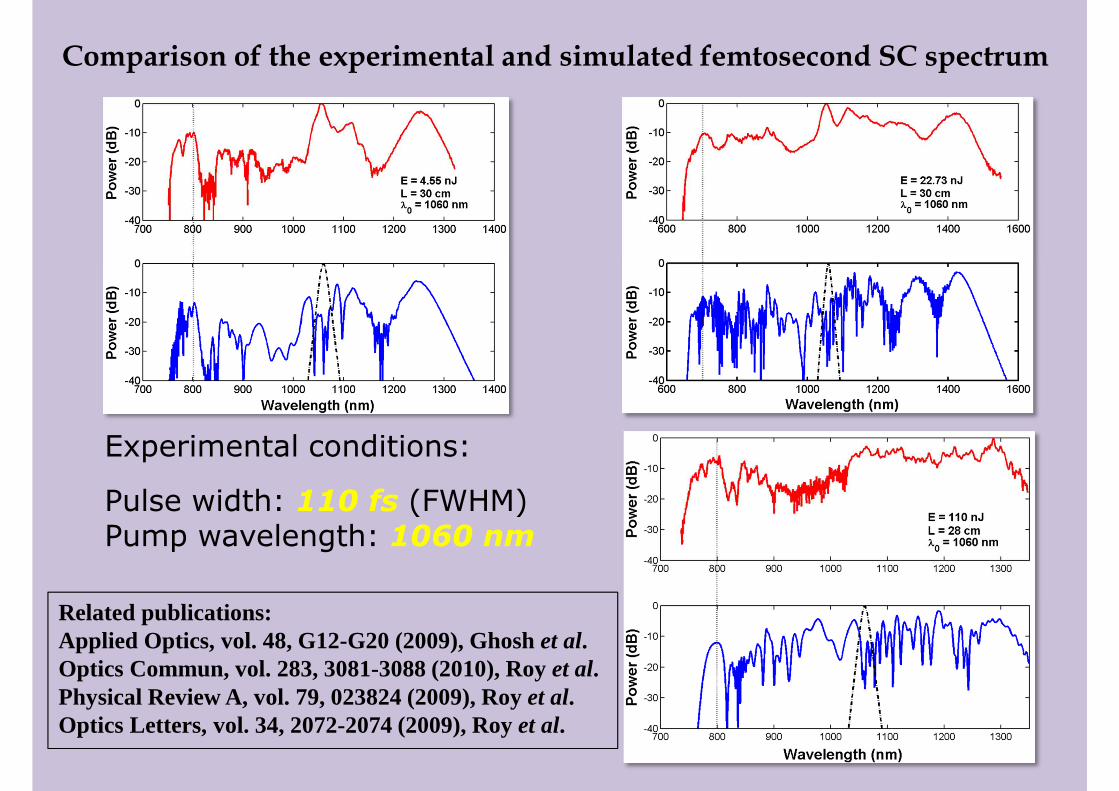
Comparison of the experimental and simulated femtosecond SC spectrum
Related publications:Applied Optics, vol. 48, G12-G20 (2009), Ghosh et al.Optics Commun, vol. 283, 3081-3088 (2010), Roy et al.Physical Review A, vol. 79, 023824 (2009), Roy et al.Optics Letters, vol. 34, 2072-2074 (2009), Roy et al.
Visible part of the SC spectrum obtained from the MOF fabricated atCGCRI dispersed by a prism. The experiment was done at Heriot-WattUniversity, Edinburgh, UK.
�39 W average output power → maximum reported till date for pulsed
sources.
�MOF design with comparatively larger core and high core-claddingindex contrast led to greater coupling efficiency (80%), highdamage threshold, improved power transmission and rapid onsetof visible SC with blue spectral components extending to about 400 nm.
SC output power vs input poweralong with the output mode profileand prism-separated white light
Evolution of continuum in 2m length ofthe MOF for 21 ps pulses at differentpump powers and rep. rate of 28 MHz
Published in Optics Express, 18 (6), 5426-5432 (2010), Chen et al.
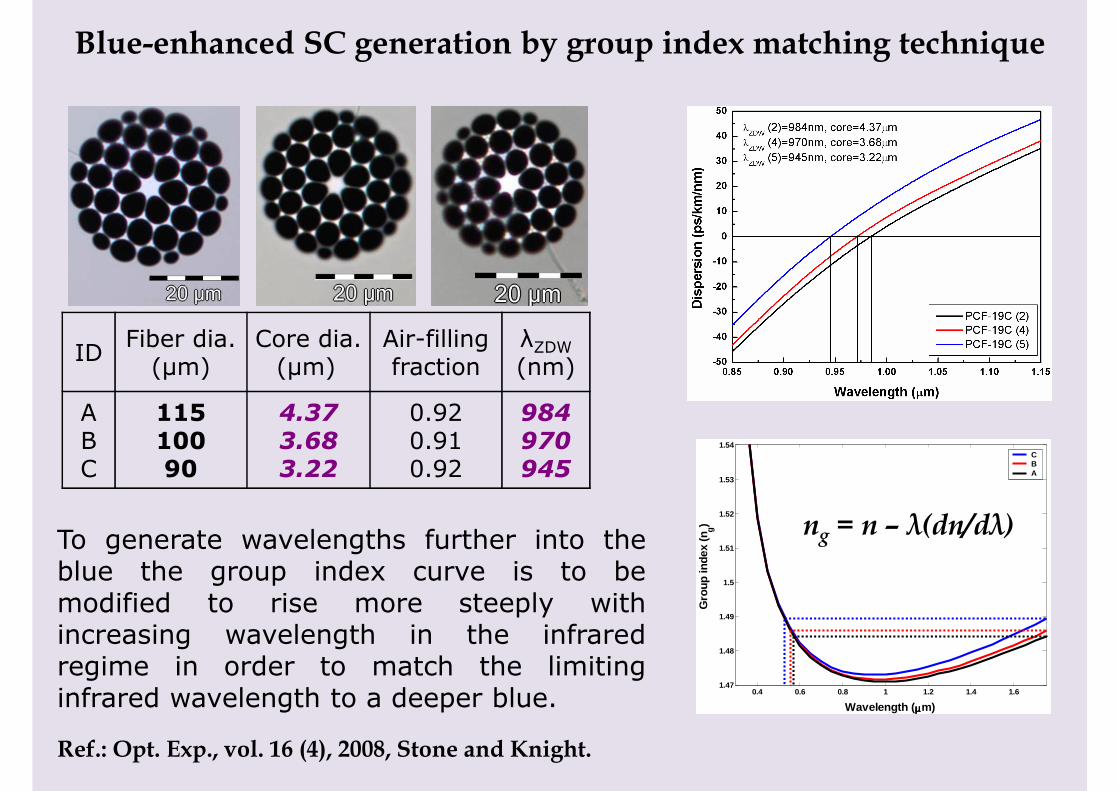
Blue-enhanced SC generation by group index matching technique
IDFiber dia.
(µm)Core dia.
(µm)Air-filling fraction
λZDW
(nm)
ABC
11510090
4.373.683.22
0.920.910.92
984970945
0.4 0.6 0.8 1 1.2 1.4 1.61.47
1.48
1.49
1.5
1.51
1.52
1.53
1.54
Wavelength (µµµµm)G
roup
inde
x (n
g)
CBA
ng = n – λ(dn/dλ)To generate wavelengths further into theblue the group index curve is to bemodified to rise more steeply withincreasing wavelength in the infraredregime in order to match the limitinginfrared wavelength to a deeper blue.
Ref.: Opt. Exp., vol. 16 (4), 2008, Stone and Knight.
Results: Observations and Optimization
λp = 1060 nmT = 600 psL = 10 m
400 600 800 1000 1200 1400 1600-40
-35
-30
-25
-20
-15
-10
-5
0
Wavelength (nm)
Sp
ectr
al P
ow
er (
dB
)
ABC
350 400 450 500 550 600 650 700 750 800-40
-38
-36
-34
-32
-30
-28
-26
-24
-22
-20
Wavelength (nm)
Sp
ectr
al P
ow
er (
dB
)
ABC
� Extent of SC spectra of MOFs Band C are almost same. Wetherefore seem to reach a limitto the short wavelength edge ofthe SC spectra.
� Although decrease in core sizeleads to shorter wavelengthgeneration, yet spectral powerof the continuum in the blueside shows steady reduction.
� No such remarkable powerreduction is observed in thelonger wavelength side.
� Optimization of the corediameter and position of thepump w.r.t. ZDW is necessaryfor generating wavelengthsdeeper into the blue region withenhanced spectral powerdensity.
MOF – B generates maximum blue-enhancedSC spectra with optimum spectral powerdensity in the short wavelength side.
Published in J. of Lightwave Technology, vol. 29, 146-152 (2011), Ghosh et al.
Possible applications:�Chemical and biological sensors�Gas-filled Raman amplifier�Laser induced micro particle guidance�Laser frequency metrology�Quantum optics
Recent development
Cross-section of a hollow core PCF fabricated at CGCRI, Kolkata
central hollow coreCane
Fiber cross-sectional view and TEM picture of Si nano-particles doped preform
Activities at Fiber Optics & Photonics Division, CGCRI
�Photonic crystal fibers
� High power optical fiber laser
Yb-doped high yttrium alumino-silicate nano-particlesbased pentagonal-shaped fibers (core dia.≈35µm aredeveloped through the conventional MCVD process withsolution doping technique. The lasing performance(81% efficiency, 17.5W output power), measured atORC, Southampton, UK is shown alongside.
�MCVD system with chelate delivery facility
The system, from Nextrom Inc., Finland has the facilityto deliver rare-earth elements in vapour phase.
�Fiber Bragg grating based sensors and devices
A prototype CCD based FBG interrogationsystem with user interface software andpackaged weldable FBG strain sensors.
0.1
0.2
0.3
0.05
0.1
0.15
0.2
Blue component due to dispersive wave in presence of 3OD
3OD present 3OD absentFrequency Domain
No Radiation
Effect of 3OD on Dispersive wave
δ3 = 0.02 δ3 = 0.03
600 700 800 900 1000 1100-80
-70
-60
-50
-40
-30
-20
-10
0
λ (nm)
Pow
er(
dB
)
600 700 800 900 1000 1100-80
-70
-60
-50
-40
-30
-20
-10
0
λ (nm)
Po
we
r (d
B)
N=3
What happen if δ3 < 0
The radiation falls in the opposite side
Frequency domainδ3 = -0.01
Low amplitude pedestal
N=2Time domain
Positive and Negative Third order dispersion (3OD)
δ3 = 0.06 δ3 = -0.06
Radiation
Radiation
δ1 = Normalised Delay
Reference
-3-2
-10
0
1
2
3
40
0.5
1
1.5
2
(ν-ν 0)T 0
ξ
Inte
nsity
NSR
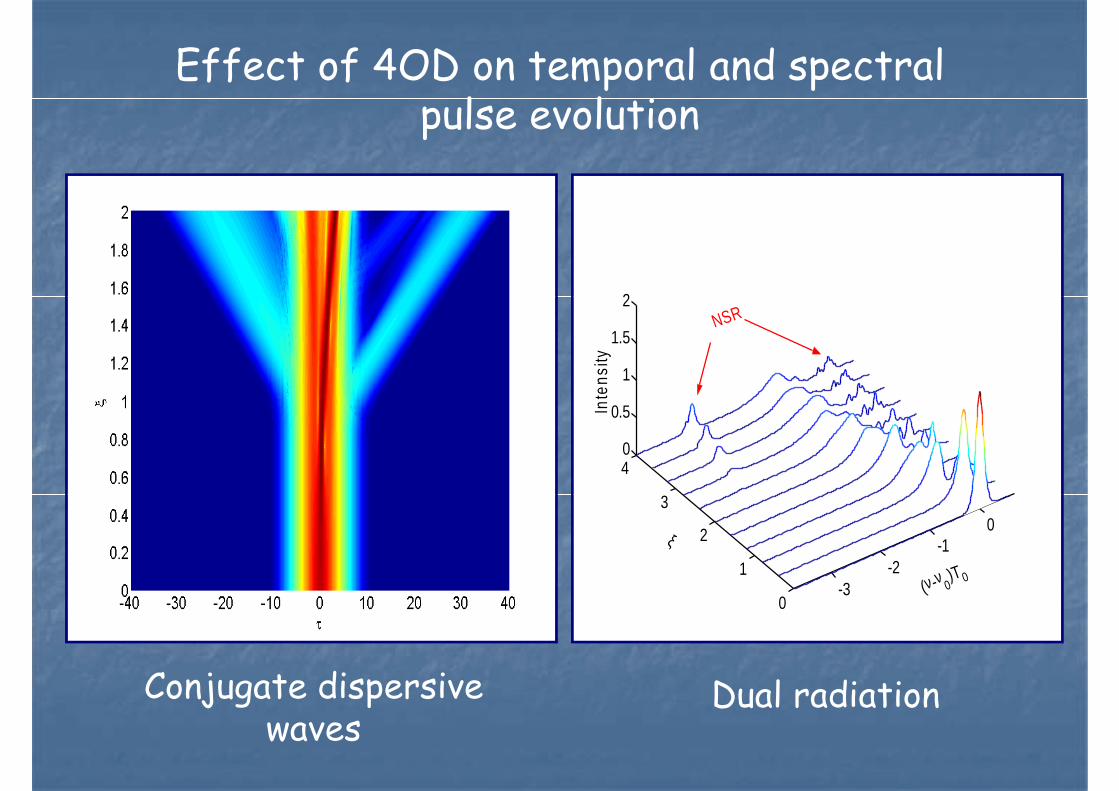
Conjugate dispersive waves
Dual radiation
Effect of 4OD on temporal and spectral pulse evolution
L=0.25 unit L=0.50 unit
L=0.75 unit L=1 unit
Spectrogram of dual radiation at various distance (N=2)
2nd ZDP
Blue
Red
Results
Evolution of frequency position and amplitude of dispersive waves as a function of fourth order dispersion for δ3 = 0 (blue), δ3 = 0.01 (red) and δ3 = 0.02 (black).
The solid curves in fig (a) represent modified phase matching condition considering higher order effects
(a) (b)
1 2 3 4 5 6 7 8 9
x 10-3
-80
-70
-60
-50
-40
-30
-20
-10
0
δ4
Pea
k po
wer
(dB
)
N=2
1 2 3 4 5 6 7 8 9
x 10-3
-6
-5
-4
-3
-2
-1
0
1
2
3
4
δ4
∆νd
T0
N = 2
Reference
All odd higher order dispersion (HOD) terms generate a single peak on the blue or red side depending on their signs. All positive even HOD terms, on the other hand, generate conjugate radiations on blue and red side. No radiation is observed for negative values of those parameters.