EVALUATING THE 4AS FRAMEWORK IN SERVING THE LOW-INCOME CONSUMER
SELF-HELP HOUSING NEEDS
Bhekizitha Mthembu
Student No: 28531745
A research project submitted to the Gordon Institute of Business Science,
University of Pretoria, in partial fulfilment of the requirements for the degree of Master
of Business Administration.
11 November 2009
©© UUnniivveerrssiittyy ooff PPrreettoorriiaa
ii
ABSTRACT
This research project investigated the applicability of the 4As framework amongst the low-
income consumers for self-help housing in South Africa based on the study by Anderson
and Billou (2007). In their research they established that in the heart of all organisations’
success in serving the low-income consumer; there is development of an approach that
delivers the 4As, namely: acceptability, availability, affordability and awareness.
South Africa, like the rest of the developing world, has a dire need to address poverty with
regards to shelter as a more visible dimension of poverty. The lack of housing delivery
has persisted despite South Africa putting in place a number of housing initiatives meant
to alleviate the housing backlog. This research was conducted under the assumption that
when people have control and responsibility over key decisions in the housing process
(self-help housing), that helps break the barrier to alleviation of poverty and lack of
reasonable housing. Recognition of any continuous improvement idea in low-cost
housing (like the 4As framework), should help strengthen the self-help housing efforts and
help the state achieve more with less effort.
The study was conducted using quantitative method - focused on the consumer
perspective and was confined to household owners whose earnings are less than R3,500
per month. This was the target group in the scope of the study regarded as the low-
income housing consumer and were designated as ‘poor’ for purposes of this study.
The study found that the 4As framework does work and can be applied in the low-income
consumer market for self-help housing needs. The research also found that affordability
and availability were the highest rated by the poor consumers confirming the theory that
affordability and availability of products amongst the low-income consumers are the main
barriers.
iii
DECLARATION
I declare that this research is my own work. It is submitted in partial fulfilment of the
requirements for the degree of Master of Business Administration at the Gordon Institute
of Business Science, University of Pretoria. It has not been submitted before for any
degree or examination in any other University. I further declare that I have obtained the
necessary authorisation and consent to carry out this research.
………………………………...
Bhekizitha Mthembu 11 November 2009
iv
ACKNOWLEDGEMENTS
The decision to embark on an MBA programme through the Gordon Institute of Business
Science has been one of the most fundamental decisions that I have taken regarding my
personal and career growth.
Now that I have come thus far, I would like to express my sincere thanks and gratitude to
the following people who have supported me in this exciting yet tough journey:
� Firstly, I would like to thank and give praise to the Lord God Almighty for giving me
courage, perseverance, health and ability to handle a project of this size.
� My beautiful and lovely wife Mumsy. Thank you so much for your support and
encouragement throughout all those sleepless nights.
� My two wonderful kids, Ntuthuko and Zime for their understanding when I had to
stop playing games with them in order to devote time to my studies.
� My supervisor Michael Goldman for the guidance and invaluable insights that he
gave me in writing this research.
� My mother Mrs J.D. Mthembu, for her prayers and support in my studies, career and
my family.
� My management and colleagues at PPC for all their support and words of
encouragement.
� To all my extended family and friends for their help in keeping my head above water
throughout this period.
� To my GIBS family – You kept me going, you are all amazing and special.
v
TABLE OF CONTENTS
ABSTRACT ................................................................................................................................... ii
DECLARATION ........................................................................................................................... iii
ACKNOWLEDGEMENTS .......................................................................................................... iv
GLOSSARY ................................................................................................................................. ix
LIST OF FIGURES......................................................................................................................... x
LIST OF TABLES.......................................................................................................................... xi
CHAPTER 1: INTRODUCTION TO THE RESEARCH PROBLEM ......................................1
1.1 INTRODUCTION .................................................................................................................1
1.2 THE RESEARCH PROBLEM...............................................................................................2
1.3 WHY USE THE 4AS FRAMEWORK? ..................................................................................5
1.4 RELEVANCE OF THIS RESEARCH TO SA BUSINESSES .....................................................6
1.5 MOTIVATION FOR THE RESEARCH ....................................................................................8
1.6 RESEARCH OBJECTIVES ..................................................................................................9
1.7 RESEARCH SCOPE.........................................................................................................10
CHAPTER 2: LITERATURE REVIEW .....................................................................................11
2.1 SOUTH AFRICAN HOUSING POLICY ...............................................................................11
2.2 CHALLENGES FOR SOUTH AFRICAN HOUSING POLICY .................................................14
2.3 A CASE FOR SELF-HELP HOUSING CONCEPT................................................................16
2.4 CONSTRAINTS STANDING ON THE WAY TO SERVE THE POOR .......................................19
2.5 CHARACTERISTICS OF LOW-INCOME MARKETS.............................................................20
2.5.1 Purchasing power ............................................................................................20
2.5.2 Location and diversity ......................................................................................21
2.5.3 Skill and awareness .........................................................................................22
vi
2.5.4 Institutions and infrastructure .........................................................................22
2.6 DEFINING THE BOP CONSUMER POPULACE.................................................................23
2.6.1 The BOP proposition - Globally .....................................................................23
2.6.2 BOP IN SOUTH AFRICA ......................................................................................26
2.6.3 Conclusion.........................................................................................................27
2.7 BOP CONSUMER BEHAVIOUR ........................................................................................28
2.7.1 Food ...................................................................................................................28
2.7.2 Housing ..............................................................................................................29
2.7.3 Energy ................................................................................................................30
2.7.4 Finance services...............................................................................................30
2.7.5 Water and sanitation........................................................................................31
2.7.6 Transportation...................................................................................................32
2.8 JUSTIFICATION OF THE 4AS FRAMEWORK.....................................................................32
2.8.1 Introduction........................................................................................................32
2.8.2 Defining the 4As (Anderson and Billou, 2007) ............................................33
2.8.3 Development of the 4As Framework.............................................................34
2.8.4 Further studies in support of the 4As framework approach ......................36
2.9 CRITICS TO CURRENT BOP THINKING ...........................................................................38
2.10 CONCLUSION OF LITERATURE REVIEW .........................................................................40
CHAPTER 3: RESEARCH HYPOTHESES ............................................................................41
3.1 RESEARCH HYPOTHESES ..............................................................................................42
CHAPTER 4: RESEARCH METHODOLOGY ........................................................................44
4.1 INTRODUCTION ...............................................................................................................44
4.2 RESEARCH METHOD ......................................................................................................44
4.3 POPULATION OF RELEVANCE .........................................................................................45
vii
4.4 SAMPLING METHOD ........................................................................................................45
4.5 SAMPLE SIZE ..................................................................................................................46
4.6 UNIT OF ANALYSIS .........................................................................................................47
4.7 QUESTIONNAIRE DESIGN................................................................................................48
4.8 DATA COLLECTION METHOD ..........................................................................................48
4.9 DATA ANALYSIS..............................................................................................................49
4.9.1 Cross Tabulation ..............................................................................................49
4.9.2 Correlation Analysis .........................................................................................49
4.9.3 Analysis of Variance (ANOVA).......................................................................49
4.9.4 Kruskal-Wallis Test ..........................................................................................50
4.10 LIMITATIONS OF THE RESEARCH....................................................................................51
CHAPTER 5: RESULTS ............................................................................................................52
5.1 INTRODUCTION ...............................................................................................................52
5.2 DESCRIPTION AND PROFILE OF RESPONDENTS ............................................................52
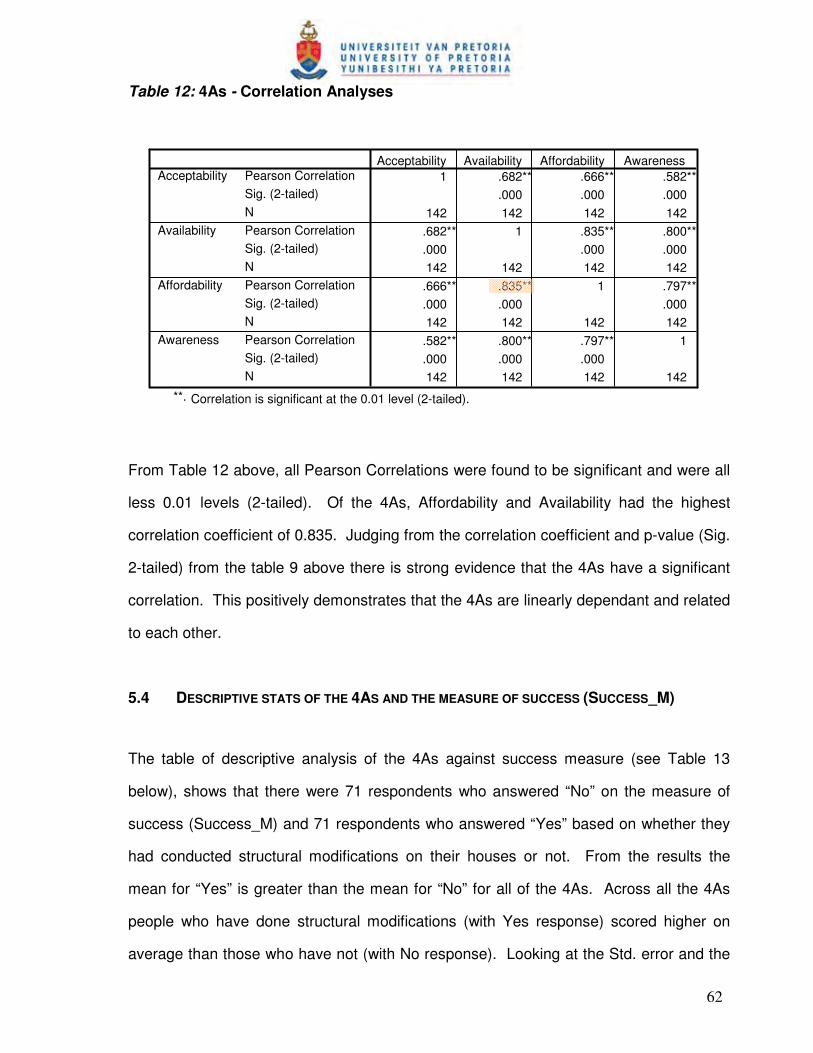
5.3 CORRELATION ANALYSES OF THE 4AS..........................................................................61
5.4 DESCRIPTIVE STATS OF THE 4AS AND THE MEASURE OF SUCCESS (SUCCESS_M).....62
5.5 SUM SCORE PERCENTAGE (%) RATING FOR EACH OF THE 4AS QUESTIONS ................64
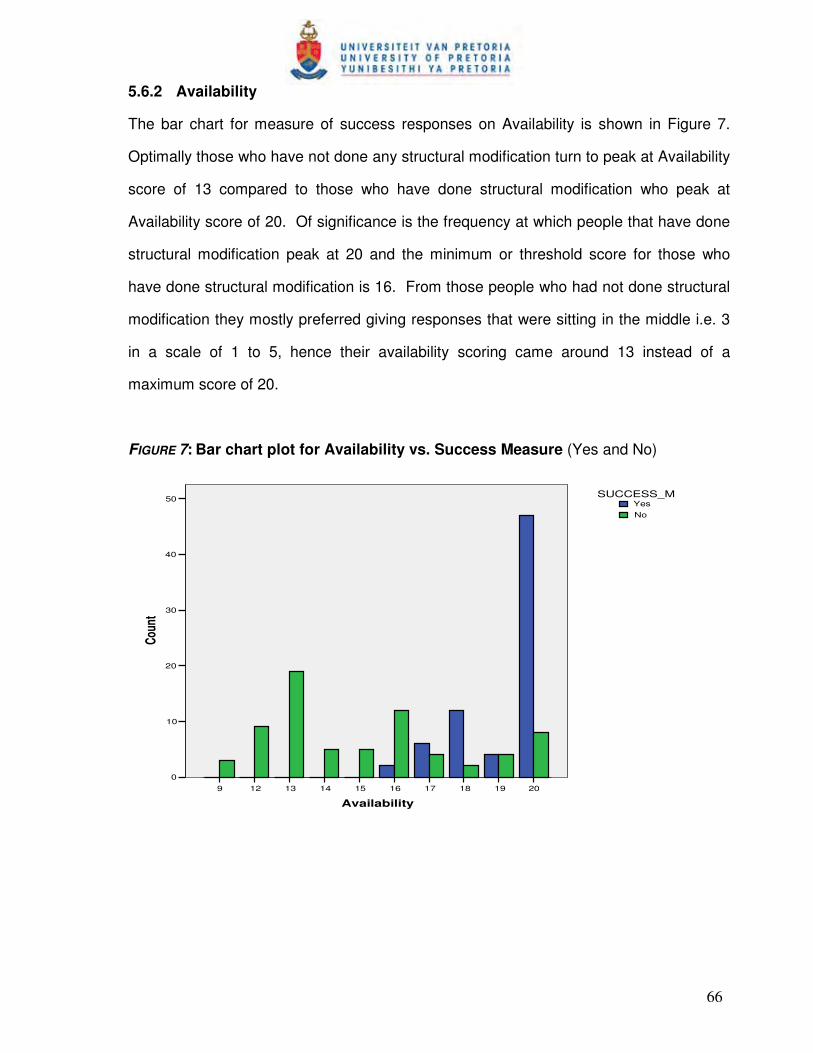
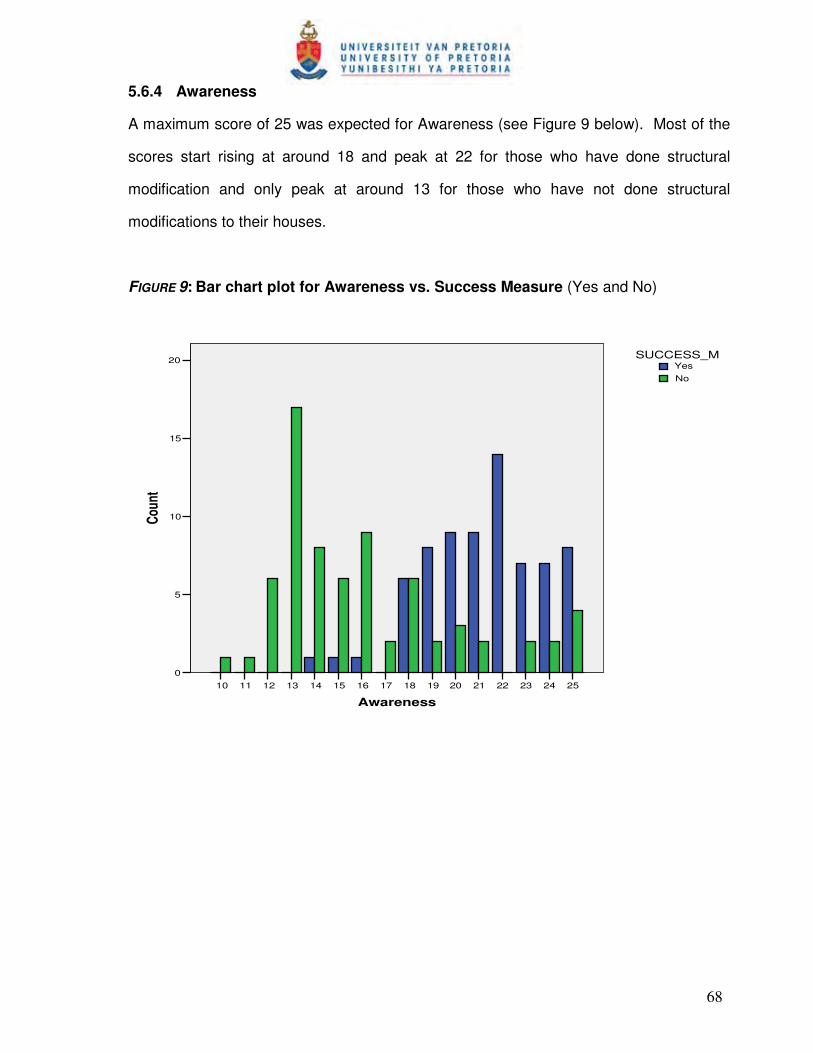
5.6 BAR CHART PLOTS FOR THE 4AS ..................................................................................65
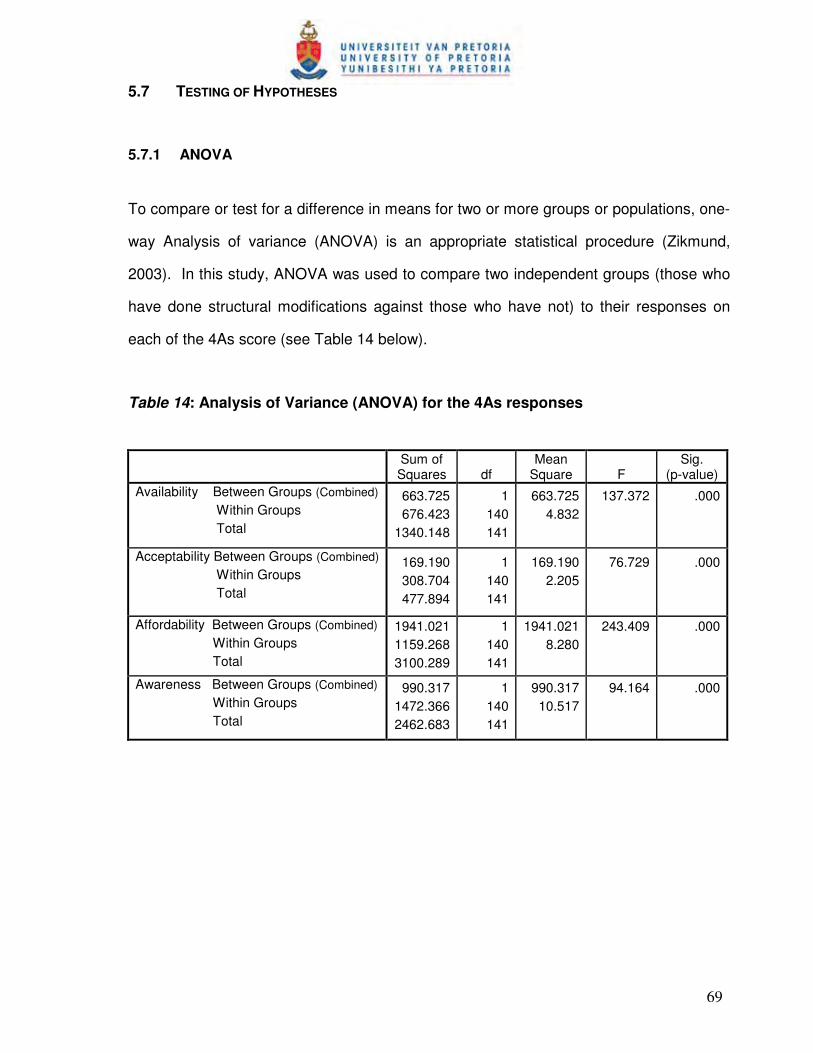
5.7 TESTING OF HYPOTHESES .............................................................................................69
5.8 ANOVA FOR THE 4AS VERSUS EACH OF THE DESCRIPTIVE ELEMENTS .......................71
5.9 KRUSKAL-WALLIS TEST .................................................................................................73
CHAPTER 6: DISCUSSION OF RESULTS............................................................................76
6.1 INTRODUCTION ...............................................................................................................76
6.2 DESCRIPTIONS OF THE SAMPLE POPULATION................................................................76
6.3 RESEARCH HYPOTHESIS ONE (Acceptability versus Success) ................................80
viii
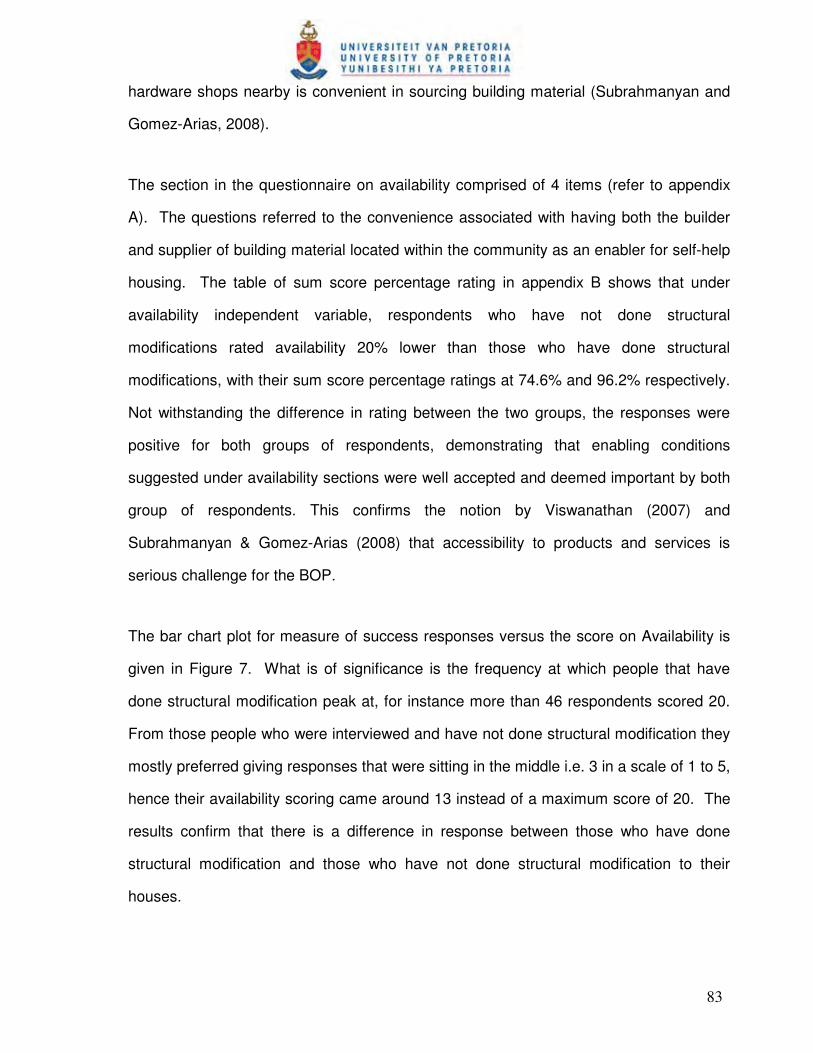
6.4 RESEARCH HYPOTHESIS TWO (Availability versus Success) ...................................82
6.5 RESEARCH HYPOTHESIS THREE (Affordability versus Success)..............................85
6.6 RESEARCH HYPOTHESIS FOUR (Awareness versus Success).................................89
6.7 SUMMARY.......................................................................................................................91
CHAPTER 7: CONCLUSION ....................................................................................................93
7.1 INTRODUCTION ...............................................................................................................93
7.2 MAIN FINDINGS AND CONCLUSIONS ..............................................................................93
7.3 PROPOSED FRAMEWORK FOR SERVING LOW-INCOME CONSUMER FOR HOUSING ........95
7.4 RECOMMENDATIONS ......................................................................................................97
7.5 FUTURE RESEARCH IDEAS ..........................................................................................102
8. REFERENCES ..................................................................................................................103
9. APPENDICES....................................................................................................................111
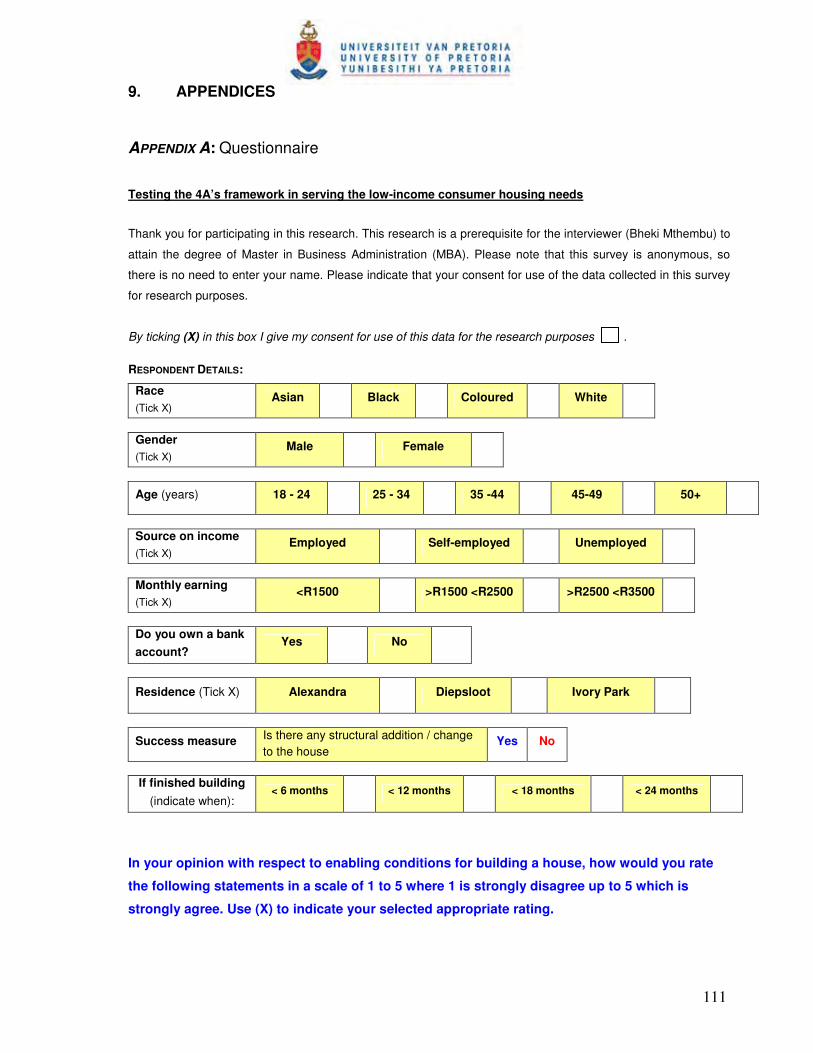
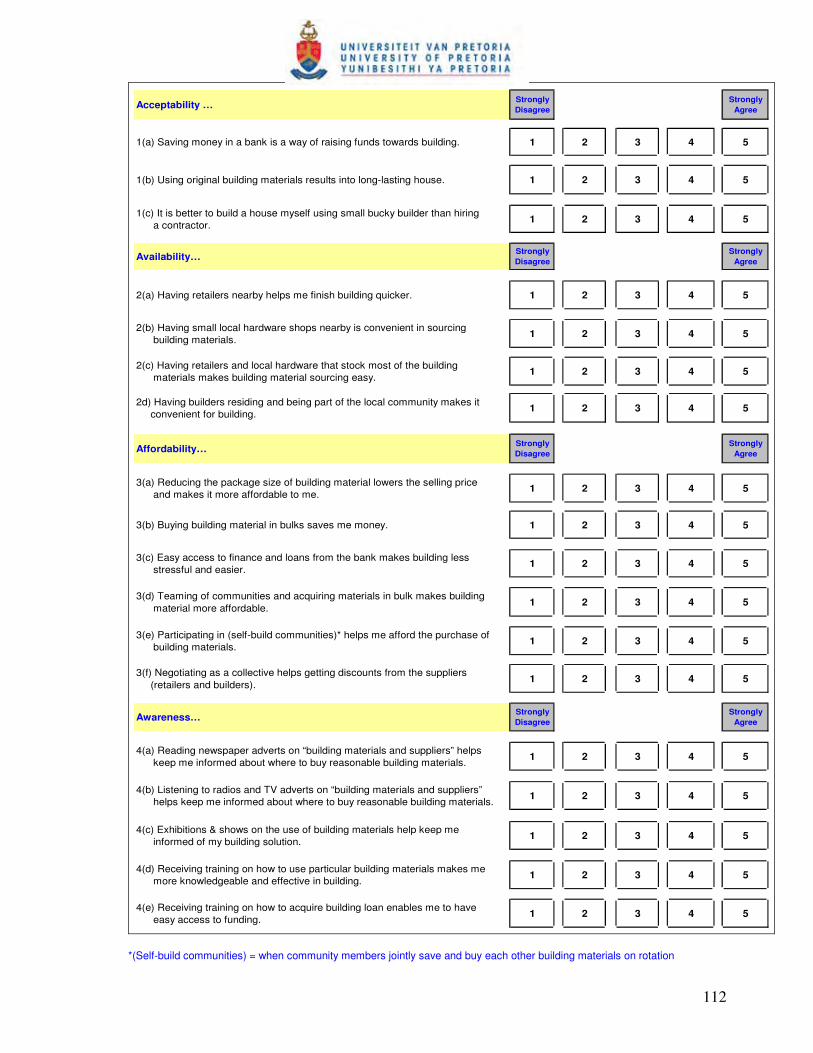
APPENDIX A: Questionnaire...................................................................................................111
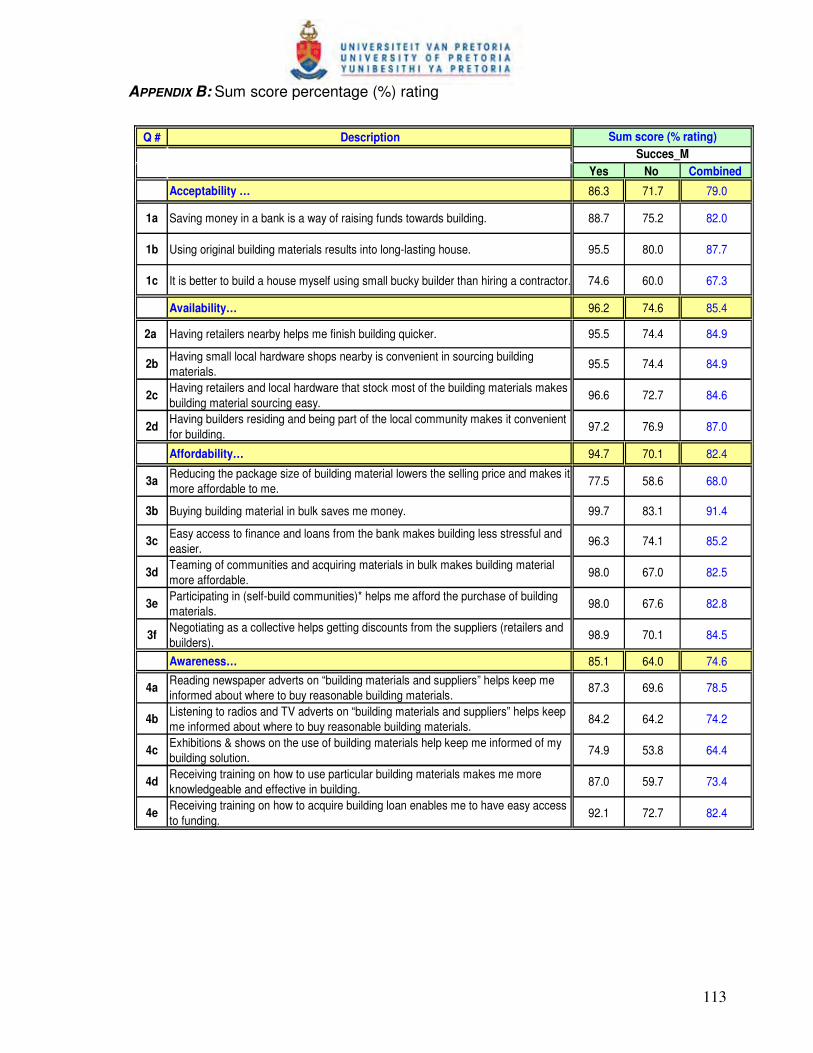
APPENDIX B: Sum score percentage (%) rating.................................................................113
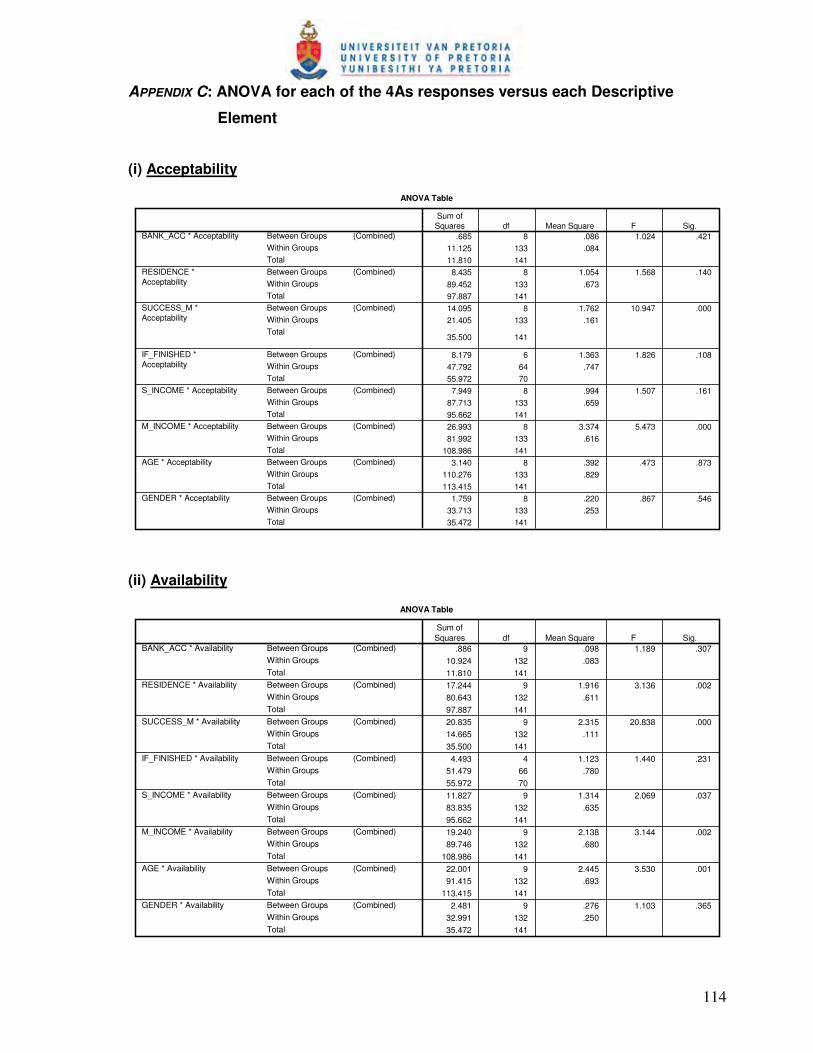
APPENDIX C: ANOVA for each of the 4As responses versus each Descriptive ...........114
ix
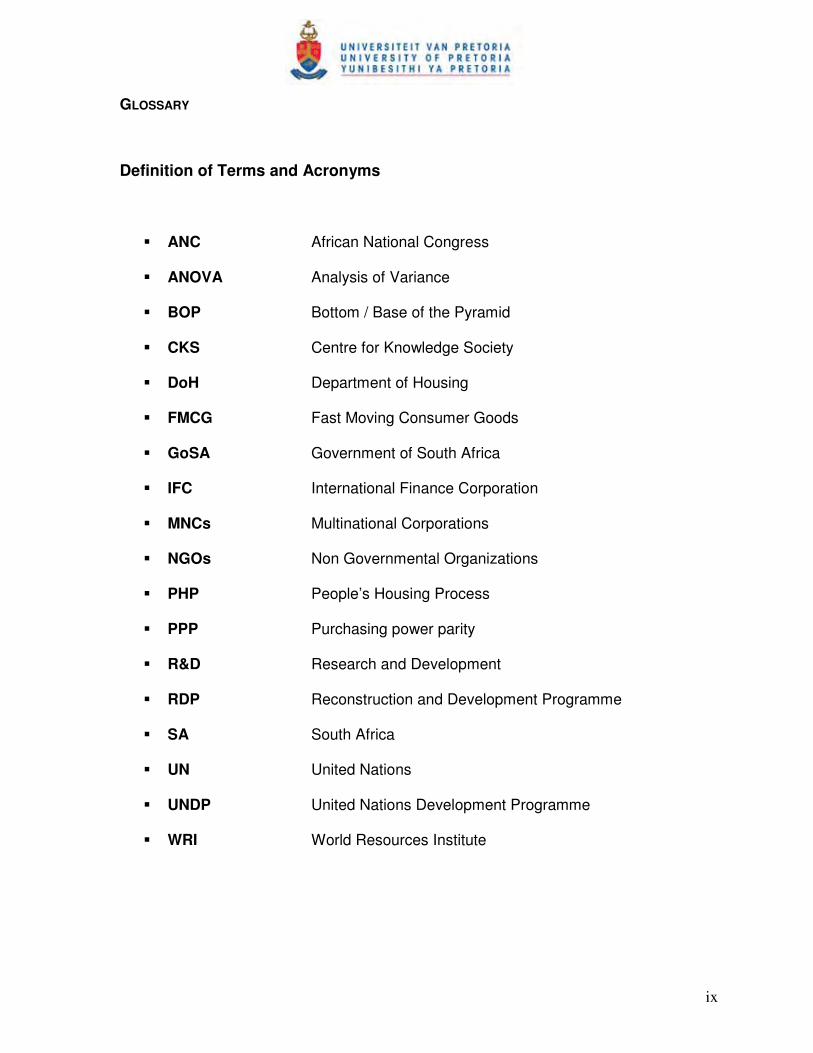
GLOSSARY
Definition of Terms and Acronyms
� ANC African National Congress
� ANOVA Analysis of Variance
� BOP Bottom / Base of the Pyramid
� CKS Centre for Knowledge Society
� DoH Department of Housing
� FMCG Fast Moving Consumer Goods
� GoSA Government of South Africa
� IFC International Finance Corporation
� MNCs Multinational Corporations
� NGOs Non Governmental Organizations
� PHP People’s Housing Process
� PPP Purchasing power parity
� R&D Research and Development
� RDP Reconstruction and Development Programme
� SA South Africa
� UN United Nations
� UNDP United Nations Development Programme
� WRI World Resources Institute
x
LIST OF FIGURES
Figure No. Description Page No.
Figure 1: The World Economic Pyramid………………………………………24
Figure 2: South African Economic Pyramid…………………………………..27
Figure 3: How poor consumers spend their money………………………….29
Figure 4: The 4As framework of addressing low-income consumers……...33
Figure 5: Solutions for the BOP………………………………………………..35
FIGURE 6: Bar chart plot for Acceptability vs. Success Measure…………....65
FIGURE 7: Bar chart plot for Availability vs. Success Measure………………66
FIGURE 8: Bar chart plot for Affordability vs. Success Measure……………..67
FIGURE 9: Bar chart plot for Awareness vs. Success Measure……………...68
FIGURE 10: The modified 4As framework for serving low-income consumer for
Housing………………………………………………………………..96
xi
LIST OF TABLES
Table No. Description Page No.
Table 1: Government Subsidies………………………………………………….……13
Table 2: BOP population and income ………………………………………………...25
Table 3: Corp. strategies in response to low-income markets barriers…………...37
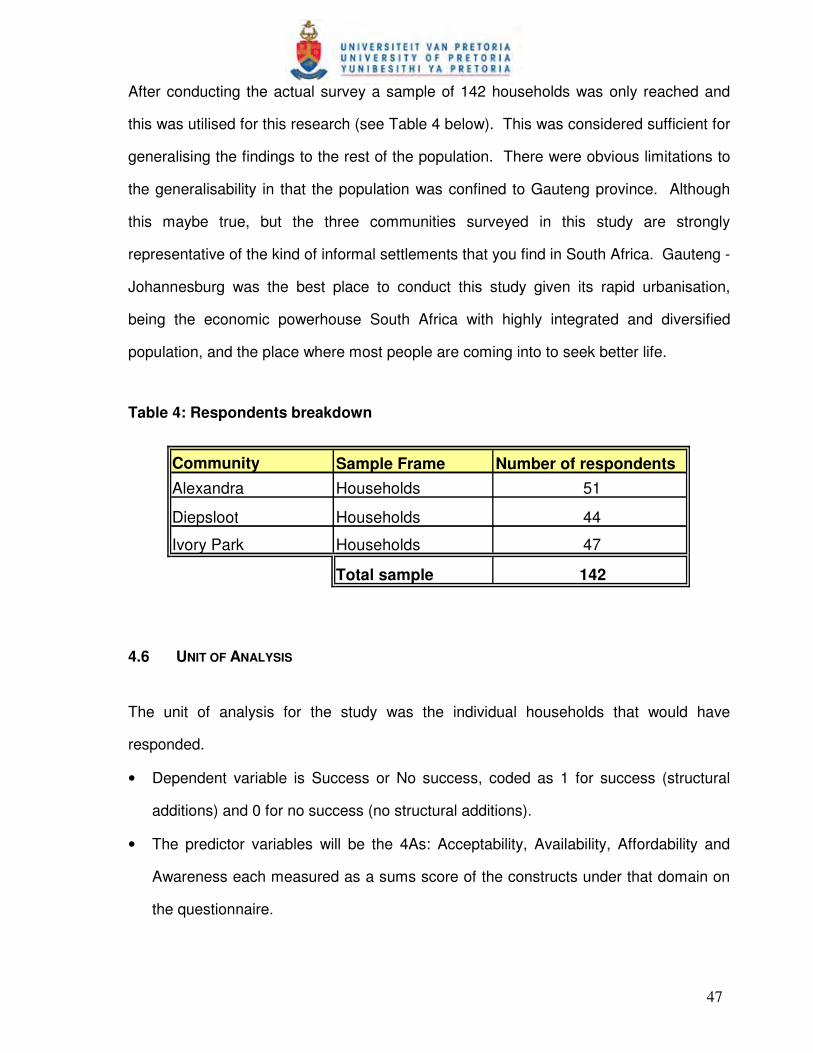
Table 4: Respondents breakdown…………………………………………………….47
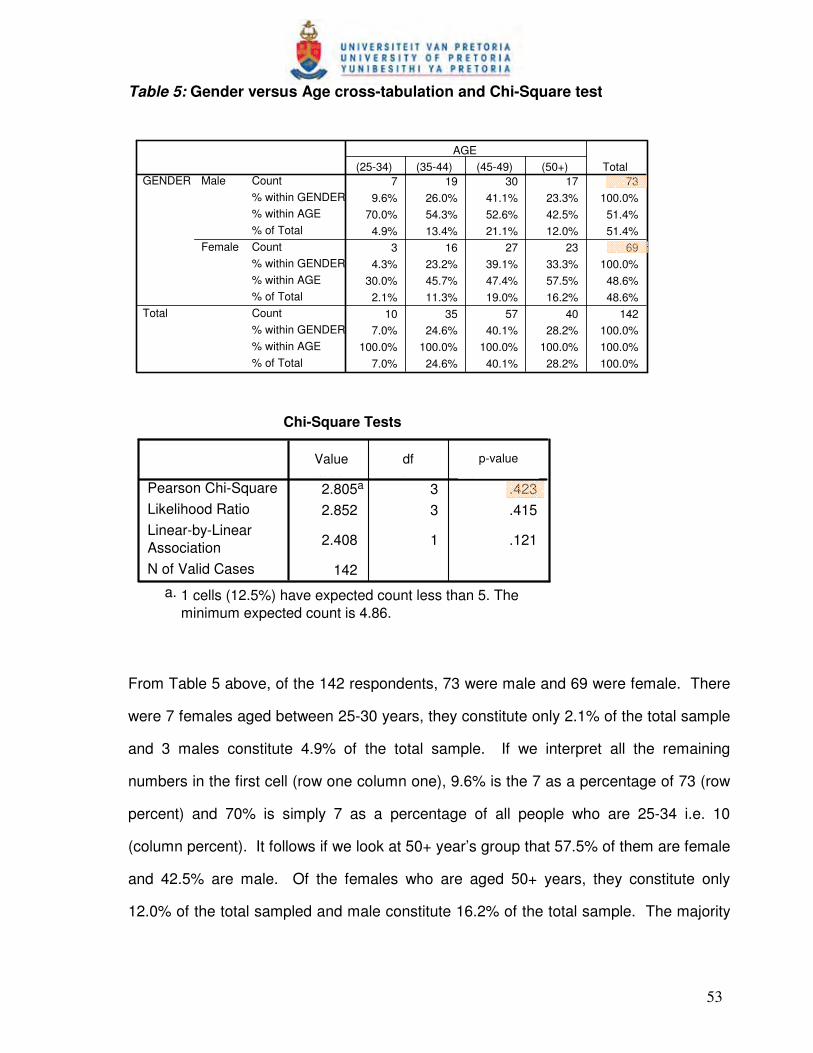
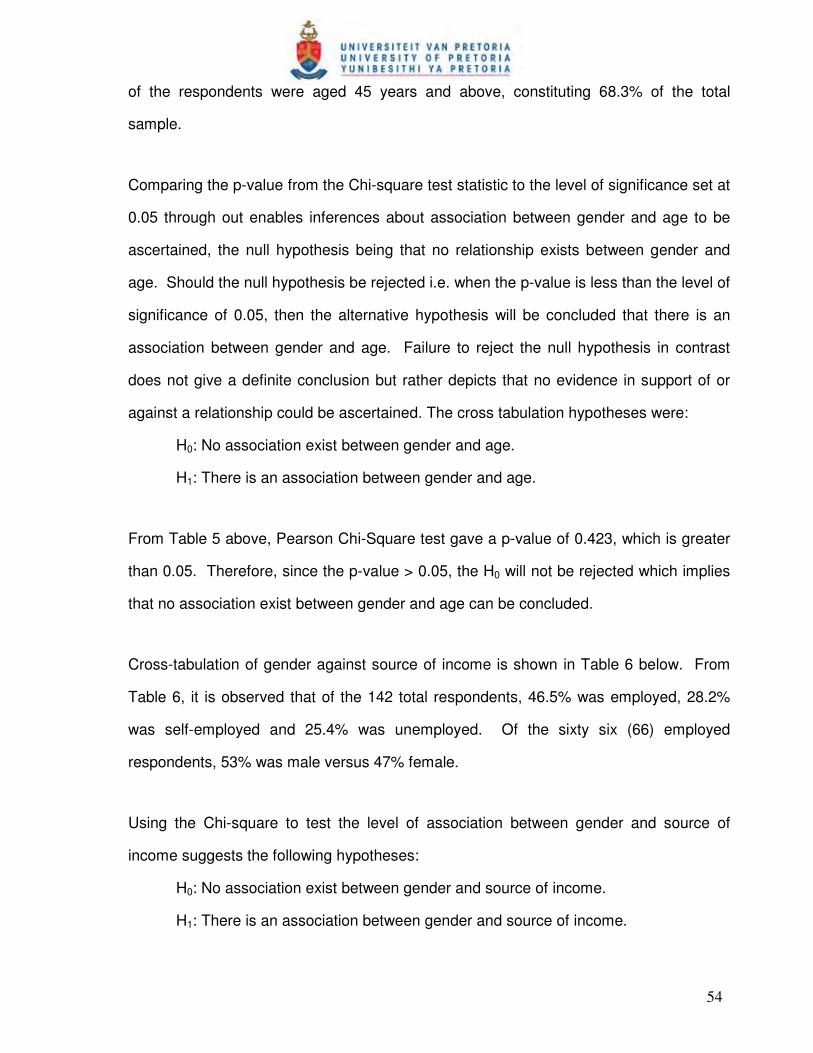
Table 5: Gender vs. Age cross-tabulation and Chi-Square test…………………...53
Table 6: Gender vs. Source of income cross-tab. and Chi-Square test…………..55
Table 7: Gender vs. Monthly income cross-tab. and Chi-Square test………….....56
Table 8: Gender vs. Owning a Bank acc. cross-tab. & Chi-Square test…………..57
Table 9: Gender vs. Finishing period cross-tab. and Chi-Square test………….....58
Table 10: Finishing period versus Monthly income cross-tabulation….….. …….....59
Table 11: Finishing period versus Owning a Bank account cross-tabulation …......60
Table 12: 4As - Correlation Analyses..…………...…………...…………...…………..62
Table 13: Descriptive analysis of the 4As against Success measure…………..…..63
Table 14: Analysis of Variance (ANOVA) for the 4As responses……………………69
Table 15: Kruskal-Wallis Test for the 4As responses…………………………………74
CHAPTER 1: INTRODUCTION TO THE RESEARCH PROBLEM
1.1 INTRODUCTION
South Africa, like the rest of the developing world, has a dire need to address poverty
with regards to shelter as a more visible dimension of poverty (Marais, Van Rensburg
and Botes, 2003). Access to housing and secure accommodation is an integral part of
government’s commitment to reducing poverty and improving the quality of people’s
lives. Low cost housing remains a major challenge to government post-apartheid South
Africa, as the government attempts to address inequalities, poor municipal service
delivery and rapid urbanisation (Marais, Van Rensburg and Botes, 2003).
The White Paper on Housing of 1994 prioritised the needs of the poor and promised to
deliver one million houses in five years. This has been done through community
participation and the private sector (Goebel, 2007). Although housing delivery has been
substantial since 1994, the sector is facing challenges relating to coordination. Clearer
lines of accountability are necessary to ensure government meets its responsibility
towards both poor and low-income households for them to have access to adequate
housing and the housing market.
The lack of housing delivery has persisted despite South African Government having put
in place a number of housing initiatives to help alleviate the housing backlog (Kajimo-
Shakantu and Evans, 2006). The Department of Housing (DoH) annual report (2007)
bears testimony to Kajimo-Shakantu and Evans’ view that despite the delivery of 2
million subsidised houses since the inception of the new housing programme in 1994,
the housing backlog has continued to grow and was estimated at some 2,4 million units
in mid 2007 (Department of Housing, 2007).
2
According to the Department of Housing (2007, p. 17) “if the size of the economy is
compared with that of the population of the country, there are indications that the
average share of each individual South African in the economy is above R30 000”.
Despite this, more than 25% of the South African population is unemployed and is
excluded from benefiting from the economy and consequently have limited means to
provide for their needs, including housing needs.
This research sought to investigate whether the 4As framework can help alleviate the
challenges faced with respect to lack of housing amongst the low-income consumers in
South Africa as proclaimed in the study “Serving the world’s poor: Innovation at the Base
of the Economic Pyramid” by Anderson and Billou (2007), or not. The 4As framework
stands for acceptability, availability, affordability and awareness.
1.2 THE RESEARCH PROBLEM
According to Pillay and Naude (2006) the inherited housing backlog in South Africa is
largely a result of high levels of urbanisation, poverty, and high unemployment, together
with the history of apartheid and separate development. Redressing the inherited
inequalities of apartheid has meant a complex and challenging context for meeting basic
needs in contemporary South Africa and given the physical and political segregation of
apartheid, meeting the demand for housing has been a central development challenge
since 1994 (Pottie, 2004). The importance of the need for housing is amplified as the
concept of accessibility is now entrenched in the South African Constitution; “Everyone
has the right to have access to adequate housing” and that “the state must take
reasonable legislative and other measures with its available resources, to achieve the
progressive realisation of this right” (Pottie, 2004, p. 607).
3
Housing for many households around the world is both the largest expense and the most
important asset and is also an important determinant of quality of life. A well functioning
housing market influences not only as shelter to people; but can improve public health by
reducing the outbreaks of diseases, stimulate economic growth through own job creation
and also be used as workplaces for home-based entrepreneurs. Housing can also have
social spin offs by influencing the reduction of crime (Warnock and Warnock, 2008).
Warnock and Warnock (2008) further argued that access to housing increases the
number of bankable projects as houses can be used as collateral to access finance for
business purposes. In addition, efficient delivery of housing enhances social capital in a
community. Social capital is very important for economic development as evidenced by
the recent xenophobia attacks in early 2008 in several parts of South Africa; these
attacks were purportedly sparked off by the lack of adequate housing, among other
reasons.
On her 2008/9 Budget Vote speech to the National Assembly on 28 May 2008, the
Honourable Minister of Housing, Lindiwe Sisulu, said:
“Conditions of poverty, especially within the informal settlements are unacceptable. We
have drawn attention to this ad museum. It is precisely on this realization that we, as the
Housing sector have prioritised the informal settlement eradication and have given it a
target date. For this we would like to mobilise the rest of government and civil society to
join us. In a country with our level of economic development, it is not justifiable to have
these pockets of poverty and vulnerability where the poor scramble for scant resources
and when they experience periods of severe hardship, their frustration knows no moral
bounds” (Sisulu, 2008, p.1).
4
Furthermore, the high rate of unemployment is expected to remain so for a longer period
of time, and this will continue to force millions of South Africans to rely on government for
free housing and service provision. Continuation of the status quo where the economy
fails to respond adequately to unemployment and the creation of resources for
government will impede on eradication of informal settlements in the country and poverty
alleviation (Pillay and Naude, 2006). What can be acknowledged by most is that
Government alone cannot solve the problem of housing. Both the Government and the
private sector need to join hands towards eradicating informal settlements in South
Africa. Delivery of infrastructure in South Africa is characterised by huge backlogs
challenges.
It is against the above backdrop that this research sought to investigate whether the 4As
framework can help in better serving the needs of the low-income consumers for self-
help housing in South Africa as proclaimed in the study “Serving the world’s poor:
Innovation at the Base of the Economic Pyramid” by Anderson and Billou (2007), or not.
The 4As framework was developed to address issues that companies need to keep in
mind when trying to develop successful strategies for serving low-income consumers.
This research assesses the framework by not looking into companies, but rather the end
consumers themselves in confirming whether they would agree with most of the factors
suggested by Anderson and Billou with respect to better serving their needs. Should this
be true, it will ultimately help low-income consumers to access the products/services in
their self-help housing and alleviate housing backlog that has persisted for a long time in
the low-income market in South Africa.
5
1.3 WHY USE THE 4AS FRAMEWORK?
The 4As framework is based on Anderson and Billou‘s research (2007) on how best
customers at the bottom of the economic pyramid in various industries could be served.
Their research employed methodology based on enquiry, analysis and testing. It aimed
to articulate best practices as companies deal with the challenges of serving low-income
consumers in developing markets and in many instances explores strategies that are still
evolving.
In their research they found that in the heart of all the organisations’ success in serving
the low-income consumer is the development of an approach that delivers the 4As
namely: Availability, Affordability, Acceptability and Awareness (see Figure 1, in the
literature review). The 4As framework has been endorsed by ATKearney, the global
strategic management consulting firm (Pfeiffer, Massen and Bombka, 2007). Since its
inception over the past two years it has been cited and referenced in a couple of
academic articles, journals and peer reviewed publications; which are listed in the
literature review (Chapter 2) section of this study.
In this research, the arguments and factors mentioned in different case studies of
Anderson and Billou‘s research are examined to confirm whether from the consumers’
perspective these conditions would really work or not. The author agrees with United
Nations Development Programme (UNDP) (2008) report on the notion that “businesses
know too little about poor people - what they prefer, what they can afford and what
products and capabilities they have to offer as employees, producers and business
owners”. It is therefore critical that the consumer perspective is tested, hence this
research. Whether or not this framework can help South Africa address the low-income
market housing needs and whether or not it does work are aspects evaluated and
discussed in this research.
6
1.4 RELEVANCE OF THIS RESEARCH TO SA BUSINESSES
The poor often do not share in the benefits of globalization, and there is growing
awareness that traditional development solutions have not worked (Hammond and
Prahalad, 2004). Hammond and Prahalad (2004) warn that if businesses ignore the
bottom of the economic pyramid, they miss most of the market. In recent years,
business and international development communities have become increasingly
interested in creative new business models and strategies to engage low-income
communities (also known as Bottom / Base of the Pyramid - BOP) (Jenkins, Ishikawa,
Barthes and Giacomelli, 2008). The BOP appears to introduce a completely new
international context with a unique set of new stakeholders; furthermore, it appears to
require disruptive innovation in technologies, products, as well as business models
(Prahalad and Hart, 2002). The phrase and concept of the "Bottom of the Pyramid"
originated from the work of professors Stuart Hart and C.K. Prahalad in their seminal
2002 article "The Fortune at the Bottom of the Pyramid" (Prahalad and Hart, 2002).
The theory of disruptive innovation (Christensen, 1999) suggests that existing
mainstream market are the wrong place to look for major new waves of growth.
Essentially Prahalad and Hart propagate that this approach should be viewed as a viable
market to do business with, thus advancing the profit objectives of Multinational
Corporations (MNCs) and that of the BOP market. In particular, if SA businesses could
identify potential indigenous market clusters in the BOP market; they can be a source of
inter-organisational partnering between MNCs and local firms which are profitable.
Global spanning networks could link local firms to skills and resources they often lack
(e.g. financing, accounting, training, R&D, and branding) and connect MNCs to
distinctive cultural resources and products high in perceived authenticity and even quality
(Ger, 1999).
7
According to Christensen, Craig and Hart (2001) the poor stand to benefit in several
ways when large companies target them as consumers. Access to new products,
expanded choices and increased purchasing power would improve quality of life.
Additional benefits such as new services and information that improve efficiency would
help increase productivity and raise incomes among poor citizens.
“Savings are important in low-income housing finance for several reasons. While on the
one hand they bring in the much-needed additional finances for home improvement, on
the other hand consistent savings demonstrate affordability, not only of housing finance,
but also of home ownership” (Mthweku and Tomlinson, 1999, p.14). It is through savings
that individuals can fund their housing initiatives without the government and the private
sector support. Omenya and Talukhaba (2005, p. 10) states “Recognition of small-scale
continuous investment in low-cost housing could help in strengthening their self-help
housing efforts and help the state achieve more with less effort”.
Mexico’s cement producer, CEMEX is a case in point where a payment system is
offered, Patrimonio Hoy, which allows low-income families to purchase houses in
instalments - giving those at the “bottom (or base) of the pyramid” (BOP) access to
services, cement and other building materials through a group savings programme.
Other examples of companies with multinational strategies are Unilever and BAT
(Sharma and Hart, 2006). Unilever’s Indian subsidiary, Hindustan Lever, for example, is
seen by local consumers as an Indian company, run by Indians, with products tailored to
Indian tastes.
There is a need for such strategic intervention for the low-income consumer in housing.
It is such innovative strategies and a lot more that this research intends to explore in
relation to the low-income consumer for housing. For most firms, business with the poor
will not be business as usual. According to UNDP (2008) the greatest obstacle in
8
serving the poor is the lack of information about the poor. Maybe once all stakeholders
know and are able to address the requirements of the poor, eradication of poverty and
inequality could become reality where all South Africans live a better life.
1.5 MOTIVATION FOR THE RESEARCH
Generally, poverty is an economic, social, political and moral problem. Eradicating it or
at least making attempts to alleviating it must be an ongoing and urgent challenge. For
many decades, local governments, developed country governments, international
organizations (such as the World Bank and the United Nations), aid foundations and
non-governmental organizations have tried measures meant to address this challenge.
The lack of resources discourages companies from providing the basic goods and
services that would empower them and would improve their lives. Those who encourage
market-based approaches argue that finding appropriate ways to satisfy the unmet
needs of lower-income communities can bring enhanced opportunities for these
communities, in terms of access to better products as well as employment (SadreGhazi,
2008).
Because of the limited economic opportunities, low-income communities have often been
unable to contribute to or benefit from growing market economies. Furthermore, even
when such opportunities do occur, the poor are generally unable to take advantage of
these opportunities because of lack education and credit. Hart (2005, p. 143) states “If
we can gain a better understanding of the constraints that influence the behaviour, we
can construct new business models designed to remove these constraints and profit in
the process”. It has been widely argued by Prahalad (2005), Hart (2005) and Hammond
et al (2007) that a large share of the world population i.e. those who live in the low-
income communities of developing countries, are not adequately included in the global
9
economy and have limited access to products, markets and opportunities to develop
themselves.
If the 4As framework approach of addressing low-income consumers that was developed
by Anderson and Billou (2007) is going to help with better serving of their housing needs,
there is a need therefore for assessment and testing of this framework. The 4As
framework is the normative model, (i.e. can be used across the whole range of
consumers, including the low-income consumer for housing).
This research seeks to assess and gain better understanding of the constraints that
hamper progress into self-help housing for low-income consumers while testing the 4As
framework. So far, the intellectual discourse has been largely in the fields of public
policy and development economics. More recently, management experts and business
schools have entered this arena. C.K. Prahalad has been one of the pioneers of this
movement and is certainly the most prolific writer in this field to date. “Except for a few
exceptions (e.g. Seelos and Mair, 2007; Anderson and Billou, 2007), most of current
literature has not addressed how appropriate business and innovation strategies could
be specifically devised and implemented to address low-income markets” (SadreGhazi,
2008, p.2).
1.6 RESEARCH OBJECTIVES
The objectives of the research can be summarised as follows:
• To assess the 4As framework in serving the low-income consumer’s self-help
housing needs.
• To identity the impact each of the A’s has in serving the self-help housing needs.
• To make inferences and recommendations where necessary on what can be
done to better serve the low-income consumers for housing.
10
The research will therefore test the assumptions embedded in the 4As approach for
addressing the needs of the low-income consumers for housing.
1.7 RESEARCH SCOPE
When private sector organisations tap into the low-income consumers, this should
stimulate commerce and development in low-income segments, and result in improved
lives for the people, including the creation of a more stable and inclusive world (Sánchez,
Ricart and Rodríguez, 2007). The specific communities targeted given their accessibility
among other factors include low-income households sampled in the following informal
settlements: (a) Alexandra; (b) Diepsloot and, (c) Ivory Park. These communities were
chosen out of convenience and easy access given their location.
In line with the current limit for accessing government grant for housing, this study shall
be confined to those household owners whose earnings are less than R3,500 per month.
This is the target group in the scope of this study regarded as the low-income housing
consumer and will be designated as ‘poor’ for purposes of this study. Most of the houses
in the above targeted townships were built via the government’s Reconstruction and
Development Programme (RDP). Common to these communities are the levels of
poverty, poor living conditions and low quality of life. The measure of success for this
targeted population will be any structural modification/s or change/s in the house
conducted by the owner using his/her own income in the past two years.
11
CHAPTER 2: LITERATURE REVIEW
Literature review will examine the behaviour of the BOP consumer positions and help
place the study within the domain of academic research. The status quo with respect to
South African Housing Policy will be discussed, followed by some challenges thereof. It
will also cover the emergence of the self-help housing concept as a better alternative to
housing the poor and the constraints standing on the way to serve the needs of the poor.
The characteristics of the low-income market and the definition of the BOP for both the
global context and the South African context will be discussed. Justification for the
research to test the 4As framework amongst the low-income consumer for housing
including the definition, development and supporting studies for the 4As framework will
be discussed. In the conclusion, one looks at some of the points for and against the
current BOP thinking.
2.1 SOUTH AFRICAN HOUSING POLICY
Housing delivery in the developing world is characterised by an extreme scarcity of
resources and remains a challenge for any government. Housing delivery policies are
aimed at providing quality products and services which ensure living standards
conducive to the comprehensive development of previously marginalised recipients
(Marais and Wessels, 2005). The quantity must be such that the majority of people living
under precarious conditions in informal settlements are assisted as soon as possible.
One school of thought is that the right to housing does not mean that governments are
supposed to construct houses for the entire population but rather, is more concerned
with the obligation of the state not to act in a way that will undermine the opportunity of
households to gain access to housing (Marais and Wessels, 2005).
12
According to Marais and Wessels (2005); there can be very little doubt that the South
African (SA) housing policy directly favours the poor. However, Liebenberg (2001)
argues that policy in it self is not enough, and that policy development should include an
implementation framework, as it is possible in practice for pro-poor policies not to reach
the poor. The African National Congress (ANC) adopted an income-based capital
subsidy scheme as the basis of its approach to low-cost housing in order to facilitate the
realisation of this right. Over the years the ANC’s housing policy has grown in
complexity (Pottie, 2004).
The subsidy designed and implemented in 1994, used a strong targeting mechanism in
which subsidy allocations were based on the household income, with the lowest earners
accessing the full grant and those earning close to R3,500 accessing less. Since 2004,
the housing policy has shifted to include households earning R3,501 to R7,000 in the
credit-linked subsidies (DoH, 2004). In the current design of the housing subsidy, all
eligible households earning below R3,500 qualify for the full subsidy that is meant to
provide between 40-45 m2 starter units (see Table 1 for the table on Government
Subsidies).
13
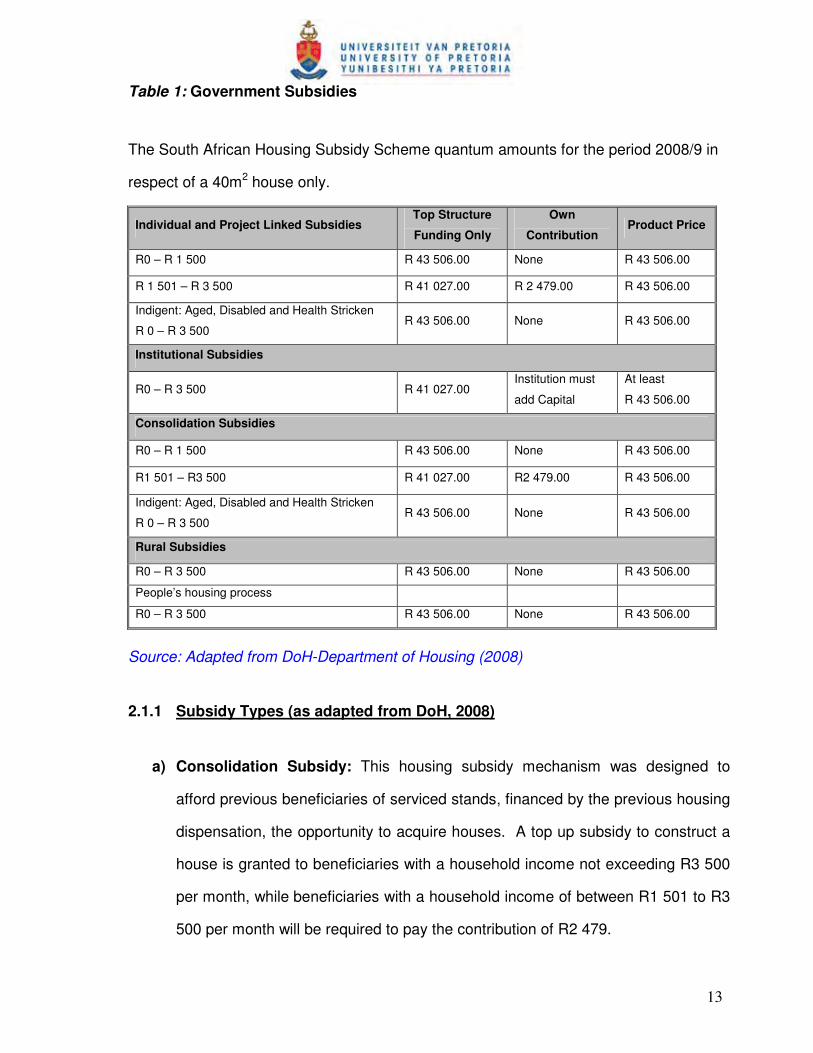
Table 1: Government Subsidies
The South African Housing Subsidy Scheme quantum amounts for the period 2008/9 in
respect of a 40m2 house only.
Individual and Project Linked Subsidies Top Structure
Funding Only
Own
Contribution Product Price
R0 – R 1 500 R 43 506.00 None R 43 506.00
R 1 501 – R 3 500 R 41 027.00 R 2 479.00 R 43 506.00
Indigent: Aged, Disabled and Health Stricken
R 0 – R 3 500 R 43 506.00 None R 43 506.00
Institutional Subsidies
R0 – R 3 500 R 41 027.00 Institution must
add Capital
At least
R 43 506.00
Consolidation Subsidies
R0 – R 1 500 R 43 506.00 None R 43 506.00
R1 501 – R3 500 R 41 027.00 R2 479.00 R 43 506.00
Indigent: Aged, Disabled and Health Stricken
R 0 – R 3 500 R 43 506.00 None R 43 506.00
Rural Subsidies
R0 – R 3 500 R 43 506.00 None R 43 506.00
People’s housing process
R0 – R 3 500 R 43 506.00 None R 43 506.00
Source: Adapted from DoH-Department of Housing (2008)
2.1.1 Subsidy Types (as adapted from DoH, 2008)
a) Consolidation Subsidy: This housing subsidy mechanism was designed to
afford previous beneficiaries of serviced stands, financed by the previous housing
dispensation, the opportunity to acquire houses. A top up subsidy to construct a
house is granted to beneficiaries with a household income not exceeding R3 500
per month, while beneficiaries with a household income of between R1 501 to R3
500 per month will be required to pay the contribution of R2 479.
14
b) Individual Subsidy: This provides qualifying beneficiaries with access to
housing subsidies to acquire ownership of improved residential properties (stand
and house) or to acquire a house building contract which is not part of approved
housing subsidy projects.
c) Project Linked Subsidy: This housing subsidy mechanism enables a qualifying
household to access a complete residential unit, which is developed within an
approved project linked housing subsidy project for ownership by the beneficiary.
d) Institutional Subsidy: The Institutional Subsidy is available to qualifying
institutions to enable them to create affordable housing stock for persons who
qualify for housing subsidies.
e) Rural Subsidy: This housing subsidy is available to beneficiaries who only enjoy
functional tenure rights to the land they occupy. This land belongs to the State
and is governed by traditional authorities.
2.2 CHALLENGES FOR SOUTH AFRICAN HOUSING POLICY
South African housing policy has been frequently criticized for fostering urban sprawl by
locating housing delivery on the peripheries of urban areas, thereby reinforcing the
spatial tendencies of apartheid and locating the poor on the periphery (Huchzermeyer
2003a; Harrison et al. 2003; Mokoena and Marais, 2007). Tomlinson (1999, p. 292)
notes that “evidence…suggests that residents of shack settlements on the urban
peripheries, while now enjoying access to housing subsidies, have remained
marginalized and impoverished.
15
The lack of economic opportunities means that huge numbers of families are in the same
economic situation as before, even though with a housing option”. Watson and
McCarthy (1998, p. 52) observe that “the location of many ownership schemes, usually
on cheaper land on the city outskirts, has meant that many poor households have had to
choose between ownership in a peripheral settlement, far from work, or rental in a better
located area”.
The issue that is frequently brought to the fore in literature is the fact that the subsidy
scheme is not suitable to be used for informal settlement upgrading (Huchzermeyer,
2002); that informal settlement upgrading is limited (Marais, 2003) and that the practice
of informal settlement upgrading has serious shortcomings (Huchzermeyer, 2002;
Mokoena and Marais, 2007).
Linked to the issue of the lack of informal settlement upgrading, the inappropriate nature
of ownership in respect of the poor is problematic (Mokoena and Marais, 2007). In this
regard, Mokoena and Marais (2007, p. 313) agree with Khan’s (2003) argument that:
“The key challenge for SA housing policy is the development of appropriate tenure
arrangements/instruments for informal settlement upgrade, especially because informal
land and housing delivery systems will for many decades remain the only alternative for
the homeless poor.”
According to De Soto (2000), the issue of titles and credit has always been very
important in the housing arena. De Soto (2000, p. 5) explains that the current problem
facing the poor is that: “Even in the poorest nations the poor save. The value of savings
among the poor is, in fact, immense – forty times all the foreign aid received throughout
the world since 1945… But they hold these resources in defective forms: houses built on
land whose ownership rights are not adequately recorded, unincorporated businesses
with undefined liability, industries located where financiers and investors cannot
16
adequately see them. Because the rights to these possessions are not adequately
documented, these assets cannot readily be turned into capital, cannot be traded outside
of narrow local circles where people know and trust each other, cannot be used as
collateral for a loan, and cannot be used as a share against an investment.”
South Africa’s housing policy is based on a once-off housing subsidy. The purpose of
this subsidy is to provide recipients with a site and basic services, coupled with a nuclear
(starter) home that can be extended over time (Harris, 2003). Theoretically, self-help is
thus entrenched in the South African policy. The self-help approach in the policy was
officially called the People’s Housing Process (PHP) and was implemented mainly
through self-help groups called “Housing Support Centres” - a concept similar to that of
housing cooperatives (Harris, 2003).
2.3 A CASE FOR SELF-HELP HOUSING CONCEPT
According to Marais, Van Rensburg and Botes (2003) the major areas of contention in
the debate on appropriate low-income housing policies are the nature of the product to
be supplied and the process to be followed. On one hand there are those who advocate
supplying a smaller number of complete houses – the conventional approach. On the
other there are those who argue for mass provision of basic starter homes which owners
can expand over time – the progressive approach. In the latter approach, the point
made being that a progressive / incremental approach to housing delivery is a more
suitable strategy that contributes towards peri-urban upgrading in a more participatory
manner (i.e. self-help housing). Conversely, conventional housing strategies have a bad
reputation for neglecting the power of people’s self-development (Botes, 1999; Marais et
al. 2003).
17
In many cases, the idea of government support to enable families to build their own
houses came from the people themselves, and not from governments or international
experts (Harris, 1998; 2003). Various researchers have indicated that self-help has been
a common phenomenon for centuries in a number of countries and that aided self-help
was lobbied for, and practised, long before the rise of the ideas of Turner in the 1960s
and 1970s (Harris, 1998). Thus, as pointed out by Harris (1998, 2003), the formulation
of ideas on self-help may well be the result of western writers following, rather than
leading, international trends.
An initiative to support self-help housing was launched by the government on a trial basis
back in 1998 (Jenkins, 1999). This was called the “People's Housing Process (PHP)'',
and was on community “self-help'' construction support workshops. The Government
mechanisms for assistance to this were announced in April 1998, although some 24 pilot
projects had been underway for some time previously and its policy position had been in
development since late 1994. This programme was aimed at the poorer families who
only had access to housing subsidies and wished to enhance on their subsidies by
building or organising the building of their homes themselves (GoSA, 1998; Jenkins,
1999). PHP was meant as an improvement on the RDP programme by benefiting
communities who would be involved at all levels of decision making and in the
implementation of their projects. Communities would benefit directly from programmes
in matters such as employment, training and award of contracts (Jenkins, 1999).
Although self-help in housing has been practised for centuries and a number of
researchers have formulated ideas on the topic, the notion of self-help is commonly
attributed to JFC Turner (Marais et al. 2003). Turner (1976) argued that houses that are
built where people had the freedom to build are often superior to those built by
governments. Turner argued that if you give individual families greater choice regarding
18
the location and design of their houses, their houses will match their needs more closely.
When dwellers control the major decisions and are free to make their own contribution to
the design, construction and management of their housing, both the process and the
environment produced stimulate individual and social well-being (Turner, 1976). When
people have no control or responsibility over key decisions in the housing process,
dwelling environments may become a barrier to personal fulfilment and a burden on the
economy (Turner, 1976).
Overall, three distinct forms of self-help can be differentiated. The first form of self-help
is without government aid. This has been practised world-wide for centuries by low- and
high-income households (Jenkins and Smith, 2001). The second form of self-help, which
can be termed “aided self-help”, comprises an approach in which site-and-service
schemes play a crucial role (Laquian, 1983). The state assists to a large extent on
creating an environment in which people build for themselves. The third form is the self-
help implemented through institutional organisations and housing cooperatives.
Owing to a change in the housing needs of people over time as well as the different
needs of people, Marais et al (2003) agreed with Turner on the notion that government
and other large organisations inadequately address these needs. The main reason for
the inability of large organisations to address the households housing needs is that these
organisations usually have standardised procedures and products that do not adhere to
the principles of variety and individual needs. As such, Turner emphasises the concept
of freedom in the building environment. However, Turner does not argue that, by means
of the freedom to build, everybody should build their own houses rather, he emphasises
that individuals should be able to make decisions about their own housing (dweller
control). He believes that when the beneficiary is able to make decisions about the
19
planning, construction and management of the house (irrespective of class), the housing
problem would be addressed effectively.
2.3.1 Conclusion
In concluding, of the three forms of self-help described above, this study intends to look
into the second form of self-help, where the state assists to a large extent in creating an
environment in which people build for themselves. This can be done through control and
regulatory policies by the state where private sector (large organisations) are compelled
to put systems in place that will make it conducive (i.e. easy access to credit and
reduced cost per unit of product) for the poor to build for themselves.
2.4 CONSTRAINTS STANDING ON THE WAY TO SERVE THE POOR
According to Mendoza and Thelen (2008), numerous barriers prevent the poor from
participating more actively in markets, both as consumers and as producers.
In the UNDP (2008) report five general constraints that limit businesses from trying to
engage the poor were identified. These were: limited market information; Ineffective
regulatory environments; inadequate physical infrastructure; missing knowledge and
skills; restricted access to financial products and services.
Limited market information: Businesses know too little about poor people - what they
prefer, what they can afford and what products and capabilities they have to offer as
employees, producers and business owners.
Ineffective regulatory environments: The poor markets lack regulatory frameworks
that allow business to work. Rules are not enforced. People lack access to the
opportunities and protections afforded by a functioning legal system.
20
Inadequate physical infrastructure: Transportation is complicated by the lack of roads
and supporting infrastructure. Water, electricity, sanitation and telecommunications
networks are lacking.
Missing knowledge and skills: Consumers may not know the uses and benefits of
particular products or may lack the skills to use them effectively. Suppliers, distributors
and retailers may lack the knowledge and skills to deliver quality products and services
consistently, on time and at a set cost.
Restricted access to financial products and services: Lacking credit, poor producers
and consumers cannot finance investments or large purchases. Lacking insurance, they
cannot protect what meagre assets and income they may have against shocks, such as
illness, drought and theft. And lacking transactional banking services, they face insecure
and expensive financial management.
2.5 CHARACTERISTICS OF LOW-INCOME MARKETS
The first step in addressing low-income markets in the developing world is to understand
existing markets and their associated challenges and opportunities. SadreGhazi (2008)
described the following as the most important characteristics of low-income markets:
2.5.1 Purchasing power
The most eminent characteristic of the communities at the base of the pyramid is the
lower level of disposable income. The problem of low disposable income manifests itself
mainly in two ways: (1) low purchasing power and (2) lack of access to credit
(SadreGhazi, 2008).
21
The majority of the low-income communities have daily fluctuating as opposed to a
constant monthly income. That makes it difficult for them to have high once-off payment
for goods and services. In higher-income regions consumers have access to credit and
can exercise higher purchase power. Banks on the other hand are reluctant to provide
such credit facilities to those without a constant monthly income. As a result in many
such low-income areas people pay very high interests to the informal money lenders to
overcome the credibility problem (SadreGhazi, 2008).
Often low-income communities even have to pay a higher price for many of their basic
goods and services – a phenomenon called poverty penalty. High-income consumers
spend a much smaller percentage of their resources on the basic necessities of life,
leaving them more money to purchase life enhancing items. While in most low-income
consumers, more than 50% of the income is spent just on food (SadreGhazi, 2008;
Subrahmanyan and Gomez-Arias, 2008).
Perhaps the classic example of such a business is the micro-credit model introduced by
Muhammad Yunus and the Grameen Bank. The loans made to the poor through the
bank lead directly to income generation through micro-entrepreneurship and other forms
of local enterprise development (Yunus, 1999). In addition to providing credit,
companies can develop technologies to raise BOP incomes and start businesses.
2.5.2 Location and diversity
The low-income market represents a more diverse cultural variety and geography. In the
majority of low-income markets, the availability of logistics infrastructure can not be taken
for granted (SadreGhazi, 2008) and that makes delivery, distribution and service of the
product more difficult. In addition, limited access to media makes common ways of
media advertisement less effective.
22
In order to access and educate consumers at the low-income end, a variety of
approaches is needed ranging from simple methods such as billboards on walls and
truck-mounted demonstrations to local communities spreading by word of mouth
advertising (Anderson and Billou, 2007).
2.5.3 Skill and awareness
According to SadreGhazi (2008), a considerable share of low-income population is
illiterate, almost one fifth of adults around the world are functionally illiterate. In addition,
they have less experience working with technology-intensive products or devices that
require some level of prior skill or knowledge to operate. Hence it is important to
redesign the product functions to make it acceptable and easy to use for those who lack
the skill or knowledge to use the product (SadreGhazi, 2008).
Educating the end-user can be a way to overcome the literacy problem. In lack of
traditional channels for educating users, some companies have teamed up with Non
Governmental Organizations (NGOs) and local groups to address this e.g. CEMEX, a
leading global building solutions company based in Mexico offered not only affordable
housing solutions through tailored business models, but also established a local network
of trusted distributors to provide quality materials and education on how to build houses
(Subrahmanyan and Gomez-Arias, 2008).
2.5.4 Institutions and infrastructure
Low-income markets have other characteristics that challenge the business practices
developed in advanced markets. In addition to such corporate challenges, many
countries in low-income markets face political instability, volatile exchange rates, and
underdeveloped physical infrastructure that make business even more difficult (Prahalad
and Hart, 2002).
23
Much of the physical infrastructure conditions that are taken for granted in advanced
markets are not available or are rather weak in low-income markets. The low degree of
penetration of information and communication services together with limited
transportation and other logistics put some restrictions on the use of usual distribution
models. The wide and scattered nature of low-income markets also requires extensive
distribution networks that are viable at low volumes and low prices (SadreGhazi, 2008).
2.6 DEFINING THE BOP CONSUMER POPULACE
2.6.1 The BOP proposition - Globally
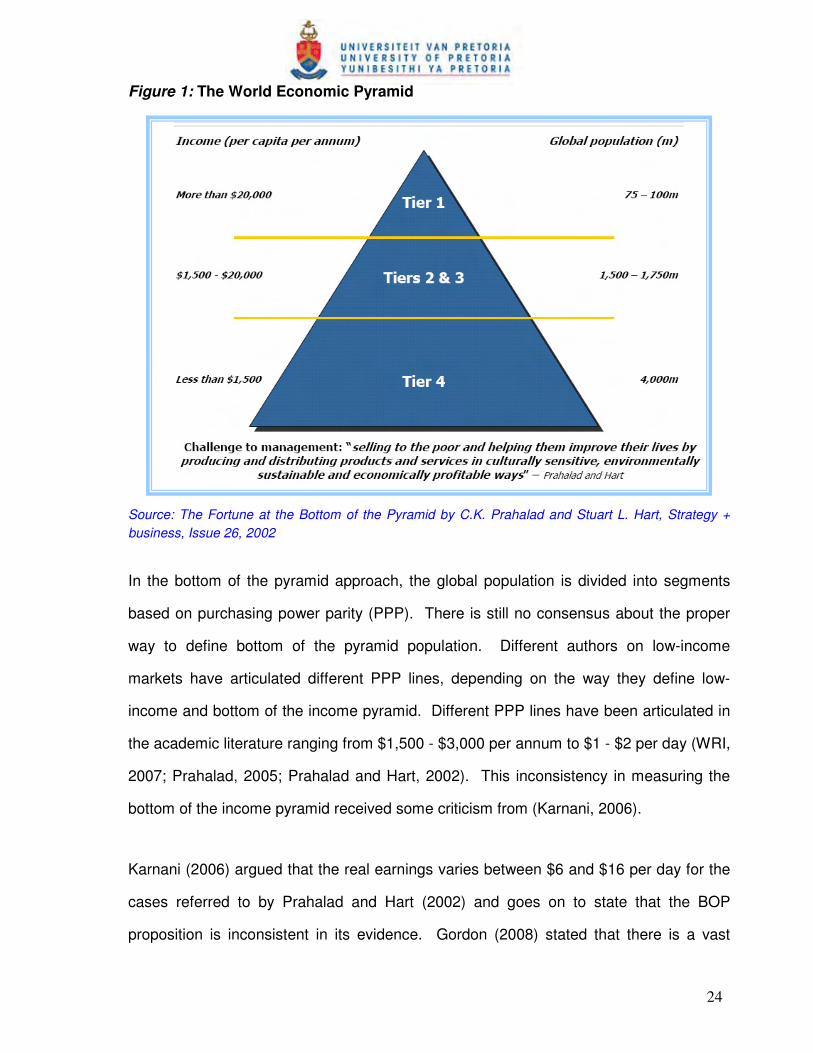
Prahalad and Hart (2002, p. 2) defined the bottom of the pyramid (BOP) as, “the 4 billion
people in the world whose per capita income is less than $1,500 adjusted for purchasing
power parity (PPP) in US dollars being the minimum considered necessary to sustain a
decent life”. They divided the world economy into a 4-tiered pyramid to represent the
global distribution of wealth and the capacity to generate income. At the top of the
pyramid (Tier 1) are the wealthy, with numerous opportunities for generating high levels
of income. Tier 2 and tier 3 represent the economic middle class who consists of poor
customers in the developed nations and the rising middle classes in the developing
countries. Tier 4 (the bottom of the pyramid), on the other hand, is composed of over 4
billion people whose average per capita income is less than $1,500 per annum or less
than $ 1 a day (see Figure 1, below).
24
Figure 1: The World Economic Pyramid
Source: The Fortune at the Bottom of the Pyramid by C.K. Prahalad and Stuart L. Hart, Strategy +
business, Issue 26, 2002
In the bottom of the pyramid approach, the global population is divided into segments
based on purchasing power parity (PPP). There is still no consensus about the proper
way to define bottom of the pyramid population. Different authors on low-income
markets have articulated different PPP lines, depending on the way they define low-
income and bottom of the income pyramid. Different PPP lines have been articulated in
the academic literature ranging from $1,500 - $3,000 per annum to $1 - $2 per day (WRI,
2007; Prahalad, 2005; Prahalad and Hart, 2002). This inconsistency in measuring the
bottom of the income pyramid received some criticism from (Karnani, 2006).
Karnani (2006) argued that the real earnings varies between $6 and $16 per day for the
cases referred to by Prahalad and Hart (2002) and goes on to state that the BOP
proposition is inconsistent in its evidence. Gordon (2008) stated that there is a vast
25
difference in the standard of living between people earning less than a dollar a day
versus those living on five dollars a day. It becomes evident that a more precise BOP
definition is needed before any sustainable arguments for or against the BOP proposition
can be made.
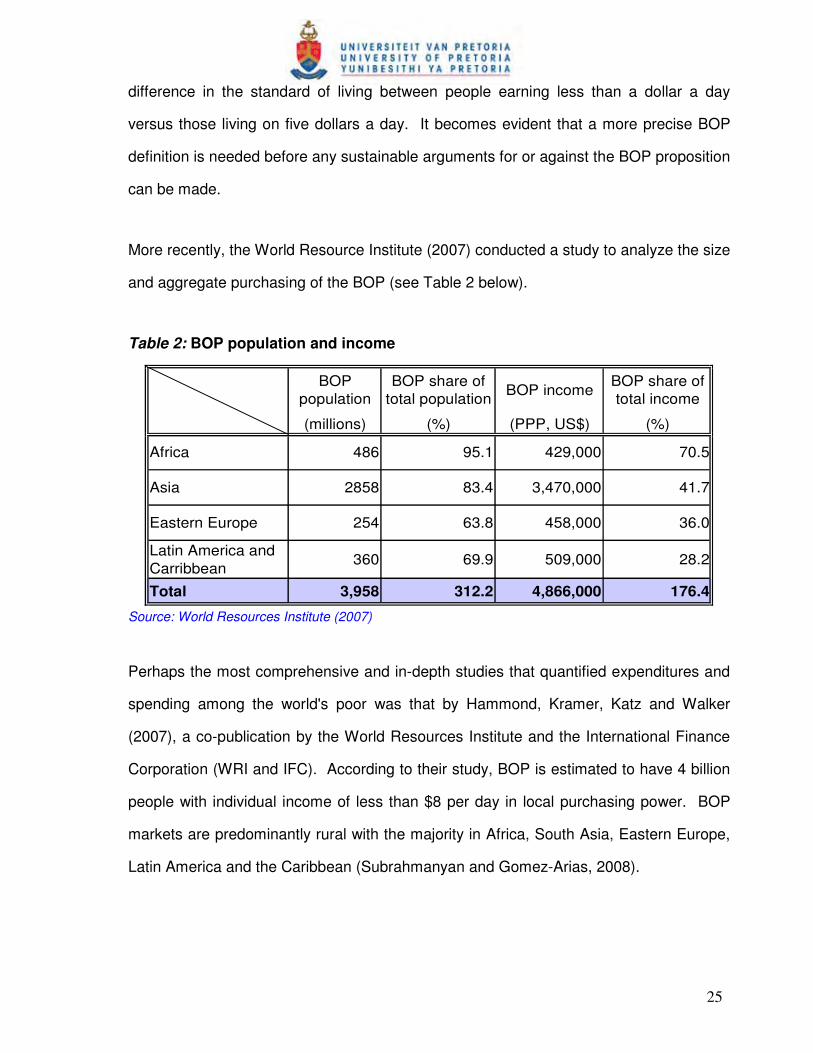
More recently, the World Resource Institute (2007) conducted a study to analyze the size
and aggregate purchasing of the BOP (see Table 2 below).
Table 2: BOP population and income
BOP population
BOP share of total population
BOP incomeBOP share of total income
(millions) (%) (PPP, US$) (%)
Africa 486 95.1 429,000 70.5
Asia 2858 83.4 3,470,000 41.7
Eastern Europe 254 63.8 458,000 36.0
Latin America and Carribbean
360 69.9 509,000 28.2
Total 3,958 312.2 4,866,000 176.4
Source: World Resources Institute (2007)
Perhaps the most comprehensive and in-depth studies that quantified expenditures and
spending among the world's poor was that by Hammond, Kramer, Katz and Walker
(2007), a co-publication by the World Resources Institute and the International Finance
Corporation (WRI and IFC). According to their study, BOP is estimated to have 4 billion
people with individual income of less than $8 per day in local purchasing power. BOP
markets are predominantly rural with the majority in Africa, South Asia, Eastern Europe,
Latin America and the Caribbean (Subrahmanyan and Gomez-Arias, 2008).
26
2.6.2 BOP IN SOUTH AFRICA
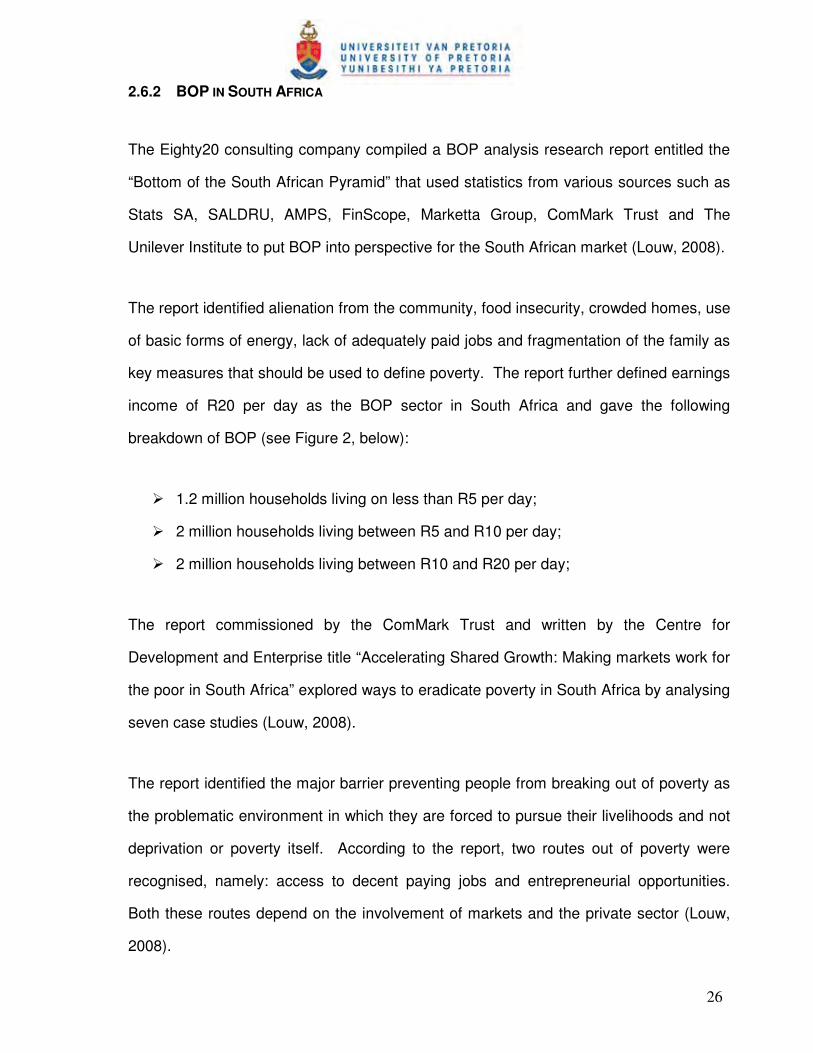
The Eighty20 consulting company compiled a BOP analysis research report entitled the
“Bottom of the South African Pyramid” that used statistics from various sources such as
Stats SA, SALDRU, AMPS, FinScope, Marketta Group, ComMark Trust and The
Unilever Institute to put BOP into perspective for the South African market (Louw, 2008).
The report identified alienation from the community, food insecurity, crowded homes, use
of basic forms of energy, lack of adequately paid jobs and fragmentation of the family as
key measures that should be used to define poverty. The report further defined earnings
income of R20 per day as the BOP sector in South Africa and gave the following
breakdown of BOP (see Figure 2, below):
� 1.2 million households living on less than R5 per day;
� 2 million households living between R5 and R10 per day;
� 2 million households living between R10 and R20 per day;
The report commissioned by the ComMark Trust and written by the Centre for
Development and Enterprise title “Accelerating Shared Growth: Making markets work for
the poor in South Africa” explored ways to eradicate poverty in South Africa by analysing
seven case studies (Louw, 2008).
The report identified the major barrier preventing people from breaking out of poverty as
the problematic environment in which they are forced to pursue their livelihoods and not
deprivation or poverty itself. According to the report, two routes out of poverty were
recognised, namely: access to decent paying jobs and entrepreneurial opportunities.
Both these routes depend on the involvement of markets and the private sector (Louw,
2008).
27
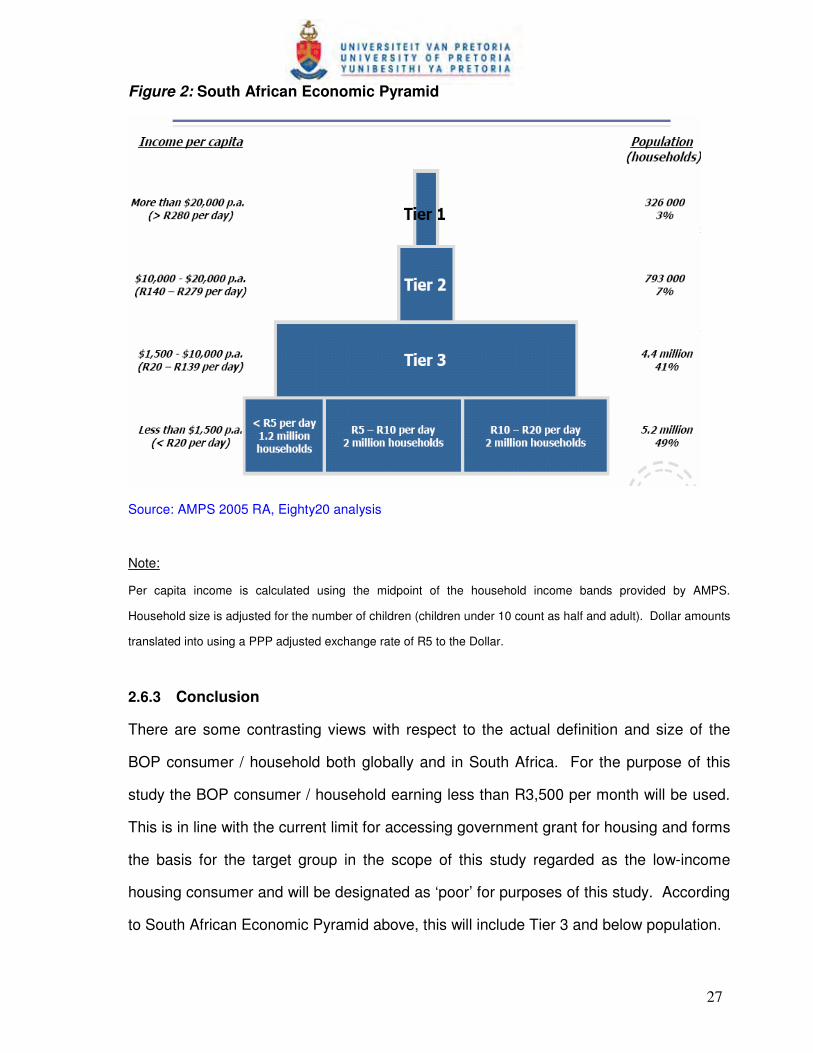
Figure 2: South African Economic Pyramid
Source: AMPS 2005 RA, Eighty20 analysis
Note:
Per capita income is calculated using the midpoint of the household income bands provided by AMPS.
Household size is adjusted for the number of children (children under 10 count as half and adult). Dollar amounts
translated into using a PPP adjusted exchange rate of R5 to the Dollar.
2.6.3 Conclusion
There are some contrasting views with respect to the actual definition and size of the
BOP consumer / household both globally and in South Africa. For the purpose of this
study the BOP consumer / household earning less than R3,500 per month will be used.
This is in line with the current limit for accessing government grant for housing and forms
the basis for the target group in the scope of this study regarded as the low-income
housing consumer and will be designated as ‘poor’ for purposes of this study. According
to South African Economic Pyramid above, this will include Tier 3 and below population.
28
2.7 BOP CONSUMER BEHAVIOUR
According to Subrahmanyan and Gomez-Arias (2008) the poorest of the world, termed
as being economically at the bottom of the pyramid (BOP), has an estimated purchasing
power of $5 trillion. Because of difficult geography and dispersed locations, the rural
poor are often more costly to reach both by public and private sectors. Not surprisingly,
recent estimates show that the rural poor tend to have less access to public
infrastructure and certain types of social services, compared with urban residents and/or
the urban poor (Mendoza and Thelen, 2008).
In addition, the poor tend to have low literacy levels and may be unfamiliar with certain
goods and services, such as new technologies or financial services which in turn might
deter them from using such products (UNDP, 2007). An understanding of what and how
much is spent on each category can be the starting point to examine where the need and
innovation is. The various categories and their sizes as per the study by Subrahmanyan
and Gomez-Arias (2008) are given in Figure 3 below.
2.7.1 Food
Although food purchases comprise about 60 percent of a household's income (Braun,
2008), BOP consumers still face poor quality and high prices of products. As a result
there may be inadequate nutrition or balanced diet. BOP typically buys products at local
or neighbourhood stores that charge higher prices. BOP consumers do not have the
transportation luxury to do price comparisons. Also, having a regular relationship with a
few neighbourhood retailers helps build trust and hence more likelihood of getting credit
(Viswanathan, 2007).
29
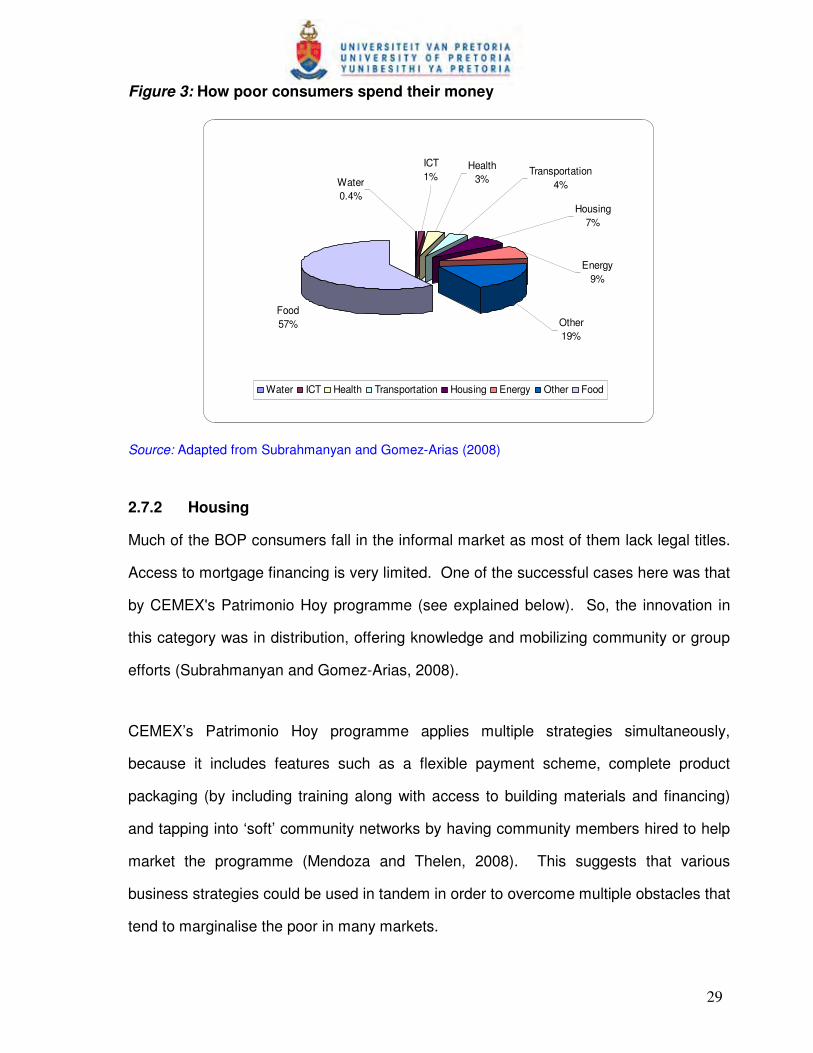
Figure 3: How poor consumers spend their money
ICT
1%Health
3%Transportation
4%
Housing
7%
Energy
9%
Water
0.4%
Food
57% Other
19%
Water ICT Health Transportation Housing Energy Other Food
Source: Adapted from Subrahmanyan and Gomez-Arias (2008)
2.7.2 Housing
Much of the BOP consumers fall in the informal market as most of them lack legal titles.
Access to mortgage financing is very limited. One of the successful cases here was that
by CEMEX's Patrimonio Hoy programme (see explained below). So, the innovation in
this category was in distribution, offering knowledge and mobilizing community or group
efforts (Subrahmanyan and Gomez-Arias, 2008).
CEMEX’s Patrimonio Hoy programme applies multiple strategies simultaneously,
because it includes features such as a flexible payment scheme, complete product
packaging (by including training along with access to building materials and financing)
and tapping into ‘soft’ community networks by having community members hired to help
market the programme (Mendoza and Thelen, 2008). This suggests that various
business strategies could be used in tandem in order to overcome multiple obstacles that
tend to marginalise the poor in many markets.
30
2.7.3 Energy
BOP consumers lack clean, affordable energy. They also face significant health
challenges arising from using inefficient devices for cooking or lighting. Sellers of energy
here are typically governments or large utility companies. BOP consumers often cannot
afford payment and in some urban areas tap power illegally. One innovative solution by
AES Corporation in Venezuela has been to recognize that the poor who live in the
informal settlements could be willing to pay for uninterrupted power source.
By engaging the community and offering an integrated solution such as pre-paid meters,
public lighting, installation and maintenance of collective meters, the illegal tapping was
converted into a paying source of satisfied consumers and unpaid accounts also paid up
(Gómez-Samper and Marquez, 2006; Subrahmanyan and Gomez-Arias, 2008).
Innovation in this category needs active partnership with energy companies, aid
agencies and communities. Innovation in the form of energy efficient devices is also
needed.
2.7.4 Finance services
Informal jobs and lack thereof for most of BOP make access to formal financial services
both in terms of savings and borrowing difficult. Often payment is made in cash thereby
making them susceptible to being robbed. For loans, BOP typically resorts to store
credits, borrowing money from local money lenders at exorbitant rates (Hammond et al.,
2007). One of the most innovative services in this category is micro-financing
popularized by Grameen Bank in Bangladesh (Hammond et al., 2007; Subrahmanyan
and Gomez-Arias, 2008).
31
Ways to improve the poor’s purchasing power may include adjusting retail and pricing
strategies - notably through joint consumption, flexible payment schemes, and tiered
pricing - to better fit a large consumer base with individually low and volatile income
streams (Mendoza and Thelen, 2008).
a) Joint consumption: Whereas traditional business strategies tend to focus on
reaching single consumers, a number of business models geared to reaching
the poor involve the provision of goods and services to groups (or even entire
communities).
b) Flexible payments: The poor typically have low and variable income streams
and are unable to undertake bulk purchases. Mendoza and Thelen (2008)
advise that various flexible payment arrangements can help solve this cash-flow
problem. Examples of flexible-payment innovations are micro-leasing and pay-
as-you-go solutions. ‘Purchasing through savings’ is another innovation which
CEMEX uses in its Patrimonio Hoy programme in Mexico. Through a well-
planned savings programme Patrimonio Hoy allows low-income families to
obtain access to services such as cement and other building materials on credit
(Segel and Meghji, 2005).
2.7.5 Water and sanitation
Access to clean drinking water is a critical need. BOP consumers often do whatever it
takes to obtain water in any way. Private sector is often the last resort provider. Since
water borne diseases are prevalent in many BOP areas, there are a range of products by
private companies to treat water. Even poor communities are willing to pay both for
treated water and for home delivery. In this sector, innovation has been in purification
techniques and efficient delivery of water (Subrahmanyan and Gomez-Arias, 2008).
32
2.7.6 Transportation
BOP consumers in urban areas use public transportation and spend a large part of their
income on transportation especially as they are likely to live far away from places of
employment (WRI-IFC, 2007). According to the WRI-IFC report, BOP accounts for over
60 percent of the total Asian transportation market. Those in rural areas have fewer
options such as walking, bicycling, animal-drawn carts, infrequent or expensive buses
and trains. Due to these limitations, their economic potential is much reduced so much
such that even medical care and education for children are foregone. In many
developing countries, motorized two wheelers are popular and innovative adaptations by
consumers have taken place (WordChanging Team, 2007; Subrahmanyan and Gomez-
Arias, 2008).
2.8 JUSTIFICATION OF THE 4AS FRAMEWORK
2.8.1 Introduction
The 4As framework is based on research by Anderson and Billou (2007) on serving
customers at the bottom of the economic pyramid in various industries. Their aim was to
articulate best practices for companies dealing with the challenges of serving low-income
consumers in developing markets and in many instances, explores strategies still
evolving (Anderson and Billou, 2007). In their two-year research project they undertook
to test the hypothesis that there were common challenges and approaches in serving
BOP customers, and that these could be articulated and refined to get better business
results. Their exploratory research found that in the heart of all the organisations’
success in serving the low-income consumer is the development of an approach that
delivers the 4As – availability, affordability, acceptability and awareness (see Figure 4)
33
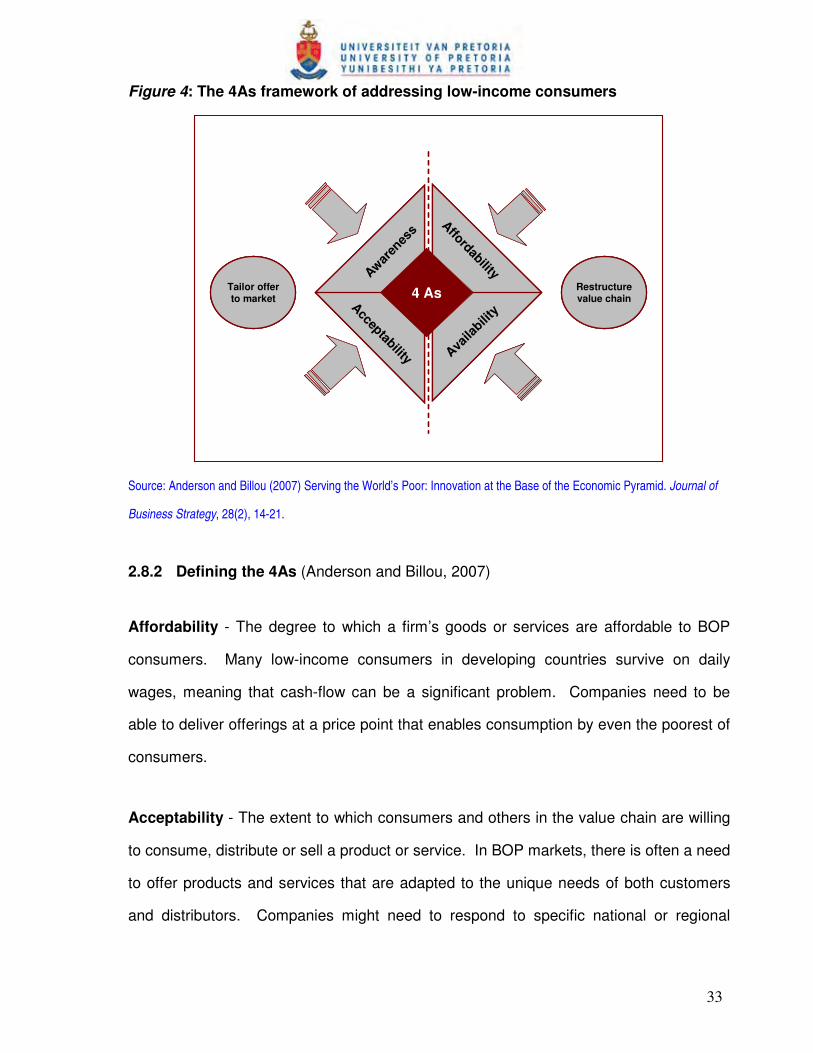
Figure 4: The 4As framework of addressing low-income consumers
4 As
AffordabilityA
war
enes
s
Acceptability A
vaila
bility
Tailor offerto market
Restructurevalue chain4 As
AffordabilityA
war
enes
s
Acceptability A
vaila
bility
Tailor offerto market
Restructurevalue chain4 As
AffordabilityA
war
enes
s
Acceptability A
vaila
bility
Tailor offerto market
Restructurevalue chain
Source: Anderson and Billou (2007) Serving the World’s Poor: Innovation at the Base of the Economic Pyramid. Journal of
Business Strategy, 28(2), 14-21.
2.8.2 Defining the 4As (Anderson and Billou, 2007)
Affordability - The degree to which a firm’s goods or services are affordable to BOP
consumers. Many low-income consumers in developing countries survive on daily
wages, meaning that cash-flow can be a significant problem. Companies need to be
able to deliver offerings at a price point that enables consumption by even the poorest of
consumers.
Acceptability - The extent to which consumers and others in the value chain are willing
to consume, distribute or sell a product or service. In BOP markets, there is often a need
to offer products and services that are adapted to the unique needs of both customers
and distributors. Companies might need to respond to specific national or regional
34
cultural or socioeconomic aspects, or to address the unique requirements of local
business practices.
Availability - The extent to which customers are able to readily acquire and use a
product or service. Distribution channels in BOP markets can be fragmented or non-
existent and the task of simply getting products to people can be a major hurdle to
overcome. Companies need to explore alternative methods of delivering their products
and services to even the most isolated BOP communities.
Awareness - The degree to which customers are aware of a product or service. Given
that many BOP customers are largely inaccessible to conventional advertising media,
building awareness can be a significant challenge for companies wishing to serve low-
income consumers in the developing world. To overcome these constraints companies
must explore alternative communication channels.
2.8.3 Development of the 4As Framework
Work similar to the framework that Anderson and Billou derived has been conducted by
Prahalad (2005) in his publication “Fortune at the Bottom of the Pyramid” and Prahalad &
Hart (2002) in their article titled “The Fortune at the Bottom of the Pyramid, Strategy and
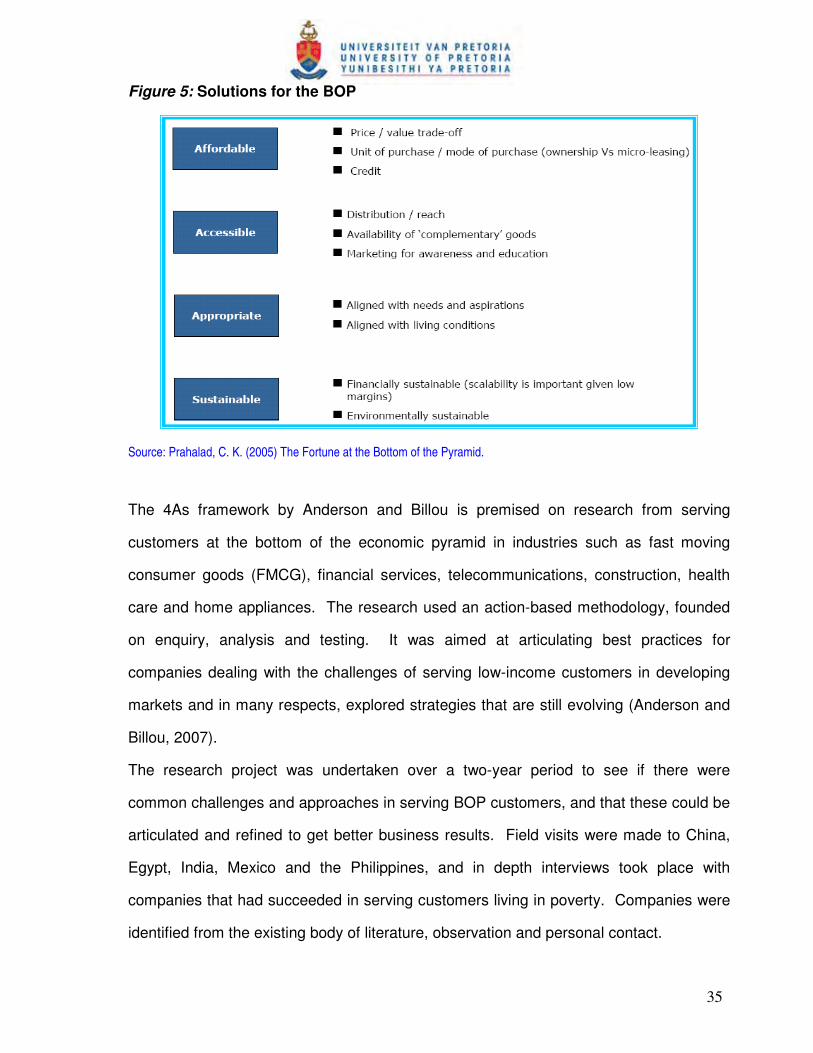
Business”. They emphasized that affordability and accessibility of products or services
amongst the low-income consumers were the main barriers. Prahalad suggested the
following model in addressing the needs of the BOP (see Figure 5 below).
35
Figure 5: Solutions for the BOP
Source: Prahalad, C. K. (2005) The Fortune at the Bottom of the Pyramid.
The 4As framework by Anderson and Billou is premised on research from serving
customers at the bottom of the economic pyramid in industries such as fast moving
consumer goods (FMCG), financial services, telecommunications, construction, health
care and home appliances. The research used an action-based methodology, founded
on enquiry, analysis and testing. It was aimed at articulating best practices for
companies dealing with the challenges of serving low-income customers in developing
markets and in many respects, explored strategies that are still evolving (Anderson and
Billou, 2007).
The research project was undertaken over a two-year period to see if there were
common challenges and approaches in serving BOP customers, and that these could be
articulated and refined to get better business results. Field visits were made to China,
Egypt, India, Mexico and the Philippines, and in depth interviews took place with
companies that had succeeded in serving customers living in poverty. Companies were
identified from the existing body of literature, observation and personal contact.
36
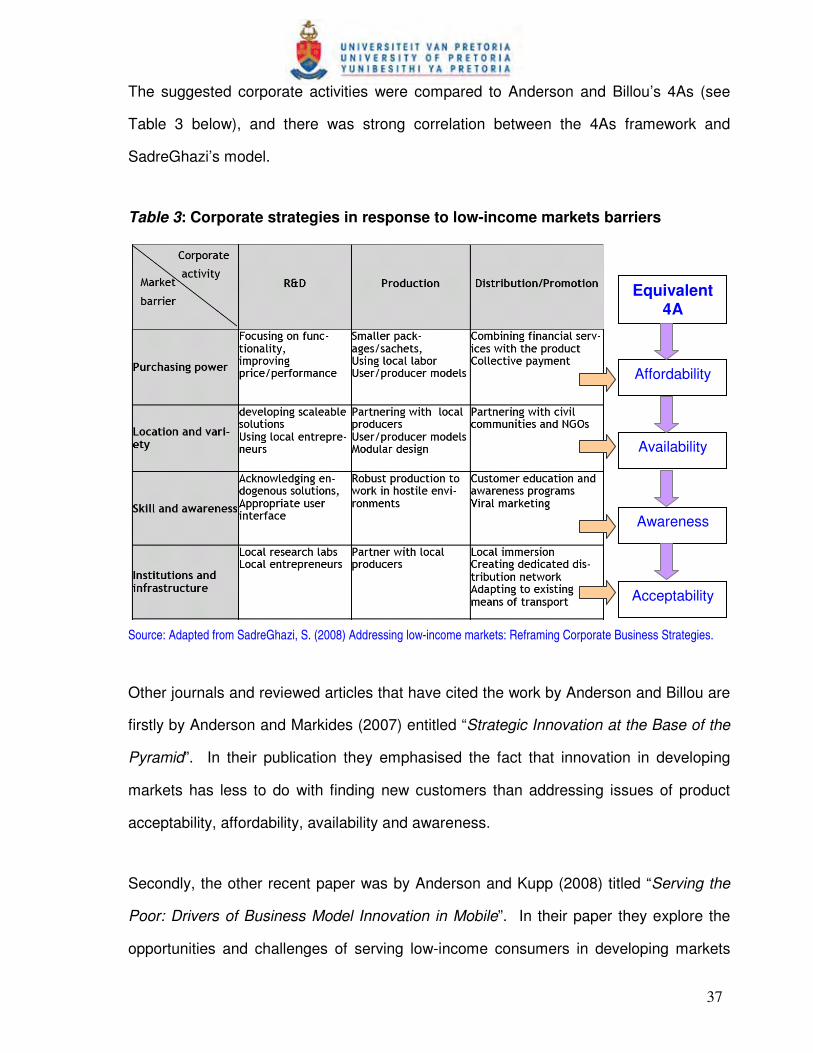
The 4As framework was refined during 2004-2005 in a reiterative process of application,
testing and adaptation using academic literature, field visits, research and writing of case
studies and hands on experience with managers. Through feedback from their
academic colleagues, (C. K. Prahalad and Jagdish Sheth), classroom discussions and
further interviews with executives involved in the application at companies; shared
approaches to the 4As were identified and used to build theory and make the concepts
generic enough so to be utilized by other managers (Anderson and Billou, 2007).
2.8.4 Further studies in support of the 4As framework approach
Since its inception over the past two years, the 4As framework has been cited in some of
the academic articles, journals and reviews and has been endorsed by ATKearney, the
global strategic management consulting firm (Pfeiffer, Massen and Bombka, 2007).
Reference to the work by Jamie Anderson has been mentioned in a paper titled
“Teleuse@BOP3” compiled by Centre for Knowledge Societies (CKS) in their findings
from a six-country qualitative study of teleuse at the bottom of the pyramid in Asia (CKS
Consulting Pvt. Ltd. (2009) Teleuse@BOP3: A Qualitative Study. Colombo: LIRNEasia).
None of the above listed authors’ articles criticise or challenge the 4As framework by
Anderson and Billou in their citations. For this reason, the framework is anticipated to
work in serving the SA low-income consumers needs; hence for it to be assessed
against their critical need namely, their housing need, through interviewing the actual
household within the Gauteng informal settlements.
In his paper titled “Addressing low-income markets: Reframing Corporate Business
Strategies” SadreGhazi (2008) summarises the main characteristics of low-income
market and the way in which core activities of multinationals in terms of R&D, production
and distribution/promotion need to be adapted to meet the challenges of those specific
consumers.
37
The suggested corporate activities were compared to Anderson and Billou’s 4As (see
Table 3 below), and there was strong correlation between the 4As framework and
SadreGhazi’s model.
Table 3: Corporate strategies in response to low-income markets barriers
Source: Adopted from
Source: Adapted from SadreGhazi, S. (2008) Addressing low-income markets: Reframing Corporate Business Strategies.
Other journals and reviewed articles that have cited the work by Anderson and Billou are
firstly by Anderson and Markides (2007) entitled “Strategic Innovation at the Base of the
Pyramid”. In their publication they emphasised the fact that innovation in developing
markets has less to do with finding new customers than addressing issues of product
acceptability, affordability, availability and awareness.
Secondly, the other recent paper was by Anderson and Kupp (2008) titled “Serving the
Poor: Drivers of Business Model Innovation in Mobile”. In their paper they explore the
opportunities and challenges of serving low-income consumers in developing markets
Affordability
Equivalent 4A
Availability
Awareness
Acceptability
38
with mobile telecommunications. Their paper also touched on the commonly held belief
that “reaching low-income consumers is difficult due to two key challenges – affordability
and availability”.
Thirdly is the article by Mendoza and Thelen (2008) published titled “Innovations to Make
Markets More Inclusive for the Poor”. This article identified and made reference to
Anderson and Billou’s strategies and innovations used to make it easier for the poor to
access product and services – availability.
Lastly but not least is the paper by SadreGhazi and Duysters (2008) titled “Serving low-
income markets: Rethinking Multinational Corporations’ Strategies”. Their paper touched
on a variety of approaches needed, as covered by Anderson and Billou (2007), in order
to access and educate consumers at low-income markets.
2.9 CRITICS TO CURRENT BOP THINKING
Despite this congruence, Karnani (2006) criticised and questioned the fundamentals of
the bottom of the pyramid proposition as espoused by Prahalad. Karnani (2006, p. 36)
says: “The BOP proposition is characterized by much hyperbole and very weak research
methodology. The fortune and glory at the bottom of the pyramid are a mirage. The
fallacy of the BOP proposition is exacerbated by its hubris”.
Karnani (2006) examines the propositions by Prahalad from 4 angles. Firstly is the issue
of assumptions around the potential size of this market. Karnani believes that although
Prahalad argues that 4 billion people fall into that category, according to the World Bank
the numbers are closer to 2.7 billion. Secondly, he believes that Prahalad
underestimated the high costs that would be borne by MNC seeking to serve this market
hence the reason they have stayed away from investing in it, meaning a lack of
39
economies of scale. Thirdly, the costs of distribution are high because these consumers
are geographically dispersed and there is poor infrastructure linking them. The target
population of this study are a ladder up when it comes to distribution costs in that they
are not necessarily geographically dispersed and their infrastructural challenges, for
instance, there are roads but these are not properly maintained. Finally, he concludes
that the poor are very price sensitive with limited disposable income and therefore with
little or no potential for further consumption outside of basics like food, shelter and fuel.
Karnani (2006) further argues that the BOP proposition is at the best a harmless illusion
and potentially a dangerous delusion. As a counter he puts forward this proposition:
Firstly, the only way to help the poor and alleviate poverty is to raise the real income of
the poor.
Secondly, the cost per unit of product must be lowered in order to increase their effective
income.
Thirdly and most profoundly, the poor should be viewed primarily as producers and not
consumers.
Finally, governments have a critical role to play in uplifting the poor at the bottom of the
pyramid as opposed to the private sector taking the lead.
Based on the inputs by mainly Prahalad & Stuart (2002); Hammond & Prahalad (2004);
Hart (2005); Prahalad (2005); Hammond et al (2007); Sharma & Hart (2006); Anderson
& Billou (2007) and Subrahmanyan & Gomez-Arias (2008), it was accepted that there is
a bottom of the economic pyramid. For the purpose of this study the leading contribution
by Prahalad and Hart (2002) is relied upon.
40
2.10 CONCLUSION OF LITERATURE REVIEW
The issue that has been touched on the literature review is the fact that informal
settlement upgrading has serious short comings and the subsidy scheme is not suitable
to be used for informal settlement upgrading.
The emergence of self-help housing concept by Marais et al. (2003) gives an interesting
dimension to a more suitable strategy that would contribute towards peri-urban
upgrading in a more plausible manner. Literature shows that both government and large
organisations are unable to adequately address the poor housing needs owing to
complications and general constraints, and there are major challenges faced by the low-
income consumers for housing and major barriers preventing them from breaking out of
poverty and deprivation. The literature suggests that a form of self-help housing where
the state assist to a large extent in creating an environment where people build houses
themselves through some regulatory policies is perhaps an alternative towards
addressing housing delivery.
None disputably, the studies by Prahalad and Hart on how to better serve the BOP
market back in 2002, were influential in Anderson and Billou’s latest 4As framework.
Notwithstanding the critics for the BOP model by the likes of Karnani, the urgency to
address and improve housing delivery for the benefit of BOP in SA does exist. It is for
this reason that the research was conducted, mainly in order to assess and test whether
the 4As framework could be used to better serve the housing need of the low-income
consumer.
41
CHAPTER 3: RESEARCH HYPOTHESES
The purpose of this study is to assess 4As framework in serving the low-income housing
market using quantitative methodology and analyses. Descriptive research often helps
segment and target markets or clusters of markets (Zikmund, 2003). This research is
based on the theory that serving the low-income consumer can be improved by
addressing the four As, namely: Affordability, Awareness, Acceptability and Availability.
In literature review, extensive research has been conducted on how to serve consumers
at Bottom of the Pyramid (BOP) though there may be other factors unaccounted for and
unique to the low-income housing market.
This study was conducted on a sample of households whose earnings are less than
R3,500 per month and located in the informal settlements of Alexandra, Diepsloot and
Ivory Park townships of Johannesburg in Gauteng Province. Common to these
communities are the levels of poverty, living conditions and quality of life. Apart from
lack of adequate housing, access to electricity, water and sanitation these communities
often have other issues to deal with such as high crime levels. The target group in the
scope of this study is the low-income housing consumer in South Africa. The measure of
success (Succes_M) for this targeted population will be any structural modifications or
extensions in the house conducted by the owner using his/her own effort and or income
in the past two years. Succes_M is the response binary variable either coded
Success_MNo (for no structural modification or extension) and Success_MYes otherwise.
42
3.1 RESEARCH HYPOTHESES
In statistical theory a hypothesis is an unproven proposition or supposition that
tentatively explains certain factors or phenomenon (Zikmund, 2003). The hypotheses
represent an assumption by the investigator of a view of the world. The benefit of
statistical tools is that there is an opportunity to confirm whether or not the theoretical
hypotheses are plausible by the empirical evidence (Zikmund, 2003) or with a certain
degree of measurable statistical evidence.
The study included the households who had made and those who had not made
structural modifications or extensions to their houses over the past twenty four months.
Success was defined as those household that have done structural modification or
change using their own income in the past two years and would have responded Yes
under success measure section of the questionnaire otherwise measure of success was
no. In statistical methodology, Anova is the tool used to detect if differences exist
between such two (or more) groups and Kruskal-Wallis is the non parametric equivalent.
Hypothesis 1:
The null hypothesis states that there is no difference between exercising an approach
that delivers acceptability and success amongst low-income consumer for self-help
housing. The alternative hypothesis states that there is a difference between the two
constructs, i.e.
H0: on the Acceptability score, Success_MYes = Success_MNo
H1: on the Acceptability score, Success_MYes ≠ Success_MNo
43
Hypothesis 2:
The null hypothesis states that there is no difference between exercising an approach
that delivers availability and success amongst low-income consumer for self-help
housing. The alternative hypothesis states that there is a difference between the two
constructs, i.e.
H0: on the Availability score, Success_MYes = Success_MNo
H1: on the Availability score, Success_MYes ≠ Success_MNo
Hypothesis 3:
The null hypothesis states that there is no difference between exercising an approach
that delivers affordability and success amongst low-income consumer for self-help
housing. The alternative hypothesis states that there is a difference between the two
constructs, i.e.
H0: on the Affordability score, Success_MYes = Success_MNo
H1: on the Affordability score, Success_MYes ≠ Success_MNo
Hypothesis 4:
The null hypothesis states that there is no difference between exercising an approach
that delivers awareness and success amongst low-income consumer for self-help
housing. The alternative hypothesis states that there is a difference between the two
constructs, i.e.
H0: on the Awareness score, Success_MYes = Success_MNo
H1: on the Awareness score, Success_MYes ≠ Success_MNo
44
CHAPTER 4: RESEARCH METHODOLOGY
4.1 INTRODUCTION
This chapter focuses on the research methodology and how it was applied to the
research constructs covered in Chapter 1 and 3. Emphasis will be on the population, the
sample size, and selection, the questionnaire design, data collection process, data
analysis and research limitations.
4.2 RESEARCH METHOD
Quantitative research is employed when the researcher evaluates quantitative
information. The main data collection tool used in this study was a survey questionnaire
(see Annexure A). The 5-point numerical scale rating questionnaire was used to
interview low-income households whose earnings were less than R3,500 per month from
the area of Alexandra, Diepsloot and Ivory Park. The 5-point numerical scale was such
that respondents were able to rate their attitudes by checking how they agree or
disagree with carefully constructed positive statements (Zikmund, 2003). By assigning
the scores or weights to the alternative responses, statistical analysis of data is enabled
with probabilistic measure of a likelihood of generalisations (Zikmund, 2003).
The pilot study was also conducted to determine the validity of the questionnaire for data
collection and it served as a guide on what was to be expected from the larger study and
modifications that were necessary. Statistical analyses were done to data and
conclusions drawn in respect of the above hypotheses.
45
4.3 POPULATION OF RELEVANCE
Blaikie (2004, p.160) explains that, “In order to apply a sampling technique, it is
necessary to define the population (also called the target population, universe or
sampling frame) from which the sample is drawn”. A population can be defined as a
complete group of entities (be it people, companies, stores etc.) that share a common
set of characteristics (Zikmund, 2003). Taking into account this definition, the targeted
population for the study will mainly be the people living in the informal settlements who
earn less than R3,500 per month (falling in Tiers 3 and 4 of SA economic pyramid). For
purposes of convenience and generalisability, households who earn less than R3,500
per month and living in the informal settlements of South Africa.
4.4 SAMPLING METHOD
Blaikie defines a sample as, “a selection of elements from a population and is used to
make statements about the whole population” (Blaikie, 2004, p. 161). He further states
that, “The ideal sample is one that provides a perfect representation of a population, with
all relevant features of a population included in the sample in the same proportions.
However, while this ideal can be approached, it is difficult to achieve fully in practice”. In
this particular study practicality with respect to easy access to the sample was a huge
factor, in that whilst the study of the whole population would have been ideal, it was
important that the study is not tedious and cost intensive. Consequently the study was
limited to the geographical areas of Gauteng’s three informal settlements as a matter of
convenience.
46
Most of the houses in these townships i.e. Alexandra, Diepsloot and Ivory Park informal
settlements, form the population of interest of households who earn less than R3,500 per
month and had houses that were built via the government’s Reconstruction and
Development Programme (RDP). Common to these communities are the levels of
poverty, living conditions and quality of life.
This study employed the use of stratified sampling, analysis of variance, cross
tabulations and regression techniques as described below. Stratified sampling was an
ideal sampling method since it enabled the classification of the population into subgroups
(strata) that are more or less equal on some characteristics as mentioned above. In a
stratified sampling a sub-sample is drawn utilising simple random sampling within each
stratum (Zikmund, 2003). The other reason for choosing the stratified sampling
procedure was because of the assurance that the sample will accurately reflect the
population on the basis of the criterion or criteria used for stratification.
4.5 SAMPLE SIZE
With regards to sample size, the general rule is the bigger the better. However, Blaikie
(2004, p. 166) points out that, “increasing the sample size is subject to ‘law’ of
diminishing returns. A sample of 150 individual households who earn less than R3,500
per month from the informal settlements of Alexandra, Diepsloot and Ivory Park was
initially planned to be surveyed. The three informal settlements were to be treated as
strata with 50 household per stratum under the assumption that if there were any factors
that impact on the low-income housing consumers these were similar across the strata,
hence the strata would in fact be clusters.
47
After conducting the actual survey a sample of 142 households was only reached and
this was utilised for this research (see Table 4 below). This was considered sufficient for
generalising the findings to the rest of the population. There were obvious limitations to
the generalisability in that the population was confined to Gauteng province. Although
this maybe true, but the three communities surveyed in this study are strongly
representative of the kind of informal settlements that you find in South Africa. Gauteng -
Johannesburg was the best place to conduct this study given its rapid urbanisation,
being the economic powerhouse South Africa with highly integrated and diversified
population, and the place where most people are coming into to seek better life.
Table 4: Respondents breakdown
4.6 UNIT OF ANALYSIS
The unit of analysis for the study was the individual households that would have
responded.
• Dependent variable is Success or No success, coded as 1 for success (structural
additions) and 0 for no success (no structural additions).
• The predictor variables will be the 4As: Acceptability, Availability, Affordability and
Awareness each measured as a sums score of the constructs under that domain on
the questionnaire.
Community Sample Frame Number of respondents
Alexandra Households 51
Diepsloot Households 44
Ivory Park Households 47
Total sample 142
48
4.7 QUESTIONNAIRE DESIGN
The questionnaire was designed with the intention of collecting the data required to
answer the research hypotheses in Chapter 3. In order to clearly describe the profile of
the respondents the questionnaire comprised of nine questions relating to the
biographical and socio-economic attributes of the respondents. These questions were
namely: race, gender, age, source of income, monthly earning, ownership of a bank
account, residence, success measure (whether done structural modification or not) and
period taken to finish in addition to the constructs on Affordability, Availability,
Acceptability and Awareness.
4.8 DATA COLLECTION METHOD
Zikmund (2003) highlights that the survey method can potentially provide quick,
inexpensive, efficient, and accurate means of assessing information about the
population. A face-to-face survey was conducted in order to ensure clarity on questions
and partly to deal with any language issues through the use of the 5-point numerical
scale survey questionnaire (see Appendix A). This was done by using the group of four
data capturers, who had been trained and assessed by the author in ensuring that they
were conversant with the questionnaire details. This approach was expected to yield
minimally biased responses.
There were no personal or confidential issues on the instrument, though salary was
generally regarded as conservative. However getting the sampling frame from a
government RDP housing scheme, for those households staying in RDP houses,
ensured a way around this complication since one must earn less that R3,500 to be
granted a house.
49
4.9 DATA ANALYSIS
4.9.1 Cross Tabulation
In order to measure the existence / absence of a relationship between each of the
variables and the significance thereof, the use of cross-tabulation and Chi-square test
were employed. According to Zikmund (2003), cross-tabulation is used to inspect
differences among groups and to make comparisons. This form of analysis also helps
determine the form of a relationship between two categorical variables. Chi-square test
allows for testing of the significance in the relationship, i.e. “it tests the goodness of fit”
(Zikmund, 2003, p. 511).
4.9.2 Correlation Analysis
The most popular technique that indicates the relationship of one variable to another is
simple correlation analysis” (Zikmund, 2003, p. 551). Simple correlation coefficient is a
statistical measure of the association, between two variables. The correlation coefficient,
r, ranges from +1.0 to -1.0. It indicates both the magnitude of the linear relationship and
the direction of the relationship (Zikmund, 2003). The association between each of the
4As responses was conducted using the Pearson correlation and the significance of the
relationship was determined by using the sig. (2-tailed).
4.9.3 Analysis of Variance (ANOVA)
Analysis of Variance (ANOVA) is a statistical procedure useful in comparing means of
several groups of observations and is sometimes referred to as the test for significant
difference between means (StatSoft, 2008). When mean of more than one groups or
populations are to be compared, one-way Analysis of Variance (ANOVA) is the
appropriate statistical tool to use (Zikmund, 2003). ANOVA was used to compare two
50
independent variables, those who had done structural modifications against those who
had not (two levels of success), to their responses on each of the 4As score. In this
regard an F-test was used to test the null hypothesis for the difference in means between
Success versus No success groups. However, the test did not provide information about
the magnitude of the difference - other statistical tests would need to be performed to
quantify the magnitude. In this case, the null hypothesis was that the means of the two
groups (Success versus No success) showed no difference across each of the 4As.
H0: µSuccess = µNo success
The alternative hypothesis, H1 was that there is a difference between the two groups.
H1: µSuccess ≠ µNo success
4.9.4 Kruskal-Wallis Test
Kruskal-Wallis test is appropriate when comparing three or more groups or populations
and data are ordinal (Zikmund, 2003). According to Zikmund (2003), Kruskal-Wallis has
similarities to ANOVA, however ANOVA is used for parametric test where else Kruskal-
Wallis test can be applied in nonparametric testing (i.e. there is no distributional
assumptions such as normality). The data must be ranked from lowest to highest or the
original data be converted so that a numerical rank may be assigned to every
observation (Zikmund, 2003).
Kruskal-Wallis test has been used in this research to ascertain exactly whether
differences exist in the success measure (Yes or No responses). This test is very
relevant in a study where the arbitrary scoring was used instead of the actual numbers
(Zikmund, 2003) and that was the case in this research.
51
4.10 LIMITATIONS OF THE RESEARCH
One of the limitations for the research was that it looked at the informal settlement
around the Gauteng urban region. The conclusion and inferences made from this
research for the population of South Africa could be skewed as it will not have included
the informal settlements in the urban rural and rural areas of South Africa more so as
Gauteng has economic climate different to other provinces. This may require caution in
generalising the results to the rest of the country, e.g. the application of weights.
However, it is argued that the three communities survey, namely: Alexandra, Diepsloot
and Ivory Park, were strongly representative of the kind of informal settlements that you
find in South Africa. There is no better place in South Africa to conduct a representative
study than in Gauteng - Johannesburg where most people are coming into. Given its
rapid urbanisation and the fact that it is the economic powerhouse of South Africa with
highly integrated and diversified population, it was deemed a better place to conduct a
study of this nature.
The majority of the low-income consumer market is not fluent in English, therefore during
the interviews clarity to questions and translation where necessary was given using one
of the African languages, such as Zulu, Xhosa or Sotho. In addition there was a
possibility that the original occupant (who did structural modifications) could have not
been a sitting tenant and as such the study would attribute the success to the sitting
tenant when clearly this was not so, however every effort was made to ensure that all
respondents were real owners of the houses. This was mitigated by using multiple
questioning and probing of the respondent during the completion of the questionnaire.
52
CHAPTER 5: RESULTS
5.1 INTRODUCTION
This chapter presents findings of the research hypotheses as set out in Chapter 3
beginning with results of socio-demographic and socio-economic variables up to the
validity of different statistical techniques used for analyses. Finally, results relating to the
hypotheses being tested are presented starting with hypothesis 1 to hypothesis 4 as set
out in Chapter 3.
5.2 DESCRIPTION AND PROFILE OF RESPONDENTS
To clearly describe the profile of the respondents, the questionnaire comprised of certain
questions relating to the biographical and socio-economic attributes of the respondents
namely: race, gender, age, source of income, monthly earning, ownership of a bank
account, residence, success measure and period taken to finish building.
To measure the significance in existence or absence of a relationship between two
variables cross-tabulation tables with Chi-square test-statistics were employed.
According to Zikmund (2003), cross-tabulation is useful to inspect differences among
categorical groups and to make comparisons. Chi-square test allows for testing of
significance in relationships, i.e. “it tests the goodness of fit” (Zikmund, 2003, p. 511).
Although cross-tabulation relationships were not core to the study, the analyses were
done to explore if there were any interesting relationships that would influence the 4As.
53
Table 5: Gender versus Age cross-tabulation and Chi-Square test
GENDER * AGE Crosstabulation
7 19 30 17 73
9.6% 26.0% 41.1% 23.3% 100.0%
70.0% 54.3% 52.6% 42.5% 51.4%
4.9% 13.4% 21.1% 12.0% 51.4%
3 16 27 23 69
4.3% 23.2% 39.1% 33.3% 100.0%
30.0% 45.7% 47.4% 57.5% 48.6%
2.1% 11.3% 19.0% 16.2% 48.6%
10 35 57 40 142
7.0% 24.6% 40.1% 28.2% 100.0%
100.0% 100.0% 100.0% 100.0% 100.0%
7.0% 24.6% 40.1% 28.2% 100.0%
Count
% within GENDER
% within AGE
% of Total
Count
% within GENDER
% within AGE
% of Total
Count
% within GENDER
% within AGE
% of Total
Male
Female
GENDER
Total
(25-34) (35-44) (45-49) (50+)
AGE
Total
Chi-Square Tests
2.805a 3 .423
2.852 3 .415
2.408 1 .121
142
Pearson Chi-Square
Likelihood Ratio
Linear-by-LinearAssociation
N of Valid Cases
Value dfAsymp. Sig.
(2-sided)
1 cells (12.5%) have expected count less than 5. Theminimum expected count is 4.86.
a.
From Table 5 above, of the 142 respondents, 73 were male and 69 were female. There
were 7 females aged between 25-30 years, they constitute only 2.1% of the total sample
and 3 males constitute 4.9% of the total sample. If we interpret all the remaining
numbers in the first cell (row one column one), 9.6% is the 7 as a percentage of 73 (row
percent) and 70% is simply 7 as a percentage of all people who are 25-34 i.e. 10
(column percent). It follows if we look at 50+ year’s group that 57.5% of them are female
and 42.5% are male. Of the females who are aged 50+ years, they constitute only
12.0% of the total sampled and male constitute 16.2% of the total sample. The majority
p-value df Value
54
of the respondents were aged 45 years and above, constituting 68.3% of the total
sample.
Comparing the p-value from the Chi-square test statistic to the level of significance set at
0.05 through out enables inferences about association between gender and age to be
ascertained, the null hypothesis being that no relationship exists between gender and
age. Should the null hypothesis be rejected i.e. when the p-value is less than the level of
significance of 0.05, then the alternative hypothesis will be concluded that there is an
association between gender and age. Failure to reject the null hypothesis in contrast
does not give a definite conclusion but rather depicts that no evidence in support of or
against a relationship could be ascertained. The cross tabulation hypotheses were:
H0: No association exist between gender and age.
H1: There is an association between gender and age.
From Table 5 above, Pearson Chi-Square test gave a p-value of 0.423, which is greater
than 0.05. Therefore, since the p-value > 0.05, the H0 will not be rejected which implies
that no association exist between gender and age can be concluded.
Cross-tabulation of gender against source of income is shown in Table 6 below. From
Table 6, it is observed that of the 142 total respondents, 46.5% was employed, 28.2%
was self-employed and 25.4% was unemployed. Of the sixty six (66) employed
respondents, 53% was male versus 47% female.
Using the Chi-square to test the level of association between gender and source of
income suggests the following hypotheses:
H0: No association exist between gender and source of income.
H1: There is an association between gender and source of income.
55
From Table 6 below, Pearson Chi-Square test gave a p-value of 0.843, which is much
greater than 0.05. Therefore, since the p-value > 0.05, the H0 will not be rejected which
implies that no association exist between gender and source of income can be
concluded.
Table 6: Gender versus Source of income cross-tabulation and Chi-Square test
GENDER * S_INCOME Crosstabulation
35 21 17 73
47.9% 28.8% 23.3% 100.0%
53.0% 52.5% 47.2% 51.4%
24.6% 14.8% 12.0% 51.4%
31 19 19 69
44.9% 27.5% 27.5% 100.0%
47.0% 47.5% 52.8% 48.6%
21.8% 13.4% 13.4% 48.6%
66 40 36 142
46.5% 28.2% 25.4% 100.0%
100.0% 100.0% 100.0% 100.0%
46.5% 28.2% 25.4% 100.0%
Count
% within GENDER
% within S_INCOME
% of Total
Count
% within GENDER
% within S_INCOME
% of Total
Count
% within GENDER
% within S_INCOME
% of Total
Male
Female
GENDER
Total
Employed S_Employed Unemployed
S_INCOME
Total
Chi-Square Tests
.341a 2 .843
.341 2 .843
.276 1 .599
142
Pearson Chi-Square
Likelihood Ratio
Linear-by-Linear
Association
N of Valid Cases
Value dfAsymp. Sig.
(2-sided)
0 cells (.0%) have expected count less than 5. Theminimum expected count is 17.49.
a.
Cross-tabulation of gender against monthly income is shown in Table 7 below. Using the
Chi-square to test the level of association between gender and monthly income suggests
the following hypotheses:
H0: No association exist between gender and monthly income.
H1: There is an association between gender and monthly income.
p-value df Value
56
From Table 7 below, Pearson Chi-Square test gave a p-value of 0.221, which is greater
than 0.05. Therefore, since the p-value > 0.05, the H0 will not be rejected which implies
that no association exist between gender and monthly income can be concluded. The
salaries cannot be said to be dependant on gender.
Table 7: Gender versus monthly income cross-tabulation and Chi-Square test
GENDER * M_INCOME Crosstabulation
24 13 36 73
32.9% 17.8% 49.3% 100.0%
49.0% 40.6% 59.0% 51.4%
16.9% 9.2% 25.4% 51.4%
25 19 25 69
36.2% 27.5% 36.2% 100.0%
51.0% 59.4% 41.0% 48.6%
17.6% 13.4% 17.6% 48.6%
49 32 61 142
34.5% 22.5% 43.0% 100.0%
100.0% 100.0% 100.0% 100.0%
34.5% 22.5% 43.0% 100.0%
Count
% within GENDER
% within M_INCOME
% of Total
Count
% within GENDER
% within M_INCOME
% of Total
Count
% within GENDER
% within M_INCOME
% of Total
Male
Female
GENDER
Total
<R1500>R1500<R2500
>R2500<R3500
M_INCOME
Total
Chi-Square Tests
3.019a 2 .221
3.034 2 .219
1.240 1 .265
142
Pearson Chi-Square
Likelihood Ratio
Linear-by-LinearAssociation
N of Valid Cases
Value dfAsymp. Sig.
(2-sided)
0 cells (.0%) have expected count less than 5. Theminimum expected count is 15.55.
a.
p-value df Value
57
From Table 8 below, out of 73 male respondents, 67 (91.8%) of them have bank
accounts and six (8.2%) have no bank accounts. And out of sixty nine (69) female
respondents, 62 (89.9%) have bank accounts and 7 (10.1%) have no bank accounts.
The Pearson Chi-Square test gave a p-value of 0.691, which is greater than 0.05.
Therefore there is no association between gender and owning a bank account.
Table 8: Gender vs. owning a bank account cross-tabulation and Chi-Square test
GENDER * BANK_ACC Crosstabulation
67 6 73
91.8% 8.2% 100.0%
51.9% 46.2% 51.4%
47.2% 4.2% 51.4%
62 7 69
89.9% 10.1% 100.0%
48.1% 53.8% 48.6%
43.7% 4.9% 48.6%
129 13 142
90.8% 9.2% 100.0%
100.0% 100.0% 100.0%
90.8% 9.2% 100.0%
Count
% within GENDER
% within BANK_ACC
% of Total
Count
% within GENDER
% within BANK_ACC
% of Total
Count
% within GENDER
% within BANK_ACC
% of Total
Male
Female
GENDER
Total
Yes No
BANK_ACC
Total
Chi-Square Tests
.158b 1 .691
.011 1 .915
.158 1 .691
.776 .457
.157 1 .692
142
Pearson Chi-Square
Continuity Correctiona
Likelihood Ratio
Fisher's Exact Test
Linear-by-Linear
Association
N of Valid Cases
Value dfAsymp. Sig.
(2-sided)Exact Sig.(2-sided)
Exact Sig.(1-sided)
Computed only for a 2x2 tablea.
0 cells (.0%) have expected count less than 5. The minimum expected count is 6.32.
b.
p-value df Value
58
From Table 9 below, out of seventy one (71) respondents who admitted to having done
structural modifications / additions to their houses, 53.5% were female versus 46.5%
male. Of the twenty eight (28) respondents who had done structural modification within
a period of less than 18 months, 64.3% were female versus only 35.7% male. Of the
(thirty) 30 respondents who had done structural modification / additions within a period of
less than 24 months 66.7% were male versus only 33.3% female.
Table 9: Gender vs. Finishing period cross-tabulation and Chi-Square test
GENDER * IF_FINISHED Crosstabulation
1 2 10 20 33
3.0% 6.1% 30.3% 60.6% 100.0%
20.0% 25.0% 35.7% 66.7% 46.5%
1.4% 2.8% 14.1% 28.2% 46.5%
4 6 18 10 38
10.5% 15.8% 47.4% 26.3% 100.0%
80.0% 75.0% 64.3% 33.3% 53.5%
5.6% 8.5% 25.4% 14.1% 53.5%
5 8 28 30 71
7.0% 11.3% 39.4% 42.3% 100.0%
100.0% 100.0% 100.0% 100.0% 100.0%
7.0% 11.3% 39.4% 42.3% 100.0%
Count
% within GENDER
% within IF_FINISHED
% of Total
Count
% within GENDER
% within IF_FINISHED
% of Total
Count
% within GENDER
% within IF_FINISHED
% of Total
Male
Female
GENDER
Total
< 6 m < 12 m < 18 m < 24 m
IF_FINISHED
Total
Chi-Square Tests
9.112a 3 .028
9.384 3 .025
7.692 1 .006
71
Pearson Chi-Square
Likelihood Ratio
Linear-by-LinearAssociation
N of Valid Cases
Value dfAsymp. Sig.
(2-sided)
4 cells (50.0%) have expected count less than 5. Theminimum expected count is 2.32.
a.
The Pearson Chi-Square test gave a p-value of 0.028, which is less than 0.05. Since the
p-value < 0.05, this implies that there is an association between gender and period taken
to finish building. This means that the two gender groups (men versus women) differ in
period taken to finish building.
p-value df Value
59
From Table 10 below the finishing period versus monthly income cross-tabulation is
shown. Out of seventy one (71) respondents who admitted to having done structural
modifications / additions to their houses, forty nine (49) earn between R2,500 and
R3,500; eleven (11) earn between R1,500 and R2,500 and another eleven (11) earn less
than R1,500 per month (see Table 10). Most of the people (43 out of 49) who earn
between R2,500 and R3,500 per month have done structural modification longer than 12
months. The people who earn <R1,500 per month were uniformly distributed in terms of
their project completion periods.
Table 10: Finishing period versus monthly income cross-tabulation
Crosstab
2 0 3 5
40.0% .0% 60.0% 100.0%
18.2% .0% 6.1% 7.0%
2.8% .0% 4.2% 7.0%
3 2 3 8
37.5% 25.0% 37.5% 100.0%
27.3% 18.2% 6.1% 11.3%
4.2% 2.8% 4.2% 11.3%
1 5 22 28
3.6% 17.9% 78.6% 100.0%
9.1% 45.5% 44.9% 39.4%
1.4% 7.0% 31.0% 39.4%
5 4 21 30
16.7% 13.3% 70.0% 100.0%
45.5% 36.4% 42.9% 42.3%
7.0% 5.6% 29.6% 42.3%
11 11 49 71
15.5% 15.5% 69.0% 100.0%
100.0% 100.0% 100.0% 100.0%
15.5% 15.5% 69.0% 100.0%
Count
% within IF_FINISHED
% within M_INCOME
% of Total
Count
% within IF_FINISHED
% within M_INCOME
% of Total
Count
% within IF_FINISHED
% within M_INCOME
% of Total
Count
% within IF_FINISHED
% within M_INCOME
% of Total
Count
% within IF_FINISHED
% within M_INCOME
% of Total
< 6 m
< 12 m
< 18 m
< 24 m
IF_FINISHED
Total
<R1500>R1500<R2500
>R2500<R3500
M_INCOME
Total
60
Table 11 shows the finishing period versus owning a bank account cross-tabulation. Out
of seventy one (71) respondents who admitted to having done structural modifications,
there was only one (1) who had no bank account.
Table 11: Finishing period versus owning a bank account cross-tabulation
Crosstab
5 0 5
100.0% .0% 100.0%
7.1% .0% 7.0%
7.0% .0% 7.0%
8 0 8
100.0% .0% 100.0%
11.4% .0% 11.3%
11.3% .0% 11.3%
28 0 28
100.0% .0% 100.0%
40.0% .0% 39.4%
39.4% .0% 39.4%
29 1 30
96.7% 3.3% 100.0%
41.4% 100.0% 42.3%
40.8% 1.4% 42.3%
70 1 71
98.6% 1.4% 100.0%
100.0% 100.0% 100.0%
98.6% 1.4% 100.0%
Count
% within IF_FINISHED
% within BANK_ACC
% of Total
Count
% within IF_FINISHED
% within BANK_ACC
% of Total
Count
% within IF_FINISHED
% within BANK_ACC
% of Total
Count
% within IF_FINISHED
% within BANK_ACC
% of Total
Count
% within IF_FINISHED
% within BANK_ACC
% of Total
< 6 m
< 12 m
< 18 m
< 24 m
IF_FINISHED
Total
Yes No
BANK_ACC
Total
61
5.3 CORRELATION ANALYSES OF THE 4AS
5.3.1 Measurement scores
Acceptability: this was measured by using the sum score of the responses given for
each of the 3 factors (see appendix A) with minimum = 3 and maximum
= 15
Availability: this was measured by using the sum score of the responses given for each
of the 4 factors (see appendix A) with minimum = 3 and maximum = 20
Affordability: this was measured by using the sum score of the responses given for
each of the 6 factors (see appendix A) with minimum = 3 and maximum
= 30
Awareness: this was measured by using the sum score of the responses given for each
of the 3 factors (see appendix A) with minimum = 3 and maximum = 25
“The most popular technique that indicates the relationship of one variable to another is
simple correlation analysis” (Zikmund, 2003, p. 551). Simple correlation coefficient is a
statistical measure of the association, between two variables. The correlation coefficient,
r, ranges from +1.0 to -1.0. It indicates both the magnitude of the linear relationship and
the direction of the relationship (Zikmund, 2003). The association between each of the
4As responses was conducted using the Pearson correlation and the significance of the
relationship was determined by using the sig. (2-tailed) (see Table 12 below).
62
Table 12: 4As - Correlation Analyses
Correlations
1 .682** .666** .582**
.000 .000 .000
142 142 142 142
.682** 1 .835** .800**
.000 .000 .000
142 142 142 142
.666** .835** 1 .797**
.000 .000 .000
142 142 142 142
.582** .800** .797** 1
.000 .000 .000
142 142 142 142
Pearson Correlation
Sig. (2-tailed)
N
Pearson Correlation
Sig. (2-tailed)
N
Pearson Correlation
Sig. (2-tailed)
N
Pearson Correlation
Sig. (2-tailed)
N
Acceptability
Availability
Affordability
Awareness
Acceptability Availability Affordability Awareness
Correlation is significant at the 0.01 level (2-tailed).**.
From Table 12 above, all Pearson Correlations were found to be significant and were all
less 0.01 levels (2-tailed). Of the 4As, Affordability and Availability had the highest
correlation coefficient of 0.835. Judging from the correlation coefficient and p-value (Sig.
2-tailed) from the table 9 above there is strong evidence that the 4As have a significant
correlation. This positively demonstrates that the 4As are linearly dependant and related
to each other.
5.4 DESCRIPTIVE STATS OF THE 4AS AND THE MEASURE OF SUCCESS (SUCCESS_M)
The table of descriptive analysis of the 4As against success measure (see Table 13
below), shows that there were 71 respondents who answered “No” on the measure of
success (Success_M) and 71 respondents who answered “Yes” based on whether they
had conducted structural modifications on their houses or not. From the results the
mean for “Yes” is greater than the mean for “No” for all of the 4As. Across all the 4As
people who have done structural modifications (with Yes response) scored higher on
average than those who have not (with No response). Looking at the Std. error and the
63
Std. deviation columns, those respondents who had responded “Yes” had lower Std.
error and the Std. deviation than those who had responded “No” implying more
consistence within the “Yes” group compared to the “No” group. Acceptability had the
lowest Std. error and Std. deviation, for each of the 4As at 1.841 and 0.154 respectively.
Across all 4As the “No” responses had the lowest minimum when compared to the “Yes”
responses.
Table 13: Descriptive analysis of the 4As against Success measure
Descriptives
71 19.24 1.177 .140 18.96 19.52 16 20
71 14.92 2.877 .341 14.23 15.60 9 20
142 17.08 3.083 .259 16.57 17.59 9 20
71 12.94 1.308 .155 12.63 13.25 9 15
71 10.76 1.643 .195 10.37 11.15 4 14
142 11.85 1.841 .154 11.55 12.16 4 15
71 28.42 1.215 .144 28.13 28.71 23 30
71 21.03 3.884 .461 20.11 21.95 16 30
142 24.73 4.689 .394 23.95 25.50 16 30
71 21.28 2.485 .295 20.69 21.87 14 25
71 16.00 3.854 .457 15.09 16.91 10 25
142 18.64 4.179 .351 17.95 19.33 10 25
Yes
No
Total
Yes
No
Total
Yes
No
Total
Yes
No
Total
Availability
Acceptability
Affordability
Awareness
N Mean Std. Deviation Std. Error Lower Bound Upper Bound
95% Confidence Interval for
Mean
Minimum Maximum
The descriptive Std. deviation and Std. error shows the level of consistency by each of
the respondents in each of the 4As. Of the 4As, Acceptability had the lowest Std. error
(0.154), this means that the responses for Acceptability had less variation within
themselves than the other 3As, i.e. the responses were more consistent.
64
5.5 SUM SCORE PERCENTAGE (%) RATING FOR EACH OF THE 4AS QUESTIONS
The table in Appendix B shows the sum score % ratings for each of the 4As variables.
Each of the variable comprised of items that were being rated on a 5-point numerical
scale where “1” was for strongly disagree and “5” was for strongly agree. The highest
sum score for acceptability which has 3 items would therefore be 15, (i.e. 3 x 5 = 15).
Thus if a respondent had highly rated (strongly agreed) all acceptability questions, the
sum score % rating would then be [((3 x 5)/15)*100] = 100%.
All respondents who answered “Yes” had their responses with aggregate sum score %
rating above 85%, with the minimum sum score % rating of 86.3% and 85.1% for
acceptability and awareness independent variables respectively. All respondents who
answered “No” had their responses more than 70% except for the awareness
independent variables that had the sum score % rating of 64.0%.
Under awareness independent variable, most of the “No” respondents had scored low on
item 4(c): which was about exhibition on the use of building materials (sum score rating
of 53.8%), and 4(d): which was about receiving training on how to use a particular
building material (at 59.7%). The other individual low sum score rating below 60% was
under affordability independent variable where most of the “No” respondents had scored
low on item 3(a): which was about the reduced package size of building material helping
with lowering the selling price and making building material affordable.
On average both the respondents who had “Yes” and those who had “No” response on
success measure (Success_M) had sum score well above 60% for each of the 4As
independent variables. This demonstrates the importance of each of the variables in
enabling conditions for self-help building as per consumer perspective.
65
5.6 BAR CHART PLOTS FOR THE 4AS
5.6.1 Acceptability
Figure 6 below shows the bar chart plot for measure of success responses versus the
score on Acceptability. On average those who have done structural modifications (Yes
for Success_M) turn to peak at 13 on Acceptability score whereas those who have not
done structural modifications (with “No” response for Success_M) turn to peak at 11 on
Acceptability score. People that have done structural modification had higher count
frequency compared to those who have not. Clearly seen on the graph is the lagging
effect visible between the two groups. Therefore on the average one would expect those
people who have completed their structural modification to retain a higher Acceptability
score than those who have not.
FIGURE 6: Bar chart plot for Acceptability vs. Success Measure (Yes and No)
151413121110984
Acceptability
30
25
20
15
10
5
0
Cou
nt
No
Yes
SUCCESS_M
66
5.6.2 Availability
The bar chart for measure of success responses on Availability is shown in Figure 7.
Optimally those who have not done any structural modification turn to peak at Availability
score of 13 compared to those who have done structural modification who peak at
Availability score of 20. Of significance is the frequency at which people that have done
structural modification peak at 20 and the minimum or threshold score for those who
have done structural modification is 16. From those people who had not done structural
modification they mostly preferred giving responses that were sitting in the middle i.e. 3
in a scale of 1 to 5, hence their availability scoring came around 13 instead of a
maximum score of 20.
FIGURE 7: Bar chart plot for Availability vs. Success Measure (Yes and No)
2019181716151413129
Availability
50
40
30
20
10
0
Cou
nt
No
Yes
SUCCESS_M
67
5.6.3 Affordability
With respect to Affordability, people who have done structural modifications scored
higher on average than those who have done no structural modifications (see Figure 8
below). Those who have done no structural modifications turn to peak up lower at
around 18 versus those who have done structural modification who optimally scored 29.
FIGURE 8: Bar chart plot for Affordability vs. Success Measure (Yes and No)
3029282726252423212019181716
Affordability
30
25
20
15
10
5
0
Cou
nt
No
Yes
SUCCESS_M
68
5.6.4 Awareness
A maximum score of 25 was expected for Awareness (see Figure 9 below). Most of the
scores start rising at around 18 and peak at 22 for those who have done structural
modification and only peak at around 13 for those who have not done structural
modifications to their houses.
FIGURE 9: Bar chart plot for Awareness vs. Success Measure (Yes and No)
25242322212019181716151413121110
Awareness
20
15
10
5
0
Cou
nt
No
Yes
SUCCESS_M
69
5.7 TESTING OF HYPOTHESES
5.7.1 ANOVA
To compare or test for a difference in means for two or more groups or populations, one-
way Analysis of variance (ANOVA) is an appropriate statistical procedure (Zikmund,
2003). In this study, ANOVA was used to compare two independent groups (those who
have done structural modifications against those who have not) to their responses on
each of the 4As score (see Table 14 below).
Table 14: Analysis of Variance (ANOVA) for the 4As responses
Sum of Squares
df
Mean Square
F
Sig. (p-value)
Availability Between Groups (Combined)
Within Groups
Total
663.725
676.423
1340.148
1
140
141
663.725
4.832
137.372
.000
Acceptability Between Groups (Combined)
Within Groups
Total
169.190
308.704
477.894
1
140
141
169.190
2.205
76.729
.000
Affordability Between Groups (Combined)
Within Groups
Total
1941.021
1159.268
3100.289
1
140
141
1941.021
8.280
243.409
.000
Awareness Between Groups (Combined)
Within Groups
Total
990.317
1472.366
2462.683
1
140
141
990.317
10.517
94.164
.000
70
Acceptability: If we have two levels of the independent variable, the null hypothesis for
Acceptability is stated as follows:
H0: on the Acceptability score, Success_MYes = Success_MNo
H1: on the Acceptability score, Success_MYes ≠ Success_MNo
Based on the p-value achieved which was significantly less than 0.05, reported to be
0.000, this implies that we reject the H0 and conclude on H1 i.e. Success_MYes ≠
Success_MNo. This means that there is a significant difference in responses on
Acceptability between the people who have done structural modification versus those
who have not.
Availability: If we have two levels of the independent variable, the null hypothesis for
Availability is stated as follows:
H0: on the Availability score, Success_MYes = Success_MNo
H1: on the Availability score, Success_MYes ≠ Success_MNo
Based on the p-value achieved which was significantly less than 0.05, reported to be
0.000, this means that the null hypothesis, H0 is rejected in favour of the alternative
hypothesis, H1, so Success_MYes ≠ Success_MNo. This means that there is a significant
difference in responses on Availability between the people who have done structural
modification versus those who have not.
Affordability: If we have two levels of the independent variable, the null hypothesis for
Affordability is stated as follows:
H0: on the Affordability score, Success_MYes = Success_MNo
H1: on the Affordability score, Success_MYes ≠ Success_MNo
71
Based on the p-value achieved which was significantly less than 0.05, reported to be
0.000, this implies that we reject the H0 and conclude on H1 i.e. on the Affordability score,
Success_MYes ≠ Success_MNo. This means that there is a significant difference in
responses on Affordability between the people who have done structural modification
versus those who have not.
Awareness: If we have two levels of the independent variable, the null hypothesis for
Awareness is stated as follows:
H0: on the Awareness score, Success_MYes = Success_MNo
H1: on the Awareness score, Success_MYes ≠ Success_MNo
Based on the p-value achieved which was significantly less than 0.05, reported to be
0.000, this implies that we reject the H0 and conclude on H1, again on the Awareness
score, Success_MYes ≠ Success_MNo. This means that there is a significant difference in
responses on Awareness between the people who have done structural modification
versus those who have not.
5.8 ANOVA FOR THE 4AS VERSUS EACH OF THE DESCRIPTIVE ELEMENTS
5.8.1 Acceptability
The Analysis of Variance (ANOVA) for each of the 4As as the independent variable
against each of the descriptive elements is depicted in Appendix C (i). From Appendix C
(i), it is seen that under Acceptability people with bank account had a p-value of 0.421
which is higher than 0.05. The Success_M and monthly income have the p-values <
0.05 at 0.00 for both descriptive elements.
Since the p-value of 0.421 is higher than 0.05, therefore one can conclude that there is
no association between Acceptability and owning a bank account. This implies that
72
there is no difference in responses between people who have a bank account and those
without a bank account when it comes to their responses under Acceptability. Therefore
owning a bank account or not has no influence on how people would respond to
Acceptability.
On the other hand Success_M and monthly income have the p-values < 0.05 at 0.00 for
both descriptive elements. Therefore, there is an association / relationship between
Acceptability and Success_M, which confirms the previous findings (i.e. Success_MYes ≠
Success_MNo), and also there is an association between Acceptability and monthly
income.
5.8.2 Availability
The table of results in Appendix C (ii) shows that of the eight descriptive elements looked
at against Availability, five have their p-values <0.05, namely: residence (0.002);
Success_M (0.000); source of income (0.037); monthly income (0.002) and age (0.001).
The results show evidence to suggest that Availability is associated to residence;
Success_M; source of income; monthly income and age. Interestingly noticed is that
Availability was associated with residence and age but not Acceptability.
5.8.3 Affordability
The table of results in Appendix C (iii) shows that of the eight descriptive elements
looked at against Affordability, three have their p-values <0.05, namely: owning a Bank
account (0.000); Success_M (0.000) and monthly income (0.001).
From the results, there is evidence to suggest that Affordability is associated to owning a
bank account; Success_M and monthly income. Similar to Acceptability and Availability
above, Affordability is also related / associated to Success_M and monthly income.
73
5.8.4 Awareness
The table of results in Appendix C (iv) shows that of the eight descriptive elements
looked at against Awareness, four have their p-values <0.05, namely: residence (0.001);
Success_M (0.000); period_finished (0.000) and monthly income (0.001).
From the results, there is evidence to suggest that Awareness is associated to
residence; Success_M; period_finished and monthly income. Interesting to note is that
monthly income and success measure were associated to all the 4As.
5.9 KRUSKAL-WALLIS TEST
Kruskal-Wallis test is appropriate when comparing three or more groups or populations
and data are ordinal (Zikmund, 2003). According to Zikmund (2003), Kruskal-Wallis has
similarities to ANOVA, however ANOVA is used for parametric test where else Kruskal-
Wallis test can be applied in nonparametric testing (i.e. there is no distributional
assumptions such as normality). The data must be ranked from lowest to highest or the
original data be converted so that a numerical rank may be assigned to every
observation (Zikmund, 2003).
Kruskal-Wallis test has been used in this research to ascertain exactly whether
differences exist in the success measure (Yes or No responses). This test is very
relevant in a study where the arbitrary scoring was used instead of the actual numbers
(Zikmund, 2003) and this was the case in this research.
From the ranks Table 15 below, it is seen that those who had “Yes” responses on
success measure (i.e. had done structural modifications) have a higher mean rank
values across all the 4As.
74
The mean rankings were as follows:
• For Acceptability: 96.54 (Yes responses) and 46.46 (No responses)
• For Availability: 99.56 (Yes responses) and 43.44 (No responses)
• For Affordability: 101.45 (Yes responses) and 41.55 (No responses), and
• For Awareness: 96.85 (Yes responses) and 46.15 (No responses)
From the ranks Table, the mean rank for Affordability and Availability were the highest at
101.45 and 99.56 respectively.
Table 15: Kruskal-Wallis Test for the 4As responses
Ranks
71 96.54
71 46.46
142
71 99.56
71 43.44
142
71 101.45
71 41.55
142
71 96.85
71 46.15
142
SUCCESS_MYes
No
Total
Yes
No
Total
Yes
No
Total
Yes
No
Total
Acceptability
Availability
Affordability
Awareness
N Mean Rank
The greater mean rank values for those who had done structural modifications, depicted
in Table 15 above, implies that in all of the 4As those who had done structural
modifications have a greater mean rank values than those who had not done structural
modifications, and this difference was significant through out. This further confirms the
research hypothesis (H1) that says: Success_MYes ≠ Success_MNo
75
The mean ranks for Affordability and Availability that were the highest implies that of the
4As, Affordability and Availability have the significant influence and strong association to
the level of success in conducting structural modifications (success measure) on their
houses. Ultimately, all the 4As were highly significant in influencing the level of success
in self-help housing amongst the respondents.
76
CHAPTER 6: DISCUSSION OF RESULTS
6.1 INTRODUCTION
This chapter expands on the results presented in Chapter 5. The interpretation of the
results is facilitated by insights gained in literature review. The objective of this analysis
of results is to provide plausible projections into the sample population and elaborate on
the rejection of hypotheses 1 to 4 as presented in Chapter 5 or the failure to do so i.e. to
reject.
6.2 DESCRIPTIONS OF THE SAMPLE POPULATION
6.2.1 Descriptive for gender and age
In terms of the sample size, the sample population is properly balanced (i.e. 71:71)
between those respondents who have done structural modifications and those who have
not done structural modifications to their houses. The results shown in Table 5 indicate
that, the majority of the respondents were aged 45 years and above, constituting 68.3%
of the total sample. The difference in home ownership between male and female (see
Table 5) is more or less equally split between genders with 51.4% male and 48.6%
female ownership.
6.2.2 Association between gender and monthly income
Testing the relationship between gender and monthly income, as shown in Table 7 of
Chapter 5, suggests that no association exist between gender and monthly income. This
implies that the salaries that we are going to see are not in anyway dependant on
whether one is a male or female. Therefore there is no argument to suggest that women
or man would be advantaged in doing structural modifications or extensions to their
houses because of salary issues. Income levels are not differentiated by gender, i.e. if
77
there is any difference in income between male and female gender would not be the
causative. For any argument in this study, income can therefore not be used as a
source of evidence in influencing the success of female versus male and visa versa.
6.2.3 Association between gender and owning a bank account
The results shown in Table 8 of Chapter 5 suggest that, there is no relationship between
gender and owning a bank account. Therefore, if there is a difference between people
who have bank account versus those who have no bank account, causative effect of that
can never be gender. This is obvious since for both male and female most of them
clearly had the “Yes” response and very few “No” with respect to owning a bank account.
What is noticeable is that most of the respondent households (i.e. 90.8%) own bank
accounts, with only 9.2% owning no bank account. SadreGhazi (2008, p. 7) argues that
“Individual’s limited access to or use of the formal banking services pervades many
emerging markets”. Even though 90.9% of respondents agreed to own a bank account,
but their low level income limit them from accessing credit and most of them cannot
therefore finance large investments or purchases. According to Mendoza and Thelen
(2008) this results to restricted access to financial products and services amongst the
poor, preventing them from participating more actively in housing market.
6.2.4 Association between gender and finishing period
From Table 9, the results show that the p-value is less than 0.05; this implies that there
is an association between gender and period taken to finish building. Of the (thirty) 30
respondents who have done structural modification / additions within a period of less
than 24 months 66.7% were male versus only 33.3% female. On average male
respondents took much longer a period to finish their projects than female as evidenced
by the Kruskal Wallis test. This could mean that women do not procrastinate or drag on
things that would require investment on time or they are just better organisers than man.
78
This supports literature observation by Jenkins et al (2008, p.19) that “Companies have
found time and time again that women are both more reliable and more entrepreneurial
than men”. Jenkins et al (2008) further argues that women have a great social network
than men. Ndinda (2009) also confirms Jenkins et al observation when she argues that
the success by women in housing is the result of the strategies the women employed, for
instance they are good at lobbying.
Various studies suggest that the involvement of women in the planning, design and
implementation of housing projects results in a higher success rate of projects than
where women are excluded (Ndinda, 2009). Interesting to note is that, Government of
South Africa has also particularly identified the need to support the role of women in the
housing delivery process (DoH, 2007).
6.2.5 Association between finishing period and monthly income
Cross-tabulation results between finishing period and monthly income shown in Table 10
depicts that most of the people who earn between R2,500 and R3,500 per month have
done structural modification took longer than 12 months, and people who earn <R1,500
per month were uniformly distributed in terms of their project completion periods.
Amongst the low-income earners, people who earn more would be expected to be the
one who take less time to complete their projects than those who earn less, but this was
not the case. This could be that people who earn more turn to procrastinate or possibly
could have a lot to do with the size or scale of the structural modification project, which
they embark upon, being large and hence taking longer.
79
6.2.6 Association between finishing period and owning a bank account
The table of results in Table 11 shows the finishing period versus owning a bank account
cross-tabulation. Out of seventy one (71) respondents who conducted structural
modifications, there was only one (1) who had no bank account. Table 8 shows that, out
of 142 total respondents, thirteen (13) had no bank account, this means that out of
seventy one (71) respondents who have not done structural modifications, there were
twelve (12) with no bank account. This clearly demonstrate that ownership of a bank
account is much more of the incentive (according to the scope of the study) leading to
success in structural modification than not owning a bank account. This finding confirms
Mendoza and Thelen (2008) view that restricted access to financial products and
services amongst the poorer prevent them from participating more actively in housing
market.
It is stated earlier in the literature review that compared to those with high-incomes, low-
income people are much less likely to have bank accounts, less likely to save or invest
and more susceptible to predatory lending practices (Hammond et al., 2007; UNDP,
2007; Subrahmanyan and Gomez-Arias, 2008). Ownership of a bank account is an
incentive; it enables easy access to credit and also allows for direct deposit of payroll
transactions and bill payment (Mendoza and Thelen, 2008).
However, it must also be mentioned that lack of stable financial resources resulting from
unemployment, could be the primary reason for not having a bank account. These
results support the literature in that the majority of the respondents (i.e. 12 out of 13
respondents) who did not have bank accounts had not done any structural modifications
to their homes.
80
6.3 RESEARCH HYPOTHESIS ONE (Acceptability versus Success)
Hypothesis one is the relationship between Acceptability and Success amongst low-
income consumer for self-help housing. The null hypothesis states that there is no
difference between exercising an approach that delivers acceptability and success
amongst low-income consumer for self-help housing. The alternative hypothesis states
that there is a difference between the two constructs, i.e.
H0: on the Acceptability score, Success_MYes = Success_MNo
H1: on the Acceptability score, Success_MYes ≠ Success_MNo
6.3.1 Discussion of findings on Hypothesis One
It is stated earlier on in the literature review (Chapter 2) that acceptability is the extent to
which consumers and others in the value chain are willing to consume, distribute or sell a
product or service (Anderson and Billou, 2007). According to Segel and Meghji (2005)
purchasing through savings is another innovation that low-income consumers can use to
obtain access to services such as cement and other building materials on credit. In the
literature review De Soto (2000, p. 5) explained the fact that: “Even in the poorest
nations the poor save. The value of savings among the poor is, in fact, immense”.
The section in the questionnaire on acceptability comprised 3 items (refer to appendix
A). Item 1(a) refers to the culture of saving money in a bank as a way of raising funds
towards building. The response categories for this item were such that “1” was for
strongly disagree and “5” for strongly agree. People who have done structural
modifications rated item 1(a) at 88.7% and those who have not done structural
modifications rated 1(a) at 75.2%. Though there is a 13.5% difference in the rating, but
both sum score percentage ratings were fairly high and falling between agreeing and
strongly agreeing scale. This confirms the notion by De Soto (2000) that low-income
81
consumers do believe in savings. What has to be acknowledged though is the fact that
saving towards building is never adequate given the low disposable income amongst the
poor.
The bar chart plot for measure of success responses versus the score on Acceptability
(see Figure 6), shows that on average people who have done structural modification are
on the higher frequency compared to those who have not. Therefore on the average one
would expect those people who have completed their structural modification to retain a
higher Acceptability score than those who have not (i.e. Success_MYes ≠ Success_MNo).
The results confirm the research hypothesis that there is a difference between exercising
an approach that delivers acceptability and success amongst low-income consumer for
self-help housing.
From the ANOVA results in Table 14, the p-value achieved was significantly less than
0.05, reported to be 0.000, this implies that the H0 is rejected and conclude on H1 (i.e.
Success_MYes ≠ Success_MNo). This further confirms the fact that there is a significant
difference in responses on Acceptability between people who have done structural
modification versus those who have not.
ANOVA for each of the 4As against each of the descriptive elements depicted in
Appendix C (i) shows that Success_M and monthly income have the p-values < 0.05 at
0.00 for both descriptive elements. The association between Acceptability and
Success_M confirms the previous findings (i.e. Success_MYes ≠ Success_MNo). The
association between acceptability and monthly income was to be expected since for
people to can have a culture of saving they need to be earning some money and having
disposable cash for saving.
82
6.4 RESEARCH HYPOTHESIS TWO (Availability versus Success)
Hypothesis two is the relationship between Availability and Success amongst low-income
consumer for self-help housing. The null hypothesis states that there is no difference
between exercising an approach that delivers availability and success amongst low-
income consumer for self-help housing. The alternative hypothesis states that there is a
difference between the two constructs, i.e.
H0: on the Availability score, Success_MYes = Success_MNo
H1: on the Availability score, Success_MYes ≠ Success_MNo
6.4.1 Discussion of findings on Hypothesis Two
From the literature review (Chapter 2) availability is the extent to which customers are
able to readily acquire and use a product or service (Anderson and Billou, 2007).
According to Marais and Wessels (2005) housing delivery in the developing world is
characterised by an extreme scarcity of resources and remains a contentious issue for
any government. One of the main constraints that limit businesses from engaging with
the poor is inadequate physical infrastructure (Mendoza and Thelen, 2008).
Transportation is complicated by the lack of roads and supporting infrastructure making it
very difficult for the poor to access product and services (UNDP, 2008).
In support of the above notion, SadreGhazi (2008, p. 8) states that “the low-income
market represents a more diverse cultural variety and geography. In the majority of low-
income markets, the availability of logistics infrastructure can not be taken for granted as
it makes delivery and distribution of building material difficult”. Viswanathan (2007)
advises that since BOP consumers do not have the transportation luxury to do price
comparisons, having a regular relationship with a few neighbourhood retailers helps build
trust and hence more likelihood of getting credit. Ultimately having a small local
83
hardware shops nearby is convenient in sourcing building material (Subrahmanyan and
Gomez-Arias, 2008).
The section in the questionnaire on availability comprised of 4 items (refer to appendix
A). The questions referred to the convenience associated with having both the builder
and supplier of building material located within the community as an enabler for self-help
housing. The table of sum score percentage rating in appendix B shows that under
availability independent variable, respondents who have not done structural
modifications rated availability 20% lower than those who have done structural
modifications, with their sum score percentage ratings at 74.6% and 96.2% respectively.
Not withstanding the difference in rating between the two groups, the responses were
positive for both groups of respondents, demonstrating that enabling conditions
suggested under availability sections were well accepted and deemed important by both
group of respondents. This confirms the notion by Viswanathan (2007) and
Subrahmanyan & Gomez-Arias (2008) that accessibility to products and services is
serious challenge for the BOP.
The bar chart plot for measure of success responses versus the score on Availability is
given in Figure 7. What is of significance is the frequency at which people that have
done structural modification peak at, for instance more than 46 respondents scored 20.
From those people who were interviewed and have not done structural modification they
mostly preferred giving responses that were sitting in the middle i.e. 3 in a scale of 1 to 5,
hence their availability scoring came around 13 instead of a maximum score of 20. The
results confirm that there is a difference in response between those who have done
structural modification and those who have not done structural modification to their
houses.
84
From the ANOVA results in Table 14, the p-value achieved was significantly less than
0.05, reported to be 0.000, this implies that the H0 is rejected in favour of the alternative
hypothesis, H1 (i.e. on availability score, Success_MYes ≠ Success_MNo). This further
confirms the fact that there is a significant difference in responses on Availability
between people who have done structural modification versus those who have not.
There is evidence from the table of results in Appendix C (ii) to suggest that Availability is
associated to residence; Success_M; source of income; monthly income and age.
Interesting to note is that Availability was associated with residence and age but not
Acceptability. Similar to Acceptability variable, Availability is also associated / related to
Succes_M and monthly income. Surely there must be a difference with respect to
access to the suppliers of building materials between residents of Ivory Park, Alexandra
and Diepsloot to suggest an association between availability and residence observed
above. This finding aligns with what SadreGhazi (2008, p. 8) states in that “the low-
income market represents a more diverse cultural variety and geography. In the majority
of low-income markets, the availability of logistics infrastructure is always a challenge”.
This is evident from the high availability scoring by those who have done structural
modification; they must have felt the inconvenience causes by lack of building material
suppliers within the vicinity where they stay. Availability of resources and infrastructure
would thus make space for the time and effort required to serving the needs and
concerns of consumer for housing both on the consumer and supplier perspective. In
conclusion it has been demonstrated that there is a relationship between Availability and
Success amongst low-income consumer for self-help housing.
85
6.5 RESEARCH HYPOTHESIS THREE (Affordability versus Success)
Hypothesis three is the relationship between Affordability and Success amongst low-
income consumer for self-help housing. The null hypothesis states that there is no
difference between exercising an approach that delivers affordability and success
amongst low-income consumer for self-help housing. The alternative hypothesis states
that there is a difference between the two constructs, i.e.
H0: on the Affordability score, Success_MYes = Success_MNo
H1: on the Affordability score, Success_MYes ≠ Success_MNo
6.5.1 Discussion of findings on Hypothesis Three
Anderson and Billou (2007, p. 15) defines affordability as “The degree to which a firm’s
goods or services are affordable to BOP consumers”. They further state that, “… many
low-income consumers in developing countries survive on daily wages, meaning that
cash-flow can be a significant problem, thus companies need to be able to deliver
offerings at a price point that enables consumption by even the poorest of consumers”
(Anderson and Billou, 2007, p. 15).
From the literature review, Tomlinson (1999, p. 292) states: “evidence…suggests that
residents of shack settlements on the urban peripheries, while now enjoying access to
housing subsidies, have remained marginalized and impoverished”. According to De
Soto (2000), most of the poor households occupy land whose ownership rights are not
adequately recorded and as a result cannot use these assets as collateral for a loan, and
this scenario limits them from accessing credit.
The most eminent characteristic of the communities at the BOP is the lower level of
disposable income (SadreGhazi, 2008). The problem of low disposable income
86
according to SadreGhazi manifests itself mainly in two ways: (1) low purchasing power
and (2) lack of access to credit (SadreGhazi, 2008). Lacking credit simply mean that the
poor consumer cannot finance large purchases like a house. Mendoza and Thelen
(2008) suggest things such as a flexible payment scheme, complete product packaging
(by including training along with access to building materials and financing) and tapping
into ‘soft’ community networks by having community members hired to help market the
programme, as possible innovative strategies that companies can employ in order to
overcome obstacles that marginalise the poor in self-help housing.
Mendoza and Thelen (2008) further advise that, “There may be a number of ways to
improve the poor’s purchasing power by adjusting retail and pricing strategies - notably
through joint consumption, flexible payment schemes, and tiered pricing - to better fit a
large consumer base with individually low and volatile income streams”. These and
other strategies were put in a questionnaire items for affordability section in order to
gather from the consumers perspective as to whether such strategies would improve
their conditions for self-help housing or not.
The affordability section of the questionnaire comprised of 6 items (refer to appendix A).
The questions referred to the above suggested strategies by Mendoza and Thelen
(2008), Anderson and Billou (2007), and SadreGhazi (2008) on how to make building
material affordable to the poor consumer for self-help housing. The table of sum score
percentage rating in appendix B shows that under affordability independent variable,
respondents who had not done structural modifications rated affordability 24% lower than
those who had done structural modifications, with their sum score percentage ratings at
70.1% and 94.7% respectively. Again, not withstanding the difference in rating between
the two groups, the responses were positive for both groups, demonstrating that
87
enabling conditions suggested under affordability sections were well accepted and
deemed important by both group of respondents.
Of the 6 items under affordability section of the questionnaire, item 3(a), which was
about “reducing the package size of building material to lower the selling price”, was
scored the lowest by both those who have done structural modifications and those who
have not (see appendix B). What was interesting to note was that, though Mendoza and
Thelen (2008) advocate for packaging of building material into smaller size to help lower
building material cost per unit selling price, thus making it affordable, the poor
consumers (based on the respondents) do not subscribe to this idea. But rather they
prefer purchasing in bulk and agreed with the fact that buying in bulk and teaming up as
a collective to purchase building material in bulk would save them money.
The bar chart plot for measure of success responses versus the score on Affordability is
given in Figure 8. From the results, there is a clear distinction between people who have
done structural modifications and those who have not done structural modifications on
their houses. Those who have done structural modifications scored higher on average
than those who have not. The positive thing is that the results confirm that with respect
to affordability, there is a difference in response between those who have done structural
modification and those who have not done structural modification to their houses.
From the ANOVA results in Table 14, the p-value achieved was significantly less than
0.05, reported to be 0.000, this implies that the H0 is rejected in favour of the alternative
hypothesis, H1 (i.e. on affordability score, Success_MYes ≠ Success_MNo). This further
confirms the fact that there is a significant difference in responses on Affordability
between people who have done structural modification versus those who have not. This
further confirms the notion by Karnani (2006) in that the majority of the poor people are
very price sensitive given that they have limited disposable income, hence their biggest
88
obstacles affordability. He further suggests that the only way to help the poor and
alleviate poverty is to raise their real income.
In the table of results Appendix C (iii), there is evidence to suggest that Affordability is
associated to owning a bank account; Success_M and monthly income. Similar to
Acceptability and Availability above, Affordability is also associated to Success_M and
monthly income. Together with affordability is the issue of monthly income, the poor
have little income as Karnani advises, hence there exist a strong association (p-value of
0.001 in appendix C (iii) ) between affordability and income. The existence of an
association between Affordability, owning a bank account and success in building is not
surprising. It was expected that for a normal society, people who own bank accounts
and earning slightly better income would use the accounts for saving some of their
disposable income and this would then results in them being able to afford doing some
extension / modifications to their houses.
Difference in response on affordability questions between those who have done
structural modification and those who have not is probably due to the fact that those who
have done structural modifications base their opinions and views from real experience
unlike those who have not - who may speculate or choose to take the middle road when
responding. Otherwise this stands to support the research hypothesis that there would
be differences in responses between those who done structural modification and those
who have not.
89
6.6 RESEARCH HYPOTHESIS FOUR (Awareness versus Success)
Hypothesis four is the relationship between Awareness and Success amongst low-
income consumer for self-help housing. The null hypothesis states that there is no
difference between exercising an approach that delivers awareness and success
amongst low-income consumer for self-help housing. The alternative hypothesis states
that there is a difference between the two constructs, i.e.
H0: on the Awareness score, Success_MYes = Success_MNo
H1: on the Awareness score, Success_MYes ≠ Success_MNo
6.6.1 Discussion of findings on Hypothesis Four
Anderson and Billou (2007, p. 15) defines awareness as “The degree to which
customers are aware of a product or service”. Given that many BOP customers largely
have no access to conventional advertising media, building awareness can be a
significant challenge for companies wishing to serve low-income consumers in the
developing world (Anderson and Billou, 2007).
According to SadreGhazi (2008), a considerable share of low-income population is
illiterate; hence it is important to redesign the product functions to make it acceptable
and easy to use for those who lack the skill or knowledge to use the product. The limited
access to media by the low-income markets due to low degree of penetration of
information and lack of communication services makes common ways of media
advertisement less effective (SadreGhazi, 2008). Anderson and Billou (2007, p. 19)
states that, “…with many BOP customers largely inaccessible to conventional advertising
media, building awareness is another challenge for companies wishing to serve low-
income consumers in the developing world”.
90
To overcome these constraints, they recommend that companies invest heavily in
billboards along roads and truck-mounted demonstrations, in urban areas and in rural
communities, develop point-of-sale advertisement and even look into training their
customers down the distribution channel on the use of products (Anderson and Billou,
2007).
The awareness section of the questionnaire comprised of 5 items (refer to appendix A)
which are questions on above suggested strategies to help improve customer awareness
and knowledge on building materials as per Anderson and Billou, 2007 and SadreGhazi,
2008 recommendations. The table of sum score percentage rating in appendix B shows
that under awareness independent variable, respondents who had not done structural
modifications rated awareness 21% lower than those who had done structural
modifications, with their sum score percentage ratings at 64.0% and 85.1% respectively.
Again, not withstanding the difference in rating between the two groups, the responses
were positive for both groups, demonstrating that conditions suggested to help improve
awareness amongst the poor on building materials were well accepted and deemed
important by both group of respondents.
Of the 5 items under awareness section of the questionnaire, item 4(c), which is about
“Exhibitions & shows on the use of building materials”, was scored the lowest by both
those who have done structural modifications and those who have not (see appendix B).
This is again interesting, but also was to be expected given that most of the low-income
consumers do not really pay much importance to exhibitions and shows. Unlike the
lower middle and upper low-income consumers, they do not have the transportation
luxury to do price comparisons or attend exhibition / shows (Viswanathan, 2007).
91
The bar chart plot for measure of success responses versus the score on Awareness is
given in Figure 9. From the results, again a clear distinction between the two groups of
respondents is seen. Those who have done structural modifications scored higher on
average than those who have not, thus confirming that on awareness scoring,
Success_MYes ≠ Success_MNo. This implies that the null hypothesis is rejected in favour
of the alternative hypothesis. The ANOVA results in Table 14 confirmed similar findings,
the p-value achieved was significantly less than 0.05, reported to be 0.000. This implies
that we can reject H0 and conclude on H1 (i.e. Success_MYes ≠ Success_MNo). This
means that there is a significant difference in responses on Awareness between the
people who have done structural modification and those who have not.
From the table of results in Appendix C (iv), there is evidence to suggest that Awareness
is associated to residence; success_M; period finished and monthly income. Interesting
to note is that monthly income and success measure were associated with the 4As. This
agrees with Karnani’s (2006) proposition that the only way to help the poor and alleviate
poverty is to raise their real income.
6.7 SUMMARY
In conclusion, based on ANOVA and Bar charts for each of the 4As above, there is
strong evidence to suggest that responses obtained cut across all the 4As and this talks
to the relevance of this study where one intended to test the 4As framework against the
low-income consumer market for self-help housing. It is evident that each one of the 4As
plays a unique role as they are addressing different elements / constituents of the
demographics. None of these responses have a combination which one could have
predicted.
92
For all the 4As their p-values were significantly lower than 0.05 (i.e. all reported at
0.000). This means that it is safe to conclude that there is a significant difference in
responses between the people who have done structural modification versus those who
have not for all 4As, i.e. Success_MYes ≠ Success_MNo.
Further confirmation of the overall findings was conducted using Kruskal-Wallis test (see
Table 15). The results show that those who had “Yes” responses on success measure
(i.e. had done structural modifications) have a higher mean rank values across all the
4As. From the ranks Table, the mean rank for Affordability and Availability were the
highest at 101.45 and 99.56 respectively. This implies that of the 4As, affordability and
availability have the significant influence and strong association to the level of success
(success measure) in conducting structural modifications on their houses. Ultimately, all
the 4As were highly significant in influencing the level of success in self-help housing
amongst the respondents.
The above finding affirms the original work by Prahalad and Hart (2002) in their article
titled “The Fortune at the Bottom of the Pyramid, Strategy and Business”. They strongly
emphasised that affordability and accessibility or availability of products and services
amongst the low-income consumers were the main barriers. This was further
emphasised by Anderson and Kupp (2008) when they said, “…most businesses have
failed to serve the poorest consumers due to the commonly held belief that reaching
these consumers is difficult due to two key challenges - affordability and availability. By
looking at the consumer perspective this notion has been affirmed.
93
CHAPTER 7: CONCLUSION
7.1 INTRODUCTION
Based on the findings pertaining to the hypotheses, this chapter looks at the conclusions
that can be derived and these are suggested with respect to the relationship between the
4As model and success in self-help housing as depicted in Chapter 3.
Recommendations based on the findings and the literature reviews are also made to
both government and businesses. A possible model, adapted from Anderson and Billou
framework, is also presented. The chapter finally explores some ideas for future
research.
7.2 MAIN FINDINGS AND CONCLUSIONS
Hart (2005, p. 143) states “If we can gain a better understanding of the constraints that
influence the behaviour, we can construct new business models designed to remove
these constraints and profit in the process”. Although the initial purpose of this research
was to test the 4As model against the actual consumers for self-help housing, it also
shed some insight into certain behavioural attributes of the consumers for self-help
housing in Gauteng, South Africa. One thing that needs to be acknowledged from the
onset is that Government alone cannot meet the housing demand. The onus to
eradicate informal dwellings should not only be left to Government, but rather, should be
a shared responsibility involving many other players such as NGOs, cooperate world and
individuals etc.
The view by Mendoza and Thelen (2008) that, restricted access to financial products and
services amongst the poor prevents them from participating more actively in housing
market was evident in this study. The results of this research supported the literature in
94
that 92% of the respondents who did not have a bank account also had not done any
structural modifications to their homes.
Another interesting finding was the fact that women were better investors and organisers
than man when it came to housing modification initiatives. This is inline with Ndinda
(2009)’s view that suggests that involvement of women in the planning, design and
implementation of housing projects results in a higher success rate of projects than
where women are excluded. Intuitively, it is accepted that women are hesitant and less
prone to risky initiatives yet in all fairness of mind, women go the extra mile in taking that
where the security of the future is guaranteed and a house is the ultimate summation of
that security. Housing for many households around the world is both the largest expense
and the most important asset and is also an important determinant of quality of life
(Warnock and Warnock, 2008).
According to Mthweku and Tomlinson (1999), savings are important in low-income
housing finance. De Soto (2000) is of the opinion that low-income consumers do not
believe in savings. However, he warns against the fact that saving towards building is
never adequate given the low disposable income amongst the poor. This research
confirmed De Soto’s view in that there was an overwhelming positive response by both
respondent groups in rating savings as an important variable for housing finance.
This research was aimed at testing the 4As framework against the poor families who are
legible for housing subsidies against their success in building or organising the building
of their homes themselves. This research was premised on the fact that when people
have control and responsibility over key decisions in their housing process, helps break
the barrier or obstacles to alleviation of poverty and lack of reasonable housing
initiatives. Self-help housing done under enabling conditions as set out by Anderson and
95
Billou (2007) in their 4As framework and provided that the poor consumers believe in it;
help the poor meet their housing needs.
From the findings of the research study, the main conclusion is that the 4As framework
by Anderson and Billou (2007) is applicable in the low-income consumer market for self-
help housing needs. Although ultimately there was evidence to suggest that each one of
the 4As has a unique role to play in addressing different needs of the low-income
consumer for self-help housing. On the other objective of the research to quantify the
individual impact of the four A’s in serving the self-help housing needs, affordability and
availability were identified as the highest rated by the low-income consumer for self-help
housing and also implying the 4As do not all have the same measure of impact.
Identification of these two as of a higher impact of the four A’s was an affirmation of
Prahalad and Hart (2002) and Anderson and Kupp (2008) studies where they all strongly
emphasised that affordability and availability of products amongst the low-income
consumers were the main barriers. A modified version of the framework for serving the
low-income consumer for self-help housing, adapted from Anderson and Billou (2007)
framework is proposed in section 7.3.
7.3 PROPOSED FRAMEWORK FOR SERVING LOW-INCOME CONSUMER FOR HOUSING
As observed, the 4As cannot be treated equally. It is proposed that when businesses,
government institutions and all those involved in serving the low-income consumer for
housing apply this framework; follow a quota like systematic approach. This means that
a priority will be given in the following order of ranking from very important to important:
(1) Affordability
(2) Availability
(3) Awareness
(4) Acceptability.
96
It must however be mentioned that differences between each of the 4As level of impact,
shown by ranking above were very marginal yet the impact of each is still necessary and
required for a complete impact.
In applying a modified framework, businesses need to acknowledge and accept the
challenges of serving the poor and have appreciation of the value that this model will add
in making them remain profitable in serving the so called “difficult to serve” consumer
segment. There are more positive reasons for businesses to do this, since it will without
any doubt lead to success in self-help housing amongst the low-income consumers out
there.
FIGURE 10: Modified 4As framework for serving low-income consumer for housing
4 As
Affordability
26.0%Awar
enes
s24
.5%
24.0%
Acceptability
25.5
%
Ava
ilabili
ty
Tailor offerto market
Restructurevalue chain
• Reduce package size for low
price /unit.
• Encourage buying in bulk.
• Leverage building material
sourcing network.
• Give customers easy access
to credit.
• Reduce cost to serve.
• Shorten building material
supply chain.
• Localize sourcing of materials.
• Devise stocking strategy.
• Be closer to customers.
• Form partnership with the
general public organizations.
• Do promotions using a mix
of outlets.
• Give training to customers on
the use of building materials.
• Align product with customer
needs.
• Align building materials with
customer living conditions.
• Focus development on
customers - i.e. train them
on how to save.
Source: Adapted and modified from Anderson and Billou (2007) Serving the World’s Poor: Innovation at the Base of the
Economic Pyramid. Journal of Business Strategy, 28(2), 14-21)
97
The modified framework above was derived from the literature study and has been
customised specifically for low-income consumer self-help housing requirements.
Acceptability: With reference to the framework in figure 10 above, according to the work
by Anderson & Billou (2007); Segel & Meghji (2005) and De Soto (2000), they support
the notion that businesses need to align their products to the needs of the consumer.
They need to focus on customers and encourage a culture of saving through product
offerings that rewards savings culture amongst the poor.
Availability: Mendoza & Thelen (2008) and Viswanathan (2007) advise that having the
building material supplier closer to the customer and knowing each other personally can
help both parties in reducing the cost to serve and shortening building material supply
chain. This will ultimately result in lowering cost of building material.
Affordability: Mendoza & Thelen (2008), Anderson & Billou (2007), and SadreGhazi
(2008) advocate that businesses need to make products affordable to the poor consumer
through allowing for flexible payment schemes, joint consumption and tiered pricing.
Awareness: Anderson & Billou (2007) and SadreGhazi (2008) advice that businesses
should help bring product awareness amongst the poor through promotions, forming
partnership with the general public organisations and training of customers on the use of
the product.
7.4 RECOMMENDATIONS
These recommendations are based on the findings and the literature reviews and are
directed mainly to businesses and government institutions. Businesses include
multinational corporations (MNCs) or small and medium enterprises and all those
involved in serving the low-income consumer for housing. Resolving the problem of
housing in South Africa requires a joint effort from both public and private sector.
98
7.4.1 What should the government be doing?
The 4As has revealed that it is imperative that the Government creates a policy
framework that will encourage businesses to practice strategies that are inclusive of the
poor as per the 4As framework proposed above.
The role played by women in self-help housing cannot be undermined. To guarantee
greater success, when government or businesses channel funds to low-income
consumers for housing, they must ensure that these funds are channelled through those
societies or organisations that have representation of women.
Acceptability: Huchzermeyer, M. (2003b, p. 605) states that, “…in SA though most of
the consumers for self-help housing are eager and capable of house construction via
their savings and credit mechanism, they have learnt from disappointing experience that
permanent construction must await formal government approval and intervention, which
may take several years”. Therefore it is critical for government to come up with
pragmatic strategies within their structures which can be implemented to eliminate
blockages of this nature in the delivery of houses.
During the research study in the three communities and sharing discussions with some
of the households; there was a sense that people are sitting back and waiting for the
government to provide housing. This waiting mentality by the poor weakens community
organisation and their ability to play a role in the ongoing development and management
of settlements. They have lost confidence and trust in the local municipalities’ capability
to deliver on housing. Structures like PHP and other community driven building
initiatives have to be encouraged by the government. Government should look into
having a competition amongst the local municipalities where those municipalities who
built more houses, through involving the local community members instead of hiring a
building contractor, are rewarded.
99
Availability: The road infrastructure, especially in Diepsloot, was deplorable. It was not
conducive for a normal delivery truck to access some of the communities owing to either
roads being too narrow or having been eroded by floods. Conditions such as these
make it impossible for people and businesses to access each other for trade of building
materials. People in the informal settlements survey have to drive or commute long
distances to access hardware. This ends up being expensive for them to afford buying
and transporting building materials and probably as a result they end up choosing not to
build. Government’s institutions should strengthen their collaboration with the private
sector and form public private partnerships targeted at creating building depots in the
townships for convenient sourcing of building materials.
Affordability: The state can also try to direct credit to the poor, by offering subsidised
credit, such as through government lending agencies. However Mendoza and Thelen
(2008, p. 446) warn that, “…there is also the possibility of government failure, such as
those resulting from politicisation of the allocation of credit. The experience of many
countries with state-directed credit seems to indicate high default rates and
ineffectiveness in reaching the poor”. Therefore in implementing this strategy the
government will have to guard against such failures.
The other approach would be to have a subsidy mechanism where government channel
funding through local churches and women governed local structures. This will help
reduce default rates and ineffectiveness in reaching the poor.
Awareness: In the cement industry they hold on the annual basis the Young Cement
Sculpture Awards ceremony – which is a competition organised by the Cement and
Concrete Institute (C&CI) sponsored by SA cement producers in conjunction with
Universities. This is aimed at increasing awareness amongst young professionals on the
use of cement and its application. It is initiatives similar to these that we need to
100
increase awareness amongst the poor on the use of building materials. Government
should encourage private sector to sponsor an award or price giving initiatives to those
households who build durable houses through self-help mechanisms to encourage
competition amongst them with respect to self-help housing. These incentives should be
significant enough to motivate serious effort to be put into self-help housing by the
household owner.
7.4.2 What should be the role of businesses?
Government alone cannot resolve the housing problem. Businesses need to
continuously innovate and come up with products that are more suited to the low-income
consumer for housing. They should learn from strategies such as those adopted by the
likes of CEMEX, Unilever and others, e.g. flexible payment schemes and complete
product repackaging.
Businesses should focus on those initiatives that will improve access by the poor to
markets for building materials and services, or even the markets where the poor might
be able to participate on the supply side rather than being a consumer.
Karnani is correct in arguing that the only way for businesses to help the poor and
alleviate poverty is to raise the real income of the poor (Karnani, 2006). In addition to
providing credit, companies can develop technologies to raise BOP incomes and start
their own businesses.
Acceptability: Financial institutions will have to make policies that accommodate
lending to low-income consumers for their house improvement and new house building,
rather than being biased toward completed owner-occupied housing. They can
encourage saving amongst the poor by issuing higher interest on savings and low
service fees to those who save towards building. This can be monitored by ensuring that
101
such monies can only be accessed by submitting a quotation from the supplier of
building materials or hardware and the payment is also directly made to the supplier. By
doing this the bank would have ensured that the money is not abused and as a result will
indirectly encourage a culture of saving amongst the poor.
Availability: Big business should establish warehouses for building materials supply in
the townships and where possible set up small local hardwares that are owned and run
by the locals. Businesses can extend their collaborative networks by setting up small
enterprises that will manufacture bricks in the townships using local resources with a
view to supply that local market. The benefits are both to the community as these would
be within reach and minimal transport costs and for the companies the products have a
ready market, a situation that will create employment and further ensure that low-income
people are not only consumers but they are also suppliers of building materials.
Affordability: What must be acknowledged is the fact that most of the low-income
market consumers for building cannot afford the cost of building material. Financial
institutions should make it easier for the poor to get a housing loan with lesser
restrictions on collateral requirements. Supplier of building materials should help by
allowing the poor to pay for their building material on instalments and give discounts for
bulk purchases.
Awareness: Most people in the informal communities are limited in terms of technology
and information. Therefore for purposes of advertising and promotion of products,
businesses should in addition, use billboards on the streets and on delivery trucks to
increase level of awareness and communicate information about building materials.
Businesses should also look into setting up transparent community organisations, such
as township or village representatives that will facilitate dialogue and information sharing
between community and business.
102
7.5 FUTURE RESEARCH IDEAS
The future research ideas are based on a combination of research limitations of this
study and some of the insights gained from the literature review and findings. The
following research ideas can be pursued:
� Many MNCs still consider doing business with the BOP consumer not to be
profitable at all. The big question one may ask is how ready and willing are South
Africa’s MNCs in putting up strategies that will ensure that needs of the low-income
consumer for housing are addressed? Future research to conduct a quantitative
survey with respect to SA’s businesses readiness to applying 4As framework in
addressing low-income consumer housing needs is recommended.
� Literature review states that, “…the rural poor tend to have less access to public
infrastructure and certain types of social services, compared with urban residents”
(Mendoza and Thelen (2008, p. 432). The informal settlements that this study
looked at were in the Gauteng metropolitan / urban areas. It would be interesting to
see what the response would be for households living out of the Gauteng province
in the rural areas. It is therefore recommended that additional studies be carried
out using similar framework but with low-income consumers for housing in rural
areas out of Gauteng province.
103
8. REFERENCES
Anderson, J. & Billou, N. (2007) Serving the World’s Poor: Innovation at the Base of the
Economic Pyramid. Journal of Business Strategy, 28(2), 14-21.
Anderson, J. & Kupp, M. (2008) Serving the Poor: Drivers of Business Model Innovation
in Mobile. Info, 10(1), 5-12.
Blaikie, N. (2003) Analysing Quantitative Data. London: Sage Publications.
Braun, J. V. (2008) Rising food prices: what should be done? IFPRI Policy Brief.
Available from: http:www.ifpri.org/themes/foodprices/foodprices.asp (accessed on
01/03/09).
Bowerman, B. L. & O’Connel, R. T. (1990) Linear Statistical Models: An Applied
Approach. 2nd ed. Thomson Learning.
Christensen, C. M. (1999) Coping with Change: A framework for the new millennium.
Special Issue on Millennium Edition. Business Technology Journal.
Christensen, C. M., Craig, T. & Hart, S. (2001) The Great Disruption. Foreign Affairs,
80(2), 80-95.
CKS Consulting Pvt. Ltd. (2009) Teleuse@BOP3: A Qualitative Study. Colombo:
LIRNEasia.
Department of Housing (DoH) (2004) Breaking new ground: A comprehensive plan for
the development of sustainable human settlements. Pretoria, Department of Housing.
Department of Housing (DoH) (2007) Annual Report 2006-2007: Breaking New Ground
in Housing delivery. Vote 28. Available from:
http://www.housing.gov.za/Content/Documents/Annual%20Report%20-
%202007/Small/04.pdf (accessed on 01/03/09).
104
De Soto, H. (2000) The mystery of capital: Why capitalism triumphs in the West and fails
everywhere else. New York, NY: Basic Books.
Eighty20 Consulting (2006) The Bottom of the South African Pyramid. 12 July 2006.
Gordon Institute of Business Science (GIBS), University of Pretoria.
FinMark Trust (2007) 2006 Survey finding Brochure: FinMark Trust. Available from:
http://www.finscope.co.za/documents/2006/Brochure_SA06.pdf (accessed on 22/07/09).
Ger, G. (1999) Localising in the Global Village: Local Firms Competing in Global
Markets. California Management Review, 41, 64-83.
Goebel, A. (2007) Sustainable urban development? Low-cost housing challenges in
South Africa. Habitat International, 31(3), 291-302.
Gómez-Samper, H. & Marquez, P. (2006) Rethinking organizations that serve Latin
America's mass markets: a study of AES-EDC experience in Venezuela. William
Davidson Institute Research Resources,
Available from: http://www.wdi.umich.edu/Resources/1646/ (accessed June 9, 2009).
Gordon, M. D. (2008) Management Education and the Base of the Pyramid. Journal of
Management Education, 1-15.
Government of South Africa (GoSA) (1998) National Housing Policy: Supporting the
people's housing process. Department of Housing, Pretoria.
Hammond, A. L., Kramer, W. J., Katz, R. S., Tran, J. T. & Walker, C. (2007) The Next 4
Billion: Market Size and Business Strategy at the Base of The Pyramid. World
Resources Institute.
Hammond, A. & Prahalad, C.K. (2004) Selling to the poor. Foreign Policy, 142, 30-37.
105
Harris, R. (1991) Self-Building in the Urban Housing Market. Economic Geography,
67(1), 1-21.
Harris, R. (2003) A double irony: the originality and influence of John F.C. Turner.
Habitat International, 27, 245-269.
Harrison, P., Huchzermeyer, M., & Mayekiso, M. (2003) Confronting fragmentation:
housing and urban development in a democratising society. Cape Town: Juta/UCT
Press.
Hart, S. L. (2005) Capitalism at the crossroads: The unlimited business opportunities in
solving the world’s most difficult problems. Upper Saddle River, NJ: Wharton School
Publishing.
Huchzermeyer, M. (2002) Upgrading through the project-linked capital subsidy:
Implications for the strategies of informal settlement residents and their community
organisations. Urban Forum, 13(2), 67-89.
Huchzermeyer, M. (2003a) Addressing segregation through housing policy and finance.
In P. Harrison, M. Huchzermeyer, & M. Mayekiso (Eds.) Confronting fragmentation:
housing and urban development in a democratising society. Cape Town: Juta/UCT
Press.
Huchzermeyer, M. (2003b) A Legacy of Control? The Capital Subsidy for Housing, and
Informal Settlement Intervention in South Africa. International Journal of Urban and
Regional Research, 27(3), 591-612.
Jenkins, B., Ishikawa, E., Barthes, E. & Giacomelli, M. (2008) Supporting
Entrepreneurship at the Base of the Pyramid through Business Linkages. 2008
International Finance Corporation, International Business Leaders Forum (IBLF),
and the CSR Initiative at the Harvard Kennedy School. Available from:
106
http://www.iblf.org/docs/BusinessLinkagesRioConferenceReport.pdf (accessed on
01/06/09).
Jenkins, P. (1999) Difficulties encountered in Community Involvement in Delivery Under
the New South African Housing Policy. Habitat International, 23 (4), 431-446.
Jenkins, P. & Smith, H. (2001) An institutional approach to analysis of state capacity in
housing systems in the developing world: Case studies in South Africa and Costa Rica.
Housing Studies, 16(4), 485-508.
Kajimo-Shakantu, K. & Evans, K. (2006) The role of Banks in the provision of low-income
housing finance in South Africa: Can they play a different role? International Journal of
Strategic Property, 10(1), 27-39.
Karnani, A. (2006) Fortune at the Bottom of the Pyramid: A Mirage. Ross School of
Business Working Paper Series, Working Paper No. 1035.
Khan, F. (2003) Housing finance. In F. Khan and P. Thring (Eds.) Housing policy and
practice in post-apartheid South Africa. Sandown: Heinemann.
Laquian, A. A. (1983) Basic Housing. Policies for Urban Sites, Services and Shelter in
Developing Countries. (Ottawa, International Development Research Centre).
Liebenberg, S. (2001) The right to social assistance: the implications of Grootboom for
policy reform in South Africa. South African Journal of Human Rights, 17(2), 232-257.
Louw, A.I. (2008) Redefining BOP: In Pursuit of Sustainable Opportunity at the Base of
the Economic Pyramid. Gordon Institute of Business Science (GIBS), University of
Pretoria.
Marais, L. (2003) Good intentions with negative consequences: The case of housing size
in the Free State Province of South Africa. Africa Insight, 33(4), 54-60.
107
Marais, L., Van Rensburg, N. & Botes, L. (2003) An Empirical Comparison of Self-help
Housing and Contractor-driven Housing: Evidence from Thabong (Welkom) and
Mangaung (Bloemfontein). Urban Forum, 14(4), 347-365.
Marais, L. & Wessels, J. (2005) Housing Standards and Housing Rights: The Case of
Welkom in the Free State Province. Urban Forum, 16(1), 17-34.
Martins, J. (2007) Household budgets as a social indicator of poverty and inequality in
South Africa. Social Indicators Research, 81, 203-221.
Mendoza, R.U. & Thelen, N. (2008) Innovations to Make Markets More Inclusive for the
Poor. Development Policy Review, 26 (4), 427-458.
Mokoena, M. & Marais, L. (2007) The missing Link in Cooperative Governance and
Housing Delivery: Lessons from Mangaung Local Municipality. Urban Forum, 18, 311-
327.
Mthweku, M. & Tomlinson, M. (1999) Can savings play a role in housing delivery?
Discussion paper, National Urban Reconstruction and Housing Agency (NURCHA) and
the Banking Council of South Africa.
Ndinda, C. (2009) Women’s participation in housing delivery: The case of Ezilweleni,
South Africa. Development Southern Africa, 24(5), 665-680.
Omenya, A. & Talukhaba, A. (2005) Bottlenecks of access to housing finance by the low-
income in Kenya and South Africa. University of the Witwatersrand, Johannesburg,
South Africa.
Pfeiffer, P., Massen, S. & Bombka, U. (2007) Serving the Low-Income consumer: How to
Tackle This Mostly Ignored Market, ATKearney. Available from:
http://www.atkearney.com/main.taf?p=5,1,1,119,6 (accessed on 01/03/09).
108
Pillay, A. & Naude, A. (2006) Financing low-income housing in South Africa: Borrowers
experiences and perceptions of banks. Habitat International, 30(4), 872-885.
Porteous, D. (2003) The demand for financial services by low-income South Africans.
Midrand: FinMark Trust. Available from:
http://www.finmarktrust.org.za/documents/2003/SEPTEMBER/demandFS2.pdf
(accessed 30/04/09).
Pottie, D. (2004) Local government and housing in South Africa: Managing demand and
enabling markets. Development in Practice, 14(5), 606-618.
Prahalad, C. K. (2005) The fortune at the bottom of the pyramid eradicating poverty
through profits. Upper Saddle River, NJ, Wharton School Publications.
Prahalad, C.K. & Hart, S.L. (2002) The fortune at the Bottom of the Pyramid. Strategy
and Business, Issue 26.
SadreGhazi, S. (2008) Addressing low-income markets: Reframing Corporate Business
Strategies. Oikos Ph.D. summer academy 2008 – Entrepreneurial Strategies for
Sustainability.
SadreGhazi, S. & Duysters, D. (2008) Serving low-income markets: Rethinking
Multinational Corporations’ Strategies. United Nations University-MERIT.
Sánchez, P., Ricart, J.E. & Rodríguez, M.A. (2007) Influential Factors in Becoming
Socially Embedded in Low-Income Markets. GMI.
Seelos, C. & Mair, J. (2007) Profitable Business Models and Market Creation in the
Context of Deep Poverty: A Strategic View. Academy of Management Perspectives,
21(4), 49-63.
109
Segel, A. & Meghji, N. (2005) Patrimonio Hoy: A Groundbreaking Corporate Program to
Alleviate Mexico’s Housing Crisis. Paper prepared for the Harvard
Business School Global Poverty Conference, 1-3 December, Cambridge, MA.
Sharma, S. & Hart, S. (2006) Base of the Pyramid: Predicting MNC entry and success.
Available from:
http://www.tilburguniversity.nl/faculties/fsw/departments/os/research/colloquium/hart.pdf
(accessed on 23/07/09).
Sisulu, L. N. (2008) Housing Minister's Budget Speech. Parliamentary Monitoring Group-
PMG. Available from:
http://www.pmg.org.za/briefing/20080528-housing-ministers-budget-speech (accessed
on 28/03/09).
South African Year Book 2007/2008: Housing. Chapter 13, (349-360). Available from:
http://www.gcis.gov.za/resource_centre/sa_info/yearbook/2008/chapter13.pdf (accessed
on 18/07/09).
Subrahmanyan, S. & Gomez-Arias, J.T. (2008) Integrated approach to understanding
consumer behaviour at bottom of pyramid. Journal of Consumer Marketing, 25(7), 402-
412.
The South African Advertising Research Foundation (SAARF) (2004) The SAARF
Universal LSM Descriptors. Johannesburg: The South African Advertising Research
Foundation. Available from:
http://archive.saarf.co.za/ppt.htm/LsmdescriptorsAugust2004.files/frame.htm
(accessed on 10/04/09).
Tomlinson, M. (1999) South Africa’s housing policy: Lessons from four years of delivery.
Lecture for the Housing Policy Development and Management Programme, Graduate
School of Public and Development Management, University of Witwatersrand,
Johannesburg.
110
Turner, J. F. C. (1976) Housing by People. Towards Autonomy in Building Environments.
Marion Byers, London.
UNDP (United Nations Development Programme) (2007) Building Security for the Poor:
Potential and Prospects for Micro- insurance in India. New York: UNDP.
UNDP (United Nations Development Programme) (2008) Creating value for all:
Strategies for doing Business with the Poor. New York: UNDP.
Viswanathan, M. (2007) Understanding product and market interactions in subsistence
marketplaces, a study in South India. in Rosa, J.A., Viswanathan, M. (Eds), Product and
Market Development for Subsistence Marketplaces, JAI Press, London.
Warnock, V. C. & Warnock, F. E. (2008) Market and housing finance. Journal of Housing
Economics, 17(3), 239-251.
Watson, V. & McCarthy, M. (1998) Rental housing policy and the role of the household
rental sector: evidence from South Africa. Habitat International, 22(1), 49-56.
World Resources Institute (WRI) and the International Finance Corporation (IFC), 2007.
Next Four Billion: Market Size & Business Strategy at the Base of the Pyramid.
Washington, D.C.: WRI.
Yunus, M. (1999) Banker to the Poor: Micro-Lending and the Battle against World
Poverty. New York: Public Affairs.
Zikmund, W. G. (2003) Business Research Methods. 7th ed. Thompson: South-Western.
111
9. APPENDICES
APPENDIX A: Questionnaire Testing the 4A’s framework in serving the low-income consumer housing needs
Thank you for participating in this research. This research is a prerequisite for the interviewer (Bheki Mthembu) to
attain the degree of Master in Business Administration (MBA). Please note that this survey is anonymous, so
there is no need to enter your name. Please indicate that your consent for use of the data collected in this survey
for research purposes.
By ticking (X) in this box I give my consent for use of this data for the research purposes .
RESPONDENT DETAILS:
Race
(Tick X) Asian Black Coloured White
Gender
(Tick X) Male Female
Age (years) 18 - 24 25 - 34 35 -44 45-49 50+
Source on income
(Tick X) Employed Self-employed Unemployed
Monthly earning
(Tick X) <R1500 >R1500 <R2500 >R2500 <R3500
Do you own a bank
account? Yes No
Residence (Tick X) Alexandra
Diepsloot
Ivory Park
Success measure Is there any structural addition / change
to the house Yes No
If finished building
(indicate when): < 6 months
< 12 months
< 18 months
< 24 months
In your opinion with respect to enabling conditions for building a house, how would you rate
the following statements in a scale of 1 to 5 where 1 is strongly disagree up to 5 which is
strongly agree. Use (X) to indicate your selected appropriate rating.
112
Acceptability …Strongly
Disagree
Strongly
Agree
1(a) Saving money in a bank is a way of raising funds towards building. 1 2 3 4 5
1(b) Using original building materials results into long-lasting house. 1 2 3 4 5
1(c) It is better to build a house myself using small bucky builder than hiring
a contractor.1 2 3 4 5
Availability… Strongly
Disagree
Strongly
Agree
2(a) Having retailers nearby helps me finish building quicker. 1 2 3 4 5
2(b) Having small local hardware shops nearby is convenient in sourcing
building materials. 1 2 3 4 5
2(c) Having retailers and local hardware that stock most of the building
materials makes building material sourcing easy.1 2 3 4 5
2d) Having builders residing and being part of the local community makes it
convenient for building.1 2 3 4 5
Affordability…Strongly
Disagree
Strongly
Agree
3(a) Reducing the package size of building material lowers the selling price
and makes it more affordable to me.1 2 3 4 5
3(b) Buying building material in bulks saves me money. 1 2 3 4 5
3(c) Easy access to finance and loans from the bank makes building less
stressful and easier.1 2 3 4 5
3(d) Teaming of communities and acquiring materials in bulk makes building
material more affordable.1 2 3 4 5
3(e) Participating in (self-build communities)* helps me afford the purchase of
building materials.1 2 3 4 5
3(f) Negotiating as a collective helps getting discounts from the suppliers
(retailers and builders).1 2 3 4 5
Awareness…Strongly
Disagree
Strongly
Agree
4(a) Reading newspaper adverts on “building materials and suppliers” helps
keep me informed about where to buy reasonable building materials.1 2 3 4 5
4(b) Listening to radios and TV adverts on “building materials and suppliers”
helps keep me informed about where to buy reasonable building materials.1 2 3 4 5
4(c) Exhibitions & shows on the use of building materials help keep me
informed of my building solution.1 2 3 4 5
4(d) Receiving training on how to use particular building materials makes me
more knowledgeable and effective in building.1 2 3 4 5
4(e) Receiving training on how to acquire building loan enables me to have
easy access to funding. 1 2 3 4 5
*(Self-build communities) = when community members jointly save and buy each other building materials on rotation
113
APPENDIX B: Sum score percentage (%) rating
Q # Description
Yes No Combined
Acceptability … 86.3 71.7 79.0
1a Saving money in a bank is a way of raising funds towards building. 88.7 75.2 82.0
1b Using original building materials results into long-lasting house. 95.5 80.0 87.7
1c It is better to build a house myself using small bucky builder than hiring a contractor. 74.6 60.0 67.3
Availability… 96.2 74.6 85.4
2a Having retailers nearby helps me finish building quicker. 95.5 74.4 84.9
2bHaving small local hardware shops nearby is convenient in sourcing building materials.
95.5 74.4 84.9
2cHaving retailers and local hardware that stock most of the building materials makes
building material sourcing easy.96.6 72.7 84.6
2dHaving builders residing and being part of the local community makes it convenient
for building.97.2 76.9 87.0
Affordability… 94.7 70.1 82.4
3aReducing the package size of building material lowers the selling price and makes it more affordable to me.
77.5 58.6 68.0
3b Buying building material in bulk saves me money. 99.7 83.1 91.4
3cEasy access to finance and loans from the bank makes building less stressful and easier.
96.3 74.1 85.2
3dTeaming of communities and acquiring materials in bulk makes building material more affordable.
98.0 67.0 82.5
3eParticipating in (self-build communities)* helps me afford the purchase of building materials.
98.0 67.6 82.8
3fNegotiating as a collective helps getting discounts from the suppliers (retailers and
builders).98.9 70.1 84.5
Awareness… 85.1 64.0 74.6
4aReading newspaper adverts on “building materials and suppliers” helps keep me informed about where to buy reasonable building materials.
87.3 69.6 78.5
4bListening to radios and TV adverts on “building materials and suppliers” helps keep me informed about where to buy reasonable building materials.
84.2 64.2 74.2
4cExhibitions & shows on the use of building materials help keep me informed of my building solution.
74.9 53.8 64.4
4dReceiving training on how to use particular building materials makes me more knowledgeable and effective in building.
87.0 59.7 73.4
4eReceiving training on how to acquire building loan enables me to have easy access
to funding.92.1 72.7 82.4
Sum score (% rating)
Succes_M
114
APPENDIX C: ANOVA for each of the 4As responses versus each Descriptive
Element
(i) Acceptability
ANOVA Table
.685 8 .086 1.024 .421
11.125 133 .084
11.810 141
8.435 8 1.054 1.568 .140
89.452 133 .673
97.887 141
14.095 8 1.762 10.947 .000
21.405 133 .161
35.500 141
8.179 6 1.363 1.826 .108
47.792 64 .747
55.972 70
7.949 8 .994 1.507 .161
87.713 133 .659
95.662 141
26.993 8 3.374 5.473 .000
81.992 133 .616
108.986 141
3.140 8 .392 .473 .873
110.276 133 .829
113.415 141
1.759 8 .220 .867 .546
33.713 133 .253
35.472 141
(Combined)Between Groups
Within Groups
Total
(Combined)Between Groups
Within Groups
Total
(Combined)Between Groups
Within Groups
Total
(Combined)Between Groups
Within Groups
Total
(Combined)Between Groups
Within Groups
Total
(Combined)Between Groups
Within Groups
Total
(Combined)Between Groups
Within Groups
Total
(Combined)Between Groups
Within Groups
Total
BANK_ACC * Acceptability
RESIDENCE *Acceptability
SUCCESS_M *Acceptability
IF_FINISHED *Acceptability
S_INCOME * Acceptability
M_INCOME * Acceptability
AGE * Acceptability
GENDER * Acceptability
Sum ofSquares df Mean Square F Sig.
(ii) Availability
ANOVA Table
.886 9 .098 1.189 .307
10.924 132 .083
11.810 141
17.244 9 1.916 3.136 .002
80.643 132 .611
97.887 141
20.835 9 2.315 20.838 .000
14.665 132 .111
35.500 141
4.493 4 1.123 1.440 .231
51.479 66 .780
55.972 70
11.827 9 1.314 2.069 .037
83.835 132 .635
95.662 141
19.240 9 2.138 3.144 .002
89.746 132 .680
108.986 141
22.001 9 2.445 3.530 .001
91.415 132 .693
113.415 141
2.481 9 .276 1.103 .365
32.991 132 .250
35.472 141
(Combined)Between Groups
Within Groups
Total
(Combined)Between Groups
Within Groups
Total
(Combined)Between Groups
Within Groups
Total
(Combined)Between Groups
Within Groups
Total
(Combined)Between Groups
Within Groups
Total
(Combined)Between Groups
Within Groups
Total
(Combined)Between Groups
Within Groups
Total
(Combined)Between Groups
Within Groups
Total
BANK_ACC * Availability
RESIDENCE * Availability
SUCCESS_M * Availability
IF_FINISHED * Availability
S_INCOME * Availability
M_INCOME * Availability
AGE * Availability
GENDER * Availability
Sum of
Squares df Mean Square F Sig.
115
(iii) Affordability
ANOVA Table
3.073 13 .236 3.463 .000
8.737 128 .068
11.810 141
13.328 13 1.025 1.552 .108
84.559 128 .661
97.887 141
24.522 13 1.886 21.993 .000
10.978 128 .086
35.500 141
5.024 6 .837 1.052 .401
50.948 64 .796
55.972 70
11.820 13 .909 1.388 .174
83.842 128 .655
95.662 141
25.382 13 1.952 2.989 .001
83.604 128 .653
108.986 141
10.064 13 .774 .959 .495
103.351 128 .807
113.415 141
2.648 13 .204 .794 .665
32.824 128 .256
35.472 141
(Combined)Between Groups
Within Groups
Total
(Combined)Between Groups
Within Groups
Total
(Combined)Between Groups
Within Groups
Total
(Combined)Between Groups
Within Groups
Total
(Combined)Between Groups
Within Groups
Total
(Combined)Between Groups
Within Groups
Total
(Combined)Between Groups
Within Groups
Total
(Combined)Between Groups
Within Groups
Total
BANK_ACC * Affordability
RESIDENCE *Affordability
SUCCESS_M *Affordability
IF_FINISHED *Affordability
S_INCOME * Affordability
M_INCOME * Affordability
AGE * Affordability
GENDER * Affordability
Sum ofSquares df Mean Square F Sig.
(iv) Awareness
ANOVA Table
1.783 15 .119 1.494 .117
10.027 126 .080
11.810 141
24.165 15 1.611 2.753 .001
73.723 126 .585
97.887 141
18.590 15 1.239 9.234 .000
16.910 126 .134
35.500 141
25.289 10 2.529 4.945 .000
30.683 60 .511
55.972 70
10.569 15 .705 1.043 .416
85.093 126 .675
95.662 141
27.962 15 1.864 2.899 .001
81.024 126 .643
108.986 141
13.351 15 .890 1.121 .345
100.064 126 .794
113.415 141
4.217 15 .281 1.133 .334
31.255 126 .248
35.472 141
(Combined)Between Groups
Within Groups
Total
(Combined)Between Groups
Within Groups
Total
(Combined)Between Groups
Within Groups
Total
(Combined)Between Groups
Within Groups
Total
(Combined)Between Groups
Within Groups
Total
(Combined)Between Groups
Within Groups
Total
(Combined)Between Groups
Within Groups
Total
(Combined)Between Groups
Within Groups
Total
BANK_ACC * Awareness
RESIDENCE *Awareness
SUCCESS_M *Awareness
IF_FINISHED *Awareness
S_INCOME * Awareness
M_INCOME * Awareness
AGE * Awareness
GENDER * Awareness
Sum ofSquares df Mean Square F Sig.