Page 1
BHI Annual Quality Report Fiscal Year 2015
Quality Improvement Department Clara Cabanis, Director of Quality Improvement
Jessie Nelson, Quality Improvement Team Leader
Sam Madden, Quality Improvement Coordinator
Travis Rosen, Quality Improvement Coordinator
Ann Doering, Compliance Monitoring Specialist
Page 2
BHI Annual Quality Report FY15 1
Table of Contents Section 1: Executive Summary ......................................................................................................... 3
QI Structure and Committees ........................................................................................................ 4
Key Metric Trends ........................................................................................................................ 7
Key Accomplishments from FY15 ............................................................................................... 8
Key Initiatives for FY16 ............................................................................................................... 9
Barrier Analysis and Planned Interventions ................................................................................. 9
Section 2: NCQA Accreditation ..................................................................................................... 11
Section 3: BHI Population Characteristics and Penetration Rates.................................................. 12
Aid Categories and Demographic Characteristics ...................................................................... 12
Penetration Rates ........................................................................................................................ 14
Section 4: Network Adequacy and Availability ............................................................................. 16
Ensuring Availability .................................................................................................................. 16
Cultural Needs and Preferences .................................................................................................. 21
Section 5: Access to Services ......................................................................................................... 25
Access to Care............................................................................................................................. 25
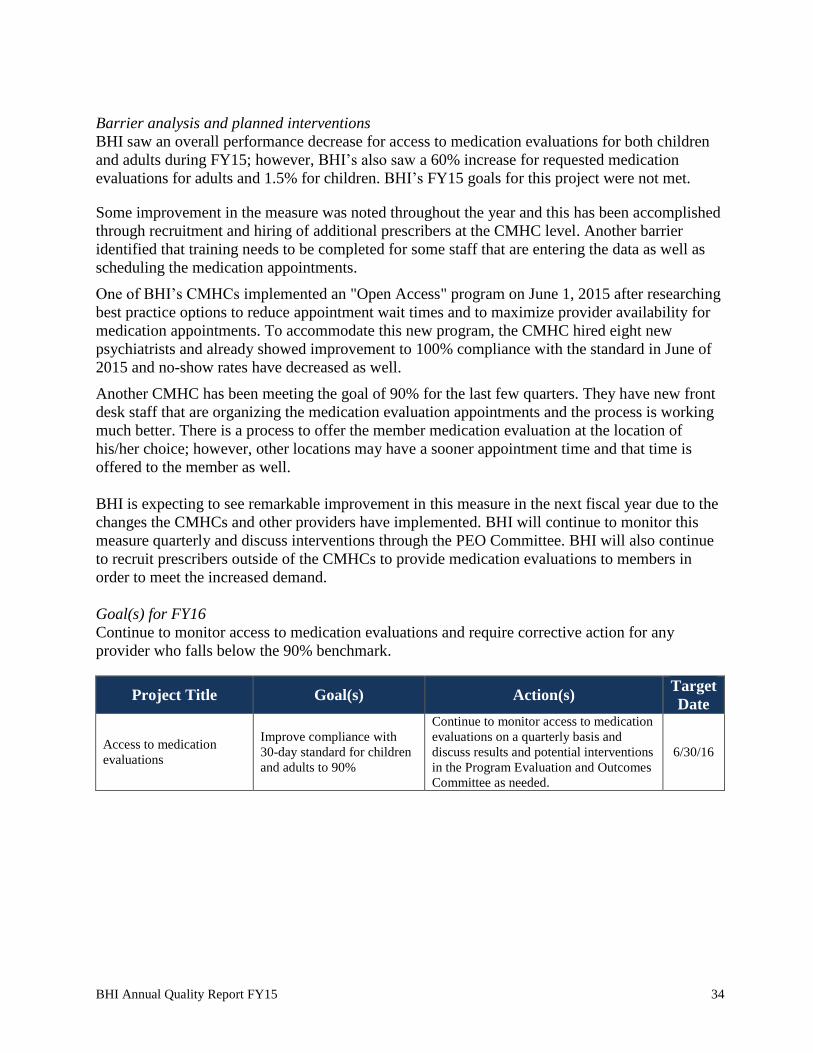
Access to Medication Evaluations .............................................................................................. 33
Focal Point of Behavioral Health for SMI Population................................................................ 35
Section 6: Compliance Monitoring ................................................................................................. 36
External Quality Review Organization Audit (EQRO Audit) .................................................... 36
Delegation Oversight .................................................................................................................. 38
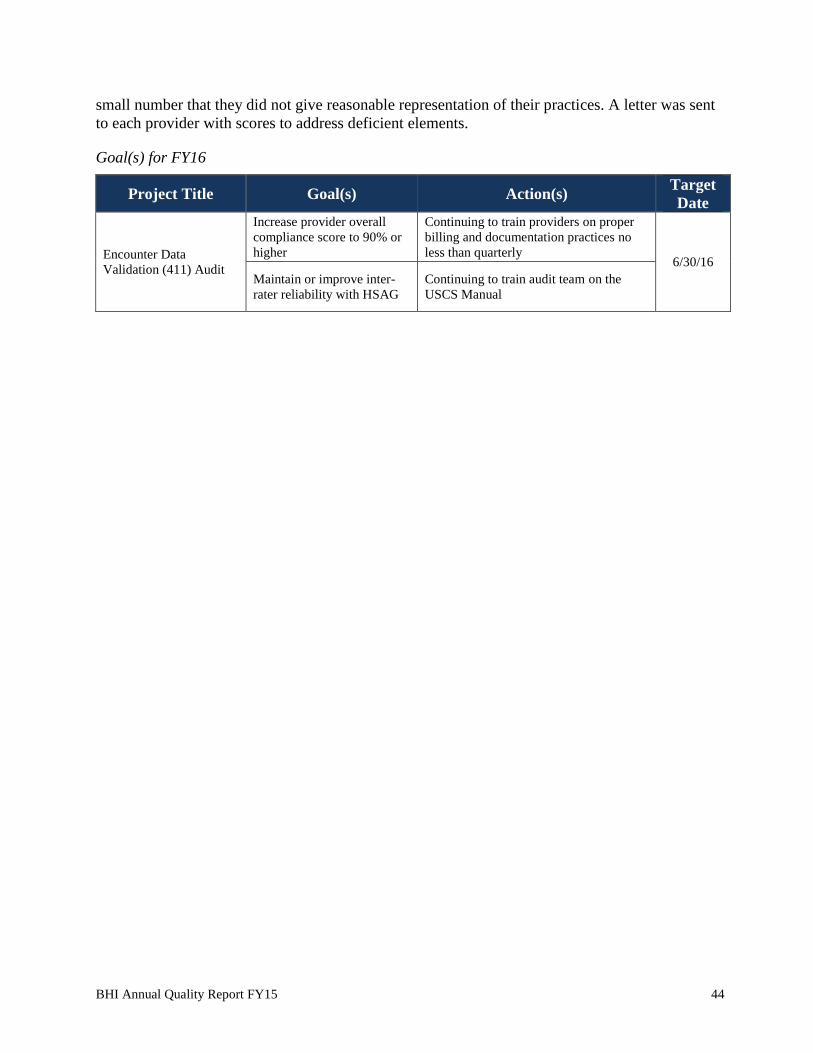
Encounter Data Validation Audit (411 Audit) ............................................................................ 40
Provider Audits ........................................................................................................................... 45
Section 7: Performance Measures ................................................................................................... 48
Reducing Over- and Under-Utilization of Services .................................................................... 48
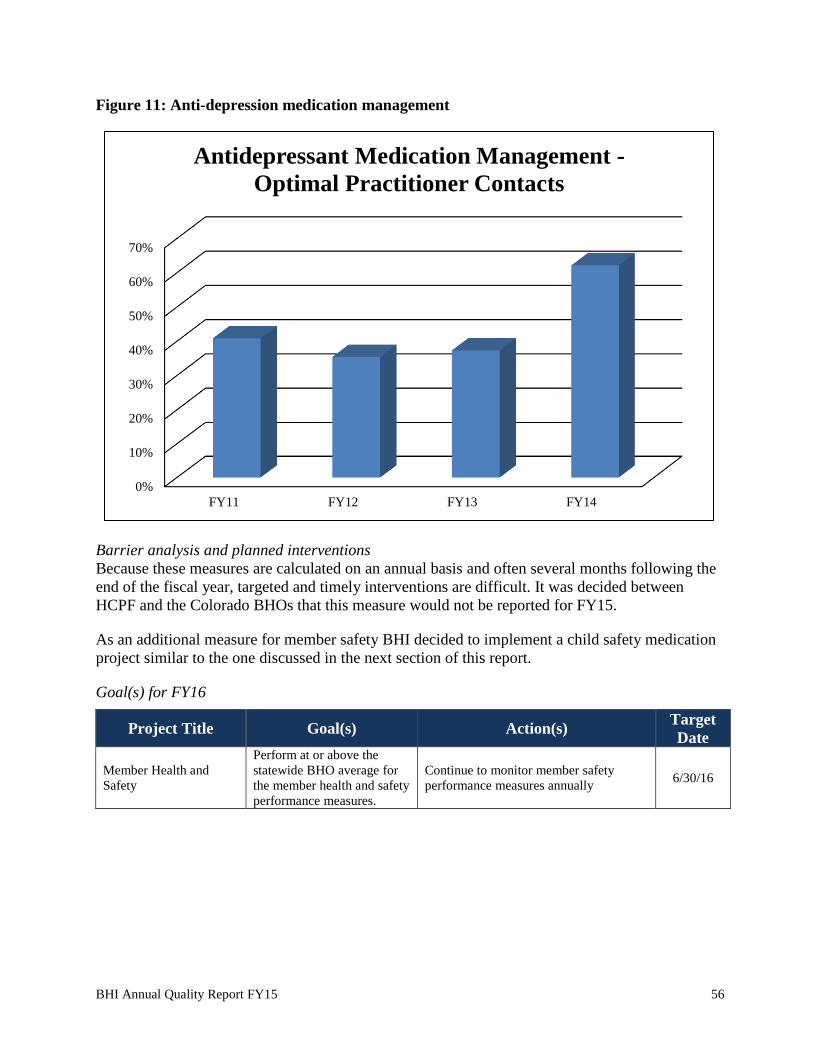
Improving Member Health and Safety ....................................................................................... 54
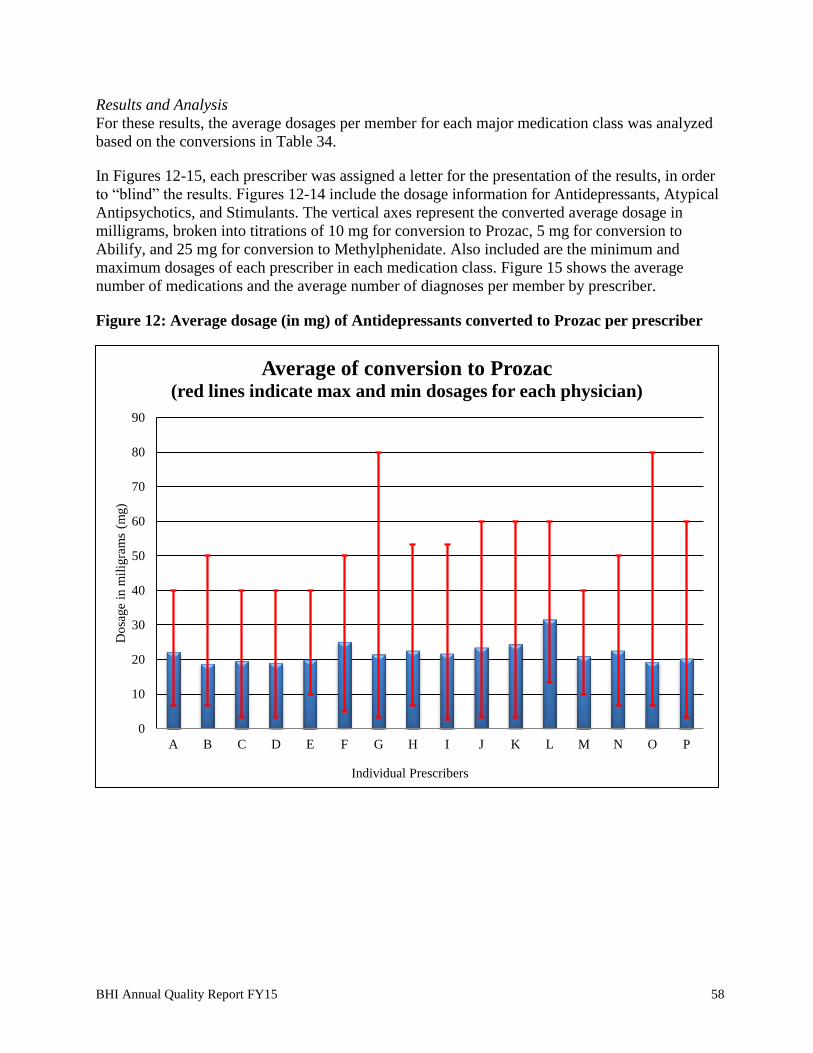
Safety Standards in Medication Dosages Report ........................................................................ 57
Coordination of Care – Follow-up after Hospital Discharge ...................................................... 62
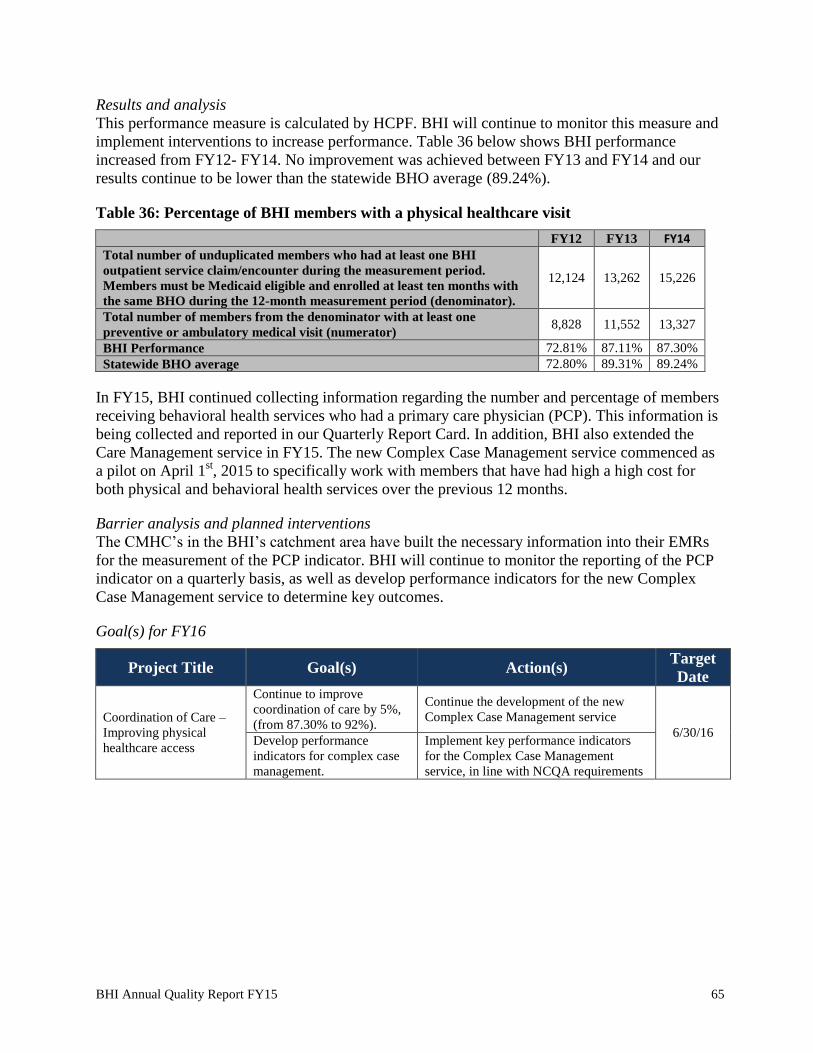
Coordination of Care - Improving Physical Healthcare Access ................................................. 64
Coordination of Care – Adolescent Depression Screening and Follow-up ................................ 66
Coordination of Care – E-Visits ................................................................................................. 67
Improving Member Functioning ................................................................................................. 68
Information Systems Capabilities Assessment Tool (ISCAT) Audit ......................................... 70
Section 8: Clinical Practice Guidelines and Evidence-Based Practices ......................................... 72
Page 3
BHI Annual Quality Report FY15 2
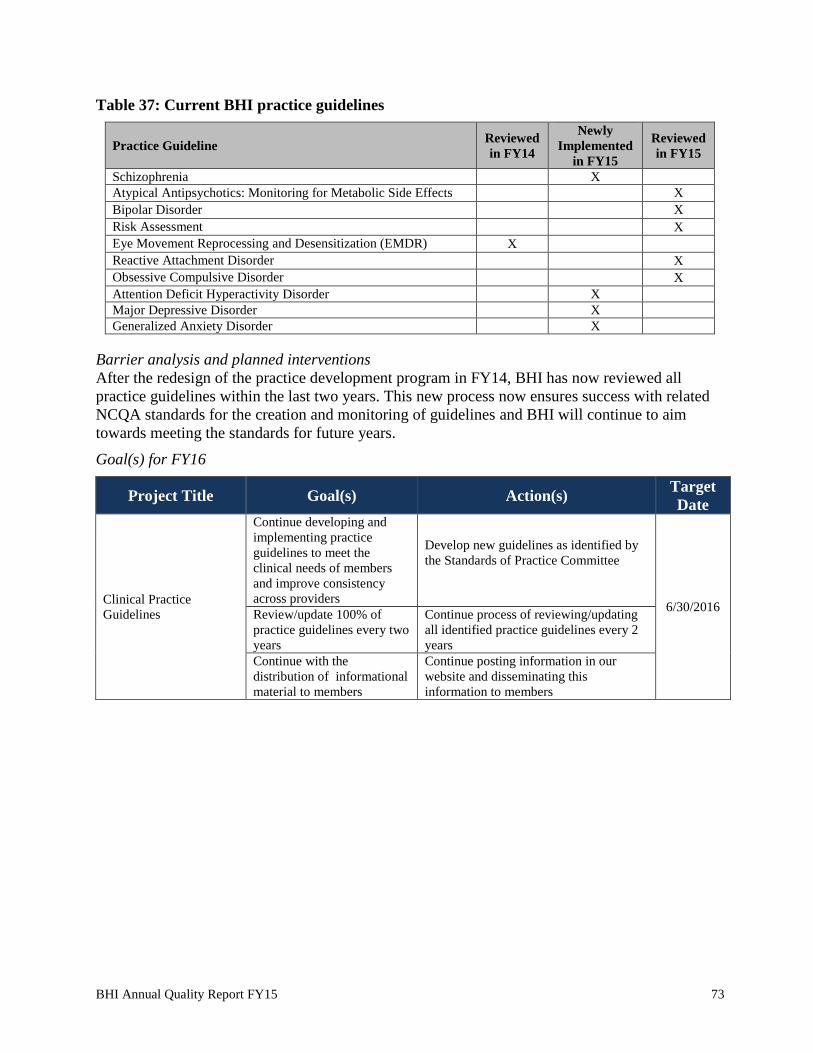
Practice Guideline Review and Development ............................................................................ 72
Practice Guideline Compliance – Reactive Attachment Disorder .............................................. 74
Practice Guideline Compliance – Risk Assessment ................................................................... 76
Practice Guideline Compliance – Atypical Antipsychotics and Monitoring of Metabolic Side
Effects ......................................................................................................................................... 78
Evidence-Based and Promising Practices ................................................................................... 80
Section 9: Member & Family Input in QI Program ........................................................................ 82
Member Satisfaction (BHI Member Satisfaction Survey) .......................................................... 82
Member Satisfaction (ECHO)..................................................................................................... 87
Grievances and Appeals .............................................................................................................. 92
Quality of Care Concerns............................................................................................................ 96
Critical Incident Reporting ......................................................................................................... 98
Section 10: BHI Quality Improvement Work Plan for FY16 ....................................................... 101
Page 4
BHI Annual Quality Report FY15 3
Section 1: Executive Summary
Behavioral Healthcare, Inc.’s (BHI) Quality Improvement (QI) Program is modeled after the
Total Quality Management (TQM) System. This model allows BHI departments the sharing of
knowledge to provide multidimensional health care management and incorporate business
intelligence into programmatic decision-making. BHI departments work collaboratively to
implement and maintain a continuous process of quality assessment, measurement, intervention,
and re-measurement of service and outcome related measures.
At the beginning of FY14, BHI decided to combine the Quality Improvement and Utilization
Management Departments under one Director. With the dual-director role, BHI found it difficult
to concentrate efforts and ensure the needs of each department were being met. Furthermore, due
to the increased demands on both departments, BHI determined that each department needed its
own Director to achieve on-going goals successfully.
The QI Department accomplished many of the work plan goals established for FY15 and is
committed to continuously enhancing the quality of services received by our members. A
Compliance Monitoring Specialist as well as an additional .25 FTE was hired to assist the
department in achieving its goals. Quarterly clinical documentation trainings were implemented
and providers have been receptive to the feedback received during the trainings. The QI
Department completed an in depth analysis of network adequacy and determined that our network
of providers can meet the needs of our ever-growing membership. Through the critical incident
procedure and collaboration with a provider, the number of restraints was reduced by 72% over
three months. The QI Department was able to refine and implement a more comprehensive
evidenced-based reporting process with providers. All of the on-going and newly developed QI
Program activities, including the accomplishments described above allowed the QI program to
continue to be effective during FY15.
Page 5
BHI Annual Quality Report FY15 4
QI Structure and Committees
The structure of the BHI Quality Improvement Program, illustrating reporting relationships and
the chain of supervisory authority, is displayed below.
Figure 1: QI Reporting Structure
Board of Directors
Program Improvement
Advisory Committee (PIAC)
Member Advisory Board (MAB)
BHIChief Executive Officer
Chief Operations OfficerChief Medical OfficerChief Financial Officer
Quality Improvement
Committee (QIC)
Program Evaluation and Outcomes Committee
(PEO)
Credentialing Committee
Standards of Practice Committee (SOP)
The ultimate authority for the Quality Improvement Program rests with the Board of Directors.
The Board delegates this authority to the Chief Executive Officer (CEO), the Chief Operations
Officer (COO), and the Chief Medical Officer (CMO). The Director of Quality Improvement is
accountable to the CEO/COO/CMO for all operations of the Quality Improvement Program.
Quality Improvement Committee
The Quality Improvement Committee (QIC) was created in FY14 to monitor, oversee, and design
interventions for BHI daily operations. QIC monitors activities from BHI’s quality improvement,
utilization management (UM), provider relations, and member and family affairs departments,
including (but not limited to): access to care, audits, quality of care concerns, critical incidents,
over and under-utilization, UM decision timeframes, grievance and appeal data, and provider
network adequacy. Trends are analyzed and interventions are developed and implemented as
necessary. Effectiveness of interventions and follow-up activities are also reviewed. QIC oversees
Page 6
BHI Annual Quality Report FY15 5
any significant change in policies and operational procedures from each department. QIC meets
monthly and membership includes the following:
Table 1: FY15 QIC Membership
Quality Improvement Committee
Name Credentials Title Affiliation
Lisa Brody MS Chief Operations Officer (Chair) BHI
Ann Winters BA Compliance Monitoring Specialist BHI
Cara Mason MPA Director of Member Services and Outreach BHI
Clara Cabanis MHA Director of Quality Improvement BHI
Emily Schrader LPC, CACIII Substance Use Disorder Coordinator BHI
Jane Moore LCSW UM Care Manager BHI
Jessie Nelson LPC Quality Improvement Team Lead BHI
Laura Hill RN Director of Integrated Care BHI
Mandy Jamieson LPC UM Care Manager BHI
Ron Morley MD Chief Medical Officer BHI
Sam Madden BS Quality Improvement Coordinator BHI
Teresa Summers BA Director of Provider Relations BHI
QIC has three subcommittees, each of which includes providers from the BHI network. Each
subcommittee chair reports activities and progress to QIC:
Program Evaluation and Outcomes Committee (PEO)
Standards of Practice Committee (SOP)
Credentialing Committee
Program Evaluation and Outcomes Committee:
The Program Evaluation and Outcomes (PEO) Committee focuses on the improvement of service
provision and membership includes several BHI network providers. Each participating member of
PEO submits quarterly data to BHI for monitoring and oversight. The PEO Committee develops
standards for performance on a variety of clinical and service indicators, analyzes trends in
performance at both the provider and network levels, and develops interventions accordingly. The
PEO Committee meets monthly and membership includes:
Table 2: FY15 PEO Membership
Performance Evaluation and Outcomes Committee
Name Credentials Title Affiliation
Clara Cabanis MHA Director of QI (Chair) BHI
Ann Winters BA Compliance Monitoring Specialist BHI
Jessie Nelson LPC Quality Improvement Team Leader BHI
Sam Madden BS Quality Improvement Coordinator BHI
Cynthia Grant PhD, LCSW QI Clinical Manager ADMHN
Lisa Traudt LMFT Director of Managed Care and QI ADMHN
Karen Levine LPC Director of Quality Development AuMHC
John Mahalik LPC Clinical Services Administrator CCC
Lara Dicus LCSW Clinical Services Administrator CCH
Janet Rassmusen MSW Director of Accountable Care and
Behavioral Health
Clinica Family Health
Services
Clay Cunningham LPC Director of Quality Assurance CRC
Brian Stanley BS Director of QI & UM Creative Treatment Options
Matt Louzon LPC Director of Community Based Services Excelsior Youth Center
Page 7
BHI Annual Quality Report FY15 6
The Standards of Practice Committee:
The Standard of Practice Committee (SOP) oversees the development, implementation,
monitoring, and evaluation of BHI Clinical Practice Guidelines. Membership includes several
psychiatrists and clinicians from the BHI provider network. The SOP Committee develops and
reviews BHI practice guidelines and reviews requests for new technology. The SOP Committee
reviews the results of guideline compliance evaluations, identifies education opportunities, and
makes recommendations for performance improvement. The SOP Committee meets as needed
and membership includes:
Table 3: FY15 SOP Membership
Standards of Practice Committee
Name Credentials Title Affiliation
Ron Morley MD Chief Medical Officer – Psychiatry (chair) BHI
Sam Madden BS Quality Improvement Coordinator BHI
Lisa Traudt LMFT Director of Managed Care and QI ADMHN
Resul Ozbayrak MD Medical Director ADMHN
Karen Levine LPC Manager of Quality and Training AUMHC
Leslie Winters MD Medical Director – Psychiatry AUMHC
Clay Cunningham LPC Director of Quality Assurance CRC
Jeanette Valdivieso MD Medical Director CRC
Credentialing Committee
BHI utilizes a multidisciplinary Credentialing Committee that includes both BHI personnel and
network providers with experience in a variety level of care and behavioral health specialties,
including substance use disorders. The Credentialing Committee reviews and discusses complete
credentialing files and then approves or declines the credentialing request. The Credentialing
Committee reviews the credentials of all providers who do not meet BHI’s established criteria.
BHI’s CMO is a member of the Credentialing Committee and as such, participates in all
credentialing decisions. Only the CMO has the authority to determine if the files meets the BHI
credentialing criteria and sign off on it as complete, clean, and approved by the Credentialing
Committee. The Credentialing Committee meets monthly and membership includes:
Table 4: FY15 Credentialing Committee Membership
Credentialing Committee
Name Credentials Title Affiliation
Teresa Summers BA Director of Provider Relations (chair) BHI
Ann Winters BA Compliance Monitoring Specialist BHI
Ashley Murphy LPC Utilization Reviewer BHI
Cara Mason MPA Director of Member and Family Affairs BHI
Clara Cabanis MHA Director of Quality Improvement BHI
Emily Schrader LPC, CACIII SUD Coordinator BHI
Heather Piernik LCSW Director of UM BHI
Jessie Nelson LPC Quality Improvement Team Leader BHI
Laura Hill RN Director of Integrated Care BHI
Lisa Brody MS Chief Operations Officer BHI
Mandy Jamieson LPC UM Care Manager BHI
Ron Morley MD Chief Medical Officer BHI
Sam Madden BS Quality Improvement Coordinator BHI
Bryan Stanley BS Director of QI and UM Creative Treatment Options
Rebecca Hea PsyD Executive Director Denver Children’s Home
Page 8
BHI Annual Quality Report FY15 7
Key Metric Trends
Table 5: Key Metric Trends
Access to Care Measures
Measure Goal FY12 FY13 FY14 FY15
Access to Care
Routine Care within 7 days
Urgent Care within 24 hours
Emergent Care within 1 hour
Emergency Phone Calls
100.00%
100.00%
100.00%
100.00%
99.83%
100.00%
100.00%
100.00%
99.84%
100.00%
100.00%
100.00%
96.55%
100.00%
100.00%
100.00%
98.8%
100%
94.8%
100%
Access to Medication Evaluations
Adult
Children
90.00%
90.00%
88.44%
87.61%
91.15%
85.82%
80.21%
83.77%
66.9%
82.8%
Penetration Rates
Total Rate
>13.00%
11.28%
11.42%
12.04%
*
Utilization Monitoring
Emergency room visits per 1000
members
- 9.95 9.94 12.46 *
Hospital Measures: All Hospital Data
Measure Goal FY12 FY13 FY14 FY15
Utilization Monitoring
Inpatient: Admits per 1000 members
Inpatient: Average length of stay
-
-
3.83
15.54
3.39
12.90
3.84
13.17
*
*
Follow-up After Hospital Discharge
7 Days
30 Days
90.00%
95.00%
59.31%
72.70%
61.19%
75.20%
54.55%
71.34%
*
*
Inpatient Readmits
7 Days
30 Days
90 Days
-
-
-
2.95%
8.84%
15.08%
2.83%
7.79%
12.57%
3.50%
8.11%
13.48%
*
*
*
Hospital Measures: Non-State Hospital Data
Measure Goal FY12 FY13 FY14 FY15
Utilization Monitoring
Inpatient: Admits per 1000 members
Inpatient: Average length of stay
-
-
2.87
7.13
2.81
7.76
3.29
7.11
*
*
Follow-up After Hospital Discharge
7 Days
30 Days
90.00%
95.00%
57.69%
70.83%
58.15%
73.16%
52.43%
70.58%
*
*
Inpatient Readmits
7 Days
30 Days
90 Days
-
-
-
2.78%
8.33%
14.58%
2.99%
7.91%
12.39%
3.20%
7.71%
18.35%
*
*
*
*Data will be available upon validation of FY15 Performance Measures
Page 9
BHI Annual Quality Report FY15 8
Key Accomplishments from FY15
Table 6: Key Accomplishments from FY15
Project Accomplishment
Encounter Data Validation Audit Achieved near-perfect inter-rater reliability with HSAG
Provider audits
Continued Clinical Documentation Training initiative
and trained over 100 providers. BHI also completed
training with four facilities.
Utilization Management data analysis
Continued to refine process for tracking authorization
and census data and reporting. BHI expanded tracking
and reporting to additional levels of care requiring
authorization.
Evidenced Based Practices
Developed a reporting process for 12 evidenced based
practices across the Community Mental Health Centers
(CMHCs) and other community based providers. BHI
identified fidelity scores for nine of the practices and
reported a total of 23 outcome measures.
Performance Improvement Project
(PIP)
Adolescent Depression Screening and Transition to a
Behavioral Health Provider PIP was reviewed and
scored 100% by HSAG.
Critical Incident reporting
Through the critical incident reporting process, BHI was
able to collaborate with a provider to successfully reduce
the number of restraints by 72% in 90 days.
Follow up after hospital discharge
Implemented new oversight process for discharge
planning and follow up for members receiving inpatient
services. Preliminary reports indicate a significant
improvement in follow-up after hospital discharge for
FY15.
Access to Care
Developed access to care and other reporting
requirements specifications document that details
definitions, numerator and denominator values for each
measure included in the report card.
Page 10
BHI Annual Quality Report FY15 9
Key Initiatives for FY16
Table 7: Key Initiatives for FY16
Project Initiative
Report Card data integrity Develop systematic way to audit data that providers are submitting
to ensure data integrity.
Provider Monitoring
Develop a new process to monitor providers’ contractual
requirements, quality of care, and data validation in a better
systematic manner; through scheduled periodic audits covering a
larger number of contracted providers.
Performance Improvement Project (PIP)
Continue working with providers and facilities to increase the rate
of adolescent follow-up with a behavioral health provider after
screening positive for depression in a primary care setting.
Data Reporting system
Implement, test, and train BHI Quality Improvement staff on new
electronic systems that will expedite data analysis and reporting
needs.
Performance Measures Create more in-depth monitoring and interventions for various
performance measures.
NCQA Accreditation BHI will apply for NCQA reaccreditation in June 2016.
Access to Care
Enhance the current monitoring of access to care measures with all
contracted providers, including the Colorado Crisis Connection data
collection process
Member Satisfaction
Develop and implement effective process to assess member
experience with BHI processes and customer service, including
Utilization Management procedures.
Barrier Analysis and Planned Interventions
The current staffing and historical staffing of the Quality Improvement Department remains a
challenge that limits the amount of progress and projects the department can effectively work on
at a time. The QI Department continues to need more resources in order to effectively monitor
progress and implement timely interventions for on-going/new projects.
At the same time the data quality and quantity is another barrier. There are three sources of data
the QI department relies on: claims, internal systems, and external sources. Claims data is often
delayed due to provider submission requirements, which is expected. Internal tracking
mechanisms rely heavily on manual input and reporting which can lead to incomplete and
inaccurate data. In addition, the QI Department does not have the resources to track, validate, and
monitor data from all external sources.
A third barrier is related to the lack of understanding of the QI initiatives by all Stakeholders. As
the QI Department continues working on a wide variety of initiatives, stakeholders are not always
aware of the new and on-going initiatives. This lack of engagement could create delays and
conflict during the execution of the different initiatives.
The table on the next page shows the specific barriers encountered and the interventions planned
to address these barriers.
Page 11
BHI Annual Quality Report FY15 10
Table 8: Barrier Analysis
Barrier Planned Intervention(s)
Adequate Quality Improvement
Department Staffing
Hire a Quality Provider Monitoring Specialist by the end
of October 2015. Hire an additional Quality
Improvement Coordinator by January 2016.
Data accuracy and timeliness
Continue to coordinate data requirements to providers
and Colorado Access, as BHI’s Administrative Service
Organization and implement a better internal data
tracking system.
Lack of understanding of QI
initiatives by Stakeholders.
Continue educating and engaging stakeholders,
members, providers, and other community partners
about BHI’s QI program and activities through
communication in different committees, the provider
bulletin, and the Member and Family Newsletter.
Page 12
BHI Annual Quality Report FY15 11
Section 2: NCQA Accreditation
In September 2013, BHI received a full, 3-year accreditation with the National Committee for
Quality Assurance (NCQA) as a Managed Behavioral Health Organization (MBHO).
Accreditation required compliance in several categories: Quality Improvement, Utilization
Management, Credentialing, Member Rights and Responsibilities, and Preventive Health.
The NCQA re-accreditation process continues to be project managed by the Quality Improvement
team. BHI continues to oversee compliance and implement new programs, policies, and
procedures in order to meet the standards.
Goal for FY16
Project Title Goal(s) Action(s) Target
Date
NCQA Accreditation Achieve re-accreditation in
2016
Continue to project manage
implementation and oversight of NCQA
standards
6/30/2016
Page 13
BHI Annual Quality Report FY15 12
Section 3: BHI Population Characteristics and Penetration Rates
Aid Categories and Demographic Characteristics
The BHI member population varies slightly from month to month. By the end of 2015 BHI was
responsible for a total of 296,998 active members. This is an increase of 22% from FY14, in
which BHI served 242,551 members by the end of the FY14 fiscal year. Table 9 shows the
breakdown of the BHI member population by aid category, as of June 30, 2015.
Table 9: Member Aid Categories
Aid Category Description # of
members
% of
member
population
Categorically Eligible Low-Income Adults (AFDC-A): includes low income adults who
receive Medicaid, families who receive Temporary Aid to Needy Families, and adults
receiving Transitional Medicaid (adults in families who have received Medicaid in three of
the past six months and become ineligible due to an increase in earned income) 42,331 14.25%
Categorically Eligible Low-Income Children (AFDC-C): includes children of low-
income families and children on Transitional Medicaid. 133,505 44.95%
Disabled Individuals to 59 (AND-AB): these individuals are blind, have a physical or
mental impairment that keeps them from performing substantial work, or are children who
have a marked and severe functional limitation 15,279 5.14%
Adults without Dependent Children (AWDC): adults between the ages of 19-64, who
earn approximately $95 or less a month for a single adult ($129 for a married couple). 78,924 26.57%
Baby Care-Adults, Breast, and Cervical Cancer Program (BCKC-A, BCCP): includes
women with incomes up to 133% of the federal poverty level. Coverage includes prenatal
care and delivery services, plus 60 days of postpartum care. Also covers women who were
screened using national breast and cervical cancer early detection and prevention
guidelines, and found to have breast or cervical cancer. These women are between the ages
of 40 and 64, uninsured, and otherwise not eligible for Medicaid.
7,626 2.57%
Baby Care Children (BCKC-C): Children who are born to women enrolled in the Baby
and Kid Care program (described above) 3,288 1.11%
Foster Care (Foster): Title IV-E provides federal reimbursement to states for the room
and board costs of children placed in foster homes and other out-of-home placements.
Eligibility is determined on family circumstances at the time when the child was removed
from the home.
4,852 1.63%
Non-categorical Refugee Assistance (NCRA): mandatory full coverage for refugees for
the first seven years after entry into the United States regardless of whether the individual
is an optional or mandatory immigrant 42 < 1.0%
Adults 65 and Older (OAP-A): Colorado automatically provides Medicaid coverage to
individuals who receive Supplemental Security Income. Supplemental An individual must
have income below the federal monthly maximum Supplemental Security Income limit and
limited resources.
8,457 2.85%
Disabled Adults 60 to 64, Working Adults with Disabilities (OAP-B, WAWD):
Colorado automatically provides Medicaid coverage to individuals who receive
Supplemental Security Income. An individual must have income below the federal monthly
maximum Supplemental Security Income limit and limited resources. Disabled adults aged
60 to 64 who are eligible for Supplemental Security Income are included in this category.
2,652 <1.0%
Total 296,998 100%
Page 14
BHI Annual Quality Report FY15 13
Table 10 shows the breakdown of the BHI member population by age, race/ethnicity, and gender.
Table 10: Member Demographic Characteristics
Number of
members
% of
Population
Age
Under 5 years 41,013 13.81%
5-13 years 76,728 25.84%
14-17 years 26,167 8.81%
18-64 years 144,124 48.53%
65+ years 8,945 3.01%
Race/Ethnicity
Hispanic 91,207 30.71%
Caucasian 79,288 26.70%
Unknown / Not Stated 44,371 14.94%
Other 34,636 11.66%
African American 30,122 10.14%
Asian 11,903 4.01%
Native American 4,023 1.35%
Native Hawaiian/other Pacific Islander 1,205 0.41%
Asian/Pacific Islander 222 0.07%
Gender
Female 162,540 54.73%
Male 134,437 45.27%
Results and analysis
The member aid categories and demographic characteristics remained relatively stable from FY14
to FY15. Within the aid categories the most significant change was that of Adults without
Dependable Children (AWDC) that increased from 17% to 26%. The largest changes in the
opposite direction were the categories for Categorically Eligible Low-Income Adults and
Children (AFDC-A & AFDC-C), both of which reduced by four percentage points.
There was very little change in the demographic characteristics, the most significant being the
increase in age of the member population. All three categories for members aged under-18
reduced in terms of the overall percentage, whereas members aged between 18 and 64 increased
by four percentage points. The race and ethnicity figures are difficult to interpret as there is such a
high number that are unknown or not stated. It is not a requirement that members identify a
race/ethnicity; however there were still 85% of the population that did identify themselves as a
certain race or ethnicity and BHI will therefore continue to use the above information to
appropriately plan services for FY16.
Page 15
BHI Annual Quality Report FY15 14
Penetration Rates
Summary of project
Penetration rates refer to the percent of members with at least one behavioral health contact
during the fiscal year. Throughout this document are interventions designed to increase
performance on several different aspects of member care. The calculation of penetration rates
(broken down by age, race, eligibility type, and overall) helps BHI to better target interventions to
improve member’s access to timely, and appropriate services that meet their needs.
Goal from FY15
Project Title Goal(s) Action(s) Target
Date
Penetration Rates Increase overall penetration
rate by 2% to 11.64%
Calculate penetration rates for each
CMHC in the BHI catchment area on an
annual basis
6/30/15
Results and analysis
BHI will continue to utilize the Geo-Coding information to assess specific geographic areas in the
catchment area. BHI continues to work towards the benchmark of 13.00% and increased overall
penetration rates by 5.43% (11.42% to 12.04%) in FY14 performance measures, as shown in
Figure 2. This is more than double the target of 2% improvement and therefore BHI considers the
objectives for this measure to be met.
Figure 2: BHI penetration rates
0%
2%
4%
6%
8%
10%
12%
14%
16%
FY11 FY12 FY13 FY14
BHI Penetration Rates
Page 16
BHI Annual Quality Report FY15 15
Barrier analysis and planned interventions
BHI will continue the process by which each individual CMHC penetration rates will be
calculated for monitoring and targeted improvements. This information will be calculated
annually, at minimum. BHI also plans to monitor the geo-coding information by zip code so that
the more in depth analysis will be able to highlight the exact areas of the catchment area that have
lower numbers of providers.
Goal(s) for FY16
Project Title Goal(s) Action(s) Target
Date
Penetration Rates Increase overall penetration
rate by 2% to 12.28%
Calculate penetration rates for each
CMHC in the BHI catchment area on an
annual basis
6/30/16
Page 17
BHI Annual Quality Report FY15 16
Section 4: Network Adequacy and Availability
Ensuring Availability
Summary of project – Quality of Services
BHI continuously builds its provider network to meet the needs of members in Adams, Arapahoe
and Douglas counties, and throughout Colorado. BHI members can receive services through three
different service delivery systems:
Prescribers: BHI defines a prescriber as one of the following:
o Psychiatrist (either a Doctor of Medicine or a Doctor of Osteopathy) who is
licensed by the Colorado Board of Medical Examiners
o Physician’s Assistant who is licensed by the Colorado Board of Medical
Examiners
o Advanced Practice Nurse with Prescriptive Authority (RxN) who is licensed who
has been granted prescriptive authority by the Colorado Board of Nursing
Practitioners: BHI and NCQA define a practitioner as any professional who provides
behavioral health care services. This includes licensed practitioners in private practice and
practitioners in the community mental health centers (CMHCs). It is noteworthy that the
CMHCs also have many non-licensed mental health clinicians providing certain services.
For the purposes of this report, “practitioners” includes only licensed clinicians.
Providers/Facilities: BHI and NCQA define a provider as an organization that provides
services to members, including hospitals, residential facilities, or group practices.
The US Department of Health and Human Services designates a psychiatric health professional
shortage area (HPSA) when the prescriber to member ratio reaches 1:20,000 and the licensed
mental health professional (MHP) ratio reaches 1:6,000. In December 2012, the BHI Leadership
team set a standard for the provider-to-member ratio in the BHI catchment area. Because BHI
strives to build a robust network, the BHI standard was set at 25% of the HPSA benchmark – for
prescribers, a ratio of one prescriber per 5,000 members and for practitioners, a ratio of one
practitioner per 1,500 members. As there is no state or national standard for facility ratios, BHI
adapted the CMS guidelines for Medicare Advantage and state penetration rates to develop our
own network standard. For providers/facilities, BHI’s standard is set as one facility per 15,000
members.
In addition to the HPSA guidelines, the access standards for Medicaid Managed Care
Organizations sets out requirements that the maximum distance within the state of Colorado that
members should travel to receive services is 30 miles. To ensure that this standard is met BHI
calculates the percent of members throughout the catchment area that live within 30 miles of a
BHI-contracted prescriber, practitioner, and facility.
Goal from FY15
Project Title Goal(s) Action(s) Target
Date
Network Adequacy –
Ensuring Availability
Meet the geographical needs
of members by assuring
provider availability
Continue to assess provider network
availability against BHI standards and
respond to the needs of the ever-growing
Medicaid population.
6/30/15
Page 18
BHI Annual Quality Report FY15 17
Results and analysis
The FY15 provider to member ratio performance and BHI standards are listed in Table 11 below,
demonstrating BHI compliance with the standards for availability of services.
Table 11: Provider availability in BHI catchment area
Total
Number
Total BHI
Members
Members in
catchment area Ratio
BHI
Standard
Prescribers 94 286,680 263,745 1:2,803 1:5,000
Practitioners 641 286,680 263,745 1:411 1:1,500
Providers/Facilities 43 286,680 263,745 1:6,134 1:15,000
BHI monitors the number of prescribers, practitioners, and providers/facilities in each county of
our catchment area to assure that our provider network is not only adequate but also robust to
meet the needs of our members. BHI uses the same ratio standards as outlined above to assess the
availability in each county of the catchment area. Tables 12-14 reflect the different types of
service delivery systems in the different counties of the catchment area and demonstrates BHI
compliance with the standards of availability of services.
Table 12: Prescriber availability in BHI catchment area by county
Prescribers Total Number Members in
Catchment area Ratio
BHI
Standard
Adams County 23 124,148 1:5,398 1:5,000
Arapahoe County 62 117,039 1:1,888 1:5,000
Douglas County 9 22,558 1:2,506 1:5,000
Table 13: Practitioner availability in BHI catchment area by county
Practitioners Total Number Members in
Catchment area Ratio
BHI
Standard
Adams County 207 124,148 1:600 1:1,500
Arapahoe County 390 117,039 1:300 1:1,500
Douglas County 49 22,558 1:460 1:1,500
Table 14: Providers/Facilities availability in BHI catchment area by county
Providers / Facilities Total Number Members in
Catchment area Ratio
BHI
Standard
Adams County 15 124,148 1:8,277 1:15,000
Arapahoe County 26 117,039 1:4,502 1:15,000
Douglas County 2 22,558 1:11,279 1:15,000
Page 19
BHI Annual Quality Report FY15 18
While the prescriber/member ratio in Adams County currently exceeds BHI standard, the
percentage of compliance with the Access to Medication Evaluation standard has remained
consistent throughout FY15. However, BHI will continue to work with the CMHC in Adams
County, and continue to recruit prescribers in Adams County to assure that members can access
services in a timely manner.
As the geographic access standard is a newer measurement for BHI, both the FY14 and FY15
performance and BHI standards are listed in Table 15 and 16 below. BHI met the geographic
access standards goals in FY14 and FY15 across all provider types and all three counties.
Table 15: FY14 Access standards in BHI catchment area
BHI Members
living in
catchment area
BHI Members
living within 30
miles of a provider
% of BHI Members
living within 30
miles of a provider
BHI
Standard
Prescribers 219,668 219,017 99.7% 95%
Practitioners 219,668 219,668 100.0% 95%
Providers/Facilities 219,668 219,017 99.7% 95%
Table 16: FY15 Access standards in BHI catchment area
BHI Members
living in
catchment area
BHI Members
living within 30
miles of a provider
% of BHI Members
living within 30
miles of a provider
BHI
Standard
Prescribers 263,745 262,963 99.7% 95%
Practitioners 263,745 263,745 100.0% 95%
Providers/Facilities 263,745 262,963 99.7% 95%
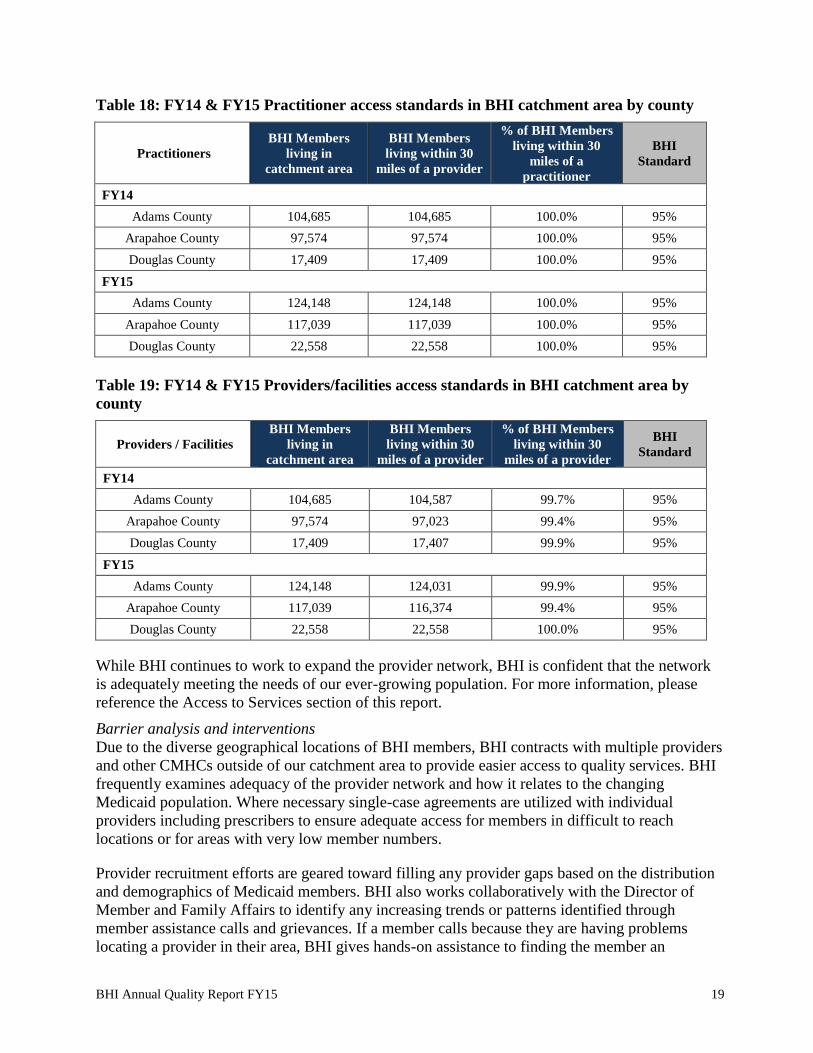
As with the number of providers, BHI monitors the access standards within each county of our
catchment area using the same distance of 30 miles. Tables 17-19 reflect the members within 30
miles of each of the provider types for FY14 and FY15.
Table 17: FY14 & FY15 Prescriber access standards in BHI catchment area by county
Prescribers
BHI Members
living in
catchment area
BHI Members
living within 30
miles of a provider
% of BHI Members
living within 30
miles of a prescriber
BHI
Standard
FY14
Adams County 104,685 104,587 99.7% 95%
Arapahoe County 97,574 97,023 99.4% 95%
Douglas County 17,409 17,407 99.9% 95%
FY15
Adams County 124,148 124,031 99.9% 95%
Arapahoe County 117,039 116,374 99.4% 95%
Douglas County 22,558 22,558 100.0% 95%
Page 20
BHI Annual Quality Report FY15 19
Table 18: FY14 & FY15 Practitioner access standards in BHI catchment area by county
Practitioners
BHI Members
living in
catchment area
BHI Members
living within 30
miles of a provider
% of BHI Members
living within 30
miles of a
practitioner
BHI
Standard
FY14
Adams County 104,685 104,685 100.0% 95%
Arapahoe County 97,574 97,574 100.0% 95%
Douglas County 17,409 17,409 100.0% 95%
FY15
Adams County 124,148 124,148 100.0% 95%
Arapahoe County 117,039 117,039 100.0% 95%
Douglas County 22,558 22,558 100.0% 95%
Table 19: FY14 & FY15 Providers/facilities access standards in BHI catchment area by
county
Providers / Facilities
BHI Members
living in
catchment area
BHI Members
living within 30
miles of a provider
% of BHI Members
living within 30
miles of a provider
BHI
Standard
FY14
Adams County 104,685 104,587 99.7% 95%
Arapahoe County 97,574 97,023 99.4% 95%
Douglas County 17,409 17,407 99.9% 95%
FY15
Adams County 124,148 124,031 99.9% 95%
Arapahoe County 117,039 116,374 99.4% 95%
Douglas County 22,558 22,558 100.0% 95%
While BHI continues to work to expand the provider network, BHI is confident that the network
is adequately meeting the needs of our ever-growing population. For more information, please
reference the Access to Services section of this report.
Barrier analysis and interventions
Due to the diverse geographical locations of BHI members, BHI contracts with multiple providers
and other CMHCs outside of our catchment area to provide easier access to quality services. BHI
frequently examines adequacy of the provider network and how it relates to the changing
Medicaid population. Where necessary single-case agreements are utilized with individual
providers including prescribers to ensure adequate access for members in difficult to reach
locations or for areas with very low member numbers.
Provider recruitment efforts are geared toward filling any provider gaps based on the distribution
and demographics of Medicaid members. BHI also works collaboratively with the Director of
Member and Family Affairs to identify any increasing trends or patterns identified through
member assistance calls and grievances. If a member calls because they are having problems
locating a provider in their area, BHI gives hands-on assistance to finding the member an
Page 21
BHI Annual Quality Report FY15 20
appropriately qualified provider within reasonable traveling distance and/or helps the member
with transportation arrangements.
BHI and the CMHC providers have experienced the effects of the national physician shortage in
the efforts to recruit and retain qualified prescribers for our members. To mitigate the impact of
the shortage, BHI continues to adjust the fee schedule for contracted prescribers to make rates
more attractive. BHI also offers single-case agreements as an option for a provider to see a
specific member. BHI is working with current single-case agreement prescribers to get them fully
contracted to better meet the needs of our members. The CMHCs have recently expanded their
telemedicine programs to fill gaps while new prescribers can be recruited.
To improve the ratio of members to prescribers in Adams County and generally to maintain a
high compliance with all network adequacy goals, BHI is planning the following interventions for
FY16:
1) Recruit prescribers outside of CMHCs
2) Ongoing monitoring of the number of prescribers at CMHCs through quarterly reporting
3) Discuss network adequacy results in PEO and develop specific interventions as a result
4) Ongoing monitoring of access to medication evaluations
5) Develop a data collection process for monitoring follow up of medication appointments
Goal(s) for FY16
Project Title Goal(s) Action(s) Target
Date
Network Adequacy –
Ensuring Availability
Meet the geographical needs
of members by assuring
provider availability
Continue to assess provider network
availability against BHI standards and
respond to the needs of the ever-growing
Medicaid population.
6/30/16
Page 22
BHI Annual Quality Report FY15 21
Cultural Needs and Preferences
Summary of project – Quality of Services
BHI believes that our health system must continuously evolve to reduce behavioral health
disparities. Our primary goal is to meet the needs and expectations of the all members and
families we serve with a robust network of culturally competent providers. Our providers excel at
embracing divergent norms, beliefs, expectations, and resources and how these factors are related
to cultural background and identity. BHI has recognized that quality care for all diverse
communities depends on inclusion and accessibility of services. Staff members at BHI are trained
to be conscious of and sensitive to, the cultural needs of our members.
BHI conducts ongoing assessment of demographic profiles of members who utilize services
through monthly clinical reports and the assessment of census and eligibility data. Utilization
rates by diverse member categories are calculated annually. BHI uses these assessments and other
surveillance data to determine where and how to allocate cultural and linguistic resources to best
serve the variety of individuals and communities we serve.
Goal from FY15
Project Title Goal(s) Action(s) Target
Date
Network Adequacy –
Cultural Needs and
Preferences
Meet the cultural, ethnic, and
linguistic needs of members
by assuring diverse provider
network
Implement facility update form to capture
cultural information from facility
providers
1/1/15
Results and analysis
Table 20 shows the demographics of the member population in BHI’s catchment area – Adams
County, Arapahoe County, Douglas County, and the city of Aurora (based on eligibility
information provided by member at application). Table 21 shows languages other than English
spoken in households throughout Colorado. The information for Table 21 is based on US census
data from 2010 as this remains the most recent census data available and is the most reliable data
source. BHI has also begun requesting race/ethnicity of individual providers in the Contracted
Provider Network (CPN). Please note that the data in Table 22 does not include the providers
working at each of the 100+ facilities statewide with which BHI has contracted.
Table 20: Population demographics in BHI’s catchment areas
Race/Ethnicity % of member
Population
% of provider
network*
Hispanic 30.71% 7.06%
Caucasian 26.70% 73.43%
Unknown / Not Stated 14.94% 10.04%
Other 11.66% 1.97%
African American 10.14% 4.01%
Asian 4.01% 2.80%
Native American 1.35% 0.64%
Native Hawaiian/other Pacific Islander 0.41% 0.06%
Asian/Pacific Islander 0.07% 0.00% *this does not include the providers working at each of the 100+ facilities statewide with which BHI has contracted
Page 23
BHI Annual Quality Report FY15 22
Table 21: Languages Spoken in Colorado
Languages Spoken in Colorado
Spoke only English at home 83%
Spoke a language other than English at home 17%
Breakdown of non-English speaking homes
Spanish 71% Other Indo European Languages 1%
French 2% Chinese 2%
Italian 1% Japanese 1%
German 4% Korean 2%
Russian 2% Vietnamese 2%
Polish 1% Other Asian Languages 1%
Other Slavic Languages 1% Tagalog 1%
Hindi 1% All Other Languages 4%
Source: US census 2010
BHI believes that linguistically appropriate services are crucial to service delivery. All members
who access the network will be evaluated at intake to assess linguistic needs. If a member is in
need of interpretation services, BHI will contact one of the resources available through a CMHC
or the CPN (see Table 22 below). In cases where the language needed is not available within the
network, BHI helps facilitate gaining access to language services. A family member of the
member will not be used to provide interpretation unless requested by the member.
Table 22: Providers offering services in languages other than English
ADMHN AUMHC CRC CPN Total ADMHN AUMHC CRC CPN Total
ASL 1 0 0 9 10 Lugisa 0 1 0 0 1
Afrikaans 0 1 0 0 1 Mandarin 0 3 0 5 8
Amharic 0 2 0 0 2 Mandika 0 1 0 0 1
Arabic 0 2 0 1 3 Marshallese 0 0 0 1 1
Burmese 0 2 0 2 4 Navajo 0 1 0 0 1
Cambodian 0 1 0 3 4 Nepali 0 3 0 4 7
Cantonese 0 1 0 0 1 Nigerian 0 1 0 0 1
Ethiopian 0 1 0 0 1 Norwegian 0 2 0 0 2
Farsi 0 1 1 1 3 Polish 0 0 0 1 1
French 2 3 0 9 14 Portuguese 0 1 0 1 2
Fuzhounese 0 1 0 0 1 Punjabi 0 0 0 1 1
German 1 2 0 4 7 Russian 1 5 1 4 11
Greek 0 0 0 1 1 Sango 0 1 0 0 1
Hebrew 0 0 0 2 2 Sinhala 0 1 0 0 1
Hindi 0 0 0 1 1 Somali 0 1 0 0 1
Hmong 0 1 0 1 2 Spanish 19 74 33 37 163
Hungarian 0 1 0 0 1 Swahili 0 1 0 0 1
Italian 0 3 0 2 5 Swedish 0 1 0 0 1
Japanese 0 2 0 1 3 Tagalog 0 1 0 1 2
Karen 0 2 0 2 4 Thai 0 2 0 1 3
Khmer 0 1 0 0 1 Ukrainian 0 2 0 2 4
Korean 0 2 0 3 5 Urdu 0 0 0 1 1
Lakota 0 0 0 1 1 Vietnamese 0 2 0 3 5
Laotian 0 0 0 1 1 Yiddish 0 0 0 1 1
Lingala 0 1 0 0 1 Yoruba 0 1 0 0 1
Luganda 0 1 0 0 1 TOTAL 24 136 35 107 302
Page 24
BHI Annual Quality Report FY15 23
BHI began collecting cultural demographic information from our individual providers in FY14.
BHI has not yet begun aggregating data from facilities. For this reason, the cultural identification
of the BHI providers (listed above) is skewed and incomplete. Several facilities in the BHI
network employ a wide range of provider cultural backgrounds.
BHI strives to meet our member’s linguistic and cultural needs by printing the Member and
Family Handbook in both English and Spanish. The handbook is also available upon request in
large print and in audio (English and Spanish) versions. Educational brochures and informational
brochures are also available in other languages (including Braille) upon request. Informational
flyers (such as the grievance procedure and member rights and responsibilities) are posted in each
CMHC as well as other provider locations in both English and Spanish.
In FY15, BHI continued to expand the provider network in order to continue to meet member’s
cultural and linguistic needs and preferences. BHI also hired a Member Services Outreach team
member who is Bilingual (English and Spanish). BHI continues to work with its Cultural
Competency Consultant to ensure the best quality of care is being provided to members and
member needs are being met. Additionally, BHI continues to contract with Cyracom for
translation and interpreter services.
Since 2005, BHI has only received one complaint from a member regarding accessing providers
that meet his/her linguistic needs (a Spanish speaking provider). BHI staff was able to link the
member to a Spanish-speaking provider at one of the CMHCs. The member was satisfied with the
resolution and the complaint was resolved within 14 days.
In FY13, BHI began a UM satisfaction survey to accompany the annual member satisfaction
surveys each year. As a part of the UM satisfaction surveys, BHI asked three additional questions
to determine if member’s cultural, linguistic and special needs were being met. For more
information on the survey methodology, please see Section 9. Below are the results of those three
questions from FY13, FY14, and FY15.
Table 23: Member Satisfaction with Cultural, Linguistic, and Special Needs
Member Satisfaction Questions
FY13
Percent
Satisfied
FY14
Percent
Satisfied
FY15
Percent
Satisfied How satisfied are you with the way your cultural needs or preferences
were met 91.26% 94.93% 93.26%
How satisfied are you with the way your linguistic needs or preferences
were met 90.97% 95.57% 92.53%
How satisfied are you with the way your special needs or preferences
were met (such as disability, living situation, multiple diagnosis,
medical condition, or substance use)
89.31% 91.91% 92.66%
Last year, BHI implemented a facility update form and a new individual practitioner form that
providers can use to update their language, cultural, and specialty areas so BHI can more
accurately capture provider information. Providers also are required to fill out this new form upon
recredentialing.
While there was a slight decrease in satisfaction from FY14 to FY15 for cultural and linguistic
needs or preferences, scores remains above 90% for each category. BHI also saw an increase in
Page 25
BHI Annual Quality Report FY15 24
experience with special needs or preferences being met. Experience scores are still well above
FY13. Since experience scores remain above 90% for each question above, BHI believes that, our
provider network is adequately meeting the needs of our membership.
Barrier analysis and planned interventions
While BHI believes that our provider network adequately meets the needs of our member
population, it is understood that our population is ever growing and ever changing. BHI is
committed to continued assessment of the provider network and increasing the level of cultural
competence and proficiency of our provider network.
BHI will continue to gather and update information from providers and practitioners related to
cultural, linguistic and specialty areas of practice. BHI will update the provider and practitioner
databases as new information becomes available.
Goal(s) for FY16
Project Title Goal(s) Action(s) Target
Date
Network Adequacy –
Cultural Needs and
Preferences
Meet the cultural, ethnic, and
linguistic needs of members
by assuring diverse provider
network
Aggregate data provided by facilities &
incorporate into analysis 1/30/16
Continue to monitor grievances via QIC
committee related to cultural needs /
preferences
6/30/2016
Page 26
BHI Annual Quality Report FY15 25
Section 5: Access to Services
Access to Care
Summary of project – Quality of Services
Access to care refers to the ease in which a member can obtain behavioral health services.
Providing access to quality behavioral health services for members and families is central to the
mission of BHI and its providers. Providers can be both facilities and individual practitioners.
BHI assesses compliance with Access to Care standards in the following manners:
BHI’s three CMHCs are required to submit an access to care report quarterly
Two other BHI organizations are submitting access to care reports quarterly
Other providers are assessed for access to care through the secret shopper program
BHI conducts an annual survey of members to assess specific access to care standards
The four access to care indicators required by the Colorado Department of Health Care Policy and
Financing (HCPF) include: Initial requests for routine services, urgent service requests,
emergency face-to-face requests, and emergency phone calls.
Initial requests for routine services include the non-urgent and non-emergent requests for
services. The performance standard for this indicator is offering an appointment within
seven business days.
Urgent service requests include those situations in which acute mental health symptoms
are present, have potential for an emergency health condition, or any other condition that
would place the health or safety of a member or other individual in jeopardy in the
absence of treatment. Urgent services require offering an appointment with 24 hours of the
urgent request.
Emergency face-to-face requests occur when a member presents with a condition
manifesting itself with acute symptoms that require immediate medical attention/mental
health services. Emergency Services (ES) shall be available in-person within one hour of
contact (in urban and suburban areas).
Emergency phone calls consist of calls that require immediate interventions. Calls can be
received at any time during and/or after business hours and are responded to by a qualified
mental health practitioner within 15 minutes. BHI does not have a centralized triage and
referral center for members.
Goals from FY15
Project Title Goal(s) Action(s) Target
Date
Access to routine,
urgent, and emergency
services
Provide access to covered
services as indicated in the
Medicaid standards for
access to care
Continue educating providers about
access to care standards and referrals to
BHI
1/1/15 Continue to conduct secret shopper calls
of all providers.
Improve member satisfaction
with Access to Care by 5%
Educate members about definitions of
routine, urgent, and emergent
appointments and resources available
Page 27
BHI Annual Quality Report FY15 26
In FY15, BHI implemented the following interventions to help improve access to care standards:
1. Educated providers through the provider bulletin and training about access to care
standards
2. Conducted secret shopper calls
3. Educated members about the differences between routine, urgent and emergent access to
care standards through the Member and Family Newsletter and Member Advisory Board
meetings.
BHI educated providers through the provider bulletin and clinical documentation trainings about
access to care, and how to refer members back to BHI if a provider could not offer an
appointment within the standard timeframe. BHI conducted secret shopper calls internally, having
members recruited from BHI’s Drop-In Centers make calls to measure access to care standards
with a random selection of providers. Providers were called as often as monthly to quarterly
during this fiscal year. BHI educated both members and provides on the access to care standards.
BHI also educated members about the differences between routine, urgent, and emergency care
through the Member Advisory Board and the Member and Family Newsletter.
Results and Analysis –Access to Care Reporting
BHI’s CMHCs are contractually required to report on access to care standards once a quarter.
BHI’s CMHCs have seen 24,275 unique members since July 1, 2014 (the start of Fiscal Year
2015), and have provided 276,369 services. The CMHCs continue to see the majority of BHI
members (76% of members receiving services).
To monitor performance and meet contractual requirements, each CMHC pulls access to care data
from their Electronic Medical Record (EMR) and submits quarterly reports of the four access to
care indicators to BHI. BHI reviews and aggregates these reports and submits them to HCPF.
HCPF has established performance standards for each indicator, typically at least 95%. Failure to
meet the 95% performance standard requires a formal Corrective Action Plan (CAP). BHI’s goal
is to maintain at least 95% compliance with each measure for access to care.
While BHI has consistently met access to care performance standards in recent years, instances of
non-compliance are of concern to HCPF, BHI, and CMHCs. The quarterly reports submitted to
HCPF include a narrative explanation of patterns of non-compliance. Other serious concerns may
result in a formal CAP. In addition, BHI routinely reviews compliance concerns with CMHCs in
the Program Evaluation and Outcomes Committee (PEO) to identify opportunities for
improvement.
As seen in Table 24, in FY15 Q1 several routine services took place outside the seven-day
requirement. The non-compliance appeared to carry over from FY14 Q4 and a corrective action
plan was put into place to address the continued non-compliance. The CMHC, as part of the
corrective action plan, was required to refer members who cannot be seen within the seven-day
requirement back to BHI, so BHI can assist those members with finding another provider within
the standard timeframe. The non-compliance with this access to care standard ended in FY15 Q2
and was seen as an anomaly rather than a continuing trend.
Page 28
BHI Annual Quality Report FY15 27
For the third and fourth quarter of FY15, BHI was out of compliance for the Emergency Face-to-
Face within one hour measure by less than 1%. There are a variety of explanations for non-
compliance with this measure that BHI has considered.
In December of 2014, Colorado Crisis Services expanded behavioral health resources to nearly
three million Coloradans in nine counties throughout the Denver/Boulder region. Community
Crisis Connection (CCC) is the partnership between six Community Mental Health Centers in the
metro area including the three CMHCs within BHI’s catchment area, as well as Jefferson Center
for Mental Health, Mental Health Center of Denver, and Mental Health Partners. Community
Crisis Connection offers walk-in crisis stabilization centers, mobile crisis, and crisis stabilization
units. Services are available 24/7/365.
Since the implementation of the CCC, the CMHCs have expanded their coverage area of
emergency evaluations to cover not only evaluations at the local emergency rooms, but
evaluations completed at the walk-in centers and crisis stabilization units across the metro area.
The increase in coverage area created increased travel time for evaluators. Secondly, BHI has
seen an increase in the number of requests for emergency face to face requests of 108.55% from
FY14 to FY15. The increase in covered metro area locations and increased requests for
emergency face to face services contributed to BHI’s non-compliance with this measure for the
third and fourth quarters of FY15.
Since FY15 Q3, the CCC has provided data to BHI regarding emergency face-to-face requests,
both for mobile crisis and walk-in center requests. Evaluations completed in the emergency room
are included in the mobile crisis data submission from CCC. One issue of note with the CCC data
submission for this indicator is that time of request to time being seen is not captured. BHI’s
CMHCs within the catchment area are still able to report the number of emergency face-to-face
evaluations that are occurring in the emergency department as well as the time of request to the
time being seen. Since BHI is receiving data on emergency face-to-face evaluations from both the
CCC and the CMHCs, the data submitted has the potential to be duplicative. BHI continues to
partner with the CCC to determine if data is being collected in a manner consistent with reporting
requirements and de-duplicate data as much as possible to avoid over-reporting of the number of
emergency face-to-face requests.
It was recently noted by one CMHC that evaluators were documenting the time of the request for
an evaluation from the time of the call, rather than recording the time of request after the member
has been medically cleared, when evaluators are contacted again to complete the evaluation. The
time difference was noted as anywhere between three and twelve hours. This contributed to the
increase in the number of requests that took greater than two hours to start the face to face service.
The CMHC noted that new staff was not trained properly on how to document request times and
since has been trained appropriately.
Page 29
BHI Annual Quality Report FY15 28
Table 24: Access to Care Results for FY15
Initial Requests for Routine Services
Q1 Q2 Q3 Q4
Offered within 7 days 2,070 2,667 3,181 2,742
Offered between 8-14 days 55 4 0 0
Offered in 15 day or more days 67 1 0 0
Percent Compliance 94.4% 99.8% 100.0% 100.0%
Percent Non-Compliance 5.6% 0.2% 0.0% 0.0%
Request for Urgent Services
Q1 Q2 Q3 Q4
Offered within 24 hours 64 60 171 266
Offered in greater than 24 hours 0 0 0 0
Percent Compliance 100.0% 100.0% 100.0% 100.0%
Percent Non-Compliance 0.0% 0.0% 0.0% 0.0%
Emergency Face to Face
Q1 Q2 Q3 Q4
Offered within 1 hour 806 929 1,523 2,134
Greater than 1 hour but less than 2 hours 25 30 54 76
Greater than 2 hours 4 4 42 58
Percent Compliance 96.5% 96.5% 94.1% 94.1%
Percent Non-Compliance 3.5% 3.5% 5.9% 5.9%
Emergency Phone Calls
Q1 Q2 Q3 Q4
Calls made within 15 minutes 5071 10,087 7,043 7,231
Calls made within 16-30 minutes 0 0 2 0
Calls made after 30 minutes 0 0 0 0
Percent Compliance 100.0% 100.0% 99.9% 100.0%
Percent Non-Compliance 0.0% 0.0% 0.1% 0.0%
Results and Analysis – Secret Shopper
From July 2014 to September 2014, BHI was contracted with Market Power to conduct secret
shopper calls to various practitioners/providers within the network. BHI ended the contract with
Market Power mid-September of 2014, as BHI was able to hire an additional full-time staff to
analyze secret shopper calls as well as organize the project to allow member involvement in
making the calls.
BHI enlisted the help of members, recruited from the Drop-in centers at Community Connections
and the Rainbow Center. The purpose of the calls was to monitor knowledge related to access to
care standards, available services for members, and availability of appointments.
One BHI staff listened to the audio recording of each phone call and determined if access to care
(ATC) standards were met when a live person answered the call. BHI also determined if
emergency instructions (such as calling 911 in an emergency) were on the provider’s voicemails.
Table 25 shows the analysis of the calls made during FY15.
During the past fiscal year, this project has not yielded great results. One potential barrier to
conducting secret shopper calls, especially with facilities, is that BHI often requires a pre-
authorization for services. Prior to scheduling an appointment for a member, the facility would
need to obtain the authorization for services, and then be able to provide the member with an
Page 30
BHI Annual Quality Report FY15 29
appointment. Another barrier for the secret shopper calls is related to individual practitioners and
availability of BHI members to participate in the calls. Often during the day and into evening
hours, practitioners are providing services to members and often use their cell phone as a point of
contact at their office location. Because of the nature of secret shopper, BHI members were
unable to leave callback numbers on practitioner voicemails so access to care could not be
assessed properly. In addition, BHI was not able to recruit enough members to participate and
make a large amount of phone calls. BHI is working to redesign the process to be able to monitor
access to care better.
BHI offers new provider orientation quarterly that covers the access to care measures. BHI will
continue to work with all providers regarding secret shopper call results and training on access to
care standards. BHI does not believe that any formal corrective action is necessary for providers
at this time related to secret shopper calls, as there is a very small sample size of answered calls
completed to date and emergency instructions on clinician’s voicemails is not a required element
of access to care.
Table 25: Secret Shopper Call Results
Community Mental Health Centers
Yes No Percentage Yes
ATC Standard Met with Live Call 10 2 83%
Emergency Instructions on Voicemail NA NA NA
Facilities
Yes No Percentage Yes
ATC Standard Met with Live Call 6 7 46%
Emergency Instructions on Voicemail 5 4 55%
Individual Providers
ATC Standard Met with Live Call 3 2 60%
Emergency Instructions on Voicemail 11 6 65%
Results and Analysis – Member Satisfaction with Access to Care
Satisfaction surveys provide BHI with knowledge on member perceptions of well-being,
independence, and functional status as well as perceptions on the scope of services offered,
accessibility to obtain services when needed, availability of appropriate practitioners and services,
and acceptability or “fit” of the practitioner, program, and services in meeting the members’
unique needs and preferences. This feedback helps to modify the service system for actual
utilization patterns and enables member choice. If a pattern is detected or there is a statistically
significant level of concern, BHI requires and/or develops a corrective action plan.
For 2015, BHI conducted a survey to assess member experience with access to care.
The Access to Care questions on the survey specified “In the past 12 months:”
If you had a mental health emergency and you contacted your mental health provider,
were you contacted by someone within 1 hour or told to go to the emergency room/dial
911 for help (this includes clinician voicemails)?
If you had an urgent need to speak with someone about your mental health, called your
clinician, were you contacted by someone within 24 hours of your initial call?
Page 31
BHI Annual Quality Report FY15 30
If you needed to schedule a routine office visit, were you scheduled and seen within 7
business days of your request (this includes walk-in and “open access”)?
The answer choices available were yes, no, and N/A.
The results of this year’s survey are listed below in Table 26. For information regarding sampling
methodology, scoring, and response rates, please reference the section in this report titled:
Member and Family Input into the Quality Improvement Section.
Table 26: Member experience with access to care
Percent that answered “Yes”
FY14 FY15
Emergency 79.13% 71.67%
Urgent 85.07% 82.85%
Routine 86.47% 84.00%
BHI still believes member perception of emergent and urgent care could vary greatly from BHI’s
definition, so it would be important for BHI to continue to educate members on not only
definitions, but also access to care standards. BHI may continue to revise the access to care
questions for next year’s survey and give the specific definition of each appointment type within
the survey.
BHI saw an increase in membership (22%) over the last fiscal year; however, the amount of
providers, including CMHCs, hospitals, and other acute care facilities remained relatively the
same. BHI expected with the addition of the CCC mobile crisis units and walk-in centers that
members could access emergency care more quickly; however the access to care data and
member’s perception indicate members may be waiting longer to receive emergency care. The
longer wait times for care could be attributed specifically to the “mobile” crisis response teams.
The mobile crisis response teams have expanded the coverage area where services are provided,
including various schools, jails, and client homes across the metro area. Previous to the
implementation of the CCC, CMHC staff only completed evaluations at the local emergency
departments.
Results and Analysis – Overall
Based on the results of the monitoring activities in FY15, BHI has determined that members are
able to access needed services within the timeliness standards. While BHI saw a decrease in
access to emergency face-to-face appointments since the implementation of the CCC, the percent
of non-compliance is less than 1%. BHI is continuing to work with the CCC as well as the
CMHCs to ensure date is not duplicated and accurate data is being collected for the emergency
face-to-face measure.
Due to the low amount of secret shopper calls that BHI was able to conduct in FY15, no
conclusions can be made about the results. Knowing this, BHI is working to develop a robust
process to revitalize the monitoring of access to care.
When comparing the number of grievances related to access to care from FY14 to FY15, BHI
determined there was a significant increase. One possible explanation for the increase is the
revision to the grievance process. Another possible explanation for the increase in the number of
Page 32
BHI Annual Quality Report FY15 31
grievances is related to how grievances are being filed by BHI. If a member files a grievance
about two different categories, then BHI counts each category of grievance as a separate
grievance, instead of choosing the first category.
Due to the significant increase in access-to-care related grievances from FY14 to FY15, BHI
Quality Improvement staff reviewed each of the grievances related to access to care to determine
if there were any patterns, trends, or significant issues that were not resolved. The grievances
related to access varied from issues with scheduling a medication management appointment to not
being able to reach the intake department at a facility. The Quality Improvement Department
determined that there were no trends related to grievances involving access to care.
Barrier analysis and planned interventions
Barriers to all of the access to care initiatives are listed below:
1. Member engagement in secret shopper program
2. Number of successfully completed secret shopper calls
3. Potential duplicative data from the CCC and CMHCs related to the emergency face-to-
face measure
4. Increase in locations and areas covered by the mobile crisis response teams
5. On-going staff turn-over and staffing issues
BHI will continue to monitor access to care standards via the quarterly access to care report,
member experience, and grievances. BHI will implement the following interventions for FY16 to
continue to improve member access to care:
1. Redesign the provider monitoring of access to care standards via phone calls. BHI will
increase the number of providers who are contacted about appointment availability.
Interventions may also be implemented with providers on an on-going basis.
2. BHI will continue to partner with the CCC and CMHCs to align data collection efforts to
more accurately capture emergency face-to-face appointment wait times.
3. Educate providers on access to care standards. BHI will also educate providers on how to
refer members back to BHI if access to care standards cannot be met.
4. Continue to educate members about definitions of routine, urgent, and emergent
appointments and the associated standards.
5. BHI may re-design the member experience survey questions to better assess access to care
6. If a trend is identified with grievances related to access to care, the Quality Department
will work with the Office of Member and Family Affairs to create interventions as needed.
Page 33
BHI Annual Quality Report FY15 32
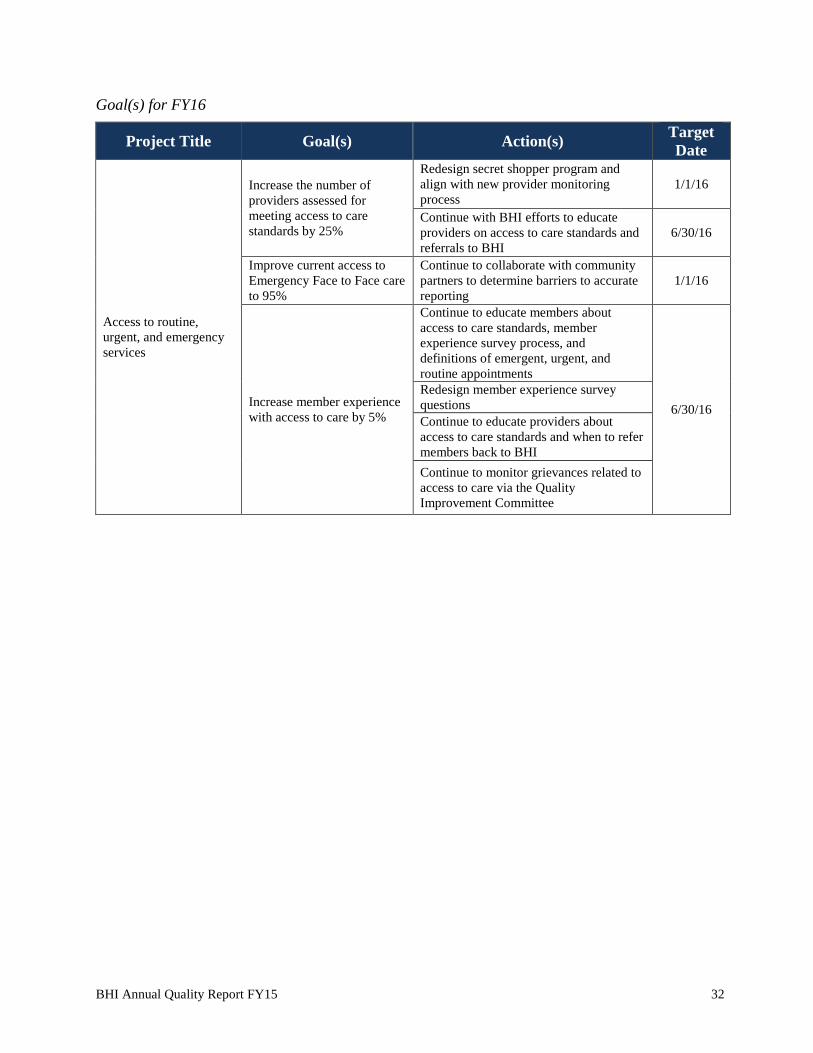
Goal(s) for FY16
Project Title Goal(s) Action(s) Target
Date
Access to routine,
urgent, and emergency
services
Increase the number of
providers assessed for
meeting access to care
standards by 25%
Redesign secret shopper program and
align with new provider monitoring
process
1/1/16
Continue with BHI efforts to educate
providers on access to care standards and
referrals to BHI 6/30/16
Improve current access to
Emergency Face to Face care
to 95%
Continue to collaborate with community
partners to determine barriers to accurate
reporting
1/1/16
Increase member experience
with access to care by 5%
Continue to educate members about
access to care standards, member
experience survey process, and
definitions of emergent, urgent, and
routine appointments
6/30/16
Redesign member experience survey
questions
Continue to educate providers about
access to care standards and when to refer
members back to BHI
Continue to monitor grievances related to
access to care via the Quality
Improvement Committee
Page 34
BHI Annual Quality Report FY15 33
Access to Medication Evaluations
Summary of project – Quality of Services
Medication evaluations are comprehensive assessments completed by psychiatric prescribers in
order to assist in diagnosis development and begin any necessary medication regimens that
complement the other therapeutic services the member may be receiving. It is crucial to offer
members medication evaluations in a timely manner in order to facilitate effective treatment.
Many members cannot fully benefit from other therapeutic services until their symptoms
(particularly acute) are addressed.
Goal from FY15
Project Title Goal(s) Action(s) Target
Date
Access to medication
evaluations
Improve compliance with
30-day standard to 90%
Assist providers in barrier analyses to
identify opportunities to improve access
to medication evaluations.
6/30/15
Results and analysis
Figure 3 shows the percent of members offered a medication evaluation within 30 days of the
request for a medication evaluation. BHI set a performance standard of 90% compliance on this
measure based on a pervious focused study. Any performance under the 90% standard requires a
CAP from the CMHC. Figure 3 demonstrates overall BHI performance with this standard.
Figure 3: Overall performance on access to medication evaluations indicator
65%
70%
75%
80%
85%
90%
95%
FY13 FY14 FY15
Access to Medication Evaluations
Adults Children
benchmark
Page 35
BHI Annual Quality Report FY15 34
Barrier analysis and planned interventions
BHI saw an overall performance decrease for access to medication evaluations for both children
and adults during FY15; however, BHI’s also saw a 60% increase for requested medication
evaluations for adults and 1.5% for children. BHI’s FY15 goals for this project were not met.
Some improvement in the measure was noted throughout the year and this has been accomplished
through recruitment and hiring of additional prescribers at the CMHC level. Another barrier
identified that training needs to be completed for some staff that are entering the data as well as
scheduling the medication appointments.
One of BHI’s CMHCs implemented an "Open Access" program on June 1, 2015 after researching
best practice options to reduce appointment wait times and to maximize provider availability for
medication appointments. To accommodate this new program, the CMHC hired eight new
psychiatrists and already showed improvement to 100% compliance with the standard in June of
2015 and no-show rates have decreased as well.
Another CMHC has been meeting the goal of 90% for the last few quarters. They have new front
desk staff that are organizing the medication evaluation appointments and the process is working
much better. There is a process to offer the member medication evaluation at the location of
his/her choice; however, other locations may have a sooner appointment time and that time is
offered to the member as well.
BHI is expecting to see remarkable improvement in this measure in the next fiscal year due to the
changes the CMHCs and other providers have implemented. BHI will continue to monitor this
measure quarterly and discuss interventions through the PEO Committee. BHI will also continue
to recruit prescribers outside of the CMHCs to provide medication evaluations to members in
order to meet the increased demand.
Goal(s) for FY16
Continue to monitor access to medication evaluations and require corrective action for any
provider who falls below the 90% benchmark.
Project Title Goal(s) Action(s) Target
Date
Access to medication
evaluations
Improve compliance with
30-day standard for children
and adults to 90%
Continue to monitor access to medication
evaluations on a quarterly basis and
discuss results and potential interventions
in the Program Evaluation and Outcomes
Committee as needed.
6/30/16
Page 36
BHI Annual Quality Report FY15 35
Focal Point of Behavioral Health for SMI Population
Summary of project – Quality of Services
BHI monitors the BHO-HCPF Annual Performance Measure data to identify opportunities for
improvement. One such indicator measures the percent of adult members with severe mental
illness (SMI) who have a focal point of behavioral health care identified (three or more behavioral
health services or two or more prescriber services in a 12 month period). Note that FY14
performance measures are included in this report as they are calculated in November, after the
previous annual quality report has been published.
Goal from FY15
Project Title Goal(s) Action(s) Target
Date
Focal point of behavioral
health services
Continue to perform at or
above the statewide average
for this performance
indicator.
Continue to monitor clients’ accessibility
to services 6/30/15
Results
In FY14, 84.78% of BHI members with SMI had a focal point of behavioral health. The weighted
average of all Colorado BHOs was 87.61%. BHI performed lower than the state average for
FY14, however, it was decided between HCPF and the Colorado BHOs that this measure would
not be reported for FY15. BHI intends to measure focal point of behavioral health in line with the
Colorado C-Stat measures for FY15, as BHI can collect data from the CMHCs.
Figure 4: Focal point of behavioral healthcare within SMI population
79%
81%
83%
85%
87%
89%
91%
93%
95%
FY12 FY13 FY14
Focal Point of Behavioral Health
Page 37
BHI Annual Quality Report FY15 36
Section 6: Compliance Monitoring
External Quality Review Organization Audit (EQRO Audit)
Summary of Project
BHI underwent the eleventh EQRO audit and site visit in FY15. HSAG focused review on four
standards: Member Information, Grievance System, Provider Participation and Program Integrity,
and Subcontracts and Delegation. Compliance with federal regulations and contract requirements
was evaluated through review of these four standards.
Goal from FY15
Project Title Goal(s) Action(s) Target
Date
External Quality Review
Organization (EQRO)
audit
Continue to score at or above
the previous year’s
performance
Coordinate with HSAG (Health Services
Advisory Group) to comply with review
activities conducted in accordance with
federal EQR regulations 42 C.F.R. Part
438 and the CMS mandatory activity
protocols
6/30/15
Results and analysis
Table 27 below represents the score in each category for BHI.
Table 27: FY15 EQRO audit results
Standard Number of
Elements
Number of
Applicable
Elements
Number
Met
Number
Partially
Met
Number
Not Met
Score
Member Information 20 20 19 1 0 95%
Grievance System 26 26 19 7 0 73%
Provider Participation and Program
Integrity 14 14 12 2 0 86%
Subcontracts and Delegation 6 6 6 0 0 100%
Totals 66 66 56 10 0 85%
BHI’s strongest performance was in Subcontracts and Delegation and Member Information,
which earned a compliance score of 100% and 95% respectively. HSAG identified ten required
actions throughout the entire tool. The ten required actions focused on revision of policies and
procedures for consistency, further development of provider monitoring, and enhancement of
Fraud, Waste, and Abuse identification practices and tools. With an FY14 score of 87%, BHI did
not meet the goal of performing at or better than the previous year’s score.
BHI’s strengths included:
A well-organized Member and Family Handbook to assist members in understanding the
behavioral health managed care program.
Well defined policy and procedure for responding to grievances and appeals
Robust oversight of delegated functions and improvement activities
Page 38
BHI Annual Quality Report FY15 37
Barrier analysis and planned interventions
The corrective action plan prompted BHI to thoroughly review and develop an ongoing provider
monitoring plan as well as further develop the provider claims auditing process. BHI trained all
staff on corporate compliance procedures and gave examples of how to identify upcoding,
unbundling of services, and services that were never rendered. BHI is confident that with new,
clarified policies and procedures that performance on these standards will be fully compliant in
future reviews.
Goal(s) for FY16
Project Title Goal(s) Action(s) Target
Date
External Quality Review
Organization (EQRO)
audit
Continue to score at or above
the previous year’s
performance
Coordinate with HSAG (Health Services
Advisory Group) to comply with review
activities conducted in accordance with
federal EQR regulations 42 C.F.R. Part
438 and the CMS mandatory activity
protocols
6/30/16
Page 39
BHI Annual Quality Report FY15 38
Delegation Oversight
Summary of project
BHI conducts annual evaluations of each of its delegates and the various functions for which each
delegate is responsible. These evaluations require the delegates to submit evidence of compliance
for each delegated function, including policies, reports, trainings, etc.
Goal from FY15
Project Title Goal(s) Action(s) Target
Date
Delegation Oversight
Oversee the quality of
activities delegated to any
subcontractor
Continue to monitor the activities
delegated to Colorado Access as our
Administrative Service Organization
through Delegation Oversight Audits
6/30/15
Results
BHI conducted the delegation audit of Colorado Access (COA) in January 2015. The results of
the delegation audit, including a credentialing file review, are listed below. Colorado Access
completed a Corrective Action Plan to address any areas scoring less than full compliance,
including policy and procedure revisions, training, and additional reporting requirements. BHI
considers both goals related to delegation oversight to be met.
Table 28: COA Credentialing delegation oversight results
Standard # Standard Name
Possible
Pts
Pts Scored
by
Delegate
% of
Pts
Scored
Weighted
Pts
Weighted
Pts
Earned
CR 1 Credentialing Policies 9 9 100% 0.50 0.50
CR 2 Credentialing Committee 9 9 100% 0.30 0.30
CR 3 Initial Credentialing Verification 20 20 100% 1.10 1.10
CR 4 Application and Attestation 10 10 100% 0.35 0.35
CR 5 Initial Sanction Information 10 10 100% 0.75 0.75
CR 6 Practitioner Office Site Quality (NA) 8 8 100% 1.20 1.20
CR 7 Recredentialing Verification 38 38 100% 1.65 1.65
CR 8 Recredentialing Cycle Length 10 10 100% 0.35 0.35
CR 9 Ongoing Monitoring 10 10 100% 1.40 1.40
CR 10 Notification to Authorities and
Practitioner Appeal Rights 8 8 100% 0.40 0.40
CR 12 Delegation of Credentialing NA NA NA NA NA
Total 132 132 0% 8.00 8.00
Page 40
BHI Annual Quality Report FY15 39
Table 29: COA Administrative Service/Delegation Agreement oversight results
Barrier analysis and planned interventions
During delegation oversight process in the past three years, BHI has identified opportunities for
improvement in the administrative service and delegation agreements. BHI continues
collaborating with Colorado Access to revise and clarify this document in order to improve the
delegation oversight process and to meet NCQA standards.
Goal(s) for FY16
Project Title Goal(s) Action(s) Target
Date
Delegation Oversight
Oversee the quality of
activities delegated to any
subcontractor
Continue to monitor the activities
delegated to Colorado Access as our
Administrative Service Organization
through Delegation Oversight Audits
6/30/16
Function Possible
Points
COA Score
Administrative Duties
A. Establish and Maintain a system of data integrity processes 2 1
B. Maintain the integrity and security of all data 2 2
C. Maintain back up files of all BHI data 2 2
D. Establish and maintain and system of quality assurance 2 1
I. Claims and Encounter Processing and Adjudication
1A. Processing all claims and encounter data 2 0
1B. Necessary system configuration /modifications 2 2
1C. Processing of all claims adjustments 2 2
1D. Preparation of encounter and claims data for submission to HCPF 2 2
1E. Preparation of any additional or modified reports 2 2
II. Decision Support and Required Reporting
2A. Submission of monthly, quarterly and annual reports 2 2
2B. All reports shall be submitted to BHI for review/approval 2 2
2C. The list of reports is subject to revision 2 2
III. Tactical Reports
3A. Preparation of various operational, financial, and quality reports 2 2
IV. Network Development and Provider Relations
4A. Claims Support 2 2
4B. Contracting/Credentialing (see next page) 2 2
V. Clinical/Care Management Services
5A. Three FTE Care Managers 2 2
VI. Eligibility and Database Services
6A. Loading of eligibility data 2 2
6B. Preparation of mailing labels for new client mailing 2 2
6C. Preparation of mailing labels for annual member mailing 2 2
Totals (38 points total)
Total Points scored 38 34
Overall Percentage 89.5%
Page 41
BHI Annual Quality Report FY15 40
Encounter Data Validation Audit (411 Audit)
Summary of project
Three service program categories were selected by the Department of Health Care Policy and
Financing (HCPF) for review in this year’s audit. The categories are outlined as follows:
137 encounters from prevention/early intervention services (Service Category “HT”)
137 encounters from club house or drop-in center services (Service Category “HB”)
137 encounters from residential services (Service Category “SC” or “HE”)
BHI used the 411 sample to identify lists of encounters/claims by provider. BHI communicated
with the QI Directors for the various providers during meetings as well as via phone and email
about the records being requested. Providers in the CPN were mailed a letter requesting the
appropriate records.
Each CMHC provided remote access to their electronic health records for the review. The
remaining providers submitted records via fax or delivery of paper records.
To create the audit tool, BHI modified the Excel spreadsheet containing the 411 sample to include
columns for auditor comments next to each required field for the audit. BHI used numbers to code
the results of each audit field, per Appendix II of the Annual BHO Encounter Data Quality
Review Guidelines (1 = compliance, 0 = non-compliance). If a field was found to be non-
compliant, the auditor indicated the reason for non-compliance in the adjoining comment box.
The audit tool was tested and validated during the inter-rater reliability session with all auditors.
The auditors were instructed to make sure that all assigned fields were completed for each
encounter they audited before they closed the medical record. Each auditor found the tool both
simple and efficient to use during the audit process.
Four auditors conducted the encounter validation. Two auditors had prior experience with the
Encounter Data Validation audit and extensive experience in behavioral health, maintaining, and
reviewing clinical records. Prior to any records being reviewed, training was conducted by the
lead auditor and covered the following topics:
The Annual BHO Encounter Data Quality Review Guidelines
Scoring criteria for the various audit fields
Review of the Uniform Service Coding Standards Manual (including the transition from
the 2013 manual to the 2014 manual); both the 2013 and 2014 versions of the USCS
manual were used depending on the date of service
Navigating each of the EMR systems and where to locate the necessary information
The four auditors included:
Lindsay Cowee, LPC, CACII (Manager of Quality Improvement, lead auditor)
Jessie Nelson, LPC, (QI Project Manager)
Travis Rosen, MPH (QI Project Manager)
Ann Winters, (Compliance Monitoring Specialist)
Page 42
BHI Annual Quality Report FY15 41
BHI provided three-hour training for the auditors. Five records were used as practice records.
Auditors were given specific instructions for each EMR, including where to locate the necessary
information within the EMR. Both hands-on training and hardcopies of instructions for EMR
access were provided. During the practice session, auditors rated the records and had an open
discussion on any issues with abstraction. Following the practice session, an inter-rater reliability
study was conducted on 10 records. The records were projected on a screen and all auditors
scored the various elements for each record individually with no discussion. An inter-rater
reliability analysis summarized the results and provided kappa scores for each of the auditors. An
inter-rater reliability analysis yielded a 94.1% agreement (with kappa = 0.772), which is
considered “substantial agreement.”
BHI conducted most of the audits in a group format. Any problematic records were reviewed by
more than one person. The teams arrived at audit results after discussion and reference to the
Uniform Service Coding Standards (USCS) manual and the Diagnostic and Statistical Manual
(DSM-IV). Several checks were conducted in the data analysis process that also acted as internal
over read.
The audit tool was used to verify the accuracy and completeness of auditor abstraction. Pivot
tables were created to analyze the results for the required fields and overall audit performance. QI
auditors verified all required fields based on auditor comments. Any missing information was
gathered from the medical records and consultation with clinicians and administrators. Data
analysis was conducted using the complete and accurate file.
Goals from FY15
Project Title Goal(s) Action(s) Target
Date
Encounter Data
Validation (411) Audit
Improve provider claims
review to a compliance score
of 90% or higher
Continuing to train providers on proper
billing and documentation practices 6/30/15
Maintain or improve inter-
rater reliability with HSAG
Continuing to train audit team on the
USCS Manual
Results and analysis
The tables below list the elements that were scored for each encounter and a breakdown of audit
score by program service category. Because the review period included dates of service from
before the corrective actions from the CY13 review was completed, BHI felt it essential to
calculate compliance rates for CY14 overall, and for CY14 dates that occurred after corrective
action was implemented (titled CY14 post-CAP). The results for CY14 overall and CY14 Post-
CAP are listed below.
Page 43
BHI Annual Quality Report FY15 42
Table 30: Audit scores by program service category
Program Service Category Comparison
CY11 CY12 CY13
CY13 post-
CAP CY14
CY14 post-
CAP
Overall - all categories 79% 74% 79% 90% 83% 86%
PEI Services n/a 77% 84% 89% 87% 91%
Drop-In Center Services n/a 56% 58% n/a 78% 81%
Residential Services n/a n/a n/a n/a 84% n/a
Table 31: Audit scores across all providers and program service categories
BHI Overall - All Services
All Dates of Service Post-CAP Dates of Service
Claims paid 10/1/13-9/30/14 5/1/14-9/30/14
Field Descriptor Records
Accurate
Records
Audited
%
Records
Accurate
Weight Weighted
Score
Records
Accurate
Records
Audited
%
Records
Accurate
Weight Weighted
Score
Diagnosis Code 381 411 93% 5% 5% 83 83 100% 5% 5%
Start Date 410 411 100% 5% 5% 83 83 100% 5% 5%
End Date 410 411 100% 5% 5% 83 83 100% 5% 5%
Procedure Code 363 411 88% 15% 13% 67 83 81% 15% 12%
Place of Service 253 411 62% 10% 6% 59 83 71% 10% 7%
Service Program Category 352 411 86% 10% 9% 81 83 98% 10% 10%
Duration 407 411 99% 15% 15% 83 83 100% 15% 15%
Units 269 411 65% 15% 10% 42 83 51% 15% 8%
Population 409 411 100% 5% 5% 83 83 100% 5% 5%
Mode 400 411 97% 5% 5% 78 83 94% 5% 5%
Staff Requirement 248 411 60% 10% 6% 47 83 57% 10% 6%
Overall Compliance 3902 411 86% 100% 83% 789 913 86% 100% 86%
BHI did not meet the goal of 90% compliance score for providers for the overall 411 audit results.
Overall services categories, the compliance score was 83% for CY14 and post-CAP CY14 scores
were at 86%. BHI saw an increase in compliance with PEI services as well as drop-in center
services. It is likely that BHI’s scores decreased overall post-CAP in CY14 because of the review
of residential claims. These claims have not been previously included in the 411 Audit and
resulted in an 84% compliance score.
Each year, HSAG pulls a random sample of claims to perform an over-read audit in order to
check the accuracy of audit methodology of the behavioral health organizations. This provides
BHI with inter-rater reliability scores between our internal audit team and the state’s external
quality review organization. The below table reflects the combined scores for all BHOs on the
over-read audit and the individual scores for BHI. BHI scored a 100% in the majority of
categories. These scores reflect a commitment by BHI to provide thorough and comprehensive
audits on a continuous basis. The QI Department strives to be consistent in their audits and the
scores below reflect a very high inter-rater reliability between the BHI audit team and HSAG, an
Page 44
BHI Annual Quality Report FY15 43
accomplishment that has been found to be very helpful to our individual providers during the
audit feedback and corrective action process. Table 32 below shows BHI performance on the
over-read audit results as compared to the statewide BHO average.
Table 32: BHI 411 over-read results
All Claims PEI Drop- In Center Residential
All BHOs BHI All
BHOs
BHI All
BHOs
BHI All BHOs BHI
Overall 97.1% -- 98.0% -- 97.5% -- 96.0% --
Procedure Code 97.9% 96.7% 98.0% 100% 100% 100% 96.0% 90%
Service Category 99.3% 100% 100% 100% 100% 100% 98.0% 100% Diagnosis 100% 100% 100% 100% 100% 100% 100% 100% POS 100% 100% 100% 100% 100% 100% 100% 100% Units 99.3% 100% 100% 100% 97.5% 100% 100% 100% Start Date 100% 100% 100% 100% 100% 100% 100% 100% End Date 100% 100% 100% 100% 100% 100% 100% 100% Population 100% 100% 100% 100% 100% 100% 100% 100% Duration 100% 100% 100% 100% 100% 100% 100% 100% Mode of Delivery 100% 100% 100% 100% 100% 100% 100% 100% Minimum Staff Req. 96.4% 93.3% 98.0% 100% 95.0% 90% 96.0% 90%
BHI did maintain inter-rater reliability with HSAG from the CY13 over-read records to the CY14
over-read records.
Barrier analysis and interventions
As previously mentioned, the number of the claims selected for review by HCPF occurred prior to
the implementation of corrective action from the previous year’s audit as claims were selected by
paid date and not date of service.
Similarly, as a response to the CY11 audit, BHI implemented a new system for tracking member
encounters at each of our drop in centers, Patient Tools. This program was not fully implemented
until the summer of 2013, and as encounters are selected by date claim was submitted, rather than
date of service. However, the overall score did increase for the drop-in center services from CY13
(58%) to CY14 (78%). BHI continues to work with the drop-in centers on documentation
guidelines and training new staff on requirements.
Three providers with an overall score below 95% were required to submit a Corrective Action
Plan (CAP) addressing any deficiencies discovered during the audit. Each provider was given
specific feedback on resolving issues such as system errors, clinical errors, or errors related to the
USCS Manual. To address areas of deficiency, providers implemented corrective actions such as:
Training with staff regarding proper definition and billing of various Prevention/Early
Intervention codes
Configuring EMRs to correctly calculate units for encounter codes
Including staff credentials on all service templates in the EMR
One provider that scored deficiencies related to system programming submitted appropriate
documentation to reflect corrections are in place. The remainder of provider claims was such a
Page 45
BHI Annual Quality Report FY15 44
small number that they did not give reasonable representation of their practices. A letter was sent
to each provider with scores to address deficient elements.
Goal(s) for FY16
Project Title Goal(s) Action(s) Target
Date
Encounter Data
Validation (411) Audit
Increase provider overall
compliance score to 90% or
higher
Continuing to train providers on proper
billing and documentation practices no
less than quarterly 6/30/16
Maintain or improve inter-
rater reliability with HSAG
Continuing to train audit team on the
USCS Manual
Page 46
BHI Annual Quality Report FY15 45
Provider Audits
Summary of project
BHI utilizes an audit tool that combines several different elements, including claims and billing
validation (with elements similar to the 411 audit), treatment plan requirements, and requirements
for the full clinical records (such as releases of information, disclosure forms, components of an
intake, etc.).
An audit is conducted to examine the quality and appropriateness of medically necessary services
delivered to members, whether the services were billed accurately and supported through
documentation in the medical records. The audit process is designed to identify a provider’s
compliance with applicable BHI, state and/or federal regulations governing the healthcare
program and payment to the provider.
Providers are typically selected for audit using one or more of the following criteria: high volume
of services provided, high cost services provided, new providers, as required for state and/or
federal regulations, member inquiry or complaint, internal staff inquiry, and random selection.
In November of FY15, BHI added one staff member to allow for additional auditing functions.
The additional auditor continued to refine the audit process and completed audits with six
providers (three follow up audits, two initial audits and one service specific audit). The volume of
records for the two initial audits is a statistically valid sample. Upon completion of the audit, BHI
schedules a face-to-face meeting with the provider to discuss results, including areas of strength,
suggestions for improvement and required actions (for providers who score less than 90%). The
required actions can include completing a CAP, completing specific trainings on the deficit’s
identified through the audit, and possibly repayment of claims previously paid. Each provider is
offered a training that is facilitated by BHI staff. Providers who score between 80-90% are given
tools to self-monitor their clinical records and encounter submissions. Providers who score less
than 80% complete a re-audit with BHI between 3-6 months after CAP implementation in order to
formally monitor the effectiveness of their corrective action.
Goals from FY15
Project Title Goal(s) Action(s) Target
Date
Provider claim/record
audits
Improve provider
documentation and reduce
incidence of waste and abuse
in billing practices
Implement quarterly clinical
documentation trainings 6/30/15
Initiate a minimum of 10 provider audits
Results and analysis
BHI trained over 100 providers and completed the documentation training with four facilities
within the past fiscal year. Due to the success of the audit process, BHI considers the objective of
implementing quarterly trainings to be met. BHI providers have been very responsive to the audit
process. Providers appreciate the training being provided by BHI as a part of the corrective action
process (often requiring entire clinical staff to attend), and having a QI contact within BHI for
questions about coding and documentation. Several providers have revamped various templates,
including progress note templates and treatment plan templates in order to meet compliance and
prompt clinicians to meet all documentation standards.
Page 47
BHI Annual Quality Report FY15 46
As staff was added later than October 2014, as originally planned, and training requirements, the
goal for 10 provider audits was not met. Several patterns have emerged across provider
compliance with these audits, particularly around minimum documentation. Clinicians most often
struggle with citing the therapeutic interventions being utilized in the session, directly linking the
service to the treatment plan, and specifically documenting process (or lack thereof) towards the
specific treatment goals.
Table 33 demonstrates the various scores from provider audits.
Table 33: BHI provider audit results
Provider
Initial
Audit
Score
Follow
up
Audit
Score
Status
A 47% 89% Provider upgraded EHR after re-audit, all CAP requirements met
B 44% 18% Initial CAP requirements met. No indication corrections made with re-
audit. Additional audit scheduled for Dec. 2015.
C 47% 52%
Pending CAP submittal based on follow-up audit results. Provider will
be required to self-monitor and a follow-up audit will be completed in 3-
6 months of original audit date.
D 44% *
Pending CAP submittal for initial audit. Provider will be required to self-
monitor and a follow-up audit will be completed in 3-6 months of
original audit date.
E 85% *
Pending CAP submittal for initial audit. Provider will be required to self-
monitor and a follow-up audit will be completed in 3-6 months of
original audit date. F 64% * re-audit scheduled for Oct. 2015
* Follow up audit not yet conducted
Barrier analysis and planned interventions
One barrier to meeting the goal of auditing 10 providers between FY14 and FY15 is related to
staffing issues. BHI planned to hire a Compliance Monitoring Specialist at the beginning of
FY15; however, one was not hired until November. Shortly after the Compliance Monitoring
Specialist hire date, BHI began preparing for the annual encounter validation audit (411 audit)
that continues through the end of March. Provider audits were not conducted on a regular basis
until after the annual audit was completed.
An audit plan was developed to help aid the process of provider auditing. In response to the
EQRO audit, BHI continued to refine the provider monitoring process further. The plan was
developed in order to have structured guidelines for selection of service category and provider for
review. The FY16 audit plan used CY14 data to determine which service categories to review. A
minimum of 10 providers will be randomly selected for auditing/monitoring. Under the
circumstances where there are less than 10 providers per service category, all providers will be
audited. The audits will include a sample of claims reviewed for validation, a sample of full chart
audits reviewed for quality, and an office-site evaluation tool.
Since the provider-monitoring plan in more detailed and in-depth than previous years, BHI
determined that two additional staff were needed. An additional Compliance Monitoring
Specialist will be hired under the Compliance Department and a Provider Quality Monitoring
Specialist will be hired under the Quality Improvement Department. Specifically, the Provider
Quality Monitoring Specialist will conduct the quality of care reviews (based on the full chart
Page 48
BHI Annual Quality Report FY15 47
audits) and the office site evaluation form. Based on the results of the provider monitoring, a
more in depth audit of full charts and/or claims validation auditing can occur.
The FY16 Provider Monitoring Plan includes the following service categories:
Q1: In-home providers; Outpatient providers
Q2: Inpatient services
Q3: Annual Encounter Validation Audit (411)
Q4: Substance Use Disorder (SUD) Organizations/Facilities
In addition, BHI continues to schedule at a minimum, quarterly documentation training that is
open for all providers to attend. Documentation training currently available include, routine
outpatient services, higher levels of care that comprise of day treatment, residential, and intensive
in-home services and outpatient services. In addition, service specific training in SUD is
available.
Providers can request supplementary trainings based on their needs. BHI has been conducting
these trainings individually to providers as the result of an audit or upon provider request.
Providers have responded positively to these trainings, and other providers are requesting
trainings for their agencies. Therefore, BHI will continue to offer regular clinical documentation
trainings to meet this demand.
Goal(s) for FY16
Project Title Goal(s) Action(s) Target
Date
Provider claim/record
audits
Increase volume of provider
audits completed to at least
30 per year
Initiate a minimum of 10 provider audits
per service category according to the
FY16 audit plan. 6/30/16
Hire two additional staff
Hire additional compliance monitoring
specialist and provider quality monitoring
specialist.
Documentation training
Provide training to meet
provider needs
Develop additional service specific
trainings to meet provider needs. 6/30/16
Train at least 100 individual
outpatient providers
Continue to provide quarterly routine
outpatient documentation trainings
Page 49
BHI Annual Quality Report FY15 48
Section 7: Performance Measures
BHI believes that to provide truly excellent behavioral health services, programs should go
beyond basic quality assurance. BHI strives to use data continually, to improve services, and
develop innovative solutions where traditional methods have failed. Note that all performance
measures are being reported for FY14, as FY15 performance measures will not be calculated until
fall of 2015.
Reducing Over- and Under-Utilization of Services
Summary of project – Quality and Safety of Clinical Care
BHI utilizes a very skilled UM department whose focal point is to authorize the medical
necessary appropriate level of care, in the least restrictive environment. BHI is able to achieve
these outcomes by utilizing a UM department that actively manages the members admitted to
inpatient hospitals. The UM Department also has a close relationship with the CMHC and CPN
providers. This relationship allows the UM team to identify an outpatient service provider that
will be the best fit for our members’ unique behavioral health needs. The UM team also keeps
records on frequent ED utilizers. Becoming familiar with our members who are high utilizers in
the ED allows BHI to connect that member with the most appropriate outpatient provider.
The Office of Member and Family Affairs (OMFA) also provides programming to reduce
member’s ED utilization and inpatient hospital stays. Through initiatives like the peer specialist
program and the Drop-in centers, OMFA is able to provide members with support, education,
outreach, advocacy, and basic needs. These services help members reduce their need for
hospitalization or the utilization of an ED. Drop-in centers provide a safe place where members
can get their daily needs met, which reduces stress that can often times exacerbate a mental
illness. The peer support program provided is crucial to many members living with a severe
mental illness. Peer specialists understand the experience of being admitted to the hospital or
utilizing an ED to cope with severe symptoms. With those experiences in mind, the peer
specialists can empathize with the member and relate with real life solutions that can help the
member avoid over utilization of EDs and/or inpatient hospital stays. Peer specialists are crucial
in addressing concerns of our members that are the impetus for ED use and hospital stays.
Goals from FY15
Project Title Goal(s) Action(s) Target
Date
Monitoring over- and
under-utilization
Continue to perform at or
above the statewide BHO
average for cost-of-care
performance measures.
Continue to measure performance
indicators quarterly to monitor for
patterns and trends across services 6/30/15
Continue to monitor specific member
utilization for targeted interventions
Page 50
BHI Annual Quality Report FY15 49
Results and analysis – Hospital Readmissions
BHI calculates the proportion of member discharges from a hospital episode and those members
who are readmitted for another hospital episode within 7, 30, 90 days. This measure is calculated
by HEDIS age group and by hospital type (non-state hospital and all hospital). Figure 4 shows the
percentage of members who were readmitted to a hospital within 7, 30, and 90 days of discharge
from another hospital stay. In FY14, BHI actually increased recidivism in each of the three
timeframes; however BHI remained below the state average for both 30 days (9.61%) and 90 days
(15.98%). Therefore, BHI considers this objective to be partly met.
Figure 5: Hospital recidivism rates
0%
2%
4%
6%
8%
10%
12%
14%
16%
18%
20%
FY11 FY12 FY13 FY14
State & Non-State Hospital Recividism Rates
Total Population 7 days Total Population 30 days Total Population 90 days
Page 51
BHI Annual Quality Report FY15 50
Results and analysis – Length of Stay
This indicator measures the average length of stay (ALOS, in days) for BHO members discharged
from a hospital (non-state and state hospital) episode by age group and total population. For
members transferred from one hospital to another within 24 hours, total length of stay for both
hospitals is attributed to the hospital with the final discharge. For final discharges from a State
hospital, all days in the hospital episode will be included if the member was Medicaid eligible at
the time of admission. Because inpatient stays in state hospitals tend to be disproportionately
longer than those of non-state hospitals, Figure 5 shows the average length of stay for all hospitals
(both state and non-state) as well as the average length of stay for non-state hospitals alone.
Although BHI demonstrated a slight increase in ALOS for all hospitals in FY14, the ALOS
reduced for non-state hospitals and remained below the state average for both non-state hospitals
(8.15) and all hospitals (14.24). Therefore, BHI considers this objective to be met.
Figure 6: Average length of stay
0
2
4
6
8
10
12
14
16
FY11 FY12 FY13 FY14
Num
ber
of
Day
s
Average Length of Stay
Total Population - Non-State Hospital Total Population - All Hospital
Page 52
BHI Annual Quality Report FY15 51
Results and analysis - Inpatient Utilization
This indicator measures the total number of BHI member discharges from a hospital episode for
treatment of a covered mental health disorder per 1,000 members. The UM department continues
to build relationships with providers at all levels of care and BHI has increased the utilization of
other sub-acute levels of care. As demonstrated in Figure 7, inpatient utilization increased for
FY14, however, BHI remains below the state average for non-state hospitals (4.37) and for all
hospitals (5.08). BHI also has the lowest utilization amongst all the Colorado behavioral health
organizations; therefore, BHI considers this objective to be met.
Figure 7: Inpatient utilization
Results and analysis – ED Utilization
This indicator measures the number of BHO member emergency room visits for a covered mental
health disorder per 1,000 members by age group and overall for the specified fiscal year. BHI’s
ED utilization rate was higher than the statewide BHO average rate (10.92) and therefore, BHI
considers its goal not met.
BHI saw a decrease in the total population rate of ED utilization. The rate increased for children
and adolescents and decreased for adults and older adults in FY14. BHI will consider
interventions for these specific ages group if utilization continues to increase. BHI is monitoring
ED use on a monthly basis in the QIC and sharing the analysis and interventions with the
Performance Improvement Advisory Committee (PIAC). BHI is expecting that ED Utilization
will decrease in the coming years due to the implementation of the CCC programs.
0.0
0.5
1.0
1.5
2.0
2.5
3.0
3.5
4.0
4.5
5.0
FY11 FY12 FY13 FY14
Inpatient Utilization (per 1000 members)
Total Population - Non-State Hospital Total Population - All Hospital
Page 53
BHI Annual Quality Report FY15 52
BHI understands that the ED utilization rate for adolescents has increased in the past three fiscal
years. Many of the Colorado BHO’s show an increase in adolescent utilization as well as total
population ED utilization. One explanation for the increased utilization among adolescents this
year is that the rate of adolescent eligible continued to increase. Many of these individuals new to
the behavioral health system may be using the EDs for entry into mental health services, and now
substance use services. Potential outreach and education services can be planned to target
adolescents via school district to prevent and lower ED use among this age group.
Figure 8: ED utilization rates by age category
Barrier analysis and planned interventions – All measures
In an effort to obtain more timely data and see more timely effects of interventions, BHI measures
each of these indicators on a quarterly basis for reporting in the Quarterly Performance Report
Card. These measures are also included in the monthly UM Report, that is reviewed by senior
leadership, Director and Manager of UM, and the QIC.
BHI has planned and implemented several interventions due to the increase in readmission rates,
inpatient utilization, and ED utilization. Several of these interventions are also targeted to increase
the rate of follow-up after hospital discharge within 7 and 30 days. The following are a list of
implemented interventions:
1. If a member readmits to the hospital within 30 day of a previous discharge and the
member is currently receiving services via the CMHCs within BHI’s catchment area, the
hospital liaison for that CMHC is contacted by the UM acute care team at BHI to plan
some targeted wrap-around services for that member. If the member is not currently being
0.0
5.0
10.0
15.0
20.0
25.0
30.0
FY11 FY12 FY13 FY14
Emergency Department Utilization Rate
(per 1000 members)
Total Population Children (0-12) Adolescents (13-17)
Adults (18-64) Older Adults (65+)
Page 54
BHI Annual Quality Report FY15 53
seen by the CMHC, the member is automatically referred to the Care Management team
by the hospital liaison and the BHI UM acute care team.
2. If a BHI member presents at the ED for evaluation for admission to inpatient services, the
UM acute care team notifies the member’s Care Manager, if the member is currently
enrolled in the Care Management program prior to authorizing an inpatient stay.
3. BHI has continued to develop and refine its hospital liaison program. This refining
process has led to better communication, including monthly meetings at the BHI offices
to discuss cases, interventions, and program planning.
4. BHI continues to address the ‘big-picture’ system issues that are direct result of increased
need for behavioral health services. BHI continually discusses, via the Board of Directors
and PIAC, the need for building specific programs to tailor to member needs.
5. BHI has previously had discussions with its PEO Committee about the annual
performance measures and how they are calculated. BHI specifically discussed Follow-up
after hospital discharge and what CPT/HCPCS codes count towards this measure. The
Director of Utilization Management plans to have similar discussions with the hospital
liaison teams at the CMHCs to ensure follow-up care is being coded correctly.
6. BHI monitors follow-up after hospital discharge anywhere from monthly to quarterly.
The hospital liaisons send BHI information about follow-up appointments monthly and
this is compared to claims data quarterly to determine any discrepancies in reporting.
It is likely, due to the timing of the annual performance measures, that the interventions
implemented will not have a marked effect on the FY15 measures; however, the interventions are
expected to influence the FY16 measures.
Goal(s) for FY16
Project Title Goal(s) Action(s) Target
Date
Monitoring over- and
under-utilization
Continue to perform at or
above the statewide BHO
average for cost-of-care
performance measures.
Continue to measure some performance
indicators quarterly to monitor for
patterns and trends across services 6/30/16
Continue to monitor specific member
utilization ensure targeted interventions
are working
Page 55
BHI Annual Quality Report FY15 54
Improving Member Health and Safety
Summary of project – Quality and Safety of Clinical Care
There are several statewide performance measures designed to monitor member health and safety,
particularly regarding psychotropic medications. BHI furthered this study in the recent
development of a safety medication project. For more information, see the Coordination of Care
Section of this report.
Goal from FY15
Project Title Goal(s) Action(s) Target
Date
Member Health and
Safety
Perform at or above the
statewide BHO average for
the member health and safety
performance measures.
Implement polypharmacy medication
project 1/1/15
Results and analysis – Percentage with duplicate antipsychotic
Certain clinical circumstances allow members occasionally to be prescribed two or more atypical
antipsychotic medications at the same time. This indicator measures those members prescribed
multiple atypical antipsychotic medications (for 120 days or more) in proportion to members who
are prescribed only one atypical antipsychotic. Though BHI continues to be higher 11.14% than
the statewide BHO average 7.07%, there has been continued decrease from FY13 to FY14 in this
measure, as demonstrated in Figure 9. BHI considers objectives for this measure to be partly met.
Figure 9: Of all members on antipsychotics, percent on two or more
0.00%
2.00%
4.00%
6.00%
8.00%
10.00%
12.00%
14.00%
16.00%
FY11 FY12 FY13 FY14
Percentage of Members with Duplicate
Prescriptions for Antipsychotic Medication
Page 56
BHI Annual Quality Report FY15 55
Results and analysis – Adherence to atypical antipsychotics
This indicator measures the percentage of members 19-64 years of age during the measurement
year with schizophrenia who were dispensed and remained on an antipsychotic medication for at
least 80% of their treatment period. This measure is calculated State-wide rather than split by
BHO and in FY14 Colorado Medicaid performed at 70.37% compliance, a slight decrease from
FY13. BHI will continue to monitor and trend this indicator to identify opportunity for
improvement.
Results and analysis - Depression and Medication
This indicator measures the percent of members who have been: 1) diagnosed with a new episode
of major depression, 2) treated with antidepressant medication, and 3) maintained on
antidepressants for at least 84 days (12 weeks). As demonstrated in Figure 10, BHI showed a
slight decrease from FY13 to FY14 but continued the significant increase from FY11-12. BHI
remains higher than the state-wide average (58.91%) and therefore considers objectives for this
measure to be met.
Figure 10: Depression and medication monitoring
Results and analysis - Medication Management and Optimal Practitioner Contacts
This indicator measures the percent of members diagnosed with a new episode of major
depression, treated with antidepressant medication, and who had at least three follow up contacts
with a practitioner during the acute treatment phase (84 days or 12 weeks). As shown in Figure
11, BHI demonstrated a significant increase in performance from FY13, and continued to perform
well above the statewide average for this measure (32.38%). Therefore, BHI considers the
objective for this measure to be met.
0%
10%
20%
30%
40%
50%
60%
70%
FY11 FY12 FY13 FY14
Percentage of Members with Depression who
Maintained Antidepressant Medication for 84
Days
Page 57
BHI Annual Quality Report FY15 56
Figure 11: Anti-depression medication management
Barrier analysis and planned interventions
Because these measures are calculated on an annual basis and often several months following the
end of the fiscal year, targeted and timely interventions are difficult. It was decided between
HCPF and the Colorado BHOs that this measure would not be reported for FY15.
As an additional measure for member safety BHI decided to implement a child safety medication
project similar to the one discussed in the next section of this report.
Goal(s) for FY16
Project Title Goal(s) Action(s) Target
Date
Member Health and
Safety
Perform at or above the
statewide BHO average for
the member health and safety
performance measures.
Continue to monitor member safety
performance measures annually 6/30/16
0%
10%
20%
30%
40%
50%
60%
70%
FY11 FY12 FY13 FY14
Antidepressant Medication Management -
Optimal Practitioner Contacts
Page 58
BHI Annual Quality Report FY15 57
Safety Standards in Medication Dosages Report
Summary of Project
BHI has historically monitored several performance measures related to medication safety,
including:
Members prescribed duplicate atypical antipsychotics
Member adherence to atypical antipsychotics
Members diagnosed with major depression and treated with antidepressant medication
While BHI’s performance on these measures remains consistent with the other Colorado BHOs,
BHI identified this area as an opportunity to improve the use and safety of psychotropic
medications with our member population. Because BHI prioritizes member safety, this project
seeks to identify whether physicians within BHI’s network are prescribing within standard
guidelines by using an accepted method of equivalency of one drug per medication class.
Sixteen different prescribers across BHI’s three main CMHCs were evaluated for this project.
Any prescriber who prescribed medication to at least 40 unique members in the allotted
timeframe (calendar year 2014) was included in the sample. If any prescriber saw more than 100
unique members, a total sample of 100 members for that individual prescriber was used. This
resulted in a total sample size of 1,365 child and adolescent members. The member clinical
records for each member were extracted, and only the most recent medication management
service was reviewed, in order to capture the most current data.
Each CMHC provided remote access to their EMR in order to perform the clinical record reviews.
Data extracted from the clinical record included: the member’s age, the specific medications
prescribed, the overall total number of medications prescribed per member, the total number of
medications per member in each class, the precise dosage for each medication prescribed, and the
number of DSM-IV Axis I diagnoses per member. In order to measure dosages for the three main
medication classes (Antidepressants, Antipsychotics, and Stimulants), an established method of
conversion was developed by BHI’s CMO by reviewing and incorporating peer-reviewed and
established governmental guidelines for comparing and switching the most common medications
in each class (see table below). Antidepressants were converted to Prozac; Antipsychotics were
converted to Abilify, and stimulants were converted to Methylphenidate.
Table 34: Conversion Equivalents
Conversion to PROZAC Conversion to ABILIFY Conversion to METHYLPHENIDATE
ZOLOFT (Sertralne) = 3.75 RISPERDAL (Risperidone) = 0.2 ADDERALL (Dextroamphetamine) = 0.5
CELEXA (Citalopram) = 1 SEROQUEL (Quetiapine) = 25 VYVANSE (Lisdexamfetamine) = 1.25
LEXAPRO (Escitalopram) = 0.5 HALDOL (Haloperidol) = 0.4
PAXIL (Paroxatine) = 1 ZYPREXA (Olanzapine) = 1
For example, if a member had been prescribed Zoloft, the amount prescribed was converted into
the equivalent of Prozac for each member. If a member was prescribed 100mg of Zoloft, that
dosage would be converted to 26.67mg of Prozac for our analysis. A member who is taking 10mg
of Zyprexa would convert to an even 10mg of Abilify, as that ratio is 1:1.
Page 59
BHI Annual Quality Report FY15 58
Results and Analysis
For these results, the average dosages per member for each major medication class was analyzed
based on the conversions in Table 34.
In Figures 12-15, each prescriber was assigned a letter for the presentation of the results, in order
to “blind” the results. Figures 12-14 include the dosage information for Antidepressants, Atypical
Antipsychotics, and Stimulants. The vertical axes represent the converted average dosage in
milligrams, broken into titrations of 10 mg for conversion to Prozac, 5 mg for conversion to
Abilify, and 25 mg for conversion to Methylphenidate. Also included are the minimum and
maximum dosages of each prescriber in each medication class. Figure 15 shows the average
number of medications and the average number of diagnoses per member by prescriber.
Figure 12: Average dosage (in mg) of Antidepressants converted to Prozac per prescriber
0
10
20
30
40
50
60
70
80
90
A B C D E F G H I J K L M N O P
Do
sage
in m
ilig
ram
s (m
g)
Individual Prescribers
Average of conversion to Prozac (red lines indicate max and min dosages for each physician)
Page 60
BHI Annual Quality Report FY15 59
Figure 13: Average dosage of Abilify per prescriber
Figure 14: Average dosage of Methylphenidate per prescriber
0
5
10
15
20
25
30
35
40
45
50
A B C D E F G H I J K L M N O P
Do
sage
in m
ilig
ram
s (m
g)
Individual Prescribers
Average of Conversion to Abilify (Red lines indicate max and min dosages for each physician)
0
25
50
75
100
125
150
175
200
225
A B C D E F G H I J K L M N O P
Do
seag
e in
mil
igra
ms
(mg)
Individual Prescriber
Average of conversion to Methylphenidate (Red lines indicate max and min dosages for each physycian)
Page 61
BHI Annual Quality Report FY15 60
In order to account for the medical complexities of the members being seen by each prescriber,
the comparison between the average number of diagnoses each prescribers’ members have in
relation to the average number of medications prescribed. Figure 4 demonstrates these
relationships.
Figure 15: Average number of medications and diagnoses per member per prescriber
Based on the result presented above, it can be concluded that most of the average dosages for
each prescriber are in line with regularly accepted benchmarks for all the examined classes of
medication. However, the maximum dosages for several medications were above the
recommended guidelines.
Barrier Analysis and Planned Interventions
BHI did not identify any barriers to this project at this time. Based on the results of this quality
improvement activity, BHI has planned several interventions.
1) Non-blinded findings will be presented to the CEOs and medical directors of each CMHC.
2) Blinded findings will be presented to each of the prescribers included in the project.
3) Outliers will be discussed at the organization level
0.00
0.50
1.00
1.50
2.00
2.50
3.00
3.50
4.00
A B C D E F G H I J K L M N O P
Aver
age
Num
ber
of
Med
icat
ions
or
Dia
gno
ses
Individual Prescriber
Average Number of Medications and Diagnoses per
Prescriber
Avg. Number of Medications Avg. Number of Diagonses
Page 62
BHI Annual Quality Report FY15 61
With this information, the CMHCs will be able to implement the interventions as a team within
their own organizations. This project is scheduled to occur annually in order to monitor
improvement over time for each provider and to measure the efficacy of the planned
interventions. This project will also be replicated with adult members.
Goal(s) for FY16
Project Title Goal(s) Action(s) Target
Date
Member Health and
Safety
Complete the medication
safety project with children
annually
Implement annual medication safety
project 6/30/16
Implement adult medication
safety project Complete adult medication safety project 1/1/16
Page 63
BHI Annual Quality Report FY15 62
Coordination of Care – Follow-up after Hospital Discharge
Summary of project – Quality and Safety of Clinical Care
It is important to provide regular follow-up treatment to members after they have been
hospitalized for mental illness. An outpatient visit with a mental health practitioner after
discharge is recommended to make sure that the member’s transition to the home or work
environment is supported and that gains made during hospitalization are not lost. It also helps
health care providers detect early post-hospitalization reactions or medication problems and
provide continuing care. Research has found that member access to follow-up care within seven
days of hospital discharge to be a strong predictor of a reduction in hospital readmission. Facility
treatment may stabilize individuals with acute behavioral conditions, but timely and appropriate
continued care is needed to maintain and extend improvement outside of the hospital. The period
immediately following discharge from inpatient care is recognized as a time of increased
vulnerability. Ensuring continuity of care by increasing compliance to outpatient follow up care
helps detect early post-hospitalization medication problems and provides continuing support that
improves treatment outcomes and reduces health care costs.
Follow up after hospital discharge is a yearly performance measure that is calculated by BHI. The
measure is the percentage of member discharges from an inpatient hospital episode for treatment
of a covered mental health disorder to the community or a non-24-hour treatment facility and
were seen on an outpatient basis (excludes case management) with a mental health provider
within 7 or 30 days after discharge. Readmissions within that timeframe are excluded.
Goals from FY15
Project Title Goal(s) Action(s) Target
Date
Coordination of Care –
Follow-up after hospital
discharge
Provide 90% of outpatient
appointments within 7 days
after hospital discharge BHI will continue to monitor this
measure quarterly and implement
targeted interventions
6/30/15 Provide 95% of outpatient
appointments within 30 days
of hospital discharge
Results and analysis
BHI continued efforts to provide high-volume providers with education about the services
included and excluded from this performance indicator. Because this measure is calculated on an
annual basis as part of the performance measure process, full-year FY15 data is not yet available.
As seen below the amount of members increased significantly and while BHI continues to
perform above the statewide BHO average for both 7 days (50.51%) and for 30 days (69.53%),
performance decreased compared to FY13 and continues to fall short of the new internal
benchmarks set by the QI and UM departments.
Page 64
BHI Annual Quality Report FY15 63
Table 34: 7-day follow-up after hospital discharge (non-state hospitals)
Measurement Period Measurement Numerator Denominator Compliance Benchmark
FY11 Baseline 139 278 50.00% 90.00%
FY12 Re-measurement 1 180 312 57.69% 90.00%
FY13 Re-measurement 2 182 313 58.15% 90.00%
FY14 Re-measurement 3 237 452 52.43% 90.00%
Table 35: 30-day follow-up after hospital discharge (non-state hospitals)
Measurement Period Measurement Numerator Denominator Compliance Benchmark
FY11 Baseline 188 278 67.63% 95.00%
FY12 Re-measurement 1 221 312 70.83% 95.00%
FY13 Re-measurement 2 229 313 73.16% 95.00%
FY14 Re-measurement 3 319 452 70.58% 95.00%
Barrier analysis and interventions
In FY15, BHI started to measure the data on a quarterly basis; however the information was
always three months behind when the analysis was conducted due to claims lag. To address this
issue and to facilitate both timely and accurate data, BHI implemented a new process in April
2015 utilizing information from the CMHC hospital liaisons about members’ discharge planning
and confirmation of follow-up appointment attendance. This allowed the calculation of this
measure within 15 days of the end of the quarter. This data will be validated with claims data
upon completion. Also considering how far our current results are from the benchmark new goals
are being set for FY16.
Goal(s) for FY16
Project Title Goal(s) Action(s) Target
Date
Coordination of Care –
Follow-up after hospital
discharge
Provide 62% of outpatient
appointments within 7 days
after hospital discharge BHI will continue to monitor this
measure quarterly and implement
targeted interventions
6/30/16 Provide 80% of outpatient
appointments within 30 days
of hospital discharge
Page 65
BHI Annual Quality Report FY15 64
Coordination of Care - Improving Physical Healthcare Access
Summary of project – Quality of Services
Physical healthcare access is defined by the total number of members who received outpatient
mental health treatment during the measurement period and had a qualifying physical healthcare
visit during the measurement period.
In an effort to provide effective preventive behavioral health programs, BHI recognizes the need
to integrate medical and psychosocial health. The solution was to create a Care Management
program that promotes behavioral wellness by addressing, stabilizing, and preventing decline in
its members’ physical health. A majority of the population BHI serves has co-occurring chronic
mental and physical illness such as diabetes, bipolar disorder, asthma, heart disease, COPD, and
schizophrenia. The goal of the Care Management program is to eliminate barriers members face
when navigating the healthcare system and, thus, enabling them to better care for themselves -
both mind and body. BHI acknowledges the connection between the quality of one’s physical
health and their ability to maintain mental stability. The BHI Care Management program seeks to
ensure the mental health of its members by improving their overall health; therefore, reducing
costs for both behavioral and physical healthcare.
There are many ways BHI Care Managers work to connect members to appropriate medical care.
BHI Cara Managers provide members with referrals to PCPs and specialists in their catchment
area. If a member is unable to do so themselves, the care manager will also schedule
appointments and make transportation arrangements. Linking each member to a PCP allows him
or her to establish a Medical Home with access to ongoing and preventative care reducing the
need for ED visits and inpatient hospital stays. The Cara Manager receives referrals from
therapists, case managers, and prescribers within the CMHCs. The Cara Manager also reviews
claims data and contacts members who are considered high utilizers of hospital resources. In these
cases, if the member is not already connected to their local CMHC, the Care Manager will make a
psychiatric referral, if appropriate.
Once a member is connected to a PCP or specialist, the Care Manager continues a documented
process. Upon written permission from the member, the Care Manager seeks to ensure that all
parties involved in the member’s medical care are aware of all interventions. This includes
facilitating the release of records, making sure all providers have access to lab results, current
medication lists, and most importantly, increasing communication between physical and mental
health care providers. Communication between physical and behavioral health care providers is
paramount to maintaining a member’s psychiatric stability and preventing future decline.
Goals from FY15
Project Title Goal(s) Action(s) Target
Date
Coordination of Care –
Improving physical
healthcare access
Continue to improve
coordination of care
Continue to develop the Care
Management Program 6/30/15
Improve measurement of
coordination of care Fully implement PCP measure for
Quarterly Report Card 1/1/15
Page 66
BHI Annual Quality Report FY15 65
Results and analysis
This performance measure is calculated by HCPF. BHI will continue to monitor this measure and
implement interventions to increase performance. Table 36 below shows BHI performance
increased from FY12- FY14. No improvement was achieved between FY13 and FY14 and our
results continue to be lower than the statewide BHO average (89.24%).
Table 36: Percentage of BHI members with a physical healthcare visit
FY12 FY13 FY14
Total number of unduplicated members who had at least one BHI
outpatient service claim/encounter during the measurement period.
Members must be Medicaid eligible and enrolled at least ten months with
the same BHO during the 12-month measurement period (denominator).
12,124 13,262 15,226
Total number of members from the denominator with at least one
preventive or ambulatory medical visit (numerator) 8,828 11,552 13,327
BHI Performance 72.81% 87.11% 87.30%
Statewide BHO average 72.80% 89.31% 89.24%
In FY15, BHI continued collecting information regarding the number and percentage of members
receiving behavioral health services who had a primary care physician (PCP). This information is
being collected and reported in our Quarterly Report Card. In addition, BHI also extended the
Care Management service in FY15. The new Complex Case Management service commenced as
a pilot on April 1st, 2015 to specifically work with members that have had high a high cost for
both physical and behavioral health services over the previous 12 months.
Barrier analysis and planned interventions
The CMHC’s in the BHI’s catchment area have built the necessary information into their EMRs
for the measurement of the PCP indicator. BHI will continue to monitor the reporting of the PCP
indicator on a quarterly basis, as well as develop performance indicators for the new Complex
Case Management service to determine key outcomes.
Goal(s) for FY16
Project Title Goal(s) Action(s) Target
Date
Coordination of Care –
Improving physical
healthcare access
Continue to improve
coordination of care by 5%,
(from 87.30% to 92%).
Continue the development of the new
Complex Case Management service
6/30/16 Develop performance
indicators for complex case
management.
Implement key performance indicators
for the Complex Case Management
service, in line with NCQA requirements
Page 67
BHI Annual Quality Report FY15 66
Coordination of Care – Adolescent Depression Screening and Follow-up
Summary of Project
The goal for this performance improvement project is to increase the number of adolescents who
are screened positive for depression within the medical setting and follow-up with a behavioral
health provider. It is believed that youth who receive timely behavioral health treatment as soon
as possible after a positive depression screening will fare better with their overall health outcomes
and ultimately will be at lesser risk for the complications arising from depression mentioned
previously.
This performance improvement project places an emphasis on the primary care setting because
the “majority” of “depressed youth identified in primary care…seem to start treatment.” By
systematically assessing the adolescent population for depression it is likely that more individuals
with depression would be identified, that those with depression would be diagnosed and treated
earlier than they would have been otherwise. By increasing assessment, identification, and
treatment of adolescents with depression, the ultimate goal is to improve their heath and level of
functioning by improving symptoms, thus mitigating the negative downstream effects of
untreated depression.
The proposed target population is shared BHI and RCCO Medicaid members between the ages of
12-17 who screen positive for depression by a medical provider. Members must be continuously
enrolled for at least 90 days prior to and 30 days following the date of the positive depression
screen. Members with a depression diagnosis within the past 90 days will be excluded from the
project (unless the diagnosis was made in an Emergency Department). Members who are
currently receiving treatment from a behavioral health provider prior to the screening are also
excluded. CPT 99420 code with diagnosis code of V40.9 will be used to identify those members
in the denominator. Diagnosis codes used to identify members with a previous diagnosis of
depression within 90 days prior to the screening date will be DSM-IV diagnosis codes: 296.20-
296.25; 296.30-296.35; 298.0; 311. Follow-up visits with a behavioral health provider can occur
on the same day as the positive depression screening. Follow up visits include:
HSAG evaluated Activities I-VI and determined that there is a high confidence in the results. BHI
is in the process of gathering baseline data (CY14) and implementing interventions with both
primary care providers and behavioral health providers. A list of references for this project are
available upon request.
Goal(s) for FY16
Project Title Goal(s) Action(s) Target
Date
Adolescent Depression
Screening and Follow-up
To improve screening and
follow-up by more than 5%
by the end of CY15
Implement interventions as presented in
the PIP write-up tool 6/30/16
CPT Codes HCPCS Codes
90791; 90792; 99201-99205; 90839;
90840 H0002, H0004, H0031; H0023; H0025; H2011; T1016; T1017
Page 68
BHI Annual Quality Report FY15 67
Coordination of Care – E-Visits
Each county within BHI’s catchment area has a CMHC that provides an array of services to BHI
members. In order to accommodate the expansion of Medicaid, each CMHC has started a
subgroup of availability of e-visits for their members. BHI began collecting data related to the
number of unique members seen via e-visits as well as the total number of visits provided. E-
visits, currently, only includes those services provided via HIPAA secure video conferencing.
Each of the CMHCs within BHI’s catchment area receives a capitated rate payment to help
support/facilitate the telehealth program.
Arapahoe Douglas Mental Health Network (ADMHN)
ADMHN began an e-visit program in June 2013, in order to address retention of psychiatrists.
Two of the agency’s Child and Family psychiatrists were relocating to other states. The
psychiatrists both expressed interest in retaining their clients for continuity of care. ADMHN was
able to create a HIPAA and privacy secure mechanism for video and audio exchange between the
psychiatrist and their clients. The service is offered at four of ADMHN’s locations. The
psychiatrists have retained their caseload and can also take new clients. There have been 247
unique BHI members seen since 2013 and over 985 e-visits.
Aurora Mental Health Center(AuMHC)
AuMHC began an e-visit program in Fiscal Year 2015, in order to retain a Child Psychiatrist who
was relocating to another state. AuMHC was able to create a HIPAA and privacy secure
mechanism for video and audio exchange between the psychiatrist and her clients. The
psychiatrist has retained her caseload and also takes new clients. She visits clients in person one
time per year who are on medications that require dosage and frequency monitoring. Since the
program began, there have been 204 unique BHI members seen and over 601 e-visits.
Community Reach Center (CRC)
CRC began an e-visit program in Fiscal Year 2015, in order to address the growing number of
members due to Medicaid expansion. CRC was able to create a HIPAA and privacy secure
mechanism for video and audio exchange between the psychiatrist and her clients. CRC offers
both behavioral health and medication management e-visits to their members. The services are
offered at all Outpatient Offices and Residential Facilities. Services are available Monday through
Friday 8:00am- 5:00pm, and are available after hours and weekends through the on-call services.
CRC saw 1,304 members during FY15 and provided 3,129 telehealth visits.
Goal(s) for FY16
Project Title Goal(s) Action(s) Target
Date
Coordination of Care –
E Visits
BHI will continue to support
the telehealth programs at
each of the CMHCs by
developing policies and
procedures for billing and
data collection
Create policies and procedures related to
telehealth programming and data
collection
6/30/16
Page 69
BHI Annual Quality Report FY15 68
Improving Member Functioning
Summary of Project – Quality and Safety of Clinical Care
The Recovery Model focuses on empowering members not only in relation to their illness, but
also for members to take charge of their entire lives. Two performance measures focus on
improving overall member functioning, as measured by their living status.
Goal from FY15
Project Title Goal(s) Action(s) Target
Date Improving Member
Functioning
Continue to measure and
monitor performance
Cooperate with HCPF on the calculation
of performance measures 6/30/15
Results and analysis
The Independent Living Status indicator measures the percent of clients, age 18 years and older,
living independently, that maintain this status during the measurement period. The progress
towards Independent Living Status indicator measures the percent of clients, age 18 years and
older, who move to a less restricted place of residence, including independent living, during the
measurement period. BHI performance on these measures is reflected in Figure 16 and Figure 17.
While BHI performance is still not as high as FY12, it remains consistent with the statewide
average for maintaining independent living status (95.18%) and performed highest of all the
Colorado BHOs for progress towards independent living status in FY14 (statewide average was
10.49%). Therefore, BHI considers objectives for this measure to be met.
Figure 17: Members maintaining independent living status
91%
92%
92%
93%
93%
94%
94%
95%
95%
FY12 FY13 FY14
Maintaining Independent Living Status
Page 70
BHI Annual Quality Report FY15 69
Figure 17: Members making progress towards independent living status
Barrier analysis and planned interventions
Performance measures such as these are difficult to assess for proper benchmarks and goals.
While optimistic to believe that 100% of members receiving services could be living
independently, this goal would be unrealistic. It is therefore difficult to distinguish an appropriate
percentage of members who “should” be living independently and/or making progress towards
independent living. It was decided between HCPF and the Colorado BHOs that this measure
would not be reported for FY15.
0%
2%
4%
6%
8%
10%
12%
14%
16%
FY12 FY13 FY14
Progress Towards Independent Living Status
Page 71
BHI Annual Quality Report FY15 70
Information Systems Capabilities Assessment Tool (ISCAT) Audit
Summary of project
Each of the performance measures that are calculated for BHI is subject to validation by HSAG.
Some of these measures were calculated by HCPF using data submitted by the BHOs; other
measures were calculated by the BHOs. The measures came from a number of sources, including
claims/encounter and enrollment/eligibility data.
The CMS Performance Measure Validation Protocol identifies key types of data that should be
reviewed as part of the validation process. Below is a list of the types of data collected and how
HSAG conducted an analysis of this data:
Information Systems Capabilities Assessment Tools (ISCATs) were requested and
received from the BHOs and the Department. Upon receipt by HSAG, the ISCATs
underwent a cursory review to ensure each section was complete and all applicable
attachments were present. HSAG then thoroughly reviewed all documentation, noting any
potential issues, concerns, and items that needed additional clarification.
Source code (programming language) for performance measures was requested and was
submitted by the Department and the BHOs. HSAG completed line-by-line review of the
supplied source code to ensure compliance with the State-defined performance indicator
specifications. HSAG identified areas of deviation from the specifications, evaluating the
impact to the indicator and assessing the degree of bias (if any).
Performance measure reports for FY 2014–2015 were reviewed by the validation team.
The team also reviewed previous reports to assess trending patterns and rate reasonability.
Supporting documentation included any documentation that provided additional
information to complete the validation process, including policies and procedures, file
layouts, system flow diagrams, system log files, and data collection process descriptions.
HSAG reviewed all supporting documentation, with issues or clarifications flagged for
follow-up.
Performance measures that were selected for validation for FY14 were:
Hospital Readmissions Within 7, 30, 90 Days Post-Discharge
Behavioral Health Engagement (BHE)
Overall Penetration Rates
Penetration Rates by Age Category
Penetration Rates by Eligibility Category
Follow-up Appointments Within Seven (7) and Thirty (30) Days After Hospital Discharge
Percent of Members with SMI with a Focal Point of Behavioral Health Care
Improving Physical Healthcare Access
Inpatient Utilization (per 1000 members)
Hospital Average Length of Stay (LOS)
Emergency Department Utilization (per 1000 members)
Page 72
BHI Annual Quality Report FY15 71
Goal from FY15
Project Title Goal(s) Action(s) Target
Date
Information Systems
Capabilities Assessment
Tool (ISCAT) audit
Continue to achieve 100%
compliance on the audit.
Continue to monitor and assess each
aspect of the performance measure
calculation process and adjusting
accordingly
6/30/15
Results and analysis
BHI achieved “met” status for all elements reviewed, resulting in a 100% compliance score. The
strengths and suggested areas of improvement include:
Strengths:
o BHI continued to have a collaborative relationship with Colorado Access, the
BHO’s administrative service organization (ASO).
o As in prior years, the BHO had the same cohesive team (with a high degree of
technical expertise), which was responsible for performance calculation and
reporting.
o In 2014, BHI experienced major system change along with assuming responsibility
for an additional product line (substance use disorder [SUD]), which resulted in an
increase in membership. However, even with these changes, the BHO was able to
provide quality services to its members and maintain its performance level
throughout the year.
Suggested areas of improvement:
o During the on-site visit, it was found that the incorrect data field was captured for
the inpatient services. However, the BHO’s analytical staff members were
responsive and corrected these discrepancies prior to the generation of this report.
o The corrected data files were resubmitted for review. After the file review, HSAG
noted no further issues or concerns.
o BHI should continue to work closely with the Department to resolve discrepancies
with the flat files not matching the 837 files in the State’s Medicaid Management
Information System (MMIS).
Barrier analysis and planned interventions
HSAG reported that BHI acted on the recommendations made from the previous year,
collaborating with the Department and the other BHOs to address and resolve any issues
identified in the scope document. BHI will work with the department during the 2015 ISCAT to
ensure that the flat files match the files in the State’s Medicaid Management Information System.
Goal(s) for FY16
Project Title Goal(s) Action(s) Target
Date
Information Systems
Capabilities Assessment
Tool (ISCAT) audit
Continue to achieve 100%
compliance on the audit.
Continue to monitor and assess each
aspect of the performance measure
calculation process and adjusting
accordingly
6/30/16
Page 73
BHI Annual Quality Report FY15 72
Section 8: Clinical Practice Guidelines and Evidence-Based Practices
Practice Guideline Review and Development
Summary of project – Quality and Safety of Clinical Care
BHI adopts practice guidelines that meet the following criteria as required by the Medicaid
contract and federal managed care regulation:
The guidelines are based on valid and reliable clinical evidence or a consensus of health
care professionals in the particular field
The guidelines take into consideration the particular needs of BHI members
The guidelines have only been adopted after consultation with appropriate contracted
health care and mental health professionals
The guidelines are reviewed and updated periodically as appropriate
BHI reviews, updates, and implements practice guidelines through our Standards of Practice
Committee (SOP). Upon approval from the SOP Committee, BHI distributes the new or updated
practice guidelines to providers in the following manners:
To any providers on the SOP and PEO committees
To the CPN providers through the provider bulletin or individual mailings/emails
Posting on the BHI website
Goals from FY15
Project Title Goal(s) Action(s) Target
Date
Clinical Practice
Guidelines
Develop and implement
practice guidelines to meet
the clinical needs of
members and improve
consistency across providers
Create and review all identified practice
guidelines per NCQA standards.
1/1/2015 Create and distribute member
informational materials about practice
guidelines
Results and analysis
Table 37 indicates the current BHI practice guidelines, including which guidelines have been
newly implemented and which have been recently reviewed. Because NCQA requires that
practice guidelines are updated every two years (rather than the HCPF requirement of updating
“as appropriate,”) BHI has been working to review existing practice guidelines to remain in
compliance with NCQA standards.
Medication guidelines are included as an aspect of treatment in each practice guideline. Each
practice guideline also includes a member information handout which explains the parameters set
forth in the practice guideline in a member-friendly format (6th
grade language where possible)
rather than clinical and medical terms. The member handouts are posted on the BHI website and
promoted in the quarterly Member and Family Newsletter. BHI considers FY15 objectives for the
practice guideline program to be met.
Page 74
BHI Annual Quality Report FY15 73
Table 37: Current BHI practice guidelines
Practice Guideline Reviewed
in FY14
Newly
Implemented
in FY15
Reviewed
in FY15
Schizophrenia X
Atypical Antipsychotics: Monitoring for Metabolic Side Effects X Bipolar Disorder X Risk Assessment X
Eye Movement Reprocessing and Desensitization (EMDR) X
Reactive Attachment Disorder X
Obsessive Compulsive Disorder X
Attention Deficit Hyperactivity Disorder X
Major Depressive Disorder X
Generalized Anxiety Disorder X
Barrier analysis and planned interventions
After the redesign of the practice development program in FY14, BHI has now reviewed all
practice guidelines within the last two years. This new process now ensures success with related
NCQA standards for the creation and monitoring of guidelines and BHI will continue to aim
towards meeting the standards for future years.
Goal(s) for FY16
Project Title Goal(s) Action(s) Target
Date
Clinical Practice
Guidelines
Continue developing and
implementing practice
guidelines to meet the
clinical needs of members
and improve consistency
across providers
Develop new guidelines as identified by
the Standards of Practice Committee
6/30/2016 Review/update 100% of
practice guidelines every two
years
Continue process of reviewing/updating
all identified practice guidelines every 2
years
Continue with the
distribution of informational
material to members
Continue posting information in our
website and disseminating this
information to members
Page 75
BHI Annual Quality Report FY15 74
Practice Guideline Compliance – Reactive Attachment Disorder
Summary of project – Quality and Safety of Clinical Care
BHI developed the Reactive Attachment Disorder (RAD) practice guideline in March 2013 and
updated in October of 2014. The practice guideline includes specifications for the assessment and
treatment of RAD, including a “focus on creating positive interactions with caregivers” and an
avoidance of polypharmacy. In order to measure compliance with these aspects of the practice
guideline, BHI analyzed encounter and pharmacy claims data in the following manner:
Indicator 1: Percentage of members with primary diagnosis of RAD (313.89) who
received family therapy during fiscal year 2014 (encounter data)
Indicator 2: Percentage of members with primary diagnosis of RAD (313.89) who were
prescribed three or fewer psychotropic medications (pharmacy data)
Goal from FY15
Project Title Goal(s) Action(s) Target
Date Compliance with
Clinical Practice
Guidelines
Monitor providers’
compliance with BHI clinical
practice guidelines
Monitor compliance with RAD guideline
via encounter and pharmacy claims 6/30/15
Results and analysis
While compliance with Indicator 1 (inclusion of family therapy) improved from FY14, the
compliance with Indicator 2 (avoidance of polypharmacy) decreased. BHI included additional
therapy codes for FY15 (90846) which represented family therapy without the child present and
also in-home therapy codes (H2015, H2021 & H2022). It was recognized that it would still be of
benefit to the child if the parents attended therapy without the child, and also the therapy did not
have to be in a clinical setting and therefore the additional codes should be included in the
practice guideline compliance. Table 38 highlights the results of both indicators, and for Indicator
1 shows compliance scores with and without the additional codes.
Table 38: Compliance with RAD Practice Guideline
Indicator 1: Percentage of members with primary diagnosis of RAD (313.89) who received family therapy
during FY14
FY14 FY15
Denominator: number of members with primary diagnosis of RAD (313.89) 137 116
Numerator: number of members with primary diagnosis of RAD (313.89) who also
received a family therapy service (90847) 43 54
Percent compliance 31.39% 46.55%
Numerator: number of members with primary diagnosis of RAD (313.89) who also
received a family therapy service (90847, 90846, and in-home therapy codes H2015,
H2021 & H2022)
N/A 63
Percent compliance N/A 54.31%
Indicator 2: Percentage of members with primary diagnosis of RAD (313.89) who were prescribed three or
fewer psychotropic medications
FY14 FY15
Denominator: number of members with primary diagnosis of RAD (313.89) 137 116
Numerator: number of members with primary diagnosis of RAD (313.89) who were
prescribed three or fewer psychotropic medications 134 95
Percent compliance 97.80% 81.89%
Page 76
BHI Annual Quality Report FY15 75
Barrier analysis and planned interventions
BHI has planned some further analysis for this project to determine the increase in polypharmacy,
including investigating the specific providers that prescribed the psychotropic medications.
Though the inclusion of family therapy increased significantly from FY14 the numbers are still
much lower than would be expected therefore BHI will continue to look into ways of increasing
performance for FY16.
In addition, BHI will continue to educate providers through the provider bulletin about all practice
guidelines, including the RAD guideline.
Goal(s) for FY16
Project Title Goal(s) Action(s) Target
Date
Compliance with
Clinical Practice
Guidelines
Maintain provider
compliance with Indicator 1
and increase provider
compliance with Indicator 2
to 90%
Monitor compliance with RAD guideline
via encounter and pharmacy claims
6/30/16
Identify areas to improve performance
with the local CMHCs
Investigate prescriptions of multiple
psychotropic medications to determine
ways to avoid polypharmacy
Page 77
BHI Annual Quality Report FY15 76
Practice Guideline Compliance – Risk Assessment
Summary of project – Quality and Safety of Clinical Care
BHI reviewed and updated the Risk Assessment practice guideline in March 2015. The practice
guideline includes specifications for both suicide and violence assessments and includes a tool
(based on the SAFE-T assessment) that can be utilized by clinicians.
The BHI provider audit process includes a review of two full clinical records. In order to monitor
compliance with the BHI Risk Assessment practice guideline, BHI requires that the following
elements are included in the clinical record:
Suicide risk assessment
Violence risk assessment
Crisis Plan (or documentation that crisis plan is not needed)
Goal from FY15
Project Title Goal(s) Action(s) Target
Date Compliance with
Clinical Practice
Guidelines
Monitor providers’
compliance with BHI clinical
practice guidelines
Monitor compliance with Risk
Assessment guideline via clinical record
review
6/30/15
Results and analysis
BHI completed full clinical record audits on eight providers across multiple levels of care;
outpatient, inpatient and residential. The number of randomly sampled cases reviewed per
provider and the overall results of the Risk Assessment practice guideline compliance review are
listed in Table 39.
Table 39: Risk Assessment Practice Guideline Compliance Review
Indicator 1 Indicator 2 Indicator 3 Number
of Cases
Suicide
Assessment
Violence
Assessment Crisis Plan
Provider A 5 0% 100% 40%
Provider B 5 0% 0% 0%
Provider C 5 0% 0% 80%
Provider D 5 0% 0% 0%
Provider E 5 0% 0% 0%
Provider F 2 100% 100% 0%
Provider G 2 0% 0% 0%
Provider H 4 100% 100% 100%
TOTAL 33 18% 33% 30%
The non-compliance scores for suicide and violence assessments for provider E were due to no
assessment being present, but non-compliance throughout the other providers was due to
insufficient documentation. Most providers did include reference to violence or suicide ideation,
however a thorough assessment was not documented and therefore the providers did not meet the
standards as set out in the BHI practice guideline. Each of the non-compliance scores for Crisis
Plan were due to either not having a crisis plan in place or due to a lack of documentation that a
Crisis Plan was not needed at the time of assessment.
Page 78
BHI Annual Quality Report FY15 77
Barrier analysis and planned interventions
The scores for FY15 were very low and therefore it will be important to work with the providers
in FY16 to ensure that risk assessment guidelines are adhered to. BHI will provide education
about the results of the review, including specific details for each individual provider with regards
to non-compliance, and continue discussion throughout the year to support changes to the risk
assessment and documentation processes.
Goal(s) for FY16
Project Title Goal(s) Action(s) Target
Date
Compliance with
Clinical Practice
Guidelines
Increase providers
compliance with all
indicators by 10%
Monitor compliance with Risk
Assessment guideline via new provider
monitoring process
6/30/16 Support providers to update risk
assessment processes
Educate providers about the Risk
Assessment Practice Guideline
Page 79
BHI Annual Quality Report FY15 78
Practice Guideline Compliance – Atypical Antipsychotics and Monitoring of
Metabolic Side Effects
Summary of project – Quality and Safety of Clinical Care
BHI developed the Atypical Antipsychotics & Monitoring of Metabolic Side Effects practice
guideline in August 2009 and the guidelines has since been reviewed every two years. The
practice guideline includes recommendations and considerations when initially prescribing
atypical antipsychotics, as well as the effect that this can have on different people and a detailed
timeline of follow-up and monitoring.
BHI analyzes compliance with the guidelines through a member survey. This was first introduced
after clinical research determined that the monitoring of fasting blood glucose and fasting lipid
panels was not in line with the guidelines for members on atypical antipsychotic medication.
Simply having the practice guideline in place was therefore not enough and instead adherence to
the required practices needed to be monitored for improvement. The survey records members that
have taken antipsychotic medication and had the following monitoring within the previous 3
months:
Indicator 1: Monitoring of fasting blood glucose and full lipid panel
Indicator 2 : Monitoring of weight
Goal from FY15
Project Title Goal(s) Action(s) Target
Date
Compliance with
Clinical Practice
Guidelines
Monitor providers’
compliance with BHI clinical
practice guidelines
Monitor compliance with Atypical
Antipsychotic guideline via member
survey
6/30/15
Results and analysis
As shown in the tables below there was significant improvement from FY14 to FY15. The
recording of weight increased to 91.27% and is now close to the benchmark goal of 95%, whereas
glucose and lipid panels were reported to have been drawn in 71.18% of the clients that returned a
survey, up from only 39.84% the previous year. This is above the 65% benchmark goal and
therefore the overall objective is considered to have been met.
Table 40: Monitoring of weight
2014 2015
Completed
Surveys
Weight
Recorded
Weight
Recorded %
Completed
Surveys
Weight
Recorded
Weight
Recorded %
ADMHN 54 49 90.74% 55 48 87.27%
AuMHC 37 30 81.08% 76 64 84.21%
CRC 36 32 88.89% 98 97 98.98%
TOTAL 127 111 87.40% 229 209 91.27%
Page 80
BHI Annual Quality Report FY15 79
Table 41: Monitoring of fasting blood glucose and full lipid panel
2014 2015
Completed
Surveys
Labs
Drawn
Labs
Drawn %
Completed
Surveys
Labs
Drawn
Labs
Drawn %
ADMHN 55 28 50.91% 55 34 61.82%
AuMHC 37 5 13.51% 76 47 61.84%
CRC 36 18 50.00% 98 82 83.67%
TOTAL 128 51 39.84% 229 163 71.18%
Barrier analysis and planned interventions
It was acknowledged for FY15 that some pharmacies where the survey was distributed did not
have a doctor on site that would be able to monitor fasting blood glucose and a full lipid panel,
therefore the survey was altered to also include times that the client had been referred to a doctor
to have the labs drawn. This may have accounted for some of the increase in performance from
FY14 to FY15 but is likely to only be a small amount.
The survey is carried out annually and therefore only shows a snapshot in time of people who
went to the pharmacy and filled out a survey in June of that year. For FY16 the QI department
therefore plans on increasing the number of times the survey is run to be able to track
performance and if needed implement interventions prior to the end of year survey in June 2016.
Since the survey only captures member self-report, claims data will also be pulled from the
RCCO system to cross-check labs.
Goal(s) for FY16
Project Title Goal(s) Action(s) Target
Date
Compliance with
Clinical Practice
Guidelines
Maintain provider
compliance with Indicator 1
and increase provider
compliance with Indicator 2
to 80%
Monitor compliance with Atypical
Antipsychotic guideline via member
survey and laboratories to every 6 months
to improve measurement and track
progress.
6/30/16
Page 81
BHI Annual Quality Report FY15 80
Evidence-Based and Promising Practices
Summary of Project – Quality and Safety of Clinical Care
Evidence-based practices (EBPs) typically refer to programs or practices that are proven to be
successful through research methodology and have produced consistently positive patterns of
results. The implementation of proven, well-researched programs is standard practice and
required by most funding sources. Promising practices are those that may have demonstrated
efficacy through qualitative evaluation protocols but have not yet been supported by quantitative,
peer-reviewed scientific publication.
Goal from FY15
Project Title Goal(s) Action(s) Target
Date
Evidence-based and
Promising Practices
Provide optimal care for
members using well-
researched clinical practice
Refine and implement EBP reporting
process 6/30/15
Results and analysis
In order to monitor BHI’s contracted providers and how evidence-based practices are being
performed, a new process was developed in FY15. This process included the tracking of 12
evidenced based practices and a report on fidelity and/or outcomes in each case. Six practices for
both adults and children’s services were agreed on, with co-occurring substance use disorders
evident in four of them. Table 42 indicates the reporting for FY15.
Table 42: Evidence-Based Practices
# Program / CurriculumSUD / Co-
occurring?
Fidelity
Measure
Outcome
MeasureToolkit
Fidelity
Score
Max Fidelity
Score
Fidelity %
Score
Outcome
Measure 1
Outcome
Measure 2
Outcome
Measure 3
Outcome
Measure 4
Outcome
Measure 5
Outcome
Measure 6
1 Assertive Community Treatment P P CO-ACT Fidelity Scale 98 115 85% 11% 71% - - - -
2 Integrated Dual Diagnosis Treatment P P - SAMHSA toolkit 43 70 61% - - - - - -
3Wellness Recovery Action Plan
(WRAP)P P
WRAP Adherance
Scale & Trait Hope 17.4 30 58% 11% 1% - - - -
4 Seeking Safety P P PSeeking Safety
Adherence Scale50.28 57 88% % - - - - -
5Individualized Placement and Support
(IPS)P -
IPS Supported
Employment Fidelity 85 105 81% - - - - - -
6 Supported Housing P P SAMHSA toolkit 22.375 28 80% 100% - - - - -
# Program / CurriculumSUD / Co-
occurring?
Fidelity
Measure
Outcome
Measure
Fidelity / Outcome
Measure
Fidelity
Score
Max Fidelity
Score
Fidelity %
Score
Outcome
Measure 1
Outcome
Measure 2
Outcome
Measure 3
Outcome
Measure 4
Outcome
Measure 5
Outcome
Measure 6
7 Parent-Child Interaction Therapy P -PCIT Training
Competencies30.5 52 59% - - - - - -
8Adolescent Community Reinforcement
Approach (A-CRA)P - P GAIN-SS - - - % % % - - -
9 Multi-Systemic Therapy (MST) P P TAM-R & SAM-R 0.69 1.00 69% 0% - - - - -
10Screening, Brief Intervention, and
Referral to Treatment (SBIRT)P P P RASAI 17 30 57% 0% 30% - - - -
11 Nurturing Parenting Program - P AAPI-2 - - - 3% % 1% % 3% -
12Healthy Environments & Response to
Trauma in Schools (HEARTS)- P
Training of Trainers
Survey (TOT)- - - % % % % % 70%
ADULT SERVICES
Reporting
CHILD & ADOLESCENT SERVICES
Reporting
Evidenced Based Practices Type of Reporting
Evidenced Based Practices Type of Reporting
Page 82
BHI Annual Quality Report FY15 81
BHI’s PEO Committee worked to finalize the EBP reporting process for FY15 and considers
objectives related to this project to be met.
Goal(s) for FY16
Project Title Goal(s) Action(s) Target
Date
Evidence-based and
Promising Practices
Continue monitoring EBP
within contracted providers
and develop a system to
improve fidelity and
outcomes
Develop ongoing and meaningful EBP
reporting to track progress over time
6/30/16 Collaborate with contracted providers to
set goals and mechanisms to achieve
those goals related to fidelity & outcome
measures
Page 83
BHI Annual Quality Report FY15 82
Section 9: Member & Family Input in QI Program
Member and family involvement and input into the quality improvement program are vital to true
service improvement. The QI program involves members and their families in a bi-directional
manner, assuring that not only is member input driving improvement activities, but also that
information about those quality improvement activities are being given back to members,
increasing member education about the quality improvement process.
For example, a member of the BHI QI Department attends the Member Advisory Board meeting
on a monthly basis in order to educate members about the activities of the QI department
(including member satisfaction surveys, education about practice guidelines, etc.) and receive
feedback about the barriers they may experience (including accessing services, the quality of care
received, etc.)
Additional mechanisms for incorporating the member experience into the quality improvement
department are outlined in the following sections:
Member Satisfaction (BHI Member Experience Survey)
Member Satisfaction (ECHO Survey)
Grievances and Appeals
Quality of Care Concerns
Critical Incident Reporting
Member Satisfaction (BHI Member Satisfaction Survey)
Summary of project – Quality of Services
Member evaluation of health plan services offered through BHI is critical to the identification of
opportunities to improve all aspects of care provided to our members. BHI has conducted its
member surveys since 1996. Satisfaction surveys provide BHI with knowledge on member
perceptions of well-being, independence, and functional status as well as perceptions on the scope
of services offered, accessibility to obtain services when needed, availability of appropriate
practitioners and services, and acceptability or “fit” of the practitioner, ensuring program changes
and services redesign in meeting the members’ unique needs and preferences. This feedback helps
to modify the service system for actual utilization patterns and enables member choice. If a
pattern is detected or there is a statistically significant level of concern, BHI requires and/or
develops a corrective action plan.
For 2015, BHI conducted a Member Experience Survey of 25 questions to assess Utilization
Management services and Access to Care as well as to assess more thoroughly acceptability or
“fit” of the practitioner, program, and services in meeting the members’ unique needs and
preferences. In April, the surveys were given to CMHC sites and Drop-in Centers, and mailed to a
random sample of CPN members. Surveys had to be sent back to BHI to start the analysis by May
30, 2015 giving approximately six weeks to complete the survey.
The total population size used for determining the needed number of completed surveys was
21,685 members. This was the total number of members who received services from the start of
FY14 (July 1, 2014) through January 24, 2015 when the sample was obtained. Using the sample
size calculator, it was determined that 393 members was a sufficient overall sample size. The
Page 84
BHI Annual Quality Report FY15 83
sample size calculator prepares a random sample where n = N/(1+(N*0.0025)) where sample
error & confidence level = 0.05 & 95% from study population, with a 5% oversample.
For 2015, BHI provided each CMHC with an electronic version of the Member Survey, allowing
them to produce as many copies as necessary for maximum distribution. This was also done as to
enable them to add additional specific location codes to aid them in tracking responses by
location. These codes were logged for each CMHC and analysis offered for their own internal
use.
Table 43: Sample Methodology
Sample Methodology
Group
Population
Size
Percent of
Total
Desired
Sample Size
Returned
Surveys
ADMHN 3,332 15.37% 60 258
AuMHC 6,237 28.76% 113 577
CRC 4,624 21.32% 84 434
CPN 7,165 33.04% 130 10
Drop-In Centers 3,27 1.51% 6 10
Total 21,685 100% 393 1289
BHI matched the Member Satisfaction Survey questions and the additional survey questions to
the NCQA categories of: Services, Accessibility, Availability, and Acceptability. Members
responded to the questions by answering Poor, Fair, Good, Very Good, or Excellent on the
questions regarding how well they rated different aspects of their treatment across categories, and
Yes or No to three access-related questions, specifying whether they received services in a timely
manner. The measurement of “satisfaction” was determined by dividing the number of members
who responded with Good, Very Good, Excellent, or Yes by the total number of members who
answered that question anything except Not Applicable or not answered.
The Services category refers to the scope of services offered by the organization. It includes the
following questions:
The services you received
The help you received when you called the BHI office
The grievance process (not the outcome)
The BHI/Medicaid appeal process (not the outcome)
If I requested a change of provider, how was it handled
How were you treated by BHI staff when you called or stopped by
The courtesy shown to you by staff
The appropriateness of therapies and interventions offered
The ability of services to meet your needs
The availability of staff to talk with you
Accessibility is the ability of the organization to obtain, readily and easily, services when needed.
It includes the following questions:
The process of getting the services you needed approved
The time it took to approve the services you received
Signs and directions to treatment areas
Page 85
BHI Annual Quality Report FY15 84
The ability to reach desired department or person by phone
The hours appointments are available
The time spent in the waiting area for your scheduled appointment
If you had a mental health emergency and you contacted your provider, were you
contacted by someone with 1 hour and/or told to go the ER or call 911 for help?
If you had an urgent need to speak with someone about your mental health, and called
your clinician, were you contacted by someone within 24 hours of your initial call?
If you needed to schedule a routine office visit, were you scheduled and seen within 7
business days of your request (this includes walk-in and “open access”)?
Availability is the presence of the appropriate types of practitioners, providers, and services in
locations convenient for members. It includes the following questions:
Convenience of travel between provider locations
Length of time between making appointment and seeing the psychiatrist
Length of time between making appointment and seeing the therapist/counselor
The Acceptability category refers to the “fit” of the practitioner, program and services with the
member receiving care, representing an organization’s “cultural competence,” or its capability to
assess and meet the special, cultural, ethnic, communication and linguistic needs and preferences
expressed by its members. It includes the following questions:
The way your cultural needs or preferences were met
The way your linguistic needs or preferences were met
The way your special needs or preferences were met (such as disability, living situation
multiple diagnosis, medical condition, or substance use)
Goal from FY15
Project Title Goal(s) Action(s) Target Date
Member Satisfaction
Surveys
Meet or exceed satisfaction
results from FY14
Support OBH and the Department on
implementation with the ECHO survey 6/30/15
Results and Analysis
Table 44 shows the demographics of the members who completed the BHI Member Experience
Survey. BHI continues to have the highest number of members who are between the ages of 18-
64, as well as a predominantly white and female population.
Table 44: Member Experience Survey Demographics
Member Age Member Race
0-12 18.54% White 66.17%
13-17 15.82% Black 10.44%
18-64 63.18% Asian 1.77%
65+ 2.46% Pacific Islander <1%
Member Gender American Indian 2.88%
Male 40.77% Other 17.98%
Female 59.23%
Hispanic/Latino Origin
Yes 32.59%
Page 86
BHI Annual Quality Report FY15 85
Table 45: BHI Member Experience Survey results
Percentage Satisfied*
FY15 FY14 FY13
Services 92% 93% 91%
Accessibility 88% 90% 82%
Availability 89% 91% 91%
Acceptability 93% 92% 91%
Overall 91% 92% 86%
*Percent of Good, Very Good, Excellent, and “Yes” responses for the survey questions in each category
Overall, member’s satisfaction scores remain higher than the baseline year (FY13) with the
exception of the availability category. It is important to note that the decrease in satisfaction from
FY13 to FY15 was minimal. Table 45 shows the results of the BHI Member Experience Survey
based on NCQA categories. Of the four member satisfaction categories, three (Services,
Accessibility, Availability) declined slightly from last year’s results. BHI saw an improvement in
the Acceptability category, while the other categories decreased slightly as well as the overall
score. BHI established a goal of 90% in each category as well as 90% or greater overall for
member experience.
BHI failed to meet the goal in two of the three categories this year. Scores were at 88% and 89%
for the accessibility and availability categories, respectively. BHI believes that these scores are
still well within normal range for member satisfaction. BHI expected the accessibility experience
to fall this year because of the notable access to care issues, not only related to routine
appointments but also emergency face to face wait time. Comments from the member satisfaction
survey were analyzed due to the fall below 90%. Comments indicated members found it difficult
to reach their therapist or psychiatrist via phone. BHI will address this issue in FY16 through
interventions noted in this section.
The availability category decreased from FY14 to FY15 and was likely due to wait times in
between appointments with psychiatrists and therapists. Due to the decline in wait times for
medication evaluations, this is expected. While access to medication evaluations only assesses the
percent of members who were offered a medication evaluation appointment within 30 days of
their request for one, continued access to medication appointments has been a concern for BHI,
CMHCs and other providers. In FY15, BHI added University Physician, Inc. as a provider to the
network to provide psychiatry services. BHI is also actively recruiting independent prescribers
outside of the CMHCS to provide services to members.
Barrier analysis and planned interventions
One barrier identified was that BHI members interact almost exclusively with staff from the
CMHCs, where members are receiving services, and very rarely do members directly interact
with BHI. This year, BHI created a separate section of the Member Experience Survey with
instructions to answer questions related to the member experience with his/her current provider.
Survey results analyzed questions from both parts of the surveys, which included member
experience with BHI and with providers. The majority of members receive services through the
CMHCs. It is still very likely that members answered all the questions from the perspective of
their interactions with the CMHCs.
Page 87
BHI Annual Quality Report FY15 86
BHI recognizes that while the overall sample size was adequate to meet NCQA sample size
needs, the number of returned surveys from the CPN were low. The criteria for the population of
members seen by the CPN included currently being enrolled in BHI and receiving at least one
service within the last year. If members saw more than one provider for more than one service,
the primary provider was identified as where the members received the most services. Members
selected from the CPN population and included in the sample could have only received one
service and received a survey. It is unlikely that if a member only received one service during a
year that he/she would send back a survey.
A final barrier to the CPN response rate is that BHI did not offer an incentive to participate in the
survey this year. Last year, BHI had members who returned the survey also return an
informational card so they could be contacted if they won the incentive. The incentive was a $20
gift card to Target.
Based on the results and the barrier analysis BHI will implement the following interventions for
the FY16 member experience surveys.
1) When selecting a random sample of CPN members to mail the survey to, BHI will identify
members who have received at least five services within the past five months to be
selected for the sample. This will ensure members who are completing the survey can
provide an appropriate assessment of BHI and the provider.
2) BHI will again offer the $20 gift card incentive for completing and returning the survey.
3) BHI will provide members with a short instructional page about the survey, explaining the
purpose, intended outcomes, and gift-card incentive information.
4) BHI will continue to monitor access to care measures, including access to medication
evaluations, quarterly to determine if interventions are needed on an on-going basis.
5) BHI will continue to monitor grievances/complaints quarterly to determine if services
offered, accessibility, availability, and/or acceptability become an issue with a particular
provider.
6) BHI will continue to monitor network adequacy on a quarterly basis to determine if an
increase in providers is necessary.
7) In PEO, BHI will discuss how a member can reach his/her therapist/psychiatrist or other
provider by phone and if any data is collected on the response time.
Goal(s) for FY16
Project Title Goal(s) Action(s) Target
Date
Member Satisfaction
Surveys
Meet or exceed results from
the FY15 BHI Member
Survey
Develop new sample size methodology
for members seen by CPN
6/30/16
Offer incentive for completing survey
Develop instructional sheet for survey
with information about BHI
Continue to monitor access to care
measures
Continue to monitor grievances by
category
Continue to monitor network adequacy
Discuss how members can contact
provider outside of appointment times
Page 88
BHI Annual Quality Report FY15 87
Member Satisfaction (ECHO)
Summary of project – Quality of Services
Beginning in 2014, the Department of Health Care Policy and Financing (HCPF) contracted with
Health Services Advisory Group to initiate a member satisfaction survey to replace the previously
used Mental Health Statistics Improvement Program (MHSIP), Youth Services Survey (YSS),
and Youth Services Survey for Families (YSS-F). BHI supported the implementation of the
survey and shared the results with key stakeholders through the Program Evaluation and
Outcomes Committee.
Satisfaction surveys were given to clients identified as having received at least one behavioral
health care service through one of the participating behavioral health organizations (BHOs)
and/or BHO-contracted community mental health centers (CMHCs) and specialty clinics. The
goal of the ECHO Survey is to provide performance feedback that is actionable and will aid in
improving overall client satisfaction.
The survey instrument selected for adult clients was a modified version of the Adult ECHO
Survey, Managed Behavioral Healthcare Organization (MBHO) Version 3.0, which incorporates
items from the MHSIP survey. The survey instrument selected for child clients was a modified
version of the Child/Parent ECHO Survey, MBHO Version 3.0, which incorporates items from
the YSS-F and the YSS. Adult clients and parents/caretakers of the child client (or the child
client) completed the surveys from July to October 2014.
Adult clients eligible for ECHO Survey sampling included clients who were identified as having
received at least one behavioral health service or treatment from one of the five participating
BHOs, as reflected in the encounter data, or corresponding BHO-contracted CMHCs and
specialty clinics during the measurement year (i.e., January 1, 2013 to December 31, 2013). For
the Medicaid population, clients eligible for sampling included those who were enrolled in
Medicaid at the time the sample was created and who were continuously enrolled for at least 11
out of the last 12 months in 2013 (January through December 2013), with no more than one gap
in enrollment of up to 45 days. Additionally, adult clients eligible for sampling included those
who were 18 years of age or older as of December 31, 2013. The child clients eligible for the
ECHO survey sampling were identified in the same way as the adults. Additionally, child clients
eligible for sampling included those who were 17 years of age or younger as of December 31,
2013.
BHI matched some of the ECHO questions to the NCQA categories of Services, Accessibility,
and Acceptability. There were no questions on the ECHO that correlated with the Availability
category for NCQA.
Page 89
BHI Annual Quality Report FY15 88
The Services category refers to the scope of services offered by the organization. It includes the
following questions from the ECHO survey:
In the last 12 months, how often did anyone talk to you about whether to include your
family or friends in your counseling or treatment?
In the last 12 months, were you told about self-help or support groups, such as consumer-
run groups or 12-step programs?
In the last 12 months, how often were you given information about different kinds of
counseling or treatment that are available?
In the last 12 months, were you given information about your rights as a patient?
In the last 12 months, did you feel you could refuse a specific type of medicine or
treatment?
In the past 12 months, how much were you helped by the counseling or treatment you got?
In the last 12 months, how often did you /your family get the professional help you wanted
for yourself/your child?
In the last 12 months, how often did you feel you/your child had someone to talk to for
counseling or treatment when you were/your child was troubled?
In the last 12 months, were you given as much information as you wanted about what you
could do to manage your/your child’s condition?
Accessibility is the ability of the organization to obtain, readily and easily, services when needed.
It includes the following questions from the ECHO survey:
In the last 12 months, how often did the people you went to for counseling or treatment
spend enough time with you/your child?
In the last 12 months, how often did you get the professional counseling you/your child
needed on the phone?
In the last 12 months, when you/your child needed counseling or treatment right away,
how often did you see someone as soon as you wanted?
In the last 12 months, not counting times you/your child needed counseling or treatment
right away, how often did you get an appointment for counseling or treatment as soon as
you wanted?
In the last 12 months, how often were you seen within 15 minutes of your/your child’s
appointment?
The Acceptability category refers to the “fit” of the practitioner, program and services with the
member receiving care, representing an organization’s “cultural competence,” or its capability to
assess and meet the special, cultural, ethnic, communication and linguistic needs and preferences
expressed by its members. It includes the following questions from the ECHO survey:
In the last 12 months, how often did the people you went to for counseling or treatment
listen carefully to you?
In the last 12 months, how often did the people you went to for counseling or treatment
explain things in a way you/your child could understand?
In the last 12 months, how often did the people you went to for counseling or treatment
show respect for what you/your child had to say?
In the last 12 months, how often did you feel safe when you were with the people you
went to for counseling or treatment?
Page 90
BHI Annual Quality Report FY15 89
In the last 12 months, how often were you involved as much as you wanted in your/your
child’s counseling or treatment?
In the last 12 months, was the care you/your child received responsive to your needs
(related to language, race, religion, ethnic background, culture)?
Goal from FY15
Project Title Goal(s) Action(s) Target
Date
Member Satisfaction
Surveys
Continue to monitor and
improve member satisfaction
with services
Support OBH and the Department on
implementation of the ECHO survey. 6/30/15
Results and analysis
Table 46: Survey Response Rates
Sample Distribution and Response Rates for Adults
Total Sample Eligible Sample Total Respondents Response Rate
Overall Colorado BHO Program 7,690 6,343 1,608 25.35% Behavioral Healthcare, Inc. 1,538 1,278 339 26.53%
Sample Distribution and Response Rates for Children Total Sample Eligible Sample Total Respondents Response Rate
Overall Colorado BHO Program 7,690 5,965 1,120 18.78% Behavioral Healthcare, Inc. 1,538 1,232 267 21.67%
Table 47: Age Demographics
Adult Age Demographics
18 -24 25 - 34 35 - 44 45 - 64 65+ Overall Colorado BHO Program 6.1% 15.7% 18.9% 51.9% 7.4% Behavioral Healthcare, Inc. 8.0% 17.8% 22.5% 45.8% 5.8%
Child Age Demographics
1 - 3 4 - 7 8 - 12 13 - 18 Overall Colorado BHO Program 0.9% 14.7% 38.0% 46.3% Behavioral Healthcare, Inc. 0.4% 15.1% 42.9% 41.7%
Table 48: Race/Ethnicity Demographics
Adult Race/Ethnicity Demographics
Multi-
Racial White Black Asian
Native American
Other
Overall Colorado BHO Program 7.8% 72.6% 6.6% 1.3% 1.9% 9.8% Behavioral Healthcare, Inc. 9.1% 70.7% 7.9% 3.8% 0.9% 7.6%
Child Race/Ethnicity Demographics
Multi-
Racial White Black Asian
Native American
Other
Overall Colorado BHO Program 12.9% 67.2% 6.3% 0.7% 1.2% 11.8% Behavioral Healthcare, Inc. 10.3% 66.1% 7.3% 1.3% 0.4% 14.6%
Page 91
BHI Annual Quality Report FY15 90
Table 49: Gender Demographics
Adult Gender Demographics
Male Female
Overall Colorado BHO Program 32.6% 67.4% Behavioral Healthcare, Inc. 33.8% 66.2%
Child Gender Demographics
Male Female
Overall Colorado BHO Program 58.2% 41.8% Behavioral Healthcare, Inc. 59.8% 40.2%
Demographic information for BHI members appeared to be comparable to the overall Colorado
BHO program demographic results. ECHO survey results were analyzed by NCQA category;
however, the ECHO survey did not contain any questions related to availability. BHI chose not to
combine the results of the BHI Member Experience survey with the results of the ECHO survey,
as the timing of the surveys was different. Results for the ECHO survey by NCQA category are
presented in Table 50. The percent satisfied was calculated by dividing the number of survey
questions for each category with a “yes,” “usually” or “always” answer by the total number of
responses (not applicable and blank/missing responses were omitted from the percent satisfied
calculation).
Table 50: Results of ECHO Survey (Adult and Child)
Percentage
Satisfied*
FY14
Services 74%
Accessibility 71%
Acceptability 86%
Overall 77%
*Percent of “Usually,” “Always,” and “Yes” responses for the survey questions in each category
Since this is the first year of the ECHO survey, BHI does not have previous year results to
compare. The ECHO survey results by category were lower than the BHI member experience
survey. Of the three categories, accessibility was the lowest on the ECHO survey as well as on the
BHI survey. This is likely due to the access to care issues experienced throughout the year. As
mentioned in the access to care section of this report, providers struggled with meeting standards
related to routine access to care at the end of FY14 and the beginning of FY15. Providers also
struggled with providing emergency care within one hour of the request during FY15. BHI is
continuing to monitor access to care issues through data sent in by providers, the grievance
process, and assessment of member experience.
Barrier analysis and planned interventions
One barrier identified during the implementation of the ECHO was the timing of the survey. The
survey was sent out to members who received at least one behavioral health service between
January 1, 2013 and December 31, 2013 which was halfway through FY13 and into FY14. The
survey period was from July-October of 2014, which depending on when the member was
receiving services could have been up to a year and a half after the member received services.
Page 92
BHI Annual Quality Report FY15 91
BHI believes that the internal member experience survey conducted each year represents a more
accurate picture of member experience with services, accessibility, availability, and acceptability.
The BHI member experience survey allows members who are actively in treatment within the
CMHCs to discuss their experience. BHI also includes a sample of members who are currently
being seen within the Contracted Provider Network and at the BHI drop-in centers; therefore, a
more comprehensive picture of member experience is collected and analyzed.
Another barrier to assessing member satisfaction via the ECHO survey is survey burnout. BHI
completes the internal member experience survey every spring and the ECHO is completed in the
late summer/early fall. Because of this, members are more likely to experience survey burnout
when completing the ECHO, as it is potentially the second survey the member has had to fill out
within a year period.
Finally, BHI identified that the length of the ECHO survey could also contribute to the low
responses and low response rates. BHI’s member experience survey is about 30 questions while
the ECHO has 59 questions. In addition, the sample size for the ECHO survey was only 267 for
children and 339 for adults. With the very small sample size, it is difficult to draw conclusions
and implement appropriate interventions.
BHI does not have any planned interventions for the ECHO survey results, as BHI does not
control the timing, sample size, or data collection for the ECHO nor are there results to compare.
BHI will continue to support the Department in efforts to continue the survey process in the next
fiscal year and provide feedback about the survey process to HCPF and HSAG. BHI will continue
to analyze the ECHO survey results according to the NCQA categories and develop interventions
as needed.
Goal(s) for FY16
Project Title Goal(s) Action(s) Target
Date
Member Satisfaction
Surveys
Compare ECHO survey
results from FY14 to FY15
when FY15 results are
available.
Continue to analyze ECHO survey results
according to NCQA categories and
implement interventions if needed.
6/30/16
Page 93
BHI Annual Quality Report FY15 92
Grievances and Appeals
Summary of project – Quality of Services
It is the policy of BHI to support the rights of members, family members and interested others to
register concerns and/or file grievances related to any issue regarding the care received through
BHI and provide reasonable assistance in completing any forms requested. The purpose of this
policy is to ensure that clients and interested others have a means of providing ongoing feedback
to the BHI system which results in prompt resolution of individual problems, the tracking of
problematic trends within the system, an overall improvement in the quality of services, and the
prevention of retaliation.
Goal from FY15
Project Title Goal(s) Action(s) Target
Date
Grievances and Appeals
Improve the process by
which members and family
members have a means of
providing ongoing feedback
to BHI
Continue to collect and analyze grievance
and appeal data through the quarterly
Performance Report Card
6/30/15
Results and analysis
In an effort to monitor member and family concerns about quality of care issue, BHI operates a
comprehensive grievance tracking and resolution process. Figure 18 shows the trend in number of
grievances for the past four quarters.
Figure 18: Grievance data by quarter
0
4
8
12
16
20
24
Q1 Q2 Q3 Q4
Grievances Reported in FY15
Page 94
BHI Annual Quality Report FY15 93
Table 51 shows the number of complaints and appeals by NCQA category for the past year, by
quarter. Note: BHI defines a “grievance” as a member complaint.
Table 51: Grievances by Category, by quarter for FY15
2014 - 2015 Grievances by Category
Category
FY15
Q1
FY15
Q2
FY15
Q3
FY15
Q4
FY15
Total by
Category
FY15
Percentage
of Total
FY14
Total by
Category
FY14
Percentage
of Total
Quality of Care 8 4 7 7 26 44.07% 23 48.94%
Access 3 3 3 5 14 23.73% 1 2.13%
Attitude and Service 2 1 4 6 13 22.03% 15 31.91%
Billing and Financial
Issues 1 0 1 0 2 3.39% 6 12.77%
Quality of Practitioner
Office Site 0 0 0 0 0 0.00% 1 2.13%
Rights/Legal 1 1 0 2 4 6.78% 1 2.13%
Total Number of
Grievances 15 9 14 20 59 100.00% 47 100.00%
BHI understands that the majority of the grievances are going to be in the quality of care, access,
and customer service categories. The quality of care category also has the biggest number of
subcategories. The number of grievances filed increased by 26% from FY14 to FY15. One
possible explanation for this is the revision to the grievance process. BHI is now handling the
majority of grievances related to its members, instead of allowing providers to handle the
grievances internally. Another possible explanation for the increase in the number of grievances is
related to how grievances are being filed by BHI. If a member files a grievance about two
different categories, then BHI counts each category of grievance as a separate grievance, instead
of choosing the first category.
BHI also saw a significant increase in the number of grievances related to access. This is likely
due to the aforementioned access to care issues experienced throughout the BHI network within
the last year. Of the 14 access related grievances filed in FY15, four were related to appointment
delays, four were related to call back issues, one was related to telephone accessibility, one was
related to wait time for scheduled appointment, and four were categorized as “other.” The BHI QI
Department reviewed each of these grievances to determine if any trends occurred. Several of the
grievances in the access category were related one of BHI’s CMHCs. Since the CMHC
implemented an “open access” system for medication evaluations and appointments, the number
of grievances increased. Due to the new system, it was expected that this increase in grievances
would occur and BHI is working with the CMHC to ensure members are receiving care in an
appropriate amount of time. Three of the grievances related to access also required the provider
and/or BHI to implement formal corrective action plans to ensure the issue did not continue to
occur.
BHI also saw an increase in the number of grievances related to Rights/Legal issues from FY14 to
FY15. Two of the five grievances in this category were related to HIPPA, one was related to
member rights, and one grievance was filed as “other.” Due to the increase in the number of
grievances in this category, BHI QI staff reviewed the grievances, but found no significant trends.
Page 95
BHI Annual Quality Report FY15 94
The number and overall percentages of grievances related to quality of care, attitude and service,
and billing and financial issues each decreased from FY14 to FY15. Since the number of
grievances related to quality of care remained high, BHI QI Department also reviewed these
grievances and found that a majority of the grievances (14) in this category were related to one
CMHC. Two grievances were filed under the subcategory of coordination of care, three were filed
under medication issues, five were under service delivery issue, and four were related to
professional conduct/competence. Nine of the 14 grievances were substantiated and three required
a formal corrective action plan. There were no trends identified in the grievances; however, QIC
met to discuss the increase in grievances from the one CMHC. It was determined that a quarterly
meeting with the CMHC to review grievances and other data would be set up through the COO of
BHI and the COO of each of the CMHCs within BHI’s catchment area. The meeting will focus on
data collection and review of data with each CMHC individually to determine if corrective action
is needed.
Upon review of a request for services, if BHI determines that the request for service does not
meet medical necessity a notice of action is given. If the member is dissatisfied with the Notice of
Action, they have a right to appeal this action locally and/or through a State Fair Hearing. Table
52 shows the types of action appealed in FY15 and the results of the local appeal and/or State Fair
Hearing.
Table 52: Appeals
Type of Action Appealed FY15 Q1 FY15 Q2 FY15 Q3 FY15 Q4
Denial or limited authorization of a requested service,
including the type or level of service 5 4 2 0
Reduction, suspension or termination of a previously
authorized service 0 0 0 0
Failure to provide services in a timely manner 0 0 0 0
Failure to act within timeframes provided in rule 8.209 0 0 0 0
Appeal Outcome
Local Level – Appeal Upheld (Action Overturned) 2 0 0 0
Local Level – Appeal Denied (Action Upheld) 3 4 2 0
State Fair Hearing – Appeal Upheld (Action Overturned) 0 0 0 0
State Fair Hearing – Appeal Denied (Action Upheld) 0 0 0 0
Both grievances and appeals are analyzed by quarter and addressed by the Office of Member and
Family Affairs and the Utilization Management Department. BHI does not set “goals” for the
number of appeals or grievances filed as members are encouraged to file for both as often as
needed and necessary.
Barrier analysis and interventions
As seen in Table 51, almost 50% of the grievances within the past fiscal year were related to
quality of care issues. Quality of Care grievances also has the largest subcategory groups and
therefore it is expected that a majority of the grievances will fall here. Across FY15 there were
seven grievances that resulted in a corrective action plan. These included a member not being
involved in treatment planning, inadequate discharge planning, delays in providing medication
reviews/outpatient services, and a member being discharged from the emergency department
rather than being transferred to an inpatient facility.
Page 96
BHI Annual Quality Report FY15 95
All corrective action plans were developed and implemented to a satisfactory standard, with
lessons learned from each of the grievances in place to prevent similar incidents from repeating.
BHI will continue to monitor reported grievances into FY16 and look for any trends that may
identify the necessity for corrective action.
Goal(s) for FY16
Project Title Goal(s) Action(s) Target
Date
Grievances and Appeals
Continue the process by
which members and family
members have a means of
providing ongoing feedback
to BHI
Continue to collect and analyze grievance
and appeal data through the quarterly
Performance Report Card and quarterly
meetings with the CMHCs
6/30/16
Page 97
BHI Annual Quality Report FY15 96
Quality of Care Concerns
Summary of project – Quality and Safety of Clinical Care
BHI’s Quality of Care Concerns (QOCC) system identifies, investigates, and addresses potential
quality of care concerns, including those involving physician providers. QOCC detection is
permanently built into BHI’s standard operating procedures and requirements. QOCCs include all
potential problems, concerns, or complaints concerning access to urgent or emergent care, delay
or denial of care or services, after-hours services, professional conduct or competence,
coordination of care, medication issues, diagnosis issues, service plan or delivery issues, or
concerns with legal or member rights. QOCCs are also triggered by care resulting in unexpected
death, suicide attempts requiring medical attention, medication errors, or adverse medication
effects requiring medical attention, preventable complication requiring medical attention, assault
or accident related injuries requiring medical attention, or an at-risk client missing from a 24-hour
facility.
A potential quality of care concern regarding one or more BHI members can be reported to BHI
by any of the following entities: HCPF, an employee of BHI, a Client Representative, a clinician,
or an external agency. Any concerns raised by a member will be forwarded to the Office of
Member and Family Affairs to be handled as a grievance.
Goal(s) from FY15
Project Title Goal(s) Action(s) Target
Date
Quality of Care
Concerns
Address any potential
member safety issue
Continue to trend QOCCs by provider and
by category and address any patterns
6/30/15 Continue to work with individual providers
on corrective actions if a QOCC is
substantiated
Results and analysis
In FY15, BHI has investigated nine QOCCs, six of which were substantiated. For these issues,
corrective action plans were completed and implemented by the facility involved and resulted in
changes to the applicable programs to assure a better quality of care. Table 53 below indicates the
categories of the QOCCs reported in FY15, whereas Figure 19 indicates the number of QOCCs
reported in each quarter of FY15. BHI continues to improve the process by which QOCCs are
reported and investigated. Therefore, BHI considers objectives related to this project to be met.
Table 53: Categories of FY14 QOCCs
QOCC Category Unsubstantiated Substantiated
Professional conduct or competence 1 2
Medication issues 0 1
Coordination / continuity of care 1 1
Discharge planning 0 1
Suicide attempt requiring medical
attention 1 1
Page 98
BHI Annual Quality Report FY15 97
Figure 19: QOCCs reported by quarter in FY15
Barrier analysis and interventions
BHI now discusses all QOCCs at QIC to be able to review the concerns and make suggestions for
further actions. This also provides an opportunity to bring together any other feedback in relation
to specific providers that are subject to QOCCs and discuss any recurring themes or incidents. In
FY15 one provider in particular had three QOCCs, two of which were substantiated and therefore
it was decided by the Committee that a further investigation into overall care would be carried
out.
Goal(s) for FY16
Project Title Goal(s) Action(s) Target
Date
Quality of Care
Concerns
Address any potential
member safety issue
Continue to trend QOCCs by provider &
category and address any patterns
6/30/16 Continue to work with individual providers
on corrective actions if a QOCC is
substantiated
0
1
2
3
4
Q1 Q2 Q3 Q4
QOCCs Reported in FY15
Page 99
BHI Annual Quality Report FY15 98
Critical Incident Reporting
Summary of project – Quality and Safety of Clinical Care
In order to more closely monitor the safety of clinical care our members were receiving, BHI
developed a Critical Incident reporting policy and procedure back in FY14. BHI now requires any
provider/agency/facility it credentials, contracts with, or approves to provide services
(“Providers”) to report Critical Incidents involving BHI members to the BHI Quality
Improvement Department. Reporting and investigation of Critical Incidents recognizes the
importance of health, safety, and well-being of members. BHI believes a standard system of
reporting Critical Incidents will enhance the quality of service provided and minimize the risk of
harm to members.
Critical Incidents report in FY15 included the following:
Assaultive Behavior
Breach of Confidentiality
Diverted Drugs
Medical Condition
Member AWOL
Restraint/Seclusion
Serious Physical Injury
Suicide
Suspected Neglect
Attempted Suicide
Death
Injury
Medication Error
Missing Person
Seclusion
Sexual Contact
Suicide
Suspected Physical/Sexual Abuse
Goals from FY15
Project Title Goal(s) Action(s) Target
Date
Critical Incident
Reporting
Address any potential
member safety issue
Continue to trend critical incidents by
provider and by category and address any
patterns 6/30/15
Increase compliance with
critical incident reporting
Outreach providers and provide education
about the critical incident reporting
process
Results and analysis
BHI receives Critical Incident reports from providers, documents information related to the
Critical Incident in a database, and will investigate further as needed. BHI generates a report of
critical incidents and reports results to the Quality Improvement Committee monthly.
FY15 was the first full year that critical incidents were being reported to BHI and therefore the
process is still being updated and improved. Table 54 below highlights the total number of
incidents reported throughout the year, as well as the most commonly reported types of incident.
Restraint & seclusion is the highest category of incidents reported, which is expected, as
providers are required to report every instance of restraint and seclusion of a BHI member.
Page 100
BHI Annual Quality Report FY15 99
Table 54: Critical Incident Reporting FY15
Critical Incident Information FY15
Number of Critical Incidents 624
Number of Unique Members 218
Number of Members 2 or more CIs 63
Most CIs on one member 44
Highest Frequency: Critical Incident Categories
Restraint/Seclusion 359 (58%*)
Assaultive Behavior 50 (8%*)
Death 47 (8%*)
Medical Condition 37 (6%*)
Medication Error 37 (6%*)
* Percentage of the total critical incidents submitted
Figure 20: Critical Incidents reported by quarter in FY15
Barrier analysis and planned interventions
BHI recognizes that the Critical Incident reporting process is still relatively new and therefore
FY15 was used as a time to review the processes and update as necessary. During the
development of this policy and procedure, BHI conducted research about provider reporting
requirements for other entities, such as the Office of Behavioral Health and the Colorado
Department of Public Health and Environment. BHI attempted to align its Critical Incident form
with other entity forms; due to the fact that providers’ own forms are very different BHI is
looking to align with the Office of Behavioral Health form for FY16.
130
135
140
145
150
155
160
165
170
Q1 Q2 Q3 Q4
Critical Incidents Reported in FY15
Page 101
BHI Annual Quality Report FY15 100
BHI has noticed that not all providers are reporting critical incidents. The UM Dept. comes into
contact with providers more frequently than the QI Department so the two departments continue
to work internally on a strategy to educate providers about Critical Incident reporting
requirements.
Goal(s) for FY16
Project Title Goal(s) Action(s) Target
Date
Critical Incident
Reporting
Address any potential
member safety issue
Continue to trend critical incidents by
provider and by category and address any
patterns
6/30/16
Increase compliance with
critical incident reporting
Continue to outreach providers and
provide education about the critical
incident reporting process.
Facilitate reporting process to diminish
the quantity of forms providers need to
complete.
Page 102
BHI Annual Quality Report FY15 101
Section 10: BHI Quality Improvement Work Plan for FY16
Project Title Goal(s) Action(s) Target
Date
Member Population
Penetration Rates Increase overall penetration rate
by 2% from 12.28%.
Calculate penetration rates for each
CMHC in the BHI catchment area on an
annual basis
6/30/16
Network Adequacy
Network Adequacy –
Ensuring Availability
Meet the geographical needs of
members by assuring provider
availability
Continue to assess provider network
availability against BHI standards and
respond to the needs of the ever-growing
Medicaid population.
6/30/16
Network Adequacy –
Cultural Needs and
Preferences
Meet the cultural, ethnic, and
linguistic needs of members by
assuring diverse provider
network
Aggregate data provided by facilities &
incorporate into analysis
1/1/16 Continue to monitor grievances via QIC
committee related to cultural needs /
preferences
Access to Services
Access to routine,
urgent, and
emergency services
Increase the number of providers
assessed for meeting access to
care standards by 25%
Redesign secret shopper program to asses
at and align with new provider
monitoring process
1/1/16
Continue with BHI efforts to educate
providers on access to care standards and
referrals to BHI
6/30/16
Improve current access to
Emergency Face to Face care to
95%
Continue to collaborate with community
partners to determine barriers to accurate
reporting
1/1/16
Increase member experience
with access to care by 5%
Continue to educate members about
access to care standards, member
experience survey process, and definitions
of emergent, urgent, and routine
appointments
6/30/16
Redesign member experience survey
questions
Continue to educate providers about
access to care standards and when to refer
members back to BHI
Continue to monitor grievances related to
access to care via the Quality
Improvement Committee
Access to medication
evaluations
Improve compliance with 30-
day standard to 90%
Continue to monitor access to medication
evaluations on a quarterly basis and
discuss results and potential interventions
in the Program Evaluation and Outcomes
Committee as needed.
6/30/16
Compliance Monitoring
External Quality
Review Organization
(EQRO) audit
Continue to score at or above the
previous year’s performance
Coordinate with HSAG to comply with
review activities conducted in accordance
with federal EQR regulations 42 C.F.R.
Part 438 and the CMS mandatory activity
protocols
6/30/16
Delegation Oversight Oversee the quality of activities
delegated to any subcontractor
Continue to monitor the activities
delegated to Colorado Access as BHI’s 6/30/16
Page 103
BHI Annual Quality Report FY15 102
Project Title Goal(s) Action(s) Target
Date Administrative Service Organization
through Delegation Oversight
Encounter Data
Validation (411)
Audit
Increase provider overall
compliance score to 90% or
higher
Continuing to train providers on proper
billing and documentation practices no
less than quarterly 6/30/16
Maintain or improve inter-rater
reliability with HSAG
Continuing to train audit team on the
USCS Manual
Provider claim/record
audits
Increase volume of provider
audits completed to at least 30
per year
Initiate a minimum of 10 provider audits
per service category according to the
FY16 audit plan. 6/30/16
Hire two additional staff
Hire additional compliance monitoring
specialist and provider quality monitoring
specialist.
Documentation
training
Provide training to meet
provider needs
Develop additional service specific
trainings to meet provider needs. 6/30/16
Train at least 100 individual
outpatient providers
Continue to provide quarterly routine
outpatient documentation trainings and
train at least 100 providers
Performance Measures
Monitoring over- and
under-utilization
Continue to perform at or above
the statewide BHO average for
performance measures
Continue to measure some performance
indicators quarterly to monitor for
patterns and trends across services 6/30/16
Continue to monitor specific utilization
measures to determine if interventions are
working.
Member Health and
Safety
Perform at or above the
statewide BHO average for the
member health and safety
performance measures
Continue to monitor member safety
performance measures annually 6/30/16
Complete the medication safety
project with children annually
Implement annual medication safety
project 6/30/16
Implement adult medication
safety project Complete adult medication safety project 1/1/16
Coordination of Care
– Follow-up after
hospital discharge
Provide 62% of outpatient
appointments within 7 days after
hospital discharge BHI will continue to monitor this measure
quarterly and implement targeted
interventions
6/30/16 Provide 80% of outpatient
appointments within 30 days of
hospital discharge
Coordination of Care
– Improving physical
healthcare access
Continue to improve
coordination of care by 5%,
(from 87.30% to 92%).
Continue the development of the new
Complex Case Management service
6/30/16
Develop performance indicators
for complex case management.
Implement key performance indicators for
the Complex Case Management service,
in line with NCQA requirements
Adolescent
Depression Screening
and Follow-up
To improve screening and
follow-up by more than 5% by
the end of CY15
Implement interventions as presented in
the PIP write-up tool 6/30/16
Page 104
BHI Annual Quality Report FY15 103
Project Title Goal(s) Action(s) Target
Date
Coordination of Care
-E Visits
BHI will continue to support the
telehealth programs at each of
the CMHCs by developing
policies and procedures for
billing and data collection
Create policies and procedures related to
telehealth programming and data
collection
6/30/16
Information Systems
Capabilities
Assessment Tool
(ISCAT) audit
Continue to achieve 100%
compliance on the audit
Continue to monitor and assess each
aspect of the performance measure
calculation process and adjusting
accordingly
6/30/16
Clinical Practice Guidelines and Evidence-Based Practices
Clinical Practice
Guidelines
Continue developing and
implementing practice
guidelines to meet the clinical
needs of members and improve
consistency across providers
Develop new guidelines as identified by
the Standards of Practice Committee
6/30/16
Review/update 100% of practice
guidelines every two years
Continue process of reviewing/updating
all identified practice guidelines every 2
years
Continue with the distribution of
informational material to
members
Continue posting information in our
website and disseminating this
information to members
Compliance with
Clinical Practice
Guidelines
Maintain provider compliance
with Indicator 1 and increase
provider compliance with
Indicator 2 to 90%
Monitor compliance with RAD guideline
via encounter and pharmacy claims
6/30/16
Identify areas to improve performance
with the local CMHCs
Investigate prescriptions of multiple
psychotropic medications to determine
ways to avoid polypharmacy
Compliance with
Clinical Practice
Guidelines
Increase providers compliance
with all indicators by 10%
Monitor compliance with Risk
Assessment guideline via new provider
monitoring process
6/30/16 Support providers to update risk
assessment processes Educate providers about the Risk
Assessment Practice Guideline
Maintain provider compliance
with Indicator 1 and increase
provider compliance with
Indicator 2 to 80%
Monitor compliance with Atypical
Antipsychotic guideline via member
survey and laboratories to every 6 months
to improve measurement and track
progress.
6/30/16
Evidence-based and
Promising Practices
Continue monitoring EBP within
contracted providers and
develop a system to improve
fidelity and outcomes
Develop ongoing and meaningful EBP
reporting to track progress over time
6/30/16 Collaborate with contracted providers to
set goals and mechanisms to achieve
those goals related to fidelity & outcome
measures
Page 105
BHI Annual Quality Report FY15 104
Project Title Goal(s) Action(s) Target
Date
Member and Family Input into the QI Program
Member Satisfaction
Surveys
Meet or exceed results from the
FY15 BHI Member Survey
Develop new sample size methodology
for members seen by CPN
6/30/16
Offer incentive for completing survey
Develop instructional sheet for survey
with information about BHI
Continue to monitor access to care
measures
Continue to monitor grievances by
category
Continue to monitor network adequacy
Discuss how members can contact
provider outside of appointment times
Member Satisfaction
Surveys
Compare ECHO survey results
from FY14 to FY15 when FY15
results are available.
Continue to analyze ECHO survey results
according to NCQA categories and
implement interventions if needed.
6/30/16
Grievances and
Appeals
Continue the process by which
members and family members
have a means of providing
ongoing feedback to BHI
Continue to collect and analyze grievance
and appeal data through the quarterly
Performance Report Card and quarterly
meetings with the CMHCs
6/30/16
Quality of Care
Concerns
Address any potential member
safety issue
Continue to trend QOCCs by provider &
category and address any patterns
6/30/16 Continue to work with individual
providers on corrective actions if a QOCC
is substantiated
Critical Incident
Reporting
Address any potential member
safety issue
Continue to trend critical incidents by
provider and by category and address any
patterns
6/30/16
Increase compliance with critical
incident reporting
Continue to outreach providers and
provide education about the critical
incident reporting process.
Facilitate reporting process to diminish
the quantity of forms providers need to
complete.