1 Release Time IMMEDIATE Date 17 August 2021 Number 15/21 BHP RESULTS AND STRATEGIC UPDATE GROWING VALUE AND POSITIONING FOR THE FUTURE FINANCIAL YEAR ENDED 30 JUNE 2021 BHP delivered a strong set of results for the 2021 financial year, with a safe and reliable operational performance and strong financial returns. On the back of these results, the Board has announced a record final dividend of US$2.00 per share, bringing BHP’s returns to shareholder to more than US$15 billion for the full year. Our strategy is to deliver long-term value and returns through the cycle. We aim to do this through owning a portfolio of world class assets with exposure to highly attractive commodities which benefit from the mega-trends playing out in the world around us, by operating them exceptionally well, by maintaining a disciplined approach to capital allocation and through being industry leaders in sustainability and the creation of social value. As the world continues to evolve, BHP is positioning itself to benefit from the mega-trends and through sustainability leadership. To this end, today we have announced: Investment in the Jansen Stage 1 potash project which is aligned with our strategy of growing our exposure to future facing commodities in world class assets; Agreement to pursue a merger of our Petroleum business with Woodside to create a global top 10 independent energy company with a large-scale portfolio of producing, development and exploration assets; and Intention to unify our corporate structure under BHP’s existing Australian parent company to realise simplification and enhanced strategic flexibility benefits. BHP Chair, Ken MacKenzie: “BHP’s performance over the past year illustrates the strength of our portfolio, balance sheet, people and performance culture. Including the record dividend announced today of US$2.00 per share, we have returned over US$15 billion to shareholders over the past year. BHP is in a strong position to manage its future in a time of rapid change. We have a clear strategy and are executing against it. Jansen Stage 1 will give BHP exposure to a commodity with a strong demand outlook and decades of potential growth. The agreement to pursue a merger of BHP’s Petroleum business with Woodside will maximise the value of our oil and gas assets through increased operating scale and synergies, with a more diversified product portfolio to support the energy transition. Now is the right time to unify BHP’s corporate structure. BHP will be simpler and more efficient, with greater flexibility to shape our portfolio for the future. Our plans announced today will better enable BHP to pursue opportunities in new and existing markets and create value and returns over generations.” BHP Chief Executive Officer, Mike Henry: “The BHP team has achieved a great set of operational and financial results in the year past. This is thanks to both the outstanding effort of 80,000 people across the company, as well as to the support of BHP’s thousands of suppliers and customers, and our host communities and governments. Most importantly, our improved results were achieved safely, with 2021 being our second consecutive full financial year with zero fatalities in BHP operations. We achieved several production records and our four major capital projects were executed on time and on budget. We continue to invest in people and technology, setting BHP up for ongoing improvement in performance. We continue to actively position our portfolio as well for future returns and growth. We have progressed exploration and development in copper and nickel, commodities which are favourably leveraged to the mega-trends of electrification and decarbonisation. In sanctioning the Jansen Stage 1 project in Canada, we gain access not only to the healthy returns of this project on a stand-alone basis, but to a new front for growth in a future facing commodity in the world’s best potash basin and an attractive investment jurisdiction. The merger of our petroleum business with Woodside will create a top 10 global independent energy company, unlocking value for BHP shareholders, including through synergies, and a stronger, more resilient combined business that will be better positioned to continue to grow value as it navigates the energy transition.”
Transcript
1
Release Time IMMEDIATE
Date 17 August 2021
Number 15/21
BHP RESULTS AND STRATEGIC UPDATE GROWING VALUE AND POSITIONING FOR THE FUTURE
FINANCIAL YEAR ENDED 30 JUNE 2021
BHP delivered a strong set of results for the 2021 financial year, with a safe and reliable operational performance and
strong financial returns. On the back of these results, the Board has announced a record final dividend of US$2.00 per
share, bringing BHP’s returns to shareholder to more than US$15 billion for the full year.
Our strategy is to deliver long-term value and returns through the cycle. We aim to do this through owning a portfolio of
world class assets with exposure to highly attractive commodities which benefit from the mega-trends playing out in the
world around us, by operating them exceptionally well, by maintaining a disciplined approach to capital allocation and
through being industry leaders in sustainability and the creation of social value.
As the world continues to evolve, BHP is positioning itself to benefit from the mega-trends and through sustainability
leadership.
To this end, today we have announced:
Investment in the Jansen Stage 1 potash project which is aligned with our strategy of growing our exposure to future
facing commodities in world class assets;
Agreement to pursue a merger of our Petroleum business with Woodside to create a global top 10 independent
energy company with a large-scale portfolio of producing, development and exploration assets; and
Intention to unify our corporate structure under BHP’s existing Australian parent company to realise simplification
and enhanced strategic flexibility benefits.
BHP Chair, Ken MacKenzie:
“BHP’s performance over the past year illustrates the strength of our portfolio, balance sheet, people and performance
culture. Including the record dividend announced today of US$2.00 per share, we have returned over US$15 billion to
shareholders over the past year.
BHP is in a strong position to manage its future in a time of rapid change. We have a clear strategy and are executing
against it. Jansen Stage 1 will give BHP exposure to a commodity with a strong demand outlook and decades of potential
growth. The agreement to pursue a merger of BHP’s Petroleum business with Woodside will maximise the value of our
oil and gas assets through increased operating scale and synergies, with a more diversified product portfolio to support
the energy transition. Now is the right time to unify BHP’s corporate structure. BHP will be simpler and more efficient,
with greater flexibility to shape our portfolio for the future. Our plans announced today will better enable BHP to pursue
opportunities in new and existing markets and create value and returns over generations.”
BHP Chief Executive Officer, Mike Henry:
“The BHP team has achieved a great set of operational and financial results in the year past. This is thanks to both the
outstanding effort of 80,000 people across the company, as well as to the support of BHP’s thousands of suppliers and
customers, and our host communities and governments. Most importantly, our improved results were achieved safely,
with 2021 being our second consecutive full financial year with zero fatalities in BHP operations. We achieved several
production records and our four major capital projects were executed on time and on budget. We continue to invest in
people and technology, setting BHP up for ongoing improvement in performance.
We continue to actively position our portfolio as well for future returns and growth. We have progressed exploration and
development in copper and nickel, commodities which are favourably leveraged to the mega-trends of electrification
and decarbonisation. In sanctioning the Jansen Stage 1 project in Canada, we gain access not only to the healthy
returns of this project on a stand-alone basis, but to a new front for growth in a future facing commodity in the world’s
best potash basin and an attractive investment jurisdiction. The merger of our petroleum business with Woodside will
create a top 10 global independent energy company, unlocking value for BHP shareholders, including through synergies,
and a stronger, more resilient combined business that will be better positioned to continue to grow value as it navigates
the energy transition.”
News release
2
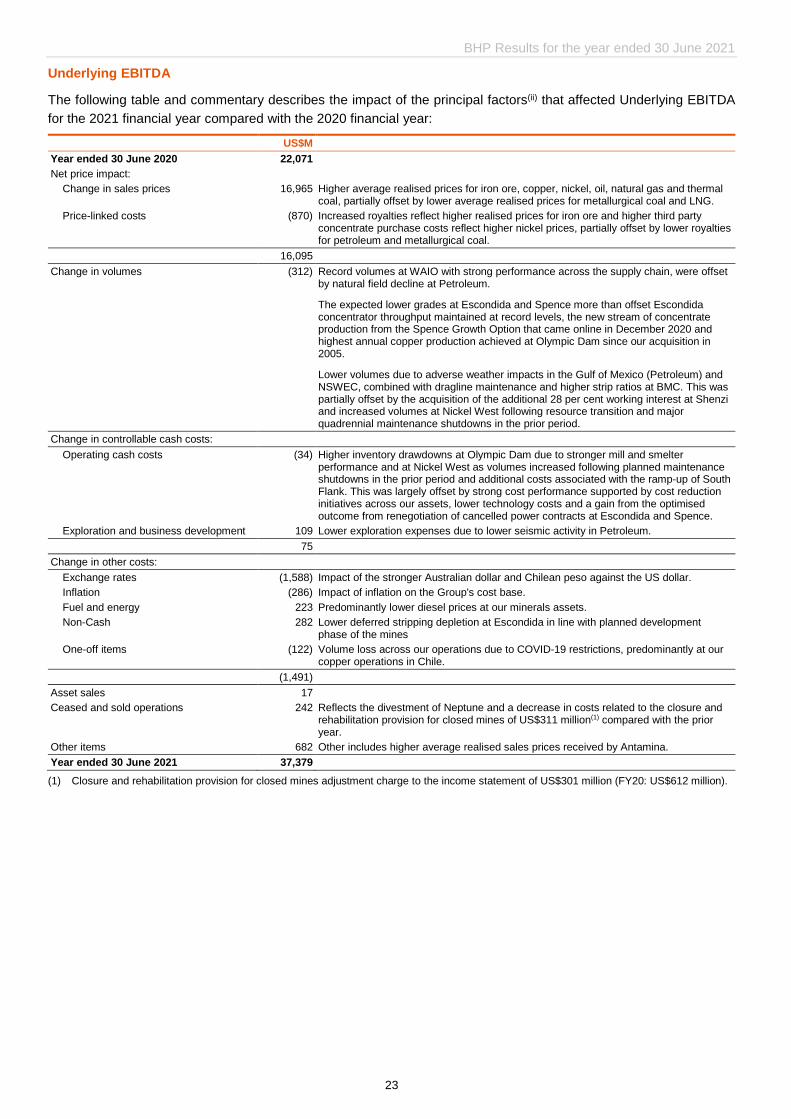
BHP Results for the year ended 30 June 2021
Note: All guidance is subject to further potential impacts from COVID-19 during the 2022 financial year.
Keeping our people and communities safe
There were no fatalities at our operated assets over the last two and a half years. High Potential Injury frequency(i)
declined by 17% and Total Recordable Injury Frequency(i) decreased by 11% during the year.
Our ongoing focus on safety, health and wellbeing has enabled us to deliver strong safety and operational
performance.
Operational excellence: Strong operational performance and free cash flow generation, with a margin of 64%
Strong underlying operational performance, with record volumes achieved at Western Australia Iron Ore (WAIO),
Goonyella and Olympic Dam, and Escondida maintained average concentrator throughput at record levels.
Profit from operations of US$25.9 billion, up 80%, and Underlying EBITDA(ii) of US$37.4 billion at a record(iii)
margin(ii) of 64%.
Attributable profit of US$11.3 billion (includes an exceptional loss of US$5.8 billion predominantly related to the
impairments of our potash and energy coal assets, and the current year impact of the Samarco dam failure).
Underlying attributable profit(ii) of US$17.1 billion, up 88% from the prior year.
Net operating cash flow of US$27.2 billion, above US$15 billion for the fifth consecutive year, and record(iii) free
cash flow(ii) of US$19.4 billion, reflects higher iron ore and copper prices, and a strong operational performance.
Disciplined capital allocation: Four major projects delivered and early stage options added
Capital and exploration expenditure(ii) within guidance at US$7.1 billion. Minerals capital and exploration
expenditure is expected to be approximately US$6.7 billion for the 2022 financial year (and a further US$2.3 billion
for Petroleum).
Successfully achieved first production at four major development projects, all of which were delivered on or ahead
of schedule and on budget. We acquired an additional 28% working interest in Shenzi in November 2020. The
Shenzi North development, a two-well subsea tie-in to the Shenzi platform, was approved in August 2021.
In exploration, we have continued to add to our early stage options in future facing commodities throughout the
year, with the recently announced recommended all-cash takeover offer of Noront Resources in Canada, the
signing of an agreement for a nickel exploration alliance in Canada and of a farm-in agreement for the Elliott copper
project in Australia. At Oak Dam in South Australia, next stage resource definition drilling commenced in May 2021.
Net debt at US$4.1 billion, compared to US$12.0 billion at 30 June 2020. In light of our announcement to pursue a
merger of our Petroleum business with Woodside, we will be reviewing our net debt target and will provide an
update with our interim results for the 2022 financial year in February 2022.
Value and returns: Consistently high cash returns, US$15.2 billion of total announced returns to shareholders
The Board has determined to pay a final dividend of US$2.00 per share or US$10.1 billion, which includes an
additional amount of US$0.91 per share (equivalent to US$4.6 billion) above the 50% minimum payout policy. Total
dividends announced of US$3.01 per share, equivalent to an 89% payout ratio.
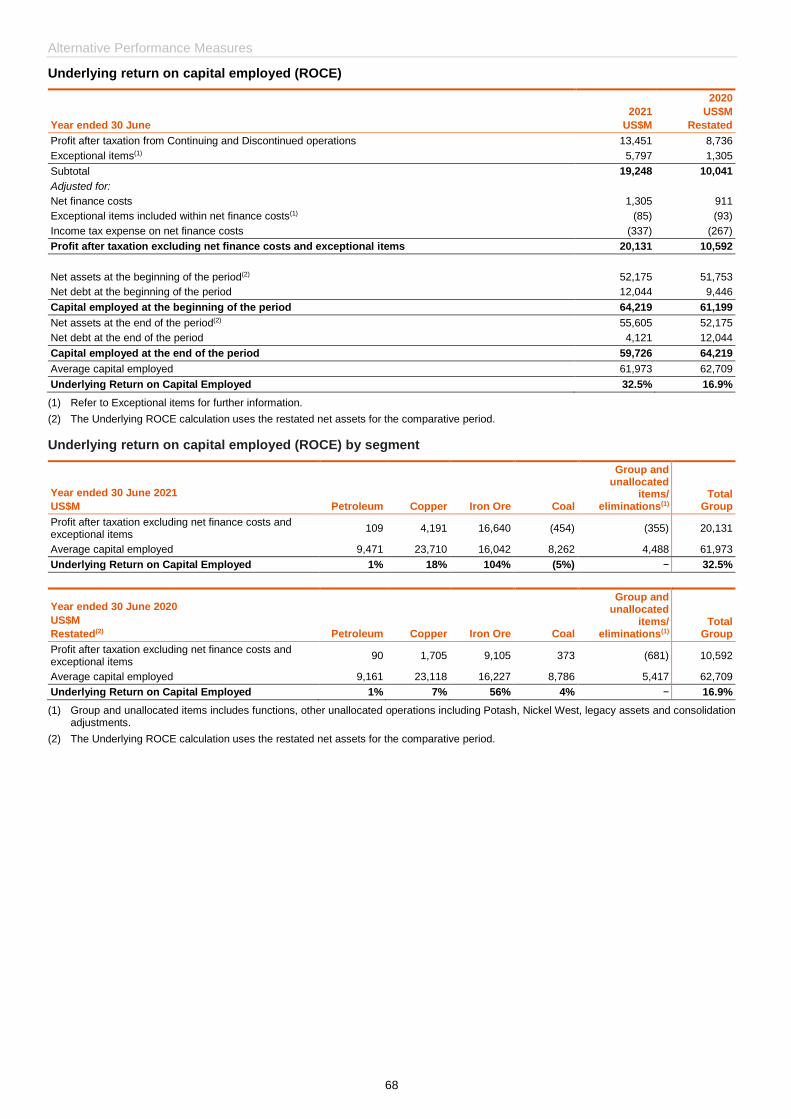
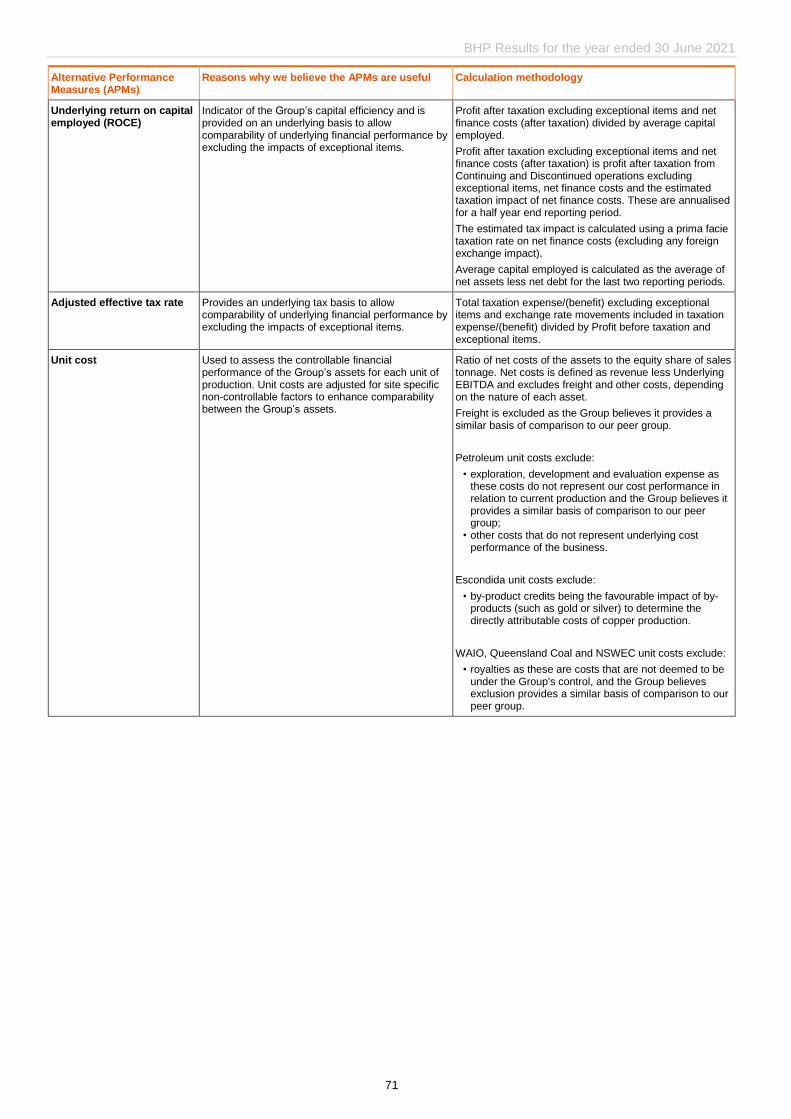
Underlying return on capital employed(ii) strengthened to 32.5%.
Year ended 30 June
2021
US$M
2020
US$M
Change
%
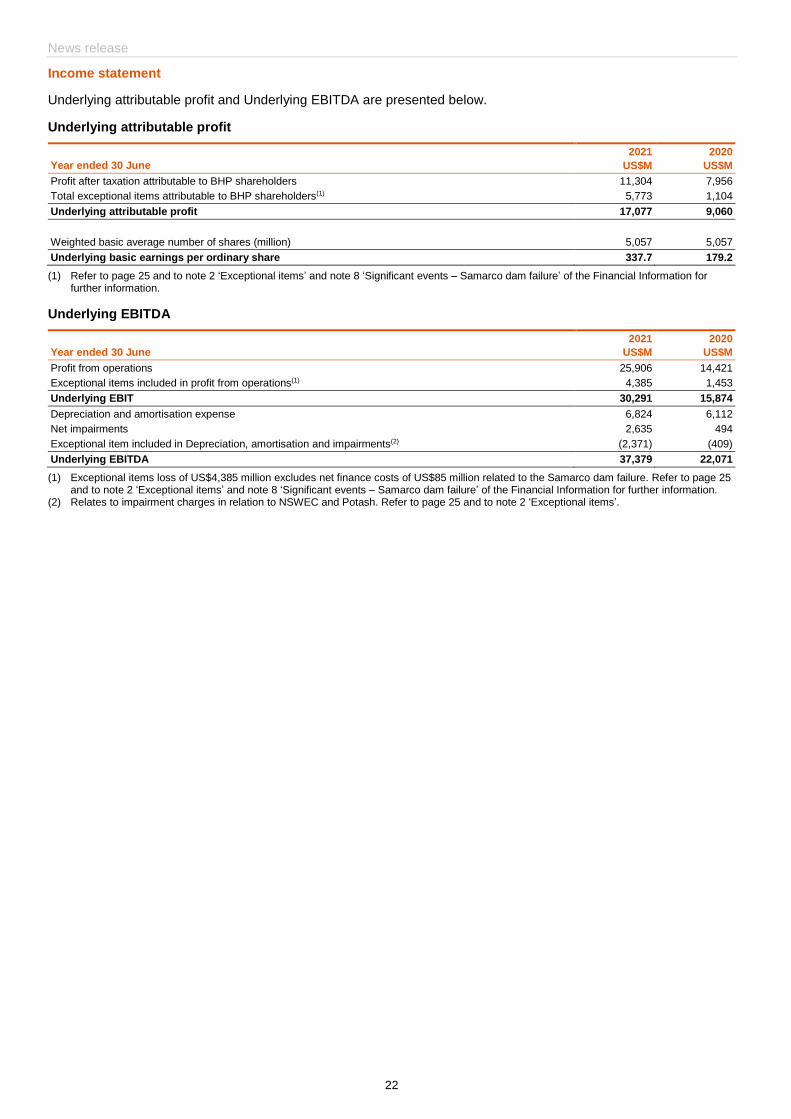
Profit from operations 25,906 14,421 80%
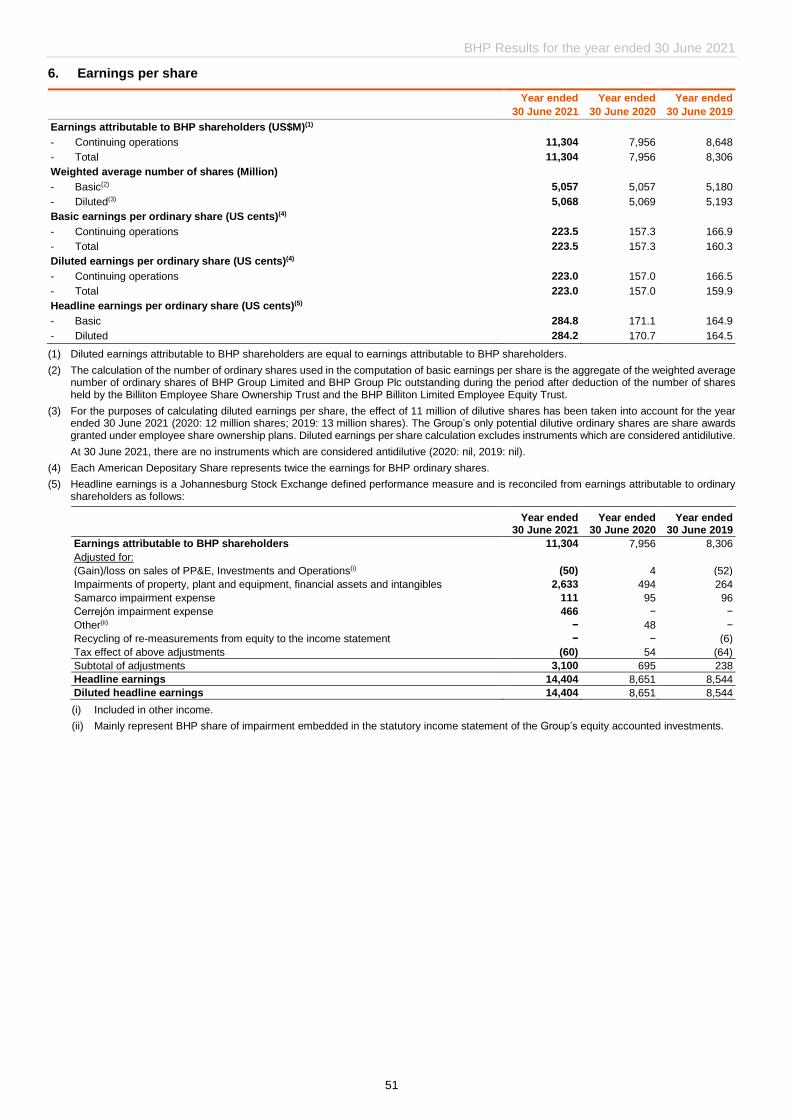
Attributable profit 11,304 7,956 42%
Basic earnings per share (cents) 223.5 157.3 42%
Dividend per share (cents) 301.0 120.0 151%
Net operating cash flow 27,234 15,706 73%
Capital and exploration expenditure 7,120 7,640 (7%)
Net debt 4,121 12,044 (66%)
Underlying EBITDA 37,379 22,071 69%
Underlying attributable profit 17,077 9,060 88%
Underlying basic earnings per share (cents)(ii) 337.7 179.2 88%
BHP Results for the year ended 30 June 2021
3
Strategic Update
Investment in the Jansen Stage 1 potash project which is aligned with our strategy of growing our exposure to future facing commodities in world class assets
BHP approved US$5.7 billion (C$7.5 billion) in capital expenditure for the Jansen Stage 1 (Jansen S1), which includes funding for the required port infrastructure.
Exposure to potash provides increased leverage to key global mega-trends including rising population, changing diets, decarbonisation and improving environmental stewardship.
Jansen S1 is expected to produce approximately 4.35 million tonnes of potash per annum(iv).
First ore is targeted in the 2027 calendar year, with construction expected to take approximately six years, followed by a ramp up period of two years.
At consensus prices(v), the go-forward investment on Jansen S1 is expected to generate an internal rate of return of 12 to 14%, an expected payback period of seven years from first production and an underlying EBITDA margin of approximately 70%.
The Jansen project offers significant high returning growth optionality in the world’s best potash basin and an attractive investment jurisdiction.
We have assessed the carrying value of the existing potash asset base as at 30 June 2021 and have recognised a pre-tax impairment charge of US$1.3 billion (US$2.1 billion after-tax).
Agreement to pursue a merger of our Petroleum business with Woodside to create a global top 10 independent energy company with a large-scale portfolio of producing, development and exploration assets
BHP and Woodside have entered into a merger commitment deed to combine their respective oil and gas portfolios
by an all-stock merger. The merger is subject to confirmatory due diligence, negotiation and execution of full form
transaction documents, and satisfaction of conditions precedent including shareholder, regulatory and other
approvals.
On completion, it is expected Woodside would be owned approximately 52% and 48% by existing Woodside and
BHP shareholders respectively, and will remain listed on the Australian Securities Exchange (ASX) with listings on
additional exchanges being considered.
The proposed merger would create a global top 10 independent energy company by production and would be the
largest energy company on the ASX.
It will give our shareholders greater choice about how to weight their exposure to the different investment
propositions of BHP and Petroleum via Woodside.
It is expected to deliver substantial benefits for our shareholders, including estimated synergies of more than
US$400 million per annum.
With the combination of two high quality asset portfolios, the combined business will have a high margin oil portfolio,
long life LNG assets and the financial resilience to help supply the energy needed for global growth and
development over the energy transition.
Intention to unify our corporate structure under BHP’s existing Australian parent company to drive simplicity and flexibility
BHP intends to unify its Dual Listed Company (DLC) structure, subject to final Board and other approvals. Unification
would result in a corporate structure that is simpler and more efficient, reduce duplication and streamline our
governance and internal processes.
As we position the company for the future operating environment, a unified structure will improve flexibility for
portfolio reshaping to maximise value for shareholders over the long-term, including facilitating a simpler separation
of Petroleum.
Following recent changes to our portfolio there has been a significant reduction in earnings contribution from Plc
assets, as well as a material reduction in the expected costs of unification of approximately US$1.2 billion, with one-
off costs now expected to be US$400 to US$500 million.
Plc shareholders' shares will be exchanged for Limited shares on a one-for-one basis. BHP's Board, management,
dividend policy, ability to distribute fully franked dividends and fundamentals will remain the same.
It is expected that a unified BHP would have its primary listing on the ASX, a standard listing on the London Stock
Exchange (LSE), a secondary listing on the Johannesburg Stock Exchange (JSE), and a sponsored Level II ADR
program on the New York Stock Exchange (NYSE).
If approved, unification is expected to occur in the first half of the 2022 calendar year, with the proposed Petroleum
merger with Woodside to follow.
Additional information included on pages 17 to 21.
News release
4
Delivering strong performance
BHP delivered a strong set of results for the 2021 financial year. We were safe, more reliable and more productive,
and we increased our efforts to pursue further improvements in our safety and wellbeing performance. We have now
had over two and a half years without a fatality at our operated assets and we have seen a sustained improvement in
our key safety performance indicators. High Potential Injury frequency has decreased by 17 per cent during the year
and a reduction of 35 per cent since the 2019 financial year. Total Recordable Injury Frequency has continued to
decline, down 11 per cent during the year to 3.7(vi), and a reduction of 21 per cent over the last two years. Our two
largest assets, Western Australia Iron Ore and our Escondida copper mine have continued to deliver production and
throughput respectively at record levels, as did Olympic Dam which achieved the highest annual copper production
since BHP acquired the asset in 2005 and the highest gold production ever for the operation. When combined with our
strong reliability and disciplined cost control, this has helped us to benefit from record high iron ore and copper prices.
We generated record free cash flow, return on capital employed strengthened to 32.5 per cent and our balance sheet
is strong, with net debt finishing the year at US$4.1 billion. On the back of these results, the Board has announced a
record final dividend of US$2.00 per share, bringing BHP’s returns to shareholder to more than US$15 billion for the
full year, and more than US$38 billion over the past three years.
We are continuing to unlock even greater performance from our equipment and infrastructure through enabling our
people and investing in capability. We continue to build a more inclusive and diverse workforce to further enhance
performance excellence. This includes our aspirational goal of a gender balanced workforce by 2025. We had 48 per
cent female external hires during the year, which has resulted in a material increase of female representation(i) in the
workforce, up three percentage points to 29.8 per cent. The Executive Leadership Team established last year has 50
per cent female representation.
We are reliably delivering our major growth and sustaining capital projects in copper, iron ore and petroleum, with all
major projects during the year executed on time and on budget despite COVID-19 challenges. The Spence Growth
Option (SGO) copper project and the South Flank iron ore sustaining project, which will contribute to improved grade
and increased lump in our iron ore product suite, both began production and are ramping up. In Petroleum, the Atlantis
Phase 3 and Ruby growth projects both started producing over the last 12 months, and we completed the counter-
cyclical acquisition of an additional interest in the Shenzi asset. In nickel and copper, we have established further
exploration partnerships, acquired new tenements and progressed greenfield exploration.
In addition to strengthening economic growth, in the past year we have seen growing national ambitions and some
positive steps towards overcoming the challenge of climate change. This is aligned with, and has reinforced, our
perspective on the unfolding mega-trends of decarbonisation, electrification, population growth and the drive for higher
living standards in the developing world, which we see becoming key drivers of commodity demand. We expect our
diversified portfolio to be resilient under a number of different long-term scenarios, and in fact, that many of our
commodities would further benefit from an accelerated decarbonisation pathway(vii). We continue to pursue
opportunities to further strengthen our portfolio and our exposure to these long-term trends.
We have invested through the cycle in high returning growth projects, and in options for future development and value
creation in copper, nickel, oil and potash through innovation, exploration, early stage investment and development.
Creating and securing more options in future facing commodities remains a priority.
Creating social value
We are committed to creating long-term value for our shareholders and consider social value and financial value in the
decisions we make. Social value is our positive contribution to society – to our people, partners, economy, environment
and local communities.
Safety and sustainability
The safety, health and wellbeing of our workforce and the communities in which we operate are fundamental to our
ability to contribute to social value. We have continued to demonstrate this throughout the COVID-19 pandemic with
the ongoing, safe performance of our operated assets. We have provided significant support to local businesses, and
regional and Indigenous communities where we operate in response to COVID-19 and have established programs to
support the public health response.
BHP Results for the year ended 30 June 2021
5
At our operated assets, we remain vigilant and will continue with social distancing and hygiene practices, and other
additional protocols as appropriate to protect our workforce and communities from COVID-19, in line with guidelines
from local and national government bodies and expert health advice in the countries where we operate. Many of these
measures remain in place. Our Australian operations have effectively managed the rapidly changing environment
relating to interstate travel and border access, however ongoing frequent border restrictions create uncertainty in
managing the business. In Chile, the operating environment is expected to continue to be challenging as COVID-19
cases in the country remain elevated, with reductions in our on-site workforce forecast to continue in the 2022 financial
year.
Despite the challenges, our people have continued their focus on safety. Our global safety improvement programs are
progressing well and our safety leading indicators have continued a strong positive trend underpinning the current
safety performance. We have now had over two and a half years without a fatality at our operated assets and we
continue to focus on fostering a culture of respect and ensuring our workplace is safe at all times.
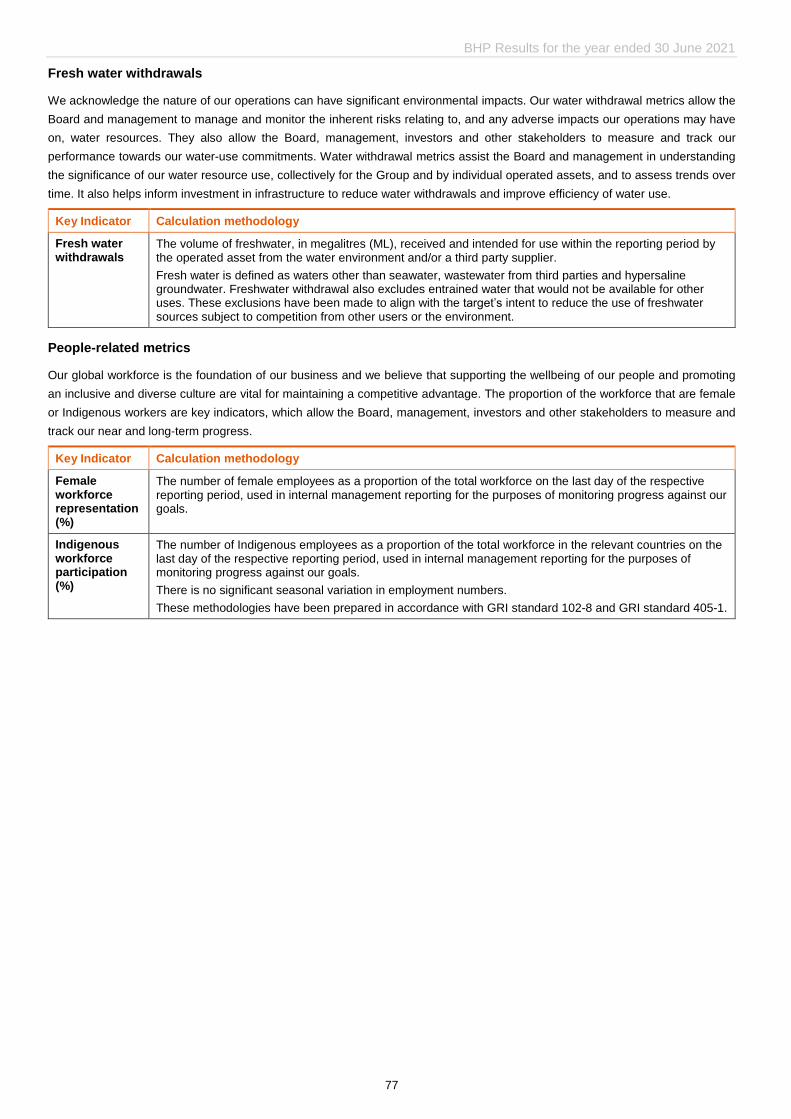
Our ambition to minimise our withdrawals of high-quality fresh water(viii) and replace them with seawater or low-quality
withdrawals where feasible saw a continued reduction in freshwater withdrawals(i), which were 11 per cent lower in the
2021 financial year compared to the prior year and are now 27 per cent below the 2017 baseline for our five year
target.
Communities remain a critical part of our social value contribution
Our community and social investment commitment (one per cent of pre-tax profit), which began 20 years ago, is
aligned with our broader business priorities and contributes to the resilience of the communities and environment
where we have a presence. This is one of the critical parts of creating social value.
In response to COVID-19, we have worked closely with local businesses, and regional and Indigenous communities
where we operate in both the immediate response to COVID-19 and in the recovery phase. This has included financial
support to local and regional health networks, the provision of essential community services including mental health,
training and upskilling, enhancing technology and targeted support to remote Indigenous communities. In addition, we
secured and donated medical personal protective equipment and other health and sanitation goods to communities
and organisations where supply was interrupted.
We also partnered with the communities where we operate, by offering training and apprenticeships on emerging
technologies, systems and practices to build future capabilities.
As part of our social value contribution, we also fund the BHP Foundation, which continues to work with partner
organisations globally to address some of the world’s most critical sustainable development challenges. These efforts
are designed to address challenges that are directly relevant to the global resources sector and contribute towards
many of the United Nations Sustainable Development Goals focussing on the governance of natural resources,
environmental resilience and education equity. The BHP Foundation’s global partnership with Transparency
International supports governments to identify and address corruption risks in mining licensing processes, and its
global programs supporting Indigenous peoples have enabled Indigenous land management activities covering the
Ten Deserts of Australia and traditional lands in the Boreal Forests of Canada and the Amazon basin of Peru. Further
information can be found at: bhp.com/foundation.
With effect from 1 July 2021, BHP has reduced to seven-day payment terms for all small, local and Indigenous
suppliers, getting cash into their hands sooner. This will benefit over 4,000 suppliers globally, including in Australia,
Chile, North America and Canada. These include suppliers that are a part of the Local Buying Program in Australia
and South America.
Our approach to cultural heritage is driven by the commitments made in our Indigenous Peoples Policy Statement, our
Indigenous Peoples Strategy and our Reconciliation Action Plan. During the year, we continued to work with Traditional
Owner groups and other Indigenous representative organisations to further strengthen our cultural heritage
management practices. We also continue to support efforts to further strengthen the laws, policies and practices that
regulate the management of cultural heritage values.
We have made strong progress on actions required to meet our commitments to reduce operational emissions.
In September 2020, we signed a renewable power purchasing agreement (PPA) to meet half of our electricity needs
across our Queensland Coal operations from low emissions sources. We also executed a 15-year contract extension
to our power purchase agreement at Nickel West, which provides additional ability to integrate renewable electricity
generation. Our four new renewable power contracts for Escondida and Spence commence from the 2022 financial
year, as part of our aim to achieve 100 per cent renewable supply at both operations by the mid-2020s. In August
2021, BHP became a founding member of Komatsu’s GHG Alliance, providing engineering, technical and mining
expertise with the aim of accelerating the path to market of zero-greenhouse gas emissions haul trucks.
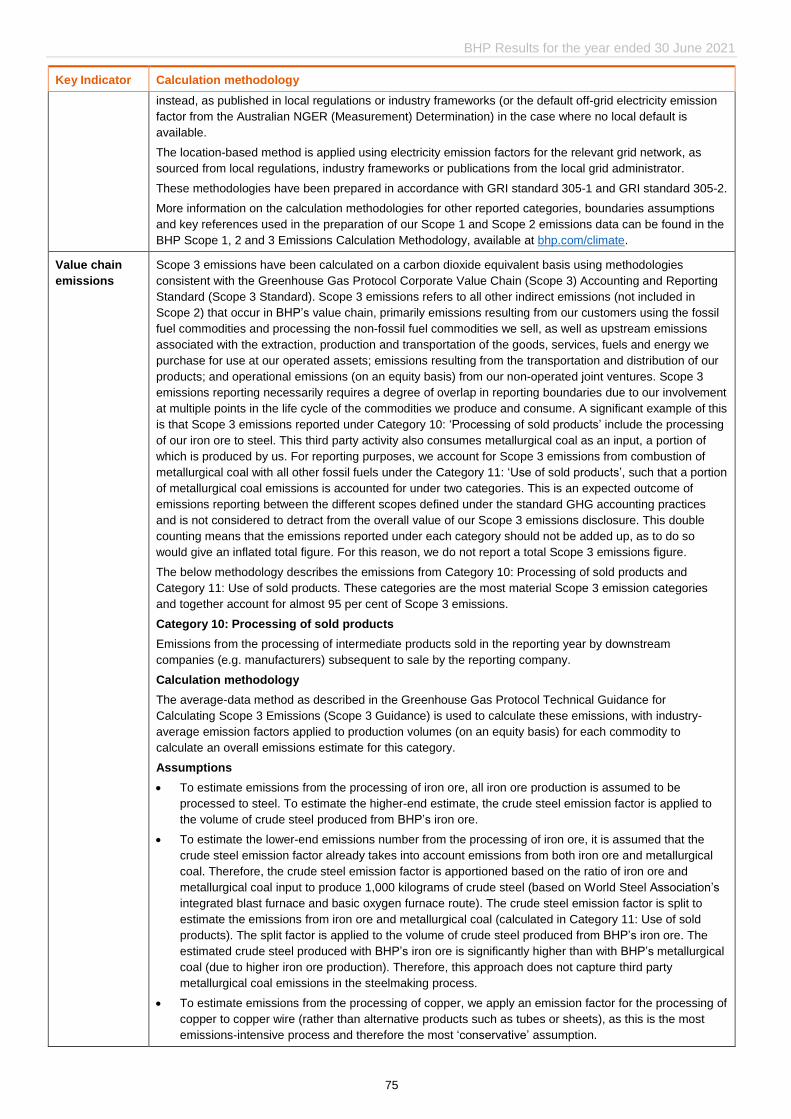
In line with the 2030 Scope 3 goals we set in 2020, we have taken actions to contribute to decarbonisation in our value
chain. In steelmaking, we have entered into three partnerships that are targeted at the development and deployment
of technologies to support a reduction in greenhouse gas emissions in integrated steelmaking for an aggregate
investment of up to US$65 million. We signed a Memorandum of Understanding (MoU) with:
China’s HBIS Group Co., Ltd (HBIS), one of the world’s largest steelmakers and one of our major iron ore
customers, to collaborate on three priority areas: hydrogen-based direct reduction technology, the recycling and
reuse of steelmaking slag, and the role of iron ore lump utilisation to help reduce emissions from ironmaking and
steelmaking (March 2021).
JFE Steel, one of Japan’s largest steel producers, to study the properties of raw materials, with focus on specific
areas such as iron ore pre-treatment, use of enhanced iron ore lump, high quality coke and DRI, required to
decrease iron and steelmaking emissions (February 2021).
World leading steel producer, China Baowu, to collaborate on technical solutions to utilise low carbon fuel sources
such as hydrogen injection in the blast furnace, and explore other low emission options (November 2020).
The combined output of these three steelmakers equates to around 10 per cent of global steel production(ix).
In shipping, we have also taken a number of actions to help reduce emissions in our value chain:
We awarded the world’s first LNG-fuelled Newcastlemax bulk carriers contract, since replicated by others, with the
aim to reduce CO2-e emissions by up to 34 per cent per voyage (September 2020).
We also took part in a successful marine biofuel trial which will support development of a strategy on the supply
of biofuels and its use on our key shipping routes (April 2021).
We announced the signing of a Memorandum of Cooperation to become one of the founding members of
Singapore’s Global Centre for Maritime Decarbonisation (GCMD). The centre will spearhead the maritime
industry’s energy transition journey. BHP is the only resources company that is part of the alliance (April 2021).
Building on our leading practice in climate risk management, disclosure and engagement, we plan to put forward a
non-binding advisory Say on Climate to shareholders at our 2021 AGMs in the form of a vote with respect to our new
Climate Transition Action Plan (CTAP). The CTAP will cover the focus areas of the Climate Action 100+ Net Zero
Company Benchmark and in particular, provide further information on our approach to addressing emissions in our
value chain (Scope 3 emissions).
BHP Results for the year ended 30 June 2021
7
Social value: key indicators scorecard(1)
Key indicators Target
FY21 H2
FY21 H1
FY21 FY20 Comment
Fatalities Zero work-related fatalities 0 0 0 0 No fatalities at our operated assets for over two and a half years.
High Potential Injury (HPI) frequency(i) (per million hours worked)
Year-on-year improvement in HPI frequency
0.20 0.20 0.20 0.24 17 per cent decrease from FY20.
TRIF(i) (per million hours worked)
Year-on-year improvement in TRIF
3.7 3.7 3.6 4.2 11 per cent reduction from FY20.
Operational greenhouse gas (GHG) emissions(i) (Mt CO2-e)
Maintain FY22 operational GHG emissions at or below FY17 levels(2)(3), while we continue to grow our business and reduce emissions by at least 30 per cent from FY20 levels(3) by FY30
16.2 8.0 8.2 15.9 On track to meet our FY22 and FY30 targets, despite expected increase in FY21, due to reductions in emissions from renewable power contracts in Chile and Australia.
Value chain emissions(i) Steelmaking: 2030 goal to support industry to develop technologies and pathways capable of 30 per cent emissions intensity reduction in integrated steelmaking, with widespread adoption expected post-2030
- On track to deliver 2030 goal with three low-carbon partnerships initiated with some of the world’s leading steelmakers in FY21: China Baowu, HBIS and JFE.
Maritime transportation: 2030 goal to support 40 per cent emissions intensity reduction of BHP-chartered shipping of our products
- On track to deliver 2030 goal with award of a LNG-fuelled bulk carrier tender and LNG supply agreement, completion of a marine biofuel trial and signing of a Memorandum of Cooperation to become a founding member of the Global Centre for Maritime Decarbonisation in FY21.
Freshwater withdrawals(i) (GL)
Reduce FY22 freshwater withdrawals by 15 per cent from FY17 levels(4)
113.5 60.9 52.6 127.0 On track to meet our five-year target with an 11 per cent reduction from FY20 and 27 per cent reduction from FY17 baseline.
Community and social investment (US$M)
No less than one per cent of pre-tax profit (three-year rolling average)
174.8 144.3 30.5 149.6 Impacts this year include (i) >12.8M hectares conserved, restored or improved management; (ii) 19,000 people completing training aligned with the future of work, with >1,500 people obtaining paid employment.
Local procurement spend
(US$M)
Support the growth of local businesses in the regions where we operate
2,176 1,064 1,112 1,922 Over US$4 billion directed to local suppliers in the past two financial years.
Female workforce representation(i) (%)
Aspirational goal for gender balance by the end of FY25
29.8 29.8 27.4 26.5 We have achieved a 12 percentage point increase from FY16, with 48 per cent female external hires in FY21.
Indigenous workforce participation(i) (%)
Australia: aim to achieve 8.0 per cent by the end of FY25
7.2 7.2 6.7 6.5 Continued increase throughout FY21.
Chile: aim to achieve 10.0 per cent by the end of FY26(5)
7.5 7.5 6.8 6.6 Continued increase throughout FY21.
Canada - Potash: aim to achieve 20.0 per cent by the end of FY27(5)
13.5(6) 13.5(6) 12.8 15.0 Expected to increase slowly throughout project execution but to rise sharply when hiring operational staff begins, predominantly in FY26.
(1) All data points are subject to non-financial assurance reviews. Some previously reported data points have been re-stated as a result of audit and assurance reviews completed subsequent to release of information or due to reclassification. Re-stated figures are shown in italics.
(2) In FY17, our operational GHG emissions were 14.6 Mt CO2-e (excluding Onshore US).
(3) FY17 and FY20 baselines will be adjusted for any material acquisitions and divestments based on GHG emissions at the time of the transaction. Carbon offsets will be used as required. FY17 baseline is on a continuing operations basis and has been adjusted for divestments.
(4) In FY17, our fresh water withdrawals were 156.1 GL (on an adjusted basis, excluding Onshore US). The FY17 baseline data has been adjusted to account for: the materiality of the strike affecting water withdrawals at Escondida in FY17 and improvements to water balance methodologies at WAIO and Queensland Coal and exclusion of hypersaline, wastewater, entrainment, supplies from desalination and Discontinued operations (Onshore US assets) in FY19 and FY20.
(5) New medium term target established.
(6) Includes data for employees & embedded contractors as at 30 June 2021 and data for service contractors as at 30 April 2021.
News release
8
Samarco
BHP remains committed to supporting the Renova Foundation and its work to progress the remediation and
compensatory programs to restore the environment and re-establish communities affected by the Samarco tragedy.
In total, Renova has spent R$14 billion (approximately US$3.3 billion(x)) on remediation and compensation programs
to 30 June 2021.
Compensation and financial assistance of approximately R$4.7 billion (approximately US$1.1 billion) has been paid to
support approximately 336,000 people affected by the Fundão dam failure up until 30 June 2021(xi). Resettlement of
communities continues to progress despite ongoing challenges, including the implementation of precautionary
measures to minimise the spread of COVID-19(xii).
A Framework Agreement was entered into between Samarco, Vale and BHP Brasil and the relevant Brazilian
authorities in March 2016 and established the Renova Foundation to develop and implement environmental and socio-
economic programs to remediate and provide compensation for damage caused by the Samarco dam failure.
Negotiations are ongoing with State and Federal Prosecutors and certain other Brazilian public authorities on the
review of the Framework Agreement, seeking a definitive and substantive settlement of claims relating to the dam
failure. It is not possible to provide a range of outcomes or a reliable estimate of potential settlement outcomes and
there is a risk that a negotiated outcome may be materially higher than amounts currently reflected in the Samarco
dam failure provision. Until any revisions to the Programs are agreed, Fundação Renova will continue to implement
the Programs in accordance with the terms of the Framework Agreement and the Governance Agreement. The
suspended R$155 billion (approximately US$30 billion(x)) Federal Public Prosecution Office claim is under discussion
as part of these negotiations.
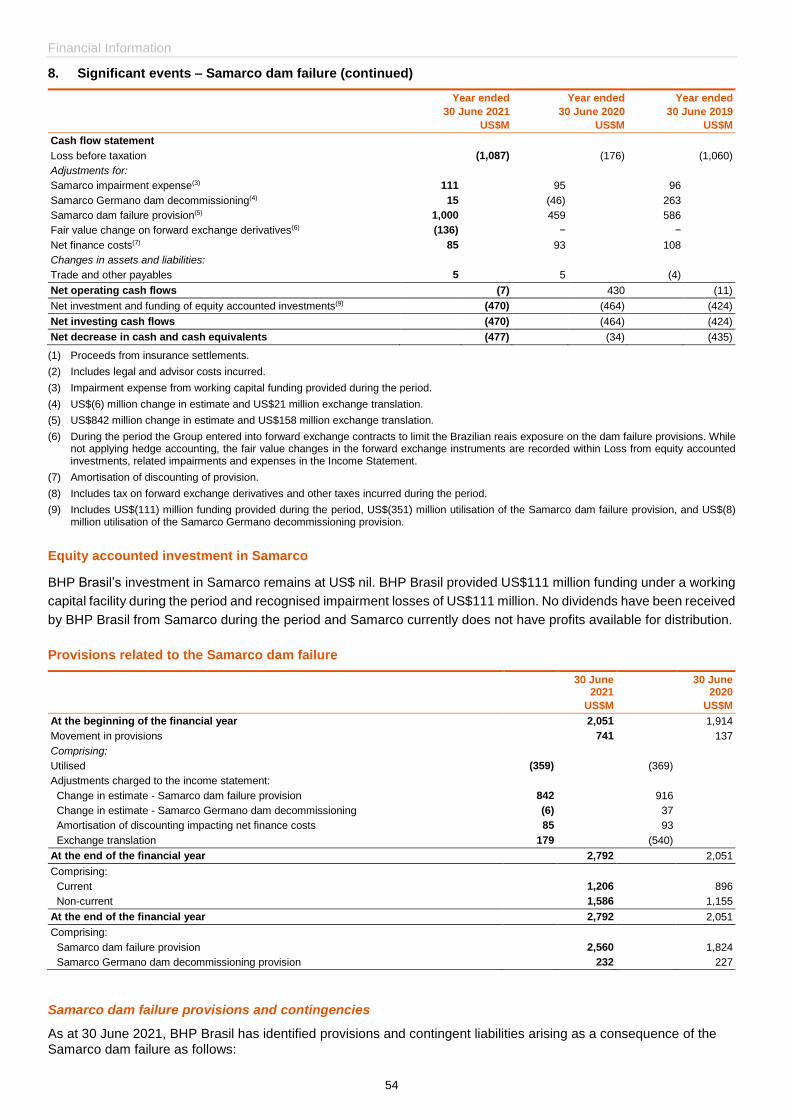
BHP has reported a total income statement charge of US$1.2 billion (after tax) in relation to the Samarco dam failure
for the 2021 financial year. This charge is recognised as an exceptional item. Additional commentary is included on
page 53.
BHP Results for the year ended 30 June 2021
9
Financial performance
Note: All guidance is subject to further potential impacts from COVID-19 during the 2022 financial year
Earnings and margins
Attributable profit of US$11.3 billion includes an exceptional loss of US$5.8 billion (2020: US$8.0 billion, which
includes a US$1.1 billion exceptional loss).
The exceptional loss of US$5.8 billion (after tax) relates to an impairment charge in relation to potash of
US$2.1 billion, an impairment charge in relation our energy coal assets of US$2.2 billion (New South Wales Energy
Coal of US$1.7 billion, and Cerrejón of US$0.5 billion), COVID-19 related costs of US$0.4 billion and the current
year impact of the Samarco dam failure of US$1.2 billion. The impairment charge against our potash assets reflects
an analysis of recent market perspectives and the value that we would now expect a market participant to attribute
to our investments to date. The impairment charge for New South Wales Energy Coal (NSWEC) reflects the status
of the divestment process and forecast market conditions for thermal coal, the strengthening Australian dollar and
changes to the mine plan. The impairment charge for Cerrejón reflects the expected net sale proceeds. The
Samarco dam failure exceptional item primarily reflects updates to the Group’s assessment of remediation and
compensation costs relating to the dam failure, including increased eligibility for compensation programs reflecting
the latest judicial rulings and revisions to the resettlement costs for impacted communities.
Underlying attributable profit of US$17.1 billion (2020: US$9.1 billion) reflects higher commodity prices and strong
operational performance.
Profit from operations of US$25.9 billion (2020: US$14.4 billion) increased as a result of higher commodity prices,
strong underlying operational performance, lower deferred stripping depletion at Escondida, lower fuel and energy
costs, solid cost performance supported by cost reduction initiatives across our assets and other net movements.
This was partially offset by the exceptional charge, unfavourable impacts of a stronger Australian dollar and
Chilean peso, copper grade decline, natural field decline in Petroleum, inflation, adverse weather and planned
maintenance.
The total impact from COVID-19 on our operations was US$780 million (pre-tax) (2020: US$348 million). This
represents the following impacts: lower volumes at our operated assets of US$234 million (2020: US$112 million)
and additional direct costs of US$546 million pre-tax (exceptional item) incurred, such as increased social
distancing measures including additional charter flights, accommodation, security and health and hygiene services
and also temporary relocation costs due to border restrictions (US$0.2 billion), combined with higher demurrage
and other standby charges due to delays caused by COVID-19 (US$0.3 billion).
Underlying EBITDA of US$37.4 billion (2020: US$22.1 billion), driven by higher iron ore and copper prices, record
volumes at WAIO and additional volumes from the Spence Growth Option, higher profit from equity accounted
investments, lower deferred stripping depletion at Escondida, lower fuel and energy costs, disciplined cost
performance and other net movements. This was partially offset by unfavourable impacts of a stronger Australian
dollar and Chilean peso, copper grade decline, natural field decline in Petroleum, inflation, adverse weather and
planned maintenance.
Record(iii) underlying EBITDA margin of 64 per cent (2020: 53 per cent).
Underlying return on capital employed strengthened to 32.5 per cent (2020: 16.9 per cent).
Operational performance and costs
Strong underlying performance across the portfolio, including record production at WAIO, Goonyella and Olympic
Dam and concentrator throughput at record levels at Escondida, offset by the impacts of overall grade decline at
our copper assets, natural field decline in Petroleum, adverse weather and planned maintenance across a number
of our assets.
Disciplined cost performance supported by cost reduction initiatives across our assets offset by higher inventory
drawdowns at Olympic Dam and at Nickel West, and additional costs associated with the ramp-up of South Flank.
News release
10
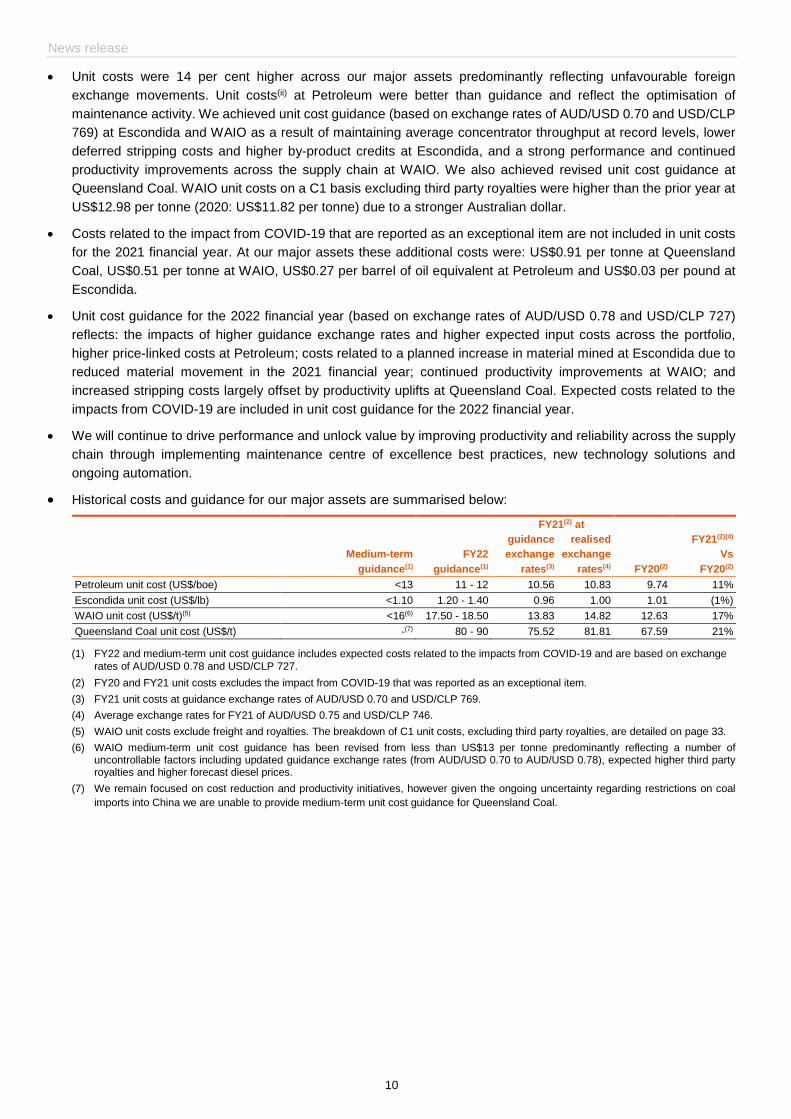
Unit costs were 14 per cent higher across our major assets predominantly reflecting unfavourable foreign
exchange movements. Unit costs(ii) at Petroleum were better than guidance and reflect the optimisation of
maintenance activity. We achieved unit cost guidance (based on exchange rates of AUD/USD 0.70 and USD/CLP
769) at Escondida and WAIO as a result of maintaining average concentrator throughput at record levels, lower
deferred stripping costs and higher by-product credits at Escondida, and a strong performance and continued
productivity improvements across the supply chain at WAIO. We also achieved revised unit cost guidance at
Queensland Coal. WAIO unit costs on a C1 basis excluding third party royalties were higher than the prior year at
US$12.98 per tonne (2020: US$11.82 per tonne) due to a stronger Australian dollar.
Costs related to the impact from COVID-19 that are reported as an exceptional item are not included in unit costs
for the 2021 financial year. At our major assets these additional costs were: US$0.91 per tonne at Queensland
Coal, US$0.51 per tonne at WAIO, US$0.27 per barrel of oil equivalent at Petroleum and US$0.03 per pound at
Escondida.
Unit cost guidance for the 2022 financial year (based on exchange rates of AUD/USD 0.78 and USD/CLP 727)
reflects: the impacts of higher guidance exchange rates and higher expected input costs across the portfolio,
higher price-linked costs at Petroleum; costs related to a planned increase in material mined at Escondida due to
reduced material movement in the 2021 financial year; continued productivity improvements at WAIO; and
increased stripping costs largely offset by productivity uplifts at Queensland Coal. Expected costs related to the
impacts from COVID-19 are included in unit cost guidance for the 2022 financial year.
We will continue to drive performance and unlock value by improving productivity and reliability across the supply
chain through implementing maintenance centre of excellence best practices, new technology solutions and
ongoing automation.
Historical costs and guidance for our major assets are summarised below:
(1) FY22 and medium-term unit cost guidance includes expected costs related to the impacts from COVID-19 and are based on exchange
rates of AUD/USD 0.78 and USD/CLP 727.
(2) FY20 and FY21 unit costs excludes the impact from COVID-19 that was reported as an exceptional item.
(3) FY21 unit costs at guidance exchange rates of AUD/USD 0.70 and USD/CLP 769.
(4) Average exchange rates for FY21 of AUD/USD 0.75 and USD/CLP 746.
(5) WAIO unit costs exclude freight and royalties. The breakdown of C1 unit costs, excluding third party royalties, are detailed on page 33.
(6) WAIO medium-term unit cost guidance has been revised from less than US$13 per tonne predominantly reflecting a number of uncontrollable factors including updated guidance exchange rates (from AUD/USD 0.70 to AUD/USD 0.78), expected higher third party royalties and higher forecast diesel prices.
(7) We remain focused on cost reduction and productivity initiatives, however given the ongoing uncertainty regarding restrictions on coal
imports into China we are unable to provide medium-term unit cost guidance for Queensland Coal.
(1) Petroleum medium-term production guidance has been revised from approximately 106 MMboe to reflect the approval of the Shenzi North development and the potential sanction of the Scarborough gas development later in the 2021 calendar year.
(2) Represents annual average copper production over the medium term.
(3) Other copper comprises Pampa Norte, Olympic Dam and Antamina.
(4) WAIO’s current licenced export capacity is 290 Mtpa.
(5) Samarco restarted operation of one concentrator in December 2020, and had safely produced 1.9Mt (BHP share) by the end of the 2021 financial year.
(6) We remain focused on cost reduction and productivity initiatives, however given the ongoing uncertainty regarding restrictions on coal imports into China we are unable to provide medium-term volume guidance for Queensland Coal.
(7) We will no longer provide production guidance for Cerrejón reflecting the announced divestment of our interest in June 2021 and volumes will be reported separately from 1 July 2021 until transaction completion.
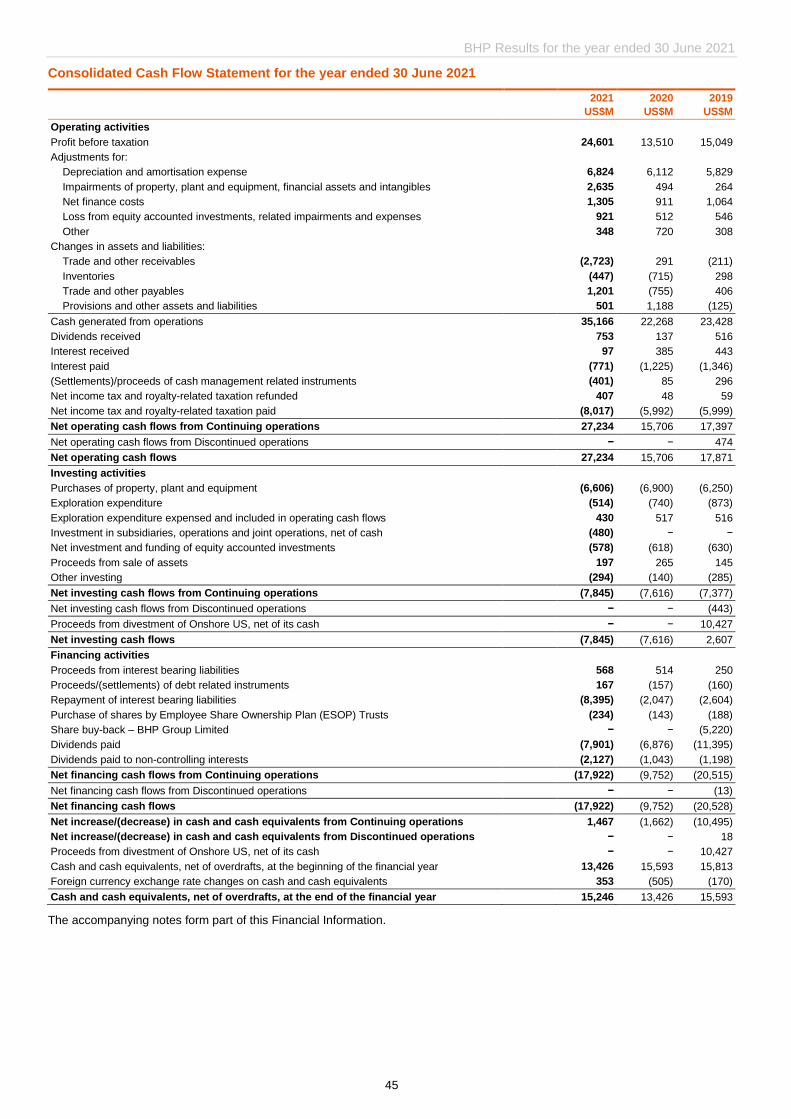
Cash flow and balance sheet
Net operating cash flows of US$27.2 billion (2020: US$15.7 billion), above US$15 billion for the fifth consecutive
year, reflects strong iron ore and copper prices, and strong underlying operating performance across the portfolio.
Income tax and royalty-related taxation (petroleum resource rent tax and Chilean mining tax) payments of
US$8.0 billion, included within net operating cash flows, are largely based on instalment rates using prior year tax
return information. While higher profits resulted in increased tax payments during the current year, approximately
US$2.6 billion of tax instalments and final tax payments relating to the 2021 financial year are expected to be
made in the 2022 financial year.
Free cash flow of US$19.4 billion, after capital and exploration expenditure of US$7.1 billion.
Our balance sheet remains strong with net debt at US$4.1 billion at 30 June 2021 (31 December 2020:
US$11.8 billion; 30 June 2020: US$12.0 billion). The decrease of US$7.9 billion in net debt in the year (or
US$7.7 billion from December 2020) reflects record(iii) free cash flow generation by the operations which more than
offset the record ordinary dividends paid to shareholders during the year of US$7.9 billion and US$1.1 billion of
lease additions (including SGO).
Year ended 30 June
2021
US$M
2020
US$M
Net debt at the beginning of the period 12,044 9,446
IFRS 16 transition − 1,778
Lease additions 1,079 363
Free cash flow (19,389) (8,090)
Dividends paid 7,901 6,876
Dividends paid to NCI 2,127 1,043
Other movements 359 628
Net debt at the end of the period 4,121 12,044
We remain committed to a strong balance sheet through the commodity price cycle. In light of our announcement
to pursue a merger of our Petroleum business with Woodside, we will be reviewing our net debt target and will
provide an update with our interim results for the 2022 financial year in February 2022.
Gearing ratio(ii) of 6.9 per cent (31 December 2020: 18.1 per cent; 30 June 2020: 18.8 per cent).
News release
12
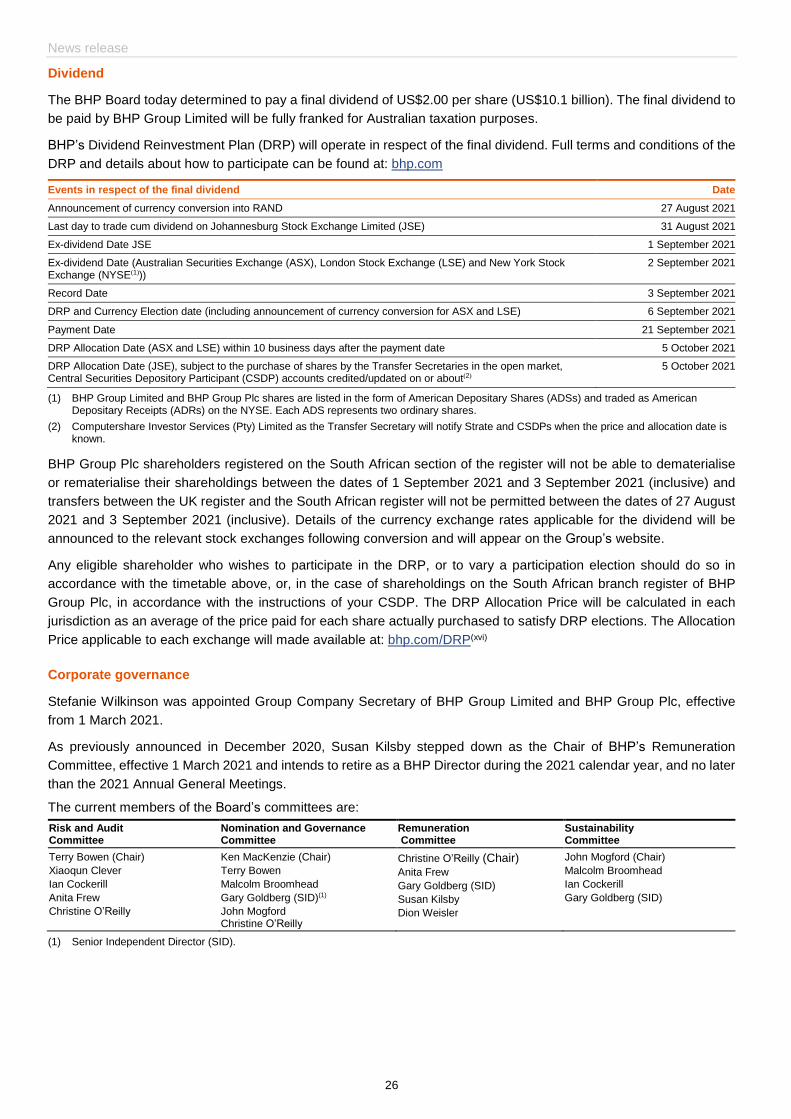
Dividends
The Board has determined to pay a final dividend of US$2.00 per share or US$10.1 billion. This is equivalent to a
92 per cent payout ratio (2020: 72 per cent).
In total, record dividends of US$15.2 billion (US$3.01 per share) have been determined for the 2021 financial year,
including an additional amount of US$6.7 billion above the minimum payout policy.
Capital and exploration
Capital and exploration expenditure of US$7.1 billion in the 2021 financial year was in line with guidance. This
included maintenance expenditure(xiii) of US$2.3 billion and exploration of US$514 million.
Capital and exploration expenditure of approximately US$6.7 billion for minerals and US$2.3 billion for petroleum
is expected for the 2022 financial year. In total, this is US$0.5 billion higher than previous guidance predominantly
due to unfavourable impacts of a stronger Australian dollar. Guidance is subject to exchange rate movements.
This guidance includes a US$800 million exploration program in the 2022 financial year, with approximately
US$260 million for our minerals exploration program (additional details on page 37) and approximately
US$540 million for petroleum exploration and appraisal program (additional details on page 29).
Historical capital and exploration expenditure and guidance are summarised below:
FY22e FY21 FY20 US$M US$M US$M
Maintenance(1)(2)(3) 3,200 2,336 1,853
Development
Minerals 3,400 3,353 4,243
Conventional Petroleum(2) 1,600 917 804
Capital expenditure (purchases of property, plant and equipment) 8,200 6,606 6,900
Add: exploration expenditure 800 514 740
Capital and exploration expenditure – total operations ~9,000 7,120 7,640
(1) Includes capitalised deferred stripping of US$810 million for FY21 (FY20: US$698 million) and approximately US$800 million for FY22.
(2) Petroleum capital expenditure for FY22 includes US$1.6 billion of development and US$0.1 billion of maintenance.
(3) The increase in maintenance costs of approximately US$0.9 billion in FY22 primarily relates to unfavourable foreign exchange rate impacts, mine and mobile equipment replacements at Escondida and Spence, tailings and waste management at Spence and water infrastructure at WAIO.
At Olympic Dam, the planned major smelter maintenance campaign and subsequent ramp up is now planned
between September 2021 and March 2022 (previously between August 2021 and February 2022). This is due to
the ongoing COVID-19 state border restrictions limiting personnel coming to site.
Average annual sustaining capital expenditure guidance over the medium term, excluding costs associated with
our automation programs, has been revised predominantly due to updated guidance exchange rates (from
AUD/USD 0.70 to AUD/USD 0.78) and forecast to be approximately:
- US$4.50 per tonne for WAIO (from US$4 per tonne); and
- US$10 per tonne for Queensland Coal (from US$9 per tonne).
Projects
In August 2021, the BHP Board approved two major projects:
- An investment of US$5.7 billion (C$7.5 billion) for the Jansen Stage 1 potash project in the province of
Saskatchewan, Canada (additional details on pages 17 to 18); and
- An investment of US$544 million for the Shenzi North development in the US Gulf of Mexico, following the
successful acquisition of an additional 28 per cent working interest in Shenzi in November 2020 (additional
details on page 29). The capital expenditure approved represents a 100 per cent share interest. BHP is operator
and holds a 72 per cent share in Shenzi North. Repsol holds the remaining 28 per cent working interest and is
expected to make a Final Investment Decision later this calendar year.
At the end of the 2021 financial year, BHP had two major projects under development, which were Mad Dog
Phase 2 in petroleum and Jansen mine shafts in potash. Both of these projects are tracking to plan.
BHP Results for the year ended 30 June 2021
13
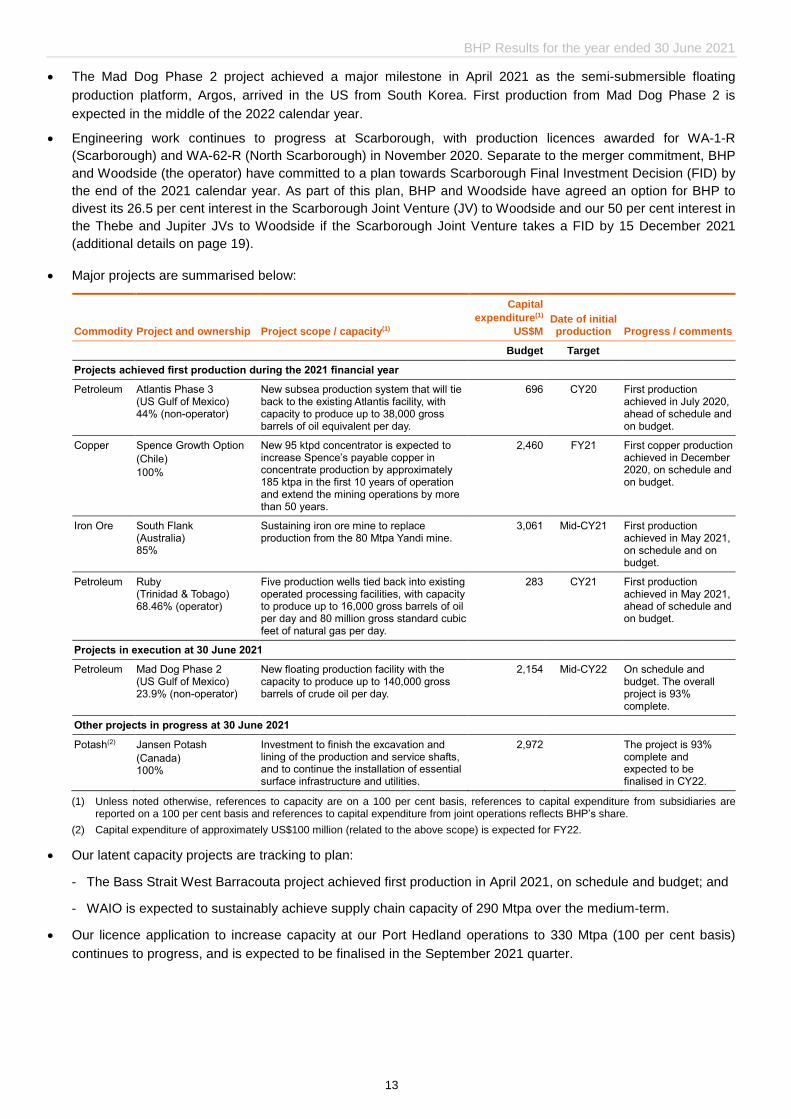
The Mad Dog Phase 2 project achieved a major milestone in April 2021 as the semi-submersible floating
production platform, Argos, arrived in the US from South Korea. First production from Mad Dog Phase 2 is
expected in the middle of the 2022 calendar year.
Engineering work continues to progress at Scarborough, with production licences awarded for WA-1-R
(Scarborough) and WA-62-R (North Scarborough) in November 2020. Separate to the merger commitment, BHP
and Woodside (the operator) have committed to a plan towards Scarborough Final Investment Decision (FID) by
the end of the 2021 calendar year. As part of this plan, BHP and Woodside have agreed an option for BHP to
divest its 26.5 per cent interest in the Scarborough Joint Venture (JV) to Woodside and our 50 per cent interest in
the Thebe and Jupiter JVs to Woodside if the Scarborough Joint Venture takes a FID by 15 December 2021 (additional details on page 19).
Major projects are summarised below:
Commodity Project and ownership Project scope / capacity(1)
Capital
expenditure(1)
US$M Date of initial production Progress / comments
Budget Target
Projects achieved first production during the 2021 financial year
Petroleum Atlantis Phase 3 (US Gulf of Mexico) 44% (non-operator)
New subsea production system that will tie back to the existing Atlantis facility, with capacity to produce up to 38,000 gross barrels of oil equivalent per day.
696 CY20 First production achieved in July 2020, ahead of schedule and on budget.
Copper Spence Growth Option
(Chile)
100%
New 95 ktpd concentrator is expected to increase Spence’s payable copper in concentrate production by approximately 185 ktpa in the first 10 years of operation and extend the mining operations by more than 50 years.
2,460 FY21 First copper production achieved in December 2020, on schedule and on budget.
Iron Ore South Flank (Australia) 85%
Sustaining iron ore mine to replace production from the 80 Mtpa Yandi mine.
3,061 Mid-CY21 First production achieved in May 2021, on schedule and on budget.
Five production wells tied back into existing operated processing facilities, with capacity to produce up to 16,000 gross barrels of oil per day and 80 million gross standard cubic feet of natural gas per day.
283 CY21 First production achieved in May 2021, ahead of schedule and on budget.
Projects in execution at 30 June 2021
Petroleum Mad Dog Phase 2 (US Gulf of Mexico) 23.9% (non-operator)
New floating production facility with the capacity to produce up to 140,000 gross barrels of crude oil per day.
2,154 Mid-CY22 On schedule and budget. The overall project is 93% complete.
Other projects in progress at 30 June 2021
Potash(2) Jansen Potash
(Canada) 100%
Investment to finish the excavation and lining of the production and service shafts, and to continue the installation of essential surface infrastructure and utilities.
2,972 The project is 93% complete and expected to be finalised in CY22.
(1) Unless noted otherwise, references to capacity are on a 100 per cent basis, references to capital expenditure from subsidiaries are reported on a 100 per cent basis and references to capital expenditure from joint operations reflects BHP’s share.
(2) Capital expenditure of approximately US$100 million (related to the above scope) is expected for FY22.
Our latent capacity projects are tracking to plan:
- The Bass Strait West Barracouta project achieved first production in April 2021, on schedule and budget; and
- WAIO is expected to sustainably achieve supply chain capacity of 290 Mtpa over the medium-term.
Our licence application to increase capacity at our Port Hedland operations to 330 Mtpa (100 per cent basis)
continues to progress, and is expected to be finalised in the September 2021 quarter.
News release
14
We have continued to progress with the implementation of autonomous trucks across our Australian iron ore and
coal mine sites.
- At the Newman East (Eastern Ridge) iron ore mine, 22 autonomous trucks deployed in November 2020.
- At the Goonyella Riverside mine in Queensland, the first coal site to implement autonomous haul trucks, the
deployment of 86 autonomous trucks continues in line with the plan and is expected to be completed in the
middle of the 2022 calendar year, on schedule and budget.
- At the Daunia coal mine in Central Queensland, the second coal operation to implement autonomous haul
trucks, the first trucks began operating in January 2021. The rollout is expected to be completed in the December
2021 quarter, on schedule and budget.
Operations Services and apprenticeships
In Australia, we have created 3,850 permanent jobs with Operations Services and deployed people across 20 locations
in WAIO, Olympic Dam, Queensland Coal and NSWEC. We have provided training to new employees and a mastery
program to address the needs of a high-calibre permanent workforce operating in modern mining. Operations Services
have successfully accelerated safety and productivity improvements across our operations, including a two per cent
increase in availability of haul trucks serviced by Operations Services.
In October 2020, BHP announced a further commitment to the training and funding of 2,500 Australian apprenticeships
and training positions over the next five years through our FutureFit Academy. As part of this announcement, BHP
also committed to supporting a further 1,000 skills development opportunities across a range of sectors in regional
areas. In the last 12 months, the BHP FutureFit academy has welcomed over 400 apprentices and maintenance
associates across two locations at Mackay in Queensland and Perth in Western Australia. The first intake of
maintenance associates from the FutureFit Academy have been progressively deployed to an Operations Services
maintenance team at WAIO and Queensland Coal during the second half of the 2021 financial year.
Capital Allocation Framework
Adherence to our Capital Allocation Framework aims to balance value creation, cash returns to shareholders and
balance sheet strength in a transparent and consistent manner.
FY21 US$B
FY20 US$B
Net operating cash flow – total operations 27.2 15.7
Our priorities for capital
Maintenance capital 2.3 1.9
Strong balance sheet
Minimum 50% payout ratio dividend 5.0 5.0
Excess cash(1) 17.6 7.7
Balance sheet 9.4 0.1
Additional dividends 2.9 1.9
Buy-backs - -
Organic development 4.8 5.7
Acquisitions/(Divestments) 0.5 -
(1) Includes total net cash outflow of US$2.3 billion (FY20: US$1.1 billion) which comprises dividends paid to non-controlling interests of US$2.1 billion (FY20: US$1.0 billion); net investment and funding of equity accounted investments of US$0.6 billion (FY20: US$0.6 billion) and an adjustment for exploration expenses of US$(0.4) billion (FY20: US$(0.5) billion) which is classified as organic development in accordance with the Capital Allocation Framework.
BHP Results for the year ended 30 June 2021
15
Outlook
Economic outlook
We remain positive in our outlook for long-term global economic growth and commodity demand. Population growth,
the infrastructure of decarbonisation and rising living standards are all expected to drive demand for energy, metals
and fertilisers for decades to come.
The outlook for the short term remains uncertain. While momentum towards recovery remains intact across many key
regions, vigilance with respect to COVID-19 risks is still a constant for all.
Inflation trends and exchange rates have been volatile. In our business specifically, many commodity-linked
uncontrollable costs have moved higher. For some of our assets, constraints on the free movement of parts of our
workforce are creating localised shortages and associated cost increases. While this situation persists, operational
risks will be elevated.
Commodities outlook
Global crude steel production was unbalanced in the 2020 calendar year, with strong growth in China offset by a steep
fall in the rest of the world (ROW). In the 2021 calendar year to date, this has corrected to some degree, with utilisation
rates in the ROW back close to normal, on average, even as China continues to produce at very high run-rates.
Notwithstanding regulatory uncertainty with respect to periodic output controls, and COVID-19 risks, Chinese steel
production is expected to increase by around 5 per cent in the 2021 calendar year. Steel prices and margins have
achieved record levels in some key ROW regions as the supply recovery has lagged the rapid improvement in
downstream demand. We anticipate a continuation of strong end-use demand conditions in China and ongoing
recovery in the rest of world over the course of the 2022 financial year.
Efforts to decarbonise steel making are expected to proceed at different rates in different regions, based on
availability of lower carbon raw feedstock (including but not exclusively scrap), the age of existing facilities, variable
levels of policy support, net trade positions and differential demands for affordable steel. We expect developing nations
such as India to deploy principally optimisation and transitional technologies across their steel making fleets in the
coming decades. Leading mills in China and in developed regions are already experimenting with transitional and
green end-state technology, with commercialisation of hydrogen-based DRI anticipated from the mid-2030s, with
Europe at the forefront. Accordingly, we expect that the steel making industry will be a large purchaser of carbon
offsets in coming decades even as it positions itself to pursue long run carbon neutrality.
Iron ore prices have been elevated since the Brumadinho tailings dam tragedy in Brazil first disrupted the market in
early 2019. Conditions have been particularly tight since the second half of the 2020 calendar year, with new record
highs for the 62% Fe index fines and the lump premium established. Forces contributing to price gains over the most
recent half have been strong Chinese pig iron production, recovering ROW pig iron production and tight supply of
branded fines products. This latter factor was partly due to production coming in towards the lower end of guidance
for some of the other major iron ore producers. Other material factors in terms of the supply-demand balance included
robust shipments from Port Hedland, Australia, and incremental growth from a high base from price-sensitive sources
of supply. The premium for lump product has been very favourable in the most recent half, buoyed by similar factors
to fines, in addition to sintering restrictions in parts of China. Medium term, China’s demand for iron ore is expected to
be lower than it is today as crude steel production plateaus and the scrap-to-steel ratio rises. In the long-term, prices
are expected to be determined by high cost production, on a value-in-use adjusted basis, from Australia or Brazil.
Quality differentiation is expected to remain a factor in determining iron ore prices.
Metallurgical coal prices faced by Australian producers in the free-on-board (FOB) market were weak for most of the
2021 financial year. Australian FOB prices were able to stage a recovery late in the financial year based on pronounced
multi-regional supply constraints, recovering ROW demand and an associated acceleration of trade flow adjustments.
Even so, the differential between FOB prices and the China CFR equivalent remains very wide, which represents value
leakage for FOB producers. The industry faces a difficult and uncertain period ahead while natural trade flows are
impaired. Long term, we believe that a wholesale shift away from blast furnace steel making, which depends on
metallurgical coal, is still decades in the future. That assessment is based on our bottom-up analysis of likely regional
steel decarbonisation pathways, as discussed above. Demand for seaborne Hard Coking Coals (HCC), or also referred
to as high quality metallurgical coals, is expected to expand alongside the growth of the steel industry in HCC importing
countries such as India.
News release
16
Energy coal prices began to recover from their COVID-19 induced lows late in the 2020 calendar year, assisted by a
pick-up in demand due to cold weather in North Asia, constrained supply and a bounce in Indian industrial activity.
Prices FOB Newcastle rallied again moving into the North Asian summer, with supply disruptions and strengthening
demand intersecting. China’s policy in respect of energy coal imports remains a key medium-term uncertainty.
Copper prices have been strong, with new record highs established on the LME in the second half of the 2021 financial
year. With ROW demand recovering and China’s economy continuing to perform well, the short term outlook for
demand remains constructive. On the supply side, we note that actual disruption rates have been below both the long-
term average and more recent experience in the calendar year to date, despite potential headwinds from COVID-19
outbreaks, political uncertainty and a number of wage negotiations at Chilean mines. Longer term, both demand and
supply factors indicate that copper is an attractive avenue for future growth. Regulatory uncertainty is an emerging risk
across more than one key supply region, the outcome of which could potentially influence the identity and cost of long-
run marginal supply.
Nickel prices have been volatile within an approximate range of US$15,000/t to US$20,000/t on the LME over the
second half of the 2021 financial year. Prices have been boosted, at times, by positive sentiment towards pro-growth
assets, supply disruptions across multiple regions and a strong demand rebound. Demand improvements have come
from both traditional uses and the battery-electric vehicle (EV) complex. Periods of price appreciation have been
interspersed with abrupt but ultimately short-lived declines related to prospective developments in upstream or
downstream technology. Longer term, we believe that nickel will be a substantial beneficiary of the global electrification
mega-trend and that nickel sulphides will be particularly attractive. This is due to their relatively lower cost of production
of battery-suitable class-1 nickel than for laterites, as well as the favourable position of integrated sulphide operations
on the emission intensity curve.
Potash prices have increased sharply over the last 12 months, despite ongoing excess production capacity. According
to CRU, granular spot prices - CFR Brazil and US (New Orleans) FOB barge - increased to around $600 per tonne in
July 2021, up more than 150 per cent and 180 per cent from a year ago respectively. Strong demand due to favourable
farm economics and constrained supply from presently operating assets have combined to inspire the rally. EU
sanctions on certain grades of Belarussian potash exports have amplified the existing upswing. Longer term, potash
stands to benefit from the intersection of a number of global mega-trends: rising population, changing diets and the
need for the sustainable intensification of agriculture. Our analysis suggests that this latter imperative becomes even
more critical under certain decarbonisation pathways. We anticipate trend demand growth will progressively absorb
the excess capacity currently present in the industry. That, in turn, is expected to create the need for new greenfield
supply by the late 2020s or early 2030s. Canadian greenfield solution mines, which tend to be higher opex and
consume more energy and water than conventional mines, are expected to set the industry’s long run trend price.
Crude oil prices have recovered to above US$70 per barrel as the 2022 financial year opens. We believe further gains
from here are possible given our constructive view of demand tailwinds. However, future developments in price are
also expected to rely in large part on the rate at which currently curtailed supply returns, which is highly uncertain.
Looking beyond this phase, our bottom-up analysis of demand, allied to systematic field decline rates, points to a long
run structural supply-demand gap. Considerable investment in conventional oil is going to be required to fill that gap
and maintain market balance. If that investment is not forthcoming in a timely way, the possibility of oil prices increasing
aggressively cannot be ruled out.
The Japan-Korea Marker price for LNG was extraordinarily volatile across the 2021 financial year. The market balance
shifted from heavily over-supplied to extremely tight going into the Northern hemisphere winter. Since that time, prices
have remained elevated relative to seasonal norms, with robust demand combined with ongoing supply outages.
Longer term, we believe the commodity offers a combination of systematic base decline and an attractive demand
trajectory. Within global gas, LNG is expected to gain share due to indigenous supply depletion and/or competitiveness
vis-a-vis pipeline imports in some regions. Against this backdrop, assets advantaged by their proximity to existing
infrastructure or customers, or both, in addition to competitive emissions intensities, are expected to be attractive.
Further information on BHP’s economic and commodity outlook can be found at: bhp.com/prospects
Our strategy is to deliver long-term value and returns through the cycle. We aim to do this through owning a portfolio
of world class assets with exposure to highly attractive commodities which benefit from the mega-trends playing out in
the world around us, by operating them exceptionally well, by maintaining a disciplined approach to capital allocation
and through being industry leaders in sustainability and the creation of social value.
We regularly review our portfolio to improve our asset base and optimise capital allocation decisions. We have
simplified and strengthened our portfolio in recent years. We have invested through the cycle in high returning growth
projects and continued to invest in options for future development and value creation in copper, nickel, oil, advantaged
gas and potash through exploration, early stage investment and development, and innovation.
As the world continues to evolve, BHP is positioning itself to benefit from the mega-trends and through sustainability
leadership.
To this end, today we have announced a major growth investment in the Jansen Stage 1 potash project, which is
aligned with our strategy of growing our exposure to future facing commodities in world class assets, as well as our
further plans to strengthen our portfolio, improve long-term value, provide choice for shareholders and to streamline
our corporate structure, better enabling execution of our strategy.
These decisions will enable a greater allocation of capital in the portfolio to be directed towards future facing
commodities and enhanced shareholder returns, as determined under our Capital Allocation Framework.
Approval of Jansen Stage 1 potash project
BHP has today approved US$5.7 billion (C$7.5 billion) in capital expenditure for the Jansen Stage 1 (Jansen S1)
potash project in the province of Saskatchewan, Canada. Potash is a future facing commodity and Jansen S1 is aligned
with BHP’s strategy of growing our exposure to future facing commodities in world class assets that are large, low cost
and expandable.
Jansen S1 includes the design, engineering and construction of an underground potash mine and surface
infrastructure including a processing facility, a product storage plant, and a continuous automated rail loading system.
It also includes a Remote Operating Centre located in Saskatoon. Jansen S1 product will be shipped to export markets
through Westshore, in Delta, British Columbia and the project includes funding for the required port infrastructure.
Jansen S1 was approved following a thorough evaluation of its risk and return metrics under our Capital Allocation
Framework and it seeks to create long-term, sustainable value and returns for shareholders. Potash provides BHP
with increased leverage to key global mega-trends including rising population, changing diets, decarbonisation and
improving environmental stewardship. It will also give BHP diversity of product, customer and operating jurisdiction.
The Jansen project also offers significant high returning growth optionality in the world’s best potash basin and an
attractive investment jurisdiction.
Jansen S1 is expected to produce approximately 4.35 million tonnes of potash per annum(iv). First ore is targeted in
the 2027 calendar year, with construction expected to take approximately six years, followed by a ramp up period of
two years. The Jansen S1 development incorporates the latest proven equipment and digital technologies, with a hard-
to-replicate design and built in structural advantages. Jansen S1 is designed with a focus on sustainability, including
a low carbon footprint and low water intensity embedded in the design.
As the world’s largest undeveloped potash deposit, future expansions at Jansen have been de-risked through the
existing shaft capacity. This enables lower capital intensity, shorter execution duration and high-return brownfield
expansions, with a basin position that could support a 100-year operation.
At consensus prices(v), the go-forward investment on Jansen S1 is expected to generate an internal rate of return of
12 to 14 per cent, an expected payback period of seven years from first production and an underlying EBITDA margin
of approximately 70 per cent given its expected first quartile cost position.
News release
18
We have previously acknowledged the US$4.5 billion (pre-tax) of capital invested to date has resulted in a significant
initial outlay and that our approach would be different if considering the project again today. The investment to date
includes construction of the shafts and associated infrastructure (US$2.97 billion(xiv) scope of work), as well as
engineering and procurement activities, and preparation works related to Jansen S1 underground infrastructure. The
construction of two shafts and associated infrastructure at the site is 93 per cent complete and expected to be finalised
in the 2022 calendar year. To date approximately 50 per cent of all engineering required for Jansen S1 has also been
completed, significantly de-risking the project. If the investment to date were to be included, the full cycle project would
yield a much lower internal rate of return.
In addition to the investment approval, we have also assessed the carrying value of the existing potash asset base as
at 30 June 2021 and have recognised a pre-tax impairment charge of US$1.3 billion (US$2.1 billion after-tax). The
impairment will reduce the carrying value of the potash asset base to approximately US$3.3 billion. The impairment
charge against our potash assets reflects analysis of recent market perspectives and the value that we would now
expect a market participant to attribute to our investments to date.
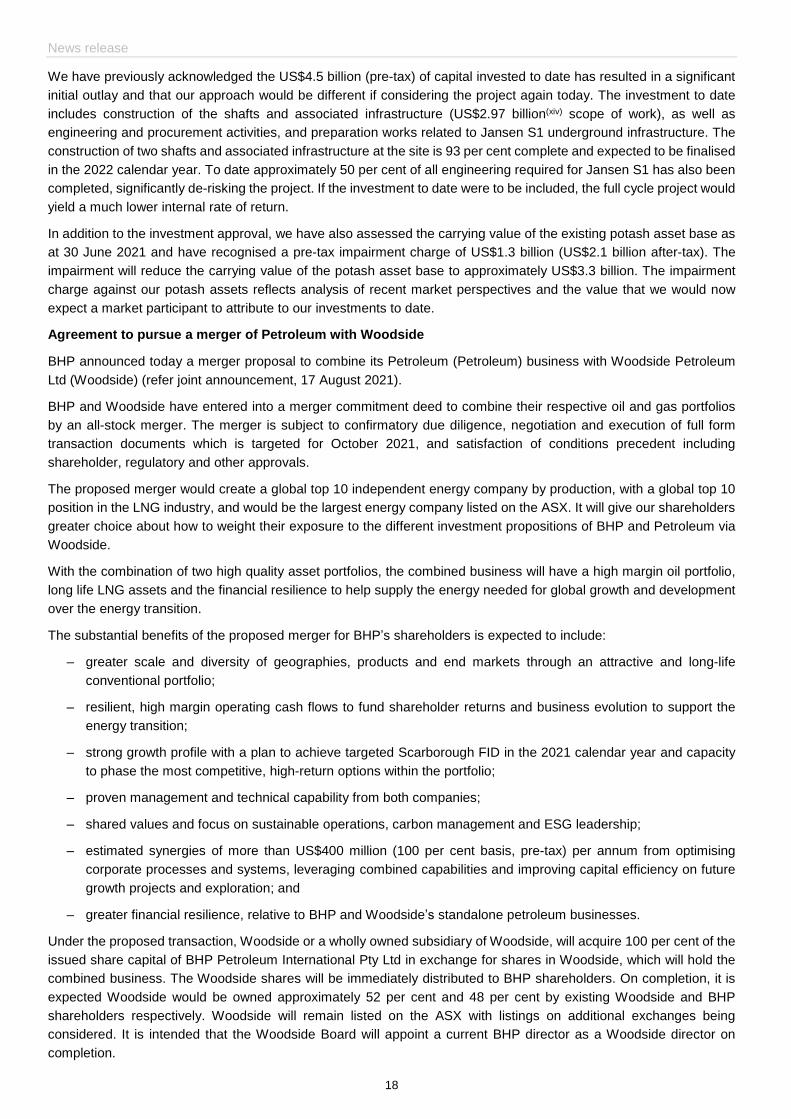
Agreement to pursue a merger of Petroleum with Woodside
BHP announced today a merger proposal to combine its Petroleum (Petroleum) business with Woodside Petroleum
Ltd (Woodside) (refer joint announcement, 17 August 2021).
BHP and Woodside have entered into a merger commitment deed to combine their respective oil and gas portfolios
by an all-stock merger. The merger is subject to confirmatory due diligence, negotiation and execution of full form
transaction documents which is targeted for October 2021, and satisfaction of conditions precedent including
shareholder, regulatory and other approvals.
The proposed merger would create a global top 10 independent energy company by production, with a global top 10
position in the LNG industry, and would be the largest energy company listed on the ASX. It will give our shareholders
greater choice about how to weight their exposure to the different investment propositions of BHP and Petroleum via
Woodside.
With the combination of two high quality asset portfolios, the combined business will have a high margin oil portfolio,
long life LNG assets and the financial resilience to help supply the energy needed for global growth and development
over the energy transition.
The substantial benefits of the proposed merger for BHP’s shareholders is expected to include:
– greater scale and diversity of geographies, products and end markets through an attractive and long-life
conventional portfolio;
– resilient, high margin operating cash flows to fund shareholder returns and business evolution to support the
energy transition;
– strong growth profile with a plan to achieve targeted Scarborough FID in the 2021 calendar year and capacity
to phase the most competitive, high-return options within the portfolio;
– proven management and technical capability from both companies;
– shared values and focus on sustainable operations, carbon management and ESG leadership;
– estimated synergies of more than US$400 million (100 per cent basis, pre-tax) per annum from optimising
corporate processes and systems, leveraging combined capabilities and improving capital efficiency on future
growth projects and exploration; and
– greater financial resilience, relative to BHP and Woodside’s standalone petroleum businesses.
Under the proposed transaction, Woodside or a wholly owned subsidiary of Woodside, will acquire 100 per cent of the
issued share capital of BHP Petroleum International Pty Ltd in exchange for shares in Woodside, which will hold the
combined business. The Woodside shares will be immediately distributed to BHP shareholders. On completion, it is
expected Woodside would be owned approximately 52 per cent and 48 per cent by existing Woodside and BHP
shareholders respectively. Woodside will remain listed on the ASX with listings on additional exchanges being
considered. It is intended that the Woodside Board will appoint a current BHP director as a Woodside director on
completion.
BHP Results for the year ended 30 June 2021
19
Both the BHP and Woodside Boards of directors confirm their support for the proposed merger. The merger is expected
to be completed in the second quarter of the 2022 calendar year with an effective date of 1 July 2021.
The merger is subject to confirmatory due diligence, negotiation and execution of full form transaction documents
which is targeted for October 2021, and satisfaction of conditions precedent including shareholder, regulatory and
other approvals. Under the merger commitment deed, each party has agreed to pursue a merger transaction and
agreed to certain exclusivity arrangements and to each pay a reimbursement fee of approximately US$160 million in
certain circumstances.
Further information about the proposed merger with Woodside will be provided in due course.
In a separate arrangement, BHP and Woodside have committed to a plan towards Scarborough Final Investment
Decision (FID) by the end of the 2021 calendar year, prior to the proposed completion date for the merger. As part of
this plan, BHP and Woodside have agreed an option for BHP to divest its 26.5 per cent interest in the Scarborough
Joint Venture (JV) to Woodside and its 50 per cent interest in the Thebe and Jupiter JVs to Woodside if the
Scarborough JV takes a FID by 15 December 2021. The option is exercisable by BHP in the second half of the 2022
calendar year and if exercised, consideration of US$1 billion is payable to BHP with adjustment from an effective date
of 1 July 2021. An additional US$100 million is payable contingent upon a future FID for a Thebe Development.
Intention to unify BHP’s Dual Listed Company (DLC) Structure
BHP announced today that it intends to unify its DLC structure, subject to final Board and other approvals.
BHP’s DLC structure has two parent companies (BHP Group Limited and BHP Group Plc) operating as a single
economic entity and was established with the BHP and Billiton merger in 2001.
The rationale for and efficacy of the DLC structure have been subject to regular evaluation as the attraction of increased
simplification has always been clear. Today’s announced plans, combined with changes over recent years to our
portfolio, a significant reduction in earnings contribution from Plc assets as well as a material reduction in the expected
costs of unification, have prompted a renewed assessment of the continued suitability of the DLC structure.
The key benefits of unification comprise:
– a simplified corporate structure which reduces duplication, offers more efficient governance and internal
processes and a single measure of value under a unified share register, and
– enhanced strategic flexibility for undertaking future portfolio changes.
A simplified corporate structure with a single unified share register
We have regularly sought to streamline and improve our corporate and governance processes. Unification would
further simplify the BHP corporate structure and shareholder registers, reduce duplication and streamline our
governance and internal processes.
Unification will enable one market capitalisation and one global pool of liquidity, with the same share trading via the
Group’s listings on the Australian, London and Johannesburg stock exchanges and its NYSE listed ADR program.
Unification will not change BHP's strong fundamentals. It will not change BHP's underlying assets or operations,
workforce, executive leadership team, Board or cash flow generation. It will not change our dividend policy or ability to
distribute fully franked dividends.
Enhanced strategic flexibility for undertaking future portfolio changes
As we position the company for the future operating environment, a unified structure will improve flexibility for portfolio
reshaping to maximise value for shareholders over the long-term.
Certain equity based acquisitions, demergers and equity raisings will be able to be executed more efficiently. In the
near-term, unification of the DLC would facilitate a simpler and more efficient separation of Petroleum.
News release
20
Earnings contribution from Plc assets have significantly reduced
Plc’s earnings have reduced over time relative to Limited’s earnings, due to the divestment of assets previously held
by Plc and changes in commodity prices. There have also been increases in overall BHP dividend payments. In recent
years, Limited has paid significant dividends to Plc through the DLC Dividend Share. Plc has used the earnings
generated by the DLC Dividend Share dividends to pay dividends to its shareholders that match the dividends paid to
Limited shareholders. If unification does not occur, BHP expects that the ongoing earnings imbalance between Plc
and Limited assets will result in Limited continuing to pay significant DLC Dividend Share dividends to Plc. Any DLC
Dividend Share dividends paid by Limited must be franked to the same extent as regular Limited dividends and the
franking credits that are attached to these dividends cannot be distributed by Plc to BHP shareholders. Unification will
remove the DLC-related constraints on dividend arrangements and result in franked distributions being paid directly to
all BHP shareholders.
Costs of unification have materially reduced
The expected costs associated with unification have significantly reduced as a result of portfolio and corporate
structure changes in recent years, including BHP’s settlement of the marketing dispute with the ATO and the recently
updated assessment of the likelihood of recovering NSWEC associated tax losses. These changes represent a
reduction in unification costs of approximately US$1.2 billion. One-off unification costs are now expected to range
between US$400 to US$500 million. In comparison, in 2017 we assessed a loss of value of up to US$3 billion based
on a single United Kingdom incorporated company. Under the transaction structure currently contemplated, the most
significant component of these expected costs is related to stamp duties levied on Limited as a result of its acquisition
of shares in Plc in order to implement unification.
Unification process and timing
Unification is subject to final Board approval, third party consents, regulatory, shareholder and court approvals.
Unification would involve Limited acquiring the shares of Plc and would be implemented by way of an English scheme
of arrangement. Unification will require the approval of Plc and Limited shareholders voting separately and UK court
approval. If unification is implemented, eligible Plc shareholders would be entitled to receive one Limited share for
each Plc share they own. Following unification, both Limited and Plc shareholders would have the equivalent voting
and economic interests in BHP as exist under the current DLC structure.
It is expected that a unified BHP would have its primary listing on the ASX, a standard listing on the LSE, a secondary
listing on the JSE, and a sponsored Level II ADR program on the NYSE. A unified BHP would retain inclusion in the
S&P/ASX indices. We have started engagement with FTSE Russell and understand that, based on their existing
indexation methodology, a unified BHP would not qualify for inclusion in the FTSE UK Index Series. BHP’s corporate
and operational presence in Australia, the UK and other key locations are expected to remain unchanged. Following
unification, BHP will retain its ongoing commitment to high corporate governance standards. The Board also intends
to continue its practice of holding annual director elections.
If approved, unification is expected to occur in the first half of the 2022 calendar year, with the proposed Petroleum
merger with Woodside to follow. Further information about the proposed unification of BHP’s DLC structure will be
provided in due course.
Update on our non-core coal divestment process
In August 2020, we announced plans to divest our interests in BHP Mitsui Coal(xv) (BMC), NSWEC and Cerrejón in
order to focus our coal portfolio on higher quality metallurgical coals used in steelmaking.
In June 2021, we announced the signing of a Sale and Purchase Agreement to divest our 33.3 per cent interest in
Cerrejón for US$294 million cash consideration. Subject to the satisfaction of customary competition and regulatory
requirements, this is expected to complete in the second half of the 2022 financial year.
The process for BMC and NSWEC is progressing, in line with the two-year timeframe we set last year. We remain
open to all options and continue consultation with relevant stakeholders.
BHP Results for the year ended 30 June 2021
21
A stronger and more competitive BHP
The plans we have announced today will help position BHP for the future. The investment and potential future growth
in potash, coupled with the proposed merger of Petroleum with Woodside will result in a portfolio with greater net
positive exposure to the mega-trends of decarbonisation and electrification. Copper, potash, nickel, and iron ore all
stand to benefit from these trends, as does higher quality metallurgical coal in the near to medium term.
The proposed unification would further simplify the BHP corporate structure with a single share register. It would also
improve strategic flexibility for increasing long-term portfolio exposure towards future facing commodities.
Following our investment in Jansen S1, the proposed separation of Petroleum and exit of our non-core coal assets,
BHP will be focussed on high quality iron ore and metallurgical coal for the steel that is needed for infrastructure
including for renewable energy; copper to support unprecedented demand for renewable energy; nickel for batteries;
and potash to make food production and land use more efficient. We will also continue to create and secure further
options in future facing commodities
We are a long-term focused company that creates value and returns over generations for our investors, partners and
communities. We do this by striving to be excellent operators, by demonstrating industry leadership in sustainability,
by maintaining a disciplined approach to capital allocation, and by ensuring exposure to commodities that benefit from
the mega-trends playing out in the world around us.
News release
22
Income statement
Underlying attributable profit and Underlying EBITDA are presented below.
Underlying attributable profit
Year ended 30 June
2021
US$M
2020
US$M
Profit after taxation attributable to BHP shareholders 11,304 7,956
Total exceptional items attributable to BHP shareholders(1) 5,773 1,104
Underlying attributable profit 17,077 9,060
Weighted basic average number of shares (million) 5,057 5,057
Underlying basic earnings per ordinary share 337.7 179.2
(1) Refer to page 25 and to note 2 ‘Exceptional items’ and note 8 ‘Significant events – Samarco dam failure’ of the Financial Information for further information.
Underlying EBITDA
Year ended 30 June
2021
US$M
2020
US$M
Profit from operations 25,906 14,421
Exceptional items included in profit from operations(1) 4,385 1,453
Underlying EBIT 30,291 15,874
Depreciation and amortisation expense 6,824 6,112
Net impairments 2,635 494
Exceptional item included in Depreciation, amortisation and impairments(2) (2,371) (409)
Underlying EBITDA 37,379 22,071
(1) Exceptional items loss of US$4,385 million excludes net finance costs of US$85 million related to the Samarco dam failure. Refer to page 25 and to note 2 ‘Exceptional items’ and note 8 ‘Significant events – Samarco dam failure’ of the Financial Information for further information.
(2) Relates to impairment charges in relation to NSWEC and Potash. Refer to page 25 and to note 2 ‘Exceptional items’.
BHP Results for the year ended 30 June 2021
23
Underlying EBITDA
The following table and commentary describes the impact of the principal factors(ii) that affected Underlying EBITDA
for the 2021 financial year compared with the 2020 financial year:
US$M
Year ended 30 June 2020 22,071
Net price impact:
Change in sales prices 16,965 Higher average realised prices for iron ore, copper, nickel, oil, natural gas and thermal coal, partially offset by lower average realised prices for metallurgical coal and LNG.
Price-linked costs (870) Increased royalties reflect higher realised prices for iron ore and higher third party concentrate purchase costs reflect higher nickel prices, partially offset by lower royalties for petroleum and metallurgical coal.
16,095
Change in volumes (312) Record volumes at WAIO with strong performance across the supply chain, were offset by natural field decline at Petroleum.
The expected lower grades at Escondida and Spence more than offset Escondida concentrator throughput maintained at record levels, the new stream of concentrate production from the Spence Growth Option that came online in December 2020 and highest annual copper production achieved at Olympic Dam since our acquisition in 2005.
Lower volumes due to adverse weather impacts in the Gulf of Mexico (Petroleum) and NSWEC, combined with dragline maintenance and higher strip ratios at BMC. This was partially offset by the acquisition of the additional 28 per cent working interest at Shenzi and increased volumes at Nickel West following resource transition and major quadrennial maintenance shutdowns in the prior period.
Change in controllable cash costs:
Operating cash costs (34) Higher inventory drawdowns at Olympic Dam due to stronger mill and smelter performance and at Nickel West as volumes increased following planned maintenance shutdowns in the prior period and additional costs associated with the ramp-up of South Flank. This was largely offset by strong cost performance supported by cost reduction initiatives across our assets, lower technology costs and a gain from the optimised outcome from renegotiation of cancelled power contracts at Escondida and Spence.
Exploration and business development 109 Lower exploration expenses due to lower seismic activity in Petroleum.
75
Change in other costs:
Exchange rates (1,588) Impact of the stronger Australian dollar and Chilean peso against the US dollar.
Inflation (286) Impact of inflation on the Group's cost base.
Fuel and energy 223 Predominantly lower diesel prices at our minerals assets.
Non-Cash 282 Lower deferred stripping depletion at Escondida in line with planned development phase of the mines
One-off items (122) Volume loss across our operations due to COVID-19 restrictions, predominantly at our copper operations in Chile.
(1,491)
Asset sales 17
Ceased and sold operations 242 Reflects the divestment of Neptune and a decrease in costs related to the closure and rehabilitation provision for closed mines of US$311 million(1) compared with the prior year.
Other items 682 Other includes higher average realised sales prices received by Antamina.
Year ended 30 June 2021 37,379
(1) Closure and rehabilitation provision for closed mines adjustment charge to the income statement of US$301 million (FY20: US$612 million).
News release
24
Prices and exchange rates
The average realised prices achieved for our major commodities are summarised below:
Nickel metal (US$/t) 17,537 15,140 16,250 13,860 17% 41% 16%
(1) Based on provisional, unaudited estimates. Prices exclude sales from equity accounted investments, third party product and internal sales, and represent the weighted average of various sales terms (for example: FOB, CIF and CFR), unless otherwise noted. Includes the impact of provisional pricing and finalisation adjustments.
(2) Includes internal sales.
(3) Hard coking coal (HCC) refers generally to those metallurgical coals with a Coke Strength after Reaction (CSR) of 35 and above, which includes coals across the spectrum from Premium Coking to Semi Hard Coking coals, while weak coking coal (WCC) refers generally to those metallurgical coals with a CSR below 35.
(4) Export sales only; excludes Cerrejón. Includes thermal coal sales from metallurgical coal mines.
In Copper, the provisional pricing and finalisation adjustments increased Underlying EBITDA by US$47 million in the
2021 financial year and are included in the average realised copper price in the above table.
The following exchange rates relative to the US dollar have been applied in the financial information:
Average Average
Year ended Year ended As at As at As at
30 June 30 June 30 June 30 June 30 June
2021 2020 2021 2020 2019
Australian dollar(1) 0.75 0.67 0.75 0.68 0.70
Chilean peso 746 771 735 816 680
(1) Displayed as US$ to A$1 based on common convention.
Depreciation, amortisation and impairments
Depreciation, amortisation and impairments excluding exceptional items increased by US$891 million to US$7.1 billion.
This increase reflected higher depreciation and amortisation at Petroleum following a decrease in estimated remaining
reserves at Bass Strait due to underperformance of the reservoir in the Turrum field and lower overall condensate and
natural gas liquids (NGL) recovery from the Bass Strait gas fields, higher depreciation at WAIO due to a change in
Yandi’s life of mine and higher depreciation on right-of-use (lease) assets associated with index-linked freight
contracts, including continuous voyage charters (CVCs), as a result of an increase in the prevailing freight index (Baltic
C5 index).
Net finance costs
Net finance costs increased by US$394 million to US$1,305 million due to premiums of US$395 million paid as part of
the value accretive multi-currency hybrid repurchase programs completed during the year.
(1) Refer exceptional items below for further details.
The Group’s adjusted effective tax rate, which excludes the impact of exchange rate movements and exceptional
items, was 34.1 per cent (2020: 33.2 per cent). The adjusted effective tax rate is above 30 per cent and higher than at
30 June 2020 primarily as a result of higher withholding tax on dividends, driven by higher profitability from our Chilean
operations, and current period losses which are not recoverable (including NSWEC and certain Petroleum exploration
projects). The adjusted effective tax rate is expected to be in the range of 32 to 37 per cent for the 2022 financial year.
Other royalty and excise arrangements which are not profit based are recognised as operating costs within Profit
before taxation. These amounted to US$3.2 billion during the period (2020: US$2.4 billion).
Exceptional items
The following table sets out the exceptional items for the 2021 financial year. Additional commentary is included on
page 48.
Year ended 30 June 2021
Gross
US$M
Tax
US$M
Net
US$M
Exceptional items by category
Samarco dam failure (1,087) (71) (1,158)
COVID-19 related costs (546) 146 (400)
Impairment of Energy coal assets (1,523) (651) (2,174)
Impairment of Potash assets (1,314) (751) (2,065)
Total (4,470) (1,327) (5,797)
Attributable to non-controlling interests (34) 10 (24)
Attributable to BHP shareholders (4,436) (1,337) (5,773)
Debt management and liquidity
BHP continues to optimise its balance sheet and debt position.
During the 2021 financial year, gross debt decreased by US$6.0 billion to US$21.0 billion at 30 June 2021. A US$2.8
billion reduction was achieved by the completion of two multi-currency hybrid repurchase programs: for US$1.7 billion
on 17 September 2020 and US$1.1 billion on 23 November 2020. These programs were funded from surplus cash
and were value accretive, with the reduction of future interest costs being higher than the premium paid to repurchase
the targeted hybrid notes. An additional US$2.8 billion debt reduction came from the early redemption of hybrid notes
including US$1.0 billion of 6.250 per cent hybrid notes on 19 October 2020, US$0.3 billion of 6.750 per cent hybrid
notes on 30 December 2020 (the balance following the repurchase programs), and EUR€1.25 billion of 4.750 per cent
hybrid notes on 22 April 2021. The redemptions were also completed using surplus cash.
At the subsidiary level, Escondida borrowed US$550 million to refinance maturing long-term debt during the 2021
financial year.
BHP continues to hold a robust liquidity position with US$15.2 billion in cash and cash equivalents. The Group also
has a US$5.5 billion commercial paper program backed by a US$5.5 billion revolving credit facility, which expires in
October 2025. As at 30 June 2021, the Group had no outstanding commercial paper and no drawn amount under the
revolving credit facility.
News release
26
Dividend
The BHP Board today determined to pay a final dividend of US$2.00 per share (US$10.1 billion). The final dividend to
be paid by BHP Group Limited will be fully franked for Australian taxation purposes.
BHP’s Dividend Reinvestment Plan (DRP) will operate in respect of the final dividend. Full terms and conditions of the
DRP and details about how to participate can be found at: bhp.com
Events in respect of the final dividend Date
Announcement of currency conversion into RAND 27 August 2021
Last day to trade cum dividend on Johannesburg Stock Exchange Limited (JSE) 31 August 2021
Ex-dividend Date JSE 1 September 2021
Ex-dividend Date (Australian Securities Exchange (ASX), London Stock Exchange (LSE) and New York Stock Exchange (NYSE(1)))
2 September 2021
Record Date 3 September 2021
DRP and Currency Election date (including announcement of currency conversion for ASX and LSE) 6 September 2021
Payment Date 21 September 2021
DRP Allocation Date (ASX and LSE) within 10 business days after the payment date 5 October 2021
DRP Allocation Date (JSE), subject to the purchase of shares by the Transfer Secretaries in the open market, Central Securities Depository Participant (CSDP) accounts credited/updated on or about(2)
5 October 2021
(1) BHP Group Limited and BHP Group Plc shares are listed in the form of American Depositary Shares (ADSs) and traded as American Depositary Receipts (ADRs) on the NYSE. Each ADS represents two ordinary shares.
(2) Computershare Investor Services (Pty) Limited as the Transfer Secretary will notify Strate and CSDPs when the price and allocation date is known.
BHP Group Plc shareholders registered on the South African section of the register will not be able to dematerialise
or rematerialise their shareholdings between the dates of 1 September 2021 and 3 September 2021 (inclusive) and
transfers between the UK register and the South African register will not be permitted between the dates of 27 August
2021 and 3 September 2021 (inclusive). Details of the currency exchange rates applicable for the dividend will be
announced to the relevant stock exchanges following conversion and will appear on the Group’s website.
Any eligible shareholder who wishes to participate in the DRP, or to vary a participation election should do so in
accordance with the timetable above, or, in the case of shareholdings on the South African branch register of BHP
Group Plc, in accordance with the instructions of your CSDP. The DRP Allocation Price will be calculated in each
jurisdiction as an average of the price paid for each share actually purchased to satisfy DRP elections. The Allocation
Price applicable to each exchange will made available at: bhp.com/DRP(xvi)
Corporate governance
Stefanie Wilkinson was appointed Group Company Secretary of BHP Group Limited and BHP Group Plc, effective
from 1 March 2021.
As previously announced in December 2020, Susan Kilsby stepped down as the Chair of BHP’s Remuneration
Committee, effective 1 March 2021 and intends to retire as a BHP Director during the 2021 calendar year, and no later
than the 2021 Annual General Meetings.
The current members of the Board’s committees are:
Iron Ore 20,797 14,554 12,924 (614) 18,400 2,328 87 47
Coal 6,242 1,632 811 (18) 9,509 603 22 9
Group and unallocated items(7) 1,219 (669) (1,201) 413 4,340 626 13 13
Inter-segment adjustment(8) (63) − − − − − − −
Total Group 42,931 22,071 15,874 (1,453) 65,853 6,900 740 517
(1) Group and segment level information is reported on a statutory basis which reflects the application of the equity accounting method in preparing the Group financial statements – in accordance with IFRS. Underlying EBITDA of the Group and the reportable segments, includes depreciation, amortisation and impairments (D&A), net finance costs and taxation expense of US$629 million (FY2020: US$446 million) related to equity accounted investments. It excludes exceptional items loss of US$990 million (FY2020: US$508 million loss) related to share of profit/loss from equity accounted investments, related impairments and expenses.
Group profit before taxation comprised Underlying EBITDA, exceptional items, depreciation, amortisation and impairments of US$11,473 million (FY2020: US$7,650 million) and net finance costs of US$1,305 million (FY2020: US$911 million).
(2) Revenue is based on Group realised prices and includes third party products. Sale of third party products by the Group contributed revenue of US$2,296 million and Underlying EBITDA of US$66 million (FY2020: US$1,171 million and US$32 million).
(3) For more information on the reconciliation of certain alternative performance measures to our statutory measures, reasons for usefulness and calculation methodology, please refer to alternative performance measures set on pages 62 and 72.
(4) Exceptional items loss of US$4,385 million excludes net finance costs of US$85 million included in the total loss before taxation of US$1,087 million related to the Samarco dam failure. Refer to note 2 ‘Exceptional items’ and note 8 ‘Significant events – Samarco dam failure’ of the Financial Information for further information.
(5) Includes US$84 million capitalised exploration (FY2020: US$223 million).
(6) Includes US$86 million of exploration expenditure previously capitalised, written off as impaired (included in depreciation and amortisation) (FY2020: US$ nil).
(7) Group and unallocated items includes functions, other unallocated operations including Potash, Nickel West, legacy assets, and consolidation adjustments. Revenue not attributable to reportable segments comprises the sale of freight and fuel to third parties, as well as revenues from unallocated operations. Exploration and technology activities are recognised within relevant segments.
(8) Comprises revenue of US$51 million generated by Petroleum (FY2020: US$62 million) and US$ nil generated by Coal (FY2020: US$1 million).
(9) Net operating assets has been restated to reflect changes to the Group’s accounting policy following a decision by the IFRS Interpretations Committee on IAS 12 ‘Income Tax’, resulting in the retrospective recognition of US$950 million of Goodwill at Olympic Dam. Note, an offsetting increase in Deferred tax liabilities of US$1,021 million which is not included in Net Operating Assets above. Refer to note 1 ‘Impact of new accounting standards and changes in accounting policies’ of the Financial Information for further information.
Underlying EBITDA for Petroleum increased by US$93 million to US$2.3 billion in the 2021 financial year.
US$M
Underlying EBITDA for the year ended 30 June 2020 2,207
Net price impact 257 Higher average realised oil and natural gas prices, partially offset by lower average realised LNG prices:
Crude and condensate oil US$52.56/bbl (2020: US$49.53/bbl);
Natural gas US$4.34/Mscf (2020: US$4.04/Mscf); and
LNG US$5.63/Mscf (2020: US$7.26/Mscf).
Change in volumes: growth (157) Lower volumes due to natural field decline across the portfolio, impacts from a highly active hurricane season in the Gulf of Mexico and lower gas demand at Bass Strait. This was partially offset by the acquisition of the additional 28 per cent working interest in Shenzi, improved reliability at Bass Strait, stronger performance at North West Shelf, and higher domestic gas sales at Macedon.
Change in controllable cash costs 43 Lower discretionary maintenance activities at our Australian assets due to COVID-19 restrictions, offset by higher workover activity at Atlantis and restructuring costs related to improving future competitiveness.
Lower exploration expenses reflects lower seismic activity, partially offset by increased business development activity in Mexico due to Trion progressing into pre-feasibility.
Ceased and sold operations (62) Revaluation of closure provisions of US$(110) million and sale of our interest in the Minerva Gas Plant in the prior year, partially offset by the divestment of Neptune.
Change in other costs:
Exchange rates 29
Inflation (10)
One-off items (9) Reflects volume loss related to COVID-19 from shutdown at Atlantis.
Other items 2 Other items include the revaluation of embedded derivatives in Trinidad and Tobago gas contract of US$59 million loss (2020: US$22 million loss), offset by tax barrel adjustments at Trinidad and Tobago and other items.
Underlying EBITDA for the year ended 30 June 2021 2,300
Petroleum unit costs increased by 11 per cent to US$10.83 per barrel of oil equivalent primarily due to lower volumes
and unfavourable exchange rate movements, partially offset by a reduction in price-linked costs. Unit costs in the 2022
financial year are expected to be between US$11 and US$12 per barrel (based on an exchange rate of AUD/USD 0.78)
reflecting the impact of an increase in exchange rate and forecast higher price-linked costs. In the medium term, we
expect an increase in unit costs to be maintained at less than US$13 per barrel (based on an exchange rate of
AUD/USD 0.78) primarily as a result of natural field decline.
Petroleum unit costs (US$M) H2 FY21 H1 FY21 FY21 FY20
Revenue 2,327 1,619 3,946 4,070
Underlying EBITDA 1,511 789 2,300 2,207
Gross costs 816 830 1,646 1,863
Less: exploration expense 115 181 296 394
Less: freight 78 29 107 110
Less: development and evaluation 90 106 196 166
Less: other(1) (67) (1) (68) 131
Net costs 600 515 1,115 1,062
Production (MMboe, equity share) 53 50 103 109
Cost per Boe (US$)(2)(3) 11.32 10.30 10.83 9.74
(1) Other includes non-cash profit on sales of assets, inventory movements, foreign exchange, provision for onerous lease contracts and the impact from revaluation of embedded derivatives in the Trinidad and Tobago gas contract.
(2) FY21 based on an exchange rate of AUD/USD 0.75.
(3) FY21 excludes COVID-19 related costs of US$0.27 per barrel of oil equivalent that are reported as exceptional items.
During the 2021 financial year, we maintained our record of strong safety and operational performance while delivering
several key milestones and outperforming our production and unit cost targets. We demonstrated capital discipline
and strengthened our competitiveness through the counter-cyclical acquisition of an increased working interest in
Shenzi, resulting in the addition of high margin barrels to the portfolio. We also accelerated our Shenzi infill drilling
program to capture commodity price upside, simplified and restructured our organisational model, and continued to
de-risk and improve the competitiveness of our growth options and future opportunities.
We also completed a transaction in May 2021 transferring our ownership interest in the operated Neptune asset in the
Gulf of Mexico to EnVen Energy Ventures, LLC.
BHP Results for the year ended 30 June 2021
29
In the June 2021 quarter, drilling commenced on the second Shenzi infill well. Drilling of the first Shenzi infill well took
place in March 2021, with production expected from both infill wells in the 2022 financial year.
On 5 August 2021, the Board approved the funding to develop the Shenzi North project, a two-well subsea tie-in to the
Shenzi platform. First production is targeted for the 2024 calendar year. Additional plans for the 2022 financial year
include advancing Trion into the Front End Engineering Design (FEED) phase, with competitive risk-weighted returns,
and progressing the Calypso appraisal program, with the first appraisal well spud in late July 2021. Further targets
include a potential Board decision on investment in the Scarborough gas development by the end of the 2021 calendar
year, prior to the proposed completion date for the merger with Woodside, and expected first production from Mad Dog
Phase 2 in the middle of the 2022 calendar year. Reflecting these projects, as well as natural field decline, average
production is expected to increase to approximately 109 MMboe over the medium term.
Petroleum exploration
Petroleum exploration expenditure for the 2021 financial year was US$322 million, of which US$296 million was
expensed. An approximately US$540 million exploration and appraisal program is planned for the 2022 financial year.
This is an increase of approximately US$200 million and reflects drilling two Calypso appraisal wells in Trinidad and
Tobago, and increased exploration drilling in the Gulf of Mexico.
In Trinidad and Tobago, we fulfilled our drilling commitments in the Southern licences with the drilling of the
Broadside-1 exploration well in the first half of the 2021 financial year. The Transocean drilling rig arrived on location
in our Northern licences in June 2021 and commenced drilling the first of the two Calypso gas appraisal wells in July
2021.
In Mexico, we commenced an Ocean Bottom Node seismic acquisition(xvii) over the Trion field on 9 November 2020,
as part of our ongoing evaluation and analysis. The survey was completed in early January 2021 and the results will
be incorporated into the current evaluation of the Trion opportunity. In addition, we received formal approval for a
124-day extension for the evaluation and exploration periods through 1 July 2021 and 1 July 2022 respectively, as a
result of the suspension of activities in 2020 due to COVID-19.
In the US Gulf of Mexico, we expanded our acreage position through the acquisition of two blocks in the central regions
and three blocks in the western region, aligned with our strategy of growing our Gulf of Mexico heartland.
In Eastern Canada, we have flexibility on timing with our two licences in the Orphan Basin, while evaluating the farm-out
opportunities. The technical evaluation to support exploration well planning is ongoing.
News release
30
Financial information for Petroleum for the 2021 and 2020 financial years is presented below.
Year ended
30 June 2021
US$M Revenue(1)
Underlying
EBITDA D&A
Underlying
EBIT
Net
operating
assets
Capital
expenditure
Exploration
gross(2)
Exploration
to profit(3)
Australia Production Unit(4) 327 202 186 16 64 23
Bass Strait 1,066 798 775 23 1,136 70
North West Shelf 893 761 239 522 1,281 104
Atlantis 560 401 162 239 1,109 178
Shenzi 417 309 175 134 970 113
Mad Dog 231 174 54 120 1,885 308
Trinidad/Tobago 204 80 44 36 433 152
Algeria 164 135 − 135 107 2
Exploration − (296) 122 (418) 1,148 −
Other(5) 85 (262) 113 (375) (169) 44
Total Petroleum from Group production 3,947 2,302 1,870 432 7,964 994
Third party products 11 1 − 1 − −
Total Petroleum 3,958 2,303 1,870 433 7,964 994 322 382
Total Petroleum statutory result 4,070 2,207 1,457 750 8,247 909 564 394
(1) Total Petroleum statutory result revenue includes: crude oil US$2,013 million (FY2020: US$2,033 million), natural gas US$977 million (FY2020: US$980 million), LNG US$682 million (FY2020: US$774 million), NGL US$212 million (FY2020: US$198 million) and other US$62 million (FY2020: US$85 million) which includes third party products.
(2) Includes US$26 million of capitalised exploration (FY2020: US$170 million).
(3) Includes US$86 million of exploration expenditure previously capitalised, written off as impaired (included in depreciation and amortisation) (FY2020: US$ nil).
(4) Australia Production Unit includes Macedon, Pyrenees and Minerva (divested in December 2019).
(5) Predominantly divisional activities, business development and Neptune (sale finalised in May 2021). Also includes the Caesar oil pipeline and the Cleopatra gas pipeline, which are equity accounted investments. The financial information for the Caesar oil pipeline and the Cleopatra gas pipeline presented above, with the exception of net operating assets, reflects BHP's share.
(6) Total Petroleum statutory result revenue excludes US$12 million (FY2020: US$16 million) revenue related to the Caesar oil pipeline and the Cleopatra gas pipeline. Total Petroleum statutory result Underlying EBITDA includes US$3 million (FY2020: US$3 million) D&A related to the Caesar oil pipeline and the Cleopatra gas pipeline.
BHP Results for the year ended 30 June 2021
31
Copper
Underlying EBITDA for the 2021 financial year increased by US$4.1 billion to US$8.5 billion.
US$M
Underlying EBITDA for the year ended 30 June 2020 4,347
Net price impact 4,336 Higher average realised price:
Copper US$3.81/lb (2020: US$2.50/lb)
Change in volumes (258) Lower volumes at Escondida as concentrator throughput at record levels was more than offset by lower feed grade for both the concentrators and for stacking. Lower cathode sales at Spence as a result of grade decline and planned maintenance, partially offset by the new stream of concentrate production from the Spence Growth Option that came online in December 2020. Highest annual copper production at Olympic Dam reflected strong performance at the smelter and refinery compared with unplanned downtime at the smelter in the prior period.
Change in controllable cash costs (106) Higher inventory drawdowns at Olympic Dam, due to stronger mill and smelter performance compared to the prior period, and at Escondida to offset lower material mined during the period due to a reduced operational workforce. This was partially offset by strong cost performance at Escondida, a US$99 million gain from the optimised outcome from renegotiation of cancelled power contracts at Escondida and Spence, and favourable leach pad inventory movements at Escondida and Spence.
Change in other costs:
Exchange rates (477)
Inflation (136)
Non-cash 273 Lower deferred stripping depletion at Escondida, reflecting the planned development phase of the mines.
One-off items (97) Copper cathodes volume loss at Escondida due to reduced operational workforce as a result of COVID-19.
Other items 607 Other includes increased profit from Antamina driven by higher realised copper and zinc prices, and favourable impacts from lower fuel and energy prices of US$75 million.
Underlying EBITDA for the year ended 30 June 2021 8,489
Escondida unit costs decreased by one per cent to US$1.00 per pound, reflecting continued strong concentrator
throughput, at record levels, as well as lower deferred stripping costs and higher by-product credits. This also reflects
a one-off gain from the optimisation of a settlement outcome for the cancellation of power contracts as part of a shift
towards 100 per cent renewable energy at Escondida. The strong unit cost result was achieved despite the impact of
unfavourable exchange rate movements, a four per cent decline in copper concentrate feed grade and lower cathode
volumes as a result of a reduced operational workforce due to COVID-19.
Unit costs in the 2022 financial year are expected to be between US$1.20 and US$1.40 per pound (based on an
exchange rate of USD/CLP 727), reflecting expected lower by-product credits, forecast higher costs associated with
an approximately 20 per cent increase in material mined required to catch up on mine development due to reduced
material movement in the 2021 financial year and study costs to increase optionality at Escondida longer term. This
also reflects the inclusion of COVID-19 costs (treated as an exceptional item in the 2021 financial year) and a further
decline in concentrator feed grade of approximately two per cent. In the medium term, unit cost guidance remains
unchanged at less than US$1.10 per pound (based on an exchange rate of USD/CLP 727).
Escondida unit costs (US$M) H2 FY21 H1 FY21 FY21 FY20
Revenue 4,954 4,516 9,470 6,719
Underlying EBITDA 3,464 3,019 6,483 3,535
Gross costs 1,490 1,497 2,987 3,184
Less: by-product credits 206 272 478 407
Less: freight 83 79 162 178
Net costs 1,201 1,146 2,347 2,599
Sales (kt) 490 576 1,066 1,164
Sales (Mlb) 1,080 1,270 2,350 2,567
Cost per pound (US$)(1)(2)(3) 1.11 0.90 1.00 1.01
(1) FY21 based on an average exchange rate USD/CLP 746.
(2) FY21 excludes COVID-19 related costs of US$0.03 per pound that are reported as exceptional items.
(3) FY21 includes a gain from the optimised outcome from renegotiation of cancelled power contracts of US$0.04 per pound.
News release
32
On 13 August 2021, Escondida successfully completed negotiations for a new collective agreement with the Union
No1 of Operators and Maintainers, effective for 36 months from 2 August 2021.
The Spence Growth Option achieved first copper concentrate sales in the March 2021 quarter, after delivering first
production in December 2020. Ramp-up to full production remains on track and is expected to be completed by
December 2021 despite COVID-19 related impacts, including border restrictions preventing key personnel coming to
site. Once ramp-up is completed, Spence is expected to average 300 ktpa of production (including cathodes) over the
first four years of operation. The expansion will operate with 100 per cent desalinated water, following the
commissioning of a new desalinated water plant, with capacity of 1,000 litres per second. In addition, we are looking
at options to use 100 per cent desalinated water in our cathode operations. This follows Escondida’s investment of
more than US$4 billion in desalinated water capacity since 2006, which enabled it in December 2019 to eliminate
drawdown of water from aquifers for operational supply, 10 years ahead of target.
In the 2022 financial year, Escondida and Spence will transition to four renewable power contracts to deliver
operational flexibility, ensure security of supply and to reduce energy prices at both operations by approximately 20
per cent. We aim to supply Escondida and Spence’s energy requirements from 100 per cent renewable energy sources
by the mid-2020s.
Financial information for Copper for the 2021 and 2020 financial years is presented below.
Year ended
30 June 2021
US$M Revenue
Underlying
EBITDA D&A
Underlying
EBIT
Net
operating
assets
Capital
expenditure
Exploration
gross
Exploration
to profit
Escondida(1) 9,470 6,483 969 5,514 11,926 666
Pampa Norte(2) 1,801 954 390 564 4,510 678
Antamina(3) 1,627 1,158 142 1,016 1,362 237
Olympic Dam 2,211 598 313 285 9,045 830
Other(3)(4) − (230) 10 (240) 85 7
Total Copper from Group production 15,109 8,963 1,824 7,139 26,928 2,418
Third party products 2,244 64 − 64 − −
Total Copper 17,353 9,027 1,824 7,203 26,928 2,418 62 58
Total Copper statutory result 10,666 4,347 1,757 2,590 25,357 2,434 54 54
(1) Escondida is consolidated under IFRS 10 and reported on a 100 per cent basis.
(2) Includes Spence and Cerro Colorado.
(3) Antamina, SolGold and Resolution are equity accounted investments and their financial information presented above with the exception of net operating assets reflects BHP Group’s share.
(4) Predominantly comprises divisional activities, greenfield exploration and business development. Includes Resolution and SolGold.
(5) Total Copper statutory result revenue excludes US$1,627 million (FY2020: US$832 million) revenue related to Antamina. Total Copper statutory result Underlying EBITDA includes US$144 million (FY2020: US$165 million) D&A and US$394 million (FY2020: US$141 million) net finance costs and taxation expense related to Antamina, Resolution and SolGold that are also included in Underlying EBIT. Total Copper Capital expenditure excludes US$237 million (FY2020: US$205 million) related to Antamina and US$1 million (FY2020: US$ nil) related to SolGold. Exploration gross excludes US$9 million (FY2020: US$8 million) related to SolGold of which US$5 million (FY2020: US$3 million) was expensed.
(6) Net operating assets has been restated to reflect changes to the Group’s accounting policy following a decision by the IFRS Interpretations Committee on IAS 12 ‘Income Tax’, resulting in the retrospective recognition of US$950 million of Goodwill at Olympic Dam. Note, an offsetting increase in Deferred tax liabilities of US$1,021 million which is not included in Net Operating Assets above. Refer to note 1 ‘Impact of new accounting standards and changes in accounting policies’ of the Financial Information for further information.
BHP Results for the year ended 30 June 2021
33
Iron Ore
Underlying EBITDA for the 2021 financial year increased by US$11.7 billion to US$26.3 billion.
US$M
Underlying EBITDA for the year ended 30 June 2020 14,554
Net price impact:
Change in sales prices 13,236 Higher average realised price:
Iron ore US$130.56/wmt, FOB (2020: US$77.36/wmt, FOB).
Price-linked costs (1,181) Higher royalties in line with higher prices.
Change in volumes 148 Record sales volumes reflected record production at Jimblebar and Mining Area C, and strong operational performance across the supply chain, with continued improvements in car dumper performance and reliability and train cycle times.
Change in controllable cash costs (43) Incremental costs associated with the ramp up of South Flank, higher labour costs relating to increased planned maintenance and rail track stability activities throughout the year and an increase in the rehabilitation provision related to closed sites. This was partially offset by continuous improvement initiatives and favourable inventory movements.
Change in other costs:
Exchange rates (416)
Inflation (60)
One-off items (16) Reflects volume loss related to COVID-19.
Other items 56 Other items include favourable impacts from lower fuel and energy prices of US$80 million, partially offset by other items.
Underlying EBITDA for the year ended 30 June 2021 26,278
WAIO unit costs increased by 17 per cent to US$14.82 per tonne (or US$12.98 per tonne on a C1 basis excluding
third party royalties(3)), due to the impact of a 12 per cent stronger Australian dollar, higher third party royalties,
incremental costs relating to the ramp up of South Flank and higher labour costs relating to increased planned
maintenance. This was partially offset by record volumes following strong performance and continued productivity
improvements across the supply chain. Costs related to the impact from COVID-19 are reported as an exceptional
item and are not included in unit costs. These additional costs were approximately US$0.51 per tonne, bringing WAIO
unit costs to a total of US$15.33 per tonne (or US$13.23 per tonne on a C1 basis excluding third party royalties(2)(3)).
Unit costs in the 2022 financial year are expected to be between US$17.50 and US$18.50 per tonne reflecting updated
guidance exchange rates (based on an exchange rate of AUD/USD 0.78), forecast costs associated with the ramp up
of South Flank and ramp down of Yandi, and elevated third party royalties. This also reflects the inclusion of COVID-
19 costs (treated as an exceptional item in the 2021 financial year). In the medium term, unit costs have been revised
to less than US$16 per tonne predominantly reflecting a number of uncontrollable factors including updated guidance
exchange rates (based on an exchange rate of AUD/USD 0.78), expected higher third party royalties and higher
Cost per tonne (US$)(1)(2) 15.27 14.38 14.82 12.63
Cost per tonne on a C1 basis excluding third party royalties (US$)(2)(3) 13.52 12.46 12.98 11.82
(1) FY21 based on an average exchange rate of AUD/USD 0.75.
(2) FY21 excludes COVID-19 related costs of US$0.51 per tonne (including US$0.25 per tonne relating to operations and US$0.26 per tonne of demurrage) that are reported as exceptional items. An additional US$0.12 per tonne relating to capital projects is also reported as an exceptional item.
(3) Excludes third party royalties of US$2.06 per tonne (FY20: US$1.17 per tonne), net inventory movements US$(1.11) per tonne (FY20: US$(0.61) per tonne), depletion of production stripping US$0.69 per tonne (FY20: US$0.63 per tonne), operational readiness costs relating to South Flank US$0.30 per tonne (FY20: US$0 per tonne), exploration expenses, Marketing purchases, demurrage, exchange rate gains/losses, and other income US$(0.10) per tonne (FY20: US$(0.38) per tonne).
News release
34
Financial information for Iron Ore for the 2021 and 2020 financial years is presented below.
Year ended
30 June 2021
US$M Revenue
Underlying
EBITDA D&A
Underlying
EBIT
Net
operating
assets
Capital
expenditure
Exploration
gross(1)
Exploration
to profit
Western Australia Iron Ore 34,337 26,270 1,959 24,311 21,289 2,186
Samarco(2) − − − − (2,794) −
Other(3) 120 7 25 (18) 168 2
Total Iron Ore from Group production 34,457 26,277 1,984 24,293 18,663 2,188
Third party products(4) 18 1 − 1 − −
Total Iron Ore 34,475 26,278 1,984 24,294 18,663 2,188 100 55
Total Iron Ore statutory result 20,797 14,554 1,630 12,924 18,400 2,328 87 47
(1) Includes US$45 million of capitalised exploration (FY2020: US$40 million).
(2) Samarco is an equity accounted investment and its financial information presented above, with the exception of net operating assets, reflects BHP Billiton Brasil Ltda's share. All financial impacts following the Samarco dam failure have been reported as exceptional items in both reporting periods.
(3) Predominantly comprises divisional activities, towage services, business development and ceased operations.
(4) Includes inter-segment and external sales of contracted gas purchases.
BHP Results for the year ended 30 June 2021
35
Coal
Underlying EBITDA for the 2021 financial year decreased by US$1.3 billion to US$288 million.
US$M
Underlying EBITDA for the year ended 30 June 2020 1,632
Net price impact (655) Lower average realised hard and weak coking coal prices, partially offset by slightly higher thermal coal prices:
Hard Coking Coal US$112.72/t (2020: US$143.65/t);
Weak Coking Coal US$89.62/t (2020: US$92.59/t); and
Thermal Coal US$58.42/t (2020: $57.10/t).
Change in volumes (168) Lower volumes at NSWEC due to significant weather impacts and an increased proportion of washed coal in response to widening price quality differentials, consistent with our strategy to focus on higher quality products. Lower volumes at Queensland Coal as a result of dragline maintenance, higher strip ratios and lower yields at BMC.
Change in controllable cash costs (102) Increased maintenance costs at Queensland Coal (earth moving equipment maintenance and shiploader maintenance at Hay Point port) as well as increased stripping volumes. This was partially offset by cost reduction initiatives at both Queensland Coal and NSWEC.
Change in other costs:
Exchange rates (512)
Inflation (55)
Other items 148 Other items include favourable impacts from lower fuel and energy prices of US$69 million and other items (predominantly higher profit from Cerrejón of US$54 million due to higher average realised prices).
Underlying EBITDA for the year ended 30 June 2021 288
Queensland Coal unit costs increased by 21 per cent to US$82 per tonne due to the impact of a 12 per cent stronger
Australian dollar, higher planned maintenance in the first half of the year, shiploader maintenance at Hay Point, and
lower yields and increased stripping volumes at Poitrel and South Walker Creek. This was partially offset by lower fuel
and energy costs, driven by lower diesel prices, and cost reduction initiatives.
Unit costs in the 2022 financial year are expected to be between US$80 and US$90 per tonne (based on an exchange
rate of AUD/USD 0.78) as a result of expected higher diesel prices. Mine plan optimisation and efficiency uplifts are
forecast to largely offset increased stripping requirements. We remain focused on cost reduction and productivity
initiatives, however given the ongoing uncertainty regarding restrictions on coal imports into China we are unable to
provide medium-term volume and unit cost guidance. We are preserving low-cost incremental growth optionality in our
portfolio and we will continue with our market responsive approach to bringing on new tonnes into the markets.
Cost per tonne (US$)(1)(2) 62.92 65.98 64.41 56.53
(1) FY21 based on an average exchange rate of AUD/USD 0.75.
(2) FY21 excludes COVID-19 related costs of US$0.40 per tonne that are reported as exceptional items.
Financial information for Coal for the 2021 and 2020 financial years is presented below.
Year ended
30 June 2021
US$M Revenue
Underlying
EBITDA D&A
Underlying
EBIT
Net
operating
assets
Capital
expenditure
Exploration
gross
Exploration
to profit
Queensland Coal 4,315 593 735 (142) 7,843 512
New South Wales Energy Coal(1) 927 (87) 144 (231) (289) 50
Colombia(1)(5) 281 74 86 (12) − 21
Other(2) − (122) 14 (136) (42) 18
Total Coal from Group production 5,523 458 979 (521) 7,512 601
Third party products − − − − − −
Total Coal 5,523 458 979 (521) 7,512 601 20 7
Adjustment for equity accounted investments(3)(4)
(369) (170) (114) (56) − (22) − −
Total Coal statutory result 5,154 288 865 (577) 7,512 579 20 7
Year ended
30 June 2020
US$M Revenue Underlying
EBITDA D&A Underlying
EBIT
Net operating
assets Capital
expenditure Exploration
gross Exploration
to profit
Queensland Coal 5,357 1,935 684 1,251 8,168 523
New South Wales Energy Coal(1) 972 (19) 152 (171) 841 73
Colombia(1) 364 69 112 (43) 776 24
Other(2) − (155) 11 (166) (276) 8
Total Coal from Group production 6,693 1,830 959 871 9,509 628
Third party products − − − − − −
Total Coal 6,693 1,830 959 871 9,509 628 22 9
Adjustment for equity accounted investments(3)(4)
(451) (198) (138) (60) − (25) − −
Total Coal statutory result 6,242 1,632 821 811 9,509 603 22 9
(1) Newcastle Coal Infrastructure Group and Cerrejón are equity accounted investments and their financial information presented above with the exception of net operating assets reflects BHP Group’s share.
(2) Predominantly comprises divisional activities and ceased operations.
(3) Total Coal statutory result revenue excludes US$281 million (FY2020: US$364 million) revenue related to Cerrejón. Total Coal statutory result Underlying EBITDA includes US$86 million (FY2020: US$112 million) D&A and US$2 million (FY2020: US$25 million) net finance costs and taxation expense related to Cerrejón, that are also included in Underlying EBIT. Total Coal statutory result Capital expenditure excludes US$21 million (FY2020: US$24 million) related to Cerrejón.
(4) Total Coal statutory result revenue excludes US$88 million (FY2020: US$87 million) revenue related to Newcastle Coal Infrastructure Group. Total Coal statutory result excludes US$82 million (FY2020: US$61 million) Underlying EBITDA, US$28 million (FY2020: US$26 million) D&A and US$54 million (FY2020: US$35 million) Underlying EBIT related to Newcastle Coal Infrastructure Group until future profits exceed accumulated losses. Total Coal Capital expenditure excludes US$1 million (FY2020: US$1 million) related to Newcastle Coal Infrastructure Group.
(5) On 28 June 2021, BHP announced that it had signed a Sale and Purchase Agreement with Glencore to divest its 33.3 per cent interest in Cerrejón. While BHP continued to report its share of profit and loss within the Coal segment and asset tables, the Group’s investment of US$284 million in Cerrejón has subsequently been classified as ‘Assets held for sale’ and therefore excluded from net operating assets.
BHP Results for the year ended 30 June 2021
37
Greenfield minerals exploration
BHP continued to strengthen its portfolio of options in future facing commodities. During the 2021 financial year,
greenfield minerals exploration was undertaken on advancing copper targets in Chile, Ecuador, Mexico, Peru, Canada,
Australia and the south-west United States, and nickel targets in Canada and Australia.
Specifically in copper, we are undertaking target drilling in Chile, Ecuador, Peru and the United States, while further
drilling is planned in the coming year in Australia and Mexico. BHP exercised its option to sign a farm-in agreement
with Encounter Resources for the early-stage Elliott copper project in Australia (May 2021). At Oak Dam in South
Australia, next stage resource definition drilling to inform future design commenced in May 2021.
Our nickel optionality has grown substantively over the last 18 months, and drilling is currently underway on our
extensive “Seahorse” land package on southern Western Australia. Elsewhere, we signed an agreement for a nickel
exploration alliance with Midland Exploration in Canada (August 2020) and we completed the acquisition of the nickel
Honeymoon Well tenements and a 50 per cent interest in the Albion Downs North and Jericho exploration joint ventures
(September 2020).
In addition, on 27 July 2021, we entered into a definitive Support Agreement with Noront Resources (Noront) to make
an all-cash takeover offer for Noront. The Noront Board of Directors has unanimously recommended the offer to Noront
shareholders. Noront owns an extensive land package that includes the Eagle’s Nest nickel and copper deposit in the
James Bay Lowlands, Ontario, in an emerging metals area known as the Ring of Fire.
Our Metals Exploration and Petroleum Exploration teams are collaborating on a global machine learning initiative that
we anticipate will further create new insights on high-potential search spaces. This partnership is unlocking previously
unrealised synergies that will further allow BHP to define options in future facing commodities.
Group and unallocated items
Underlying EBITDA for Group and unallocated items increased by US$693 million to US$24 million in the 2021 financial
year due to an increase in EBITDA at Nickel West, higher freight rates for consecutive voyage charter (CVC) voyages
on-charged to the businesses, lower technology costs reflecting changes to the technology organisational model in
the prior year and a decrease in costs related to the closure and rehabilitation provision for closed mines compared
with the prior year.
Nickel West’s Underlying EBITDA increased from a loss of US$(37) million to US$259 million for the 2021 financial
year, reflecting higher prices and volumes, and lower maintenance costs following the major quadrennial shutdowns
in the prior year, as well as lower contractor costs following the transition and ramp up of new mines. This was partially
offset by unfavourable exchange rate movements and the adverse impacts of the stronger nickel price on third party
concentrate purchase costs.
Commissioning of the Nickel Sulphate plant is now underway, with first production expected in the September 2021
quarter.
News release
38
The Financial Information set out on pages 41 to 61 for the year ended 30 June 2021 has been prepared on the basis of accounting policies and methods of computation consistent with those applied in the 30 June 2020 financial statements contained within the Annual Report of the Group, with the exception of new accounting standards and interpretations which became effective from 1 July 2020 and other changes in accounting policies applied with effect from 1 July 2020. This news release including the Financial Information is unaudited. Analysis relates to the relative financial and/or production performance of BHP and/or its operations during the 2021 financial year compared with the 2020 financial year, unless otherwise noted. Operations includes operated and non-operated assets, unless otherwise noted. Medium term refers to our five year plan. Numbers presented may not add up precisely to the totals provided due to rounding.
The following abbreviations may have been used throughout this report: barrels (bbl); billion cubic feet (bcf); barrels of oil equivalent (boe); billion tonnes (Bt); cost and freight (CFR); cost, insurance and freight (CIF), carbon dioxide equivalent (CO2-e), dry metric tonne unit (dmtu); free on board (FOB); giga litres (GL); grams per tonne (g/t); kilograms per tonne (kg/t); kilometre (km); metre (m); million barrels of oil equivalent (MMboe); million barrels of oil equivalent per day (MMboe/d); thousand cubic feet equivalent (Mcfe); million cubic feet per day (MMcf/d); million ounces per annum (Mozpa); million pounds (Mlb); million tonnes (Mt); million tonnes per annum (Mtpa); ounces (oz); pounds (lb); thousand barrels of oil equivalent (Mboe); thousand ounces (koz); thousand ounces per annum (kozpa); thousand standard cubic feet (Mscf); thousand tonnes (kt); thousand tonnes per annum (ktpa); thousand tonnes per day (ktpd); tonnes (t); total recordable injury frequency (TRIF); and wet metric tonnes (wmt).
The following footnotes apply to this Results Announcement:
(i) We use various key indicators to reflect our sustainability performance. For further information on the reasons for usefulness and calculation methodology, please refer to “Definition and calculation of Key Indicator terms” set out on pages 73 to 77.
(ii) We use various alternative performance measures to reflect our underlying performance. For further information on the reconciliations of certain alternative performance measures to our statutory measures, reasons for usefulness and calculation methodology, please refer to alternative performance measures set out on pages 62 to 72.
(iii) On a continuing operations basis.
(iv) The Jansen S1 project will convert approximately 20 per cent of the total 5.23 billion tonnes Measured and Indicated Mineral Resources into Ore Reserves (see separate announcement dated 17 August 2021).
(v) Price assumptions reflect average of CRU and Argus prices. Average 2027–2037: US$341/t CRU and US$292/t Argus. IRR = Expected Jansen S1 IRR (across approximately 100 year mine life). Jansen S1 IRR is post tax, nominal and reflects the range of the average CRU and Argus prices and excludes expenditure on shafts and essential services consistent with previous disclosure.
(vi) Per million hours worked, compared to the 2020 financial year.
(vii) Our 1.5°C scenario, described with its assumptions and outputs in our Climate Change Report 2020 (available at bhp.com), is an attractive scenario for us, our shareholders and the global community. However, despite recent progress, all 1.5°C pathways represent a major departure from today’s global trajectory.
(viii) ‘Freshwater’ is defined as waters other than seawater, wastewater from third parties and hypersaline ground water. Freshwater withdrawal also excludes entrained water that would not be available for other uses. These exclusions have been made to align with the target’s intent to reduce the use of freshwater sources of potential value other users or the environment.
(ix) Source: worldsteel.org; BHP analysis
(x) Amounts spent are converted to USD based on actual transactional (historical) exchange rates related to Renova Foundation funding. Amounts yet to be spent are converted to USD based on 30 June 2021 exchange rates.
(xi) This includes more than 17,000 claims settled under the court-mandated “Novel payment” system that was established in August 2020. The system now covers 30 impacted territories (up from 14 territories). More than 10,500 general damages claims have been resolved, in addition to approximately 270,000 claims for temporary interruption to water supplies immediately following the dam failure. The Renova Foundation has continued to assist more than 10,500 families with ongoing financial support.
(xii) Resettlement remains a priority social program for the Renova Foundation and involves ongoing engagement and consultation with many stakeholders. Resettlement works in the municipality of Mariana are continuing with COVID-19 protocols in place. At Bento Rodrigues, civil works and the healthcare facility are complete, while the public school construction is complete and construction of housing is progressing (with 79 houses either complete or under construction). At Paracatu, infrastructure works and the construction of some public buildings and the first houses are underway. At Gesteira, the Renova Foundation is progressing alternatives to urban resettlement, with an option for individual resettlement in which families from the original small community would be able to purchase individual properties.
(xiii) Maintenance capital includes non-discretionary spend for the following purposes: deferred development and production stripping; risk reduction, compliance and asset integrity.
(xiv) The US$2.97 billion current scope of work for Jansen is part of approximately US$4.5 billion that has been invested on the project since 2008 ahead of the sanction decision on Jansen S1. Approximately US$220 million of the US$2.97 billion approved for the current scope of work, expected to be completed in the 2022 calendar year, is not yet spent. Sustaining capital for Jansen S1 is expected to be approximately US$15/t (real) long term average +/- 20 per cent in any given year.
(xv) BHP’s respective interests in BMC.
(xvi) In the case of BHP Group Limited, the allocation price will also be released via the ASX using Appendix 3A.1 in accordance with ASX requirements.
This release contains forward-looking statements, including statements regarding: trends in commodity prices and currency exchange rates; demand for commodities; production forecasts; operational performance; plans, strategies and objectives of management; closure or divestment of certain assets, operations or facilities (including associated costs); anticipated production or construction commencement dates; capital costs and scheduling; operating costs and shortages of materials and skilled employees; anticipated productive lives of projects, mines and facilities; provisions and contingent liabilities; and tax and regulatory developments.
Forward-looking statements may be identified by the use of terminology, including, but not limited to, ‘guidance’, ‘intend’, ‘aim’, ‘project’, ‘anticipate’, ‘estimate’, ‘plan’, ‘believe’, ‘expect’, ‘may’, ‘should’, ‘will’, ‘would’, ‘continue’, ‘annualised’ or similar words. These statements discuss future expectations concerning the results of assets or financial conditions, or provide other forward-looking information.
BHP Results for the year ended 30 June 2021
39
These forward-looking statements are based on the information available as at the date of this release and/or the date of the Group’s planning processes or scenario analysis processes. There are inherent limitations with scenario analysis and it is difficult to predict which, if any, of the scenarios might eventuate. Scenarios do not constitute definitive outcomes for us. Scenario analysis relies on assumptions that may or may not be, or prove to be, correct and may or may not eventuate, and scenarios may be impacted by additional factors to the assumptions disclosed. Additionally, forward looking statements in this release are not guarantees or predictions of future performance, and involve known and unknown risks, uncertainties and other factors, many of which are beyond our control, and which may cause actual results to differ materially from those expressed in the statements contained in this release. BHP cautions against reliance on any forward-looking statements or guidance, particularly in light of the current economic climate and the significant volatility, uncertainty and disruption arising in connection with COVID-19.
For example, our future revenues from our assets, projects or mines described in this release will be based, in part, upon the market price of the minerals, metals or petroleum produced, which may vary significantly from current levels. These variations, if materially adverse, may affect the timing or the feasibility of the development of a particular project, the expansion of certain facilities or mines, or the continuation of existing assets.
Other factors that may affect the actual construction or production commencement dates, costs or production output and anticipated lives of assets, mines or facilities include our ability to profitably produce and transport the minerals, petroleum and/or metals extracted to applicable markets; the impact of foreign currency exchange rates on the market prices of the minerals, petroleum or metals we produce; activities of government authorities in the countries where we sell our products and in the countries where we are exploring or developing projects, facilities or mines, including increases in taxes; changes in environmental and other regulations, the duration and severity of the COVID-19 pandemic and its impact on our business; political uncertainty; labour unrest; and other factors identified in the risk factors discussed in BHP’s filings with the U.S. Securities and Exchange Commission (the ‘SEC’) (including in Annual Reports on Form 20-F) which are available on the SEC’s website at www.sec.gov.
Except as required by applicable regulations or by law, BHP does not undertake to publicly update or review any forward-looking statements, whether as a result of new information or future events.
Past performance cannot be relied on as a guide to future performance.
No offer of securities
Nothing in this release should be construed as either an offer, or a solicitation of an offer, to buy or sell any securities, or a solicitation of any vote or approval, in any jurisdiction, or be treated or relied upon as a recommendation or advice by BHP. No offer of securities shall be made in the United States absent registration under the U.S. Securities Act of 1933, as amended, or pursuant to an exemption from, or in a transaction not subject to, such registration requirements.
Reliance on third party information
The views expressed in this release contain information that has been derived from publicly available sources that have not been independently verified. No representation or warranty is made as to the accuracy, completeness or reliability of the information. This release should not be relied upon as a recommendation or forecast by BHP.
No financial or investment advice – South Africa
BHP does not provide any financial or investment 'advice' as that term is defined in the South African Financial Advisory and Intermediary Services Act, 37 of 2002, and we strongly recommend that you seek professional advice.
BHP and its subsidiaries
In this release, the terms ‘BHP’, the ‘Company, the ‘Group’, ‘BHP Group’, ‘our business’, ‘organisation’, ‘we’, ‘us’, ‘our’ and ourselves’ refer to BHP Group Limited, BHP Group plc and, except where the context otherwise requires, their respective subsidiaries as defined in note 29 ‘Subsidiaries’ in section 5.1 of BHP’s 30 June 2020 Annual Report and Form 20-F. Those terms do not include non-operated assets.
This release covers BHP’s assets (including those under exploration, projects in development or execution phases, sites and closed operations) that have been wholly owned and/or operated by BHP and that have been owned as a joint venture(1) operated by BHP (referred to in this release as ‘operated assets’ or ‘operations’) during the period from 1 July 2020 to 30 June 2021. Our functions are also included.
BHP also holds interests in assets that are owned as a joint venture but not operated by BHP (referred to in this release as ‘non-operated joint ventures’ or ‘non-operated assets’). Our non-operated assets include Antamina, Cerrejón, Samarco, Atlantis, Mad Dog, Bass Strait and North West Shelf. Notwithstanding that this release may include production, financial and other information from non-operated assets, non-operated assets are not included in the BHP Group and, as a result, statements regarding our operations, assets and values apply only to our operated assets unless stated otherwise.
(1) References in this release to a ‘joint venture’ are used for convenience to collectively describe assets that are not wholly owned by BHP. Such references are not intended to characterise the legal relationship between the owners of the asset.
News release
40
Further information on BHP can be found at bhp.com
Discounting on provisions and other liabilities 467 452 470
Other gains and losses:
Fair value change on hedged loans (779) 721 729
Fair value change on hedging derivatives 704 (788) (809)
Loss on bond repurchase(2) 395 − −
Exchange variations on net debt 99 (18) 6
Other 21 14 19
Total financial expenses 1,378 1,262 1,510
Financial income
Interest income (73) (351) (446)
Net finance costs 1,305 911 1,064
(1) Interest has been capitalised at the rate of interest applicable to the specific borrowings financing the assets under construction or, where financed through general borrowings, at a capitalisation rate representing the average interest rate on such borrowings. Tax relief for capitalised interest is approximately US$74 million (2020: US$92 million; 2019: US$74 million).
(2) Relates to the additional cost on settlement of two multi-currency hybrid debt repurchase programs and the unwind of the associated hedges, included in a total cash payment of US$3,402 million disclosed in repayment of interest bearing liabilities in the Consolidated Cash Flow Statement.
5. Income tax expense
Year ended
30 June 2021
US$M
Year ended
30 June 2020
US$M
Year ended
30 June 2019
US$M
Total taxation expense comprises:
Current tax expense 9,825 5,109 5,408
Deferred tax expense/(benefit) 1,325 (335) 121
11,150 4,774 5,529
Year ended
30 June 2021
US$M
Year ended
30 June 2020
US$M
Year ended
30 June 2019
US$M
Factors affecting income tax expense for the year Income tax expense differs to the standard rate of corporation tax as follows:
Profit before taxation 24,601 13,510 15,049
Tax on profit at Australian prima facie tax rate of 30 per cent 7,380 4,053 4,515
Non-tax effected operating losses and capital gains(1) 3,112 707 742
Tax on remitted and unremitted foreign earnings 485 225 283
Tax effect of loss from equity accounted investments, related impairments and expenses(2) 317 154 164
Investment and development allowance − (99) (94)
Tax rate changes (1) (8) 6
Amounts (over)/under provided in prior years (11) 64 (21)
Recognition of previously unrecognised tax assets (28) (30) (10)
Foreign exchange adjustments (95) 20 (25)
Impact of tax rates applicable outside of Australia (603) (167) (312)
Other 365 (211) 87
Income tax expense 10,921 4,708 5,335
Royalty-related taxation (net of income tax benefit) 229 66 194
Total taxation expense 11,150 4,774 5,529
(1) Includes the tax impacts related to the exceptional impairments of NSWEC and Potash in the year ended 30 June 2021 and Cerro Colorado in the year ended 30 June 2020, as presented in note 2 ‘exceptional items’. There were no exceptional impairments in the year ended 30 June 2019.
(2) The loss from equity accounted investments, related impairments and expenses is net of income tax, with the exception of the Samarco forward exchange derivatives described in note 8 ‘Significant events – Samarco dam failure’. This item removes the prima facie tax effect on such loss, related impairments and expenses, excluding the impact of the Samarco forward exchange derivatives which are taxable.
BHP Results for the year ended 30 June 2021
51
6. Earnings per share
Year ended
30 June 2021
Year ended
30 June 2020
Year ended
30 June 2019
Earnings attributable to BHP shareholders (US$M)(1)
- Continuing operations 11,304 7,956 8,648
- Total 11,304 7,956 8,306
Weighted average number of shares (Million)
- Basic(2) 5,057 5,057 5,180
- Diluted(3) 5,068 5,069 5,193
Basic earnings per ordinary share (US cents)(4)
- Continuing operations 223.5 157.3 166.9
- Total 223.5 157.3 160.3
Diluted earnings per ordinary share (US cents)(4)
- Continuing operations 223.0 157.0 166.5
- Total 223.0 157.0 159.9
Headline earnings per ordinary share (US cents)(5)
- Basic 284.8 171.1 164.9
- Diluted 284.2 170.7 164.5
(1) Diluted earnings attributable to BHP shareholders are equal to earnings attributable to BHP shareholders.
(2) The calculation of the number of ordinary shares used in the computation of basic earnings per share is the aggregate of the weighted average number of ordinary shares of BHP Group Limited and BHP Group Plc outstanding during the period after deduction of the number of shares held by the Billiton Employee Share Ownership Trust and the BHP Billiton Limited Employee Equity Trust.
(3) For the purposes of calculating diluted earnings per share, the effect of 11 million of dilutive shares has been taken into account for the year ended 30 June 2021 (2020: 12 million shares; 2019: 13 million shares). The Group’s only potential dilutive ordinary shares are share awards granted under employee share ownership plans. Diluted earnings per share calculation excludes instruments which are considered antidilutive.
At 30 June 2021, there are no instruments which are considered antidilutive (2020: nil, 2019: nil).
(4) Each American Depositary Share represents twice the earnings for BHP ordinary shares.
(5) Headline earnings is a Johannesburg Stock Exchange defined performance measure and is reconciled from earnings attributable to ordinary shareholders as follows:
Year ended
30 June 2021 Year ended
30 June 2020 Year ended
30 June 2019
Earnings attributable to BHP shareholders 11,304 7,956 8,306
Adjusted for:
(Gain)/loss on sales of PP&E, Investments and Operations(i) (50) 4 (52)
Impairments of property, plant and equipment, financial assets and intangibles 2,633 494 264
Samarco impairment expense 111 95 96
Cerrejόn impairment expense 466 − −
Other(ii) − 48 −
Recycling of re-measurements from equity to the income statement − − (6)
Tax effect of above adjustments (60) 54 (64)
Subtotal of adjustments 3,100 695 238
Headline earnings 14,404 8,651 8,544
Diluted headline earnings 14,404 8,651 8,544
(i) Included in other income.
(ii) Mainly represent BHP share of impairment embedded in the statutory income statement of the Group’s equity accounted investments.
Financial Information
52
7. Dividends
Year ended
30 June 2021
Year ended
30 June 2020
Year ended
30 June 2019
Per share
US cents
Total
US$M
Per share
US cents
Total
US$M
Per share
US cents
Total
US$M
Dividends paid during the period(1)
Prior year final dividend 55.0 2,779 78.0 3,946 63.0 3,356
(1) 5.5 per cent dividend on 50,000 preference shares of £1 each determined and paid annually (2020: 5.5 per cent; 2019: 5.5 per cent).
Dividends paid during the period differs from the amount of dividends paid in the Consolidated Cash Flow Statement
as a result of foreign exchange gains and losses relating to the timing of equity distributions between the record date
and the payment date. Additional derivative proceeds of US$8 million was received as part of the funding of the interim
dividend and is disclosed in (Settlements)/proceeds of cash management related instruments in the Consolidated
Cash Flow Statement.
The Dual Listed Company merger terms require that ordinary shareholders of BHP Group Limited and BHP Group Plc
are paid equal cash dividends on a per share basis. Each American Depositary Share (ADS) represents two ordinary
shares of BHP Group Limited or BHP Group Plc. Dividends determined on each ADS represent twice the dividend
determined on BHP ordinary shares.
Dividends are determined after period-end and contained within the announcement of the results for the period. Interim
dividends are determined in February and paid in March. Final dividends are determined in August and paid in
September. Dividends determined are not recorded as a liability at the end of the period to which they relate.
Subsequent to the year end, on 17 August 2021, BHP Group Limited and BHP Group Plc determined a final dividend
of 200 US cents per share (US$ 10,114 million), which will be paid on 21 September 2021 (2020: final dividend of 55
US cents per share – US$2,782 million; 2019: final dividend of 78 US cents per share – US$3,944 million).
At 30 June 2021, BHP Group Limited had 2,945 million ordinary shares on issue and held by the public and BHP
Group Plc had 2,112 million ordinary shares on issue and held by the public. No shares in BHP Group Limited were
held by BHP Group Plc at 30 June 2021 (2020: nil; 2019: nil).
BHP Group Limited dividends for all periods presented are, or will be, fully franked based on a tax rate of 30 per cent.
2021
US$M
2020
US$M
2019
US$M
Franking credits as at 30 June 14,302 10,980 8,681
Franking credits arising from the payment of current tax 1,799 471 1,194
Total franking credits available(1) 16,101 11,451 9,875
(1) The payment of the final 2021 dividend determined after 30 June 2021 will reduce the franking account balance by US$2,525 million.
BHP Results for the year ended 30 June 2021
53
8. Significant events – Samarco dam failure
On 5 November 2015, the Samarco Mineração S.A. (Samarco) iron ore operation in Minas Gerais, Brazil, experienced
a tailings dam failure that resulted in a release of mine tailings, flooding the communities of Bento Rodrigues, Gesteira
and Paracatu and impacting other communities downstream (the Samarco dam failure).
Samarco is jointly owned by BHP Billiton Brasil Ltda (BHP Brasil) and Vale S.A. (Vale). BHP Brasil’s 50 per cent
interest is accounted for as an equity accounted joint venture investment. BHP Brasil does not separately recognise
its share of the underlying assets and liabilities of Samarco, but instead records the investment as one line on the
balance sheet. Each period, BHP Brasil recognises its 50 per cent share of Samarco’s profit or loss and adjusts the
carrying value of the investment in Samarco accordingly. Such adjustment continues until the investment carrying
value is reduced to US$ nil, with any additional share of Samarco losses only recognised to the extent that BHP Brasil
has an obligation to fund the losses. After applying equity accounting, any remaining carrying value of the investment
is tested for impairment.
Any charges relating to the Samarco dam failure incurred directly by BHP Brasil or other BHP entities are recognised
100 per cent in the Group’s results.
The financial impacts of the Samarco dam failure on the Group’s income statement, balance sheet and cash flow
statement for the year ended 30 June 2021 are shown in the table below and have been treated as an exceptional
item.
Financial impacts of Samarco dam failure
Year ended
30 June 2021
US$M
Year ended
30 June 2020
US$M
Year ended
30 June 2019
US$M
Income statement
Other income(1) 34 489 50
Expenses excluding net finance costs:
Costs incurred directly by BHP Brasil and other BHP entities in relation to the Samarco dam failure(2) (46) (64) (57)
Loss from equity accounted investments, related impairments and expenses:
Samarco impairment expense(3) (111) (95) (96)
Samarco Germano dam decommissioning(4) (15) 46 (263)
Samarco dam failure provision(5) (1,000) (459) (586)
Fair value change on forward exchange derivatives(6) 136 − −
Loss from operations (1,002) (83) (952)
Net finance costs(7) (85) (93) (108)
Loss before taxation (1,087) (176) (1,060)
Income tax expense(8) (71) − −
Loss after taxation (1,158) (176) (1,060)
Balance sheet movement
Trade and other payables (5) (5) 4
Derivatives 136 − −
Tax liabilities (71) − −
Provisions (741) (137) (629)
Net liabilities (681) (142) (625)
Financial Information
54
8. Significant events – Samarco dam failure (continued)
Year ended
30 June 2021
US$M
Year ended
30 June 2020
US$M
Year ended
30 June 2019
US$M
Cash flow statement
Loss before taxation (1,087) (176) (1,060)
Adjustments for:
Samarco impairment expense(3) 111 95 96
Samarco Germano dam decommissioning(4) 15 (46) 263
Samarco dam failure provision(5) 1,000 459 586
Fair value change on forward exchange derivatives(6) (136) − −
Net finance costs(7) 85 93 108
Changes in assets and liabilities:
Trade and other payables 5 5 (4)
Net operating cash flows (7) 430 (11)
Net investment and funding of equity accounted investments(9) (470) (464) (424)
Net investing cash flows (470) (464) (424)
Net decrease in cash and cash equivalents (477) (34) (435)
(1) Proceeds from insurance settlements.
(2) Includes legal and advisor costs incurred.
(3) Impairment expense from working capital funding provided during the period.
(4) US$(6) million change in estimate and US$21 million exchange translation.
(5) US$842 million change in estimate and US$158 million exchange translation.
(6) During the period the Group entered into forward exchange contracts to limit the Brazilian reais exposure on the dam failure provisions. While not applying hedge accounting, the fair value changes in the forward exchange instruments are recorded within Loss from equity accounted investments, related impairments and expenses in the Income Statement.
(7) Amortisation of discounting of provision.
(8) Includes tax on forward exchange derivatives and other taxes incurred during the period.
(9) Includes US$(111) million funding provided during the period, US$(351) million utilisation of the Samarco dam failure provision, and US$(8) million utilisation of the Samarco Germano decommissioning provision.
Equity accounted investment in Samarco
BHP Brasil’s investment in Samarco remains at US$ nil. BHP Brasil provided US$111 million funding under a working
capital facility during the period and recognised impairment losses of US$111 million. No dividends have been received
by BHP Brasil from Samarco during the period and Samarco currently does not have profits available for distribution.
Provisions related to the Samarco dam failure
30 June 2021
US$M
30 June 2020
US$M
At the beginning of the financial year 2,051 1,914
Movement in provisions 741 137
Comprising:
Utilised (359) (369)
Adjustments charged to the income statement:
Change in estimate - Samarco dam failure provision 842 916
Change in estimate - Samarco Germano dam decommissioning (6) 37
Amortisation of discounting impacting net finance costs 85 93
Exchange translation 179 (540)
At the end of the financial year 2,792 2,051
Comprising:
Current 1,206 896
Non-current 1,586 1,155
At the end of the financial year 2,792 2,051
Comprising:
Samarco dam failure provision 2,560 1,824
Samarco Germano dam decommissioning provision 232 227
Samarco dam failure provisions and contingencies
As at 30 June 2021, BHP Brasil has identified provisions and contingent liabilities arising as a consequence of the
Samarco dam failure as follows:
BHP Results for the year ended 30 June 2021
55
8. Significant events – Samarco dam failure (continued)
Provision for Samarco dam failure
On 2 March 2016, BHP Brasil, Samarco and Vale, entered into a Framework Agreement with the Federal Government
of Brazil, the states of Espírito Santo and Minas Gerais and certain other public authorities to establish a foundation
(Fundação Renova) that is developing and executing environmental and socio-economic programs (Programs) to
remediate and provide compensation for damage caused by the Samarco dam failure. Key Programs include those
for financial assistance and compensation of impacted persons, including fisherfolk impacted by the dam failure, and
those for remediation of impacted areas and resettlement of impacted communities. A committee (Interfederative
Committee) comprising representatives from the Brazilian Federal and State Governments, local municipalities,
environmental agencies, impacted communities and Public Defence Office oversees the activities of the Fundação
Renova in order to monitor, guide and assess the progress of actions agreed in the Framework Agreement. In addition,
the 12th Federal Court is supervising the work of the Fundação Renova and the Court’s decisions have been
considered in the Samarco dam failure provision change in estimate. Any future decisions will be analysed for impacts
on the provision at the time of any decision.
The term of the Framework Agreement is 15 years, renewable for periods of one year successively until all obligations
under the Framework Agreement have been performed. Under the Framework Agreement, Samarco has primary
responsibility for funding Fundação Renova’s annual calendar year budget for the duration of the Framework
Agreement. The funding amounts for each calendar year will be dependent on the remediation and compensation
projects to be undertaken in a particular year. Annual contributions may be reviewed under the Framework Agreement.
To the extent that Samarco does not meet its funding obligations, each of BHP Brasil and Vale have secondary funding
obligations under the Framework Agreement in proportion to its 50 per cent shareholding in Samarco.
Samarco began to gradually recommence operations in December 2020, however, there remains significant
uncertainty regarding Samarco’s long term cash flow generation. In light of these uncertainties and based on currently
available information, BHP Brasil’s provision for its obligations under the Framework Agreement Programs is US$2.6
billion before tax and after discounting at 30 June 2021 (30 June 2020: US$1.8 billion).
Under a Governance Agreement ratified on 8 August 2018, BHP Brasil, Samarco and Vale were to establish a process
to renegotiate the Programs over two years to progress settlement of the R$155 billion (approximately US$30 billion)
Federal Public Prosecution Office claim (described below). Pre-requisites established in the Governance Agreement,
for re-negotiation of the Framework Agreement were not implemented during the two year period and on 30 September
2020, Brazilian Federal and State prosecutors and public defenders filed a request for the immediate resumption of
the R$155 billion (approximately US$30 billion) claim, which has been suspended from the date of ratification of the
Governance Agreement. The claim remains suspended after the parties to the claim agreed to continue the suspension
on 19 March 2021. BHP Brasil, Samarco, Vale and Federal and State prosecutors have been engaging in negotiations
to seek a definitive and substantive settlement of the obligations under the Framework Agreement and the R$155
billion (approximately US$30 billion) Federal Public Prosecution Office claim. It is not possible to provide a range of
outcomes or a reliable estimate of potential settlement outcomes and there is a risk that a negotiated outcome may be
materially higher than amounts currently reflected in the Samarco dam failure provision. Until any revisions to the
Programs are agreed, Fundação Renova will continue to implement the Programs in accordance with the terms of the
Framework Agreement and the Governance Agreement.
BHP Brasil, Samarco and Vale are required to maintain security of an amount equal to the Fundação Renova’s annual
budget up to a limit of R$2.2 billion (approximately US$440 million). The security currently comprises R$1.3 billion
(approximately US$260 million) in insurance bonds and a charge of R$800 million (approximately US$160 million)
over Samarco’s assets. A further R$100 million (approximately US$20 million) in liquid assets previously maintained
as security was released for COVID-19 related response efforts in Brazil.
Samarco Germano dam decommissioning
Samarco is currently progressing plans for the accelerated decommissioning of its upstream tailings dams (the
Germano dam complex). Given the significant uncertainties surrounding Samarco’s long term cash flow generation,
BHP Brasil’s provision for a 50 per cent share of the expected Germano decommissioning costs is US$232 million (30
June 2020: US$227 million). The decommissioning is at an early stage and as a result, further engineering work and
required validation by Brazilian authorities could lead to changes to estimates in future reporting periods.
Financial Information
56
8. Significant events – Samarco dam failure (continued)
Key judgements and estimates
Judgements
The outcomes of litigation are inherently difficult to predict and significant judgement has been applied in assessing
the likely outcome of legal claims and determining which legal claims require recognition of a provision or disclosure
of a contingent liability. The facts and circumstances relating to these cases are regularly evaluated in determining
whether a provision for any specific claim is required.
Management has determined that a provision can only be recognised for obligations under the Framework
Agreement and Samarco Germano dam decommissioning as at 30 June 2021. It is not yet possible to provide a
range of possible outcomes or a reliable estimate of potential future exposures to BHP in connection to the
contingent liabilities noted below, given their status.
Estimates
The provisions for Samarco dam failure and Samarco Germano dam decommissioning currently reflect the
estimated remaining costs to complete Programs under the Framework Agreement and estimated costs to complete
the Germano dam decommissioning and require the use of significant judgements, estimates and assumptions.
Based on current estimates, it is expected that approximately 85 per cent of remaining costs for Programs under
the Framework Agreement will be incurred by December 2023.
While the provisions have been measured based on latest information available, likely changes in facts and
circumstances in future reporting periods may lead to material revisions to these estimates. However, it is currently
not possible to determine what facts and circumstances may change, therefore revisions in future reporting periods
due to the key estimates and factors outlined below cannot be reliably measured.
The key estimates that may have a material impact upon the provisions in the next and future reporting periods
include:
number of people eligible for financial assistance and compensation and the corresponding amount of
expected compensation; and
costs to complete key infrastructure programs, including resettlement of the Bento Rodrigues, Gesteira and
Paracatu communities.
The provisions may also be affected by factors including but not limited to:
resolution of existing and potential legal claims in Brazil and other jurisdictions, including the impact of
ongoing settlement negotiations and outcome of the United Kingdom group action complaint;
potential changes in scope of work and funding amounts required under the Framework Agreement including
the impact of the decisions of the Interfederative Committee along with further technical analysis, community
participation required under the Governance Agreement and rulings made by the 12th Federal Court;
the outcome of ongoing negotiations with State and Federal Prosecutors, including review of Fundação
Renova’s Programs as provided in the Governance Agreement;
actual costs incurred;
resolution of uncertainty in respect of the nature and extent of Samarco’s long term cash generation;
costs to complete the Germano dam decommissioning;
updates to discount and foreign exchange rates; and
the outcomes of Samarco’s judicial restructuring (defined below).
Given these factors, future actual expenditures may differ from the amounts currently provided and changes to key
assumptions and estimates could result in a material impact to the provision in the next and future reporting periods.
BHP Results for the year ended 30 June 2021
57
8. Significant events – Samarco dam failure (continued)
Contingent liabilities
The following matters are disclosed as contingent liabilities and given the status of proceedings it is not possible to
provide a range of possible outcomes or a reliable estimate of potential future exposures for BHP, unless otherwise
stated. Ultimately, all the legal matters disclosed as contingent liabilities could have a material adverse impact on
BHP Brasil is among the defendants named in a claim brought by the Federal Public Prosecution Office on 3 May
2016, seeking R$155 billion (approximately US$30 billion) for reparation, compensation and moral damages in relation
to the Samarco dam failure.
The 12th Federal Court previously suspended the Federal Public Prosecution Office claim, including a R$7.7 billion
(approximately US$1.5 billion) injunction request. On 30 September 2020, Brazilian Federal and State prosecutors
and public defenders filed a request for the immediate resumption of the R$155 billion (approximately US$30 billion)
claim, which has been suspended since the date of ratification of the Governance Agreement. The claim remains
suspended after the parties to the claim agreed to continue the suspension on 19 March 2021.
BHP Brasil, Samarco, Vale and Federal and State prosecutors have been engaging in negotiations to seek a definitive
and substantive settlement of the obligations under the Framework Agreement and the R$155 billion (approximately
US$30 billion) Federal Public Prosecution Office claim. It is not possible to provide a range of outcomes or a reliable
estimate of potential settlement outcomes and there is a risk that a negotiated outcome may be materially higher than
amounts currently reflected in the Samarco dam failure provision.
United States class action complaint – Samarco bond holders
On 14 November 2016, a putative class action complaint (Bondholder Complaint) was filed in the U.S. District Court
for the Southern District of New York on behalf of purchasers of Samarco’s ten-year bond notes due 2022-2024
between 31 October 2012 and 30 November 2015. The Bondholder Complaint was initially filed against Samarco and
the former chief executive officer of Samarco.
The Bondholder Complaint was subsequently amended to include BHP Group Ltd, BHP Group Plc, BHP Brasil, Vale
and officers of Samarco, including four of Vale and BHP Brasil’s nominees to the Samarco Board. On 5 April 2017,
the plaintiff discontinued its claims against the individual defendants.
The complaint, along with a second amended complaint, had previously been dismissed by the court. The plaintiff filed
a motion for reconsideration, or leave to file a third amended complaint, which was denied by the court on 30 October
2019. The plaintiff appealed this decision, which was affirmed by the court of appeals in March 2021.
Australian class action complaint
BHP Group Ltd is named as a defendant in a shareholder class action filed in the Federal Court of Australia on behalf
of persons who acquired shares in BHP Group Ltd on the Australian Securities Exchange or shares in BHP Group Plc
on the London Stock Exchange and Johannesburg Stock Exchange in periods prior to the Samarco dam failure. The
amount of damages sought is unspecified.
United Kingdom group action complaint
BHP Group Plc and BHP Group Ltd were named as defendants in group action claims for damages filed in the courts
of England. These claims were filed on behalf of certain individuals, governments, businesses and communities in
Brazil allegedly impacted by the Samarco dam failure. The amount of damages sought in these claims is unspecified.
The complaint and a subsequent application for permission to appeal have been dismissed by the court, however an
application by the claimants to reopen the proceedings was granted in July 2021, allowing the claimants to appeal
previous dismissals of the claim.
Financial Information
58
8. Significant events – Samarco dam failure (continued)
Criminal charges
The Federal Prosecutors’ Office has filed criminal charges against BHP Brasil, Samarco and Vale and certain
employees and former employees of BHP Brasil (Affected Individuals) in the Federal Court of Ponte Nova, Minas
Gerais. On 3 March 2017, BHP Brasil filed its preliminary defences. The Federal Court terminated the charges against
eight of the Affected Individuals. The Federal Prosecutors’ Office has appealed seven of those decisions with hearings
of the appeals still pending. BHP Brasil rejects outright the charges against the company and the Affected Individuals
and will defend the charges and fully support each of the Affected Individuals in their defence of the charges.
Other claims
Civil public actions filed by State Prosecutors in Minas Gerais (claiming damages of approximately R$7.5 billion,
US$1.5 billion), State Prosecutors in Espírito Santo (claiming damages of approximately R$2 billion, US$400 million),
and public defenders in Minas Gerais (claiming damages of approximately R$10 billion, US$2 billion), have been
consolidated before the 12th Federal Court and suspended. The Governance Agreement provides for a process to
review whether these civil public claims should be terminated or suspended.
BHP Brasil is among the companies named as defendants in a number of legal proceedings initiated by individuals,
non-governmental organisations, corporations and governmental entities in Brazilian Federal and State courts
following the Samarco dam failure. The other defendants include Vale, Samarco and Fundação Renova. The lawsuits
include claims for compensation, environmental rehabilitation and violations of Brazilian environmental and other laws,
among other matters. The lawsuits seek various remedies including rehabilitation costs, compensation to injured
individuals and families of the deceased, recovery of personal and property losses, moral damages and injunctive
relief. In addition, government inquiries and investigations relating to the Samarco dam failure have been commenced
by numerous agencies of the Brazilian government and are ongoing.
Additional lawsuits and government investigations relating to the Samarco dam failure could be brought against BHP
Brasil and possibly other BHP entities in Brazil or other jurisdictions.
BHP insurance
BHP has various third party general liability and directors and officers insurances for claims related to the Samarco
dam failure made directly against BHP Brasil or other BHP entities, their directors and officers, including class actions.
External insurers have been notified of the Samarco dam failure along with the third party claims and class actions
referred to above. In the period since the dam failure to 30 June 2021, the Group has recognised US$573 million other
income from general liability insurance proceeds relating to the dam failure. Recoveries related to general liability
insurance are now considered complete.
As at 30 June 2021, an insurance receivable has not been recognised for any potential recoveries in respect of ongoing
matters.
Commitments
Under the terms of the Samarco joint venture agreement, BHP Brasil does not have an existing obligation to fund
Samarco.
BHP has agreed to fund a total of up to US$765 million for the Fundação Renova programs and Samarco’s working
capital during calendar year 2021. This comprises up to US$725 million relating to Fundação Renova programs until
31 December 2021, which will be offset against the Group’s provision for the Samarco dam failure, and a short-term
working capital facility of up to US$40 million to be made available to Samarco until 31 December 2021. Amounts
related to Fundação Renova and Samarco working capital incurred in the six months to 30 June 2021 have been
reflected in the utilisation of the provision and impairment expense respectively disclosed above. Any additional
requests for funding or future investment provided would be subject to a future decision by BHP, accounted for at that
time.
BHP Results for the year ended 30 June 2021
59
8. Significant events – Samarco dam failure (continued)
Samarco judicial reorganisation
Samarco filed for judicial reorganisation (JR) in April 2021, with the Commercial Courts of Belo Horizonte, State of
Minas Gerais, Brazil (JR Court), after multiple enforcement actions taken by certain creditors of Samarco. Samarco's
JR filing followed unsuccessful attempts to negotiate a debt restructure with certain financial creditors and multiple
legal actions filed by those creditors which threatened Samarco’s operations. The JR is an insolvency proceeding with
a means for Samarco to seek to restructure its financial debts and establish a sustainable financial position that allows
Samarco to continue to rebuild its operations and strengthen its ability to meet its Fundação Renova funding
obligations. Samarco’s operations are expected to continue during the JR and restructure process. The JR is not
expected to affect Samarco’s obligation or commitment to make full redress for the 2015 Fundão dam failure, and is
not expected to impact Renova Foundation’s ability to undertake that remediation and compensation. It is not possible
to determine the outcomes of the JR or estimate any impact that the reorganisation may have for BHP Brasil, including
its share of the Samarco dam failure provisions.
9. Impairment of non-current assets
Year ended 30 June 2021
Cash generating unit Segment
Property, plant and equipment
US$M
Goodwill and other
intangibles
US$M
Equity-accounted investment
US$M
Total
US$M
New South Wales Energy Coal Coal 1,025 32 − 1,057
Cerrejόn Coal − − 466 466
Potash G&U 1,314 − − 1,314
Other Various 244 20 − 264
Total impairment of non-current assets 2,583 52 466 3,101
Reversal of impairment − − − −
Net impairment of non-current assets 2,583 52 466 3,101
Year ended 30 June 2020
Cash generating unit Segment
Property, plant and equipment
US$M
Goodwill and other
intangibles
US$M
Equity-accounted investment
US$M
Total
US$M
Cerro Colorado Copper 409 − − 409
Other Various 85 − − 85
Total impairment of non-current assets 494 − − 494
Reversal of impairment − − − −
Net impairment of non-current assets 494 − − 494
Impairment testing requirements
Impairment tests for all assets are performed when there is an indication of impairment, although goodwill is tested at
least annually. If the carrying amount of the asset exceeds its recoverable amount, the asset is impaired and an
impairment loss is charged to the income statement so as to reduce the carrying amount in the balance sheet to its
recoverable amount.
Previously impaired assets (excluding goodwill) are reviewed for possible reversal of previous impairment at each
reporting date. Impairment reversal cannot exceed the carrying amount that would have been determined (net of
depreciation) had no impairment loss been recognised for the asset or cash generating units (CGUs). There were no
reversals of impairment in the current or prior year.
How recoverable amount is calculated
The recoverable amount is the higher of an asset’s fair value less costs of disposal (FVLCD) and its value in use (VIU).
For the purposes of assessing impairment, assets are grouped at the lowest levels for which there are separately
identifiable cash flows.
Financial Information
60
9. Impairment of non-current assets (continued)
Impairment of non-current assets
The Group recognised the following impairments to non-current assets during the year:
Year ended 30 June 2021 NSWEC Cerrejón Potash
What has been recognised?
At 30 June 2021, the Group
determined the overall
recoverable amount of the
CGU to be negative US$300
million, resulting in an
aggregate impairment of
property, plant and
equipment and intangibles of
US$1,057 million for FY2021.
At 30 June 2021, the Group
determined the recoverable
amount to be US$284 million,
being the agreed sale
proceeds of US$294 million
adjusted for expected
transaction costs, resulting in
an aggregate impairment of
US$466 million for FY2021.
At 30 June 2021, the Group
determined the recoverable
amount for Potash to be
US$3.3 billion resulting in an
impairment charge of US$1.3
billion against property, plant
and equipment.
What were the drivers of impairment?
The impairment charges
reflect the status of the
divestment process and the
forecast market conditions for
Australian thermal coal, the
strengthening Australian
dollar and changes to the
mine plan.
On 28 June 2021, the Group
announced that it had signed
a Sale and Purchase
Agreement with Glencore to
divest its interest in Cerrejón.
The impairment charge
against the Group’s Potash
assets reflects an analysis of
recent market perspectives
and the value that the Group
would now expect a market
participant to attribute to the
Group’s investments to date.
How were the valuations calculated?
The 30 June 2021 valuation
represents VIU, applying
discounted cash flow (DCF)
techniques.
The 30 June 2021
recoverable amount reflects
the expected net sale
proceeds of US$284 million.
The 30 June 2021 valuation
was determined using
FVLCD methodology,
applying DCF techniques.
What were the significant assumptions and estimates used in the valuations?
The valuation for NSWEC using DCF techniques is most sensitive to changes in energy coal
prices, estimated future production volumes and discount rates.
The valuation for Potash is most sensitive to changes in the long-term potash price outlook and
the risking applied to the future development phases of the potash resource.
10. Business combination
In October 2020, the Group signed a Membership Interest Purchase and Sale Agreement with Hess Corporation
(Hess) to acquire an additional 28 per cent working interest in Shenzi, a six-lease development in the deepwater Gulf
of Mexico. The transaction was completed on 6 November 2020 for a purchase price of US$480 million after customary
post-closing adjustments.
The transaction increased the Group’s working interest from 44 per cent to 72 per cent. Shenzi continues to be
accounted for as a joint operation because BHP continues to have joint decision-making rights with the other joint
venture partner (Repsol). The assets and liabilities related to the acquired interests have been accounted for in line
with the principles of IFRS 3/ AASB 3 ‘Business Combinations’ with no remeasurement of the Group’s previously held
interest. The acquisition resulted in increases to property plant and equipment of US$642 million, inventory of US$17
million and closure and rehabilitation liabilities of US$179 million.
Fair value of the identifiable assets acquired and liabilities assumed, approximate the consideration paid to Hess and
therefore no goodwill or bargain purchase gain has been recognised for the acquisition.
There were no other significant acquisitions during the year ended 30 June 2021, year ended 30 June 2020 or year
ended 30 June 2019.
BHP Results for the year ended 30 June 2021
61
11. Subsequent events
On 27 July 2021, BHP entered into a definitive Support Agreement with Noront Resources (Noront) to make an all-
cash takeover offer for Noront.
On 17 August 2021, BHP announced a major growth investment in the Jansen Stage 1 potash project, which is aligned
with our strategy of growing our exposure to future facing commodities in world class assets.
On 17 August 2021, BHP announced an agreement to pursue a merger of our Petroleum business with Woodside to
create a global top 10 independent energy company with a large-scale portfolio of producing, development and
exploration assets.
On 17 August 2021, BHP announced its intention to realise simplification and enhanced strategic flexibility benefits
through unifying our corporate structure under BHP’s existing Australian parent company.
Other than the matters outlined above or elsewhere in this financial information, no matters or circumstances have
arisen since the end of the financial year that have significantly affected, or may significantly affect, the operations,
results of operations or state of affairs of the Group in subsequent accounting periods.
Alternative Performance Measures
62
BHP
Alternative Performance
Measures
Year ended
30 June 2021
BHP Results for the year ended 30 June 2021
63
Alternative Performance Measures
We use various Alternative Performance Measures (APMs) to reflect our underlying financial performance.
These APMs are not defined or specified under the requirements of IFRS, but are derived from the Group’s draft
Consolidated Financial Statements for the year ended 30 June 2021 prepared in accordance with IFRS. The APMs
and below reconciliations included in this document for the year ended 30 June 2021 and comparative periods are
unaudited. The APMs are consistent with how management review financial performance of the Group with the Board
and the investment community.
We consider Underlying attributable profit to be a key measure that allows for the comparability of underlying financial
performance by excluding the impacts of exceptional items. It is also the basis on which our dividend payout ratio
policy is applied.
Underlying EBITDA is a key APM that management uses internally to assess the performance of the Group’s segments
and make decisions on the allocation of resources. In the Group’s view, this is a relevant measure for capital intensive
industries with long-life assets. Underlying EBITDA and Underlying EBIT are included in the Group’s draft Consolidated
Financial Statements, as required by IFRS 8 ‘Operating Segments’.
The “Definition and calculation of alternative performance measures” section outlines why we believe the APMs are
useful and the calculation methodology. We believe these APMs provide useful information, but they should not be
considered as an indication of, or as a substitute for, statutory measures as an indicator of actual operating
performance (such as profit or net operating cash flow) or any other measure of financial performance or position
presented in accordance with IFRS, or as a measure of a company’s profitability, liquidity or financial position.
The following tables provide reconciliations between the APMs and their nearest respective IFRS measure.
Exceptional items
To improve the comparability of underlying financial performance between reporting periods some of our APMs adjust
the relevant IFRS measures for exceptional items. Refer to the Group’s 30 June 2021 Financial Information for further
information on exceptional items.
Exceptional items are those gains or losses where their nature, including the expected frequency of the events giving
rise to them, and impact is considered material to the Group’s Consolidated Financial Statements. The exceptional
items included within the Group’s profit for the period are detailed below.
Year ended 30 June
2021
US$M
2020
US$M
Revenue − −
Other income 34 489
Expenses excluding net finance costs, depreciation, amortisation and impairments (592) (1,025)
Depreciation and amortisation − −
Net impairments (2,371) (409)
Loss from equity accounted investments, related impairments and expenses (1,456) (508)
Profit/(loss) from operations (4,385) (1,453)
Financial expenses (85) (93)
Financial income − −
Net finance costs (85) (93)
Profit/(loss) before taxation (4,470) (1,546)
Income tax (expense)/benefit (1,327) 241
Royalty-related taxation (net of income tax benefit) − −
Total taxation (expense)/benefit (1,327) 241
Profit/(loss) after taxation from Continuing and Discontinued operations (5,797) (1,305)
Total exceptional items attributable to non-controlling interests (24) (201)
Total exceptional items attributable to BHP shareholders (5,773) (1,104)
Exceptional items attributable to BHP shareholders per share (US cents) (114.2) (21.9)
Weighted basic average number of shares (Million) 5,057 5,057
Alternative Performance Measures
64
APMs derived from Consolidated Income Statement
Underlying attributable profit
Year ended 30 June 2021
US$M 2020
US$M
Profit after taxation from Continuing and Discontinued operations attributable to BHP shareholders 11,304 7,956 Total exceptional items attributable to BHP shareholders(1) 5,773 1,104
Underlying attributable profit 17,077 9,060
(1) Refer to Exceptional items for further information.
Underlying basic earnings per share
Year ended 30 June
2021
US cents
2020
US cents
Basic earnings per ordinary share 223.5 157.3
Exceptional items attributable to BHP shareholders per share(1) 114.2 21.9
Underlying basic earnings per ordinary share 337.7 179.2
(1) Refer to Exceptional items for further information.
Underlying EBITDA
Year ended 30 June
2021
US$M
2020
US$M
Profit from operations 25,906 14,421
Exceptional items included in profit from operations(1) 4,385 1,453
Underlying EBIT 30,291 15,874
Depreciation and amortisation expense 6,824 6,112
Net impairments 2,635 494
Exceptional item included in Depreciation, amortisation and impairments(1) (2,371) (409)
Underlying EBITDA 37,379 22,071
(1) Refer to Exceptional items for further information.
Underlying EBITDA margin
Year ended 30 June 2021
US$M Petroleum Copper Iron Ore Coal
Group and unallocated
items/
eliminations(4) Total
Group
Revenue – Group production 3,935 13,482 34,457 5,154 1,493 58,521
Revenue – Third party products 11 2,244 18 − 23 2,296
Revenue 3,946 15,726 34,475 5,154 1,516 60,817
Underlying EBITDA – Group production 2,299 8,425 26,277 288 24 37,313
Underlying EBITDA – Third party products 1 64 1 − − 66
Segment contribution to the Group's Underlying EBITDA(2) 10% 19% 64% 7% 100%
Underlying EBITDA margin(3) 55% 45% 70% 26% 53%
(1) Refer to Underlying EBITDA for further information.
(2) Percentage contribution to Group Underlying EBITDA, excluding Group and unallocated items.
(3) Underlying EBITDA margin excludes Third party products.
(4) Group and unallocated items includes functions, other unallocated operations including Potash, Nickel West, legacy assets and consolidation adjustments.
BHP Results for the year ended 30 June 2021
65
APMs derived from Consolidated Cash Flow Statement
Capital and exploration expenditure
Year ended 30 June
2021
US$M
2020
US$M
Capital expenditure (purchases of property, plant and equipment) 6,606 6,900
Add: Exploration expenditure 514 740
Capital and exploration expenditure (cash basis) 7,120 7,640
Free cash flow
Year ended 30 June
2021
US$M
2020
US$M
Net operating cash flows 27,234 15,706
Net investing cash flows (7,845) (7,616)
Free cash flow 19,389 8,090
APMs derived from Consolidated Balance Sheet
Net debt and gearing ratio
Year ended 30 June
2021
US$M
2020
US$M
Restated
2019
US$M
Restated
Interest bearing liabilities – Current 2,628 5,012 1,661
Interest bearing liabilities – Non current 18,355 22,036 23,167
Total interest bearing liabilities 20,983 27,048 24,828
Less: Cash and cash equivalents 15,246 13,426 15,613
Less: Net debt management related instruments(1) 557 433 (204)
Less: Net cash management related instruments(2) 34 (15) (27)
Less: Total derivatives included in net debt 591 418 (231)
Net debt 4,121 12,044 9,446
Net assets(3) 55,605 52,175 51,753
Gearing 6.9% 18.8% 15.4%
(1) Represents the net cross currency and interest rate swaps included within current and non-current other financial assets and liabilities.
(2) Represents the net forward exchange contracts related to cash management included within current and non-current other financial assets and liabilities.
(3) 30 June 2020 and 30 June 2019 net assets have been restated to reflect changes to Group’s accounting policy following a decision by the IFRS Interpretations Committee on IAS 12 'Income Tax' resulting in a retrospective decrease of US$71 million . Refer to note 1 ‘Impact of new accounting standards and interpretations and changes in accounting policies’.
Net debt waterfall
Year ended 30 June
2021
US$M
2020
US$M
Net debt at the beginning of the period (12,044) (9,446)
Net operating cash flows 27,234 15,706
Net investing cash flows (7,845) (7,616)
Net financing cash flows (17,922) (9,752)
Net increase/(decrease) in cash and cash equivalents from Continuing and Discontinued operations 1,467 (1,662)
Carrying value of interest bearing liability repayments 7,433 1,533
Carrying value of debt related instruments (proceeds)/settlements (167) 157
Carrying value of cash management related instruments settlements/(proceeds) 403 (451)
Fair value adjustment on debt (including debt related instruments) 58 88
Foreign exchange impacts on cash (including cash management related instruments) (1) (26)
IFRS 16 leases taken on at 1 July 2019 − (1,778)
Lease additions (1,079) (363)
Other (191) (96)
Non-cash movements (1,213) (2,175)
Net debt at the end of the period (4,121) (12,044)
Alternative Performance Measures
66
Net operating assets
Year ended 30 June
2021
US$M
2020
US$M
Restated
Net assets(1) 55,605 52,175
Less: Non-operating assets
Cash and cash equivalents (15,246) (13,426)
Trade and other receivables(2) (280) (194)
Other financial assets(3) (1,516) (2,425)
Current tax assets (279) (366)
Deferred tax assets (1,912) (3,688)
Assets held for sale (324) −
Add: Non-operating liabilities
Trade and other payables(4) 227 310
Interest bearing liabilities 20,983 27,048
Other financial liabilities(5) 588 1,618
Current tax payable 2,800 913
Non-current tax payable 120 109
Deferred tax liabilities 3,314 3,779
Liabilities directly associated with the assets held for sale 17 −
Net operating assets 64,097 65,853
(1) 30 June 2020 balance sheet has been restated to reflect changes to Group’s accounting policy following a decision by the IFRS Interpretations Committee on IAS 12 ‘Income Tax’. Refer to note 1 ‘Impact of new accounting standards and interpretations and changes in accounting policies’.
(2) Represents loans to associates, external finance receivable and accrued interest receivable included within other receivables.
(3) Represents cross currency and interest rate swaps, forward exchange contracts related to cash management and investment in shares and other investments.
(4) Represents accrued interest payable included within other payables.
(5) Represents cross currency and interest rate swaps and forward exchange contracts related to cash management.
BHP Results for the year ended 30 June 2021
67
Other APMs
Principal factors that affect Revenue, Profit from operations and Underlying EBITDA
The following table describes the impact of the principal factors that affected Revenue, Profit from operations and
Underlying EBITDA for the year ended 30 June 2021 and relates them back to our Consolidated Income Statement.
Revenue
US$M
Total expenses,
Other income
and Loss from
equity
accounted investments
US$M
Profit from operations
US$M
Depreciation,
amortisation
and impairments
and Exceptional Items
US$M
Underlying
EBITDA
US$M
Year ended 30 June 2020
Revenue 42,931
Other income 777
Expenses excluding net finance costs (28,775)
Loss from equity accounted investments, related impairments and expenses (512)
Total other income, expenses excluding net finance costs and Loss from equity accounted investments, related impairments and expenses (28,510)
Profit from operations 14,421
Depreciation, amortisation and impairments 6,606
Exceptional item included in Depreciation, amortisation and impairments
(409)
Exceptional items 1,453
Underlying EBITDA 22,071
Change in sales prices 17,186 (221) 16,965 − 16,965
Price-linked costs − (870) (870) − (870)
Net price impact 17,186 (1,091) 16,095 − 16,095
Change in volumes (371) 59 (312) − (312)
Operating cash costs − (34) (34) − (34)
Exploration and business development − 109 109 − 109
Change in controllable cash costs − 75 75 − 75
Exchange rates 104 (1,692) (1,588) − (1,588)
Inflation on costs − (286) (286) − (286)
Fuel and energy − 223 223 − 223
Non-cash − 282 282 − 282
One-off items (142) 20 (122) − (122)
Change in other costs (38) (1,453) (1,491) − (1,491)
Asset sales − 17 17 − 17
Ceased and sold operations (22) 264 242 − 242
Other 1,131 (449) 682 − 682
Depreciation, amortisation and impairments − (891) (891) 891 −
Exceptional items − (2,932) (2,932) 2,932 −
Year ended 30 June 2021
Revenue 60,817
Other income 510
Expenses excluding net finance costs (34,500)
Loss from equity accounted investments, related impairments and expenses (921)
Total other income, expenses excluding net finance costs and Loss from equity accounted investments, related impairments and expenses (34,911)
Profit from operations 25,906
Depreciation, amortisation and impairments 9,459
Exceptional item included in Depreciation, amortisation and impairments
(2,371)
Exceptional items 4,385
Underlying EBITDA 37,379
Alternative Performance Measures
68
Underlying return on capital employed (ROCE)
Year ended 30 June
2021
US$M
2020
US$M
Restated
Profit after taxation from Continuing and Discontinued operations 13,451 8,736
Exceptional items(1) 5,797 1,305
Subtotal 19,248 10,041
Adjusted for:
Net finance costs 1,305 911
Exceptional items included within net finance costs(1) (85) (93)
Income tax expense on net finance costs (337) (267)
Profit after taxation excluding net finance costs and exceptional items 20,131 10,592
Net assets at the beginning of the period(2) 52,175 51,753
Net debt at the beginning of the period 12,044 9,446
Capital employed at the beginning of the period 64,219 61,199
Net assets at the end of the period(2) 55,605 52,175
Net debt at the end of the period 4,121 12,044
Capital employed at the end of the period 59,726 64,219
Average capital employed 61,973 62,709
Underlying Return on Capital Employed 32.5% 16.9%
(1) Refer to Exceptional items for further information.
(2) The Underlying ROCE calculation uses the restated net assets for the comparative period.
Underlying return on capital employed (ROCE) by segment
Year ended 30 June 2021
US$M Petroleum Copper Iron Ore Coal
Group and unallocated
items/ eliminations(1)
Total Group
Profit after taxation excluding net finance costs and exceptional items
109 4,191 16,640 (454) (355) 20,131
Average capital employed 9,471 23,710 16,042 8,262 4,488 61,973
Underlying Return on Capital Employed 1% 18% 104% (5%) − 32.5%
Year ended 30 June 2020
US$M
Restated(2) Petroleum Copper Iron Ore Coal
Group and unallocated
items/ eliminations(1)
Total Group
Profit after taxation excluding net finance costs and exceptional items
90 1,705 9,105 373 (681) 10,592
Average capital employed 9,161 23,118 16,227 8,786 5,417 62,709
Underlying Return on Capital Employed 1% 7% 56% 4% − 16.9%
(1) Group and unallocated items includes functions, other unallocated operations including Potash, Nickel West, legacy assets and consolidation adjustments.
(2) The Underlying ROCE calculation uses the restated net assets for the comparative period.
BHP Results for the year ended 30 June 2021
69
Underlying return on capital employed (ROCE) by asset
Year ended 30 June 2021
US$M
Western Australia Iron Ore Antamina Escondida
Pampa Norte Petroleum(1)
Olympic Dam Potash
Queensland Coal Cerrejόn
New South Wales
Energy Coal Other
Total Group
Profit after taxation excluding net finance costs and exceptional items
(2) The Underlying ROCE calculation uses the restated net assets for the comparative period.
Alternative Performance Measures
70
Definition and calculation of alternative performance measures
Alternative Performance Measures (APMs)
Reasons why we believe the APMs are useful Calculation methodology
Underlying attributable profit
Allows the comparability of underlying financial performance by excluding the impacts of exceptional items and is also the basis on which our dividend payout ratio policy is applied.
Profit after taxation attributable to BHP shareholders excluding any exceptional items attributable to BHP shareholders.
Underlying basic earnings per share
On a per share basis, allows the comparability of underlying financial performance by excluding the impacts of exceptional items.
Underlying attributable profit divided by the weighted basic average number of shares.
Underlying EBITDA Used to help assess current operational profitability excluding the impacts of sunk costs (i.e. depreciation from initial investment). Each is a measure that management uses internally to assess the performance of the Group’s segments and make decisions on the allocation of resources.
Earnings before net finance costs, depreciation, amortisation and impairments, taxation expense, discontinued operations and exceptional items. Underlying EBITDA includes BHP’s share of profit/(loss) from investments accounted for using the equity method including net finance costs, depreciation, amortisation and impairments and taxation expense/(benefit).
Underlying EBITDA margin Underlying EBITDA excluding third party product EBITDA, divided by revenue excluding third party product revenue.
Underlying EBIT Used to help assess current operational profitability excluding net finance costs and taxation expense (each of which are managed at the Group level) as well as discontinued operations and any exceptional items.
Earnings before net finance costs, taxation expense, discontinued operations and any exceptional items. Underlying EBIT includes BHP’s share of profit/(loss) from investments accounted for using the equity method including net finance costs and taxation expense/(benefit).
Profit from operations Earnings before net finance costs, taxation expense and discontinued operations. Profit from operations includes Revenue, Other income, Expenses excluding net finance costs and BHP’s share of profit/(loss) from investments accounted for using the equity method including net finance costs and taxation expense/(benefit).
Capital and exploration expenditure
Used as part of our Capital Allocation Framework to assess efficient deployment of capital. Represents the total outflows of our operational investing expenditure.
Purchases of property, plant and equipment and exploration expenditure.
Free cash flow It is a key measure used as part of our Capital Allocation Framework. Reflects our operational cash performance inclusive of investment expenditure, which helps to highlight how much cash was generated in the period to be available for the servicing of debt and distribution to shareholders.
Net operating cash flows less net investing cash flows.
Net debt Net debt shows the position of gross debt less index-linked freight contracts offset by cash immediately available to pay debt if required and any associated derivative financial instruments. Liability associated with index-linked freight contracts, which are required to be remeasured to the prevailing freight index at each reporting date, are excluded from the net debt calculation due to the short-term volatility of the index they relate to not aligning with how the Group uses net debt for decision making in relation to the Capital Allocation Framework. Net debt includes the fair value of derivative financial instruments used to hedge cash and borrowings to reflect the Group’s risk management strategy of reducing the volatility of net debt caused by fluctuations in foreign exchange and interest rates.
Net debt, along with the gearing ratio, is used to monitor the Group’s capital management by relating net debt relative to equity from shareholders.
Interest bearing liabilities less liability associated with index-linked freight contracts less cash and cash equivalents less net cross currency and interest rate swaps less net cash management related instruments for the Group at the reporting date.
Gearing ratio Ratio of Net debt to Net debt plus Net assets.
Net operating assets Enables a clearer view of the assets deployed to generate earnings by highlighting the net operating assets of the business separate from the financing and tax balances. This measure helps provide an indicator of the underlying performance of our assets and enhances comparability between them.
Operating assets net of operating liabilities, including the carrying value of equity accounted investments and predominantly excludes cash balances, loans to associates, interest bearing liabilities, derivatives hedging our net debt, assets held for sale, liabilities directly associated with assets held for sale and tax balances.
BHP Results for the year ended 30 June 2021
71
Alternative Performance Measures (APMs)
Reasons why we believe the APMs are useful Calculation methodology
Underlying return on capital employed (ROCE)
Indicator of the Group’s capital efficiency and is provided on an underlying basis to allow comparability of underlying financial performance by excluding the impacts of exceptional items.
Profit after taxation excluding exceptional items and net finance costs (after taxation) divided by average capital employed.
Profit after taxation excluding exceptional items and net finance costs (after taxation) is profit after taxation from Continuing and Discontinued operations excluding exceptional items, net finance costs and the estimated taxation impact of net finance costs. These are annualised for a half year end reporting period.
The estimated tax impact is calculated using a prima facie taxation rate on net finance costs (excluding any foreign exchange impact).
Average capital employed is calculated as the average of net assets less net debt for the last two reporting periods.
Adjusted effective tax rate Provides an underlying tax basis to allow comparability of underlying financial performance by excluding the impacts of exceptional items.
Total taxation expense/(benefit) excluding exceptional items and exchange rate movements included in taxation expense/(benefit) divided by Profit before taxation and exceptional items.
Unit cost Used to assess the controllable financial performance of the Group’s assets for each unit of production. Unit costs are adjusted for site specific non-controllable factors to enhance comparability between the Group’s assets.
Ratio of net costs of the assets to the equity share of sales tonnage. Net costs is defined as revenue less Underlying EBITDA and excludes freight and other costs, depending on the nature of each asset.
Freight is excluded as the Group believes it provides a similar basis of comparison to our peer group.
Petroleum unit costs exclude:
• exploration, development and evaluation expense as these costs do not represent our cost performance in relation to current production and the Group believes it provides a similar basis of comparison to our peer group;
• other costs that do not represent underlying cost performance of the business.
Escondida unit costs exclude:
• by-product credits being the favourable impact of by-products (such as gold or silver) to determine the directly attributable costs of copper production.
WAIO, Queensland Coal and NSWEC unit costs exclude:
• royalties as these are costs that are not deemed to be under the Group's control, and the Group believes exclusion provides a similar basis of comparison to our peer group.
Alternative Performance Measures
72
Definition and calculation of principal factors
The method of calculation of the principal factors that affect the period on period movements of Revenue, Profit from
operations and Underlying EBITDA are as follows:
Principal factor Method of calculation
Change in sales prices Change in average realised price for each operation from the prior period to the current period, multiplied by current period sales volumes.
Price-linked costs Change in price-linked costs (mainly royalties) for each operation from the prior period to the current period, multiplied by current period sales volumes.
Change in volumes Change in sales volumes for each operation multiplied by the prior year average realised price less variable unit cost.
Controllable cash costs Total of operating cash costs and exploration and business development costs.
Operating cash costs Change in total costs, other than price-linked costs, exchange rates, inflation on costs, fuel and energy costs, non-cash costs and one-off items as defined below for each operation from the prior period to the current period.
Exploration and business development
Exploration and business development expense in the current period minus exploration and business development expense in the prior period.
Exchange rates Change in exchange rate multiplied by current period local currency revenue and expenses.
Inflation on costs Change in inflation rate applied to expenses, other than depreciation and amortisation, price-linked costs, exploration and business development expenses, expenses in ceased and sold operations and expenses in new and acquired operations.
Fuel and energy Fuel and energy expense in the current period minus fuel and energy expense in the prior period.
Non-cash Change in net impact of capitalisation and depletion of deferred stripping from the prior period to the current period.
One-off items Change in costs exceeding a pre-determined threshold associated with an unexpected event that had not occurred in the last two years and is not reasonably likely to occur within the next two years.
Asset sales Profit/(loss) on the sale of assets or operations in the current period minus profit/(loss) on sale of assets or operations in the prior period.
Ceased and sold operations Underlying EBITDA for operations that ceased or were sold in the current period minus Underlying EBITDA for operations that ceased or were sold in the prior period.
Share of profit/(loss) from equity accounted investments
Share of profit/(loss) from equity accounted investments for the current period minus share of profit/(loss) from equity accounted investments in the prior period.
Other Variances not explained by the above factors.
BHP Results for the year ended 30 June 2021
73
Definition and calculation of Key Indicator terms
We use various Key Indicators to reflect our sustainability performance.
Management uses these Key Indicators to evaluate BHP’s performance against both positive and negative impacts of operational
activities and our progress against our sustainability commitments and targets.
This section outlines why we believe the Key Indicators are useful to the Board, management, investors and other stakeholders,
and the methodology behind the metrics. A definition and explanation of each of the Key Indicators are provided in the tables below.
Health and safety-related metrics
Our highest priority is the safety of our people and the communities in which we operate. This is why are focussed on introducing
more reliable and effective controls across our safety risk profile and improving human and organisational performance, enabling
our people to work safely each day. Our work in fatality elimination is underpinned by our field leadership program, ensuring our
leaders are spending quality time in field engaging with our workforce. The health and safety Key Indicators allow the Board,
management, investors and other stakeholders to measure and track health and safety performance at our operated assets.
Key Indicator Calculation methodology
High Potential
Injury (HPI)
High potential injury frequency (HPIF) is an indicator which measures the number of injuries with fatal
potential per million hours. HPIFR equals the sum of (lost time cases + restricted work cases + medical
treatment cases + first aid cases) x 1,000,000 ÷ total hours worked.
High potential injuries remain a primary focus to assess progress against our most important safety
objective: to eliminate fatalities.
The basis of calculation for high potential injuries was revised in FY2020 from event count to injury count as
part of a safety reporting methodology improvement. In some events, multiple people are injured.
This methodology has been prepared in accordance with GRI standard 403-9.
Total
Recordable
Injury
Frequency
(TRIF)
Total recordable injury frequency (TRIF) is an indicator which measures the number of recordable injuries
per million hours. TRIF equals the sum of (fatalities + lost-time cases + restricted work cases + medical
treatment cases) x 1,000,000 ÷ total hours worked total exposure hours. BHP adopts the US Government
Occupational Safety and Health Administration (OSHA) guidelines for the recording and reporting of
occupational injury and illnesses. TRIF statistics exclude non-operated assets.
Year-on-year improvement of TRIF is one of our five-year sustainability targets and is one of the indicators
used to assess our safety performance.
This methodology has been prepared in accordance with GRI standard 403-9 and OSHA guidelines.
Climate change-related metrics
We recognise the impacts of climate change may impact BHP in a range of areas. Climate-related risks include the potential physical
impacts of acute and chronic risks, and transition impacts arising from the transition to a lower carbon economy. Our climate change
Key Indicators help us monitor our climate change commitments to mitigate the risks and potential impacts associated with climate
change to BHP, as well as fulfil our regulatory reporting obligations. The Key Indicators allow the Board, management, investors
and other stakeholders to measure BHP’s performance against these commitments.
Alternative Performance Measures
74
Key Indicator Calculation methodology
Operational
greenhouse
gas emissions
Definition
Scope 1 greenhouse gas emissions are direct emissions from operations that are owned or controlled by
BHP, primarily emissions from fuel consumed by haul trucks at our operated assets, as well as fugitive
methane emissions from coal and petroleum production at our operated assets. Scope 1 refers to direct
GHG emissions from our operated assets.
Scope 2 greenhouse gas emissions are indirect emissions from the generation of purchased or acquired
electricity, steam, heat or cooling that is consumed by operations that are owned or controlled by BHP. Our
Scope 2 emissions have been calculated using the market-based method using supplier-specific emission
factors unless otherwise specified. A residual mix is currently unavailable to account for voluntary
purchases and this may result in double counting between electricity consumers.
Scope 1 and 2 emissions have been calculated on an operational control basis in accordance with
mandatory minimum performance requirements for HSEC reporting, which are in line with the Greenhouse
Gas Protocol definitions and are measured in tonnes of carbon dioxide equivalent, and in line with the
Greenhouse Gas Protocol Corporate Accounting and Reporting Standard and the Greenhouse Gas
Protocol Scope 2 Guidance.
Calculation methodology
The emissions figures are calculated using the activity data collected at our operated assets. Activity data is
multiplied by an energy content (where necessary) and emission factors to derive the energy consumption
and GHG emissions associated with a process or an operation. Examples of activity data include kilowatt-
hours of electricity used or quantity of fuel used.
Energy and Scope 1 emissions for facilities already reporting to mandatory local regulatory programs are
required to use the same emission factors and methodologies for reporting under BHP’s operational control
boundary. This ensures a single emissions and energy inventory is maintained for consistency and
efficiency. Local regulatory programs were applicable to the majority of BHP’s Scope 1 emissions inventory
in FY2020 (operational control boundary), as listed in the table below. A local regulatory program in this
context refers to any scheme requiring emissions to be calculated using mandated references (e.g. the
Green Tax legislation in Chile, which requires emissions to be calculated using the Intergovernmental Panel
on Climate Change (IPCC) factors) or mandated emission factors (e.g. the Australian National Greenhouse
and Energy Reporting (NGER) Scheme or US EPA GHG reporting program, which publish factors specific
to the programs). In the absence of local mandatory regulations, the Australian NGER (Measurement)
Determination has been set as the default source for emission factors and methodologies for consistency
with the majority of the emissions inventory.
Asset Location Local regulations
BMA, BMC, NSW Energy Coal,
Olympic Dam, Nickel West, WA Iron
ore, Petroleum – Australia
Australia National Greenhouse and Energy Reporting Scheme
Escondida, Pampa Norte Chile Green Tax legislation (referencing IPCC factors)
Petroleum – Gulf of Mexico USA US EPA GHG reporting program
Potash – Canada Canada Canadian Greenhouse Gas Reporting Program (referencing
IPCC factors)
Petroleum – Trinidad Trinidad None
Scope 2 emissions totals are reported using the market-based method (default calculation approach unless
otherwise stated) and the location-based method, as recommended by the GHG Protocol Scope 2
Guidance. Definitions of location and market-based reporting used in BHP’s accounting are consistent with
the Greenhouse Gas Protocol terminology as follows:
Market-based reporting: Scope 2 GHG emissions based on the generators (and therefore the
generation fuel mix from which the reporter contractually purchases electricity and/or is directly
provided electricity via a direct line transfer).
Location-based reporting: Scope 2 GHG emissions based on average energy generation emission
factors for defined geographic locations, including local, subnational or national boundaries (i.e. grid
factors). In the case of a direct line transfer, the location-based emissions are equivalent to the market-
based emissions.
For facilities where market-based reporting is required, electricity emission factors are sourced directly from
the supplier in the first instance. An emission factor in the public domain, which is specific to the generation
plant supplying the facility, is considered equivalent to a supplier-specific factor in this context.
Where supplier-specific factors are not available, a default emission factor for off-grid electricity is used
BHP Results for the year ended 30 June 2021
75
Key Indicator Calculation methodology
instead, as published in local regulations or industry frameworks (or the default off-grid electricity emission
factor from the Australian NGER (Measurement) Determination) in the case where no local default is
available.
The location-based method is applied using electricity emission factors for the relevant grid network, as
sourced from local regulations, industry frameworks or publications from the local grid administrator.
These methodologies have been prepared in accordance with GRI standard 305-1 and GRI standard 305-2.
More information on the calculation methodologies for other reported categories, boundaries assumptions
and key references used in the preparation of our Scope 1 and Scope 2 emissions data can be found in the
BHP Scope 1, 2 and 3 Emissions Calculation Methodology, available at bhp.com/climate.
Value chain
emissions
Scope 3 emissions have been calculated on a carbon dioxide equivalent basis using methodologies
consistent with the Greenhouse Gas Protocol Corporate Value Chain (Scope 3) Accounting and Reporting
Standard (Scope 3 Standard). Scope 3 emissions refers to all other indirect emissions (not included in
Scope 2) that occur in BHP’s value chain, primarily emissions resulting from our customers using the fossil
fuel commodities and processing the non-fossil fuel commodities we sell, as well as upstream emissions
associated with the extraction, production and transportation of the goods, services, fuels and energy we
purchase for use at our operated assets; emissions resulting from the transportation and distribution of our
products; and operational emissions (on an equity basis) from our non-operated joint ventures. Scope 3
emissions reporting necessarily requires a degree of overlap in reporting boundaries due to our involvement
at multiple points in the life cycle of the commodities we produce and consume. A significant example of this
is that Scope 3 emissions reported under Category 10: ‘Processing of sold products’ include the processing
of our iron ore to steel. This third party activity also consumes metallurgical coal as an input, a portion of
which is produced by us. For reporting purposes, we account for Scope 3 emissions from combustion of
metallurgical coal with all other fossil fuels under the Category 11: ‘Use of sold products’, such that a portion
of metallurgical coal emissions is accounted for under two categories. This is an expected outcome of
emissions reporting between the different scopes defined under the standard GHG accounting practices
and is not considered to detract from the overall value of our Scope 3 emissions disclosure. This double
counting means that the emissions reported under each category should not be added up, as to do so
would give an inflated total figure. For this reason, we do not report a total Scope 3 emissions figure.
The below methodology describes the emissions from Category 10: Processing of sold products and
Category 11: Use of sold products. These categories are the most material Scope 3 emission categories
and together account for almost 95 per cent of Scope 3 emissions.
Category 10: Processing of sold products
Emissions from the processing of intermediate products sold in the reporting year by downstream
companies (e.g. manufacturers) subsequent to sale by the reporting company.
Calculation methodology
The average-data method as described in the Greenhouse Gas Protocol Technical Guidance for
Calculating Scope 3 Emissions (Scope 3 Guidance) is used to calculate these emissions, with industry-
average emission factors applied to production volumes (on an equity basis) for each commodity to
calculate an overall emissions estimate for this category.
Assumptions
To estimate emissions from the processing of iron ore, all iron ore production is assumed to be
processed to steel. To estimate the higher-end estimate, the crude steel emission factor is applied to
the volume of crude steel produced from BHP’s iron ore.
To estimate the lower-end emissions number from the processing of iron ore, it is assumed that the
crude steel emission factor already takes into account emissions from both iron ore and metallurgical
coal. Therefore, the crude steel emission factor is apportioned based on the ratio of iron ore and
metallurgical coal input to produce 1,000 kilograms of crude steel (based on World Steel Association’s
integrated blast furnace and basic oxygen furnace route). The crude steel emission factor is split to
estimate the emissions from iron ore and metallurgical coal (calculated in Category 11: Use of sold
products). The split factor is applied to the volume of crude steel produced from BHP’s iron ore. The
estimated crude steel produced with BHP’s iron ore is significantly higher than with BHP’s metallurgical
coal (due to higher iron ore production). Therefore, this approach does not capture third party
metallurgical coal emissions in the steelmaking process.
To estimate emissions from the processing of copper, we apply an emission factor for the processing of
copper to copper wire (rather than alternative products such as tubes or sheets), as this is the most
emissions-intensive process and therefore the most ‘conservative’ assumption.
Emissions from the end use of goods and services sold by the reporting company in the reporting year.
Calculation methodology
The method recommended in the Scope 3 Guidance for ‘direct use-phase’ emissions calculations for ‘Fuels
and feedstocks’ is used to calculate these emissions, with industry-average emission factors applied to
production volumes (on an equity basis) for each commodity to calculate an overall emissions estimate for
this category.
For the lower-end estimate emissions from metallurgical coal, the average-data method as described in the
Scope 3 Guidance is used to calculate these emissions, with industry-average emission factors applied to
production volumes (on an equity basis) for metallurgical coal to calculate an overall emissions estimate for
this category.
Assumptions
All metallurgical coal (higher end estimate), energy coal, natural gas and petroleum products are
assumed to be combusted.
In practice, metallurgical coal is primarily used in steelmaking and a portion of the carbon content
remains embedded in the final steel product and is not released to the atmosphere; the quantities
involved vary according to the feedstocks, processing technologies and output specifications of the
process route used.
To estimate the lower-end emissions number from the use of metallurgical coal, it is assumed that
crude steel emission factor already takes into account emissions from both iron ore and metallurgical
coal. Therefore, the crude steel emission factor is apportioned based on the ratio of iron ore and
metallurgical coal input to produce 1,000 kilograms of crude steel (based on World Steel Association’s
integrated blast furnace and basic oxygen furnace route). The crude steel emission factor is split to
estimate the emissions from metallurgical coal and iron ore (calculated in Category 10: Processing of
sold products). The split factor is applied to the volume of crude steel produced from BHP’s
metallurgical coal. It should be noted that in reality, BHP’s metallurgical coal may not end up with the
same customer as our iron ore.
All energy coal is assumed to be bituminous, which has a mid-range energy content among the three
sub-categories of black coal (the others being sub-bituminous coal and anthracite) listed in the NGER
Measurement Determination published by the Australian Government (Australian NGER
Determination), from which these emission factors are sourced.
All crude oil and condensates are assumed to be refined and combusted as diesel (rather than
alternative products such as gasoline) as the most emissions-intensive, therefore the most
conservative assumption. The energy content of the crude oil and condensate volumes is used to
estimate the corresponding quantity of diesel that would be produced, assuming that no fuel is ‘lost’
during the refining process.
Emissions from LPG and ethane volumes are included in emissions reported for ‘natural gas liquids’
(NGL) production and are assumed to be combusted with the same NGL emission factors. This
assumption has minimal impact on estimated emissions due to the small volumes involved.
This methodology has been prepared in accordance with GRI standard 305-3.
More information on the calculation methodologies for other reported categories, boundaries assumptions
and key references used in the preparation of our Scope 3 emissions data can be found in the associated
BHP Scope 1, 2 and 3 Emissions Calculation Methodology, available at bhp.com/climate.
BHP Results for the year ended 30 June 2021
77
Fresh water withdrawals
We acknowledge the nature of our operations can have significant environmental impacts. Our water withdrawal metrics allow the
Board and management to manage and monitor the inherent risks relating to, and any adverse impacts our operations may have
on, water resources. They also allow the Board, management, investors and other stakeholders to measure and track our
performance towards our water-use commitments. Water withdrawal metrics assist the Board and management in understanding
the significance of our water resource use, collectively for the Group and by individual operated assets, and to assess trends over
time. It also helps inform investment in infrastructure to reduce water withdrawals and improve efficiency of water use.
Key Indicator Calculation methodology
Fresh water withdrawals
The volume of freshwater, in megalitres (ML), received and intended for use within the reporting period by the operated asset from the water environment and/or a third party supplier.
Fresh water is defined as waters other than seawater, wastewater from third parties and hypersaline groundwater. Freshwater withdrawal also excludes entrained water that would not be available for other uses. These exclusions have been made to align with the target’s intent to reduce the use of freshwater sources subject to competition from other users or the environment.
People-related metrics
Our global workforce is the foundation of our business and we believe that supporting the wellbeing of our people and promoting
an inclusive and diverse culture are vital for maintaining a competitive advantage. The proportion of the workforce that are female
or Indigenous workers are key indicators, which allow the Board, management, investors and other stakeholders to measure and
track our near and long-term progress.
Key Indicator Calculation methodology
Female workforce representation (%)
The number of female employees as a proportion of the total workforce on the last day of the respective reporting period, used in internal management reporting for the purposes of monitoring progress against our goals.
Indigenous workforce participation (%)
The number of Indigenous employees as a proportion of the total workforce in the relevant countries on the last day of the respective reporting period, used in internal management reporting for the purposes of monitoring progress against our goals.
There is no significant seasonal variation in employment numbers.
These methodologies have been prepared in accordance with GRI standard 102-8 and GRI standard 405-1.
Petroleum reserves and resources, producing assets and project information
78
Petroleum reserves and
resources, producing
assets and project
information
Year ended
30 June 2021
BHP Results for the year ended 30 June 2021
79
Statement of petroleum resources
The estimates of Petroleum Reserves and Contingent Resources contained in this presentation are based on, and fairly represent,
information and supporting documentation prepared under the supervision of Mr. A. G. Gadgil, who is employed by BHP. Mr. Gadgil
is a member of the Society of Petroleum Engineers and has the required qualifications and experience to act as a qualified
Petroleum Reserves and Resources evaluator under the ASX Listing Rules. This presentation is issued with the prior written consent
of Mr. Gadgil who agrees with the form and context in which the Petroleum Reserves and Contingent Resources are presented.
Reserves and Contingent Resources are net of royalties owned by others and have been estimated using deterministic
methodology. Aggregates of Reserves and Contingent Resources estimates contained in this presentation have been calculated
by arithmetic summation of field/project estimates by category with the exception of the North West Shelf (NWS) Gas Project in
Australia. Probabilistic methodology has been utilised to aggregate the NWS Reserves and Contingent Resources for the reservoirs
dedicated to the gas project only and represents an incremental 6 MMboe of Proved Reserves. The barrel of oil equivalent
conversion is based on 6000 scf of natural gas equals 1 boe. The Reserves and Contingent Resources contained in this presentation
are inclusive of fuel required for operations. The respective amounts of fuel for each category are provided by the following table.
Production volumes exclude fuel. The custody transfer point(s)/point(s) of sale applicable for each field or project are the reference
point for Reserves and Contingent Resources. Reserves and Contingent Resources estimates have not been adjusted for risk.
Unless noted otherwise, Reserves and Contingent Resources are as of 30 June 2021. Where used in this presentation, the term
Resources represents the sum of 2P reserves and 2C Contingent Resources. BHP estimates Proved Reserve volumes according
to SEC disclosure regulations and files these in our annual 20-F report with the SEC. All Unproved volumes are estimated using
SPE-PRMS guidelines, which among other things, allow escalations to prices and costs, and as such, would be on a different basis
than that prescribed by the SEC, and are therefore excluded from our SEC filings. All Resources and other Unproved volumes may
differ from and may not be comparable to the same or similarly-named measures used by other companies. Non-proved estimates
are inherently more uncertain than proved.
Net BHP Petroleum Reserves and Contingent Resources (MMboe) as of 30 June 2021
Australia United States Trinidad & Tobago Mexico Algeria
The SEC permits oil and gas companies, in their filings with the SEC, to disclose only Proved, Probable and Possible Reserves,
and only when such Reserves have been determined in accordance with SEC guidelines. We use certain terms in this
presentation such as “Resources,” “Contingent Resources,” “2C Contingent Resources” and similar terms not determined in
accordance with the SEC’s guidelines, all of which measures we are strictly prohibited from including in filings with the SEC.
These measures include Reserves and Resources with substantially less certainty than Proved Reserves. US investors are urged
to consider closely the disclosure in our Form 20-F for the fiscal year ended 30 June 2021, File No. 001-09526 and in our other
filings with the SEC, available from us at http://www.bhp.com/. These forms can also be obtained from the SEC as described
above.
Petroleum reserves and resources, producing assets and project information
80
Petroleum portfolio | Producing assets and growth projects
Asset Description Operator BHP
ownership
FY21 Production
(MMboe)
End of field
life
1P3
(MMboe)
2P3
(MMboe)
2P+2C3
(MMboe)
Producing assets1
Shenzi2 Oil asset located in the US Gulf of Mexico with TLP (tension leg platform) development operated by BHP.
BHP 72% 8.1 2030s 74 105 294
Atlantis
One of the largest fields in the US Gulf of Mexico, with field production average of ~93,000 bopd over last 5 years and base decline offset via infill drilling and successful workovers.
BP 44% 12.1 2040s 79 175 398
North West Shelf
Integrated LNG project with material remaining resource position. Five LNG trains allowing transition towards a third party gas tolling facility extending operations for decades to come.
Woodside
12.5% – 16.67% across 9 separate
joint venture agreements
24.8 2040s 151 186 222
Mad Dog
Original development with a Truss Spar host (A-Spar): Dry trees, floating spar hull, with integrated drilling and production capabilities of ~4,400 of water depth.
BP 23.9% 4.8 2040s 137 192 365
ROD Integrated Development
The Rhourde Ouled Djemma (ROD) Integrated Development, which consists of the ROD, Sif Fatima – Sif Fatima North East (SF SFNE) and four satellite oil fields.
Joint Sonatrach/ ENI
29.3% effective interest in the
ROD Integrated Development
3.1 2020s 9 13 45
Bass Strait
Major integrated asset consisting of offshore facilities, onshore plants and associated pipeline infrastructure. Advantaged gas position with modest investable opportunities.
Exxon
Gippsland Basin Joint Venture
(GBJV): 50.0%
Kipper Unit Joint Venture (KUJV):
32.5%
28.5 2030s 107 179 387
Pyrenees Subsea oil development in 200m water depth tied back to FPSO.
BHP
WA-42-L permit: 71.43%
WA-43-L permit: 39.999%
3.0 2030s 12 21 36
Macedon Subsea gas development in 200m water depth tied back to onshore domestic gas plant.
BHP 71.43% 8.4 2030s 43 54 72
Trinidad and Tobago
(Angostura and Ruby)
Angostura: Discovered by BHP in 1999, phase 2 included a new gas export platform and two pipelines with gas sales to Trinidad & Tobago commencing in 2011.
Ruby: Developed through a wellhead program, tied back to the Angostura infrastructure. Offsets declining production from Angostura.
BHP
45.0% Block 2(c)
68.46% effective interest in Block
3(a) Project Ruby
9.3 2030s 52 86 120
Asset Description Operator BHP
ownership
Potential execution
timing
(FID)
Potential first
production
FY22 – FY30 Capex
(BHP share, nominal US$bn)
1P3
(MMboe)
2P3
(MMboe)
2P+2C3
(MMboe)
Growth projects
Scarborough
Large offshore gas development exporting gas from a floating production unit to Pluto LNG facility for onshore processing.
Woodside 26.5% CY21 CY26 ~2 bn - - 532
Trion
Large greenfield development in the deepwater Mexico GoM. Resource uncertainty reduced with recent successful appraisal drilling of 2DEL and 3DEL wells. Recently moved into FEED phase.
BHP 60% CY22 CY26 <5 bn - - 275
Calypso
Operated deepwater advantaged gas discovery in Trinidad & Tobago, well positioned to existing regional infrastructure and with low CO2 content / low greenhouse gas intensity. Multiple development concepts under evaluation.
BHP 70% CY26 CY27-28 ~3 bn - - 409
1. Includes all sanctioned and brownfield projects; Breakeven basis.
2. Includes Shenzi North & Wildling.
3. Based on FY21; includes Shenzi WI acquisition. Scarborough estimates include Thebe & Jupiter.
BHP Results for the year ended 30 June 2021
81
Petroleum portfolio | Embedded growth within producing assets
Asset Description Operator BHP
ownership Potential first
production
Estimated peak
production capacity
FY22 – FY30 Capex
(BHP share, nominal US$bn)
Sanctioned Projects (in execution)
Shenzi SSMPP Shenzi Subsea Multi-Phase Pumping (SSMPP); subsea pumping to increase production rates from existing wells.
BHP 72% CY22 6.5 kbpd in
CY22 <0.25bn
Mad Dog A Spar 3-4 infill wells tied to Mad Dog A Spar. BP 24% CY23 18 kbpd in
CY26 <0.25bn
Mad Dog Phase 2 Semi-submersible platform with 22 subsea wells (14 producing wells and 8 water injection wells).
BP 24% CY22 140 kbpd in
CY23 ~0.75bn
Atlantis Phase 3 8-well subsea tieback achieved first production in CY20.
BP 44% CY20 35 kbpd in
CY24 <0.5bn
Pyrenees Phase 4 Well re-entry program comprising infill drilling and water shut off operation.
Shenzi North 2-well subsea tieback to Shenzi TLP. IRR of over 35%1, a breakeven of ~$25/bbl and a payback of <2 years.
BHP 72% CY24 30 kbpd in
CY24 <0.5bn
Asset Description Operator BHP
ownership
Potential execution
timing (FID)
Potential first production
FY22 – FY30 Capex
(BHP share, nominal US$bn)
Unsanctioned projects
Wildling 2-well subsea tieback to Shenzi TLP via Shenzi North. BHP 100% CY22 – 23 CY24 – 25 <0.75bn
Shenzi growth opportunities
Additional infill opportunities to increase production with 3 producing and 2 water injection wells tied back to Shenzi TLP.
BHP 72% CY22 – 25 CY24 – 26 ~0.5bn
Atlantis growth opportunities
Additional development opportunities for 12 infill producing wells and 6 additional water injection wells. Opportunity to increase production via Subsea Multi-Phase Pumping (SSMPP) and topside modification.
BP 44% CY23 – 28 CY25 – 29 ~2bn
Mad Dog Phase 2 growth opportunities
Additional opportunities to increase the Mad Dog Phase 2 production beyond the initial investment scope with 9 new wells tied back to existing facility.
BP 24% CY25 – 26 CY26 – 28 ~0.5bn
Mad Dog WI expansion Two water injector wells providing water from Mad Dog Phase 2 facility to increase production at existing A Spar facility.
BP 24% CY24 CY25 <0.25bn
NWS growth opportunities
Low risk investment opportunity to maximize Karratha Gas Plant value through processing other resource owner gas; benefits through tolling fees, cost recovery and life extension.
Woodside 17% CY24 – 26 CY26 – 28 <0.25bn
Bass Strait growth opportunities
Kipper expansion (additional Phase 1B well & compression) for acceleration and incremental resource capture from the Kipper field.
Exxon GBJV: 50.0%
KUJV: 32.5% CY24 – 27 CY27 – 28 ~0.5bn
1. At consensus pricing, 10% nominal discount rate.