31
PSY 307 – Statistics for the Behavioral Sciences Chapter 3-5 – Mean, Variance, Standard Deviation and Z-scores
PSY 307 – Statistics for the
Behavioral Sciences
Chapter 3-5 – Mean, Variance, Standard Deviation and Z-scores

Measures of Central Tendency
(Representative Values)
Quantitative data:
Mode – the most frequently occurring observation
Median – the middle value in the data
Mean – average
Qualitative data:
Mode – can always be used
Median – can sometimes be used
Mean – can never be used

Mode
The value of the most frequently occurring observation.
In a frequency distribution, look for the highest frequency.
In a graph, look for the peaks or highest bar in a histogram.
Distributions with two peaks are bimodal (have two modes). Even if the peaks are not exactly the
same height.
Median
The middle value when observations are ordered from least to most, or vice versa.
Half the numbers are higher and half are lower.
When there is an even number of observations, the median is the average of the two middle values.
Mean
The most commonly used and most useful average.
Mean = sum of all observations number of all observations = X
n
Observations can be added in any order.

Notation
Sample vs population
Population notation = Greek letters
Individual value = x (lower case)
Sample mean = x or M
Population mean =
Summation sign =
Sample size = n
Population size = N

Mean as Balance Point
The sum of the deviations from the mean always equals zero.
The mean is the single point of equilibrium (balance) in a data set.
The mean is affected by all values in the data set.
If you change a single value, the mean changes.
Demo
The Most Descriptive Average
When a distribution is not skewed (lopsided), the mean, median & mode are similar.
When a distribution is skewed, the mean is closer to the extreme values, mode is farthest. Report both the mean and median for a
skewed distribution.
The mean is the preferred average.

Ranked Data
Mean and modal ranks are not informative.
The mean always equals the median (middle) rank, so use the median.
The mode occurs when there is a tie in the data, but doesn’t mean much.
Find the median by finding the middle rank (or the average of the two middle ranks).

Qualitative Data Averages
The mode can always be used.
The median can only be used when classes can be ordered. The median is the category that
contains 50% in its cumulative frequency.
Never report a median with unordered classes.
Never report the mean.

Measures of Variability
Range – difference between highest and lowest value.
Variance – the mean of the squared deviations (differences) from the mean.
Standard Deviation – square root of the variance. The average amount that observations
deviate from the mean.

Interquartile Range (IQR)
The range for the middle 50% of observations. Distance between the 25th and 75th
percentiles.
Remove the highest and lowest 25% of scores then calculate the range for the remaining values.
Used because it is insensitive to extreme observations.

Using IQR (from Holcomb)
In Rio, what percentage had been injecting from 4.5 to 14 years?
Median Year Injecting = 10
IQR is 4.5-14 (from text).
0 100%
Median = 50%
IQR
4.5 14 25% 25% 25% 25%

More Notation
Sample variance = S2
Population variance = 2
Sample standard deviation = S or SD
Population standard deviation =
Interquartile range = IQR

What Does Variance Describe?
Variance and standard deviation describe the amount that actual observations differ from the mean. How spread out are the scores?
The range doesn’t tell us how scores are distributed between the high and low values.
Because the mean is the balance point, the mean of the unsquared deviations is always zero.
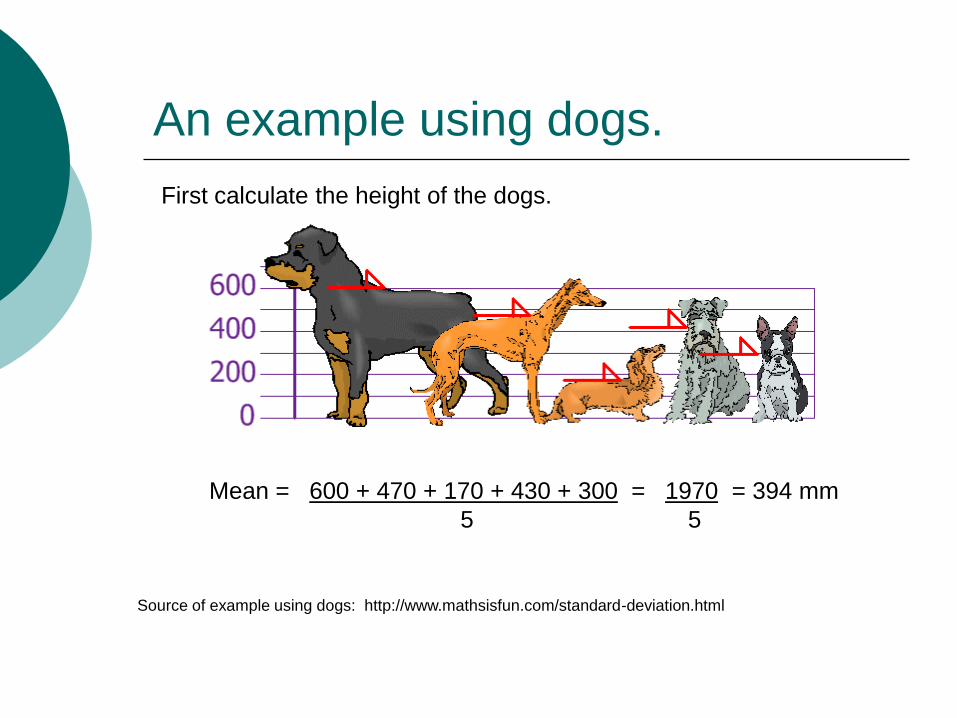
An example using dogs.
Mean = 600 + 470 + 170 + 430 + 300 = 1970 = 394 mm
5 5
Source of example using dogs: http://www.mathsisfun.com/standard-deviation.html
First calculate the height of the dogs.

Next, compare their heights to the
mean.
The green line shows the mean. Subtract the mean from
each dog’s height. Because some dogs are taller and
others are shorter, some of the differences will be positive
and some negative numbers. These differences will
cancel each other out because the mean is the balance
point in the distribution of dog heights.
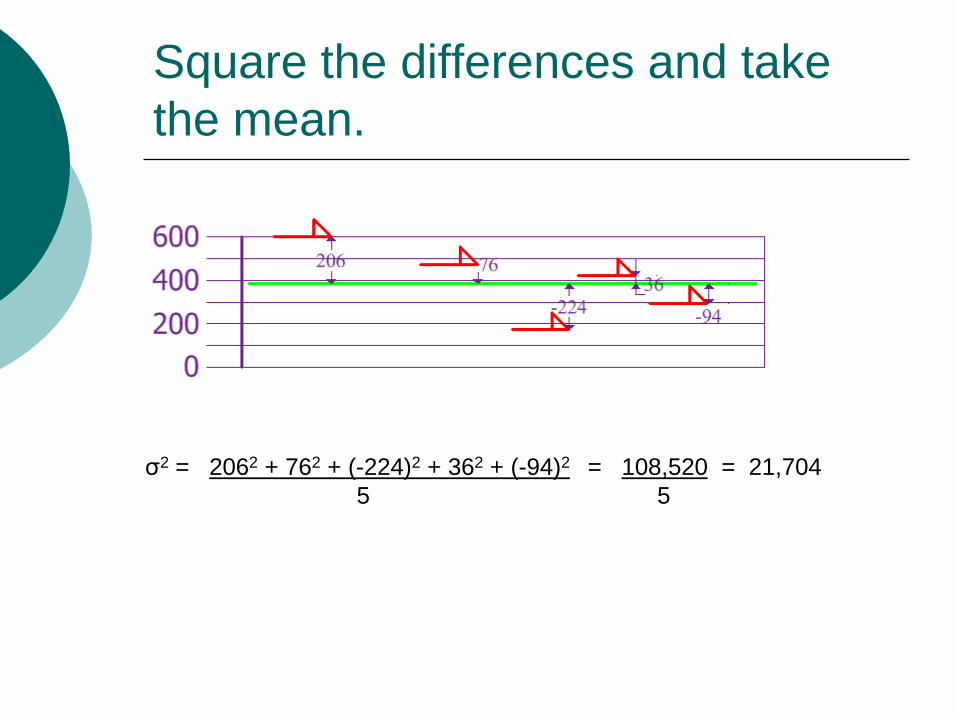
Square the differences and take
the mean.
σ2 = 2062 + 762 + (-224)2 + 362 + (-94)2 = 108,520 = 21,704
5 5

Take the square root to return to
the original units of measure.
σ = √21,704 = 147
Which dogs are within one standard deviation of the mean?
Rottweillers are unusally tall dogs. And Dachsunds
are a bit short.
Standard Deviation
The variance is expressed in squared units (e.g., squared lbs) which are hard to interpret.
Taking the square root of the variance expresses the average deviation in the original units.
The square root of the variance gives a slightly different result than taking the average of the absolute deviations.

Interpreting the SD
For most distributions, the majority of observations fall within one standard deviation of the mean.
A very small minority fall outside two standard deviations.
This generalization is true no matter what the shape of the distribution.
It works for skewed distributions.
A Measure of Distance
The mean shows the position of the balance point within a distribution.
The standard deviation is a unit of distance that is useful for comparing scores.
Standard deviations cannot have a negative value. They can measure in both positive and
negative directions from the mean.

Definition Formula
Definition formula – easier to understand conceptually.
The numerator is also called the Sum of the Squares (squared differences), abbreviated SS
N
XX 2)(2)( XX

Computation Formula
Computation formula – easier to use, especially with large data sets.
The computational and definition formulas produce the same result.
n
XX 22
2)(
N
SS
Population vs Sample
The formulas are different depending on whether a sample or a population is being measured.
Use n-1 in the denominator when using s or s2 to estimate or 2 for a population.
Using n-1 more accurately estimates the variability in a population.

Formulas
Variance for sample:
Variance for population:
1
2
n
SSs
N
SS2
Z-Score
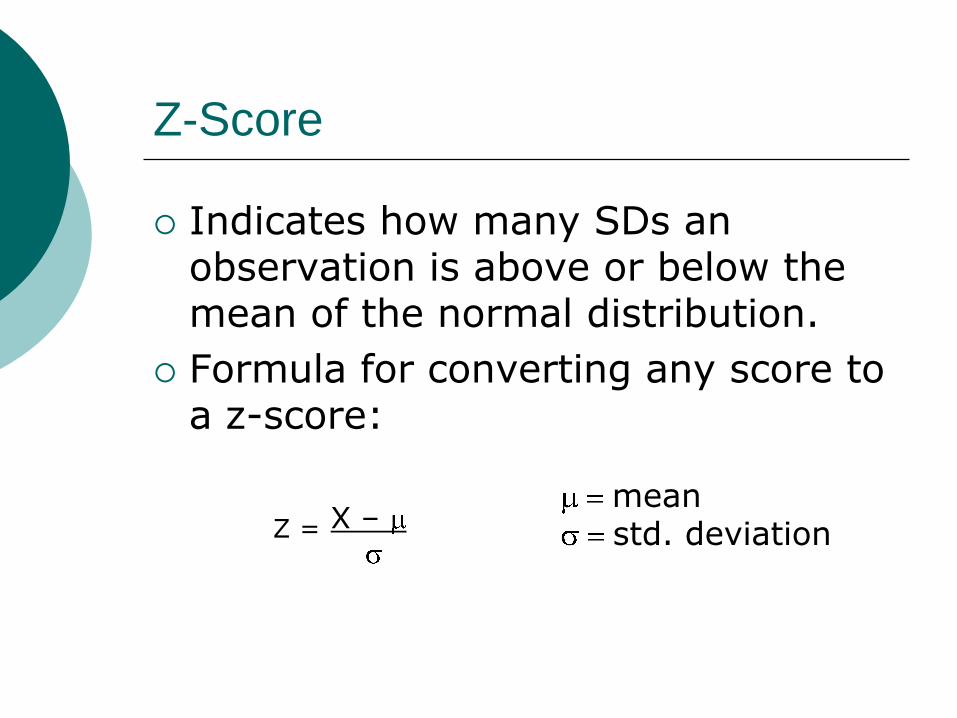
Indicates how many SDs an observation is above or below the mean of the normal distribution.
Formula for converting any score to a z-score:
Z = X –
mean std. deviation
Properties of z-Scores
A z-score expresses a specific value in terms of the standard deviation of the distribution it is drawn from.
The z-score no longer has units of measure (lbs, inches).
Z-scores can be negative or positive, indicating whether the score is above or below the mean.

Standard Normal Curve
By definition has a mean of 0 and an SD of 1.
Standard normal table gives proportions for z-scores using the standard normal curve.
Proportions on either side of the mean equal .50 (50%) and both sides add up to 1.00 (100%).

Other Distributions
Any distribution can be converted to z-scores, giving it a mean of 0 and a standard deviation of 1.
The distribution keeps its original shape, even though the scores are now z-scores. A skewed distribution stays skewed.
The standard normal table cannot be used to find its proportions.

Transformed Standard Scores
Z-scores are useful for converting between different types of standard scores:
IQ test scores, T scores, GRE scores
The z-scores are transformed into the standard scores corresponding to standard deviations (z).
New score = mean + (z)(std dev)


![Witte Poly Pumps[1]](https://static.documents.pub/doc/80x56/5695d02d1a28ab9b029151f4/witte-poly-pumps1.jpg)


