172
BHUTAN ENVIRONMENT OUTLOOK 2012 (Zero Draft working file for Discussion only) 1 | Bhutan Environment Outlook 2013

BHUTAN ENVIRONMENT OUTLOOK 2012
(Zero Draft working file for Discussion only)
1 | B h u t a n E n v i r o n m e n t O u t l o o k 2 0 1 3

Bhutan Environment Outlook 2012Copyright © NEC 2013National Environment Commission SecretariatRoyal Government of BhutanPost Box 466ThimphuReport Design and Layout:
2 | B h u t a n E n v i r o n m e n t O u t l o o k 2 0 1 3

Acknowledgements
3 | B h u t a n E n v i r o n m e n t O u t l o o k 2 0 1 3
Table of Contents
Table of ContentsBACKGROUND TO THE NATIONAL ENVIRONMENT OUTLOOK REPORT........................................12
Introduction..............................................................................................................................12
STATE OF THE ENVIRONMENT REPORTING..................................................................................14
Context and Pprocess...............................................................................................................14
Methodology............................................................................................................................16
Bhutan Environment Outlook 2013: Conceptual Framework.......................................................18
Drivers.......................................................................................................................................18
Pressures...................................................................................................................................18
State-and-Ttrends.....................................................................................................................19
Impacts.....................................................................................................................................19
Responses.................................................................................................................................20
PART 1: PEOPLE, ENVIRONMENT AND DEVELOPMENT................................................................21
Chapter 1: Environment and Economic Development..................................................................22
Topography, Geology, and Soil.................................................................................................22
Climate......................................................................................................................................22
Socio-economy.........................................................................................................................23
Demography.........................................................................................................................23
Health Sservices and Iinfrastructure.....................................................................................25
Poverty..................................................................................................................................26
Urbanization.........................................................................................................................26
Migration..............................................................................................................................27
Millennium Development Goals...........................................................................................28
Economic Development........................................................................................................29
Agriculture............................................................................................................................30
Energy...................................................................................................................................32
Transport..............................................................................................................................33
4 | B h u t a n E n v i r o n m e n t O u t l o o k 2 0 1 3

Industries..............................................................................................................................33
Tourism.................................................................................................................................34
PART 2: STATE AND TRENDS OF THE ENVIRONMENT AND ECOSYSTEMS.....................................36
2. Land Environment.....................................................................................................................37
Drivers.......................................................................................................................................37
Socio-economic Development..............................................................................................37
Population Ggrowth..............................................................................................................37
Pressure on Land Environment.................................................................................................37
Unsustainable Agriculture.....................................................................................................38
Conversion of Agricultural and Forest land...........................................................................38
Mining...................................................................................................................................40
Infrastructure Development.................................................................................................40
Livestock Rearing and Grazing..............................................................................................41
Forest Harvesting..................................................................................................................42
Forest Fire.............................................................................................................................43
Solid Waste Generation and Disposal...................................................................................46
State..........................................................................................................................................47
Land Environment.................................................................................................................47
Degraded Land......................................................................................................................49
Solid waste............................................................................................................................50
Impact.......................................................................................................................................50
Responses.................................................................................................................................51
Reforestation........................................................................................................................51
Community Forestation........................................................................................................52
Sustainable Forest Management..........................................................................................53
Forest Fire Volunteer............................................................................................................54
National Forest Inventory (NFI).............................................................................................54
Sustainable Land Management Interventions......................................................................54
Solid Waste Management.....................................................................................................55
Environment Friendly Road Construction (EFRC)..................................................................56
3. Water Environment..................................................................................................................58
Driver........................................................................................................................................59
5 | B h u t a n E n v i r o n m e n t O u t l o o k 2 0 1 3

Population Ggrowth..............................................................................................................59
Economic and Social Development.......................................................................................59
Climate Change.....................................................................................................................59
Pressure....................................................................................................................................59
Increase in Wwater Cconsumption and Ddemand................................................................59
Solid Wwaste Ggeneration and Ddisposal............................................................................63
Challenges of Wwater Ssupply and Mmanagement.............................................................63
Encroachment of Wwatershed Aarea...................................................................................63
Increased Rrunoff from Uurban Aareas................................................................................64
Deterioration of Wwater Ssources........................................................................................64
State..........................................................................................................................................65
Water Rresources.................................................................................................................65
Water Pollution.....................................................................................................................66
Water Quality and Biological Oxygen Demand Levels...........................................................67
Localized Sscarcity for Ddrinking Wwater and Aagriculture..................................................68
Global Wwarming and Gglacial Rretreat...............................................................................69
Glacial Lake Outburst Floods.................................................................................................71
Impacts.....................................................................................................................................74
Runoff Oover Ttime and Sspace:...........................................................................................74
Reduction in Wwater Ssource Yyield and Qquality Ddeterioration:......................................74
Water Iinduced Hhealth Hhazards........................................................................................75
Reduction in Aagriculture Pproductivity...............................................................................76
Sustainability of Wwater Iintensive Iindustries.....................................................................76
Other Iimpacts:.....................................................................................................................77
Responses.................................................................................................................................78
Access to Improved Water Source and Sanitation................................................................78
Implementation of Iindustrial Ddischarge Sstandards:.........................................................78
Wastewater Ttreatment.......................................................................................................79
Enforcement of Water Act of Bhutan, 2011..........................................................................79
Eco-efficient Aapproaches for Wwater Iinfrastructure.........................................................79
Piloting Rrain Wwater Hharvesting.......................................................................................79
Promotion of Wwater Ssafety Pplan.....................................................................................80
6 | B h u t a n E n v i r o n m e n t O u t l o o k 2 0 1 3

Regular Wwater Qquality Mmonitoring................................................................................80
Biological Monitoring:...........................................................................................................80
Hazard Zzonation:.................................................................................................................82
GLOF Impact Mitigation........................................................................................................83
Installation of Ttechnical Eearly Wwarning Ssystems...........................................................83
4. Air Environment........................................................................................................................85
Overview of Air Pollution in Bhutan..........................................................................................85
DRIVER......................................................................................................................................85
Socio-economic Ddevelopment............................................................................................85
Population Ggrowth..............................................................................................................86
Climate Change.....................................................................................................................86
PRESSURE..................................................................................................................................86
Vehicular Eemissions............................................................................................................86
Construction Activities..........................................................................................................87
Industrial & Mining Activities................................................................................................87
Fire........................................................................................................................................88
Fuel wood & Kerosene for Hheating and Ccooking...............................................................89
Religious Ppractices..............................................................................................................89
STATE........................................................................................................................................89
IMPACT.....................................................................................................................................91
RESPONSE.................................................................................................................................93
Revision of Eemission Sstandards.........................................................................................93
Monitoring Eemissions..........................................................................................................93
Transport and &Uurban Pplanning.......................................................................................93
Pedestrian Day......................................................................................................................94
Urban Transport Plan and Low Emission Capacity Building..................................................94
Use of Ccleaner Eenergy.......................................................................................................94
Trans-boundary Air Pollution................................................................................................94
5. Biodiversity...............................................................................................................................95
Drivers.......................................................................................................................................95
Pressure....................................................................................................................................95
Poaching...............................................................................................................................95
7 | B h u t a n E n v i r o n m e n t O u t l o o k 2 0 1 3

Human-wildlife Cconflict.......................................................................................................96
Infrastructure Ddevelopment...............................................................................................96
Forest Ffire............................................................................................................................97
Climate Change.....................................................................................................................97
State..........................................................................................................................................98
Forest Ecosystems.................................................................................................................98
Aquatic Ecosystems..............................................................................................................99
Agricultural Ecosystems......................................................................................................100
Wild Species Diversity.........................................................................................................101
Wild Ffauna.........................................................................................................................103
Domestic Biodiversity.........................................................................................................106
Livestock diversity...............................................................................................................107
Impact.....................................................................................................................................108
Population Depletion..........................................................................................................108
Habitat Ffragmentation......................................................................................................108
Response.................................................................................................................................109
Strict enforcement of Laws, Rules and Regulations............................................................109
Protection of Wild Fauna and Flora....................................................................................109
Establishment and Management of Protected Areas.........................................................109
Integrated Conservation and Development Program.........................................................110
Human Wildlife Conflict Management................................................................................110
Climate Change and Disaster (Cross Cutting Issues)...............................................................112
Land....................................................................................................................................112
Biodiversity.........................................................................................................................112
Air.......................................................................................................................................113
Water..................................................................................................................................113
Implementation Status (What is being done?)...................................................................114
Bibliography
List of Figures
8 | B h u t a n E n v i r o n m e n t O u t l o o k 2 0 1 3

List of Maps
List of Boxes
Appendices
9 | B h u t a n E n v i r o n m e n t O u t l o o k 2 0 1 3

Acronyms and Glossary of Bhutanese Terms
AcronymsAAC aAnnual aAllowable cCutBEO Bhutan Environment OutlookBWP Bhutan Water PartnershipCBD Convention on Biological DiversityCITES Convention on International Trade in Endangered Species of Fauna and FloraCO2 Carbon dioxideCTEM cClean tTechnology and eEnvironmental mManagementDanida Danish International Development AgencyDoF Department of ForestryDoR Department of RoadsEFRC eEnvironment fFriendly rRoad cConstructionEIMS eEnvironmental iInformation mManagement sSystemEUSPS Environment and Urban Sector Programme SupportEU European UnionFMU Forest Management UnitGDP gGrossdDomestic pProductGHG gGreenhouse gGasGIS gGeographic iInformation sSystemGLOF gGlacial lLake oOutburst fFloodGNH Gross National HappinessICIMOD International Center for Integrated Mountain DevelopmentIUCN World Conservation UnionMoA Ministry of AgricultureMDG mMillennium dDevelopment gGoalMT mMetric tonMTI Ministry of Trade and IndustryMW mMegawattDoE Department of EnergyNBC National Biodiversity CenterNEC National Environment CommissionNECS National Environment Commission SecretariatNORAD Norwegian Agency for DevelopmentNSSD National Strategy for Sustainable DevelopmentNu. Ngultrum (Bhutanese currency), pegged to Indian Rupee
10 | B h u t a n E n v i r o n m e n t O u t l o o k 2 0 1 3

OECD Organization of Economic Cooperation and DevelopmentPHCB Population and Housing Census of BhutanPM10 pParticulate matter of 10 μm or lessPSR pPressure-sState-rResponseRGoB Royal Government of BhutanRNR rRenewable nNatural rResourcesRSPN Royal Society for the Protection of NatureRSTA Road Safety and Transport AuthoritySEA sStrategic eEnvironmentalaAssessmentSLMP Sustainable Land Management ProjectSoE sState of the eEnvironmentTHP Tala Hydroelectric ProjectUNCCD United Nations Convention to Combat DesertificationUNEP United Nations Environment ProgrammeUNFCCC United Nations Framework Convention on Climate ChangeUS-EPA United States Environmental Protection AgencyWHO World Health Organization
Glossary of Bhutanese TermsChhuzhing Wetland cultivationDungkhag Sub-districtDzongkhag DistrictGeog Administrative block made up of few to several villagesKamzhing Dryland cultivationSokshing Woodlot for production of leaf litterTsamdo Registered grazing landTseri Slash-and-burn cultivation
..............................................................................................................................................
............
11 | B h u t a n E n v i r o n m e n t O u t l o o k 2 0 1 3

12 | B h u t a n E n v i r o n m e n t O u t l o o k 2 0 1 3

BACKGROUND AND METHODOLOGY
13 | B h u t a n E n v i r o n m e n t O u t l o o k 2 0 1 3

14 | B h u t a n E n v i r o n m e n t O u t l o o k 2 0 1 3

BACKGROUND TO THE NATIONAL ENVIRONMENT OUTLOOK REPORT
IntroductionGuided by the development philosophy of Gross National Happiness (GNH), the conservation of its culture and environment are integral considerations of socioeconomic development in Bhutan. Environmental conservation constitutes an important part of the national planning framework and has been given a high priority in the country’s development agenda. Using conventional economic considerations, cConservation of the environment comes with great costs for the country as it has to sacrifice short-term economic gains for the long-term interests of not only the Bhutanese people alone but the region and the global community at large. Bhutan’s unwavering commitment to environmental conservation has been recognized globally and today the country is recognized widely as a bastion for conservation.
Bhutan has made a conscious decision to follow the Middle Path to socio-economic development. This means pursuing socio-economic development to enhance the wellbeing of the Bhutanese while maintaining the integrity of the environment and preserving Bhutanese culture. The conservation of the country’s natural resources has been accepted as a priority to enhance the Gross National HappinessGNH of the Bhutanese people.
Bhutan’s Tenth Five Year Plan (2008-2013) stresses that focus on environmental conservation will not diminish during the implementation of the plan (Tenth Five Year Plan 2008). The Plan acknowledges that the accelerated pace of social and economic development activities accompanied by increased expansion of infrastructure development, urbanization, industrialization and changing consumption patterns are likely to put an even greater burden on the natural environment.
Bhutan is one of the very few countries in the world to feature environmental conservation explicitly in its Constitution (Box 1). Article 5 of the Constitution reflects Bhutan’s commitment to environmentally sustainable development and recognition of environmental conservation as one of the four pillars for enhancing GNH.
The latest Millennium Development Goals (MDG) Report “Bhutan’s Progress: Midway to the Millennium Development Goals” published in November 2008 indicates that Bhutan is well on track to achieve most MDG targets by 2015. With regard to Goal 7: Ensure
15 | B h u t a n E n v i r o n m e n t O u t l o o k 2 0 1 3

Environmental Sustainability, Bhutan stands out in terms of its environmental conservation commitments and efforts at securing the MDG targets of environment sustainability (Round Table Meeting,2011). Bhutan is also close to achieving the MDGs targets related to water and sanitation. Safe drinking water coverage has reached near universal levels (90.9%) though there are considerable variations across districts with Dzongkhags like Gasa with access levels at only 57.1 percent (Round Table Meeting, 2011).
Bhutan maintains 72.5% of its total land area as forest cover. About half of this area is designated as protected areas that span the length and breadth of the country. Identified as the Bhutan Biological Conservation Complex (B2C2), Bhutan’s protected area system includes 9% of the total land area maintained as biological corridors to facilitate the migratory movement of animals and birds between protected areas.
At the Fifteenth Conference of Parties to the United Nations Framework Convention on Climate Change (UNFCCC) in 2009 in Copenhagen, Denmark, the Royal Government of Bhutan submitted a declaration to keep absorbing more carbon than it emits and to maintain the country’s status as a net sink for greenhouse gases (GHGs).
Viewed from the perspective of conventional economics, fFor a small, landlocked, mountainous country, conservation of the environment comes with great costs as it has to sacrifice short-term economic gains for the long-term interests of not only the
16 | B h u t a n E n v i r o n m e n t O u t l o o k 2 0 1 3
Box 1: Article 5 of the Constitution of BhutanEnvironment
Every Bhutanese is a trustee of the Kingdom’s natural resources and environment for the benefit of the present and future generations and it is the fundamental duty of every citizen to contribute to the protection of the natural environment, conservation of the rich biodiversity of Bhutan and prevention of all forms of ecological degradation including noise, visual and physical pollution through the adoption and support of environment friendly practices and policies”.
1. The Royal Government shall:
a. Protect, conserve and improve the pristine environment and safeguard the biodiversity of the country;
b. Prevent pollution and ecological degradation;c. Secure ecologically balanced sustainable development while
promoting justifiable economic and social development; andd. Ensure a safe and healthy environment.
2. The Government shall ensure that, in order to conserve the country’s natural resources and to prevent degradation of the ecosystem, a minimum of sixty percent of Bhutan’s total land shall be maintained under forest cover for all time.
3. Parliament may enact environmental legislation to ensure sustainable use of natural resources and maintain intergenerational equity and reaffirm the sovereign rights of the State over its own biological resources.
4. Parliament may, by law, declare any part of the country to be a National Park, Wildlife Reserve, Nature Reserve, Protected Forest, Biosphere Reserve, Critical Watershed and such other categories meriting protection.
Bhutanese people alone but the region and the global community at large. Therefore, in spite of Bhutan’s strong political commitment and sound environmental policies, the country is confronted continually by major challenges pertaining to land degradation, potential biodiversity habitat loss, high fuel wood consumption, environmental impact of road construction, mitigating wildlife and human conflict, maintenance and rehabilitation of existing rural water and sanitation schemes and waste management. In addition, Bhutan also has to deal with the impacts of climate change on its biodiversity and in the agriculture, hydropower, industrial, urban and health sectors.
Evaluating and informing on the state of the environment is one of the mandates of the National Environment Commission. The purpose of the Bhutan Environment Outlook is to produce an up-to-date, politically relevant and valid report to support decision-making at all levels. The Bhutan Environment Outlook (BEO) 2013 analyzes the state of the environment, principal environmental impacts, and the motivating forces and pressures for environmental change. The BEO 2013 is a periodic assessment of the environmental conditions and trends of the country and the report aims to:
Describe current environmental issues; Build awareness and assist in the effective management of the environment;
Provide objective, accurate scientific information about the current conditions and prospects of the country’s environment;
Provide vital environmental information for authorities to make informed decisions relating to environmental management in order to support sustainable development;
Build an understanding of environmental trends and to identify priority areas where action in respect of environmental management must be taken (including an early warning of potential environmental problems);
Report on the progress made towards the implementation of recommendations made in Bhutan Environment Outlook, published in 2008;
Provide policy and other responses to environmental deterioration that has occurred; and
Make recommendations for strengthening environmental policies, plans and/orprogrammes.
17 | B h u t a n E n v i r o n m e n t O u t l o o k 2 0 1 3

STATE OF THE ENVIRONMENT REPORTING
Context and processThe NEC with financial support from United Nations Environment Programme (UNEP) developed and released the previous Bhutan Environment Outlook Report (BEO) in 2008. The BEO is an assessment of the state of the Bhutanese environment including the impacts of development activities and responses needed to mitigate the negative impacts of development activities. The BEO 2008 served as a “State of the Environment Report” that the NEC Secretariat is mandated to produce under the National Environment Protection Act 2007 (NEPA). Besides, providing information on Bhutan’s environment to the citizens and policy makers of Bhutan, the BEO also feeds into the United Nation’s process of preparing the Global Environment Outlook.
The BEO highlights a core set of environmental indicators for the country and takes into full consideration, and harmonizes with, indicators used in other State of the Environment assessments at different hierarchical levels (i.e., sub-regional, regional, and global).
The aim of the BEO is to inform the Royal Government of Bhutan (RGOB), the private sector, and the general public on current environmental trends and impacts in the country. The BEOprovides recommendations for timely action to address the priority national environmental issues identified and to mainstream the findings into national development planning to enhance proper decision-making for sustainable development.
In preparation of the second BEO report for Bhutan, an inception workshop was completed from 17-19 May 2010. At the workshop, key indicators for the report, relevant stakeholders, data sources and task force memberships were agreed upon. (rRefer Annexure 1). Once finalized by the NEC, the second BEO will be submitted to the Gross National Happiness Commission, so that the data and recommendations can be mainstreamed into the National Plan.
State of the environment (SOE) reporting provides information on the current state of the natural resources, underlying causes of environmental change and the responses to the changes. The aim of SOE reporting is to improve understanding of environment and sustainable development issues; and to contextualize and clarify environmental trends in order to inform decision-making. One of the fundamental characteristics of this sort of reporting is the identification of the linkage between the biophysical and socio-economic considerations within a sustainable development context(Rwanda State of the Environment and Outlook Report, 2009).
18 | B h u t a n E n v i r o n m e n t O u t l o o k 2 0 1 3

Traditional SOE reports have the objective of providing information on environment state and trends as its key variables. However, over the past three decades this has evolved to include an assessment of the environment in a more integrated manner. Integrated environmental assessment tries to show the cause-and-effect linkages of human and natural actions and their impact on the environment. In turn, it highlights the impacts of the resultant changes in the environment on human well-being(Rwanda State of the Environment and Outlook Report, 2009). Increasingly, SOE reports have provided greater focus on existing and potential policy responses (UNEP, 2012).
SOE reporting is a now a legal requirement in Bhutan. The National Environment Protection Act 2007, highlights “reporting to the NEC concerning the state of the environment and status of implementing the policies, regulations and directives issued by the NEC” (National Environment Protection Act of Bhutan, 2007) as one of the functions of the Secretariat to the National Environment Commission.
The entire SOE process, from the identification and proposal of themes through validation of the final report was a participatory process. It was a joint effort of the National Environment Commission, lead agencies, major governmental and non-governmental stakeholders, the private sector and national experts in the different thematic areas. As much as possible, the report has compiled and analysed data and indicators to demonstrate positive or negative change. Attempts have also been made to establish a baseline to inform any future assessments.
MethodologyState of the Environment reporting follows an international standard, which attempts to define key interactions between the natural environment and society. The methodology for preparing the BEO follows a standardised international process as described in the Integrated Environment Assessment Training Manual (The GEO Approach to IEA) published by UNEP and IISD (ref).
The purpose of environmental reporting is to answer six fundamental questions:
1. What is happening to the environment and why?2. What are the consequences for the environment, and for humanity?3. What is being done, and how effective have been the actions?4. Where are we heading?5. What actions could be taken to enable a more sustainable future?6. How might environmental degradation affect Gross National Happiness?
19 | B h u t a n E n v i r o n m e n t O u t l o o k 2 0 1 3

The data collected for the BEO follows the DPSIR Framework. In BEO 2008 only PSR was considered. However the second BEO considers the full complement of the DPSIR Framework as follows:
* Driving forces (social/economic/environmental)* Pressures (societal developments/policies/natural processes)* Environmental State (conditions/trends/status)* Impact (ecosystem functions and services/human health and wellbeing)* Responses (formal policy/societal responses)
This format highlights a chain of causal links starting with driving forces (economic and human activities) through pressures (emissions, waste) to states (physical, chemical and biological) and impacts on ecosystems, human health and functions, eventually leading to political responses (policies, legal and institutional frameworks). The framework provides a structure to present the indicators needed to enable feedback to policy makers on environmental quality and the resulting impact of the political choices made, or to be made in the future (Kristensen, 2004).1
The DPSIR framework presents a chain of causal links starting with ‘drivingforces’ (economic sectors, human activities, population growth) through ‘pressures (emissions, waste, deforestation) to ‘states’ (physical, chemical and biological) and ‘impacts’ on ecosystems, human health and functions, eventually leading to political ‘responses’ (prioritisation, target setting, indicators). Using the integrated analysis approach, the DPSIR framework aims to reinforce the cross-cutting nature of environmental management further bringing together differing sectoral mandates in support of sustainable development. The end result of this assessment is intended to be more than just knowing about the state of the environment but to provide policy-makers and other stakeholders with some guidance on how to better manage the environment (Kristensen, 2004).
1Peter Kristensen, The DPSIR Framework, 2004 to be taken to references.
20 | B h u t a n E n v i r o n m e n t O u t l o o k 2 0 1 3

Bhutan EnvironmentOutlook 2013: Conceptual Framework2
DriversThe Drivers, or indirect forces, are defined as fundamental processes in society (which include demographic changes and economic and social processes) that cause more concrete Pressures on the environment (such as changes in land use, resource extraction, pollution and waste production, and the modification and movement of organisms). Key drivers include: demographics; consumption and production patterns; scientific and technological innovation; economic demand, markets and trade; distribution patterns; institutional and social-political frameworks and value systems. The characteristics and importance of each driver differ substantially from one region to another, within regions and within and between nations. For example, in the area of population dynamics, most developing countries are still facing population growth while developed countries are faced with a stagnant and ageing population. The resource demands of people influence environmental change.
PressuresKey pressures include: emissions of substances which may take the form of pollutants or waste; external inputs such as fertilizers, chemicals and irrigation; land use; resource extraction; and modification and movement of organisms. Human interventions may be directed towards causing a desired environmental change such as land use, or they may be intentional or unintentional by-products of other human activities, for example, pollution. The characteristics and importance of each pressure may vary from one region to another, but it is often a combination of pressures that leads to environmental change. For example, climate change is the combineda result of emissions of different greenhouse gases, deforestation and land-use practices. Furthermore, the ability to create and transfer environmental pressures onto the environment of other societies varies from one region to another. Affluent societies with high levels of production, consumption and trade tend to contribute more towards global and transboundary environmental pressures than the less affluent societies which interact in more direct fashion with the environment in which they live.
State-and-TtrendsEnvironmental state also includes trends, which often refers to environmental change. This Environmental change may be natural, human-induced or both. Examples of natural
2www.unep.org/gep/geo4 retrieved on 29 June 2011
21 | B h u t a n E n v i r o n m e n t O u t l o o k 2 0 1 3

processes include solar radiation, extreme natural events, pollination, and background levels of erosion. Key forms of human induced environmental change include, for example, climate change, desertification and land degradation,biodiversity loss, and air and water pollution. Different forms of natural or human-induced changes interact. One form of change, for example, climate change, will inevitably lead to ecosystem change, which may result in desertification and/or biodiversity loss. Different forms of environmental change can reinforce or neutralize each other. For example, a temperature increase due to climate change can, in Europe, partly be offset by changes in ocean currents triggered by climate change. The complexity of the physical, chemical and biological systems constituting the environment makes it hard to predict environmental change, especially when it is subject to multiple pressures. The state of the environment and its resilience to change varies greatly within and among regions due to different climatic and ecological conditions.
ImpactsThe environment is directly or indirectly affected by activities in the social and economic sectors, contributing to change (either negative or positive) in human well-being and in the capacity/ability to cope with environmental changes. Impacts, be they on human well-being, the social and economic sectors or environmental services, are highly dependent on the characteristics of the drivers and, therefore, vary markedly between developing and developed regions.
ResponsesResponses address issues of vulnerability of both people and the environment, and provide opportunities for reducing human vulnerability and enhancing human well-being. Responses take place at various levels: for example, environmental laws and institutions at the national level, and multilateral environmental agreements and institutions at the regional and global levels. The capacity to mitigate and/or adapt to environmental change differs among and within regions, and capacity building is, therefore, a major and overarching component of the response optionscomponents.
The GEO-4 framework has been used in the analyses of issues in all the chapters, both explicitly and implicitly. Its utility is in integrating the analyses to better reflect the cause-and-effect relationships, and ultimately society’s response in addressing the environmental challenges it faces.
22 | B h u t a n E n v i r o n m e n t O u t l o o k 2 0 1 3

PART 1: PEOPLE, ENVIRONMENT AND DEVELOPMENT
23 | B h u t a n E n v i r o n m e n t O u t l o o k 2 0 1 3

24 | B h u t a n E n v i r o n m e n t O u t l o o k 2 0 1 3

Chapter 1: Environment and Economic Development
Topography, Geology, and SoilBhutan is largely mountainous with altitudes ranging from 100 meters in the south to 7,500 meters in the north. Within a span of 170km, the altitude ranges from 175 meters in the south to 7,500 meters in the north. The country is characterized by a fragile mountainous ecosystem where high, rugged mountains, glaciers and moraines, deep valleys and ravines and depressions earmarking watercourses, drainage basins and waterfalls are the main physical features. The dominant topographic features are the high Himalayas in the north with snowcapped peaks and alpine pastures, trans-montane plateaus, north–south valleys and ranges forming watersheds, deep valleys created by fast-flowing rivers, rugged foothills, and alluvial plains with broad river valleys. Valleys in western and central Bhutan like Punakha and Wangdue are wider with straight or concave lower slopes and substantial alluvial deposits. The valleys in eastern Bhutan like Lhuentse, Trashigang, and Zhemgang cut deeper, and have steep convex side slopes, narrow V-shaped valley floors, and negligible alluvium. Sarpang and SamdrupJongkhar are in the foothills of the Himalayas with dense deciduous forests and alluvial lowland river valleys.
The geology and topography of Bhutan are shaped by intense tectonic activity that resulted from the collision of the Indian and Eurasian continental plates, the closure of the intervening Tethys Ocean, and the uplift of the Himalayas. Along the southern border and in the southeast is a wide range of sedimentary and low grade metamorphic rocks, including argillites and metargillites, sandstones and quartzites, limestone, dolomite, and gypsum. The main non-gneissic rocks are three large outcrops of marine sediments, submarine basalts, and their metamorphic derivatives.The most widespread deposits at high altitudes are glacial and periglacial mixtures of stones and sand. At lower altitudes, many of the slopes are covered with colluvium. The topsoil in agricultural areas has a pH between 5 and 6, loamy clay between 10% and 30%, and silt between 20% and 50%.
The most dominant land cover is forests, making up 70.46% of the land area while shrubs account for 10.43%, cultivated agricultural land and meadows account for 2.93% and 4.10% respectively. Snow cover constitutes 7.44% while bare areas constitute 3.20%. Degraded areas, water bodies, built up areas, marshy areas and non-built up areas constitute less than 1% each
25 | B h u t a n E n v i r o n m e n t O u t l o o k 2 0 1 3

ClimateThe climate in Bhutan varies substantially from one Dzongkhag to another due to dramatic changes in the topography, elevation and altitude. Bhutan’s location at the northern periphery of the tropical circulation is an important feature that determines the country’s climate. Bhutan has three climatic zones:
The southern belt is made up of the Himalayan foothills with an altitude ranging from under 200m to about 2,000m. It has a typical subtropical climate characterized by high humidity and heavy rainfall. In this climatic zone, the temperature ranges from 150C to 300C all year round.
The central belt consists of the main rivers valleys with altitude ranging from about 2,000m to 4,000m and is characterized by cool winters, and hot summers with moderate rainfall. The temperature ranges from 150C to 260C during the monsoon season (June through September) and -40C to 150C during the winter season, and
The high region in the north encompasses snowcapped peaks and alpine meadows above 4,000m with cold winter and cool summers.
Around 70% of the precipitation in Bhutan is generated by the monsoons while pre-monsoon activities generate about 20% of the precipitation. The summer monsoons last from late June through late September. The annual precipitation ranges widely in various parts of the country. The northern region gets about 40mm of annual precipitation, mostly in the form of snow. The temperate central valley gets a yearly average of about 1,000mm of rainfall while the southern region gets about 1,500mm of rainfall annually (NSB, 2007).
Socio-economy
DemographyThe Population and Housing Census of Bhutan 2005 (PHCB, 2005) is the main source of population data. Other sources of data are from the various national surveys, censuses, and administrative data, namely the National Health Surveys 1994, 2000, Demographic Survey 1984, the RNR Censuses, Bhutan Livings Standard Surveys, Poverty Reports, National Labour Force Surveys, annual General Statistics Reports of the Ministry of Education and other administrative data of various sectors and autonomous agencies.
According to the PHCB 2005 the total population of Bhutan as of 31 May 2005 was 695,822 persons. The total population is projected at around 757,000 in 2015, and 887,000 by 2030. At that rate, Bhutan’s total population is expected to reach one million by the mid-2040s.
26 | B h u t a n E n v i r o n m e n t O u t l o o k 2 0 1 3

The annual population growth rate in 1984 was 2.6% which increased to 3.1% by 1994, mainly due to the then high level of fertility against the sharp decline in mortality. According to the National Health Survey 2000 the annual rate of growth declined to 2.6% in 2000, which further declined to 1.8% in 2005 (Population and Housing Census of Bhutan, 2005). The growth rate declined further to 1.24% in 2011 from 1.24% in 2010 and 1.27% in 2009 (ref?).
Table 1.1: Population Statistics
Sex 2008 2009 2010 2011 2012
Male 351,269 357,305 363,383 369,629 375,554
Female 319,814 326,102 332,439 338,789 345,125
Both sexes 671,083 683,407 695,822 708,265 720,679
Indicators
Overall sex ratio 110 110 109.3 109.1 109
Life Expectancy 65.53 66.13 68.9 67.3
Population density (pp per sqkm2)
17.5 17.8 18.1 18.44 18.8
Median age of population (years)
22.8 23.0 23.4 23.7 24.0
Ageing index (elderly per 100 children)
15.0 15.4 15.6 15.7 15.8
Growth rate 1.3 1.27 1.8 1.2 ?
Total dependency ratio 56.7 55.6 54.8 54.0 53.5
Child dependency ratio 49.2 48.2 47.4 46.7 46.0
Old age dependency ratio 7.5 7.4 7.4 7.3 7.0
Source: Bhutan aAt aA Glance 2012.
Age structure has direct influence on population change. A classification of the population by three broad age groups, shows that children aged 0-14 constitute a large proportion of the total population. This proportion in 1984 was 37.2% (Statistical Year Book, 1985) that but declined to 33.1% in 2005 and is expected to further decline to 22.3% by the year 2030. The proportion of population 65 years and above was 4.3% in
27 | B h u t a n E n v i r o n m e n t O u t l o o k 2 0 1 3

1984; that slightly increased to 4.7% in 2005 and is estimated to increase to 7.2% by 2030.
Another measure of the young population is the median age or the age at which the population is divided equally into two halves. The median age of the population, as per the PHCB 2005 is 22 years. This implies that the population of Bhutan will continue to increase in the near future as a result of a large proportion of a young population entering the reproductive age. The median age is expected to be 31 years by 2030 indicative of a decrease in the proportion of the young population.
Aging index, that is the ratio of old age persons above age 65+ to every hundred children below age 15 is 14%. That means, there were 14 elderly persons for every 100 children. Aging population will steadily continue to grow with the improvement of health status and increasing life expectancy.
At the national level, population density was sixteen persons per square kilometer (km2 ) in 2005. This is estimated to increase to 23 persons per square kilometerkm2 by 2030. In 2005, population density was highest in Thimphu with a density of 54 followed by Chhukha and Samtse each with densities of 40 persons per km2 sq. km. On the other hand, the least sparsely populated are GasaDdzongkhag with 1 person per square kilometerkm2 followed by LhuentseDzongkhag with 5 persons per sq. kmkm2 (Population and Housing Census of Bhutan, 2005).
In 2005, around 31% of Bhutan’s total population resided in urban areas. Thimphu city, with around 75% of the total urban population was the largest urban center in the country. The rapid increase in the urban population is mainly due to migration of population from rural to the urban areas.
With an estimated population of 708,265 in 2011, Bhutan is one of the least populated countries in Asia. Although the population density is also still very low at 18.1 persons per km2 sq km in 2010, Bhutan’s rugged topography, the vast expanse of snow and rocky areas and forests, limit the amount of land available for agriculture and settlements. Therefore, when considering only cultivable land and human settlement areas of the total land cover assessment, the population density soars to 585 persons per kKm2 in 2010 (Second National Communication, 2011). With a population growth at 1.3%, Bhutan does not have a severe populationproblem at present but localized population pressures exist due to skewed geographical distribution. During the last decade there has been a high rate of internal migration from rural to urban ,areas.The country
28 | B h u t a n E n v i r o n m e n t O u t l o o k 2 0 1 3

however has an extremely youthful demographic profile with about 45% of the population under the age of twenty.
Health services and infrastructureHuman resources and infrastructure in health have expanded significantly in Bhutan. Bhutan’s health system network included 670 health facilities in 2002. The number increased to 767 in 2010. The number of health workers more than doubled between 2005 and 2010 and the number of doctors increased from 145 in 2005 to 187 in 2010—an average annual increase of around 6% per cent. The ratio of doctors to population for every 10,000 persons improved from 1.7 in 2002 to 2.3 in 2006, although the . But increase in the numbers of doctors lagged behind that of nurses during the same period.
In 2010 there were 31 hospitals and 518 outreach clinics in the country. The number of hospital beds per 10,000 people increased to 17 in 2006 from 14 in 2002.3. Over the Ninth Plan period, primary health care coverage was sustained at above 90% per cent and immunization coverage at over 85% per cent. One emerging health risk is the rising number of human immunodeficiency virus/acquired immunodeficiency syndrome (HIV/AIDS) incidences. As of 2010, there were 40 deaths due to AIDS out of which 25 were male and 15 females. As of June 2010 the total cases of HIV/AIDS detected inBhutan is 217, male (110) and female (107). According to the Ministry of Hhealth’sministry’s HIV/AIDS report July 2011, there was a sharp increase in the number of new cases within a span of one year, from 217 in July 2010 to 246 in July 2011.
Poverty(Need write up on poverty)
UrbanizationEven though the population of Bhutan is predominantly rural (69%), the pace of urbanization is accelerating. In 1980, only 5% percent of the total population was estimated to be urban. This increased to 15% in 1994 and 30.9% in 2005, a phenomenal increase by over 100% during the last decade (1994 to 2005). Largely, the urban population growth is attributed to migration from rural areas to urban areas. Urban population (3.5%) grew (3.5%) two times faster than the national population (1.8%) during the last 11 years (1994-2005). It will continue to grow in the next
3 Bhutan National Human Development Report 2011, GNHC,2011
29 | B h u t a n E n v i r o n m e n t O u t l o o k 2 0 1 3

coming decades. According to one projection, the urban population will increase by 103.8% percent to 400,000 in 2020.
In Bhutan, the proportion of urban population grew almost exactly at the same pace of real economic growth as seen in Figure 1.2. The close relationship between percent growth in real GDP since 1985 and urban population growth during the same period is shown in the graph. The growth of urbanization follows almost exactly the same pace as the growth of real GDP.
There has been a sharp increase in urbanization particularly between 1995 and 2005. Economic progress is associated with industrialization, rise in income, and employment generation which are closely associated to population concentration and urbanization.
What is even more disconcerting is that the urban population is also concentrated in fewer Dzongkhags and urban centers. For example, ThimpuDzongkhag alone accounted for 40.4% of the urban population, followed by ChhukhaDzongkhag, accounting for 16.8% percent of the urban population and SarpangDzongkhag accounting for 6.4% of the urban population (PHCB, 2005). GasaDzongkhag has the lowest number of urban population with only 402 urban residents. Thimphu, the capital city alone accounts for 75% of all urban population, which is nearly seven times higher than the second largest town Phuentsholing with 10.5% of urban population. The concentration of urban population in fewer places/centers is detrimental to balanced regional growth as the Ggovernment will be under pressure to devote a major chunk of its meager resources to meet the urgent need of urban services such as electricity, water, sewerage, road and transport to name a few ofin over-crowded urban centers.
Excessive urban growth will put severe strain on the existing inadequate urban services and pose serious developmental and environmental problems such as increasing noise and air pollution; shortage of safe drinking water and electricity; inadequate hygienic and sewerage facilitiesy; proliferation of urban slum and squatter settlements, due to shortage of housing; unemployment, and so on. Some of these symptoms are already occurring in Thimphu and Phuentsholing, which have the highest concentration of urban population, from shortage of water supply, contamination of streams and rivers flowing through towns with due to solid waste and effluent discharge, mushrooming of slums and the accumulation of industrial and domestic pollution.
The limited arable land will also be affected by the expansion of urban areas which will make the task of the Ggovernment to attain its objective of cereal self-sufficiency much more arduous. Other problems like the lack of a proper waste managementsystem, increased extractions of sand, and stones and timbers to meet the growing construction
30 | B h u t a n E n v i r o n m e n t O u t l o o k 2 0 1 3
Fig 1.2: Percent change in real GDP and Urban population

demand in urban centeres will have adverse impacts on the environment. Also related to rapid urbanization are social issues such as poverty, prostitutions, crime, HIV/AIDS, violence and hordes of others. This calls for reduction of population growth, and to reduce the pacetempo of migration from rural to urban areas through creation of off-farm employment opportunities, health and educational facilities in the rural areas.
MigrationInternal migration is important in the population redistribution and urbanization. International migration is mainly confined to groups of project bound labor migrants.
According to the mMigration indicators based on the PHCB 2005,ThimphuDdzongkhag received the highest migrant intakes with a positive migration rate of 2.3%. Lhuentse, Zhemgang, Trashigang, and Tsirang were the major places of origins of internal migrants with a negative rate of migration rate.
The high rate of migration to urban areas may be explained by findings of the PAR 2007 , that an estimated 23.2% of the population is poor. PIt states that the poverty in Bhutan is exclusively a rural phenomenon with three in ten persons in rural areas rated asare poor. By thisits estimates, only less than two percent2% are poor in the urban areas. The Rapid Impact Assessment of Rural Development (, Planning Commission,,Nov., 2007), also indicatesthat accessibility to services particularly that of income generation support was only 16% in the rural areas. At the same time, 35% of respondents in rural areas faced food shortages during the year.
In order to get away from the drudgery of rural life and the perception of better economic prospects in the urban areas have led many people to the towns. The As per PHCB 2005, highest proportion (31.5%) migrated for family moves(PHCB, 2005). Around 17% for employment, 15% for education and training, 11% due to marriage, 10% transfer of work, 3.4% for resettlement, 7% staying as visitors to relations and the rest 7% were for other unspecified reasons.
In addition to the internal migration, the influx of an expatriate workforce for the construction work in urban centers also adds to environmental pollution and degradation.
Millennium Development GoalsThe conservation of environment is extremely important to the goals of socio-economic development as a healthy environment is an essential requisite to the well being of humankind while environmental degradation can undermine development and progress of society. This is also recognized in the Millennium Development Goals (MDGs) that Bhutan along with the other UN member states have agreed to achieve by 2015 which
31 | B h u t a n E n v i r o n m e n t O u t l o o k 2 0 1 3

centralizes around poverty reduction and human well being while in recognizing the need for environmental sustainability as a critical component in the form of the 7th
MDG, very similar to the ourBhutan’s own GNH ideals.
The goal of maintaining a healthy environment has long been at the heart of Bhutan’s development philosophy and the idea of ensuring balanced development has always been at the forefront of development strategies which now manifest in the progress made on social and economic development fronts (as seen by recentthe trends). The report on Bhutan’s progress on the MDGs “Midway to the Millennium Development Goals”, 2008, tells a success story in the tremendous progress towards meeting the targets of the MDGs in light of the challenges faced by the country which is one of the least developed countries in the world. Bhutan has already achieved a number of the targets including the reduction of malnutrition among children, access to safe drinking water and improved sanitation facilities, protection and management of forests and biodiversity, reduction in child and maternal mortality, and primary education enrolment with gender-parity, and is well on track in meeting most of the remaining targets of the MDGs. Specific to MDG-7, which is to ensure environment sustainability, the commitment of the country is reflected in one of the itsmost important documents of the country: the Constitution of the Kingdom of Bhutan, adopted in 2008, in which Article 5 strongly emphasizes the requirement to preserve the environment to ensure long term sustainable use of natural resources and the mandatory requirement of a minimum forest cover of 60% of the country to be maintained for all times. While the indicators of this goal show great achievement with the increased percentage of land under forest cover and a large percentage of protected areas, there are other strong initiatives in the area of sustainable development that haves been initiated but not measured, such as target 9: Integrating the principles of sustainable development into countrypolicies and programmes and reverse the loss of environmental resources . The National Environment Commission and the Gross National Happiness Commission have spearheaded the mainstreaming concept of integrating environment, poverty and climate change into the country’s policies and programs through use of policy screening tools and actual mainstreaming carried out in the sectoral plans and programmes of the 11th FYP that will commence in 2013.
Economic DevelopmentBhutan is categorised as a least developed country and its small population base, geographic size and being land locked pose significant challenges for development. Agriculture is still the dominant sector providing livelihood, income and employment to more than 69% percent of the total population. Bhutan is also rich in hydropower resources and the majority of electricity is exported to India. Fuelled by the
32 | B h u t a n E n v i r o n m e n t O u t l o o k 2 0 1 3

development of hydropower, the industrial sector is developing rapidly. Tourism activities are also on the rise.
Socio-economic development in Bhutan is guided by the philosophy of Gross National Happiness (GNH) promulgated by His Majesty King JigmeSingyeWangchuck. In recent years, the philosophy of GNH has gained acceptance amongst global economists, academicians, social scientists and planners who are developing methods to use GNH as a development indicator to measure how sustainable and equitable development is. The GNH philosophy advocates that socio-economic development will lead to the prosperity and happiness of the general populace only if there is an equitable balance between the four pillars of: i) gGood governance, ii) a pristine environment, iii) economic self-reliance and iv) the preservation and promotion of Bhutan’s culture. To emphasize the importance of using GNH as the guiding philosophy for all plans and programs of the country, a GNH Commission was established in 2008 as the apex body for planning in Bhutan.
Table 1.3: Economic Growth and GDP Aggregates
2005 2006 2007 2008 2009 2010Real GDP Growth 8.8% 6.9% 17.9% 4.7% 6.7% 8.1%*GDP per capita (US$) 1,290 1,388 1,815 1,874 1,851 -Electricity (% of GDP) 10.1% 13.1% 20.4% 21.1% 19.3% 21.8%*Construction(% of GDP) 17.2% 14.8% 13.7% 11.4% 12.2% 15.1%*Agriculture (% of GDP) 22.3% 21.4% 18.7% 18.4% 18.2% 14.5%*Manufacture (%of GDP) 7.1% 7.6% 8.2% 8.4% 8.2% 8.7%*Services (% of GDP) 41.7% 40.9% 37.3% 38.4% 39.8% 35.4%*GDCF(% of GDP) 56.4% 45.6% 40% 30.6%* 35.4%* 39.6%*GDS (% of GDP) 31.7% 33% 37.3% 40.2%* 40.5%* 40.4%*
Source: GNHC 2011
Between 2005 and 2010 the economy grew at an average of 8.7% per year with inflation largely contained underwithin 7% over that period (GNHC, 2011) and wasis fuelled mainly by investments in hydropower projects. Hydropower and construction together comprise one third of the economy while electricity has exceeded the agriculture sector in 2007 and 2010 constituting more than a fifth of the economy (Table 1.2). The service sector accounts for more than a third of Gross Domestic Product (GDP).
33 | B h u t a n E n v i r o n m e n t O u t l o o k 2 0 1 3

AgricultureThe renewable natural resources sector comprising of agriculture, livestock rearing and forestry accounted for almost a quarter of the total GDP in 2005 (Nature Conservation Division,2008) although its share of GDP has been declining due to growth in other sectors (Table 1.3). Although only 2.9% of the total land area is used for agriculture (National Soil Service Center,2010), more than 69% of Bhutan’s population resides in rural areas and subsists on a diverse livelihood of crop agriculture, livestock production and forestry and logging. In 2008, aAgriculture contributed 18.5% percent to the total economy, which was measured by the GDPross Domestic Product. According to the Bhutan Living Standard Survey (Bhutan Living
Standard Survey, 2007), it was the largest sector that provided livelihood to 66.6% percent of the population.
Bhutan has seen impressive growth in its economy over the recent years. The country’s Gross Domestic Product (GDP) has grown from Nu. 40,673.52 million (US$897.67 million) in 2006 to Nu. 72,477.61 million (US$1,584.9 million) in 2010, up by about 78% percent (Figure x). During the same period, per capita GDP has grown from Nu. 64,052.79 (US$1,289.56) to Nu.104,134.50 (US$2,277.16) (National Accounts Report, 2011).
The key contributors to the GDP are electricity (17.61% percent) followed by renewable natural resources (comprising agriculture, livestock and forestry)(16.8% percent) and construction (14.22% percent) (National Accounts Report, 2011).4.
4The figures are for 2010 as cited in the National Accounts Report 2011.
34 | B h u t a n E n v i r o n m e n t O u t l o o k 2 0 1 3
Figure 1.3: GDP share by sector, 2010Source SYB, 2011.
Figure 1.4: GDP growth 2006 - 2010. Source: National Accounts Report 2011.

OThe overall growth has been primarily stimulated by investments in the hydropower sector. In terms of employment, the renewable natural resources (RNR) sector remains the most important economic sector although its relative GDP share has been falling over the years. Fueled primarily by hydropower, urban development and road projects, the construction sector has fast developed into a major economic sector. Tourism is another sector contributing significantly to the country’s economy particularly in terms of foreign exchange and creation of jobs.
Over the last few years, the total RNR share of the GDP has experienced a decrease, contributing to only 16.8% percent of the overall GDP as compared to the 21% percent contribution in 2005. However, the GDP amount of the RNR sector has grown from Nu. 9,234.1 million in 2007 to Nu. 12,177.8 million in 2010. This sector experienced only a 0.3% percent growthth from 2009 to 2010 unlike the manufacturing sectors, which experienced a growth of 20.2% percent in those years. This sector is dominated by a small number of major operators such as the Penden Cement Authority Ltd., the Bhutan Board Products Ltd., Bhutan Carbide and Chemicals Ltd., the Bhutan Ferro Alloys Ltd.; and Bhutan Agro Industries Ltd., along with smaller cottage industries which may flourish with good timber resources and favorable agricultural conditions.
EnergyBhutan is rich in natural resources, especially hydropower and biomass resources. Both these energy resources hold an important position in the country’s economy. The primary source of energy in Bhutan has traditionally been firewood. In the past years, the use of commercial fuel has grown although firewood still represents more than 75% of the total energy consumption in the country. Other forms of energy used in Bhutan are electricity, solar, biomass and petroleum products. Since Bhutan has no known reserves of natural gas or oil, the demand for petroleum products such as kerosene, diesel, petrol and liquid petroleum gas is met entirely through imports.
35 | B h u t a n E n v i r o n m e n t O u t l o o k 2 0 1 3
Figure 1.5: Bhutan’s Electricity Installed Capacity and Generation 2005 - 2010

Bhutan is blessed with abundant renewable and natural energy resources. The primary energy resource is biomass (wood) followed by hydropower. Currently, fuel wood dominates the primary energy resource of the nation accounting for 91% of the country’s energy consumption. Energy today has become the most favorable element in the nation’s economic growth and hydropower in particular contributes about 45% of the national revenue and constitutes about 19% of the country’s GDP. The country has a theoretical hydropower potential of 30,000 MW out of which 23,765 MW has been found to be techno-economically feasible while and the total installed capacity as of December 2010 was only 1,505.32 MW (Second National Communication,, 2011).
Much of the electricity is exported to India to generate income to finance development activities in the other sectors. In 2005, 1,775 MU3 (approximately 67% of the total electricity generated) was exported to India. During the lean season (winter months), power is also imported from India. In 2005, 18.39 MU was imported from India (DoE,, 2005).
While hydropower development is seen as the key to economic growth and sustainability, development of other resources, particularly to meet primary energy requirements are required to be pursued adequately to address the energy security concerns.
Other forms of energy used in Bhutan are electricity, solar, biomass and petroleum products. Since Bhutan has no known reserves of natural gas or oil, the demand for petroleum products such as kerosene, diesel, petrol and liquid petroleum gas is met entirely through imports. In 2011, Bhutan imported Nu. 5014.13 million worth of other light oils and preparations and motor spirit including aviation spirit (NSB, 2012), almost double of the 2008 import figure of Nu. 2511.01 million (NSB, 2009) and topping the top ten import list.
Small deposits of sub-bituminous coal are found in the south eastern Bhutan. Solar energy is harnessed as a part of the rural electrification programme for lighting homes, as a source for powering telecommunication equipment and in heating water for some institutions. The feasibility of tapping wind energy is being explored and presently data are being collected.
TransportThe transport system is a critical infrastructure for development. The transport system in Bhutan consists mainly of road and air transport services. Bhutan has a total length of 9,491.5 km of roadsas of June 2012(NSB, 2012). This includes national highways, district roads, feeder roads, farm roads, urban roads, expressway, access road and forest roads
36 | B h u t a n E n v i r o n m e n t O u t l o o k 2 0 1 3

(DOR, 2010). As of 2011, there are 62,697 registered vehicles in Bhutan (NSB, 2012). According to the Road Safety and Transport Authority (RSTA), the number of vehicles that is being registered in Bhutan is increasing at an average of 10% annually.
Air transport was introduced in the beginning of the 1980s with links to neighbouring countries provided by the only national airline (Druk Air) with a fleet of two aircraft. A limited domestic air service operates between Paro, Bumthang, Younphula and Gelephu. The service was launched in December 2011 and is operated by the national airline and a private airline-Tashi Air.
IndustriesBhutan’s manufacturing sector consists of forest, agro-based, and mineral-based industries that contributed 8.23% to the country’s GDP in 2011. The mining, quarrying and manufacturing sector employed 5.6% of the total employed population (NSB, 2011). The mineral based industries are calcium carbide, ferro alloys and cement production. There are several units that mine dolomite, gypsum, limestone and coal. Wood-based industries are comprised mainly of small sawmills, furniture making units, small traditional paper units, one particleboard factory, wood veneering and resin and turpentine harvesting. Agro-based industries consist of fruit processing and alcoholic beverage production units. Other manufacturing units produce local handicrafts and textiles.
Industrial development in Bhutan is constrained by many factors, including supply and access to raw materials, high transportation costs, small domestic market, lack of space and infrastructure, and shortage of skilled and semi-skilled human resources. The number of industrial license holders has increased steadily over the last decade; however most of the industrial establishments are small scale or cottage industries (Figure 1.6).
According to the information publishedin the Statistical Year Book 2012, the number of industrial license holders increased from 1,777 in 2010 to 2,030 in 2011 (NSB, 2012)with more than 90% percent of the establishments operated by the private sectors. The total number of industrial establishments in Bhutan as of 2011 was 34,692 (NSB, 2012). Of this more than 95% are registered as small and cottage scale industries.
37 | B h u t a n E n v i r o n m e n t O u t l o o k 2 0 1 3

TourismThe tourism industry plays an important role in Bhutan’s socio-economic development as the largest commercial source of convertible currency earnings. Bhutan’s location, terrain and relative isolation have provided a strong comparative advantage for Bhutan as a special destination. Furthermore, the kingdom’s reputation for conservation and its developmental philosophy of Gross National Happiness have all added to Bhutan’s mystique, luring more and more tourists to Bhutan every year. The “High value, Low impact” policy has always guided tourism in Bhutan. Under this policy, tourists are required to pay a sum of US$D 200/day as tariff.
The sector also has significant potential for enhancing rural incomes and providing employment to the rising number of educated youth. Tourism in Bhutan began in 1974 through a government controlled agency, Bhutan Tourism Corporation. The BTC was privatized in 1991 opening the market up to other competitors. Since then, the tourism industry has expanded vastly along with gradually improving
38 | B h u t a n E n v i r o n m e n t O u t l o o k 2 0 1 3
Figure 1.6: Manufacturing and Mining Industries
Figure 1.7: Total tourist arrivals and gross earnings
infrastructure and marketing. As a result, the average number of tourist arrivals has been increasing throughout the years.
Over the last five years, the average number of tourist arrivals have increased drastically from 7,888 tourists over the period from 1995 to 2006, to an average of 23,216 tourists a year from 2006-2010; . 2008 had the highest number of tourist arrivals in the last decade with 27,607 arrivals, and averaging the highest annual earnings from tourism. This spike in tourist arrivals can be attributed to the Coronation of the fifth DrukGyalpo and the Centenary celebrations where Bhutan had vast amounts of media coverage as well as the Smithsonian festival in 2008, which put Bhutan at the center stage of the international community. The year 2011 saw the highest arrival numbers with total of 37,479 tourists and gross earnings of US$47.68 million.
39 | B h u t a n E n v i r o n m e n t O u t l o o k 2 0 1 3

PART 2: STATE AND TRENDS OF THE ENVIRONMENT AND ECOSYSTEMS
40 | B h u t a n E n v i r o n m e n t O u t l o o k 2 0 1 3
41 | B h u t a n E n v i r o n m e n t O u t l o o k 2 0 1 3

2. LandEnvironmentBhutan is geographically small with an area of 38,394 Sqkm2 . with forest as the dominant land cover with 70.46% (NSSC, 2011). The mMajority of the Bhutanese directly depend on the agriculture for sustenance. Due to rapid socio-economic development and increase of population immense pressure is being exerted on the land environment and its ecosystem servicesproducts. As a result, it current economic growth poses a pertinent threat on arable land as well as on the rich forest environment.
DriversThe major factors leading to the degradation of fertile land are:
Socio-economic development, and
Population growth
Socio-economic DevelopmentEconomic development of the country puts an enormous pressure on the land resource. Infrastructure development activities, development of roads and conversion of Government reserve forests into agricultural land, and mining activities directly contributes to the degradation of the land environment. It was reported that Bhutan’s economic growth rate of 8.1% ranked second in South Asia and 9th in the wWorld for the year 2011 (State of the Nation Report, 2012).
Population growthGrowth of population also has significant impacts on the land resource. The need for space for settlements and agriculture multiplies the need for land resource. The total population of Bhutan is projected to be increased by 86.03% by year 2030(NSB, PHCB 2005). Refer Table xx in population.
Pressure on Land EnvironmentThe key pressures exerted on the land resource are as follows:
Unsustainable aAgriculture Conversion of aAgricultural and forest land Mining Infrastructure development Livestock rearing and grazing
42 | B h u t a n E n v i r o n m e n t O u t l o o k 2 0 1 3

Forest hHarvesting Forest fire Solid waste generation and disposal
Unsustainable AgricultureWith 69% of population directly depending on it for sustenance and accounting for more than 16.8% of GDP in 2011, agriculture is the principlale sector providing livelihood, income and employment in Bhutan, especially for the rural populace. Owing to its rugged topography and mountainous nature, Bhutan has a very limited land that can be used for agriculture. According to the cadastral records from year 2007, there are 383,439.85 acres of agriculturale land in Bhutan, of which 31% (National Action Program to Combat Land Degradation, 2009) occurs on land between 50-100% (27-45o) slope and 1.6% on land with more than 100% (45o) slope. Farming on such steep slopes is very risky and environmentally hazardous. Soil erosion, gully formation and landslides have occurred, as exemplified by the farm land in eastern Bhutan (Strategy for Protection of Agricultural Areas, 2009). Tsericultivation a practice of slash-and–burn cultivation method, although was banned by the Land Act 2007 is still widely practiced in Eastern dzongkhahgs of Mongar, SamdrupJongkhar and Pemagatshel. The people in the region depend on tseri cultivation because of their steep farmland, low soil fertility, small landholdings and low production. Tseri cultivation practiced without proper water and soil management measures coupled by withincreased population and extended cropping periods(i.e shortening of the fallow period) leads to land degradation and when such practices occur on steep slopes the results are all the more devastating.
Conversion of Agricultural and Forest landBhutan’s limited usable land has to support not only the majority of its population directly dependeant on agriculture for sustenance, but also to accommodate all the developmental activities of a fast growing economy (of 8.1%) and population growth of 1.3% each year.
Each year, a large amount of prime agricultural and Government Reserved Forest (GRF) land has been converted to accommodate various developmental activities. According to the figure maintained with NLC and MoA, between 2007-2008 and 2008-2009, about 470.8 and 773.145 hectares of prime agricultural land have been converted to other forms of land use. This translates to 193 and 380 times more conversion just in a year times compared to the average 1997–2007 figure of 161 hectares. In the past three years about 22,235.34 acres of GRF land has been allotted for construction of basic infrastructures like schools, hospitals, rural electrification and farm roads.Of the total GRF land allotment for 2008-2011 period, 44.65% of the total landhas been allotted for
43 | B h u t a n E n v i r o n m e n t O u t l o o k 2 0 1 3
construction of transmission lines and roads. Further, mining and quarrying (refer section iii. Page 36), pasture development and power projects have also contributed in reduction of total forest cover over the years.As a result of this conversion, the average annual change in forest cover during 2010-11 is about 0.11 % of the total forest cover, which accounts to about 341.6 kKm2 and biggest conversion as compared to earlieris bigger than the previous two years (Forestry, Facts, Figures & Trends, 2011).
These conversions often take place with very little or no consideration of the land capability and the rate of land conversion taking place are isquite alarming as well. While conservation of the natural environment is an overriding national priority, economic activities and support systems can only intensify or expand on steeper and less suitable terrain, where the inherently unstable geological conditions and climatic factors increase the land’s susceptibility to degradation. It is apparent that loss of agriculture land is likely to escalate in the near future with development penetrating in all major settlements and establishment or expansion of urban areas. Such activity will not only increase the pressure on land but will also increase the vulnerability of agriculture areas threatening food security.
Figure 2.1: GRF land conversion, July 2008-June 2011. Figure 2.2. GRF land allotted in the last three years (2008- 11) for infrastructure development
44 | B h u t a n E n v i r o n m e n t O u t l o o k 2 0 1 3

Figure 2.2: Thimphu, Rapid constructions leading to land cover change. Change picture
MiningDue to rapid industrialization and economic growth, the rate of production of minerals has increased. Mining operations have a direct impact on the landscape and environment.According to the records maintained by thewith Department of Geology and Mines (DGM), there are 67 mines and quarries operating on a total land area of 1404.94 ha. Major minerals mined are dolomite, limestone, gypsum, coal, quartzite and talc and their production runs into over amore than 1 bmillion thousand tonnes every/year (t/yr).Some 53% of the mines are located in Samtse and major minerals mined in the country are dolomite, gypsum, limestone, coal, quartzite and talc, where p. Productionscross aexceeds 1 million t/yrons every year. The graphFigure 2.4 shows that around 500,000 metric tonest/yr of limestone was produced in 2002, that increasinged to 600,000 t/yrmetric tones in 2006. That is around one metric tonne of limestone mined per capita. Although slightly lower than limestone, dolomiteits production since 2003 has grown at the same rate as that of limestone. Its production in 2006 is close to 500,000 metric tones. Gypsum production of around 100,000 metric tones per year is growing at the same rate as that of limestone and dolomite as noticed in the graph Fig 3.5. Its production in 2006 crossed 200,000 metric tones. Production of coal increased slightly during the period. Talc production increased at half the pace of other minerals. Its production in 2006 was around 50,000 metric tones.
45 | B h u t a n E n v i r o n m e n t O u t l o o k 2 0 1 3

Mining operations have direct physical impact on the landscape. Cutting of slopes and excavation works cause changes in slope that may lead to soil erosion, increased run-off, and exposure to potentially reactive natural materials. Dumping or piling of overburden materials can create artificial slopes of potentially hazardous materials. Abandoned mines, if not rehabilitated adequately, leave the landscape degraded and pose immense environmental risks. Mining in Bhutan is carried out mainly to meet the demands of domestic industries and rest is exported to India.
Infrastructure DevelopmentBhutan’s economy has been growing at a very fast rate. Between 2005 and 2010 the economy grew at an average of 8.7% per year (SNC, 2011) and was ranked second in South Asia and 9th in the wWorld for the year 2011 (State of the Nation Report, 2012). The growth is fuelled mainly by investments in hydropower projectsand the construction sector.Constructions of roads and electrification among other things hasve become necessary to realize Bhutan’s socio-economic development objectives. As of 2011, Bhutan has a total road network length of 8,381.61 km of roads, almost the double of 2007 figure of 4,349 km of networks. In the 10th FYP alone, the Ggovernment has constructed around 4,444 km of farm roads across the country to ensure better access to and from markets and economic and social services, including facilitating the delivery of essential inputs to farmers.
One of the main elementsfor achieving sustainable development is access to energy whichand is a basic human need underlying all economic and social activities. In Bhutan, most of the rural families spend a considerable amount of time in collecting fuel wood as primary source of energy for cooking and heatingwhich is a primary source of indoor air pollution.
Recognizing the need to expand strategic infrastructure to achieve broader economic and social transformation theRoyal Government has attached priority in achieving the goal of electricity for all by 2013. In realizing the target, a massive network of hydropower transmission grids and distribution lines hasve been constructed. Over the period of four years, hydropower transmission grids and distribution lines increased from 803 to 949.707 km and 6,254 to 7,678.24 km respectively from 2007 to 2010.
Our Bhutan’srugged terrain and fragile geologic conditions make development of thisese infrastructures extremely environmentally challenging. Where adequate environmental safeguards and mitigation measures are not employed, development of these infrastructure almost inevitably causes problems such as slope instability, landslips, loss of vegetative cover, and sedimentation of water bodies.
46 | B h u t a n E n v i r o n m e n t O u t l o o k 2 0 1 3
Figure 2.4: Trend of mineral production, Bhutan
Livestock Rearing and GrazingLivestock rearing is an important economic activity among the rural communities. Cattle are owned by almost all of the rural households in the temperate and subtropical regions of the country. They are reared mainly for dairy products, meat, draught power and production of dung for use in farmyard manure. In the alpine and sub-alpine regions, the rural communities subsist largely on yak-herding. Yaks are reared for dairy products, meat and transportation of goods. According to the Livestock Statistics 2010, compiled by the Ministry of Agriculture, there were 309,277 cattle and 40,374 yaks in 2010. Although the cattle and yak population has not changed much over the years, however compared to the total population of cattle in 2006 to 2010, the cattle population has decreased by almost 30,000 from 2006 to 2010. This is largely due to the livestock sector’s aim of increasing the improved breeds and decreasing the local population. Figure 1 shows that proportion of improved cattle has been increasing while local cattle numbers haves been decreasing at very slowly velocity.
Figure 2.5: Tproportion in the trends of local and improved cattle breeds (Source: Bhutan RNR Statistics 2011)
Forest HarvestingForest degradation is highly impacted by the harvest of forest products for purposes like construction of shelter and firewood. Pressures are intensifying from increased timber demand from various sources. The cConstruction sector has one of the largest strains demandson timber resources. With many countless real estate developers burgeoning across the kingdom, demand for
47 | B h u t a n E n v i r o n m e n t O u t l o o k 2 0 1 3

timbersisare challenged by limited stock available in Forest Management Units (FMUs) and Working Schemes (WS). The average annual wood supply from managed forests in 2004 was 284,000 cubic meters which has almost increased almost threefold by 2010 with a supply of 63,643 cubic meters of logwood and 546,376 cubic meters of firewood and woodchips adding to a total of 610,019 cubic meters (NSB, NYB 2010). FThe following figures 1 and 2 shows timber production and disposal respectively by the NRDCL. Table 2 indicates the other wood products produced and supplied by NRDCL.
Figure 3: Timber Production by NRDCL ( NRDCL, 2011) Figure 4: Timber Disposal by NRDCL (NRDCL, 2011)
Table 1.1: Other Wood Produced by NRDCL (NRDCL, 2011)
Year Firewood Briquette Woodchips
In TL(=8 m3) In Kg In m3
2006 3,358.00 383,933.00 -2007 4,563.50 492,600.00 -2008 4,222.00 453,060.00 15,732.522009 5,077.00 470,795.00 21,538.952010 4,253.00 529,915.00 16,641.432011 3,795.28 306,015.00 20,516.99
Due to fast pace of economic growth and booming construction industries in the country, the demand for timber is increasing at an alarming rate exceeding the supply situation. According to the a2011 study conducted by the Department of Forests and Park Services, 2011, in the next five years time, approximately a 1.85 million cft
demand-supply gap of timber will be confronted in the market (A Report on the Up-gradation of Wood Processing Technology in Bhutan, 2011).The report clearly indicates
48 | B h u t a n E n v i r o n m e n t O u t l o o k 2 0 1 3

that immense increased pressure will be exerted on forest resources to meet the surplus wood demand for wood. Therefore, there is a concern of the potential of extraction of wood by ad hoc means from forests which are not under sustainable management systemis possible in order to meet the high demand. Extraction of wood from forests not under the sustainable management system could lead to excessive extraction of timber causing forest degradation and making the land vulnerable to soil and water erosion (BEO, 2008).
Forest FireWild fire poses a consistent threat to pressure on the land environment. Bhutan’s diverse geographic terrain combined with composition of high fuel load forestsand unpredictable wind conditions added upon byalong with limited trained fire-fighting professionals in the field, makes Bhutan susceptible to forest fire incidents. Forest arson accounts tofrequently results in degradation and colossal loss of forest resources and , wildlife,culminating in distortion of ecosystem disruption.
In the last 15 yearsFrom 1997-2011, on an average 62 forest fire incidents per yearces were recorded annually damaging about 7,360.53 hectares of forest land every year despite stringent legislation and public awareness programs in Bhutan (Forestry Facts, Figures & Trends 2011).
Figure 2.7: Forest arson trend over the past 15 years show decrease in incidences but occurrences still at the alarming rate. (Source: Forest Information Management Section, FRMD)
According to the record maintained with Department of Forest and Park Services, the average number of forest fire incidents over the past 15 years has been decreasing drastically, however but occurrences is arestill alarming. The average number of incidents in aper year for calculated from 1999/-2000 and to2006/-2007 was 476 which have drastically fell
49 | B h u t a n E n v i r o n m e n t O u t l o o k 2 0 1 3

reduced to 39 in 2010(DoFPS, 2010). Simultaneously, the average forest area affected by forest fire in ayear calculated from 1999/-2000 toand 2006/-2007 was 8,186.5 ha/yr which has declined to 4,222.15 ha/yrinby 2010 (DoFPS, 2010).
Most forest fire incidents in the country are anthropogenic in nature deliberately set by people to boost the growth of Lemon grass (Cymbopoganflexuosus) and other fodder species especially in the Eastern region of the country. Agriculture debris burning coinciding with dry season contributes to most firesincidences in the Western region. Figure 2.8xxx shows that combination ofthe Eastern and Western regions experienced more than 80% of the total forest fires occurrences in the last 15 years.
The drastic reduction in forest fire incidents after the 1990s can be attributed to the vigorous awareness program on fire hazards enabled by availability of different media to reach the general publicmass.Figure 2.9xxx shows that except for Gasa and Trongsadzongkhag, forest fire incidents have been reported in all the dzongkhagswith the maximum of 48 cases in Thimphu noting total of 48 incidents, (of which 19 cases were reported in 2010–2011 period) followed by Lhuentse and Trashigang with 34 cases and Mongar with 27 incidents.
Figure 2.9: Dzongkhag-wise forest fire incidents (source: DoFPS, MoAF 2012)
Depending on the local site conditions, the negative impact of forest fires may be immediate or on a longer term. In steep areas, the negative impact may be immediate, especially if heavy rains follow forest fires. The rainwater washes away topsoil and ash, depriving the exposed area of nutrients to support natural regeneration. When such a process recurs several times, a succession process is triggered whereby the site completely degenerates into a barren area. Some species such as Chir pine (Pinusroxburghii) can withstand a few forest fires. However, there is gradual
50 | B h u t a n E n v i r o n m e n t O u t l o o k 2 0 1 3
Figure 2.8: Regional wise forest fire incidences. (Source: Forest Information Management Section,

degeneration of the site and obliteration of associated species rendering the site vulnerable to land degradation and ecosystem change (BEO, 2008).
Figure 2.10: Pine forests are susceptible to fire (change picture)
Solid Waste Generation and Disposal Table 2.2: Total Municipal Solid Waste Generation in the Entire Urban Centers from Various Sources
Types of Wastes
Generation Rates
Total Quantity(Tonnes/year)
Percentage Distribution From Each Source (%)
Household Wastes 0.25 kKg/Person/Day 21,000 47Non-household WastesCommercial Sources 2.36kKg/Unit/Day 10,000 23Office Sources 0.21kKg/Employee/Day 5,000 12Weekly Vegetable Markets
0.30kKg/Person/Week 3,500 8
Schools and Institutions 0.10kKg/Person/Day 4,200 10
Total estimated in 2007
43,700 100
Average per Capita total
195Kg/Person/Year
Municipal SW Generation
0.53Kg/Person/Day
51 | B h u t a n E n v i r o n m e n t O u t l o o k 2 0 1 3

Figure 2.11: Landfill Site in Memelakha, Thimphu. The site was started since 1994 and was designed for 8 years at a rate of 8 metric ton per day (MoWHS, 2009). However, the site is still used by extending the site
to the surrounding hills(change picture)
State
Land EnvironmentThe first national forest assessment was conducted in 1976 as a Pre-Investment Survey (PIS) jointly by Royal Government of Bhutan and Forest Survey of India (Dehradun, India) based on the aerial photographs of 1956 and 1958. The present estimate of the gross volume per hectare is 191.13 m3 for the forests in Bhutan (Forestry Facts, Figures & Trends 2011) is derived from the report of Land Use Planning Project (LUPP, 1995). Thise figure may not be so reliable in the current since the derivation was based on the satellite images of 1989 and 1990.
However, based on the Land Cover Assessment Mapping Project of Bhutan, forest is a dominant features of land cover constituting 70.46% followed by shrubs accounting to 10.43%, cultivated agricultural land and meadows account for 2.93% and 4.10% respectively. Snow cover constitutes 7.44% while bare areas constitute 3.20%. Degraded areas, water bodies, built up areas, marshy areas and non-built up areas constitute less than 1% each (Figure 2.12).
52 | B h u t a n E n v i r o n m e n t O u t l o o k 2 0 1 3

Figure 2.12: Land cover types of Bhutan (LCMP-2010)
Conversely, the total land cover in 1997 was 72.5 % including shrubs in 1997 (LCMP, 2010). The increased of forest cover by more than 8% may be attributable to the enormous reduction in occurrence of forest fires as indicated earlier. In addition, the increase may also be due to the decrease in the agricultural activities which can be discerned from declination of the reduced land under agriculture from 7.70% in 1997 to 2.93% in 2010 (LCMP, 2010) in addition to ongoing re-forestation efforts which are being made.
The land cover assessment LCMP 2010shows a that the composition of thenational forest cover (of 70.46%, (excluding shrubs) includes , of which 62.43% is Broadleaf (,62.43%), 22.69% is Mixed Conifer(22.69%), 6.77% is Fir (6.77%), 3.98% isChir pine (3.98%), 2.96% is Blue pine (2.96%),and 1.16% is Broadleaf with Cconifer(1.16%) (LCMP, 2010).The land cover distribution is closely related to altitude and differences between regions and between Dzongkhags are largely the reflections of their respective altitude characteristics. Hence, broadleaf forest is dominant at elevations below 2,500m and coniferous forest between 2,500m and 3, 500m above sea level (asl). However, shrubs and meadows occur all along the altitudinal gradient. Snow, sScree and most rock outcrop areas are obviously confined to elevations above 3,500m asl. Ten out of twenty Dzongkhags have a total forest cover of more than 80%, while Gasa has the lowest of 25% followed by Thimphu with 41.73% forest cover, as result of extensive high elevation areas with natural limitations on tree growth (LCMP, 2010).
53 | B h u t a n E n v i r o n m e n t O u t l o o k 2 0 1 3

The country’s forests are presently managed as government reserved forests and protected by the Forest and Nature Conservation Act 1995.The Constitution of the Kingdom of Bhutan also mandates that at least 60% of the country must remain under forest cover for all times to come.
Forest resources are an integral and crucial part of livelihoods and well-being of the Bhutanese population through its natural regulation of climateic, water, and floral/faunal resources to furnish essential needs such as wood, food, fodder and traditional remedies.
According to the figure reported in Second National Communication (SNC) in, 2011, total managed forests accounted for about 14,054 km2 square kilometers in Bhutan in 2000. This total managed forest area is comprisesdof 8,124 km2 square kilometers (58%) reserved for potential commercial management; 4,231 square kilometers km2 (30%) of protected forests (representing 50% of total protected forest land); and 1,700 square kilometerskm2 (12%) of areas already being managed as forest management units,as shown in Ffigure 2.4 (SNC, 2011). It is important to note that Vvirtually all forests in Bhutan have some form of human intervention through biomass collection, tsamdro (grazing land), sokshing(woodlot for production of leaf litter used in farmyard manure),as well as timber harvesting for house construction, roofing shingles, wooden poles and posts for religious and cultural uses and cremationand non-wood forest products.
The total area under cultivated agricultural land according to the LCMP (2010) assessment shows wasonly 2.93%, a significant decrease of 4.92% from the previousexisting total area of 7.85% (from LUPP 1995). The actual area decrease according to the assessment report is partly due to over-classification of cultivated agricultural land during LUPP-1995 and fallowing ofTseriland during the LCMP (2010) assessment. In addition, the recent international boundary demarcation has also causedsome differences in the relative land cover composition, largely due to the loss of high-altitude areas in thenorthern part of the country (Land Cover Assessment Mapping Project 2010).
The main land uses for agriculture are kamzhing (dryland cultivation), chhuzhing(wetland cultivation), and mixed cultivation. Kamzhingis either terraced or unterracedrainfed agricultural land. It is found throughout the country, mainly on mountain slopes. It is the most dominant agricultural land use type. Chhuzhingis mainly found in the fertile valleys of Paro, Wangdue and Punakha. In other parts of the country such as Trashigang, Mongar, Lhuentse and Trongsa, chhuzhingis found scattered on
54 | B h u t a n E n v i r o n m e n t O u t l o o k 2 0 1 3

steep slopes. In the southern foothills, it can be found in long and extensive stretches (BEO, 2008). The proportion of agricultural land is highest at lower altitudes, with the four Dzongkhags exceeding 5.0% i.e. Samtse, Tsirang, Pemagatshel and Paro, while Gasa, Bumthang, Trongsa and ThimphuDzongkhags have less than 1.4% cultivated agricultural land (LCMP, 2010).
Snow and glaciers constitutes 7.44% of the total land area and is source forcontributes most of Bhutan’s fresh flowing rivers and streams.
Degraded LandTOn the contrary the area of degraded forest in Bhutan has increased by more than 7 times from 32,356hHa. in 2004 to 236,700 hHa. in 2007 (SNC, 2011). In addition, the total land area affected by landslides and soil erosion was 77,211 hHa (SNC, 2011) in the early 1990s. HoweverUnfortunately, data after the 1990s is still yet to be collected which would have been significant usefulin assessing the current area of degraded land if it was availableis still yet to be collected.
Figure 2.13: Flash flood in Gasa leading to degradation of land from wash out of fertile top soil (Source: http://www.kuenselonline.com/2011)
Solidwaste
ImpactLIt is observed from the above figures that land is being degraded at a rate of approximately 1.5% in aper year (SNC,econd National Communication2007). However, re-forestation is approximately done at a rate of about 0.11% per year (derived from
55 | B h u t a n E n v i r o n m e n t O u t l o o k 2 0 1 3

SNC, NCD 2009) based on two Five Year Plan data from 2005 and 2011. This still leaves a gap of about 1.4% annual degradation rate which is quite alarming in thatas it would only take approximately 72 years at this rate to degrade all the land in Bhutan. Probably tThe rate would be more higherhad more recent data pertaining to soil erosion and land slides are beenavailable.
Rapid socio-economic development and increased of population leads to intervention of immediate and ad hoc plans and in most cases such plans are detrimental to land in terms of sustainability. Important major impacts of current land use pattern in Bhutan are as follows:
Poor planning and implementation of urban area plans and development of infrastructure
Loss of biodiversity, loss and fragmentation of habitat
Loss of food production and decreasing food security
Decreased groundwater recharge and drying of water sources
Deterioration of water quality due to sedimentation from fragile soil areas
Decrease in forest resources and life sustaining componentsecosystem services
Wastage of fertile arable land for urbanization and industrialization
Extinction of endangered flora and fauna
The pressure on the existing forests in the country is on the rise every dayrising due to increases in human population and also due to rapid economic development. Meeting the relentless timber need in the country for various construction and developmental activities is one of the challenges faced by the Bhutan’snatural resource managers and conservationists. An estimated 54.4% of the country’s forest is unsuitable for timber production thus downsizing the productive area to only 16.8% of the total area (Forestry Facts, Figures & Trends2011). A large number of trees are isfelled yearly to meet the heavy demands of public and government organizations. This leaves resources vulnerable to illegal felling and other unlawful activities and pilfers marketin forest areas. Excessivetensive harvesting of resources is concomitant tocauses numerous environmental impacts such as depletion of resources, deterioration of quality of resources, risk of floods and erosions, habitat loss and fragmentation and reduction in net forest productivity of the forests. The rate of removal of forest products currently
56 | B h u t a n E n v i r o n m e n t O u t l o o k 2 0 1 3

exceeds the rate of replacement; hence, this is one reason ofcausing early exhaustion of forest stocks before the expiry of Management Plan and planned period. Realizing the annual allowable cut (ACC) by transferring the ACC of one Working Circle to another is an unsustainable way of achieving yield.
Ambiguity of surface arson occurrences Fire incidencedepends on numerous factors such as rainfall and humidity pattern, vegetation and forest types, micro-climate, agriculture practices, human intention, etc. Forest fires lead to significant decrease of the biological productivity of forest lands due to deterioration of the indigenous ecotopes and replacement of indigenous vegetation. It leads to irreversible change in the cryogenic regime of soils and rocks, irreversible loss of biodiversity including rare and threatened species of flora and fauna, and changes in living habitatsand migration patterns of birds, ground and aquatic animals. Water quality and catchment stability are also succumbed to obliterationdegraded due to frequent fires hazard and thus accounts also to the risk of erosion and flood. The Accumulative impacts on atmospheric processes,on aat the larger scale,contributewill lead to global climate change. Fire intensity is a notable factor influencing the composition of biomass smoke and thus affects human biological, cultural and infrastructural diversity (Fowler, 2003). Young children, the elderly, people with pre-existing conditions and smokers are particularly vulnerable to biomass smoke. Furthermore, smoky environments reduces visibility and the Environment Protection Agency (EPA) considers visibility as a matter of “pPublic wWelfare” (EPA, 1998).
ResponsesIn order to ensure sustainable use of land and its associated resources and to combat land from degradation, the country has adopted many policy objectives and measures. Some of the major responses that are being currently implemented currently are as follows:
Reforestation
Community fForestation
Sustainable fForest mManagement
Forest fire volunteers
National fForest iInventory (NFI)
Sustainable lLand mManagement iInterventions
Solid waste management
57 | B h u t a n E n v i r o n m e n t O u t l o o k 2 0 1 3

Environment fFriendly rRoad cConstruction
ReforestationOver the years, efforts were made to restock our forest to expand the forest cover and to enhance sustainability for perpetual era. Plantation was instigated as early as 1947 in Gelephu long before even establishment of the Department of Forestry.
Reforestation has been a regular and consistent effort of the Department of Forest and Park Services throughout all the five year plans. Decentralization of afforestation program took place in 2000 and since then Dzongkhagstake lead responsibility to carry put plantation in their respective areas. As of today, more than 23126.61 hectares (table 2.3)of areas are brought under afforestation and reforestation schemes by different agencies. (Forestry Facts, Figures & Trends2011). Considering annual averages of plantation and regeneration on an annual basis, about 691 ha/yrectares are regenerated, afforested and reforested annually.
Table 2.3: Reforestation in Bhutan. Source: SNC 2011
Five Year Plan Period Plantation Area(ha)Before 1st five year plan 8221st five year plan 9322nd five year plan 1,2783rd five year plan 3,5254th five year plan 1,7435th five year plan 2,1996th five year plan 4,4987th five year plan 2,5258th five year plan 1,9169th five year plan 2,078Total 21,516
58 | B h u t a n E n v i r o n m e n t O u t l o o k 2 0 1 3

Figure 2.14: Reforestation activity in Dakpai, Zhemgang(change picture)
Community ForestationForest management practices have taken undergonea paradigm shift from the conventional centralized approach to a participatory approach of community based management. The fundamental objective of the community afforestation program is to promote local community participation in the management of community forests as well as to sustainably harvest socio-economic benefits from the forests. Since the program’s its establishment sometime in the 1980s,a total of 345 community forests have beenwere established (in the country Ffigure 2.15)along withnd 627 private forests as of May 2011 (Forestry Facts, Figures & Trends2011).
Figure 2.15: With decentralization to community based management saw increasing trend in CFs over the years involving more households in managing the forests. (Source: Forestry Facts, Figures & Trends-2011, DoFPS)
59 | B h u t a n E n v i r o n m e n t O u t l o o k 2 0 1 3

Sustainable Forest ManagementSustainable forest management looks atinvolves a sustained approach towards harvesting the forest for wood. It includes a series of steps including building up an inventory of the potential harvest areas, assessment of demand and supply trends, and identification of ecological protection needs. Based on the initial studies appropriate management plans are made for harvesting the forest. Areas of each management plan is arecalled as Forest Management Units (FMUs) and are required to operate within the annual allowable cut (AAC) without disturbing the ecological balance (Bhutan Environment Outlook, 2008).
To cater to the need of ever escalating timber demand for commercial and rural purposes and without degrading forest resources and diminishing future productivity, the Department of Forests and Park Services (DoFPS) has been planning and implementing forest harvesting operations based on the principles of sScience and sSustainability. With 17 operational Forest Management Units (FMUs) and 5 Working Schemes (WS), the potential Annual Allowable CutAAC (AAC) prescribed is 94,625.9 m3
(Monitoring and Implementation Services Section2012). A total of 12, 8821.16 haectares of forest area are covered by operational FMUs where yearly extraction of timber for commercial purpose takes place. Another 2 FMUs and 6 Working Schemes are in the cue of planningproposed in the 11th Five Year Plan, . Further number ofwith further pPlansis at various stages of inventory and revision.
The main management plan for harvesting forest resources is prepared by erstwhile the Forest Resources Management Division (FRMD), whileNatural Resources Development Corporation Limited (NRDCL) carries yout the logging and extraction activitiesmonitored by respective Territorial Divisions to assure compliance with Management Plans. To ensure sustainability of yields for perpetuity, the volume of timber harvested each year must not exceed the volume of increment. Thus, sSilviculture practices which are compatible with sustainability must be prescribed in management plans. Environment protection practices compatible with sustainable forest management must be prioritized such as taking care of hydrological functions in the managed forests.
Forest Fire VolunteerThe Forest fire Volunteers’ Programme was initiated in March, 2008 with the objective to harness support as much possible from public and ardent individuals to suppress fire incidences in and around Thimphu. It helps in thepublic at the forest-urban interface to be more wary about fire incidences in the dry season via variousthroughpublic awareness programs to the public residing at the forest urban interface. About 370 individuals are registered with this programme comprising about 70% civil servants and
60 | B h u t a n E n v i r o n m e n t O u t l o o k 2 0 1 3

40% of participants are women participation. In addition, forest personnel are actively involved throughout the fire prone season and remain available as and whenevera fire the incidentces occurs.
Certain responseive measures which are effective in some other parts of the world can be epitome and taken as examples for our scenarioimplementation in Bhutan provided the resources and financial stake remains stable. For example in the USA, a Burn Area Emergency Rehabilitation (BAER) program includes treatments to prevent or reduce sedimentation of water sources in areas affected by wildfires (Fowler, 2003).
National Forest Inventory (NFI)The Department of Forests and Park Services is in the process of carrying out NFI to take stock of the country’s forest resources. Bhutan’s commitment to remain Carbon neutral has prompted a need to have baseline data on forest resources such as standing carbon stock which play an important role in sequestering Carbon. Further, NFI is expected to generate wealth of data such as number of trees per hectare, basal area per hectare, volume per hectare, growing stock, biomass, carbon stock, growth increment, canopy assessment, species diversity and distribution and classification of forest types that willould enable development of sound forest policies in the face of climate change, sustainability and other global issues such as number of trees per hectare, basal area per hectare, volume per hectare, growing stock, biomass, carbon stock, growth increment, canopy assessment, species diversity and distribution and classification of forest types of Bhutan.
Sustainable Land Management InterventionsThe sSustainable land management campaign launched by MoAF in July 2005 was intended to provide awareness on-the-ground and convey site-specific land management techniques to local people to battle against the land degradation issues which are pertinent in Bhutan. The cCampaign has been embarked upon as a continuous programme to instill in people the awareness and understanding of various land management techniques based on site-specific land degradation problems. It focuses on on-the-ground demonstrations using a broad-based participatory approach bringing together local communities,;dzongkhag staff,as well asand professionals from various disciplines (Bhutan Environment Outlook, 2008). Mass media like television and information brochures are developed on sustainable land management practices to supplement on-the-ground demonstrations.
The area of demonstration sites established by the Land Management Campaign initially in 2005 was 46.5 ha and has increased to 158 ha by 2011 (National Soil Service Center, 2011).
61 | B h u t a n E n v i r o n m e n t O u t l o o k 2 0 1 3

Solid Waste ManagementBhutan is facing rapid urbanization like any other developing country with more than 30% of the population living in the urban centers (SherubPhuntsho et al., 2007). The average population growth rate in urban centers of Bhutan is estimated to be 7.3% with the maximum in Thimphu at a rate of 11% (MoWHS 2007). Due to the absence of adequate municipal facilities and solid waste management measures in urban centers, garbage and related health problems are emergingent in rapidly growing cities like Thimphu and Phuentsholing (RSPN 2006, UNEP 2001). In addressing the emerging environmental concern of waste problem, the royal Ggovernment of Bhutan has formulated the Waste Prevention and Management Act (WPMA) of Bhutan, 2009 and itsassociated Regulation 2012.
Currently,there are 12 urban centers with havesome form of waste management system (Bhutan Environment Outlook, 2008). However the waste management system is limited to collection of waste from various locations to and disposal in uncontrolled garbage dumpsites. Segregation of waste exists only in informally stage where scavengers and scrap dealers pick waste like plastic bottles, cardboardx, scrap metals and other recyclablesfuses that can be sold across the border and to iron industries within Bhutan.
In terms of sewerage treatment, according to the Annual Information Bulletin of MoWHS 2009, and (personal communication with Mr. Samten, Head Sewerage Section TCC, 2012) 100%of households in the core area of Thimphu is are connected to the existing Babesa Sewage Treatment Plant and aandditional 35% of household in extended areas are also covered. However, in Phuentsholingonly 90% of households in the old municipal boundary is are connected to sewerage system.
Environment Friendly Road Construction (EFRC)Considering the geologically fragile and rugged mountain terrain of the country, the Department of Roads (DoR) has adopted “Environment Friendly Road Construction” (EFRC) as a key programmestrategy for sustainable development of roads (Bhutan Environment Outlook 2008).In the later stage of year 1999, DoRepartment of Roads requestedtheSNV to support the implementation of the 122 km of feeder road under the Rural Access Project (RAP) funded by World Bank (SNV, 2008). The concept of EFRC was initialized by Bhutan under this projectthen. EFRC design is fundamental to the existing environmental laws andActs, policies in place which aims to minimize environmental destruction. For example, EFRC design looks at minimization of cuts on hillsides. At the face of fragile slopes part of the road width is made in fill, by constructing retaining walls. Box cut designs are avoided as much as possible. The
62 | B h u t a n E n v i r o n m e n t O u t l o o k 2 0 1 3

cutting of trees is kept to a minimum and limited to within the road corridor. Excavators are used instead of a bulldozer, which allows transportation of debris to selected disposal sites and finally selected vegetation is used for protection and stabilization of the slopes (SNV). Although, cost of construction using EFRC is 35% (SNV) more than regular construction, it is well compensated by the eight years of operation due towith low maintenance costs(SNV, 2008).
Figure 2.16: Ula Farm Road in Wangduephodrang. Construction of the road at high gradient cliffs led to land slide 100m below the road (Source: Kuensel Issue October 2, 2012Change picture)
EFRC design and implementation was done on Dakpai-Buli farm road covering 36.5 km and Lhuentse-Dungkhar with a road stretch of 39.78 km. In addition, EFRC techniques were also used for theYadi-Shershone 7.22 km road alignment (Draft Safeguard Diagnostic Report, 2006).
63 | B h u t a n E n v i r o n m e n t O u t l o o k 2 0 1 3

3. WaterEnvironmentWater resources are an essential component of the earth’s hydrosphere and an indispensable part of the terrestrial ecosystem. Water is needed in all aspects of life. The presence of a safe and reliable source of water is an essential prerequisite for social well-being and economic productivity.Being mountainous and landlocked, Bhutan’s water resources are mainly in the form of rivers. There are four major river basins, viz. the AmoChhu (Toorsa), the Wang Chhu (Raidak), the PunatsangChhu (Sunkosh) and the DrangmeChhu (Manas) (Figure 1), all of which drains into the Indian plains. NyeraAmaChhu,JomotshangkhaChhu and ShaarChhu form smaller river basins. All the rivers originate within the country except three rivers viz. AmoChhu, Gongri and KuriChhu all of which originate in the southern part of the Tibetan Plateau.
With an abundance of rainfall and the river systems protected by forests and fed by the many glaciers, Bhutan has the one of the world’s highest per capita availability of water as highlighted below:
Long-term mean annual flow of the entire country is estimated to be 73,000 million m3;
Per capita mean annual flow availability is estimated at 109,000 m3; Per capita minimum flow availability is estimated at 20,000 m3 (Bhutan
Environment Outlook, 2008).
Figure 3.1: Major river systems in Bhutan
64 | B h u t a n E n v i r o n m e n t O u t l o o k 2 0 1 3

DriversThe key drivers that cause pressure on the water environment include population growth, rapid economic and social development, and climate change.:
Population growthPHuman population growth is a major threat to the environment, as . Eeach person requires energy, space and resources to survive, in a resource constrained worldwhich results in economic losses.
PThe population growth together with industrialization and urbanization will is resulting in an increasing demand for water which will have serious consequences on the environment. Population growth will have exacerbating impact onlead to increased water consumption and cause water stress or scarcity. Because of the growing population, water demand by agriculture is also expected to increase due to production intensification to keep pace with increasing food demand. Increased water demand and use not only reduces the amount available for agriculture and industrial and hydropower use but has a major impact on aquatic biodiversity.
Economic and Social DevelopmentThe demand for domestic water supply is increasing due to Bhutan’s changing lifestyle caused by rapid socio-economic development.TBecause of it, the stress on water resources has increased as more quantity of water is required for daily use and people being are able to afford to pay for more water usage. RBesides that, rapid urbanization as a result of economic and social development is taking place which has serious impacts both on water demand in terms of quantity required and the associated pollution that impairs water quality. In Bhutan, increased demands from hydropower and industrial developmentes have been emerging and must be accommodated.
Climate ChangeClimate change has a deep effect on the environment, especially on the quality and availability of water resources. The costs of climate change are significant. Water-related natural disasters, such as floods, droughts, and landslides, are becoming more common and more severe. Rising temperatures, causing increased evaporation and glacial melt causing glacial lake outburst floods (GLOFs), are reducing the reliability and quality of water supplies, . Tthereby, adding amajor increased pressure to oncountries that are already confronting the issue of sustainable freshwater use. Today,In recent years the weather has become more unpredictable and erratic, snow is melting rapidly and water sources are drying up causing major impacts to the country.
65 | B h u t a n E n v i r o n m e n t O u t l o o k 2 0 1 3

Pressure
Increase in WwaterCconsumption and DdemandWater users in Bhutan draw water from three distinctly different sources of groups as described below:
a) The main rivers of Bhutan provide water for major hydropower use, tourism/ recreational and aquatic ecology with only exceptional use in other sectors.
b) Tributaries, rivers and streams provide sources for all other water uses in Bhutan with emphasis on irrigation and water supply from headwater streams.
c) Sub-surface sources in the form of springs and aquifers provide water for domestic water supply and small scale irrigation.
The steep topography of the country provides unique opportunities for gravity supply of water for irrigation and domestic uses. The exploration and development of groundwater resources is still at its rudimentary stage. Deep underground water in Bhutan is virtually unused except for some places in the southern belts where domestic drinking water is tapped through tube wells. Infiltration facilities in alluvial deposits of river valleys do supply drinking water to some areas. It can be assumed that groundwater potential could provide an alternative source for domestic consumption, small scale irrigation and industrial uses in future.
The proportion of the population with access to safe drinking water increased from 69% in 2008 to 94% in 2011 with improvements particularly noticeable in rural areas.Currently, 88% of the rural population and 98% of urban population in the country now haves access to piped drinking water supply (PHCB, 2005). The MDG target of reducing those without access to safe drinking water by half by 2015 has thus already been achieved (MDG progress report, 2005). However, the sustainability of the urban water supply system and functionality of existing rural water supply schemes is remainsone of the main challenges. Analysis of the comprehensive rural water supply scheme (RWSS) inventory report in 2009 revealed that 31% of the rural schemes are non-functional due to various factors.
Sources for drinking water are mainly from streams/rivers, protected springs and alternatively from rainwater. Water from these sources is of good physico-chemical and biological quality which could be directly tapped for drinking purposes with minimal treatment. Despite the availability of surface water sources in abundance at national level, there are localized water shortages. Further, while there is lack of information on the yield of spring sources, anecdotally many springs are said to be drying up.
66 | B h u t a n E n v i r o n m e n t O u t l o o k 2 0 1 3
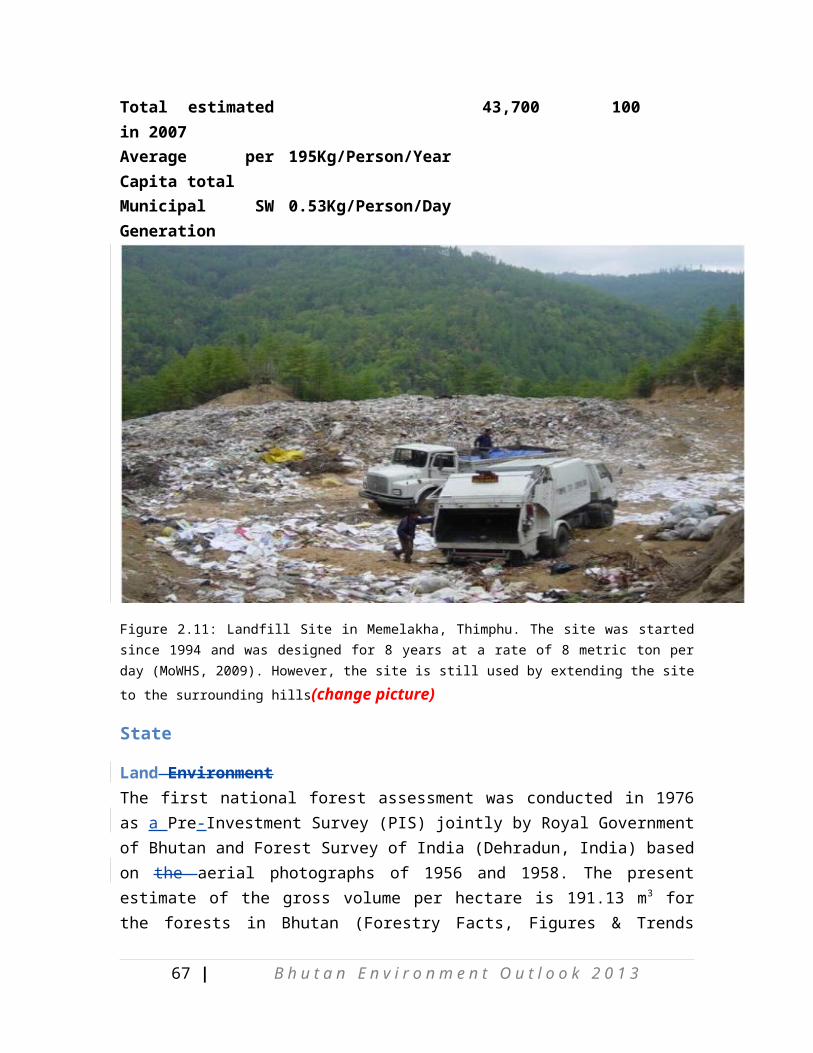
WThe water demand projection is focused on the consumptive use of surface sources. For the purposes of analysis the users have been categorized into irrigation, municipal, rural and large industries. Municipal use comprises the requirement for domestic, institutional, commercial, Government and public uses, as well as small cottage industries that are supplied through the Municipal system.
Table 3.1: Worst case gross national consumptive and non-consumptive water demand
Demand Category2002(million m3/year)
2012(million m3/year)
2022(million m3/year)
Municipal Demand 10 19 37
Irrigation Demand 393 472 472
Rural Demand 11 15 20
Industrial Demand 0.6 0.9 1.5
Livestock Demand 7.5 8.8 10.2
Sum of maximum consumptive demand
Sum of water supply (excluding irrigation) demands
422
29.1
516
43.7
541
68.7
Add-on irrigation demand 15 - 26
Non-consumptive hydropower demand 6,700 16,600 26,900
Source: Final Water Resources Management Plan (WRMP) report, 2003.
Table 3.1 shows a detailed water demand forecastfor both consumptive and non-consumptive by different sectors. The exercise carried out by the Department of Energy had estimated 422 million m3 of gross consumptive demand in 2002 and forecasted this demand to grow to 516 million m3 by 2012 and to 541 million m3 by 2022 (Bhutan Environment Outlook, 2008).
67 | B h u t a n E n v i r o n m e n t O u t l o o k 2 0 1 3

0
5,000
10,000
15,000
20,000
25,000
30,000
2002 2012 2022
mill
ion
cubi
c m
eter
s
Figure 3.2: Non consumptive demand for hydropower. Figure 3.3:Consumptive Water Demand, 2002and Projections
Non-consumptive water demand exists in the form of hydropower demand. The hydropower demand has been estimated at 6,700 million m3 for 2002, and is forecasted to grow exponentially to 26,900 million m3 by 2022 (Bhutan Environment Outlook, 2008) keeping in view the GovernmentRoyal Bhutan’s plan to have an installed capacity of 10,000 MW by 2020 (Bhutan Sustainable Hydropower Development Policy, 2008).
The result of the awater balance assessment carried out by Norconsultindicates that at the national level there is a large surplus of available and firm flow in the main north/south rivers. The Gross National Water Balance extracted from WRMP report is given below, which illustrates that Bhutan does not have an overall annual water balance problem on a national scale.
Table 3.2: Gross National Water Balance. (Source WRMP 2003)
Water Balance Indicator 2002 2012 2022
Sum of maximum total consumptive annual demand for all sectors as % of mean annual runoff
0.58% 0.70% 0.74%
Sum of maximum total consumptive annual demand for all sectors as % of minimum 7-day flows with 10 year recurrence
3.20% 3.80% 4.00%
Sum of maximum water supply (excluding irrigation) demands as % of minimum 7-day flow with 10 year recurrence
0.22% 0.33% 0.51%
Although water balance issues are not critical on a national scale in Bhutan, the picture may be different as one moveattention shifts to sub-basin levels or further down into smaller sub-catchments with heavy population concentrations. Considering that the main consumptive use of water for irrigation and drinking are extracted from the tributaries and all major rivers of Bhutan are at valley bottoms, the water balance study
68 | B h u t a n E n v i r o n m e n t O u t l o o k 2 0 1 3
Mun
icip
al D
eman
d
Rur
al D
eman
d
Irrig
atio
n D
eman
d
Indu
stria
l Dem
and
Live
stoc
k D
eman
d
0
50
100
150
200
250
300
350
400
450
500
2002 2012 2022
mill
ion
m3

needs to focus beyond sub-basins into smaller catchments and sub-catchment levels to fully understand the water balance status.
It is estimated that Bhutan has hydropower potential of 30,000.00 MW out of which 23,760 MW has been identified and assessed to be technically feasible.As the Ggovernment of Bhutan is embarking on accelerated development of 10,000 MW of hydropower projects by 2020, demand for water for hydropower may further increase in the country.
Table 3.3: Status of Hydroelectric Projects under 10,000 MW Development Plan
Sl.# Hydroelectric project Installed capacity (MW)
Date of Construction Remarks
1 Punatsangchhu-I 1,200 Under construction DPR completed2 Punatsangchhu-II 900 2010 DPR completed3 Mangdechhu 720 2010 DPR completed4 SunkoshRreservoir 2,585 2011 September 20105 Kuri-Gongri 1,800 2012 December20116 Wangchhu 600 2012 December 20117 Bunakha Reservoir 180 2012 March 20118 Kholongchhu 600 2012 June 20119 Chamkharchhu-I 670 2012 December 201110 AmochhuRreservoir 620 2012 September 2011
Source: Department of Energy, MOEA
SolidWwaste Ggeneration and DdisposalSignificant increases in solid waste, and increase in wastewater and sewage generated by residents and industriesal states; , along with disposal of building materials, domestic waste and packaging and increased in organic wastes is an are important issues in maintaining water quality.The improper disposal of municipal waste has a serious and dangerous impact on a wide range of areas. Garbage thrown in the street or in open spaces creates a public health hazard, while waste dumped near the rivers, lakes and streams contaminates the water supply. Rubbish that is burned in the open rather than disposed of properly creates pollution and releases toxic fumes into the environment. Non-biodegradable materials thrown into open drains make their way into the sewerage system, clogging pipelines and damaging infrastructure. The referral hospital in Thimphu produces around 20-30 kilograms (kgKG) of infectious medical waste and around 10 kgKG of other waste materials, mostly comprising broken glasses, every day(Bhutan Observer, February 05, 2012). The hazards posed by the dumping of untreated hospital and industrial waste are even greater, with the release of pathogens
69 | B h u t a n E n v i r o n m e n t O u t l o o k 2 0 1 3

and toxic compounds posing a grave threat not just to human life but also to plants and animals.
One of the main problems thatThimphu city currently faces is the problem of solid wastes management from due toincreases in the collection and transportation costs, the shortage of alternative landfill sites and the risk of water and soil pollution with leachate from the existing landfill site. The current waste management system is limited to disposal of waste at the present landfill site located atMemelakha and there is an urgent need to secure a new site to develop and construct the asanitary landfill site for waste disposal. The existing uncontrolled Memelakha landfill site hasd been used for 18 years. At present, there are no proper systems and structures to prevent the leachate exuding from the existing landfill site at Memelakha and it is directly observed into the natural groundsin surrounding areas.With the increasing dumping of waste adding to the already exhausted lifespan of the landfill, leachate from the landfill is seen overflowing and spilled all over the existing high ways and roads as seen in Ffigure xxxx.As an interim measure, the Thimphucity plans to divert the flow of leachate to the atemporary pond which will be pumped back to the dumping site and will be treated using the suction tanker.
Challenges of Wwater Ssupply and Mmanagement InstitutionsThe existing water user institutions have weak functional linkages at policy, planning and programming levels. The different sub-sectors have been performing their respective responsibilities independent of each other. This has resulted in fragmented data, duplication of efforts and a poor resources management system.
Encroachment of Wwatershed AareasThe cost of watershed conservation is high. On the other hand, the effective management of watersheds is imperative to forwater resources conservation and its sustainable utilization. Due to the fast pace of socio-economic development, there is tremendous pressure on the Bhutan’swatersheds. Although harvesting of forest produce is based on sustainable management plans, the increasing demand for timber, firewood and non-timber forest products, is starting to have negative impacts on the somewatersheds.Forestland encroachment and forest fires have become serious challenges for watershed conservation. Further, the degradation of natural resources is considered to be the greatest constraint to environmental conservation and sustainable development. Land degradation and deforestation creates significant changes in the hydrological function of watersheds which lead to more frequent downstream floodingmore frequently, with subsequent increases in loss of life and damages to infrastructures and properties. Accelerated erosion, produced by changes in the biotic
70 | B h u t a n E n v i r o n m e n t O u t l o o k 2 0 1 3

and hydrological components of natural watersheds has created unprecedented large scale siltation of productive low lands (A roadmap for watershed management in Bhutan 2011).
Increased Rrunoff from Uurban AareasIn urban areas, the impervious surfaces created by buildings and pavements cause rainwater to flow quickly over the landscape, rather than soaking naturally into the soil or being absorbed by plants. This can change stream flows, increase flooding, endanger private and public infrastructure, erode stream banks and channels, and destroy fish habitat. Runoff also carries pollutants such as oil, heavy metals, bacteria, sediment, pesticides and fertilizers into streams or groundwater. The water flowing through storm drains is untreated and therefore carries pollutants into local waterways. This problem becomes worse with population growth and urbanization because such activities alter natural water processes.
Deterioration of Wwater SsourcesIt is particularly important to protect the watersheds providing drinking water and surface water sources that are used for water supply. Although Bhutan has not experienced severe water shortages in the past, reports of dwindling water sources are increasing.The issue of water shortages and the sources drying up affecting the various parts of the country is a major concern. The issue was raised by representatives of almost all Dzongkhagsduring the mid-term review consultation of the 10th Five Year Plan (March-May 2011), and reported the problem of acute water shortages for drinking and attributed increasing fallowing of agricultural land in the rural communities to the drying of water sources (Second National Communication 2011). Further, surveys of local perceptions have reported that people have observed winter flows to be lower than normal in the past 10-20 years (Second National Communication 2011).
Another important aspect is water quality. It is important to monitor the quality of groundwater in view of the potential future role of groundwater as water supply source and co-ordinate with the general surface water quality monitoring. Introduction of clean technologies for industrial production should be promoted to maintain the quality of water.
State
Water RresourcesThe country’s physical feature of high rugged mountains, glaciers and moraines etc., monsoon dominated climate and vast forest cover has given rise to many river systems in Bhutanwith numerous tributaries streams and natural lakes.These river systems can
71 | B h u t a n E n v i r o n m e n t O u t l o o k 2 0 1 3
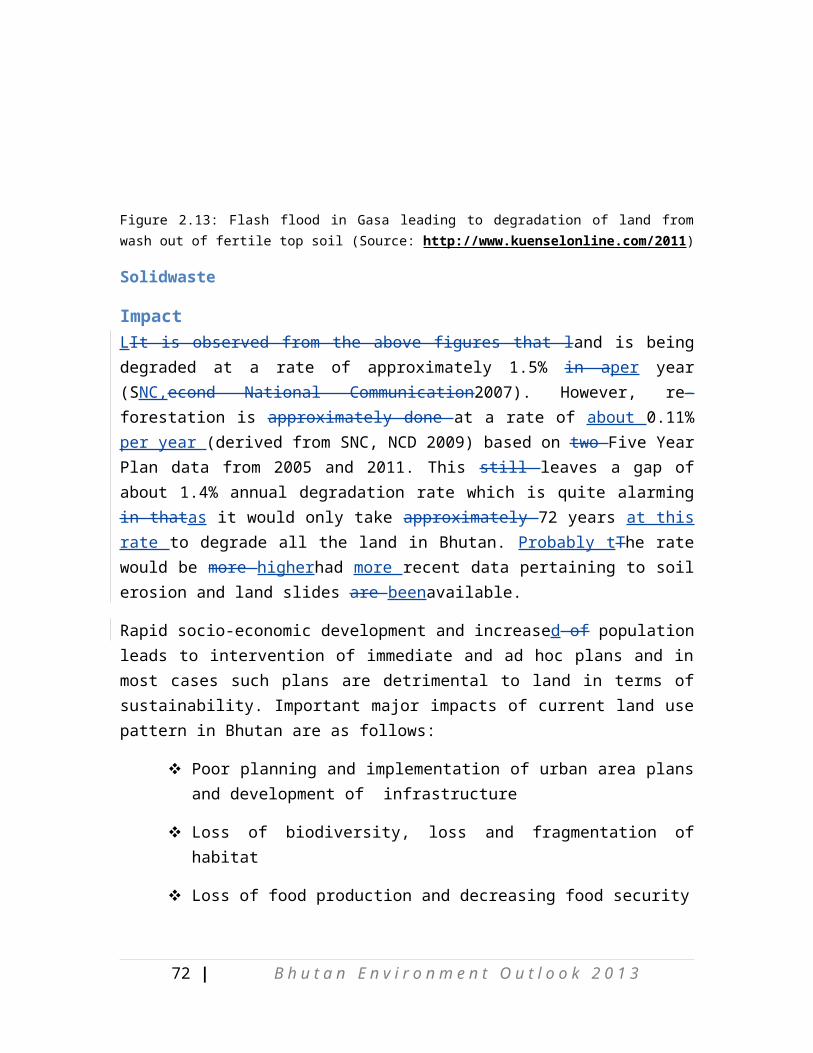
be divided into four major rivers the AmoChhu (Toorsa), the Wang Chhu (Raidak), the PunatsangChhu (Sunkosh) and the DrangmeChhu (Manas) all draining into the Brahmaputra River in India. NyeraAma Chu, JomotshangkhaChhu and ShaarChhu form smaller river basins. All the river systems originate within the country except three rivers viz. AmoChhu, Gongri and KuriChhu all of which originate in the southern part of the Tibetan Plateau.(refer figure 3.1: major river systems of Bhtuan)
Table 3.4: River Systems of Bhutan and Mean Annual Flow
River System Basin Area (km2) Mean Annual Flow (m3/sec)AmoChhu Sub-basin 2,400 161 (at Dorokha bridge)Wang Chhu Sub-basin 4,689 102 (at Chimakothi dam)
71 (at Tamchhu)Samtse Area Multi-river 962 -PunatsangChhu Sub-basin 10,355 291 (at Wangdue Rapids)
411 (at Dubani)538 (at Kerabani)
Gelegphu Area Multi-river 1,956 -MangdeChhu Sub-basin 4,095 68.4 (at Bjizam, Trongsa)
113 (at Refe)148 (at Tingtibi)
ChamkharChhu Sub-basin 3,297 54.1 (at Kurje)KuriChhu Sub-basin 4,000 297 (at Kurizampa)DangmeChhu Sub-basin 5,207 870 (at Panbang)SamdrupJongkhar Area Multi-river
2,279 -
Shinkhar-Lauri Multi-river 779 -Source: Water Resources Management Plan, Department of Energy, 2003
Water is of vital importance to the economy and people of Bhutan. Water has always been vital to agriculture but with economic growth, other sectors, mainly hydropower, industry and tourism are leaning more heavily on water resources. While the rivers provide potential for hydropower, the main rivers are generally at the bottom of deep valleys, so irrigated agriculture is limited to areas adjacent to small perennial streams above the main rivers (Second National Communication, 2011).
On a macro-scale, the per capita availability of water is very high with 109,000 m3for mean annual flow, 20,000 m3 for minimum flow, and the long-term annual flow of the entire countryis estimated to be 73,000 million m3 (Bhutan Environment Outlook, 2008). However, this provides a false sense of water security as the major sources for drinking and irrigation are mainly from local springs, streams and minor east-west tributaries. The main rivers are generally located at the bottom of valleys or deep gorges and
72 | B h u t a n E n v i r o n m e n t O u t l o o k 2 0 1 3

ravines where accessibility remains an engineeringdaunting challenge. Water flow measuring stations are also located only on main rivers for hydropower planning purposes and measurements do not exist for the smaller springs, streams and tributaries on which the majority of population depends (Second National Communication, 2011).
Water PollutionDomestic sewage is the main source of water pollution. The liquid and solid wastes from all types of farming, including runoff from pesticides, fertilizers and feedlots,; erosion and dust from plowing, animal manure and carcasses and crop residues and debris also causes water pollution.
In addition, imbalanced regional development and concentration of offices in one area has lead to a surge in motor vehicle numbers and automobile workshops especially in places like Thimphu and Phuentsholing. Inappropriate disposal of waste oil and other vehicle effluentsand illegal wastewater dumping are significant sources of water pollution and environmental concern considering the fact that all most all of these workshops are located by the riverside. According to the record of licenses issued by MoEA, currently, there are 133 vehicle workshops out of which 67 automobile workshops are in Thimphu.
The major environmental issue due to the operation of the workshops in Olakha is the water pollution resulting from the discharge of wastewater containing used oil and grease. Since September 2010 Thimphu City Corporation has initiated and installed the an oil separation tank as a pilot project. The most important issue that came up in the operation of the oil-water separator during summer was heavy siltation as shown in theFfigure 3.4xxx. Therefore, the city plans to install few additional tanks upstream during the 2012 winter to accumulate all the wastewater and to increase the efficiency of the silt removal from wastewater during the monsoon season (Thimphu City Corporation, 2012).At present, the oil separation tank is cleaned manually on a weekly basis by the City Corporation and has collected over one and half barrels(Bitumen drums) of waste oil.
There isare, however, no data on the volume of domestic sewage and industrial discharges at present.
73 | B h u t a n E n v i r o n m e n t O u t l o o k 2 0 1 3
Figure 3.4: Improper disposal of waste oil and other vehicular effluents affect local water sources (Photo@ G.KChhopel)
Figure 3.5: sedimentation of sand from the car wash and manually clearing of tanks.
Water Quality and Biological Oxygen DemandLevelsBhutan’s water resources at the moment are in a very good state except for a few areas,especially in major urban centers like Thimphu and Phuentsholing from localized water pollution. The main pollutants are surface drainage, grey water sullage from domestic households and uncontrolled seepage or overflow from septic tanks and pipes entering into water courses (Bhutan Environment Outlook, 2008).
The periodic water quality monitoring of major river basins conducted by the NEC Secretariat showed no significant changes in the trend of water quality. However, fast population growth, rapid socio-economic development and infrastructure development like construction of farm roads, forest degradation in upstream areas are an emergingent concern and threat to existing water quality.
Biochemical Oxygen Demand (BOD) refers to the amount of oxygen that would be consumed if all the organics in one liter of water were oxidized by bacteria and protozoa (ReVelle and ReVelle, 1988). Both natural and anthropogenic wastes such as dead plants, leaf falls, manure, sewage, or even food waste present in a water body are decomposed by microorganisms such as bacteria. When aerobic bacteria breaks down this waste, much of available dissolved oxygen (DO) in the water are is consumed by the bacteriait, robbing the oxygen required by other aquatic organisms. The level of BOD is directly impacted by the quantity of organic waste present in the water and the bacteria working on it to decompose it.
74 | B h u t a n E n v i r o n m e n t O u t l o o k 2 0 1 3

In Bhutan, the analysis of Biological Oxygen Demand (BOD) was carried out for the first time in 2012 for Cheri Chhu (upstream of Wangchhu), Wangchhu, Drey Chhu (stream flowing through Dechenphu and tributrary of Wang Chhu) and Babesa Sewage Treatment Plant in Thimphu due to lack of data and past reports for reference. Thewastewater status was determined by comparing against the National Environmental Discharge Standard of September 2010. According to Ambient Water Quality Criteria (Cheri, Wangchu and Drechu) for various uses, almost all the data are within the permissible limit falling within Very Good quality (Table xxx). However, Babesa Sewage Treatment Plant has exceededwas more than four times higher than the sStandard for final effluent from Sewerage Treatment Plant (Maximum permissible limit 30mg/L) (figure 3.5).
Table 3.5 Biological Oxygen Demand (BOD mg/L) Table 3.6: BOD Level indicators source:inThimphu (August 2012)
http://www.polyseed.com/misc/BODforwebsite.pdf
75 | B h u t a n E n v i r o n m e n t O u t l o o k 2 0 1 3
Sl.No Site name BOD level (mg/L)
1 Cheri Chhu, Thimphu 1.0082 Wang Chhu upstream,
Thimphu0.144
3 Wang Chhu downstream, Thimphu
1.296
4 Babesa Sewage Treatment Plant
135.22
5 Dreychhu upstream 0.96 DreyChhu middle stream 1.37 DreyChhu downstream 2
BOD Level (in ppm)
Water Quality
1 - 2 Very Good There will not be much organic waste present in the water supply.
3 - 5 Fair: Moderately Clean6 - 9 Poor: Somewhat
Polluted Usually indicates organic matter is present and bacteria are decomposingthis waste.
100 or greater Very Poor: Very Polluted Contains organic waste.

Figure 3.5: BOD levels for most Thimphu rivers and streams
Localized Sscarcity forDdrinking wWater and AagricultureAlthough, the country is endowed with vast water resources, localized and seasonal water shortages for drinking and agriculture are faced by the people in certain parts of the country. Several stories on dwindling water resources and localized problems are reported in media (Box 3.1) and attribute the phenomena as one of the main causes of rural–urban migration.
There is uneven spatial distribution of precipitation, increasing sediment loads in the rivers and wide variation between lean season and monsoon flows. Furthermore, the pressure on water resources is gradually increasing as a result of competing demands from various sectors. Floods and landslides accentuate the problem of water resources management.
The per capita consumptive water demand is 422 million m3 as per 2002 estimate. With the increasing population the pressure for the water resources is expected to grow exponentially.
Global Wwarming and Gglacial RretreatBecause of the extreme topography and complex reactions to the greenhouse effect, even high resolution climatic models cannot give reliable projections of climate change in the Himalayas. Various studies suggest that warming in the Himalayas has
76 | B h u t a n E n v i r o n m e n t O u t l o o k 2 0 1 3
Box 3.1A shortage, but not for lack (kuenslonline.com, August 28 2012)It is an irony that the rainy season disrupts source and supply Dechelinggewog in Nganglam, Pemagatshel, faces acute water shortage, not because there is no water source in the area, but because one they had is destroyed, and is too far to be repaired.DechelingmangmiUgyenThinley said in 2007, a water source at Dotar, about 18km from the village, was identified to draw water from, but wild animals, like elephants and bears, destroyed it, especially during monsoon.“But the source is very far and we can’t go to repair it every time it’s destroyed,” he said, adding, even if they attempted to go to the site, the route was too steep and risky during monsoons.“There are chances of encounters with wild animals too,” he said, adding of the six chiwogs in the gewog, the water shortage problem was severe in three.When the Dotar source proved futile, villagers of some 180 households started carrying water from a pond, about 2km away. But that too posed a lot of problems.Later, about 85 households of Bapta, Martsala and Gonpawoong contributed Nu 3,000 each, built a water reservoir some half an hour away, bought pipes and received water for certain hours a day.However, about 100 other households continued fetching water from the pond. They also sought recourse to rain water during monsoon for laundry and toilet purposes.Meanwhile, DechelinggupSonamRinchen said gewog officials have plans to propose a fund to build a dam along the stream running down past a village, which, at the moment, was polluted by animals at source.“If this is possible, we can solve water problem of this gewog to a large extent,” he said.Some 30 acres of wetland in the gewog have also been left uncultivated because of water shortage.

been much greater than the global average of 0.74°C over the last 100 years (IPCC, 2007a). Warming will be significant in arid regions of Asia and the Himalayan highlands, including the Tibetan Plateau (Gao et al., 2003; Yao et al., 2006). Warming in Nepal and on the Tibetan Plateau has been progressively greater with elevation (Figure 3.6).
Figure 3.6: Dependence of warming on elevation on the Tibetan Plateau.
Based on regional climate models, it is predicted that the temperatures in the Indian sub-continent will rise between 3.5 and 5.5ºC by 2100, and on the Tibetan Plateau by 2.5ºC by 2050 and 5ºC by 2100 (Kumar et al., 2006). The downscaled climate change scenarios prepared in PRECIS (NEC/START-SEA, 2011) piloted by two GCMs, namely the German ECHAM5 A1B and the British HadCM3Q0 A1 also predicts +3°C by 2050 (less than 0.1o C/decade) (Second National Communication, 2011).
For a high mountainous country like Bhutan, which is a home to 677 glaciers and 2,674 glacial lakes (Second National Communication, 2011), such prediction and findings is very alarming for a country identified as prone to dangerous GLOFs (glacial lake outburst floods) (Watanabe and Rothacher, 1996). In addition to increasing risk of GLOFs, rising temperatureshaves been accounted attributed tofordrying up of water sources and lakes by people.
In Bhutan, Danglingtsho, a high altitude lake situated at 3,420m above sea level amidst chirpine and rhododendron forests was reported to be drying out and believes the cause to bepossibly because of the impacts of climate change (Box 3.2).
77 | B h u t a n E n v i r o n m e n t O u t l o o k 2 0 1 3
Figure 3.7: A monk makes an offering to Mem Dangling at the Danglingtsho (Kuensel July 19, 2012)
Glaciers in Bhutan have been retreating at 30–40 m per year for dDebris-covered glaciers and 8–10 m/year for dDebris-free glaciers (Second National Communication, 2011). The greatest amount of glacier retreat occurs during the warmer month when a combination of increased temperature and rainfall leads to loss of glacier mass balance (Second National Communication,2011). The future projected changes in glacier retreat estimated for Luana (area of active GLOF events) based on warm season temperature changes alone suggest increased risk of GLOFs.;Ttemperatures in the area are projected to increase by 0.49oC to 1.23oC for 2010–2039 period and by 1.34oC to 2.88oC for 2040–2069 period. These temperatures changes would lead to glacier retreat rates of 78.2 m to 168.0 m for the period 2010-2039 for debris covered glaciers and of 20.1 m to 43.2 m for the period 2040-2069 for debris free glaciers. Based on the trends in GLOF events in Nepal, Bhutan and Tibet (Richardson and Reynolds, 2000) this retreat would translate into more frequent GLOF events by 2010-2039 and even more frequent by 2040-2069 (Second National Communication, 2011).
78 | B h u t a n E n v i r o n m e n t O u t l o o k 2 0 1 3

In addition, the climate change models also predict moderate increases in precipitation (Second National Communication, 2011). The combined influences of increasing temperature and rainfall would therefore accelerate the melting of Himalayan glaciers near and within northern Bhutan and this would very likely lead to an increase in the frequency and intensity of GLOF events (Second National Communication, 2011).
Glacial Lake Outburst FloodsHimalayan glaciers are receding faster today than the world average (Dyurgerov and Meier, 2005) (Figure 10). The IPCC Fourth Assessment Report (IPCC 2007a; 2007b) states that there is a high measure of confidence that in the coming decades many glaciers in the region will retreat, while smaller glaciers may disappear altogether. Various attempts to model changes in the ice cover and discharge of glacial melt have been made by assuming different climate change scenarios. One concludes that with a 2ºC increase by 2050, 35% of the present glaciers will disappear and runoff will increase, peaking between 2030 and 2050 (Qin, 2002).Figure 3.8: Rapid retreat of greater Himalayan glaciers in comparison to the global average.
Glaciers in Bhutan Himalaya are less well studied than those in other countries; however there are issome evidences that the glaciers in Bhutan are also retreating (Karma et al.,
2003). Debris free or ‘clean’ glaciers (C-type) are considered more sensitive to climate change than debris covered (D-type) ones. Karma et al. (2003) examined terminus variation for 103 debris-free glaciers in the Bhutan Himalaya over a period of 30 years
79 | B h u t a n E n v i r o n m e n t O u t l o o k 2 0 1 3
Box 3.2“The past two years were not a happy time for people of Khaling and monks of Trashigangdratshang who hike four hours uphill every year to make offerings to Mem (old man) Dangling, the protective deity of Khaling. With Mem Dangling’s residence drying up, people are worried that it may not be a good sign.KhalinggupTrashiDorji said the sacred lake maintained a water level even in spring. “But I was shocked to see only a marshy area last year,” he said.The situation improved this year, as there was some water in the lake, when people went to make the yearly offerings.“But it has reduced drastically, compared to the previous years,” Pema a monk with TrashigangDratshang, said. He has hiked to Danglingtsho for the past four years to make the annual offerings.He said the water level, when he first visited the lake, was about 14m deep, covering the area of an archery range. “But this year, there was very little amount of water.”Although monk Pema and others, who visited the lake, do not know why the water is drying up, Khaling residents feel the erratic climatic condition they are experiencing, like widespread destruction of maize crops by windstorms, and potato and other crops decimated by insects, is because the lake is drying up.“It’s a bad omen for the locality,” Sonam, 80, from Khaling said. “It shows that people are defiling the area and Mem Dangling is angry.”People are not permitted to visit the lake for about four months of the year, which is locally known as ridham. “But when people don’t respect it, misfortune befalls,” Yeshi, another Khaling resident, said. GupTrashiDorji said village elders say the lake dried up once before two decades ago. Trashigangdzongkhag forest officer, JigmeTshultim, said the dzongkhag is aware of the situation, and an assessment will be done in the next plan.”Source: Kuensel July 19, 2012
(from 1963 to 1993). Retreat rates (on the horizontal projection) as high as 26.6 m/year were reported for these glaciers.
A ground survey of the C-type, JichuDramo glacier was conducted in the Bhutan Himalaya as part of fieldwork in 1998; the glacier was resurveyed in 1999 to assess the changes. Naito et al. (2000) recorded a 12m retreat (from 1998-1999) and estimate that the surface was lowered by 2 to 3m.
The retreat rates for C-type glaciers in the Bhutan Himalaya were compared with retreat rates for some glaciers in eastern Nepal. Karma et al. (2003) report that the retreat rates were higher for glaciers in the Bhutan Himalaya than for glaciers in eastern Nepal; attributing the sensitivity of these glaciers to the intensity of the monsoon. These glaciers and glacial lakes are located in the northern fringes on the country, of which 24 of them are categorized as potentially dangerous (Figure 3.9xx). ILater in 2012, a new glacial inventory in Bhutan revealeds two lakes as potentially dangerous, instead of 24 as reported earlier by the ICIMOD (International Center for Integrated Mountain Development (ICIMOD)). The new finding dismisses the 2001 report of ICIMOD. According to Dr. Jiro Komori, Physical Geographer, with the JICA (Japan International Cooperation Agency (JICA), the studies were done using remote sensing data sets and verified with bathymetry, an underwater measurement. The three-year field implementation project by the Japanese experts and geology and mines officials found most of these lakes safe except for Thorthormi and Raphstreng (Kuensel March 2012) (Box 3.3).
Figure 3.9: Potentially dangerous lakes in Bhutan
Increase in temperatures as a result of cClimate cChange will lead to retreat of glaciers and increase the risk of Glacial Lake Outburst Flood (GLOFs), hence soit is necessary to monitor the flow regimes of Bhutan’s glacial lakes. According to Dr. Jiro Komori, the bottom of Thorthormi Lake is very thin and the height difference of riverbed and lake
80 | B h u t a n E n v i r o n m e n t O u t l o o k 2 0 1 3
N
Box: 3.3
Only 2 lakes dangerous, not 25, new study revealsA new glacial inventory in Bhutan reveals two lakes as potentially dangerous, instead of 25 as reported earlier by the ICIMOD. The new finding dismisses the 2001 report of ICIMOD. The finding under the Glacial Lake Outburst Flood (GLOF) project makes a special mention on Thorthormi and Raphstreng lakes that need immediate attention.The three-year field implementation project by the Japanese experts and geology and mines officials found most of these lakes safe except for Thorthormi and Raphstreng.According to Dr. Jiro Komori, Physical Geographer, with the JICA the bottom of Thorthormi Lake is very thin and the height difference of riverbed and lake water level is very big. He added that Thorthormi glacial lake is just next to Raphstreng Lake and their barrier part is also very thin. “So if in future the barrier gives a way, the water body from Thorthormi might overflow to Raphstreng and this will be threatening.”The studies were done using remote sensing data sets and verified with bathymetry, an underwater measurement. According to the experts, Thorthormi expands at a rate of around 10 meters every year towards Raphstreng, which is separated by 30 metres today.The combined volume of water from these two lakes are projected to produce about 53 million cubic metres; and if it ever creates glacial lake outburst flood, degree of damage is estimated three times more powerful than the one of 1994 flood in Punakha through Luggye lake.Source: Kuenselonline.com March 15, 2012.

water level is very big. He added that Thorthormi glacial lake is just next to Raphstreng Lake and their barrier part is also very thin. “So if in future the barrier gives a way, the water body from Thorthormi might overflow to Raphstreng and this will be threatening.” The combined volume of water from these two lakes are projected to produce about 53 million m3 cubic metres; and if a GLOF it ever creates glacial lake outburst flood,occurs here, the degree of damage is estimated to be three times more powerful than the one of 1994 flood in Punakha through Luggyelake.
Based on the monitoring results using satellite imagery pictures of the Department of Geology and Mines, Bhutan’s glaciers are observed to be receding at a rate of 20-30 meters per annum (Figure xxx pg 72).In recent studies, according to the experts,Thorthormi expands at a rate of around 10 meters every year towards Raphstreng, which is separated by 30 metres today. Unless some measures are undertaken it is possible that all the glaciers in Bhutan Himalaya could disappear within few decades. This is definitely a serious concern for a country like Bhutan whose hydro centric economy is dependent on the glacial lakes which act as natural reservoirs and also help to regulate seasonal flows in the rivers.
Impacts
Runoff over Ttime and Sspace:Mountain regions provide more than 50% of the global river runoff, and more than one-sixth of the Earth’s population relies on glaciers and seasonal snow for their water supply (Eriksson et al., 2009). The current trends in glacial melt suggest that the seasonal low flow will become substantially reduced as a consequence of climate change (IPCC, 2007a). The effect of this on, for examplee.g, food production and economic growth is likely to be unfavorable. The situation may appear to be normal in the region for several decades to come, and even with increased amounts of water available to satisfy dry season demands. However, when the shortage arrives, it may happen abruptly, with water systems turninggoing from plenty to scarce in perhaps a few decades or less. Some of the most populated areas of the world may “run out of water during the dry season if the current warming and glacial melting trends continue for several more decades” (Barnett et al., 2005). Flooding may also arise as a major development issue. It is projected that more variable, and increasingly direct, rainfall runoff will also lead to more downstream flooding. Entire hydropower generation systems established on many rivers will be in jeopardy if landslides and flash floods
81 | B h u t a n E n v i r o n m e n t O u t l o o k 2 0 1 3

increase, and hydropower generation will be affected if there is a decrease in the already low flows during the dry season.
Further, due to more erratic and unpredictable rainfall patterns, there would be reduced ability for catchments areas to retain water, leading to increased runoffs and enhanced soil erosion.
Reduction in Wwater Ssource Yyield and Qquality Ddeterioration:Increasing industrialization and the growth of large urban centers have been accompanied by increases in the pollution stress on water in river, lakes and streams. This use (or abuse) conflicts with almost all other uses of water and most seriously with the use of freshwater for drinking, personal hygiene and food processing. Human use of water for almost all purposes results in the deterioration of water quality and generally limits the further potential use of the water.
The prominent negative impacts on wWater, sSanitation and hHygiene from the national perspective are:
Damage of water supply and sanitation infrastructures from increased flooding or landslides, debris flows, GLOFs etc.;
Increased operation and maintenance costs for water treatment due to degradation of water quality input;
Pollution induced by overwhelming capacity of low cost surface water protection system, including pathogen loading, water borne diseases propagation;
Water borne diseases iIncreased by dry spells/droughts and degradation of quality of shallow water, ponds and marshes; and
Possible drying up of spring and stream sources in remote areas.
Water Iinduced Hhealth HhazardsWater, sanitation and hygiene have important impacts on both health and disease.Freshwater resources all over the world are threatened not only by over-exploitation and poor management but also by ecological degradation. The main source of freshwater pollution can be attributed to discharge of untreated waste, dumping of industrial effluent, and run-off from agricultural fields. Industrial growth, urbanization and the increasing use of synthetic organic substances have serious and adverse impacts on freshwater bodies. It is a generally accepted fact that theMost developing countries face problems of agricultural run-off in water sources. Polluted water like chemicals in drinking watercauses problem to health and leads to water-borne diseases.
Heavy rainfall can lead to flooding, which can increase the incidence of waterborne
82 | B h u t a n E n v i r o n m e n t O u t l o o k 2 0 1 3

diseases. The sanitation and cleanliness of the water and the surrounding environment are challenged as the downpour triggers sewage overflows, contaminating drinking water and causing diarrhoea, cholera, etc. Diarrhoeal disease has remained one of the top three causes of morbidity in the last one decade and contributes to about 10-15% of the morbidity cases(source:????).WHowever, it is interesting to note that with a better health care system and awareness program in place, the mortality incidences of water-borne diseases has been decreasing (refer Ffigure 3.10xx). An important fraction of the burden of water-related diseases (in particular: water-related vector-borne diseases) is attributable to the way water resources are developed and managed. In many parts of the world the adverse health impacts of water pollution, dam construction, irrigation development and flood control cause significant preventable disease.(Source???)
Figure 3.10: Prevalence of Wwater-borne Diseases, 2007-2011
Reduction in Aagriculture PproductivityThe productivity of agricultural systems is partly dependent on the availability of water resources for irrigation. Due to climatic vulnerability and associated risks, agricultural production systems especially in marginal areas are prone to degradation of land resources through land and soil erosion, and over-extraction of groundwater (National Water Mission, 2010). Subsistence and smallholder farmers are particularly vulnerable to climate variability and socio-economic stresses that further complicate their livelihood systems (Bates et al., 2008). It is paradoxical that too much water (floods, land slips) and too little water (droughts) both adversely affect agriculture leading to food insecurity. Extremes in temperatures (high/low) and shifts in rainfall patterns (early/late) lead to adjustments in planting and harvesting times, often resulting in lower crop productivity and food production.
In recent years the observed and visible impacts on agriculture possibly due to climate change in Bhutan have been the loss of arable lands, damage to crops and loss in
83 | B h u t a n E n v i r o n m e n t O u t l o o k 2 0 1 3
production, changes in temperature and rainfall patterns affecting production and food security and increasing water conflicts amongst farmers and communities as water becomes increasingly scarce for crop production, particularly rice. Several acres of paddy fields were lost to flash floods in Trashiyangtse in 2009 and Sarpang in 2010. Exact figures are unavailable but each year cultivated lands are lost to landslides and soil erosion. This is particularly true in areas in the east and south which receive heavy rainfall averaging over 4,000 mm per annum.
Due to changing weather patterns, humidity and temperatures, there has been a dramatic rise in pest and disease outbreaks in many crops. In maize, two devastating fungal diseases, Turcicum Leaf Blight (TLB) and Grey Leaf Spot (GLS) have caused huge losses in maize production. The diseases occurred in an epidemic scale throughout the country in 2006. Likewise in rice, a major epidemic outbreak of blast disease occurred in 1995 leading to a loss of 1,099MT of rice or Nu.11 million. The outbreak was associated with high rainfall and overcast conditions.
Sustainability of Wwater Iintensive IindustriesMost of Bhutan’sthe industries are located in the young, fragile and geologically unstable southern foothills that are prone to natural soil erosion and landslides. The industries that are heavily dependent on water are distilleries, agro-industries, breweries, beverage industries, food industries and metallurgical industries that require a continuous flow of water for the cooling process. Water supplies for most of the existing industries are currently met from the local tributaries, but some are served from the associated municipal water supply.
The water needed for these water intensive industries are istapped mainly from the springs and streams. The reported cases of drying up of water sources and dwindling of water yield in the headwater, if true, will jeopardize the sustainability of these industries. This is even more frightening since the availability of an alternate source was never ascertained. The exploration of groundwater reserve, as an alternative supply, in the southern plains is being initiated by the Ministry of Agriculture and Forests.
Other impacts:
Impact on Aquatic biodiversityAquatic biodiversity has enormous economic and aesthetic value and is largely responsible for maintaining and supporting overall environmental health. Factors including overexploitation of species, the introduction of exotic species, pollution from urban, industrial, and agricultural areas, as well as habitat loss and alteration through damming and water diversion, all of which contribute to the declining levels of aquatic
84 | B h u t a n E n v i r o n m e n t O u t l o o k 2 0 1 3

biodiversity in both freshwater and marine environments. As a result, valuable aquatic resources are becoming increasingly susceptible to both natural and artificial environmental changes.
Human activities are causing species to disappear at an alarming rate. Aquatic species are at a higher risk of extinction than mammals and birds. Losses of this magnitude impact the entire ecosystem, depriving valuable resources used to provide food, medicines, and industrial materials to human beings. Runoff from agricultural and urban areas, the invasion of exotic species, and the creation of dams and water diversion have been identified as the greatest challenges to freshwater environments (Allan and Flecker, 1993; Scientific American, 1997).
Climate change can also largely influence changes in aquatic biodiversity. For example, the longer, hotter summers thathaves become fairly frequent result in higher temperatures in bodies of water such as lakes and streams that used to be much cooler. Fish species each have their own unique set of tolerances, including maximum water temperatures in which they can survive. Coldwater fish species have felt the effects of climate change in their habitats already, and as a result many are coming closer to the state of being endangered or extinct.
User CconflictCompetition for water has widely increased, and it has become more difficult to conciliate reconcilethe necessities for water supply for human consumption, food production, ecosystems and other uses. Growing population and expansion of economic activities escalate pressure on water resources and the water demands will increase unless there are corresponding increases in water conservation andrecycling of this vital resource. Urban areas are experiencing drinking water shortages as their populations expand and compete with agricultural irrigators for limited water supplies. This rapid population growth and high population density could help generate conflicts over natural resources as scarcity grows.
85 | B h u t a n E n v i r o n m e n t O u t l o o k 2 0 1 3
Case study:The water quality assessment of Wangchhu which falls within the limits of the City periphery was conducted during the period March 5-9, 2012. The river was investigated at three different stretches for water quality assessment viz. Cheri, Babesa, and Khasadrapchhu, considering physical, chemical, microbiological and biological characteristics of the river. Results revealed Wangchhu at Babesa highly contaminated, that measured 428 CFU/100 ml faecal coliform, whereas at Khasadrapchu it showed indication of recovery measuring 46CFU/100 ml water. Maximum permissible standard limit of faecal coliform as recommended for Bhutan at final effluent from sewerage treatment plant (STP) is 1,000 MPN/100 ml water. At Cheri, river is free from faecal coliform. A team also applied bio-monitoring tool in water quality assessment, which includes rapid field assessment of the quality of river considering bottom dwelling larvae of insects which are considered highly sensitive to the increase in pollution. Results revealed no pollution (water quality class I) in Cheri, critical to heavy pollution (III/IV) in Babesa, and critical to moderate pollution (III/II) in Khasadrapchhu.

Local users compete to obtain their share of water, which can intensify existing tensions and sometimes lead to violence where the supply of water does not meet demand. The intensity of the conflict also varies among different water users. UThe users conflict arises when the onset of the monsoon is delayed, because a delay in rainfall affects agriculture production. Farmers therefore compete to complete agriculture work on time, and this has led to water piracy during the night. Many farmers spend sleepless nights guarding their water share. Although water distribution is regulated with a set of norms framed jointly for efficient water use both for drinking as well as for irrigation, the amount of water reaching the final destination is low due to poor conveyance efficiency of the canal. During water stress periods, only minimal water may reach the fields. Under these circumstances, the introduction of any new management practice to improve the sharing of the resources, based on equity and efficiency, has limited impact.
Responses
Access to Improved Water Sources and SanitationPrioritize and support water supply in the un-served areas. Support dzongkhags with alternative water supply technologies (pumping, rain water harvesting, water supply technology for cold region, etc)
Institute improved surveillance system for water quality, enhanced capacity in water quality testing and adoption of household water treatment.
Implementation of Iindustrial Ddischarge Sstandards:The NECS has set standards to regulate industrial discharges into water courses and bodies. The MoEA’s Environment Unit is now using these standards to monitor and regulate industrial discharges. Furthermore, environmental clearance is now mandatory for new industrial projects and inclusion of measures to adhere to the industrial discharge standards in the project proposal is a key criterion for such clearance.
Wastewater TtreatmentCurrently there are only two sewage treatment facilities in Bhutan located in two urban centers of Thimphu and Phuentsholing. The sewerage plant in Thimphu treats 1,620 m3
volume of sewerage in aperday during summer and 1,320 m3/day in winter (Sewerage Treatment Plan 2011, Thimphu) and 490.88 m3/day in Phuentsholing(Sewerage Treatment Plant 2011,Phuentsholing).
The construction of Thimphu sewerage project was commenced in December 1993 and commissioned in the year 1996 starting from core Thimphu city areas. It consists of a gravity a sewer system which collects both the foul and grey water effluents. The effluent is directly discharged to Thimchu. There are 29.73 kms of PVC/HDPE main
86 | B h u t a n E n v i r o n m e n t O u t l o o k 2 0 1 3
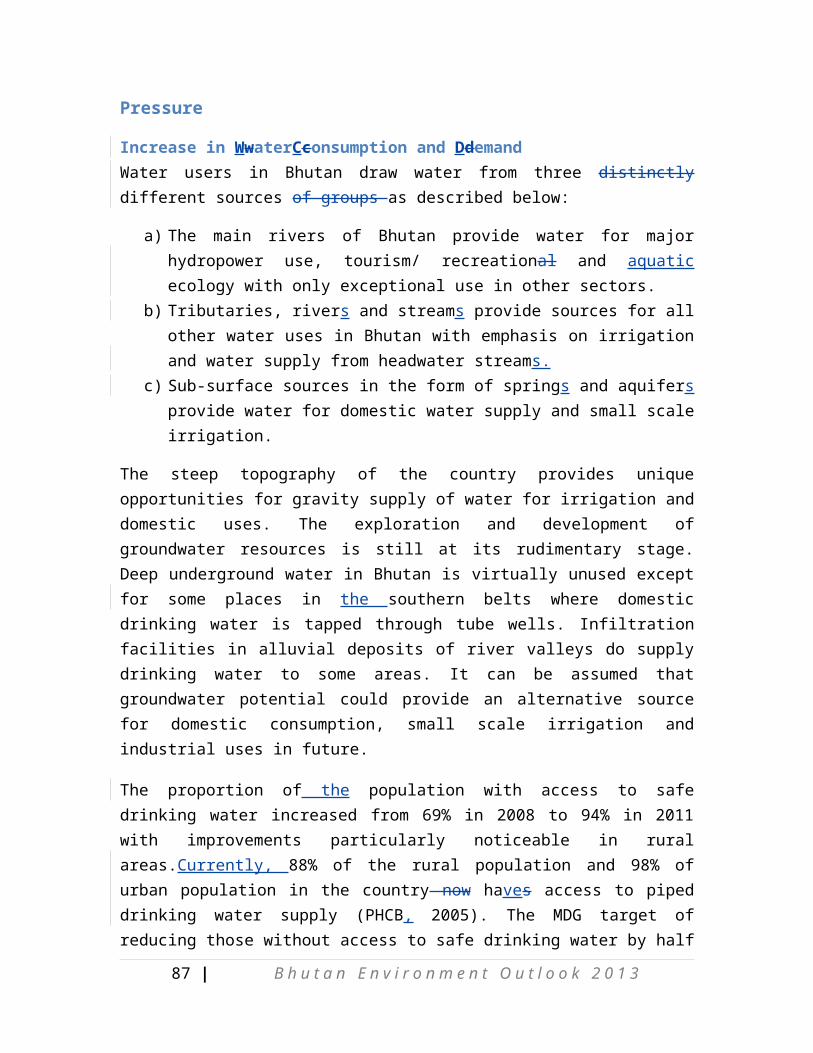
connection pipes and two series of waste stabilization treatment ponds. The sewer systems includeing house sewers with pipe diameters ranging from 160mm to 500mm, 20kms of high density polyethylene (HDPE) house connection pipe work in diameter ranging from 110mm to 225mm and associated manholes and inspection chambers. However, due to limitation of the hydraulic capacity of the trunk sewer trunk, it can cater to only the densest part of the core city areas as well as illegal connection of storm runoff/rain water leading to sewer overflows is a major challenge. Therefore, upgradingation of the plant ihas beingenundertaken by an ongoing ADP project.
Enforcement of Water Act of Bhutan, 2011The Water Act of Bhutan, 2011 should be implemented stringently to ensure conservation and protection of water resources. Grant equity in water allocation and use, respect traditional water rights if based on equity and social justice, ensure licensing of water for commercial uses, ensure registration of all water usages, should be supported by the water regulation and uphold international legal norms and conventions.
Currently, the water regulation is being formulated by NEC in close consultation with all the key stakeholder agencies including the local government. Regulation will further strengthen the implementation of the Water Act as this legislation will have clear delineation of responsibilities and strict provisions that will enhance the conservation of aquatic and riverine ecosystems.
Eco-efficient Aapproaches for Wwater IinfrastructureThe application of eco-efficiency into the public sector, including development of water infrastructure, requires more complicated thinking methods and approaches and integrated planning which will beis quite different from the traditional planning. Application of eco-efficiency into water infrastructure development needs to integrate both dimensions of physical infrastructure aspects and non-physical or institutional aspects such as laws, regulations, regulatory programs, government bureaus, and civil society groups like environmental NGOS.Another step to promote the idea of eco-efficiency in water infrastructure is to strengthen an integrated approach to water management issues. Decentralized approaches should be included as one of the crucial components for promotion of eco-efficiency in water infrastructure development. Improvement of eco-efficiency of the water sector must be conceived as part of socio-economic development process, i.e. green growth.Innovative physical components, water sensitive urban design, and conservation programs should be designed to complement existing water supply.
87 | B h u t a n E n v i r o n m e n t O u t l o o k 2 0 1 3

Piloting Rrain Wwater HharvestingRain wWater hHarvesting is considered as the analternativessupply source to supplement the water demand of the country. Rainwater hHarvesting is the collection of water that would otherwise have gone down the drainage system, into the ground or been lost to the atmosphere through evaporation. Large surfaces such as roofs are ideal for rainwater harvesting which could supplement the town’s supply and can be used to flush the toilet, water gardens and for washing machines. The Aswater scarcity is a major problem in most of the towns in wouldit is likely to increase in the near future. Various reports have been presented on these issues which clearly state the necessity of opting for other means of water supply in addition to preserving/maintaining the existing water sources. For instance, Mongar Municipality finds it difficult to supply adequate quantity of water for about 120 days of lean period in a year. Mongar Municipality over the years has been studying the various possibilities for providing safe drinking water for Mongar Town. One of the most feasible and sustainable solution is the Roof-top Rain Water Harvesting system. The rationale behind this design is to provide washing water and therefore restrictingthe treated water can tobe used only for cooking/drinking in a sustainable manner.
Promotion of Wwater Ssafety planPlanE However, efforts to further improve access and upgrade the quality of drinking water and sanitation facilities need to be sustained and expanded to cover more households and people. Spatial disparities still exist but attention is being given to clos inge the disparities quickly.
Regular Wwater Qquality MmonitoringThe NECS conducts water quality surveys and monitoring along major rivers and tributaries at least twice annually; pre- and post-monsoon. Based on this survey and monitoring, it can be concluded that the state of Bhutan’s water resources at the macro level is very healthy. The data collected through the survey indicate that the main rivers and their major tributaries, with a few exceptions, are still of a pristine quality. The natural water quality can be characterized as highly oxygenated, slightly alkaline with low conductivity and no recorded salinities. However, there are localized water pollution problems due to frequent unsanitary conditions along banks of streams and rivers. This problem is exacerbated in the urban centers where surface drainage, grey water sullage from domestic households and uncontrolled seepage or overflow from septic tanks and pipes enter into the watercourses.
88 | B h u t a n E n v i r o n m e n t O u t l o o k 2 0 1 3

Biological Monitoring:Use of aquatic insects as bio-indicators for assessing the ecological status of rivers and streams is widely accepted and represents state of the art in the developed countries and is gaining increasing importance in the HKH region.
A list of taxa of macro-invertebrates is already being compiled at the NEC, the information of which correlates to the river water quality. Using aquatic insects in evaluating the water quality has an advantage over physical and chemical monitoring as it allows determination of the spatial and temporal extent of impacts on our aquatic ecosystems. During the course of the water quality monitoring exercise, discoveryies of the relict species of dragon fly larvae, Epiophlebialaidlawi, was made. The presence of this species indicates that the quality of water is pristine with almost no human interference. Various species of stoneflies, mayflies and caddisflies which are also an indicator of good quality of water were detected in several streams in Bhutan.
Biological Water Quality Class:
Color coded method is internationally used to represent the water quality status of various water bodies.
Figure 3.11: Water Quality – color coding
Based on the above color chart, an assessment of the Thimchhu was conducted from its head water near Tango-Cheri to the south Thimphu. This is especially helpful for the policy makers and water managers who could understand the situation of the water bodies at a glance. In the below water quality map of Thimchhu, we can easilyit is easy to decipher that there is no pollution at Cheri, whereas, almost all the tributaries feeding Wang Chhu were observed to be more polluted.
89 | B h u t a n E n v i r o n m e n t O u t l o o k 2 0 1 3
I
II-III
IV
III
III-IV
I-II
II
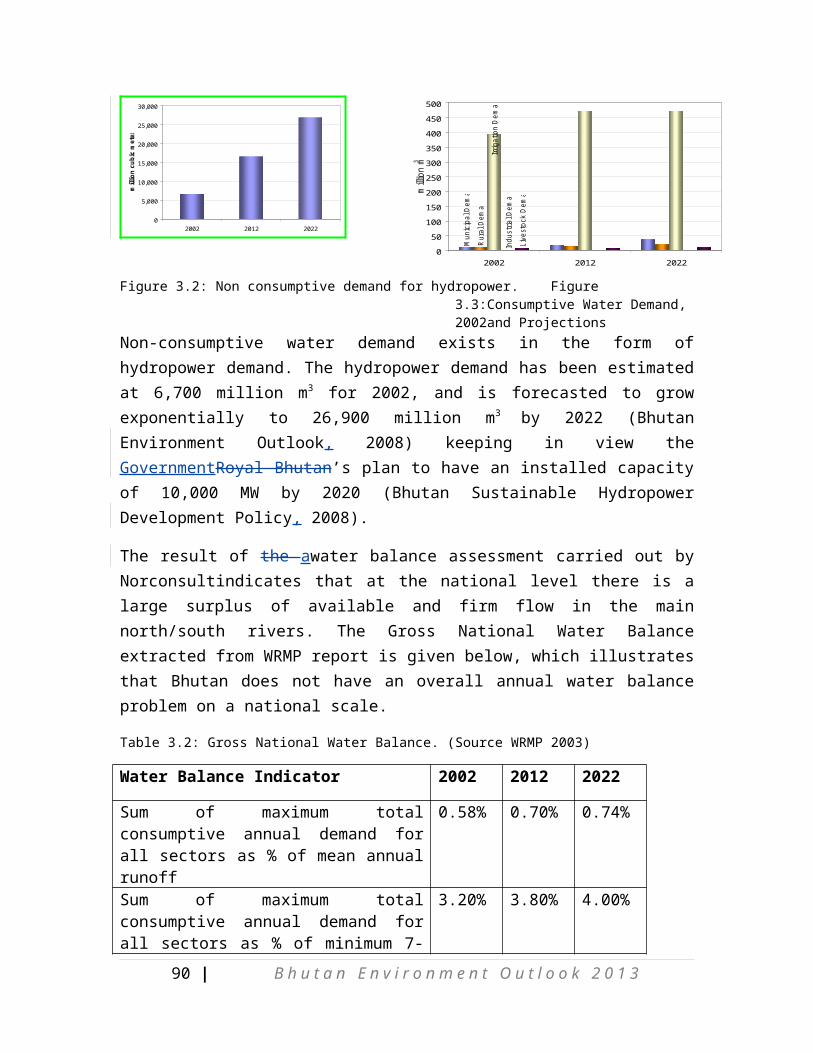
Figure 3.12: Water quality map of Wangchhu
PeltroperlidaHeptageniidaeStenopsychidae
90 | B h u t a n E n v i r o n m e n t O u t l o o k 2 0 1 3
Water Quality Assessment of Wangchhu
TAdditionally, the water quality assessment of Wangchhu which falls within the limits of the City periphery was conducted during the period March 5-9, 2012. The river was investigated at three different stretches for water quality assessment viz. Cheri, Babesa, and Khasadrapchhu, considering physical, chemical, microbiological and biological characteristics of the river. Results revealed Wangchhu at Babesa highly contaminated, that measured 428 CFU/100 ml faecal coliforms, whereas at Khasadrapchu it showed indication of recovery measuring 46CFU/100 ml water. Maximum permissible standard limit of faecal coliforms as recommended for Bhutan at final effluent from a sewerage treatment plant (STP) is 1,000 MPN/100 ml water. At Cheri, the river is free from faecal coliforms.
A team also applied a bio-monitoring tool inin the water quality assessment, which includes rapid field assessment of the quality of river considering bottom dwelling larvae of insects which are considered highly sensitive to the increase in pollution. Results revealed no pollution (water quality class I) in Cheri, critical to heavy pollution (III/IV) in Babesa, and critical to moderate pollution (III/II) in Khasadrapchhu.

Figure 3.14: Highly sSensitive aquatic fauna in Wangchhu, reported to be under threat due to pollution and other human perturbations such as river bank embankments, extraction and channel diversions.
GLOF Impact Mitigation
Figure 3.16: Mitigation of the Lake at the source of the Rapstreng
Supported by the GEF and , UNDP, the effort to lower the lake level of Thorthomi Lake was started in 2008 by 300 workers from 20 districts after study revealed Thorthomi Lake as one of the potential lakes posing a GLOF threat downstream. andInitial efforts lowered the lake level by 86 cm of the target of 1.67m due to inclement weather and harsh climatic conditions. However, by October 20th, 2012, the mitigation work could meet the set target by lowering the water level by five meters.
The story of Thorthormi Lake is shaping up to be a story of successful adaptation to climate change.
Installation of Ttechnical Eearly Wwarning SsystemsUnprecedented glacier melting in the Bhutan Himalayas is posing imminent risks in the form of Glacial Lake Outburst Floods (GLOFs). In direct response to the risk, proper hazard zonation and an effective early warning system are being implemented with support from hydropower projects and foreign aid. Presently, an early warning system has been set up in the downstream Punakha-Wangdue valley—. 4 AWLS stations at the 4 lakes in Lunana, 3 siren stations of inthe three villages in Lunana, 14 siren stations in the Punakha-Wangdi valley, 2 AWS/AWLS stations,(one in Dangsa and one in Thanza), and one control center insWangdi has been established. Further, 21 hazard-prone communities are being trained in GLOF preparedness.
91 | B h u t a n E n v i r o n m e n t O u t l o o k 2 0 1 3
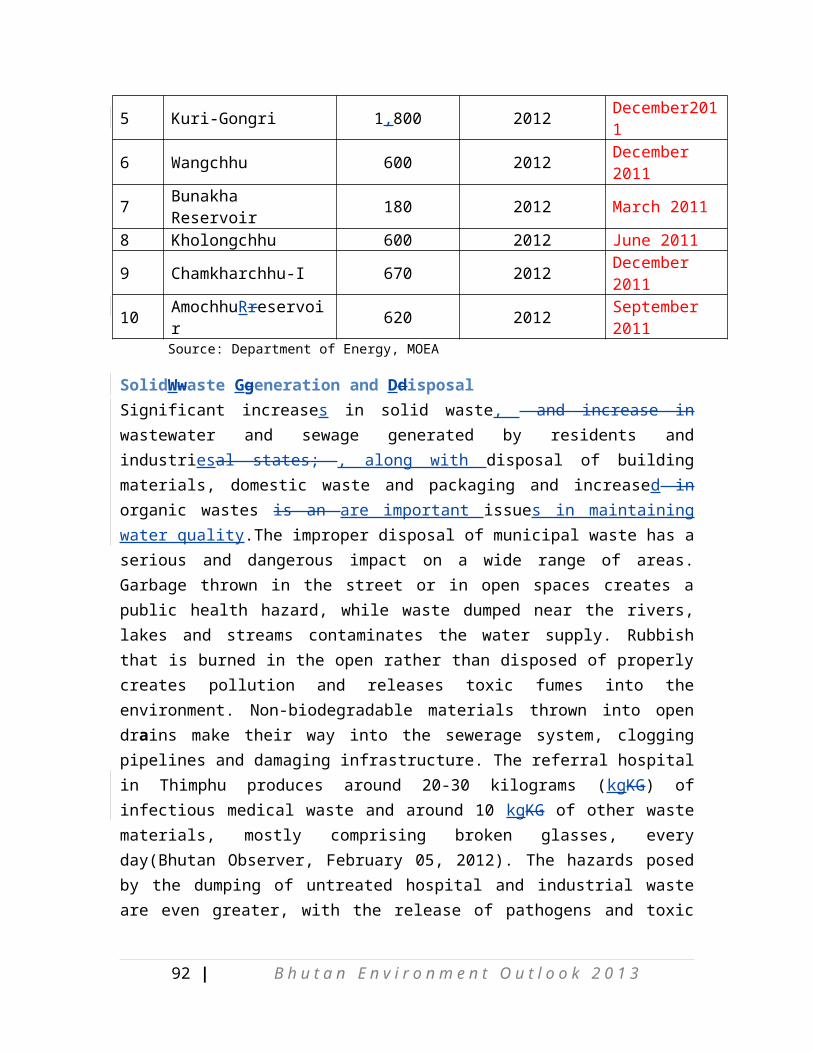
Policy and Legal EnvironmentAlthough the Water Act of Bhutan was adopted in 2011, the legal status of water resources and use is quite unclear due to lack of associated water Regulations. Various The provisions related to water issues are found in several Acts such as the Land Act 1979, the Forest and Conservation Act 1995, the Bhutan Electricity Act 2001, the Environment Assessment Act 2000, the National Irrigation Policy (NIP) and the Water and Sanitation Rules of 1999. Such provisions, however, are not always consistent or comprehensive. Aside from the above laws, there are many traditional regulations and customary norms on water sharing and use, which differ from one village to another. Recognizing the need for a comprehensive law on water, the Royal Government of Bhutan has prepared a Draft Water Regulation in 2012, which is being revised and finalized for submission to the parliament for approval. The Draft Regulation seeks to ensure sustainable use of water through uniform and consistent laws and to prevent the pollution of water and the environment. Such Regulation with strong legal backingup with consistent water laws and policy, could help to resolve the anyconflicts over water adequately.
92 | B h u t a n E n v i r o n m e n t O u t l o o k 2 0 1 3
4. AirEnvironment
Overview of Air Pollution in BhutanBhutan presently has a very pristine air environment with negligible levels of pollution. However, rapid socio-economic development and urbanization is an emerging threat to the existing air quality. Localized air pollution is already being experienced due to increasing number of vehicles, manufacturing industries and increasing number of construction activities etc. as a result of urbanization and industrialization triggered by socio-economic growth.
Bhutan signed the “Malé Declaration on Control and Prevention of Air Pollution and Its Likely Transboundary Effects for South Asia” in 2002. Due to lack of technical expertise and funds, monitoring is limited to suspended particulate matter (PM10), SOox and NOx at the moment. Monitoring of suspended particulate matter (PM10) in Thimphu was initiated in 2004 by the National Environment Commission (NEC). In line with the “Strategy for Aair Quality Assessment &andManagement in Bhutan, 2010,;aAir qQuality mMonitoring sStations have been established in collaboration with various institutes at Sherubtse representing eastern region and rural area, the College of Science and Technology for a sensitive area, Gomtu and Pasakha for an iIndustrial area and Thimphu for an urban area. Currently only PM 10 is monitored in network stations using Respirable Dust Samplers, except for Thimphu. The data from all stations are also broadcast on Bhutan Broadcasting Service Television (BBS Tv) and websites of BBSC, Kuensel and NEC for dissemination of information. NOx and SOox are monitored only periodically. NEC has plans to start daily monitoring of SOox and NOx starting 2013.
The observed level of emission of PM10 toill date is mostly within the permissible limits with rare instances of emissions beyond limits. Growing concern here is that there is an increasing trend in emissions. It is thus very timely for policy interventions to prevent adverse impacts of uncontrolled air pollutions.
DriverRIVERsThe main driving factors responsible for depleting the air quality are:
a) Socio-economic developmentb) Increasing pPopulation &andurbanizationc) Climate change
93 | B h u t a n E n v i r o n m e n t O u t l o o k 2 0 1 3

Socio-economic developmentAll the major sources of air pollution are directly or indirectly associated with the economic development of the country and increase in population. The average growth rate of Bhutan was 9% in the 9th Five Year Plan (Bhutan Economic Update, 2010, World Bank). With an economic growth rate of 8.1%, Bhutan ranked second in South Asia and 9th in the world for the year 2011 (State of the Nation report, 2012).
Population growthThe average population growth rate is estimated to be about 1.8% in 2010-2011 (NSB). By 2030 the total population of Bhutan is projected to increase by about 86.03% in the period 2005-2030 (NSB, PHCB 2005). Increase in population inevitably increases the demand for service from all sectors of the society and thus pollution.
Climate ChangeAnthropogenic climate change is now a widely accepted phenomenon responsible for a number of natural hazards. Global warming and erratic weather patterns with drought haves significant impact on local air quality. Downscaled climate models; HadCM3Q0 A1B & ECHAM5 A1B scenarios projects that the dry months in Bhutan will become drier and the wetter months will become wetter in the not so distant future (SNC 2011). This indicates that the level of emissions, particularly of SPM would increase considerably. The negligible level of SPM during the monsoon and higher concentration during the dry season at the moment confirms the anticipated increase in future.
PressuresRESSURE
Vehicular EemissionsEmissions from motor vehicles is areone of the primary sources of local air pollution in Bhutan. According to the second National Greenhouse Gas inventory, emissions from the transport sector have increased from 117.90 Giga grams (Gg) in year 2000 to 230.36 Gg of carbon dioxide in 2009 as shown below in Ffigure 4.1 xxx. This directly corresponds to the increase in number of cars over the same period of time. The number of vehicles has been increasing at an annual growth rate of 18% in last one year (The State of the Nation 2012). As of December 2011, the Road Safety and Transport Authority (RSTA)has registered about 62,707 (The State of the Nation 2012)number of vehicles. This figure excludes those vehicles owned by armed forces of Bhutan including Royal Bhutan Police, Border Roads Organization, Indian Military Training Team, iInternational oOrganizations and diplomatic missions, and vehicles engaged by external construction companies. Pollution in the transport sector is mainly from vehicle exhausts, particulate matter from tire and brake wear-out, road dust and vehicle idling
94 | B h u t a n E n v i r o n m e n t O u t l o o k 2 0 1 3

(especially diesel vehicles) in winter months. (brief write up on types of vehicles and easy loan, economic growth and affluence)
Figure 4.1: Greenhouse Gas emissions trend in Bhutan by sectors (SNC 2011)
Construction ActivitiesWindblown dust particles from the construction sites within the country are an emerging source of Ssuspended Particulate Matter pollution. Rapid urbanization has fueled a boom in the construction industry in the past decade. The construction industry accounted for about 14.2% of the GDP in 2010. Besides the windblown dust from the construction sites, vegetation loss around the urban centers to construction also contributes to increased pollution.
Although hydropower is a clean source of energy, the construction phase generates a lot of pollution due to clearing of forest for infrastructure development and transport. In addition, there has also been a surge in total length of road network across the country. The country’s total length of road network has almost doubled in 2011 with total length of 8,336.2 km compared to total road network length of 4,544.7 km in 2006 (Statistical Yearbook 2011). Pollution from road construction is mainly due to excavation and road surfacing.
95 | B h u t a n E n v i r o n m e n t O u t l o o k 2 0 1 3

Industrial &andMining ActivitiesThere has been a significant growth in the industrial sector in the last decade. As per the Second National GHG inventory, emissions from the industrial sector increased from 237.76 Gg of CO2 in 2000 to 505.03 Gg of CO2 in 2009. Major contributors to emissions from the industrial sector are cement, chemical and metal industries. The number of manufacturing and production industries has increased by 27.93% within a span of two years from 20081,389 industries in 2008 to 1,777 industries in 2010 (Statistical Yearbook 2011).
Figure 4.1: Greenhouse Gas emission from industries (NEC, SNC)
The mining industry also causes significant pollution within the vicinity/locality of the mines. This is primarily due to excavation and loss of vegetation. There were 53 licensed mines in the country as of 2010 (Statistical Yearbook 2011). Mining and qQuarrying recorded a value added of Nu. 788.11 million (rReal terms) registering a growth of 8.51% percent in 2010, after a negative growth of 6.91% percent in 2009 (NSB, National Accounts Statistics, 2010).
FireForest fires, especially during the dry season (November-May) are another major factor contributing to local air pollution. In the last 15 years 1997-2011, on an average of 62 forest fire incidences were recorded annually damaging about 18,188.23acres of forest land annually (Forestry Facts, Figures & Trends 2011). Most of the forest fires are human
96 | B h u t a n E n v i r o n m e n t O u t l o o k 2 0 1 3

induced. The most common human activities causesare burning of agricultural debris, careless smokers, road workers, electricity transmission line short-circuits, lemon grass harvesters and children playing with matchsticks (International Forest Fire News 2006). Besides the forest fires, other disasters related to fire also contributes to local air pollution. In 2011,alone 55 houses were completely destroyed and 7 houses were damaged by fire, killing one (01) person and injuring six others(06) persons (Department of Disaster Management, 2011). Burning of agricultural debris together with beingis not only a cause of forest fires but also contributes to air pollution by itself.
Fuel Wwood &andKerosene for Hheating and CcookingHousehold heating using wood-fed heaters, especially during the cold winter months and cooking from woodstoves and kerosene stoves in the rural areas is yet another factor contributing to air pollution in the country. The Natural Resource Development Corporation Limited supplied about 7.75 million Cftof firewood during the period 2008-2011 (Forestry, Facts, Figures& Trends 2011).
Religious PpracticesThe demand for timber for religious purposes is also in an increasing trend. The main contribution to air pollution is from cremation and incense burning during religious ceremonies. Felling of trees for erecting flag poles and collection of incense also has an adverse impact on the natural environment contributing to loss of greenery. According to the data maintained with Department of Forest and Park Services (DoFPS), 137,441 number of flag poles were felled during the last three years out of which 62,059 poles were felled for the deceased (Forestry, Facts, Figures & Trends 2011).
StateTATEAs discussed earlier, the air quality in Bhutan at the moment is relatively pristine. Air pollution at the moment does not pose any significant environmental threats. However, with rapid socio-economic development the sources of pollution are also on the rise. These primarily include industrialization, rapid urbanization, loss of vegetation to infrastructure development, forest fires etc. Nevertheless, with rapid socio-economic development, urbanization, industrialization and population growth, the level of emissions is onare in an increasing trend.
97 | B h u t a n E n v i r o n m e n t O u t l o o k 2 0 1 3

Figure 4.3:Annual Average PM10 µg/m3 for Thimphu (NECS Station)
Figure 4.4: Annual Average Level of PM10 at Various Stations for 2011
Figures 4.3shows an increasing trend in the level of PM10 concentration over the period 2004-2011 in Thimphu although the level still remains below national and other international limits. For other areas, levels remains below national limits, except for Rinchending which exceeds national limits as the area might be influenced by both Pasakha industries and trans-boundary air pollution from India. Level of PM10 in the
98 | B h u t a n E n v i r o n m e n t O u t l o o k 2 0 1 3

industrial areas (Figure 4.4)are well within the annual permissible limits; however there are instances of exceeding the permissible 24 hourly averages.5.
ImpactMPACTSince air pollution is not a serious concern at the moment, the magnitude of the impacts of air pollution is minimal/negligible at the moment. Nonetheless, it is an observed fact that the local air quality is gradually deteriorating. Most significant problems of local air pollution are in larger cities like Thimphu and Phuentsholing and at the industrial estates with heavy manufacturing industries.
Air pollution has direct impact both on health of human and environment. PM 10 is among one of the most harmful air pollutants. Although particulate matter can cause health problems for everyone, certain groups of people are especially vulnerable to PM10’s adverse health impact. These sensitive populations include children, the elderly, exercising adults, and those suffering from asthma or bronchitis. Of greatest concern are recent studies that link PM10 exposure to the premature death of people who already have heart and lung disease, especially the elderly (Air Resources Board 2012).
There has been no study conducted for assessing the impact of air pollution in Bhutan toill date. However, it is interesting to note that the case ofof the number of people referred for respiratory diseases has dropped from 416,239 cases in 2006 (Bhutan Environment Outlook 2008) to 275,821 cases in 2011 (Annual Health Bulletin 2011).
One of the impacts associated with air pollution in Bhutan is the Atmospheric Brown Clouds (ABCs), especially over the southern belt of the country (See satellite imagery in figurexxx). Most of the large manufacturing industries in the country are also located in the southern foothills. The ABCs obstructs the visibility to a great extent. “Studies have shown that ABC is worse during the winter months (November until April) when there is less rain to wash the pollution from the air and it is thought to be caused by a wide range of anthropogenic sources: coal-fueled power plants in India and China, airborne particles from combustion such as wood fires and forest fires, vehicle emissions, and factories, and the burning of biomass to generate energy” (PannozzoundatedNA).
5Data have been collected for less than a decade and therefore it’s not conclusive of the gravity of pollution.
99 | B h u t a n E n v i r o n m e n t O u t l o o k 2 0 1 3

Figure 4.5: Atmospheric brown Cloud over the southern belt of the country(Source:http://www.newscientist.com/article/dn10722-brown-haze-over-india-harming-rice-harvest.html)
Although there have been no studies conducted to assess the impact of air pollution on crop productivity in Bhutan, several reports were made in media on decreasing yield (vegetable, apples, citrus etc) due to air pollution from mining and industrial activities in some localities across the country (refer Box 4.1). The well-being of these communities are isalso affected due to reduced income from crop production and minor respiratory problems associated with local air pollution. The reports however must be ascertained verified with proper scientific investigation and research.
The tourism industry is one of the highest contributors to GDP of the country accounting for xxx. One of the foremost tourist attractions in the country at the moment is the rich natural heritage with negligible levels of pollution. As can be seen in Table 4.1 a significant proportion of the tourists come for nature tours and trekking. In the event of uncontrolled pollution and environmental degradation, it will definitely have deterrent impacts on the tourism sector.
Table 4.1: Percentage of tourist arrivals by purpose of visit, Bhutan.Purpose 2006 2007 2008 2009 2010Culture 67.0 69.0 70.6 66.2 67.1Buddhism 27.6 31.0 58.1 30.2 32.5Trekking 18.5 19.3 34.1 14.7 15.5Undiscovered 35.5 35.7 32.0 31.0 24.7Nature 57.0 59.0 17.5 52.4 48.7Flora/Fauna 10.7 12.0 9.4 9.0 11.1Work/Business 7.0 3.2 3.7 6.1 7.3Others 5.8 1.8 1.5 1.9 5.0Source: NSB, SYB 2011
100 | B h u t a n E n v i r o n m e n t O u t l o o k 2 0 1 3

ResponsesESPONSEPolicy interventions are necessary to maintain the pristine air environment. There are a couple of strategies and standards to curb the emerging concern of air pollution. However, there has been a sheer lack in the implementation and enforcement.
Revision of Eemission SstandardsThe nNational standards for vehicle emissions were set in 2008. In the light of increasing number of vehicles it is timely to revise the standards as well. More than the revision, it is more prudent to enforce the existing standards strictly. Awareness programs/campaigns on eco-friendly driving techniques would also help in reducing the emissions substantially.
Monitoring EemissionsThe accuracy in the measurement of the level of pollution in the country can only be determined by monitoring an increased number of parameters. Currently monitoring is limited to PM10, SOx&andNOx. Plans to increase the number of parameters have been constrained by lack of technical expertise and lack of funds to procure necessary equipments. However, NEC will have to initiate the process of broadening the parameters. (figure and write up on number of ??
Transport &andUurban PplanningStrategies for improving mass transport and non-motorised transport should also be implemented strictly. The aim should be to reduce the need for private cars by providing reliable and efficient public transport systems. “The National Strategy &andAction Plan for Low Carbon
101 | B h u t a n E n v i r o n m e n t O u t l o o k 2 0 1 3
Box:4.1 Pollution causes dwindle in farm producePasakha Industrial Estate , 13 October, 2010–Pollution from Pasakha industrial estate in Phuentsholing is choking the livelihood of farmers in the nearby villages.Villagers under Samphelinggewog, which comprises the three villages of Allahey, Rangetung, GurungDara, and Balujhora blame the polluted air and dust from factories in Pasakha for the dwindling yield in their cash crops that include ginger, areca nut, lime and mandarin.Most villagers said they witnessed a subsequent drop in the cash crops over the years.Samphelinggup Mani Kumar said the issue was discussed at the dzongkhagtshogdue last year.Although the issue was raised several times at the gewogtshogchung, farmers complained, nothing has been done so far.Ahalley village tshogpaPrem Singh Mongar said his people cultivated ginger, areca nut and lime, and made a living selling the produce at the border towns.But since five years ago the yield has begun dropping, he said. The production is either too less or of inferior quality unlike previous years.GurungDara villagers, who are nearest to the industrial estate, share a similar plight.Apart from the cash crops, GurungDara farmers said the factory pollution affected their vegetables as well. It’s the dust, which coats the vegetables, that affects our vegetables, a farmer said.In Rangetung village, some mandarin growers are abandoning orange farming, frustrated and helpless about the decline in their annual yield.A farmer of Rangetung who once owned more than 100 orange trees said it was painful to witness some of his orange trees dying gradually over the last five year.Returns from the sale of mandarin is are no longer profitable and I’ve decided to give up, he said. It’s frustrating to work so hard, when there’s very little or nothing to harvest in the end.But we haven’t received any formal complaints so far, NamgayZam said. With no proper research or studies done, it’s difficult to say whether it’s really because of pollution from the factories.Source: Kuenselonline
Development” also outlines numerous strategies and action plans to minimize emission from the transport sector. Mechanisms to implement the recommendations in the above documentstrategy must also be worked out for better results in the effort to reduce emissions.
Interventions in the urban planning process would also greatly contribute towards reducing emissions, especially from transport. The plans should focus more on easy and free movement of people rather than focusing on movement of vehicles. In other words, the focus should be to reduce the need for cars within the urban centers. This could be achieved by keeping provisions for safer footpaths and lanes for non-motorised transport. Reduction in walking distances should also be given priority.
Another source of emissions in the urban centers is from the construction sites. Rules and regulations to control windblown dust from construction sites should also be put in place. Greening of bare areas within the urban centers would also help in mitigating the pollution from windblown dust especially during the dry season.
Pedestrian DayStarting June 5 2012 coinciding with the World Environment Day, the Ggovernment initiated the Pedestrian Day on every Tuesday to reduce emissions for a cleaner air environment. In order to facilitate convenient commuting, the numbers of city buses have been increased and route maps also made available. Studies on reduction in fuel consumption on the pedestrian day and the consequent reduction in emissions are being conducted by NEC.
Urban Transport Plan and Low Emission Capacity BuildingInitiatives are also being undertaken by Ministry of information and Communication and the NEC to introduce electric/hybrid city buses within Thimphu city under Urban Transport Plan for Thimphu and Low Emission Capacity Building.6.The plan also includes construction of bicycle and pedestrian lanes including overhead pedestrian bridges in few years time to be piloted in Thimphu to reduce emissions and ease traffic congestions.
Use of cleaner energy
Trans-boundary Air Pollution
6 Refer Low Emission Capacity Building 2012, NEC.
102 | B h u t a n E n v i r o n m e n t O u t l o o k 2 0 1 3
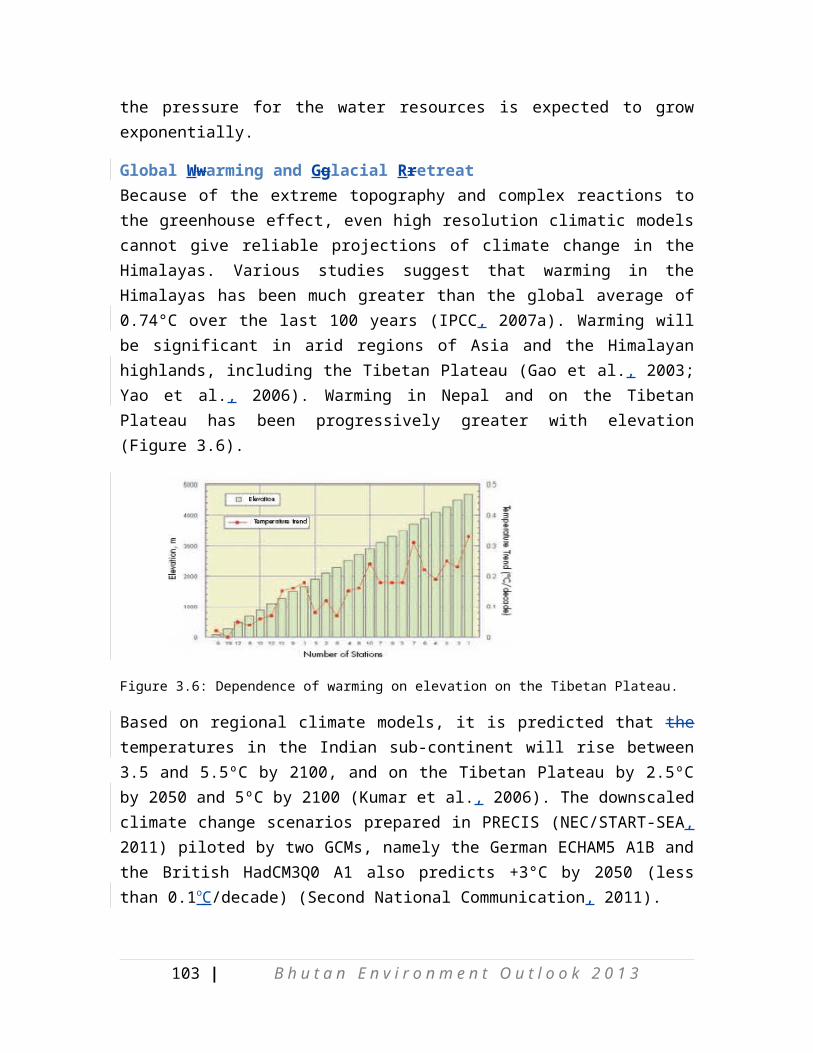
5. Biodiversity
DriversInfrastructure development
Population growth
Urbanization
Pressure
PoachingFor many centuries, Bhutanese have preserved its the naturalenvironment for both social as well as environmental reasons. Therefore, in the recent times it has been identified recognizedas one of the prime biological hotspots in the world.
The planned development activities were initiated only during the early 1960’s and all development activities are guided by the philosophy of Gross National Happiness, where environmental conservation has been taken as one of the main pillars.
Contrary to the GNH philosophy and Buddhist principles, the number of poaching cases is not insignificant. Several cases haves been recorded annuallyand about a Nu. 1 million ngultrum has beenwas collected as penalties for poachingy in 2011 by the Ddepartment of Forests and Park Services (DoFPS). Since the establishment of the Forest Protection and Surveillance Unit (FPSU) under DoFPS to curb forest offences, 91 forest offence cases were detected and dealt in the first two years (Forestry, Fact, Figures & Trends, 2011). Of the 91 offences detected, 22 cases were pertaineding to wildlife and illegal fishing (Forestry, Fact, Figures & Trends, 2011). Wild animals that fall prey to poachers include leopards, tigers, musk deer, bears, and elephants. According to the figure published by Department of Forests and Park Services (2011), Tthe Himalayan Musk deer is the most commonly poached wildlife species,. They are hunted largely to feed the growing illegal wildlife trade across the borders and for making quick money (DoFPS, 2011). In addition, some wild animals are also killed as a result of retribution for loss of human lives, livestock, properties and depredation of crops.
Poaching of wild animals is also partlydriven by international demand for wildlife parts and products and is further aided by Bhutan’s porous border. Chinese traditional medicine requirement ofdemand for larger cats and their products body partshave led to a decrease in the population of tigers in the neighboring state of India. Bhutan is
103 | B h u t a n E n v i r o n m e n t O u t l o o k 2 0 1 3
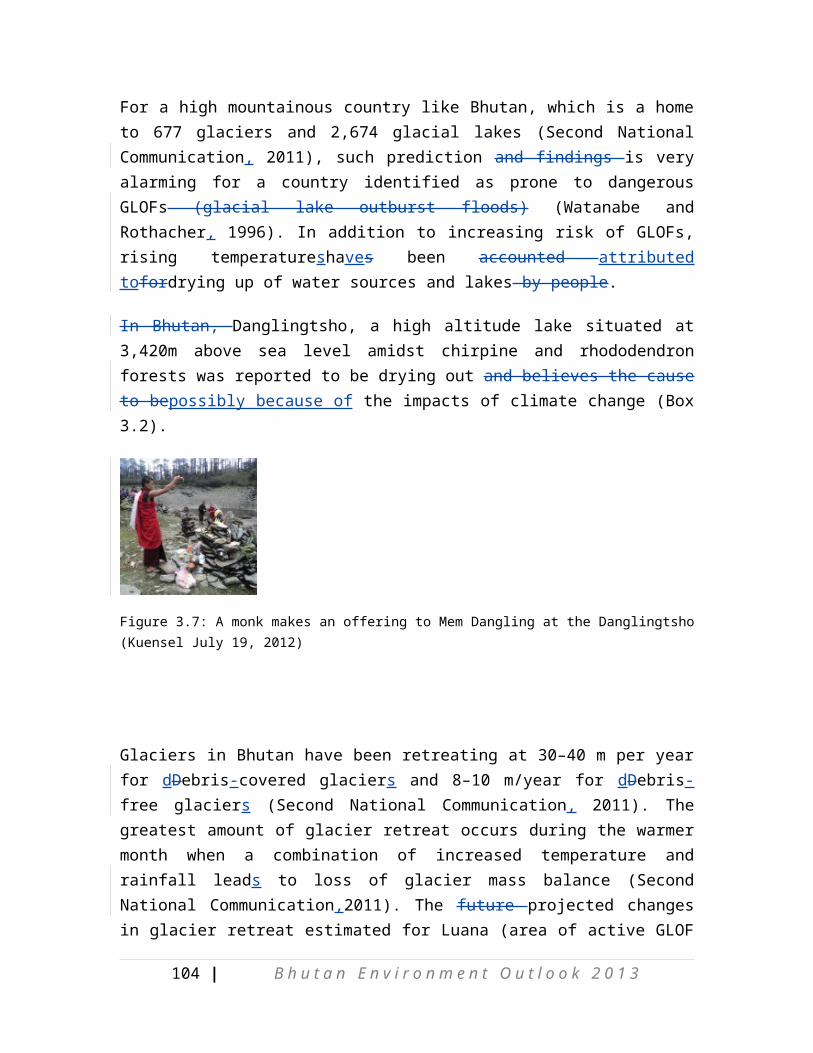
equally vulnerable to this trade and the greed of handsomehigh market price of such animals has also lured some of our local residents to engage into killing and smuggling out the animals and their products. Theus, decrease in the larger cat population has led to an increase in ungulate population which in turn causes much damage to crops. The importance of predator-prey dynamics is very crucial in maintaining the viable population of a species in the wild. Comparatively, cases of ungulate depredation of crops supersede livestock depredation by carnivores.
Human-wildlife conflictIncreasing human population and coercive encroachment into the Government Reserve Forest(GRF) land have resulted in wild animals coming out of their home range and thus arising causingconflict between humans and wildlife. Conflicts between humans and animals have always oftenled to loss on both the sides. Every year human lives, crops and livestock are lost to wild animals and in retaliation; wild animals are snared, hunted and slaughtered.
Some of the main contributors to human-wildlife conflicts in Bhutan are predation of livestock by wild mammalian carnivores (Sangay&Vernes 2008) and crops depredation by wild animals like elephants, macaques, wild boars and deer species inflicting immense significantlosses to the farmers. About 1,830 livestock depredation cases haves been recorded in 10 years (2002-2011) (Forestry Facts, Figures & Trends, 2011). The highest record of predation is recorded in Trashiyangtse with 258 cases followed by Wangdue with 194 cases, while Chukha and Samtse reported the lowest with 1 and 2 predation cases respectively (Forestry Facts, Figures & Trends, 2011).Figure xx shows that maximum predation of livestock is done by leopardswith 1,098 kills followed by tigers with 560 kills.and at the same time Ccowsand horsesbeing mostly predatedare most in danger followed by bulls and calvesf.
Every year, wild animals, especially wild boars, deer, monkeys, and elephants damage hundreds of tonnes of crops across the country inflicting loss of millions of Nusignificant financial loss. The reason is in wild reduced number of carnivores hasve led to sprawl an increasein herbivore population and thus wandering of ungulates wander into human cultivated areas in surrounded byforest causinges conflict between the two. FOur farmers continue to suffer from increasing damages from wildlife not to mentionas well as the various restrictions on utilization of natural resources. This has hindered the goal of self-sustenance and reliability for peasant farmerss. Apart from direct loss of crops, farmers loose time in guarding their crops, and have added costs of production, expenditure on items like torches and batteries, and animal chasing equipment, etc.
104 | B h u t a n E n v i r o n m e n t O u t l o o k 2 0 1 3
Infrastructure developmentBiodiversity is being lost at an increasing rate as a result of human activities like . One of the major threats to biodiversity is infrastructureal development. As socio-economic activities progress to meet the demands of a rapidly increasing population at the rate of 3.1% per annum and urbanization, hundreds of hectares of farmlands and forests are lost to infrastructure development every year. Many hydropower projects, road construction,and minerals mining and quarrying impose serious threats to both Bhutan’s flora and fauna of the country. Among the parks, Thrumishingla National Park (TNP) has lost the maximum GRF land, amccounting to more than 600((Forestry, Fact, Figures & Trends, 2011)acres, to road construction and power transmission lines from July 2008 – to June 2011 period(Forestry, Fact, Figures & Trends, 2011).(Trends, figures and indicators related to infrastructure development are described on page xxx).
One of the major threats imposed by infrastructureal development on the biodiversity is the loss of habitat. The removal of trees or certain species from a forest may cause a major ecological imbalance due to change in the microenvironment. The removal of species may cause disruption of the highly complex interrelationships among species.
Species extinction rates depend on many factors such as forest type, soil type, level of anthropogenic disturbances, degree of endemism, extent of land degradation, and so forth. When habitats become more fragmented and isolated, the survival of organisms dependent on the habitat is threatened.
Forest fireIn Bhutan the annual fire incidence averages toabout62 casesfire incidents occur annually, damaging about 7,361 ha/yrectors of forest each year. Forest fires have many implications for biological diversity. At the global scale, they are a significant source of emitted carbon which leads to global warming which could lead to biodiversity changes. At the regional and local level, they lead to change in biomass stocks, and alter the hydrological cycle with subsequent impacts on plant and animal species.
One of the most important ecological effects of burning is the increased intensity of burning for the future fires, as dead trees topple to the ground, opening up the forest to drying by sunlight, and building up the fuel load. RThe repeated burning is detrimental because it is a key factor in the impoverishment of biodiversity. (Trends, figures and indicators related to infrastructure development are described on page xxx).
Climate ChangeBiodiversity loss and climate change are closely linked and each impact upon the other.
105 | B h u t a n E n v i r o n m e n t O u t l o o k 2 0 1 3

Human-induced climate change threatens biodiversity and biodiversity loss intensifies the impacts of climate change.
Everything that lives in an ecosystem is part of the web of life, including humans. Each species, by virtue of its existence has a vital role to play in the circle of life. Maintaining a wide diversity of species in each ecosystem is necessary to preserve the web of life that sustains all living things.
The most important determinant of habitat loss and fragmentation effects, averaged across species and geographic regions, iwas current maximum temperature, with mean precipitation change over the last 100 years of secondary importance. Habitat loss and fragmentation effects were greatest in areas with high maximum temperatures. Conversely, they were lowest in areas where average rainfall has increased over time. Understanding the synergistic effects between climate change and other threatening processes has critical implications for our ability to support and incorporate climate change adaptation measures into policy development and management response.
StateBhutan is renowned for its remarkable natural beauty and biological diversity and its geographical expanse and topography include several diverse ecosystems that harbor a rich variety of faunal and floral species. There are dense and virtually untouched pristine forests in Bhutan. The following are some description of the current state of the Biodiversity in Bhutan.
Forest EcosystemsForests constitute the dominant portion of land cover, making up of 80.89%. Mixed conifers and broadleaf forests are the most dominant forest types and virtually all forests are natural. Further, as a result of variance in the altitudinal range, with corresponding variation in climatic conditions the country supports a wide range of forest ecosystems and vegetation zones. Broadly speaking, the country can be divided into three distinct eco-floristic zones. The alpine zone comprises areas above 4,000 m with no tree cover but scrub vegetation and meadows. The temperate zone, lying between 2,000 m and 4,000 m, contains temperate conifer and broadleaf forests. The subtropical zone, which lies between 150 m and 2,000 m, contains tropical and subtropical vegetation.(Trends, figures and indicators related to forest are described on page xxx).(Map of forest types)
Protected AreasWith country’s austere constitutional policy of maintaining at least 60% forest cover for all times to come, Bhutan has been able to maintain 51.44% of the total area as
106 | B h u t a n E n v i r o n m e n t O u t l o o k 2 0 1 3

Protected Area under National Parks, Wildlife Sanctuaries and Strict Nature Reserve (Forestry Facts, Figures & Trends, 2011). These Protected Areas are all interconnected to each other via a web of bBiological cCorridors and hospices containsome of the world’s most significant, charismatic and endangered spectrum of floral and faunal species such as Golden Langur (Presbytisgeei), Snow Leopard (Uncisuncia), Tiger (Pantheratigris), Bhutan Takin (Burdocastaxicolorwhitei), Black-Necked Crane (Grusnigricollis), White-bellied Heron (Ardeainsignis), Ludlow’s Bhutan Swallowtail (Bhutanitisludlowii), Ginseng (Panaxseudo-ginseng), etc. Included as a part of the Global Biodiversity Hotspot (Himalayan Region), Bhutan’s natural environment forms a share of network of International Conservation Complexes like the Global Tiger Corridor, Kanchhendzonga Conservation Complex, etc. (Map of PAs and BCs)
Protected Area & Biological Corridors Area in (kKm2) PercentageTotal Protected Area System 16,396.43 42.71
Total Area Biological Corridors 3,307.14 8.61
Royal Botanical Park 47.00 0.12
Total PAs & BCs 19,703.57 51.44
Table 5.1: Large chunk of forests are managed as a labyrinth of PAs and BCs which covers more than 50% of the total land area of the country. (Source: Forest Information Management Section, FRMD)
Aquatic Ecosystems
RiversThe countryBhutan is endowed with abundant inland water resources as a result of an extensive network of rivers, rivulets and streams arising from the high level of precipitation, presence of a huge number of glaciers and glacial lakes, and relatively well-preserved forests. The country’s river system can be divided into four major river basins(Trends, figures and indicators related to water are described on page xxx).
There are large numbers of small and medium-sized lakes spread across the country. At the present, except for glacial lakes, there is no adequate assessment of the area and location of various lakes in the country. As for glacial lakes, the Inventory of Glaciers, Glacial Lakes and Glacial Lake Outburst Floods in Bhutan produced in 2001 by the Department of Geology and Mines reporteds a total of 2,674 lakes in the country. However, most of the glacial lakes are extremely small. The largest of all the lakes is the RaphstrengTsho at an altitude of 4,360 m in the eastern part of Lunana.
MarshlandsIn addition to rivers and lakes, marshlands in the form of depressions and water-loggedareas, are envisaged to be a major part of the aquatic ecosystems in the country
107 | B h u t a n E n v i r o n m e n t O u t l o o k 2 0 1 3

although no proper survey of marshlands have been carried out so far. Marshlands are generally known to be rich in biota and provide good habitats for resident as well asand migratory birds, reptiles, amphibians and fishes. The best known marshland in the country is the Phobjikha valley, where the globally threatened black-necked cranes Grusnigrocollisroost in large numbers during winter. According to the annual crane counts by the Royal Society for the Protection of Nature (RSPN), since 1986/87 winter season,show that on average around 225 black-necked cranes have been spending their winter in Phobjikha over the last 21 years.Since the winter of 2005/06, the annual number of cranes roosting in the valley has exceeded 300. The valley is also highly valued for its outstanding scenery and cultural ethnicity.
Hot SpringsHot springs, known as Tshachuin Dzongkha, are very popular in Bhutan. People in Bhutan mainly use hot springs for therapy of various ailments, especially those affecting bones and skin. So far, ten hot springs have been officially reported in the country but the number could be more. These are gNyestshachuand YontenKuenjongtshachuin Lhuentshedzongkhag, Durtshachuin Bumthangdzongkhag, Gaylegphugtshachuin Sarpangdzongkhag, Dungmangtshachuin Zhemgangdzongkhag, Komatshachuand Chu Phugtshachuin Punakhadzongkhag, and Gasatshachu, Layatshachuand Wachitshachuin Gasadzongkhag.
Hot springs are associated with microbial biodiversity, which lies at the base of the food chain and consequently supports hundreds of higher species, but globally at the present there is very limited scientific understanding of microbial biodiversity in hot springs.
Agricultural EcosystemsThe country is known to have six major agro-ecological zones corresponding with altitudinal range and climatic conditions. (Insert map of agro-ecological zones of Bhutan)
108 | B h u t a n E n v i r o n m e n t O u t l o o k 2 0 1 3

Agro-ecological
Figure 5.xxx Agro-ecological zones of Bhutan. Source: SNC 2011.
Alpine zone: This zone, which lies between 3,600–4,600 m, is characterized by alpinemeadows and is basically too high and too cold to grow any food crops. The meadows are used assummer pastures for yaks by the nomadic yak-herding communities.
Cool Temperate Zone: This zone covers cultivated areas between 2,600–3,600 m. Rainfallis low, so dryland farming is common. Livestock farming is a predominant feature and, in particular, a small but distinct population of pastoralists maintains herds of yak and sheep in a nomadic manner. Horses, mules and dogs are the other livestock found in this zone. Key crops that are grown include wheat, potato, buckwheat, mustard and barley.
Warm Temperate Zone: This zone occurs between 1,800–2,500 m where rainfall is still low but temperature is moderately warm, except during winter when frost occurs. Migratory cattle herding is common and the herders have family links with the agricultural communities in the lower altitudes. People in this zone also keep pigs, poultry, dogs, cats, horses and small ruminants. In the wetland agricultural areas, rice is most commonly grown followed by wheat, potato, and several kinds of vegetables.
Dry Subtropical Zone: Occurring between 1,200–1,800 m, this zone is warm with moderate rainfall averaging 850–1,200 mm/yr in a year. Rice and maize are the major crops grown in this zone, in addition to wheat and mustard.
109 | B h u t a n E n v i r o n m e n t O u t l o o k 2 0 1 3

Humid Subtropical Zone: This zone lies between 600–1,200 m with relatively higherrainfall and temperature. Cattle rearing is common but is not done in a migratory fashionas in the temperate zones. The main cropping pattern in the wetland agricultural areas is rice followed by wheat and mustard. Citrus fruits (mandarin types, locally called “oranges”) are grown as cash crops. In the dryland agricultural areas, maize is the main crop followed by mustard, millet and buckwheat.
Wet Subtropical Zone: This zone has excellent areas for crop cultivation. Fodder is scarce, so the cattle are tethered in the cropping areas prior to preparation. As in the humid subtropical zone, cattle rearing areisnormally sedentary in this zone. Rice is the main crop grown in summer while maize or wheat is grown in winter depending on irrigation.Rainfall is very high, ranging between 2,500–5,500 mm/yr in a year. Irrigation sources are mostly rain-fed and dry up in the winter when rainfall becomes very low. As a result, large scale winter cropping normally does not take place. In the dryland agricultural areas, maize is the main crop. Other crops include cowpea, mustard, niger, millet and sorghum.
Wild Species Diversity
Vascular PlantsThe country’s diverse ecosystems harbor a spectacular assortment of wild flora. The Royal Botanic Garden of Edinburgh, which published the Flora of Bhutan, has recorded 5,603 species of angiosperms and gymnosperms. These include 369 species of orchids and 46 species of rhododendrons. Of the recorded plant species, 105 are said to be endemic to Bhutan, found nowhere else in the world. These include species such as Rhododendron bhutanense, R. kesangiae,Meconopsissuperba, Pedicularisinconspicua, Bhutantherahimalaica, and Vanda chlorosantha.
The wild floraincludes several plant species of enormous commercial and scientific values. The Bhutanese flora is considered to be of immense scientific value not only due to the high level of diversity but also because of the relatively good state of preservation compared to other Himalayan regions.The Instituteof Traditional Medicine Services (ITMS) uses more than 200 species for the formulation ofvarious traditional medicines. The Himalayan yew Taxusbaccata(subspecies wallichiana)is known to have cancer-curing properties. Other examples include: Podophyllumhexandrum, Aconitum orochryseum, Delphinium glaciale, Pleurospermumamabile, Gentianaurnula, Corydalis crispa, Parnassiaovata, and Polygonatumverticilliatumfortheir valuable alkaloids and various medicinal properties; Allium spp., Fritillariaspp., andLiliumspp. as wild gene pools for future crop research; and Rheum nobile, Pterocephalushookeri, Aster spp., Seneciospp., Saussureaspp., Rhododendron spp., and Geranium spp.,
110 | B h u t a n E n v i r o n m e n t O u t l o o k 2 0 1 3

Some plant taxonomists reckon estimatethat there will be more than 7,000 species of vascular plant in the country. NJ Pearce and PJ Cribb, who authored The Orchids of Bhutan published by the Royal Botanic Garden Edinburgh and the RoyalGovernment of Bhutan in 2002, have estimated that an additional 200 or more species of orchids alone are likely to be discovered in the country in future. These include 14 orchid species and 91 other plant species. The 14 endemic orchid species have been named in The Orchids of Bhutan by (Pearce and Cribb, 2002).7
“‘The Flora of Bhutan”’, which consists of three volumes of three parts each, provides a comprehensive description of the country’s flora. The species described belong to eight families of Gymnosperms, 180 families of Dycotyledons, and 66 families of Monocotyledons. In addition, the National Biodiversity Centre has recorded 410 species of pteridophytes (ferns and fern allies) through ongoing inventories in various regions of the country.8.
(Table on new recorded species of flora and fauna from Forestry facts and figures)
Insect-fungiBhutan, given its wide-ranging geo-climatic conditions, is also expected to be very rich in insect-fungi although records are currently very limited. The Chinese caterpillar fungus Cordycepssinensis, found in the alpine meadows of the country, is highly valued for its medicinal properties as an aphrodisiac and cure of lung and kidney ailments. A kilogram of this insect-fungi species known as YartsaGuenbub in Bhutanese, can fetch more than US$2,400 within the domestic market itself. Although listed as a totally protected species inthe Forest and Nature Conservation Act 1995, collection and trade of YartsaGuenbub havebeen legalized since 2006 to provide local communities with additional income-earningopportunities. The collection and trade of thise species isare regulated by the Ministry ofAgriculture and Forests (MoAF). Field studies have been initiated in 2007 to study the occurrence andecology of insect-fungi in the country, starting with the subtropical region of the country.
About 50 species of insect-fungi have been recorded in Gedu forest area alone by a surveyteam comprising Bhutanese foresters, a phytochemist from the ITMS, and an
7The information on other endemic plant species is based on personal communication with TandinWangdi, curator of the National Herbarium at the National Biodiversity Center, Serbithang.Meconopsisspp., Epilobiumspp., Anemone spp., Potentillapedicularisand Talaumahodgsonias potential horticultural crops for ornamental purpose.
8The figure may change once the National Biodiversity Centre has completed field verification and literature research of the recorded species of pteridophytes.
111 | B h u t a n E n v i r o n m e n t O u t l o o k 2 0 1 3
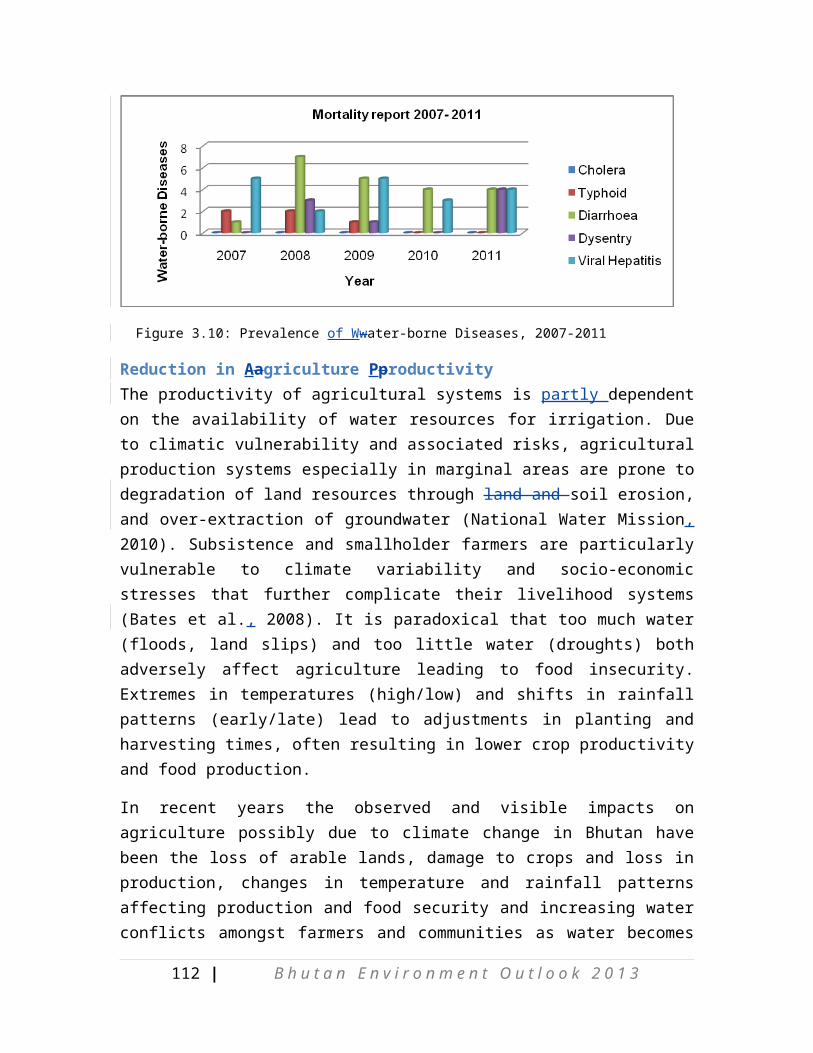
internationalinsect-fungi scientist. The preliminary record includes a highly possible new species ofinsect-fungi, which has been provisionally named Cordycepsbhutanensis.9.
About 50 species of insect-fungi have been recorded in Gedu forest area alone by a survey team comprising Bhutanese foresters, a phytochemist from the ITMS, and an international insect-fungi scientist. The preliminary record includes a highly possible new species of insect-fungi, which has been provisionally named Cordyceps bhutanensis.
MushroomsThe National Mushroom Centre has recorded more than 90 species of forest mushroomsin the country. Several species such as Cantherelluscibarius(Sissishamu in Dzongkha,Clavariabotry_s(Bjichukangro in Dzongkha) and Auriculariaauricula(Jillinamchu inDzongkha) are popular in Bhutanese cuisine. Tricholomamatsutake(Sangayshamu inDzongkha) is much sought in European and Japanese culinary markets.
WildFfauna
MammalsClose to 200 species of mammals are known to occur in the country. This is extraordinary for a country, which is one of the smallest countries in Asia. Although there are relatively few endemic mammal species, the high species richness combined with the availability of well-preserved habitats across various altitudinal and climatic zones together probably makes for what is probably the only example of an intact faunal assemblage in the Eastern Himalayas. This ecological integrity provides preconditions in Bhutan for a prime sanctuary for numerous Palearctic and Indo-Malayan mammal species. These species include a number of globally threatened mammals such as the Bengal Tiger Pantheratigristigris, snow leopard Unciauncia, cloudedleopard Neofelisnebulosa, red panda Ailurusfulgens, Bhutan takinBudorcastaxicolorwhitei, golden langurTrachypithecusgeei, capped langurTrachypithecuspileatus, Asianelephant Elephasmaximus, and Himalayan musk deer Moschuschrysogasterleucogaster.Altogether, there are 27 globally threatened species of mammals (refer table 5.1) in the country (Forestry Facts, Figures & Trends 2011).
Table 5.1 Globally Threatened Mammal Species found in BhutanSpecies Global StatusPygmy Hog SussalvaniusGolden LangurTrachypithecusgeeiCapped LangurTrachypithecuspileatus
Critically EndangeredEndangeredEndangered
9Kuensel, 3rd December 2007
112 | B h u t a n E n v i r o n m e n t O u t l o o k 2 0 1 3

Dhole/ Wild Dog CuonalpinusRed Panda AilurusfulgensBengal Tiger PantheratigristigrisSnow Leopard UnciaunciaAsian Elephant ElephasmaximusOne-horned Rhinoceros RhinocerosunicornisAsiatic Water Buffalo BubalusbubalisHispid Hare CaprolagushispidusGanges River Dolphin PlatanistagangeticaAssamese Macaque MacacaassamensisSloth Bear MelursusursinusHimalayan Black Bear UrsusthibetanuslanigerHimalayan Musk Deer MoschuschrysogasterSmooth-coated Otter LutrogaleperspicillataFishing Cat PrionailurusviverrinusMarbled Cat PardofelismarmorataClouded Leopard NeofelisnebulosaAsiatic Golden Cat CatopumatemminckiSwamp Deer CervusduvauceliGaur BosgaurusSerowCapricornissumatraensisTakinBudorcastaxicolorMouse-eared Bat MyotissicariusSikkim Rat Rattussikkimensis
EndangeredEndangeredEndangeredEndangeredEndangeredEndangeredEndangeredEndangeredEndangeredVulnerableVulnerableVulnerableVulnerableVulnerableVulnerableVulnerableVulnerableVulnerableVulnerableVulnerableVulnerableVulnerableVulnerableVulnerable
Source: Red List of Threatened Species, IUCN, 2008
High species richness, availability of unspoiled natural habitats in large parts and relativelysmall demographic pressure has made the country a haven for wildlife. Many speciesthat are striving for survival elsewhere exist in healthy numbers in Bhutan. For instance,country-wide tiger status surveys between 1996–1998 revealed a conservative estimateof 115 to 150 tigers, including 67 to 81 breeding adults, occurring in contiguous distributionspread over an area of 10,714 km2 ( McDougal &Tshering, 1998. This means that the country has a potentially viablepopulation of tigers that can serve as a vital gene pool for future tiger conservationefforts.(briefpara on recent trapping of tiger (14 nos) in Manas NP)
The golden langur is another example of a species which is on the verge of extinctionelsewhere in its range but occurs abundantly in Bhutan. Golden langur habitat andpopulation surveys conducted in the mid-1990s had revealed available habitat of over3,400 km2 and a population of more than 4,000 golden langurs across the country.
Several mammal species are habitat specialists and consequently have restricted range.For instance, blue sheep use alpine meadows for grazing and venture into alpine scree inthe ridge tops above the meadows. During winter, blue sheep migrate down into the alpinescrub habitat. Takin follow the blue sheep migratory pattern but remain in one habitatcategory below by migrating into alpine scrub in summer and down to sub-
113 | B h u t a n E n v i r o n m e n t O u t l o o k 2 0 1 3

alpine and cooltemperate broadleaf forests in the winter. The distribution of snow leopard is restrictedto the higher elevations such as alpine scree and meadows. Musk deer, usually found inmoist sub-alpine forests, overlap with the red panda, which inhabit old growth mixedconifer and temperate forests with heavy moss cover on trees and bamboo undergrowth.Intriguingly in Bhutan, tiger, which is generally associated with sub-tropical and tropicalhabitats, has been found at elevations up to 4,000 m.10.
AvifaunaBhutan has an outstanding birdlife with 678 species recorded so far. On a global scale, the country is recognized as forming a part of several globally important bird regions. It is a part of the Sino-Himalayan mountain forests, Indo-Burmese forests, Indo-Gangetic grasslands, South Asian arid habitats, and Tibetan plateau wetlands – all categorized as globally important bird regions by BirdLife International.
There are 14 globally threatened bird species and ten restricted range bird species in the country. Of the 14 that are globally threatened, one species i.e. white-bellied heron is considered critically endangered. The others are categorized as vulnerable and they include black-necked crane, rufous-necked hornbill, chestnut-breasted partridge, Pallas’s fish eagle, beautiful nuthatch, wood snipe, Blyth’s tragopan, greater spotted eagle, Imperial eagle, Baer’s pochard, Hodgson’s bushcat, and grey-crowned prinia.
Considering the criticality of conserving the species from extinction and its their endangered state, the MoAFproposal to add six species of bird under the ‘Schedule One’ in the Forest and Nature Conservation Act has beenwas approved by Ccabinet in February 2012. The proposed bird species are White-bellied Heron, Chestnut-breasted Hill Patridge, White-rumped vulture, Beautiful Nuthatch, Blyth’s Tragopan, and Satyr tragopan.
HerpetofaunaIn terms of herpetofauna, very little fewstudies and ordocumentations have been done although the country is considered to be rich in reptiles and amphibians particularly in the tropical/sub-tropical areas. Preliminary wildlife surveys in the early 1990s recorded 15 reptiles and three amphibians in Royal Manas National Park. Subsequently, in 1999, 23 species of reptiles and amphibians were recorded in the same park duringaweek-long herpetological survey training for the park staff of Royal Manas National Park. The recorded list includes globally threatened species such as the Gharial, Indian Python and Yellow Monitor Lizard. Further, a study conducted by the Bumdeling Wildlife Sanctuary,
10 Matt Walker : Lost tiger population discovered in Bhutan mountains (http://news.bbc.co.uk/earth/hi/earth_news/newsid_8998000/8998042.stm)
114 | B h u t a n E n v i r o n m e n t O u t l o o k 2 0 1 3

recorded 38 species of snake and 7 lizards. The current list of snake species recorded is totals55.
InvertebratesLimited information on invertebrates is currently available. Some record of the butterflies of Bhutan has been carried out only in the recent years and reportedly expected to havewith 800 to 900 species of butterflyexpected (van der Poel&Wangchuk, 2007). Of these, 140 species havebeen catalogued with photographs in the Butterflies of Bhutan booklet published by theRoyal Society for the Protection of Nature in 2007.11. These include some rare speciessuch as the Blue Duake Euthaliadurgaand Blue Forester Lethe scandal. Internationallyprotected species such as the Bhutan Glory Bhutanitislidderaliiand Kaiser-i-HindTeinopalpusimperialisare also known to occur in the country although they have not yetbeen photographically catalogued since they are rarely seen.In February 2012, the Ggovernment has approved to naminge Ludlow’s Bhutan Swallowtail as the National Butterfly of Bhutan. Swallowtails are rare and endemic to Bhutan.
At the present, four indigenous species of bees are known to be found in the country: .These species are Apiscerena, Apisdorsata, Apislaboriosa, and Apis florae. However, thebeekeeping industry in the country is currently promoting an introduced European speciesApismelifera. Observations made by beekeeping veterans in the country suggest changestaking place in the population dynamics of the wild bees. Information on their distribution,trends and characteristics are limited. Their contribution to agricultural productivitythrough pollination is also not widely recognized in the country. Apislaboriosa, which isconsidered a rare species, is still less understood and not many references are available.
Fish faunaThe fish fauna of the countryBhutan has not yet been properly assessed. Existing records list 50 freshwater fish species including eight introduced species.12. The main indigenous fish species include Himalayan trout Bariliussppand mahseerTor tor, which is listed as a totally protected species in the Forest and Nature Conservation Act 1995. Amongst introduced species, brown trout Salmotrutiatruttais the most common.
Domestic Biodiversity
Agricultural crops Bhutan’s diversity of about 80 agricultural crop species is quite impressive. About 80 species ofagricultural crops are expected to occur in the country. The main crops 11 The booklet catalogues butterflies sighted in habitats ranging from 800 to 3,000m.12 www.fishbase.org
115 | B h u t a n E n v i r o n m e n t O u t l o o k 2 0 1 3

include: (i) cerealssuch as rice, maize, barley, millet, wheat, and buckwheat (pseudo cereal); (ii) fruits such asapple, orange, and pear; (iii) vegetables such as potato, bean, and cabbage; and (iv) spices suchas chili, cardamom, garlic, and ginger. The crop species diversity can be further brokendown into numerous landraces that occur as a consequence of adaptation to microenvironmentscreated by altitudinal and climatic variations. For instance, there are some350 landraces of rice, 47 of maize, 24 of wheat, and 30 of barley.
Several of the crop varieties represent adaptations to some of the highest agricultural lands in the world, with cultivation in the alpine agro-ecological zone extending up to 4,600 m. For example, while wheat is not an indigenous crop, varieties grown around Laya are adapted to higher altitudes and colder climatic conditions than wheat varieties in other parts of the world. Similarly, maize and barley have undergone a natural process of breeding and selection to evolve into high-elevation varieties. A few other crop species have been domesticated; for example, buckwheat is indigenous and at least one putative wild relative, Fagopyrumdebotrys, is found in the wild in Bhutan. Foxtail millet is another indigenous crop species with a wild relative, Setariaviridis. Two wild relatives of oats, Avenafatua and A. sativa, are found in the country. There are also numerous wild relatives of horticultural crops such as apple, pear and citrus in the temperate and subtropical forests of the country.
Bhutanese rice is unique in that it represents an intermediate type between the twomajor groups of Oryza sativa, “indica” and “japonica” (“javanica” is a less significant thirdgroup). There are an estimated 350 varieties of rice in the country, many adapted tomicro-environments, and thus creating a very valuable and unique gene pool. At least twowild relatives of rice, O. minutaand O. rufipogon, are known to be found in the country.
In addition, four wild relatives of lentil, Vigna radiate var sub-lobata, V. vexillata, V. pilosa,and V. trilobata, and three wild relatives of pigeon pea, Cajanusgrandiflorus, C. mollis, C.elangatus, are known to occur in Bhutanthe country.
Livestock diversityLivestock diversity in Bhutan basically consists of bovines, caprines, ovines, equines, avians,swines, canines and felines. Among cattle, Nublang is a Bosindicusbreed believed to haveoriginated in Sombegewogof Haa. Its key characteristics are disease resistance, strengthand high butterfat content in milk. MithunBosfrontalisis a descendant of Gaur, whichoriginated in Northeast India but has been bred in Bhutan since at least the 17th century.Mithun (male) are often crossbred with Thrabam (female of Nublang) to
116 | B h u t a n E n v i r o n m e n t O u t l o o k 2 0 1 3
reproduce Jatsaand Jatsham, which are productively superior compared to either of the parent breeds.(picture of yak, and other breed of cattle)
Then there is Goleng, a Bostauruscattle species probably originating in Tibet, which iscommonly used for cross-breeding with yaks. The yaks in Bhutan are similar to those which occur commonly elsewhere in the Himalayasand Tibetan plateau. There appears to be distinct genetic differences between yaks ineastern and western Bhutan, with higher level of genetic diversity in the east. Yak andcattle hybridization is commonly practiced in central and eastern Bhutan, producingseveral sub-breeds such as Zo and Zom.
Horse breeds found in the country are also considered to be unique. These breeds areknown as Yuta, Boeta, Mera-Saktenpa, and Jata. Ass breeds are imported from Tibet orIndia for crossbreeding with horses to produce mules.(picture of horse)
Bhutanese sheep have been genetically investigated and classified into three types,namely Jakar, Sipsu and Sakten types. In particular the Jakar type is unique to centralBhutan. It is highly threatened as farmers are giving up sheep husbandry practicesbecause they are no more longereconomically viable.
Bhutan has managed to ensure preservation of its environment in the most natural state even under the unprecedented economic progress. This has been mostly possible because of strong political support and visionary leaders and Bhutanese traditional values and way of life that revere everything around them – both living and non-living. However, the conservation of our natural environment is increasingly becoming challenging with growing population and fast paced economic development.
Impact
Population DepletionBiodiversity boosts ecosystem productivity where each species, no matter how small, all have an important role to play. Having healthy biodiversity will providesa number of natural, biological and social services such as; protection of water resources, soil formation and protection, nutrient storage and recycling, pollution breakdown and absorption maintenance of ecosystem, climate stability, food chain, medicinal resources, recreation and tourism etc. Loss of a single species from the ecosystem will maycause serious threat to many species.
Habitat fragmentationIt is the process by which natural habitat is damaged or destroyed to such an extent that
117 | B h u t a n E n v i r o n m e n t O u t l o o k 2 0 1 3

it no longer capable of supporting the species and ecological diversity that naturally existed. It often results in the extinction of species and, as a result, the loss of biodiversity.
Habitat can be fragmented directly by many human activities, most of which involve the clearing of land for other uses such as agriculture, mining, logging, hydroelectric dams and urbanization. Habitat can also be fragmented indirectly by human activities such as pollution, climate change and the introduction of invasive species. Although much habitat destruction can be attributed to human activity, it is not an exclusively man-made phenomenon. Habitat loss also occurs as a result of natural events such as floods, volcanic eruptions, earthquakes, and climate fluctuations.
The effects of habitat destruction not only impact native species and communities, but they impact human populations as well. Landsisare frequently lost to erosion, desertification, and nutrient depletion. Natural disasters such as floods, droughts, outbreak of pests and water pollution take a toll on human populations.
Our planet is changing continuously, triggering habitats to be altered and modified. FOur forests are subject to changes by both natural and manmade forces such as forest fire, development activities, landslides, floods, drought, and climate change. Habitat fragmentation threatens species that need large areas of natural habitats for survival. From the biodiversity perspective it fragmentationwill trigger species depletion, loss of genetic diversity and loss of evolutionary potential.
Response
Strict Eenforcement of Laws, Rules and RegulationsSeveral statutes and policies pertaining to conservation and protection of environment have been formulated and enacted some as early asgoing back to 1957.13.One of the significant steps taken in the field of environmental conservation is incorporation of an explicit chapter on environment in the Constitution of the Kingdom of Bhutan. Besides Major policy responses have been enactment of several acts and its theirregulations, accession of multi-lateral environmental agreements, development of environmental standards, codes of best practices, and devolution environmental governance.;In addition, the Forest Protection and Surveillance Unit was established in March 2010 under the Department of Forest and Park Services as Department’s thecentral enforcement unit to curb forest offences and co-ordinate the surveillance throughout the country.
13 The ThrimzhungChenmo 1957 provides open access to use of forest resources and also provides for conservation in the form of restrictions on poaching of wildlife.
118 | B h u t a n E n v i r o n m e n t O u t l o o k 2 0 1 3

Protection of Wild Fauna and FloraThe revised list of Schedule I species of flora and fauna of Forest and Nature Conservation Act, 1995 saw an increased in the number of totally protected species to 36 inclusive of 17 mammals, 11 birds, 1 fish and 7 plants. Further, 14 new species of flora and fauna were recorded and updated by the Department. These species are provided the highest level of protection with respect to our country’s status.
Establishment and Management of Protected AreasThe Protected Area (PA) system in Bhutan is one of the most comprehensive in the world not only in the terms ofr area coverage but also in terms of the balance and contiguity in distribution across the country. The system encompasses a continuum of representational samples of all major ecosystems found in the country ranging from the tropical/subtropical grasslands and forests in the central mountain and valleys to alpine meadows and scree in the northern mountains (Forestry Facts, Figures & Trends, 2011). Bhutan’s first exemplary conservation work was the declaration of Manas Wildlife Sanctuary in 1966. The same sanctuarywas later upgraded to Royal Manas National Park (RMNP) in 1993. In addition to the existing network of comprehensive PAs, Wangchuck Centennial Park (WCP) was inaugurated in 2008, coinciding with the 100 years of centenary celebration. ThisePAProtected Areais also the largest in Bhutan, with an area of 4,319 kKm2, covering 5 Dzongkhags and home tos some of the magnificent species such as Snow Leopard (Pantherauncia) and a range of Himalayan ungulates. Conservation management plans for Phibsoo Wildlife Sanctuary and Toorsa Strict Nature Reserve are ready for field implementation.
In order for the people publicto continue enjoying the benefits and ecosystem services from PAs, the Ggovernment manages PAs based on sound scientific management principles and operates on the afive year planning cycle.
Integrated Conservation and Development ProgramHuman-wildlife conflict scenarios across Bhutan depends on the species. Southern part Bhutansees most confrontation with elephants with annual estimated crop loss ranging from 0.3-18% of the total household income. (Forestry Development in Bhutan: Policies, Programmes and Institution, 2011). Considering the magnitude of this conflict, the Wildlife Conservation Division (WCD) aided by donor agencies has implemented an Integrated Conservation and Development Program (ICDP). Unlike in the south, farmers of west, east, north and central Bhutan are constantly terrorized by wild pigs, ungulates and primates. ICDP helps in meeting communities’ developmental aspirations and conservation of biodiversity with sustainable utilization of resources. In the 9 th and 10th
Five Year Plans, Nu. 113.796 millionmnwas spent on ICDP activities by National Parks
119 | B h u t a n E n v i r o n m e n t O u t l o o k 2 0 1 3

and Wildlife Sanctuaries. (Forestry Development in Bhutan: Policies, Programmes and Institution, 2011).
Livestock compensation scheme is one of the mitigation measures undertaken to compensate for livestock predated by wild carnivores like tTigers, sSnow lLeopards, wWild dogs, lLeopards, and bBears. etc.Mmonetary compensation of Nu.65, 24,150 hasve been paid for the loss of livestock to datetill now (Forestry Development in Bhutan: Policies, Programmes and Institution, 2011).
Human Wildlife Conflict ManagementThe Department of Forests and Park Services have developed the “Bhutan National Human Wildlife Conflict Management Strategy 2008” in an effort to successfully address the conflict issues.
ONumerous other mitigation measuresresponses include (i) Pilot Community Livestock Insurance Scheme, (ii) Pilot Community Crop Insurance Scheme, (iii) iImprovement of rural livelihoods via diversification of NWFP, and (iv) cCombating crop damage by installing various eco-friendly and electronic measures like solar electric fencing, ultrasonic alarming devices, etc.
TIn an effort to provide compensation and help farmers in conservation of wildlife, a Human Wildlife Conflict Management Endowment Fund was launched on inApril 8th, 2011 where donations are collected from gGovernment agencies, corporate bodies, private companies and interested individuals. This basically helps in understanding the dynamics of wildlife conservation vis-à-vis conflict. As of December 2011,Nu.19, 60, 179 wasere collected from various donors as of December 2011 (Forestry Facts, Figures & Trends, 2011).
One of the most successful management strategies is maintenance of bBiological cCorridors (BCs) for the smooth crusade passageof wild animals. Since the declaration of corridors in 1999, the country has 3,307.14 kKm2 (8.61% of total geographical area) of areas under BCs which interlinks all the National Parks and Wildlife Sanctuaries (Forestry Facts, Figures & Trends, 2011).
120 | B h u t a n E n v i r o n m e n t O u t l o o k 2 0 1 3

6. Climate Change and Disaster (Cross Cutting Issues)LandLoss of crops due to outbreaks of pests and diseases, erratic rainfalls, windstorms, droughts and flashfloods/landslides due to climate change are reported to be increasing annually in Bhutan.
Second National Communication to the UNFFC reports, in 1996, that farmers in the high altitude areas lost between 80-% to 90% of rice yields to rice blast epidemic. In 2007, in an outbreak of northern corn blight disease, farmers loststhe maize harvest above 1,800 metres above mean sea level(Second National Communication to the UNFFC, 2011).
The late arrival of monsoons causes droughts and excessive monsoon rains causes natural disasters, such as floods and landslides. Extreme climatic events are have beenreported in greater frequency in recent years. In 2008, severe windstorms affected more than 320 households. The heavy summer monsoon rainfall of 2004 caused landslides in the east and damaged 39 irrigation channels, affected 161 acres of wetlands and 503 acres of dry land (Second National Communication to the UNFFC, 2011). In 2010, landslides and flash floods damaged more than 200 acres of agricultural land affecting 4,165 households and damaged farm roads and irrigation channels affecting 529 households, 40 acres of pastureland were washed away and over a thousand livestock killed (Department of Agriculture, 2011 and Livestock Ddisaster 2009-2010). In terms of food items, 350 million tonnes of maize, 126 million tonnes of paddy, and 2,000 citrus trees were damaged. In 2010, hail and windstorms damaged more than 5,000 acres of agricultural crops such as maize, rice, potato, chili, buckwheat and others (NAPA: Updated Projects and Profiles 2012, 2011).
Dema (2012) reported that Khaling residents experience erratic climatic conditions like widespread destruction of maize crops by windstorms, and potato and other crops decimated by insects. Such crop-related incidentsces due to climate change impacts are reported to be felt in Udzoronggewog of Trashigang too. For example, maize and potato plants wilted and around 150 decimals of maize fields in Threna village in Udzorong have died from dry spell (Wangdi, 2002).
Wangdi (2012) also reported that a month-long dry spell across the eastern district of Trashigang has parched agricultural lands, wilted crops, dried up drinking water sources, and it has driven scores of farmers to appease local deities for rain.
121 | B h u t a n E n v i r o n m e n t O u t l o o k 2 0 1 3

Sustainable land management practices will help reduce the GHG emissions and it is unlikely that the GHG emissions will increase in future due to various mitigation measures adopted for agricultural and forest sectors, livestock sector, energy sector, and industrial sector.
BiodiversityNTG Biodiversity (2011) reported changes in a number of animal species across all the eco-floristic zones with an observed increase in the populations of animals such as blue sheep, wild boar, takin, snow leopard, bear, and birds such as the laughing thrush, blood pheasant and monal pheasant. For example, there are reports of Himalayan black bear sightings during the hibernation season leading to conflicts with farmers in rural areas.
Changes in flowering time across the different eco-floristic zones has been reported with Rhododendron sp., Magnolia sp., Rosa sp., Juglans sp., Populus sp., Micheliadoltsopa, Prunus sp., Erythrina sp., Daubanga sp., Bombax sp.,( Second National, 2011). NTG Biodiversity (2011) also reported a significant increase in diversity of invasive species such as Mikaniamicarantha, Parthenium sp., and outbreaks of bark beetle in spruce forests, increased incidence of mistletoe infestation, and moisture stress related problems in blue pine forests. The survey also reported a high incidence of pests and diseases in crops, such as ants in potatoes, trunk borer in rice and wheat, and fruit fly, and diseases like Citrus greening, Turcicum Leaf Blight (TLB) and Gray Leaf Spot (GLS) in maize.
AirAccording to Second National Communicationission to the UNFCCC (2011), the occurrence of windstorms and damages has been recorded in the national newspaper (from 1994) and incidents of windstorms have been recorded every year. It also reports that Tthe severity and frequency of windstorms in Bhutan is reported to have increased over the past few years with hundred of houses being destroyed. In spring 2011, the successive windstorms affected sixteen of Bhutan’s twenty districts (Dzongkhags). In an assessment undertaken by the Department of Disaster Management, 2,424 rural homes, 81 religious structures, 57 schools, 21 health centres and 13 other government institutions were reported to be damaged across the affected districts.
WaterMelting glaciers and GLOFs are the visible impact of climate change in Bhutan. All major rivers more than doubled in size and the flows in the Punatshangchhu exceeded the volumes of the 1994 GLOF (Second National Communicationissio, 2011)(Ffigure 6.1). It also reports that Fflows in rivers are likely to decrease at low flow periods as a result of increased evaporation and runoff increase withdue to high rainfall events and waste
122 | B h u t a n E n v i r o n m e n t O u t l o o k 2 0 1 3
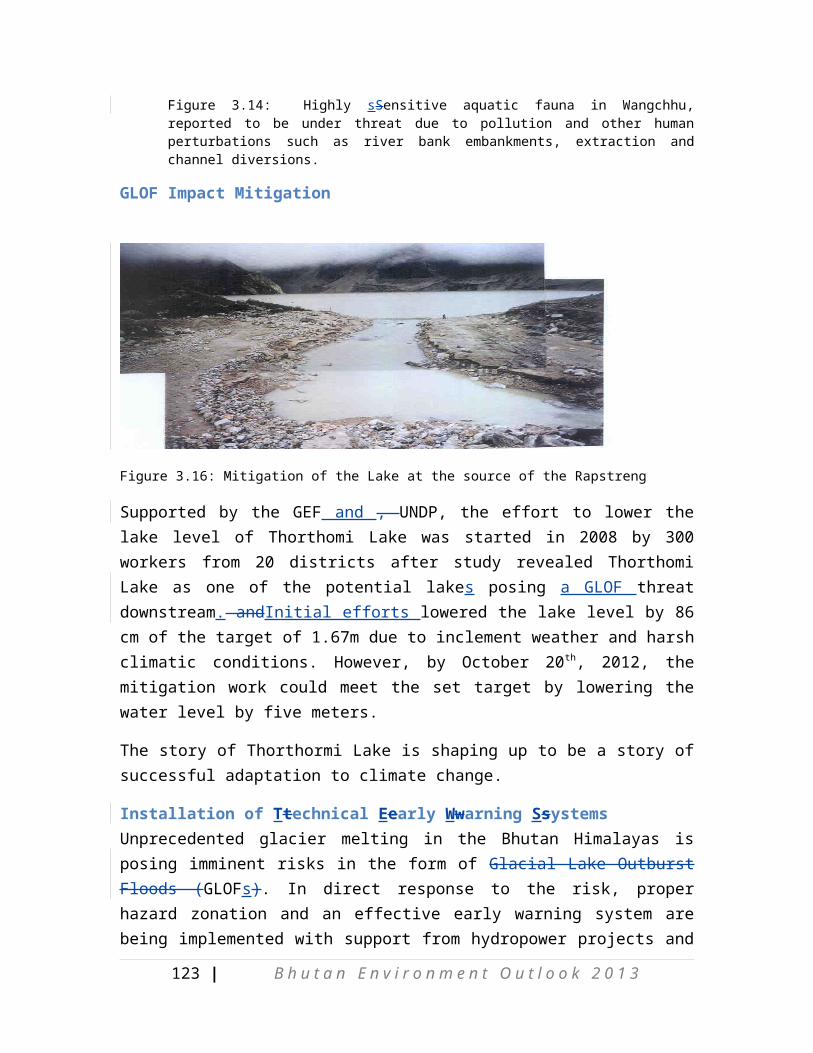
overflows (Second National Communicationission, 2011). It also reports that dDrying up of water sources,; especially drinking water, is increasing in Bhutan, especially in the eastern Bhutan. Rising temperatures and changes in precipitation will affect the timing of streamflowregimes and downstream agriculture due to retreat and loss of glacier.
Figure 6.1: Water volumes on the PuntsangChhu river at the Wangdi Rapids gauging station showing flows during 1994 GLOF and Cyclone Aila. Data source: Second National Communication, 2011
In some areas, especially Khaling in Trashigang, the residents experienced have observedthat the Dangling Tsho (lake) is drying up. It is reported, “tThe water level… was about 14m deep, covering the area of an archery range. But this year, there was very little amount of water.” (Dema,2012). Details on drying up of Dangling Tshois arementioned oin page xxx.
Climate cChange has many cross-cutting cultural linkages among land, air, biodiversity and water and its linkages areas presented in Table 6.1.
Table 6.1: Cross cutting linkages between the targeted sectors.
SECTORS Climate Change
Water Resources
Agriculture Forests and Biodiversity
Energy Production
Glaciers and GLOFs
Human Health
Climate Change
_ XXX XX XX XX XXX XX
Water Resources
XXX _ XXX XX XXX XX XX
Agriculture XXX XXX _ XXX X XX XX
123 | B h u t a n E n v i r o n m e n t O u t l o o k 2 0 1 3

Forestry and Biodiversity
XX XX XXX _ XX XX X
Energy Production
XX XXX X XX _ XX X
Glaciers and GLOFs
XXX XX XX XX XX _ XX
Human Health
XX XX XX X X XX _
X: Little impact, XX: Significant impact, XXX: Very Significant impact
Source: Second National Communication, 2011
124 | B h u t a n E n v i r o n m e n t O u t l o o k 2 0 1 3
Part 3.Environment Outlook
125 | B h u t a n E n v i r o n m e n t O u t l o o k 2 0 1 3

Environment Outlook based on Scenarios
126 | B h u t a n E n v i r o n m e n t O u t l o o k 2 0 1 3


