Page 1
BI SURVEY 14
The world´s largest survey of business intelligence software users
This document is a specially produced summary
by BARC of the headline results for
PYRAMID ANALYTICS
This document is not to be shared, distributed or reproduced in any way without prior permission of BARC
TH
E
Page 2
Pyramid Analytics in THE BI Survey 14
Page 2
Table of contents
THE BI Survey 14 Pyramid Analytics results overview ...................................................................... 3
Pyramid Analytics in THE BI Survey 14 ............................................................................................. 5
Introduction ..................................................................................................................................... 5
Pyramid Analytics overview ............................................................................................................ 5
Pyramid Analytics customer responses .......................................................................................... 5
User and use case demographics .................................................................................................. 6
Peer Groups ....................................................................................................................................... 8
The KPIs ............................................................................................................................................. 8
Summary .......................................................................................................................................... 50
Page 3
Pyramid Analytics in THE BI Survey 14
Page 3
THE BI Survey 14 Pyramid Analytics results overview
Dashboard vendor
Top ranked Leading
Collaboration
Performance satisfaction
Self-service
Project success
Price-to-value perception
Competitive win rate
Chosen as standard
Recommendation
Data discovery/visualization
Operational BI
Innovation
Query performance
Performance
Product satisfaction
Vendor support
Customer satisfaction
Agility
Ease of use
OLAP analysis vendor
Top ranked Leading
Chosen as standard
Recommendation
Collaboration
Data discovery/visualization
Operational BI
Performance satisfaction
Product satisfaction
Customer satisfaction
Self-service
Ease of use
Project success
Proportion of employees
Big data analytics
Competitive win rate
Mobile BI
Innovation
Query performance
Performance
Vendor support
Project length
Agility
Page 4
Pyramid Analytics in THE BI Survey 14
Page 4
Visual discovery vendor
Top ranked Leading
Price-to-value perception
Data volume
Chosen as standard
Collaboration
Operational BI
Query performance
Performance
Product satisfaction
Vendor support
Customer satisfaction
Self-service
Agility
Project success
Proportion of employees
Competitive win rate
Recommendation
Performance satisfaction
Ease of use
Page 5
Pyramid Analytics in THE BI Survey 14
Page 5
Pyramid Analytics in THE BI Survey 14
Introduction
The BI Survey 14 is based on findings from the world's largest and most comprehensive survey of
business intelligence end-users, conducted earlier this year. In total, 3,224 people responded to The
Survey with 2,348 answering a series of detailed questions about their usage of a named product.
Altogether, 34 products (or groups of products) are analyzed in detail.
The BI Survey 14 examines BI product selection and usage among users in areas including business
benefits, costs, proportion of employees using the product, competitiveness, recommendation,
innovation, performance, customer satisfaction and agility.
We asked several questions that helped us measure the business benefits derived from respondents’
deployments. The combined results were then used as a calibration tool – The Business Benefits
Index (BBI) - which is widely used throughout The Survey to assess the correlation between various
factors and the achievement of benefits.
Pyramid Analytics overview
Pyramid Analytics was founded in 2009 and is headquartered in Amsterdam. The privately held
company has about 100 employees. The vendor maintains offices in UK, France and USA. R&D is
based in Israel, while marketing and sales are driven out of the United States.
Pyramid Analytics has adopted a fresh approach to the BI market, with its product initially available for
Microsoft SQL Server and focused on reporting and ad hoc views.
The Pyramid Analytics BI Office Suite, based on Microsoft technology, seeks to bridge the gap
between enterprise and departmental BI tools. It features four business oriented BI tools on a common
platform. The four modules – Publisher for reporting, Dashboards, Data Discovery for ad-hoc OLAP
& tabular analysis, and Predicitive Analytics for predictive modeling and data mining – closely
resemble the Microsoft office products, not only in name but also in their design standards. Pyramid
Analytics offers tools for high-end analytics and data visualization.
While at present, Microsoft SQL Server is the most frequently used data source, the vendor can also
read from multiple data sources and the long-term plan is to support most DB vendors. Some of these
additional data sources include Excel, Access, delimited text files, Oracle, DB2, MySQL, zendesk,
salesforce, Redshift, SQL Server and SQL Azure within front-end enterprise mashups for data
visualization.
Pyramid Analytics’ customers choose the vendor’s product for its self-service capabilities, as it
supports drag-and-drop analytics queries across its modules. By extension, it is also considered the
top vendor among customers for ease of use. The vendor also leads other vendors in terms of
delivering customer satisfaction and collaborative capabilities. Customers employ Pyramid Analytics
for visual discovery, dashboarding and OLAP.
Pyramid Analytics customer responses
This is the second year that Pyramid Analytics features in The BI Survey. It appears this year with a
sample of 46 users.
Ninety-one percent of participants said they are using Pyramid Analytics version 5, and 9 percent are
using version 4.
Page 6
Pyramid Analytics in THE BI Survey 14
Page 6
User and use case demographics
Product usage (n= 46)
Company size (number of employees) (n=46)
Percentage of employees
using Pyramid Analytics
Pyramid Analytics 14%
Average of all products
15%
Number of users using
Pyramid Analytics
Median 50
Mean 163
87%
72%
70%
67%
67%
57%
33%
20%
20%
17%
15%
13%
17%
20%
24%
22%
28%
46%
39%
33%
43%
70%
Dashboards
Standard/Enterprise reporting
OLAP analysis
Ad hoc query
Visual analysis/Data discovery
Operational analytics
Scorecards
Budgeting/Planning
Financial consolidation
Big data analytics
Predictive analytics/Data mining
In use Planned
© BARC THE BI Survey 14
9%
70%
22%
Less than 100 100 - 2500 More than2500
Page 7
Pyramid Analytics in THE BI Survey 14
Page 7
Type of license model used (n=44)
Proportion of casual and power users (n=46))
Most Pyramid deployments are in the mid-market. Overall, enterprises using Pyramid Analytics report
relatively small numbers of users, which reflects the relative sophistication of the tools and analytic
capabilities.
Pyramid Analytics is used for a range of functions – including dashboarding, enterprise reporting,
OLAP, ad hoc queries and visual analysis. Customers also intend to start employing Pyramid
Analytics for a range of more sophisticated functions in the near future as well – including predictive
analytics and data mining, as well as scorecarding and big data analysis.
Relative to other vendors covered in this survey, there is a higher level of cloud adoption of Pyramid
Analytics cited by 5 percent.
64%
25%
7%
5%
0%
Purchased licensesup-front
Part of a bundle
Yearly software fee(on-premise)
Yearly software fee(cloud solution)
Open source © BARC THE BI Survey 14
75%
25%
Power user
Casual user
Page 8
Pyramid Analytics in THE BI Survey 14
Page 8
Peer Groups
The BI Survey features a range of different types of BI tools so we use peer groups to ensure similar
products are compared against each other. The groups are essential to allow fair and useful
comparisons of products that are likely to compete.
The peer groups are primarily data-driven and based on how customers say they use the product.
Pyramid Analytics features in the following peer groups:
- Dashboard
- OLAP analysis
- Visual discovery
The KPIs
The BI Survey 14 provides the reader with well-designed KPI dashboards packed with concise
information, which can be absorbed at a glance. The KPIs all follow these simple rules:
- Only measures that have a clear good/bad trend are used as the basis for KPIs
- KPIs may be based on one or more measures from The BI Survey
- Only products with samples of at least 20 - 30 (depending on the KPI) for each of the
questions that feeds into the KPI are included
- Each KPI is normalized so that the overall sample always has a value of 1.0
- The KPIs are calculated so that better-than-average products always have scores of
greater than 1.0, while less good products score less than 1.0. When viewing the peer
group KPI charts, note that the average for each peer group will usually be either higher or
lower than 1.0 because the peer groups are all subsets of the overall sample.
The products are sorted by value: the better the product the higher the value. The average is
displayed as a green bar and separates the products into two groups, those that performed better than
average and those that performed worse than aver-age.
For more details on the KPIs, see our ‘KPIs and Dashboards’ document.
Page 9
Pyramid Analytics in THE BI Survey 14
Page 9
Leading dashboard vendor in project success
Based on the implementation satisfaction level and the frequency of projects completed on time and
on budget
1.19
1.10
1.10
1.10
1.08
1.05
1.04
1.04
1.03
1.03
1.02
1.02
0.96
0.95
0.83
0.79
Dimensional Insight (1)
Information Builders (2)
Tableau (3)
Pyramid Analytics (4)
arcplan (5)
Qlik (6)
BOARD (7)
Yellowfin (8)
Entrinsik (9)
Dundas (10)
Average
Evidanza (11)
MicroStrategy (12)
Tibco (13)
IBM Cognos BI (14)
Oracle BI Found. Suite (15)
Average dashboard peer group
© BARC THE BI Survey 14
Page 10
Pyramid Analytics in THE BI Survey 14
Page 10
Leading OLAP analysis vendor in project success
Based on the implementation satisfaction level and the frequency of projects completed on time and
on budget
1.14
1.11
1.11
1.10
1.08
1.06
1.06
1.05
1.04
1.03
1.02
1.01
0.99
0.98
0.96
0.91
0.90
0.83
0.81
prevero (1)
Bissantz (2)
Jedox (3)
Pyramid Analytics (4)
Oracle Essbase (5)
Cubeware (6)
TARGIT (7)
cubus (8)
BOARD (9)
Infor (10)
Evidanza (11)
Average
IBM Cognos TM1 (12)
Microsoft SSAS (13)
MicroStrategy (14)
MS Excel & Power products (15)
Pentaho (16)
IBM Cognos BI (17)
SAP BW (18)
Average OLAP analysis peer group
© BARC THE BI Survey 14
Page 11
Pyramid Analytics in THE BI Survey 14
Page 11
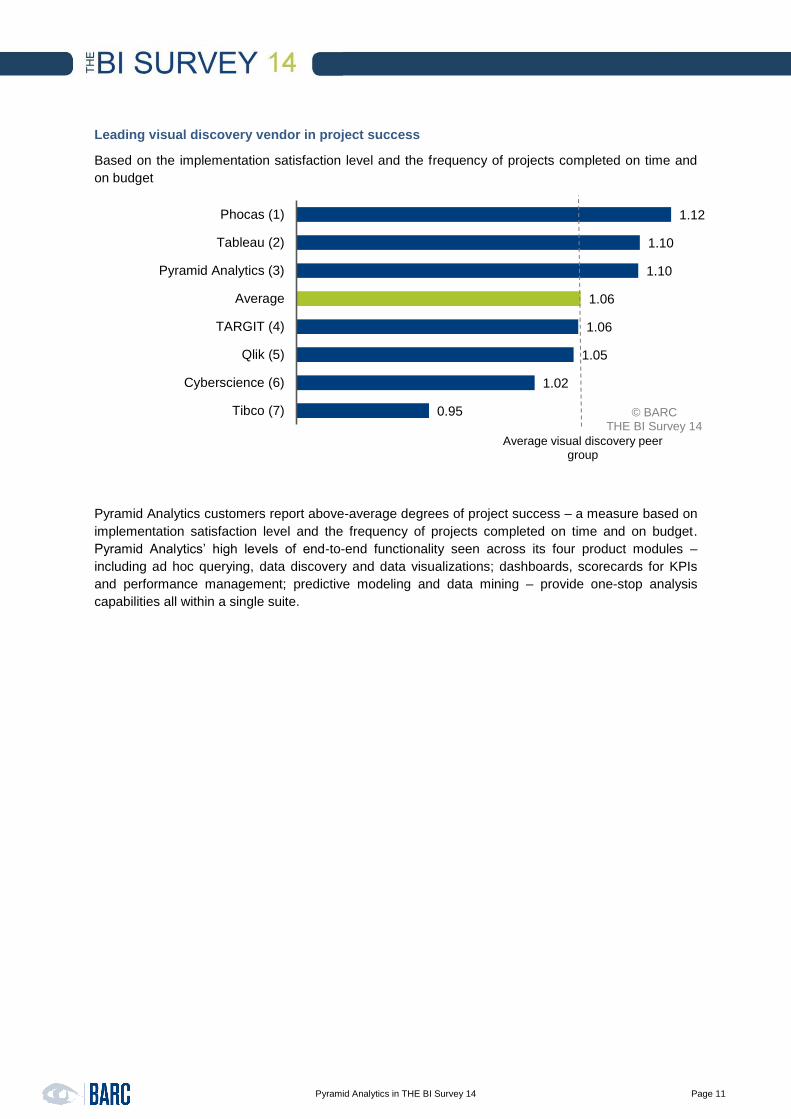
Leading visual discovery vendor in project success
Based on the implementation satisfaction level and the frequency of projects completed on time and
on budget
Pyramid Analytics customers report above-average degrees of project success – a measure based on
implementation satisfaction level and the frequency of projects completed on time and on budget.
Pyramid Analytics’ high levels of end-to-end functionality seen across its four product modules –
including ad hoc querying, data discovery and data visualizations; dashboards, scorecards for KPIs
and performance management; predictive modeling and data mining – provide one-stop analysis
capabilities all within a single suite.
1.12
1.10
1.10
1.06
1.06
1.05
1.02
0.95
Phocas (1)
Tableau (2)
Pyramid Analytics (3)
Average
TARGIT (4)
Qlik (5)
Cyberscience (6)
Tibco (7)
Average visual discovery peer group
© BARC THE BI Survey 14
Page 12
Pyramid Analytics in THE BI Survey 14
Page 12
Leading dashboard vendor in price-to-value perception
Based on how many users buy their BI tool for its price-performance ratio
Top ranked visual discovery vendor in price-to-value perception
Based on how many users buy their BI tool for its price-performance ratio
With so much functionality packed into Pyramid Analytics’ suite, it’s no surprise that customers see the
product set offering very good price per value.
1.85
1.53
1.44
1.36
1.19
1.04
0.94
0.86
0.86
0.76
0.73
0.61
0.57
0.52
0.51
0.26
Yellowfin (1)
Entrinsik (2)
Dundas (3)
Pyramid Analytics (4)
Tableau (5)
BOARD (6)
Average
arcplan (7)
Evidanza (8)
Qlik (9)
Dimensional Insight (10)
IBM Cognos BI (11)
Oracle BI Found. Suite (12)
MicroStrategy (13)
Information Builders (14)
Tibco (15)
Average dashboard peer group
© BARC THE BI Survey 14
1.36
1.19
1.15
0.88
0.81
0.76
0.66
0.26
Pyramid Analytics (1)
Tableau (2)
Phocas (3)
Average
TARGIT (4)
Qlik (5)
Cyberscience (6)
Tibco (7)
Average visual discovery peer group
© BARC THE BI Survey 14
Page 13
Pyramid Analytics in THE BI Survey 14
Page 13
Leading OLAP analysis vendor in proportion of employees
Based on the percentage of employees that use the product
Leading visual discovery vendor in proportion of employees
Based on the percentage of employees that use the product
A true sign of successful adoption for a BI and analytics tool is its degree of adoption across the
enterprise. The availability of capabilities to help decision-makers at all levels – from the CEO to the
call center representatives – is key to BI and analytics strategies. Pyramid Analytics – with its multi-
layered capabilities – is rated highly by its customers for this accessibility.
3.75
1.34
1.16
1.13
1.13
1.13
1.06
1.05
1.03
1.00
0.90
0.90
0.78
0.75
0.75
0.63
0.60
0.60
0.43
MS Excel & Power products (1)
TARGIT (2)
Pyramid Analytics (3)
Evidanza (4)
IBM Cognos BI (4)
prevero (4)
Average
Microsoft SSAS (7)
SAP BW (8)
BOARD (9)
Bissantz (10)
MicroStrategy (10)
Cubeware (12)
Jedox (13)
Oracle Essbase (13)
cubus (15)
Infor (16)
Pentaho (16)
IBM Cognos TM1 (18)
Average OLAP analysis peer group
© BARC THE BI Survey 14
2.40
1.34
1.16
1.06
1.00
0.61
0.50
0.42
Phocas (1)
TARGIT (2)
Pyramid Analytics (3)
Average
Qlik (4)
Cyberscience (5)
Tableau (6)
Tibco (7)
Average visual discovery peer group
© BARC THE BI Survey 14
Page 14
Pyramid Analytics in THE BI Survey 14
Page 14
Top ranked visual discovery vendor in data volume
Based on the median volume of data in databases used with the BI tool
Visual discovery tools need to be able to access large data sets to provide an accurate picture of
trends impacting enterprises. Pyramid Analytics is the clear leader in this category, comfortably
outpacing its nearest rival in terms of customer ratings.
1.47
1.03
0.96
0.74
0.57
0.56
0.45
0.12
Pyramid Analytics (1)
Tableau (2)
Tibco (3)
Average
TARGIT (4)
Qlik (5)
Cyberscience (6)
Phocas (7)
Average visual discovery peer group
© BARC THE BI Survey 14
Page 15
Pyramid Analytics in THE BI Survey 14
Page 15
Leading OLAP analysis vendor in big data analytics
Based on how many sites currently use big data analytics with their BI tool
Just as Pyramid Analytics’ visual discovery capabilities are highly rated in terms of supporting large
data sets, its OLAP component is seen as a critical tool for big data analysis.
2.13
1.62
1.31
1.22
1.17
1.08
0.99
0.94
0.89
0.84
0.72
0.68
0.57
0.56
0.55
0.54
0.49
0.45
0.21
TARGIT (1)
prevero (2)
Bissantz (3)
Pyramid Analytics (4)
BOARD (5)
MS Excel & Power products (6)
Infor (7)
Cubeware (8)
Average
IBM Cognos TM1 (9)
MicroStrategy (10)
Evidanza (11)
cubus (12)
Microsoft SSAS (13)
SAP BW (14)
IBM Cognos BI (15)
Oracle Essbase (16)
Jedox (17)
Pentaho (18)
Average OLAP analysis peer group
© BARC THE BI Survey 14
Page 16
Pyramid Analytics in THE BI Survey 14
Page 16
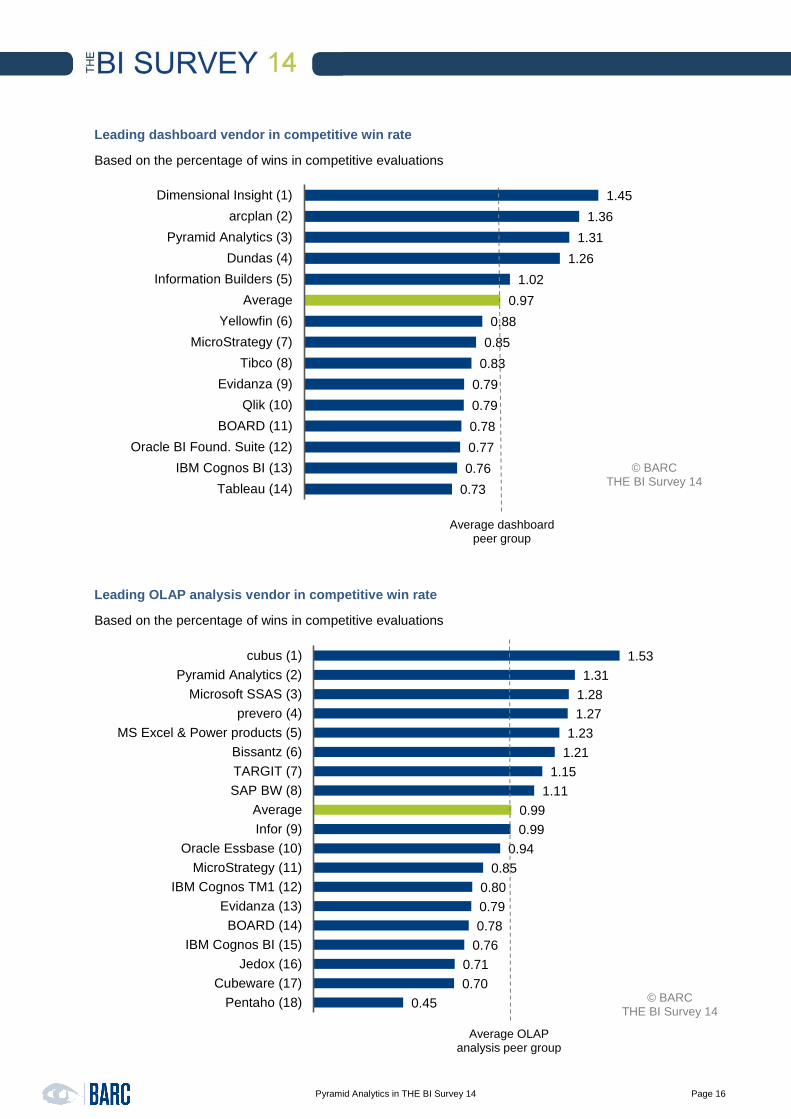
Leading dashboard vendor in competitive win rate
Based on the percentage of wins in competitive evaluations
Leading OLAP analysis vendor in competitive win rate
Based on the percentage of wins in competitive evaluations
1.45
1.36
1.31
1.26
1.02
0.97
0.88
0.85
0.83
0.79
0.79
0.78
0.77
0.76
0.73
Dimensional Insight (1)
arcplan (2)
Pyramid Analytics (3)
Dundas (4)
Information Builders (5)
Average
Yellowfin (6)
MicroStrategy (7)
Tibco (8)
Evidanza (9)
Qlik (10)
BOARD (11)
Oracle BI Found. Suite (12)
IBM Cognos BI (13)
Tableau (14)
Average dashboard peer group
© BARC THE BI Survey 14
1.53
1.31
1.28
1.27
1.23
1.21
1.15
1.11
0.99
0.99
0.94
0.85
0.80
0.79
0.78
0.76
0.71
0.70
0.45
cubus (1)
Pyramid Analytics (2)
Microsoft SSAS (3)
prevero (4)
MS Excel & Power products (5)
Bissantz (6)
TARGIT (7)
SAP BW (8)
Average
Infor (9)
Oracle Essbase (10)
MicroStrategy (11)
IBM Cognos TM1 (12)
Evidanza (13)
BOARD (14)
IBM Cognos BI (15)
Jedox (16)
Cubeware (17)
Pentaho (18)
Average OLAP analysis peer group
© BARC THE BI Survey 14
Page 17
Pyramid Analytics in THE BI Survey 14
Page 17
Leading visual discovery vendor in competitive win rate
Based on the percentage of wins in competitive evaluations
Pyramid Analytics comes out on top in customers’ competitive evaluation across a wide breadth of
categories, including dashboards, OLAP tools, and data discovery tools. User oriented and sporting a
fresh design, the product has been implemented well, especially its OLAP analysis which has been
well received. Users feel at home with the tool. This has contributed to its excellent win rate.
1.58
1.31
1.15
1.06
0.83
0.79
0.73
Phocas (1)
Pyramid Analytics (2)
TARGIT (3)
Average
Tibco (4)
Qlik (5)
Tableau (6)
Average visual discovery peer group
© BARC THE BI Survey 14
Page 18
Pyramid Analytics in THE BI Survey 14
Page 18
Leading dashboard vendor in chosen as standard
How often the product is chosen to standardize on by respondents at multi-product sites
Top ranked OLAP analysis vendor in chosen as standard
How often the product is chosen to standardize on by respondents at multi-product sites
1.18
1.17
1.14
1.09
1.06
1.05
1.04
1.03
1.02
0.99
0.99
0.96
0.96
0.96
0.83
0.82
Entrinsik (1)
Pyramid Analytics (2)
Evidanza (3)
Yellowfin (4)
IBM Cognos BI (5)
BOARD (6)
Information Builders (7)
Dimensional Insight (8)
Average
MicroStrategy (9)
Oracle BI Found. Suite (10)
arcplan (11)
Qlik (12)
Tableau (13)
Tibco (14)
Dundas (15)
Average dashboard peer group
© BARC THE BI Survey 14
1.17
1.14
1.10
1.10
1.09
1.06
1.05
1.03
1.03
1.01
1.01
0.99
0.99
0.98
0.95
0.94
0.91
0.69
0.61
Pyramid Analytics (1)
Evidanza (2)
SAP BW (3)
IBM Cognos TM1 (4)
Oracle Essbase (5)
IBM Cognos BI (6)
BOARD (7)
TARGIT (8)
Microsoft SSAS (9)
Cubeware (10)
Bissantz (11)
MicroStrategy (12)
Average
cubus (13)
MS Excel & Power products (14)
Infor (15)
Jedox (16)
prevero (17)
Pentaho (18)
Average OLAP analysis peer group
© BARC THE BI Survey 14
Page 19
Pyramid Analytics in THE BI Survey 14
Page 19
Top ranked visual discovery vendor in chosen as standard
How often the product is chosen to standardize on by respondents at multi-product sites
Just as Pyramid Analytics is seen by its customers as a strong competitor across several categories, it
also is highly regarded as setting standards across customers’ enterprises. Pyramid Analytics’ primary
customer base is among mid-size companies, a segment it clearly dominates – even being the
preferred choice over larger BI and analytics vendors, the study shows. Its visual discovery
component is especially strong.
1.17
1.12
1.04
1.03
1.02
0.96
0.96
0.83
Pyramid Analytics (1)
Phocas (2)
Cyberscience (3)
TARGIT (4)
Average
Qlik (5)
Tableau (6)
Tibco (7)
Average visual discovery peer group
© BARC THE BI Survey 14
Page 20
Pyramid Analytics in THE BI Survey 14
Page 20
Leading dashboard vendor in recommendation
Based on how many users would recommend the product to others
Top ranked OLAP analysis vendor in recommendation
Based on how many users would recommend the product to others
1.62
1.42
1.41
1.38
1.37
1.37
1.28
1.13
1.12
1.08
1.03
1.01
0.98
0.86
0.47
0.40
Dimensional Insight (1)
Entrinsik (2)
Tableau (3)
Yellowfin (4)
Pyramid Analytics (5)
Qlik (6)
Information Builders (7)
BOARD (8)
Average
Evidanza (9)
arcplan (10)
Tibco (11)
Dundas (12)
MicroStrategy (13)
IBM Cognos BI (14)
Oracle BI Found. Suite (15)
Average dashboard peer group
© BARC THE BI Survey 14
1.37
1.21
1.20
1.19
1.17
1.13
1.08
1.08
1.08
0.93
0.93
0.90
0.86
0.84
0.77
0.60
0.56
0.47
0.32
Pyramid Analytics (1)
Microsoft SSAS (2)
cubus (3)
Bissantz (4)
Jedox (5)
BOARD (6)
Oracle Essbase (7)
Evidanza (8)
prevero (9)
Average
IBM Cognos TM1 (10)
TARGIT (11)
MicroStrategy (12)
MS Excel & Power products (13)
Cubeware (14)
Pentaho (15)
Infor (16)
IBM Cognos BI (17)
SAP BW (18)
Average OLAP analysis peer group
© BARC THE BI Survey 14
Page 21
Pyramid Analytics in THE BI Survey 14
Page 21
Leading visual discovery vendor in recommendation
Based on how many users would recommend the product to others
Word of mouth is the most powerful medium for advertising and sales, and Pyramid Analytics does
well in this regard. The vendor has gained a great deal of respect and confidence from its customers.
The vendor’s products are more likely than average to be recommended to peers and colleagues. In
particular, the vendor’s OLAP capabilities are more likely to be recommended to others by its
customers – even more so than Microsoft itself.
1.57
1.41
1.37
1.37
1.25
1.14
1.01
0.90
Phocas (1)
Tableau (2)
Pyramid Analytics (3)
Qlik (4)
Average
Cyberscience (5)
Tibco (6)
TARGIT (7)
Average visual discovery peer group
© BARC THE BI Survey 14
Page 22
Pyramid Analytics in THE BI Survey 14
Page 22
Top ranked dashboard vendor in collaboration
Based on how many sites currently use collaboration features with their BI tool
Top ranked OLAP analysis vendor in collaboration
Based on how many sites currently use collaboration features with their BI tool
1.76
1.74
1.74
1.73
1.51
1.33
1.23
1.19
1.17
1.08
0.95
0.90
0.80
0.65
0.63
0.37
Pyramid Analytics (1)
Tableau (2)
Evidanza (3)
Yellowfin (4)
Entrinsik (5)
Dundas (6)
Tibco (7)
Qlik (8)
Average
BOARD (9)
arcplan (10)
Information Builders (11)
MicroStrategy (12)
Dimensional Insight (13)
IBM Cognos BI (14)
Oracle BI Found. Suite (15)
Average dashboard peer group
© BARC THE BI Survey 14
1.76
1.74
1.63
1.52
1.46
1.22
1.10
1.09
1.08
1.06
1.01
0.95
0.82
0.80
0.74
0.63
0.62
0.58
0.30
Pyramid Analytics (1)
Evidanza (2)
TARGIT (3)
IBM Cognos TM1 (4)
cubus (5)
MS Excel & Power products (6)
Oracle Essbase (7)
prevero (8)
BOARD (9)
Average
Bissantz (10)
Microsoft SSAS (11)
Jedox (12)
MicroStrategy (13)
Infor (14)
IBM Cognos BI (15)
Cubeware (16)
SAP BW (17)
Pentaho (18)
Average OLAP analysis peer group
© BARC THE BI Survey 14
Page 23
Pyramid Analytics in THE BI Survey 14
Page 23
Top ranked visual discovery vendor in collaboration
Based on how many sites currently use collaboration features with their BI tool
Pyramid Analytics adds collaboration features to its Microsoft Office-like environment, and this results
in the top ranking across all its key functional areas. Collaborative abilities are essential with today’s
complex systems and business requirements, and many enterprises see a need for much of their
critical work to be performed by dynamic teams. Thus, collaboration has become a sought-after
feature in the BI market.
1.76
1.74
1.63
1.44
1.42
1.23
1.19
1.11
Pyramid Analytics (1)
Tableau (2)
TARGIT (3)
Average
Cyberscience (4)
Tibco (5)
Qlik (6)
Phocas (7)
Average visual discovery peer group
© BARC THE BI Survey 14
Page 24
Pyramid Analytics in THE BI Survey 14
Page 24
Leading dashboard vendor in data discovery/visualization
Based on how many sites currently use data discovery/visualization with their BI tool
Top ranked OLAP analysis vendor in data discovery/visualization
Based on how many sites currently use data discovery/visualization with their BI tool
1.99
1.68
1.62
1.58
1.58
1.54
1.32
1.21
1.18
0.97
0.95
0.84
0.83
0.76
0.73
0.57
Tableau (1)
Tibco (2)
Qlik (3)
Pyramid Analytics (4)
Dundas (5)
Yellowfin (6)
Dimensional Insight (7)
Average
Entrinsik (8)
BOARD (9)
arcplan (10)
Oracle BI Found. Suite (11)
MicroStrategy (12)
Evidanza (13)
IBM Cognos BI (14)
Information Builders (15)
Average dashboard peer group
© BARC THE BI Survey 14
1.58
1.56
1.08
1.04
0.98
0.97
0.94
0.92
0.87
0.83
0.76
0.74
0.73
0.66
0.60
0.57
0.57
0.56
0.51
Pyramid Analytics (1)
TARGIT (2)
Bissantz (3)
Microsoft SSAS (4)
cubus (5)
BOARD (6)
Pentaho (7)
MS Excel & Power products (8)
Average
MicroStrategy (9)
Evidanza (10)
prevero (11)
IBM Cognos BI (12)
Jedox (13)
Oracle Essbase (14)
SAP BW (15)
Cubeware (16)
IBM Cognos TM1 (17)
Infor (18)
Average OLAP analysis peer group
© BARC THE BI Survey 14
Page 25
Pyramid Analytics in THE BI Survey 14
Page 25
Data discovery and visualization capabilities enable decision makers to quickly digest insights on
trends through highly visual representations. Pyramid Analytics maintains excellent ratings for its
ability to support data discovery and visualization, including a top ranking in the OLAP Analysis
vendors peer group. As data grows increasingly complex, many decision makers find they can more
readily see insights and detect outliers if they are plotted in visual charts and graphs, versus being
buried in data tables.
Page 26
Pyramid Analytics in THE BI Survey 14
Page 26
Leading OLAP analysis vendor in mobile BI
Based on how many sites currently use mobile BI with their BI tool
Mobile BI and analytics is an area in which Pyramid Analytics’ customers see potential for the vendor’s
OLAP tool. Mobility is built into the BI Office architecture, which supports an HTML5 web-based
interface, and includes native mobile apps on iOS, Android, and WinRT and Windows 8.1 devices.
2.25
1.55
1.35
1.23
1.10
1.00
0.87
0.86
0.83
0.82
0.80
0.57
0.57
0.40
0.40
0.26
0.17
0.15
0.00
MicroStrategy (1)
TARGIT (2)
Pyramid Analytics (3)
Bissantz (4)
Evidanza (5)
IBM Cognos BI (6)
MS Excel & Power products (7)
Microsoft SSAS (8)
SAP BW (9)
Jedox (10)
Average
Cubeware (11)
Infor (12)
BOARD (13)
IBM Cognos TM1 (13)
Oracle Essbase (15)
Pentaho (16)
cubus (17)
prevero (18)
Average OLAP analysis peer group
© BARC THE BI Survey 14
Page 27
Pyramid Analytics in THE BI Survey 14
Page 27
Leading dashboard vendor in operational BI
Based on how many sites currently use operational BI with their BI tool
Top ranked OLAP analysis vendor in operational BI
Based on how many sites currently use operational BI with their BI tool
1.31
1.29
1.28
1.21
1.21
1.19
1.16
1.08
1.06
1.06
1.04
1.04
0.86
0.86
0.71
0.64
Information Builders (1)
Dimensional Insight (2)
Pyramid Analytics (3)
Evidanza (4)
Qlik (5)
Yellowfin (6)
MicroStrategy (7)
Tableau (8)
Average
IBM Cognos BI (9)
BOARD (10)
Entrinsik (11)
arcplan (12)
Oracle BI Found. Suite (13)
Dundas (14)
Tibco (15)
Average dashboard peer group
© BARC THE BI Survey 14
1.28
1.25
1.21
1.21
1.16
1.06
1.04
0.98
0.97
0.96
0.95
0.94
0.92
0.84
0.82
0.79
0.76
0.69
0.68
Pyramid Analytics (1)
TARGIT (2)
Evidanza (3)
Microsoft SSAS (4)
MicroStrategy (5)
IBM Cognos BI (6)
BOARD (7)
IBM Cognos TM1 (8)
Average
Oracle Essbase (9)
Pentaho (10)
Bissantz (11)
cubus (12)
Jedox (13)
SAP BW (14)
MS Excel & Power products (15)
prevero (16)
Cubeware (17)
Infor (18)
Average OLAP analysis peer group
© BARC THE BI Survey 14
Page 28
Pyramid Analytics in THE BI Survey 14
Page 28
Top ranked visual discovery vendor in operational BI
Based on how many sites currently use operational BI with their BI tool
Pyramid Analytics’ sweet spot is operational BI – in which insights are derived from data coming
directly out of production systems. The vendor is considered a leader in this area by its customers,
and is well-positioned to help customers identify and implement solutions that blend archived
analytical data within operational data to be able to gain situational awareness of opportunities or
issues impacting their businesses.
1.28
1.25
1.21
1.16
1.08
1.05
0.75
0.64
Pyramid Analytics (1)
TARGIT (2)
Qlik (3)
Cyberscience (4)
Tableau (5)
Average
Phocas (6)
Tibco (7)
Average visual discovery peer group
© BARC THE BI Survey 14
Page 29
Pyramid Analytics in THE BI Survey 14
Page 29
Leading dashboard vendor in innovation
Combines the ‘Cloud BI’, ‘Collaboration’, 'Data discovery/visualization', ‘Mobile BI’, 'Operational BI' and
‘Visual design standards’ KPIs to measure the product’s level of innovation
Leading OLAP analysis vendor in innovation
Combines the ‘Cloud BI’, ‘Collaboration’, 'Data discovery/visualization', ‘Mobile BI’, 'Operational BI' and
‘Visual design standards’ KPIs to measure the product’s level of innovation
1.98
1.61
1.30
1.26
1.24
1.13
1.13
1.11
1.10
1.10
1.07
0.98
0.88
0.74
0.74
0.66
Yellowfin (1)
Tableau (2)
Qlik (3)
Evidanza (4)
Pyramid Analytics (5)
Dundas (6)
Average
arcplan (7)
Tibco (8)
Dimensional Insight (9)
MicroStrategy (10)
Entrinsik (11)
BOARD (12)
Information Builders (13)
IBM Cognos BI (14)
Oracle BI Found. Suite (15)
Average dashboard peer group
© BARC THE BI Survey 14
1.34
1.26
1.24
1.24
1.11
1.07
0.95
0.94
0.89
0.88
0.88
0.87
0.84
0.83
0.79
0.75
0.74
0.72
0.65
Bissantz (1)
Evidanza (2)
TARGIT (3)
Pyramid Analytics (4)
MS Excel & Power products (5)
MicroStrategy (6)
Average
cubus (7)
Jedox (8)
Infor (9)
BOARD (10)
Microsoft SSAS (11)
prevero (12)
Cubeware (13)
IBM Cognos TM1 (14)
SAP BW (15)
IBM Cognos BI (16)
Oracle Essbase (17)
Pentaho (18)
Average OLAP analysis peer group
© BARC THE BI Survey 14
Page 30
Pyramid Analytics in THE BI Survey 14
Page 30
Innovation is a key advantage being sought by all types of organizations seeking to compete in today’s
global economy. BI and analytics are an essential technology in this regard, as much innovation will
be driven by data insights and predictive capabilities. Vendors need to be just as innovative with their
product offerings. Pyramid Analytics scores well in terms of delivering innovation defined in this survey
by the combined KPIs of ‘Cloud BI’, ‘Collaboration’, 'Data discovery/visualization', ‘Mobile BI’,
'Operational BI' and ‘Visual design standards’.
Page 31
Pyramid Analytics in THE BI Survey 14
Page 31
Leading dashboard vendor in query performance
How quickly queries respond, adjusted by data volume
Leading OLAP analysis vendor in query performance
How quickly queries respond, adjusted by data volume
1.81
1.38
1.27
1.26
1.25
1.21
1.11
1.09
1.09
1.03
0.97
0.95
0.91
0.91
0.83
0.38
Information Builders (1)
Dimensional Insight (2)
Pyramid Analytics (3)
Oracle BI Found. Suite (4)
Qlik (5)
Evidanza (6)
Tableau (7)
Average
arcplan (8)
Tibco (9)
BOARD (10)
MicroStrategy (11)
Dundas (12)
Yellowfin (13)
IBM Cognos BI (14)
Entrinsik (15)
Average dashboard peer group
© BARC THE BI Survey 14
1.37
1.33
1.27
1.23
1.21
1.13
1.10
1.06
0.99
0.97
0.95
0.89
0.83
0.83
0.81
0.79
0.71
0.66
0.59
Jedox (1)
Oracle Essbase (2)
Pyramid Analytics (3)
IBM Cognos TM1 (4)
Evidanza (5)
Bissantz (6)
cubus (7)
Microsoft SSAS (8)
Average
BOARD (9)
MicroStrategy (10)
Infor (11)
IBM Cognos BI (12)
SAP BW (13)
Cubeware (14)
TARGIT (15)
MS Excel & Power products (16)
prevero (17)
Pentaho (18)
Average OLAP analysis peer group
© BARC THE BI Survey 14
Page 32
Pyramid Analytics in THE BI Survey 14
Page 32
Top ranked visual discovery vendor in query performance
How quickly queries respond, adjusted by data volume
As data sets grow larger, and user demands rise, query performance becomes more than a luxury – it
is essential to keep systems from slowing to intolerable levels. Pyramid Analytics’ advantage is that it
sits on top of Microsoft SQL Server. As we’ve seen with Microsoft SQL Server Analysis Services, it
performs well. Focusing on one database technology, in this case from Microsoft, definitely helps
query performance because the environment can be optimized.
1.27
1.25
1.11
1.07
1.04
1.03
0.79
0.73
Pyramid Analytics (1)
Qlik (2)
Tableau (3)
Phocas (4)
Average
Tibco (5)
TARGIT (6)
Cyberscience (7)
Average visual discovery peer group
© BARC THE BI Survey 14
Page 33
Pyramid Analytics in THE BI Survey 14
Page 33
Top ranked dashboard vendor in performance satisfaction
Measures the frequency of complaints about the system’s performance
Top ranked OLAP analysis vendor in performance satisfaction
Measures the frequency of complaints about the system’s performance
1.14
1.12
1.11
1.09
1.09
1.08
1.06
1.06
1.05
1.05
1.03
0.95
0.94
0.93
0.90
0.82
Pyramid Analytics (1)
Qlik (2)
Dimensional Insight (3)
Yellowfin (4)
Tableau (5)
Information Builders (6)
BOARD (7)
Evidanza (8)
MicroStrategy (9)
arcplan (10)
Average
Oracle BI Found. Suite (11)
Tibco (12)
Entrinsik (13)
Dundas (14)
IBM Cognos BI (15)
Average dashboard peer group
© BARC THE BI Survey 14
1.14
1.11
1.10
1.09
1.08
1.08
1.06
1.06
1.05
1.02
0.99
0.98
0.98
0.93
0.92
0.83
0.82
0.75
0.57
Pyramid Analytics (1)
Oracle Essbase (2)
IBM Cognos TM1 (3)
cubus (4)
Jedox (5)
Bissantz (6)
BOARD (7)
Evidanza (8)
MicroStrategy (9)
Infor (10)
Microsoft SSAS (11)
MS Excel & Power products (12)
Average
Cubeware (13)
TARGIT (14)
prevero (15)
IBM Cognos BI (16)
Pentaho (17)
SAP BW (18)
Average OLAP analysis peer group
© BARC THE BI Survey 14
Page 34
Pyramid Analytics in THE BI Survey 14
Page 34
Leading visual discovery vendor in performance satisfaction
Measures the frequency of complaints about the system’s performance
On average, fewer customers have complaints about Pyramid Analytics Office BI Suite than
customers of other vendors. The system employs the best of Microsoft tools, and has tightly integrated
modules that ensure more seamless BI and analytics activities.
1.14
1.14
1.12
1.09
1.09
1.06
0.94
0.92
Phocas (1)
Pyramid Analytics (2)
Qlik (3)
Tableau (4)
Cyberscience (5)
Average
Tibco (6)
TARGIT (7)
Average visual discovery peer group
© BARC THE BI Survey 14
Page 35
Pyramid Analytics in THE BI Survey 14
Page 35
Leading dashboard vendor in performance
A combination of the ‘Query performance’ and ‘Performance satisfaction’ KPIs
Leading OLAP analysis vendor in performance
A combination of the ‘Query performance’ and ‘Performance satisfaction’ KPIs
1.44
1.25
1.21
1.18
1.13
1.10
1.10
1.07
1.06
1.02
1.00
1.00
0.99
0.91
0.83
0.66
Information Builders (1)
Dimensional Insight (2)
Pyramid Analytics (3)
Qlik (4)
Evidanza (5)
Tableau (6)
Oracle BI Found. Suite (7)
arcplan (8)
Average
BOARD (9)
Yellowfin (10)
MicroStrategy (11)
Tibco (12)
Dundas (13)
IBM Cognos BI (14)
Entrinsik (15)
Average dashboard peer group
© BARC THE BI Survey 14
1.23
1.22
1.21
1.16
1.13
1.10
1.10
1.02
1.02
1.00
0.98
0.96
0.87
0.86
0.84
0.83
0.74
0.70
0.67
Jedox (1)
Oracle Essbase (2)
Pyramid Analytics (3)
IBM Cognos TM1 (4)
Evidanza (5)
Bissantz (6)
cubus (7)
Microsoft SSAS (8)
BOARD (9)
MicroStrategy (10)
Average
Infor (11)
Cubeware (12)
TARGIT (13)
MS Excel & Power products (14)
IBM Cognos BI (15)
prevero (16)
SAP BW (17)
Pentaho (18)
Average OLAP analysis peer group
© BARC THE BI Survey 14
Page 36
Pyramid Analytics in THE BI Survey 14
Page 36
Top ranked visual discovery vendor in performance
A combination of the ‘Query performance’ and ‘Performance satisfaction’ KPIs
Pyramid Analytics gets high marks in this year’s survey in terms of overall performance, a composite
score based on a combination of the ‘Query performance’ and ‘Performance satisfaction’ KPIs. Its
visual discovery capabilities – which already are highly rated across a number of categories – are
seen as high value from this perspective.
1.21
1.18
1.11
1.10
1.05
0.99
0.91
0.86
Pyramid Analytics (1)
Qlik (2)
Phocas (3)
Tableau (4)
Average
Tibco (5)
Cyberscience (6)
TARGIT (7)
Average visual discovery peer group
© BARC THE BI Survey 14
Page 37
Pyramid Analytics in THE BI Survey 14
Page 37
Leading dashboard vendor in product satisfaction
Based on the frequency of problems encountered with the product
Top ranked OLAP analysis vendor in product satisfaction
Based on the frequency of problems encountered with the product
3.99
2.49
1.75
1.62
1.62
1.47
1.41
1.33
1.28
1.22
1.16
1.12
0.90
0.88
0.64
0.62
Dimensional Insight (1)
Pyramid Analytics (2)
Qlik (3)
Evidanza (4)
arcplan (5)
Average
Information Builders (6)
Entrinsik (7)
Tableau (8)
Yellowfin (9)
MicroStrategy (10)
BOARD (11)
Dundas (12)
Tibco (13)
Oracle BI Found. Suite (14)
IBM Cognos BI (15)
Average dashboard peer group
© BARC THE BI Survey 14
2.49
2.13
1.70
1.62
1.41
1.39
1.29
1.23
1.22
1.19
1.16
1.12
1.05
1.03
0.85
0.65
0.62
0.59
0.43
Pyramid Analytics (1)
Bissantz (2)
Oracle Essbase (3)
Evidanza (4)
Infor (5)
IBM Cognos TM1 (6)
cubus (7)
prevero (8)
Average
Jedox (9)
MicroStrategy (10)
BOARD (11)
Cubeware (12)
Microsoft SSAS (13)
TARGIT (14)
Pentaho (15)
IBM Cognos BI (16)
MS Excel & Power products (17)
SAP BW (18)
Average OLAP analysis peer group
© BARC THE BI Survey 14
Page 38
Pyramid Analytics in THE BI Survey 14
Page 38
Top ranked visual discovery vendor in product satisfaction
Based on the frequency of problems encountered with the product
In today’s highly competitive market, product and service quality are critical to maintaining customer
loyalty. For many years in the BI and analytics space, customers have been able to endure
shortcomings and bugs mainly because of the relatively small handful of analysts and executives
using the tools. This can no longer be sustained as BI and analytics tools become ingrained into the
work of employees across the board. For this reason, Pyramid Analytics is well-positioned for the
coming shift in BI, with an impressive amount of customer good will toward its product set.
2.49
2.11
1.75
1.55
1.47
1.28
0.88
0.85
Pyramid Analytics (1)
Phocas (2)
Qlik (3)
Average
Cyberscience (4)
Tableau (5)
Tibco (6)
TARGIT (7)
Average visual discovery peer group
© BARC THE BI Survey 14
Page 39
Pyramid Analytics in THE BI Survey 14
Page 39
Top ranked visual discovery vendor in vendor support
Measures user satisfaction with the level of vendor support provided for the product
Leading dashboard vendor in vendor support
Measures user satisfaction with the level of vendor support provided for the product
1.43
1.33
1.30
1.19
1.16
1.05
0.92
0.86
Pyramid Analytics (1)
Cyberscience (2)
Phocas (3)
Tableau (4)
Average
Qlik (5)
TARGIT (6)
Tibco (7)
Average visual discovery peer group
© BARC THE BI Survey 14
1.53
1.46
1.43
1.39
1.33
1.29
1.26
1.23
1.19
1.14
1.05
1.03
0.96
0.86
0.64
0.38
Dimensional Insight (1)
Yellowfin (2)
Pyramid Analytics (3)
Dundas (4)
Entrinsik (5)
Information Builders (6)
arcplan (7)
BOARD (8)
Tableau (9)
Average
Qlik (10)
MicroStrategy (11)
Evidanza (12)
Tibco (13)
IBM Cognos BI (14)
Oracle BI Found. Suite (15)
Average dashboard peer group
© BARC THE BI Survey 14
Page 40
Pyramid Analytics in THE BI Survey 14
Page 40
Leading OLAP analysis vendor in vendor support
Measures user satisfaction with the level of vendor support provided for the product
Pyramid Analytics scores impressively well in terms of vendor support to its customers, and after-sales
service is top-ranked in the Visual Discovery vendors peer group. This is quite an achievement for a
new entrant to the market which has caught up with its competition to offer a high standard of support.
1.45
1.43
1.42
1.36
1.23
1.17
1.04
1.03
1.02
1.02
1.01
0.96
0.92
0.79
0.76
0.65
0.64
0.64
0.57
cubus (1)
Pyramid Analytics (2)
Bissantz (3)
prevero (4)
BOARD (5)
Jedox (6)
Infor (7)
MicroStrategy (8)
Cubeware (9)
Pentaho (10)
Average
Evidanza (11)
TARGIT (12)
IBM Cognos TM1 (13)
Microsoft SSAS (14)
Oracle Essbase (15)
IBM Cognos BI (16)
MS Excel & Power products (17)
SAP BW (18)
Average OLAP analysis peer group
© BARC THE BI Survey 14
Page 41
Pyramid Analytics in THE BI Survey 14
Page 41
Leading dashboard vendor in customer satisfaction
Combines the ‘Product satisfaction’, ‘Vendor support’ and ‘Implementer support’ KPIs
Top ranked OLAP analysis vendor in customer satisfaction
Combines the ‘Product satisfaction’, ‘Vendor support’ and ‘Implementer support’ KPIs
2.28
1.64
1.34
1.30
1.28
1.27
1.25
1.20
1.20
1.19
1.10
1.09
0.99
0.86
0.65
0.54
Dimensional Insight (1)
Pyramid Analytics (2)
arcplan (3)
Entrinsik (4)
Yellowfin (5)
Qlik (6)
Information Builders (7)
Evidanza (8)
Average
BOARD (9)
Dundas (10)
Tableau (11)
MicroStrategy (12)
Tibco (13)
IBM Cognos BI (14)
Oracle BI Found. Suite (15)
Average dashboard peer group
© BARC THE BI Survey 14
1.64
1.60
1.31
1.31
1.20
1.19
1.16
1.14
1.12
1.10
1.08
1.03
1.02
0.99
0.93
0.77
0.65
0.65
0.62
Pyramid Analytics (1)
Bissantz (2)
prevero (3)
cubus (4)
Evidanza (5)
BOARD (6)
Jedox (7)
Infor (8)
Oracle Essbase (9)
IBM Cognos TM1 (10)
Average
Cubeware (11)
TARGIT (12)
MicroStrategy (13)
Microsoft SSAS (14)
Pentaho (15)
MS Excel & Power products (16)
IBM Cognos BI (17)
SAP BW (18)
Average OLAP analysis peer group
© BARC THE BI Survey 14
Page 42
Pyramid Analytics in THE BI Survey 14
Page 42
Top ranked visual discovery vendor in customer satisfaction
Combines the ‘Product satisfaction’, ‘Vendor support’ and ‘Implementer support’ KPIs
Far more than any other category, customer satisfaction is the most important outcome for any
business within any industry. In the crowded BI and analytics market, customers have a lot of choices,
so BI and analytics vendors need to pay more attention to customer satisfaction than their
counterparts in other parts of the software world. In The BI Survey, customer satisfaction is a measure
based on a composite of the ‘Product satisfaction’, ‘Vendor support’ and ‘Implementer support’ KPIs –
and Pyramid Analytics takes the top spots across all three of its product classifications. The vendor’s
commitment to working closely with each customer, and constantly seeking new ways to more tightly
integrate its software suite, has placed the vendor in good stead with its customers.
1.64
1.57
1.34
1.27
1.26
1.09
1.02
0.86
Pyramid Analytics (1)
Phocas (2)
Cyberscience (3)
Qlik (4)
Average
Tableau (5)
TARGIT (6)
Tibco (7)
Average visual discovery peer group
© BARC THE BI Survey 14
Page 43
Pyramid Analytics in THE BI Survey 14
Page 43
Leading OLAP analysis vendor in project length
Based on how quickly the product is implemented
Project complications are the bane of any enterprise and, unfortunately, a commonplace occurrence
within the BI and analytics space. Data sources need to be identified and made available, users need
to be trained, and administrators need to be trained to deliver the right kind of reporting. Pyramid
Analytics is clearly targeted towards the end user. Its newly developed platform sits behind business
user-oriented models. This result shows it’s possible to set up the product quite quickly. Users aren’t
hampered by long training periods. The result is an agile solution.
1.41
1.39
1.30
1.22
1.22
1.06
1.02
0.96
0.94
0.87
0.77
0.71
0.67
0.56
0.55
0.53
0.52
0.43
0.42
Jedox (1)
MicroStrategy (2)
MS Excel & Power products (3)
cubus (4)
Pyramid Analytics (5)
Bissantz (6)
TARGIT (7)
IBM Cognos BI (8)
Infor (9)
Average
Oracle Essbase (10)
BOARD (11)
Evidanza (12)
Cubeware (13)
IBM Cognos TM1 (14)
Microsoft SSAS (15)
SAP BW (16)
prevero (17)
Pentaho (18)
Average OLAP analysis peer group
© BARC THE BI Survey 14
Page 44
Pyramid Analytics in THE BI Survey 14
Page 44
Top ranked dashboard vendor in self-service
Based on how many sites currently use self-service features with their BI tool
Top ranked OLAP analysis vendor in self-service
Based on how many sites currently use self-service features with their BI tool
1.33
1.32
1.26
1.25
1.15
1.14
1.10
1.06
1.06
1.06
1.01
1.00
0.99
0.93
0.65
0.62
Pyramid Analytics (1)
Information Builders (2)
Dimensional Insight (3)
IBM Cognos BI (4)
Yellowfin (5)
Entrinsik (6)
Evidanza (7)
MicroStrategy (8)
Average
Oracle BI Found. Suite (9)
BOARD (10)
Qlik (11)
Tableau (12)
Tibco (13)
arcplan (14)
Dundas (15)
Average dashboard peer group
© BARC THE BI Survey 14
1.33
1.25
1.25
1.21
1.16
1.12
1.11
1.10
1.09
1.08
1.06
1.06
1.01
0.97
0.91
0.87
0.85
0.84
0.81
Pyramid Analytics (1)
Jedox (2)
IBM Cognos BI (3)
Microsoft SSAS (4)
IBM Cognos TM1 (5)
cubus (6)
Cubeware (7)
Evidanza (8)
TARGIT (9)
Bissantz (10)
MicroStrategy (11)
Average
BOARD (12)
Infor (13)
MS Excel & Power products (14)
prevero (15)
Pentaho (16)
Oracle Essbase (17)
SAP BW (18)
Average OLAP analysis peer group
© BARC THE BI Survey 14
Page 45
Pyramid Analytics in THE BI Survey 14
Page 45
Top ranked visual discovery vendor in self-service
Based on how many sites currently use self-service features with their BI tool
Pyramid Analytics takes the first-place ranking among all vendors for its self-service capabilities.
Within its tightly integrated environment, Pyramid Analytics’ single platform enables analytics views to
be created and inserted into dashboards or reports by dragging and dropping. Dashboards are made
interactive by simply drawing arrows between data assets. The Universal Data Mash-up and
Connector tool (‘Mash-Pit’) enables users to take data from any data source (Big Data and small data)
and rapidly build data models. The BI Office Mash-Pit wizard enables non-technical end users to
“mash-up” one or more data sources through a point-and-click, web-driven wizard.
1.33
1.09
1.01
1.00
0.99
0.95
0.93
0.82
Pyramid Analytics (1)
TARGIT (2)
Average
Qlik (3)
Tableau (4)
Cyberscience (5)
Tibco (6)
Phocas (7)
Average visual discovery peer group
© BARC THE BI Survey 14
Page 46
Pyramid Analytics in THE BI Survey 14
Page 46
Top ranked visual discovery vendor in agility
Combines the ‘Project length’, ‘Self-service’ and 'Flexibility for users' KPIs
Leading dashboard vendor in agility
Combines the ‘Project length’, ‘Self-service’ and 'Flexibility for users' KPIs
1.19
1.17
1.14
1.13
1.09
1.06
1.03
0.94
Pyramid Analytics (1)
Phocas (2)
Qlik (3)
Tableau (4)
Average
Cyberscience (5)
Tibco (6)
TARGIT (7)
Average visual discovery peer group
© BARC THE BI Survey 14
1.21
1.19
1.19
1.17
1.17
1.14
1.13
1.10
1.05
1.03
1.02
0.98
0.97
0.95
0.82
0.70
Dimensional Insight (1)
Pyramid Analytics (2)
Information Builders (3)
Entrinsik (4)
Yellowfin (5)
Qlik (6)
Tableau (7)
MicroStrategy (8)
Average
Tibco (9)
BOARD (10)
Evidanza (11)
IBM Cognos BI (12)
Dundas (13)
arcplan (14)
Oracle BI Found. Suite (15)
Average dashboard peer group
© BARC THE BI Survey 14
Page 47
Pyramid Analytics in THE BI Survey 14
Page 47
Leading OLAP analysis vendor in agility
Combines the ‘Project length’, ‘Self-service’ and 'Flexibility for users' KPIs
Along with high marks for performance and self-service, Pyramid Analytics is considered a leader in
terms of agility. For purposes of this survey, agility is a composite category based on the ‘Project
length’, ‘Self-service’ and 'Flexibility for users' KPIs.
1.30
1.19
1.19
1.10
1.07
1.06
1.04
1.02
1.00
0.99
0.98
0.97
0.94
0.91
0.87
0.85
0.85
0.85
0.63
Jedox (1)
cubus (2)
Pyramid Analytics (3)
MicroStrategy (4)
MS Excel & Power products (5)
Bissantz (6)
Infor (7)
BOARD (8)
prevero (9)
Average
Evidanza (10)
IBM Cognos BI (11)
TARGIT (12)
IBM Cognos TM1 (13)
Oracle Essbase (14)
Pentaho (15)
Microsoft SSAS (16)
Cubeware (17)
SAP BW (18)
Average OLAP analysis peer group
© BARC THE BI Survey 14
Page 48
Pyramid Analytics in THE BI Survey 14
Page 48
Top ranked OLAP analysis vendor in ease of use
Based on how often the product was chosen for ease of use and the level of complaints about ease of
use post-implementation
Leading visual discovery vendor in ease of use
Based on how often the product was chosen for ease of use and the level of complaints about ease of
use post-implementation
1.35
1.28
1.18
1.05
1.05
0.99
0.99
0.99
0.97
0.91
0.89
0.86
0.82
0.79
0.72
0.71
0.68
0.68
0.38
Pyramid Analytics (1)
BOARD (2)
Jedox (3)
cubus (4)
MS Excel & Power products (5)
Oracle Essbase (6)
MicroStrategy (7)
Bissantz (8)
prevero (9)
Average
TARGIT (10)
IBM Cognos TM1 (11)
Cubeware (12)
Infor (13)
IBM Cognos BI (14)
Evidanza (15)
Pentaho (16)
Microsoft SSAS (17)
SAP BW (18)
Average OLAP analysis peer group
© BARC THE BI Survey 14
1.58
1.35
1.25
1.22
1.20
1.17
1.09
0.89
Tableau (1)
Pyramid Analytics (2)
Phocas (3)
Average
Qlik (4)
Cyberscience (5)
Tibco (6)
TARGIT (7)
Average visual discovery peer group
© BARC THE BI Survey 14
Page 49
Pyramid Analytics in THE BI Survey 14
Page 49
Leading dashboard vendor in ease of use
Based on how often the product was chosen for ease of use and the level of complaints about ease of
use post-implementation
Pyramid Analytics’ BI Office is top-ranked for agility and self-service, so it’s no surprise that the vendor
is among the few that have received the lowest levels of post-implementation complaints about ease
of use.
1.70
1.58
1.44
1.35
1.28
1.23
1.20
1.20
1.19
1.16
1.09
0.99
0.85
0.84
0.72
0.71
Entrinsik (1)
Tableau (2)
Yellowfin (3)
Pyramid Analytics (4)
BOARD (5)
Dimensional Insight (6)
Qlik (7)
Dundas (8)
arcplan (9)
Average
Tibco (10)
MicroStrategy (11)
Information Builders (12)
Oracle BI Found. Suite (13)
IBM Cognos BI (14)
Evidanza (15)
Average dashboard peer group
© BARC THE BI Survey 14
Page 50
Pyramid Analytics in THE BI Survey 14
Page 50
Summary
Pyramid Analytics is a simple-to-use tool that follows Microsoft Office standards. Although it has four
modules, it operates within a tightly integrated platform. Combined with attractive pricing, this is the
reason why investment in the product is favored by customers.
Rating high among customers are the vendor’s support for self-service, as well as its ability to deliver
customer satisfaction and collaborative capabilities. Customers employ Pyramid Analytics for visual
discovery, dashboarding and OLAP.
Sitting on top of Microsoft SQL Server, it performs well. Focusing on one database technology, in this
case from Microsoft, definitely helps query performance because the environment can be optimized.
Page 51
Copyright © BARC GmbH 2014. All rights reserved.
Business Application Research Center –
Central Europe
Berliner Platz 7
97080 Würzburg
Germany
+49 931 880651-0
www.barc.de
Rest of the World
+44 1536 772 451
www.barc-research.com