20
1 Financial Technology Monthly Sector Summary September 2017

1
Financial TechnologyMonthly Sector Summary
September 2017

2
Strong sector and product expertise across FinTech and related sub-sectorsGCA OVERVIEW
New York640 Fifth Avenue, 10th Fl.
New York, NY 10019United States
Phone: (212) 999-7090
San FranciscoOne Maritime Plaza, 25th Fl.
San Francisco, CA 94111United States
Phone: (415) 318-3600
Sean MinnihanManaging Director
Head of FinTechPhone: (212) 999 - 7077Mobile: (917) 364 - 6230
Rob FreimanDirectorFinTech
Phone: (212) 999 - 7075Mobile: (973) 229 - 0436 [email protected]
Kegan GreeneVice President
FinTechPhone: (415) 318 - 3648Mobile: (917) 579 - 4838 [email protected]
David KruegerVice President
FinServicesPhone: (212) 537 - 4534Mobile: (616) 822 - [email protected]
Steve FletcherManaging DirectorHead of Software
Phone: (415) 318 - 3661Mobile: (415) 518 - [email protected]
Peter BangManaging DirectorHead of FinServicesPhone: (212) 999 - 7074Mobile: (917) 783 - [email protected]
Chris GoughManaging Director
M&A/Real Estate Tech.Phone: (415) 318 - 3658Mobile: (415) 385 - [email protected]

3
A leading independent, global investment bankGCA OVERVIEW
San Francisco I New York I Manchester I London I Milan I Zurich I Frankfurt I Munich I Tel Aviv I Mumbai I New Delhi I Singapore I Shanghai I Osaka I Tokyo
GLOBAL
Global reach with 15 offices in 10 key markets – but deep local roots ensure close, hands-on support for our clients
TECH &INTERNET
Leading advisor in Tech and Internet sectors with strong networks in key tech hubs, including Silicon Valley
CROSS-BORDER
Expert advisor for cross-border transactions – the majority of our deals involve cross-border outcomes
GROWTHCOMPANIES
Strong expertise in advising growth companies and leading corporations in capital raising and M&A
400+
Over 400 M&A bankers and growth company experts in the U.S., in Europe and across Asia
350+
Over 350 deals closed in last 3 years, of which 33% were cross border

4
Select September Financing Transactions Percent Change Select September M&A Transactions
Date Company Selected Investors Amount Sub-Sector Subsector LTM 3 Years Date Target Buyer Value Sub-Sector
9/19/17 $60 23% 58% 9/25/17 $5,300
9/15/17 $60 17% 55% 9/25/17 $195
9/13/17 $70 22% 58% 9/13/17 $272
9/12/17 $149 10% 43% 9/7/17 $720
9/11/17 $115 12% 64% 9/6/17 $475
9/4/17 $78 34% 44% 9/5/17 $705
Quarterly Financing Activity ($Bn) 6% 3% Quarterly M&A Activity ($Bn)
21% 28%
28% 58%
19% 40%
39% 54%
Average Deal Size ($MM) Average Deal Size ($MM)
$82 Bn | 874 DealsLTM M&A Volume
Aggregate FinTech Market 21% 46%
S&P 500 16% 9%
$22 Bn | 1,471 DealsLTM Financing Volume Industry Stock Market Performance
Real Estate & Mortgage Tech.
Benefits Administration/Payroll
Information Services
Investment Technology
Trading Technology
Banking & Lending Technology
Insurance Technology
Financial SaaS
IT & BPO Services
Payments
Liquidity Venues
1
1
5
3
9
6
4
7
1
2
8
9
7
6
5
4
3
10
11
3
9
1
6
$10 $9
$6 $4 $4
$9
$5
Q1-16 Q2-16 Q3-16 Q4-16 Q1-17 Q2-17 Q3-17
436
377
$12.6$23.9$10.8$12.2$16.3$22.1$22.9
408
368
328
369
397
$17 $18 $24
$14
$23
$13
$32
Q1-16 Q2-16 Q3-16 Q4-16 Q1-17 Q2-17 Q3-17
264
244
195201
235222 216
$148$58.6$97.9$69.7$123$73.8$64.4
FINTECH DEAL DASHBOARD
Notes:Source: Pitchbook. CapIq. GCA Deal Database.Market data as of 9/30/17.(1) Includes private company equity financings.(2) Represents unweighted average, except for S&P 500.
The FinTech market is trading at 21% over the LTM period, as compared to 16% for the S&P 500. Quarterly financing volume is up modestly while amounts raised are down ~45%; quarterly M&A volume is down modestly while amounts raised are up ~150%
(1)
(1)
(2)

5
FINTECH PUBLIC COMPANY LANDSCAPEFinTech subsectors and key operating stats ($Bn)
Insurance Technology
Benefits Administration/Payroll Financial SaaS
Investment Technology
Banking & Lending Technology
Combined Market Cap.: $15617E/16A Rev. Growth: 10.5%
17E EBITDA Margin: 26.4%
Information Services
Combined Market Cap.: $9717E/16A Rev. Growth: 16.4%
17E EBITDA Margin: 19.9%
Combined Market Cap.: $9417E/16A Rev. Growth: 19.8%
17E EBITDA Margin: 21.6%
Combined Market Cap.: $24917E/16A Rev. Growth: 14.2%
17E EBITDA Margin: 25.9%
Combined Market Cap.: $2917E/16A Rev. Growth: 10.0%
17E EBITDA Margin: 12.1%
Combined Market Cap.: $31217E/16A Rev. Growth: 7.5% 17E EBITDA Margin: 30.9%
Notes:Source: CapIq.Revenue growth and EBITDA margins shown are median values for comp group.Market data as of 9/30/17.
1 2 3
4 5 6

6
FINTECH PUBLIC COMPANY LANDSCAPE (CONT’D)(3)
FinTech subsectors and key operating stats ($Bn)
Liquidity Venues PaymentsIT & BPO Services
Combined Market Cap.: $54517E/16A Rev. Growth: 10.0%
17E EBITDA Margin: 16.6%
Combined Market Cap.: $77217E/16A Rev. Growth: 12.5%
17E EBITDA Margin: 28.1%
Combined Market Cap.: $23317E/16A Rev. Growth: 12.7%
17E EBITDA Margin: 59.2%
Notes:Source: CapIq.Revenue growth and EBITDA margins shown are median values for comp group.Market data as of 9/30/17.
7 8 9
Real Estate & Mortgage Tech.
Combined Market Cap.: $21417E/16A Rev. Growth: 11.3%
17E EBITDA Margin: 17.9%
Trading Technology
Combined Market Cap.: $10517E/16A Rev. Growth: 12.1%
17E EBITDA Margin: 31.9%
10 11

7
FINTECH STOCK PRICE PERFORMANCE
3 Year Share Price Performance
LTM Share Price Performance
Notes:Source: CapIq. Market data as of 9/30/17.
Trading tech and investment tech lead the pack on an LTM basis, while insurance tech has outperformed over the past three years
6) Investment Technology
11) Trading Technology
1) Banking & Lending Technology
2) Benefits Administration/Payroll
3) Financial SaaS 5) Insurance Technology
4) Information Services
7) IT & BPO Services 8) Liquidity Venues 9) Payments 10) Real Estate & Mortgage Technology

8
FINTECH PUBLIC COMPANY VALUATIONLiquidity venues have outperformed the rest of the FinTech market on both an EV/ LTM revenue and EV/ NTM revenue basis
Notes:Source: CapIq.Market data as of 9/30/17.Lines display median multiples across comp groups for given year.
Enterprise Value / LTM RevenueEnterprise Value / LTM Revenue
Median Revenue Growth to EV / NTM Revenue MultipleEnterprise Value / NTM Revenue
6) Investment Technology
11) Trading Technology
1) Banking & Lending Technology
2) Benefits Administration/Payroll
3) Financial SaaS 5) Insurance Technology
4) Information Services
7) IT & BPO Services 8) Liquidity Venues 9) Payments 10) Real Estate & Mortgage Technology
1
2
3
4
56
7
8
910
11
3.5x 3.8x 4.0x4.5x
3.5x 3.8x 3.9x4.2x

9
FINTECH PUBLIC COMPANY VALUATION (CONT’D)Financial SaaS has outperformed the rest of the FinTech market on both an EV/ LTM EBITDA and EV/ NTM EBITDA basis
Notes:Source: CapIq.Market data as of 9/30/17.Lines display median multiples across comp groups for given year.
Enterprise Value / LTM EBITDAEnterprise Value / LTM EBITDA
Median EBITDA Growth to EV / NTM EBITDA MultipleEnterprise Value / NTM EBITDA
6) Investment Technology
11) Trading Technology
1) Banking & Lending Technology
2) Benefits Administration/Payroll
3) Financial SaaS 5) Insurance Technology
4) Information Services
7) IT & BPO Services 8) Liquidity Venues 9) Payments 10) Real Estate & Mortgage Technology
1
23
4
5
6
7 8
910
11
14.6x 15.3x 15.1x16.6x
12.8x 13.0x 12.6x
15.2x

10
Long-term growth is not necessarily correlated with FinTech public company P/E multiples or PEG ratiosFINTECH PUBLIC COMPANY VALUATION (CONT’D)
Notes: Figures represent medians of sub-sectors.Market data as of 9/30/17.Long-term EPS growth covers last 5 years.
21.7%
19.3%
12.4%
12.5%
16.6%
12.5%
11.5%
16.6%
9.3%
14.1%
12.4%
2.3
2.1
2.6
2.2
1.5
1.9
2.1
1.9
2.5
1.4
1.4
Insurance Technology
Financial SaaS
Investment Technology
Banking & Lending Tech
Information Services
Liquidity Venues
Payments
IT & BPO Services
Real Estate & Mort. Tech
Trading Technology
2017E P/E Multiple 2017E PEG Ratio
Long-Term EPS Growth
1
Benefits Admin/Payroll2
3
4
5
6
7
8
9
10
11
11
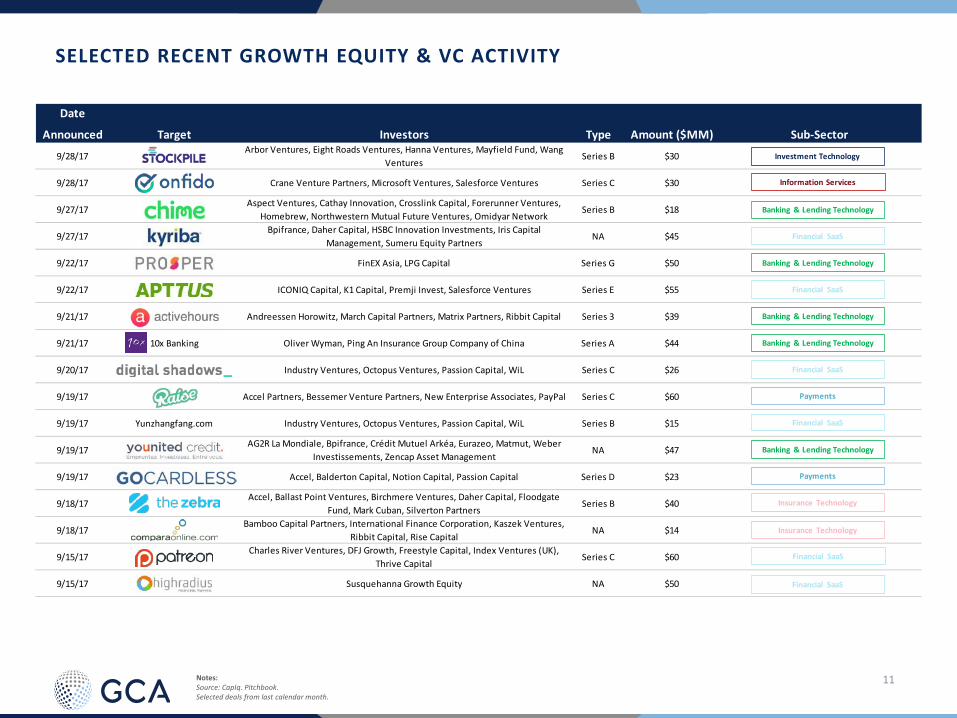
9/28/17Arbor Ventures, Eight Roads Ventures, Hanna Ventures, Mayfield Fund, Wang
VenturesSeries B $30
9/28/17 Crane Venture Partners, Microsoft Ventures, Salesforce Ventures Series C $30
9/27/17Aspect Ventures, Cathay Innovation, Crosslink Capital, Forerunner Ventures,
Homebrew, Northwestern Mutual Future Ventures, Omidyar NetworkSeries B $18
9/27/17Bpifrance, Daher Capital, HSBC Innovation Investments, Iris Capital
Management, Sumeru Equity Partners NA $45
9/22/17 FinEX Asia, LPG Capital Series G $50
9/22/17 ICONIQ Capital, K1 Capital, Premji Invest, Salesforce Ventures Series E $55
9/21/17 Andreessen Horowitz, March Capital Partners, Matrix Partners, Ribbit Capital Series 3 $39
9/21/17 10x Banking Oliver Wyman, Ping An Insurance Group Company of China Series A $44
9/20/17 Industry Ventures, Octopus Ventures, Passion Capital, WiL Series C $26
9/19/17 Accel Partners, Bessemer Venture Partners, New Enterprise Associates, PayPal Series C $60
9/19/17 Yunzhangfang.com Industry Ventures, Octopus Ventures, Passion Capital, WiL Series B $15
9/19/17AG2R La Mondiale, Bpifrance, Crédit Mutuel Arkéa, Eurazeo, Matmut, Weber
Investissements, Zencap Asset ManagementNA $47
9/19/17 Accel, Balderton Capital, Notion Capital, Passion Capital Series D $23
9/18/17Accel, Ballast Point Ventures, Birchmere Ventures, Daher Capital, Floodgate
Fund, Mark Cuban, Silverton Partners Series B $40
9/18/17Bamboo Capital Partners, International Finance Corporation, Kaszek Ventures,
Ribbit Capital, Rise CapitalNA $14
9/15/17Charles River Ventures, DFJ Growth, Freestyle Capital, Index Ventures (UK),
Thrive CapitalSeries C $60
9/15/17 Susquehanna Growth Equity NA $50
Investment Technology
Banking & Lending Technology
Payments
Banking & Lending Technology
Information Services
Financial SaaS
Financial SaaS
Financial SaaS
Financial SaaS
Banking & Lending Technology
Banking & Lending Technology
Insurance Technology
Insurance Technology
Financial SaaS
Financial SaaS
Payments
Banking & Lending Technology
SELECTED RECENT GROWTH EQUITY & VC ACTIVITY
Date
Announced Target Investors Type Amount ($MM) Sub-Sector
Notes: Source: CapIq. Pitchbook.Selected deals from last calendar month.

12
9/14/17Barry Sternlicht, Bow Capital, Cross Creek Advisors, Danhua Capital, General
Catalyst, Menlo Ventures, Union Square VenturesSeries C $28
9/14/17 Alpha Edison, PSP Growth Series B $31
9/13/17 Battery Ventures, Holtzbrinck Ventures Series A $12
9/13/17 TiE Silicon Valley Angel $70
9/13/17 Basket NA Series A $10
9/12/17Gaël de Boissard, Goldman Sachs Alternative Investments & Manager Selection
Group, Henry Ritchotte, Wadhawan Holdings NA $149
9/12/17Hummer Winblad Venture Partners, InterWest Partners, Madison Bay Capital
Partners, Venrock Series G $18
9/11/17 Infinity Group, New margin capital, Nogle Series A $115
9/11/17 ClearPoint Investment Partners NA NA
9/7/17 Jafco Series B $15 Cryptocurrency
9/7/17 Providence Equity Partners NA $35
9/7/17 Credit Agricole, Crédit Mutuel Arkéa, MAIF NA $24
9/6/17Bertelsmann India Investments, Darrin Capital, India Quotient, Mayfield Fund,
Saama Capital India Advisors, Sistema Asia Fund Series C $11
9/4/17 IDG Ventures, Sequoia Capital NA $50 Cryptocurrency
9/4/17 IDG Ventures India, True North, Wellington Management NA $78
9/3/17 Atomico, Mosaic Ventures, Revolution, Ribbit Capital Series B $24
9/1/17 Blue Lake Capital, GGV Capital, Yunqi Partners, ZhenFund Series A $15 Automated Reta i l
Median $31
Real Estate & Mortgage Tech.
Banking & Lending Technology
Banking & Lending Technology
Insurance Technology
Financial SaaS
Financial SaaS
Real Estate & Mortgage Tech.
IT & BPO Services
Investment Technology
Information Services
Payments
Real Estate & Mortgage Tech.
Banking & Lending Technology
Banking & Lending Technology
SELECTED RECENT GROWTH EQUITY & VC ACTIVITY (CONT’D)
Date
Announced Target Investors Type Amount ($MM) Sub-Sector
Notes: Source: CapIq. Pitchbook.Selected deals from last calendar month.

13
SELECTED RECENT PUBLIC EQUITY AND DEBT FINANCINGS
Offer
Date Issuer Ticker Type Amount ($MM) Offer Price Price to Date Sub-Sector
Notes: Source: CapIq. Pitchbook.Price to Date as of 9/30/17.Selected financings from last calendar month and >$50MM.
9/27/17 NYSE:CLDR Follow-On $221 $16.45 1%
9/7/17 NYSE:AYX Follow-On $170 $21.25 (4%)
9/7/17 SEHK:861 Follow-On $172 $0.51 10%
9/6/17 NasdaqGS:TWOU Follow-On $179 $49.00 14%
9/5/17 NYSE:GDDY Follow-On $882 $44.00 (1%)
Median $179 $21 1%
IT & BPO Services
Financial SaaS
Financial SaaS
Information Services
IT & BPO Services
Offer
Date Issuer Use of Funds S&P Moody's Amount ($MM) Coupon Sub-Sector
9/25/17General Corporate Purposes,
Repayment of DebtNA Caa1 $133 7.88%
9/19/17 General Corporate Purposes BBB Baa2 $500 NA
9/14/17General Corporate Purposes,
Repayment of DebtNA NA $66 3.37%
9/13/17General Corporate Purposes,
Repayment of DebtNA NA $1,000 0.25%
9/6/17General Corporate Purposes,
Repayment of DebtA+ A1 $997 2.15%
9/6/17General Corporate Purposes,
Repayment of DebtA+ A1 $744 2.75%
9/6/17 Repayment of Debt A+ A1 $747 3.65%
Median $744
Security Rating at Issuance
Payments
Benefits Administration/Payroll
Liquidity Venues
Financial SaaS
IT & BPO Services
Payments
Payments

14
9/25/2017 $6,431 5.3x 19.0x
9/25/2017 $195 NA NA
9/21/2017 $41 1.1x NA
9/19/2017 $21 NA NA
9/13/2017 $272 0.8x 9.3x
9/7/2017 $184 5.7x 17.5x
9/7/2017 $720 NA NA
9/6/2017 NA NA NA
9/6/2017 $475 1.0x NA
9/5/2017 $200 NA NA
9/5/2017 $705 NA NA
8/21/2017 $323 9.6x 20.8x
7/25/2017 $807 9.7x NA
7/21/2017 $4,014 3.8x 15.1x
Median 4.6x 17.5x
Financial SaaS
Information Services
Investment Technology
IT & BPO Services
Payments
IT & BPO Services
Financial SaaS
Banking & Lending Technology
Banking & Lending Technology
Payments
Investment Technology
Insurance Technology
Payments
Banking & Lending Technology
SELECTED RECENT M&A ACTIVITY
Notes: Source: CapIq. Pitchbook.Selected deals >$50MM.
Date Enterprise EV / Revenue EV / EBITDA
Announced Acquirer Target Value ($MM) LTM LTM Sub-Sector

15
PUBLIC COMPANY VALUATIONSBe
nefit
s Adm
in/P
ayro
llBa
nkin
g &
Len
ding
Tec
hnol
ogy
Notes: Source: CapIq. Pitchbook.Multiples based on CapIq Consensus Estimates. Multiples <0 and >100 considered NM.
Fina
ncia
l Saa
S
$MM, Except Per Share Data
Stock EPSPrice Equity Enterprise Long Term Revenue Growth EBITDA Growth EBITDA Margin EV / Revenue EV / EBITDA Price / EPS
9/30/17 Value Value Growth PEG 17E/16A NTM 17E/16A NTM 17E 17E 18P 17E 18P 17E 18PBanking & Lending TechnologyFidelity National Information Services, Inc. $93.39 $31,044 $40,084 12.0% 1.8 (0.9%) (2.4%) 35.5% 3.9% 33.6% 4.4x 4.3x 13.0x 12.5x 21.8x 19.2x First Data Corporation $18.04 $16,651 $37,430 10.1% 1.2 4.0% 5.4% 14.4% 6.9% 25.3% 3.1x 3.0x 12.3x 11.5x 11.8x 10.8x Intuit Inc. $142.14 $36,242 $35,953 14.7% 2.2 10.5% 9.9% 41.4% 10.9% 37.2% 6.7x 6.1x 18.0x 16.3x 31.8x 28.1x Fiserv, Inc. $128.96 $27,142 $31,584 12.2% 2.1 4.0% 5.6% 19.2% 6.4% 35.8% 5.5x 5.2x 15.4x 14.5x 25.3x 22.3x Wolters Kluwer N.V. $46.21 $13,092 $15,687 8.6% 2.0 16.0% 4.3% 21.7% 2.7% 27.4% 3.0x 2.9x 10.9x 10.6x 17.3x 16.2x Jack Henry & Associates, Inc. $102.79 $7,960 $7,895 11.0% 2.9 5.2% 5.4% 4.6% 6.0% 35.2% 5.4x 5.1x 15.3x 14.5x 32.4x 30.1x Temenos Group AG $101.96 $7,156 $7,456 15.4% 2.7 12.4% 14.3% 47.5% 17.4% 34.6% 10.5x 9.4x 30.2x 25.7x 41.9x 35.8x Black Knight, Inc. $43.05 $2,962 $5,494 14.2% 2.2 4.9% 6.8% 49.8% 11.5% 47.9% 5.1x 4.7x 10.7x 9.6x NA NAACI Worldwide, Inc. $22.78 $2,693 $3,295 12.5% 3.8 1.7% 0.1% NA 8.3% 24.9% 3.2x 3.1x 13.0x 12.0x 47.5x 39.5x Ellie Mae, Inc. $82.13 $2,824 $2,490 15.7% 3.5 12.2% 11.3% 61.1% 28.9% 29.2% 6.2x 5.1x 21.1x 16.4x 55.3x 45.1x LendingClub Corporation $6.09 $2,505 $1,975 NM NM 19.0% 31.0% NA NA 9.5% 3.3x 2.6x 34.7x 14.9x NM 27.4x Q2 Holdings, Inc. $41.65 $1,720 $1,641 NM NM 29.7% 26.7% NA NA 4.5% 8.4x 6.7x NM 81.5x NM NMCoupa Software Incorporated $31.15 $1,670 $1,461 NM NM 33.4% 24.8% NA NA NA 8.2x 6.6x NM NM NM NMBottomline Technologies (de), Inc. $31.83 $1,286 $1,343 16.0% 1.9 5.2% 6.9% NA 11.0% 22.4% 3.7x 3.5x 16.6x 15.0x 31.2x 27.7x On Deck Capital, Inc. $4.67 $342 $1,013 NM NM 19.8% NA NA NA 2.5% 2.9x 2.7x NM 30.7x NM 17.5x Elevate Credit, Inc. $6.11 $255 $622 NM NM 18.3% 24.3% 87.9% 67.8% 14.5% 0.9x 0.7x 6.3x 3.7x 18.0x 5.1x Computer Services, Inc. $46.05 $643 $606 NM NA NA NA NA NA NA NA NA NA NA NA NAPerformant Financial Corporation $1.82 $92 $114 NM NM (2.0%) 8.5% NA 47.8% 8.8% 0.8x 0.8x 9.3x 6.3x NM 52.0x
Median 12.5% 2.2 10.5% 7.7% 38.4% 10.9% 26.4% 4.4x 4.3x 14.2x 14.5x 31.2x 27.5x
Benefits Administration/PayrollAutomatic Data Processing, Inc. $109.32 $48,584 $47,803 10.7% 2.7 5.2% 5.5% (4.8%) 11.5% 20.5% 3.8x 3.6x 18.4x 16.5x 29.5x 27.3x Paychex, Inc. $59.96 $21,503 $21,192 8.5% 3.1 5.1% 6.7% 7.8% 6.8% 43.9% 6.6x 6.2x 15.0x 14.0x 26.2x 24.4x The Ultimate Software Group, Inc. $189.60 $5,655 $5,554 24.2% 2.2 19.8% 18.8% NA 26.5% 22.6% 5.9x 4.9x 26.3x 20.8x 53.7x 43.3x Paycom Software, Inc. $74.96 $4,466 $4,432 27.8% 2.3 31.1% 27.3% 82.4% 27.0% 28.7% 10.3x 8.2x 35.7x 28.1x 65.2x 52.2x HealthEquity, Inc. $50.58 $3,060 $2,849 28.3% 2.6 27.3% 24.2% 52.1% 27.6% 36.5% 12.6x 10.2x 34.4x 27.0x 74.7x 59.0x TriNet Group, Inc. $33.62 $2,333 $2,540 20.0% 1.1 7.8% 9.9% NA 5.5% 6.6% 0.8x 0.7x 11.6x 11.0x 22.6x 20.9x Paylocity Holding Corporation $48.82 $2,526 $2,423 26.2% 2.6 25.7% 23.2% NA 24.4% 19.4% 7.3x 6.0x 37.7x 30.3x 67.4x 55.4x WageWorks, Inc. $60.70 $2,410 $1,880 15.0% 2.3 32.2% 15.8% NA 15.1% 30.0% 3.9x 3.6x 13.0x 11.3x 34.8x 31.1x Insperity, Inc. $88.00 $1,834 $1,695 16.0% 1.2 12.0% 11.5% 41.4% 14.3% 5.1% 0.5x 0.5x 10.0x 8.7x 19.4x 17.0x Benefitfocus, Inc. $33.65 $1,049 $1,102 21.7% NM 10.0% 8.9% NA 69.6% 6.3% 4.3x 3.8x 68.5x 40.4x NM NMCastlight Health, Inc. $4.30 $566 $476 37.3% NM 30.7% 33.4% NA NA NA 3.6x 2.8x NM NM NM NM
Median 21.7% 2.3 19.8% 15.8% 41.4% 19.7% 21.6% 4.3x 3.8x 22.3x 18.6x 34.8x 31.1x
Financial SaasIntuit Inc. $142.14 $36,242 $35,953 14.7% 2.2 10.5% 9.9% 41.4% 10.9% 37.2% 6.7x 6.1x 18.0x 16.3x 31.8x 28.1x Workday, Inc. $105.39 $21,921 $20,372 34.0% NM 34.0% 26.7% NA 40.9% 15.2% 9.7x 7.7x 63.8x 45.3x NM 96.8x The Sage Group plc $9.37 $10,110 $10,533 11.0% 2.1 12.5% 8.6% 14.2% 13.2% 29.0% 4.6x 4.2x 15.9x 14.0x 23.3x 20.7x SS&C Technologies Holdings, Inc. $40.15 $8,248 $10,457 12.5% 1.7 13.5% 7.7% 33.5% 10.8% 40.8% 6.2x 5.9x 15.2x 13.8x 20.7x 18.4x Paycom Software, Inc. $74.96 $4,466 $4,432 27.8% 2.3 31.1% 27.3% 82.4% 27.0% 28.7% 10.3x 8.2x 35.7x 28.1x 65.2x 52.2x Xero Limited $22.33 $3,064 $2,985 NM NM 47.0% 43.4% NA NA 1.6% 10.7x 7.9x NM 63.6x NM NMEnvestnet, Inc. $51.00 $2,245 $2,477 17.5% 2.3 16.4% 14.1% NA 23.6% 18.9% 3.7x 3.2x 19.4x 15.7x 39.8x 32.1x Paylocity Holding Corporation $48.82 $2,526 $2,423 26.2% 2.6 25.7% 23.2% NA 24.4% 19.4% 7.3x 6.0x 37.7x 30.3x 67.4x 55.4x Financial Engines, Inc. $34.75 $2,195 $2,025 20.0% 1.3 14.2% 13.2% NA 16.0% 32.7% 4.2x 3.7x 12.8x 11.0x 25.4x 22.2x Alfa Financial Software Holdings PLC $6.79 $2,037 $2,011 NM NM 26.0% 1.8% NA NA NA 17.6x 15.5x NA NA 47.3x 40.5x Coupa Software Incorporated $31.15 $1,670 $1,461 NM NM 33.4% 24.8% NA NA NA 8.2x 6.6x NM NM NM NMBlucora, Inc. $25.30 $1,137 $1,431 18.5% 1.0 10.4% 6.5% 27.8% 18.9% 19.9% 2.8x 2.7x 14.3x 12.0x 18.6x 14.7x Benefitfocus, Inc. $33.65 $1,049 $1,102 21.7% NM 10.0% 8.9% NA 69.6% 6.3% 4.3x 3.8x 68.5x 40.4x NM NM
Median 19.3% 2.1 16.4% 13.2% 33.5% 21.3% 19.9% 6.7x 6.0x 18.7x 16.3x 31.8x 30.1x

16
PUBLIC COMPANY VALUATIONSIn
form
atio
n Se
rvic
es
Notes: Source: CapIq. Pitchbook.Multiples based on CapIq Consensus Estimates. Multiples <0 and >100 considered NM.
Insu
ranc
e Te
ch.
$MM, Except Per Share Data
Stock EPSPrice Equity Enterprise Long Term Revenue Growth EBITDA Growth EBITDA Margin EV / Revenue EV / EBITDA Price / EPS
9/30/17 Value Value Growth PEG 17E/16A NTM 17E/16A NTM 17E 17E 18P 17E 18P 17E 18PInformation ServicesRELX PLC $21.95 $43,985 $50,569 8.1% 2.5 17.5% 3.9% 36.1% 10.3% 34.7% 5.1x 4.9x 14.6x 13.2x 20.2x 18.9x S&P Global Inc. $156.31 $40,172 $42,515 13.2% 1.9 3.8% 3.7% 11.6% 6.9% 46.9% 7.2x 6.8x 15.4x 14.4x 24.7x 22.3x Thomson Reuters Corporation $45.80 $32,718 $39,738 9.9% 1.9 1.9% 4.3% 43.8% 4.2% 30.1% 3.5x 3.4x 11.6x 11.1x 18.8x 17.6x Moody's Corporation $139.21 $26,589 $28,321 9.4% 2.6 10.5% 8.1% 14.9% 9.6% 47.4% 7.1x 6.6x 15.0x 13.7x 24.8x 22.6x Nielsen Holdings plc $41.45 $14,780 $22,997 8.3% 1.8 4.1% 4.7% 25.4% 4.7% 30.9% 3.5x 3.4x 11.3x 10.8x 15.4x 14.6x Experian plc $20.10 $18,344 $21,566 9.3% 2.3 NA 6.1% NA 5.3% 34.9% 4.9x 4.5x 14.1x 13.4x 21.4x 19.1x IHS Markit Ltd. $44.08 $17,449 $21,365 13.2% 1.6 30.2% 5.5% NA 9.0% 38.8% 6.0x 5.7x 15.5x 14.2x 21.5x 19.4x Verisk Analytics, Inc. $83.19 $13,689 $15,948 10.1% 2.6 4.9% 6.9% 8.8% 7.8% 48.7% 7.6x 7.2x 15.6x 14.5x 26.5x 24.3x Wolters Kluwer N.V. $46.21 $13,092 $15,687 8.6% 2.0 16.0% 4.3% 21.7% 2.7% 27.4% 3.0x 2.9x 10.9x 10.6x 17.3x 16.2x Equifax Inc. $105.99 $12,758 $15,247 11.3% 1.6 7.4% 5.2% 11.2% 4.6% 37.0% 4.5x 4.3x 12.2x 11.7x 17.7x 16.8x Gartner, Inc. $124.41 $11,271 $14,110 16.8% 2.2 36.1% 36.8% 74.4% 21.9% 21.0% 4.2x 3.5x 20.2x 16.6x 36.5x 29.8x MSCI Inc. $116.90 $10,528 $11,854 14.3% 2.1 10.1% 10.5% 15.6% 11.5% 52.0% 9.4x 8.6x 18.0x 16.1x 30.8x 26.4x TransUnion $47.26 $8,597 $10,936 12.3% 2.1 10.0% 7.8% 30.4% 10.6% 39.3% 5.8x 5.4x 14.8x 13.4x 25.8x 23.0x Informa plc $9.01 $7,420 $9,457 6.0% 2.4 40.2% 9.8% 50.5% 5.8% 33.7% 4.1x 3.9x 12.0x 11.4x 14.4x 13.5x FactSet Research Systems Inc. $180.11 $7,065 $7,413 11.3% 2.1 10.6% 10.7% 8.1% 8.6% 34.4% 5.9x 5.4x 17.0x 15.7x 23.9x 21.5x News Corporation $13.26 $7,728 $6,375 13.9% 2.2 (0.6%) 0.5% 35.0% 4.6% 11.1% 0.8x 0.8x 7.1x 6.7x 30.7x 27.3x The Dun & Bradstreet Corporation $116.41 $4,302 $5,620 7.3% 2.3 3.7% 4.1% 10.4% 5.5% 28.1% 3.2x 3.1x 11.3x 10.7x 16.5x 15.7x CoreLogic, Inc. $46.22 $3,897 $5,449 11.8% 1.7 (4.9%) (1.5%) 11.3% 7.2% 25.1% 2.9x 2.8x 11.7x 10.9x 19.9x 17.9x Fair Isaac Corporation $140.50 $4,304 $4,785 16.0% 1.7 4.7% 6.8% 16.6% 13.5% 25.6% 5.1x 4.7x 19.8x 17.5x 27.7x 23.5x Morningstar, Inc. $84.99 $3,615 $3,505 NM NA 7.6% NA NA NA NA NA NA NA NA NA NAThe Advisory Board Company $53.63 $2,186 $2,644 17.0% 1.7 0.4% 2.7% 58.4% 8.3% 24.4% 3.3x 3.1x 13.5x 12.4x 28.2x 26.0x Acxiom Corporation $24.64 $1,967 $2,034 17.7% 2.0 2.2% 7.8% 84.5% 22.3% 18.7% 2.3x 2.0x 12.1x 9.9x 34.9x 24.9x Euromoney Institutional Investor PLC $15.70 $1,684 $1,799 NM NM 15.8% 11.4% 8.6% 7.3% 26.7% 3.1x 2.9x 11.6x 10.8x 15.4x 14.4x comScore, Inc. $28.75 $1,647 $1,533 NM NM NA 40.9% NA 19.5% 26.6% 2.5x 2.2x 9.4x 7.9x 14.9x 11.6x National Research Corporation $53.41 $1,306 $1,277 NM NA 8.3% 8.0% 12.6% 10.8% 33.7% 10.8x 10.0x 32.0x 28.9x NA NAForrester Research, Inc. $41.85 $742 $617 13.0% 2.7 1.2% 4.7% (9.0%) 23.4% 11.2% 1.9x 1.8x 16.8x 13.6x 35.2x 26.5x
Median 11.5% 2.1 7.5% 6.1% 16.1% 8.3% 30.9% 4.2x 3.9x 14.1x 13.2x 22.7x 20.4x
Insurance TechnologyVerisk Analytics, Inc. $83.19 $13,689 $15,948 10.1% 2.6 4.9% 6.9% 8.8% 7.8% 48.7% 7.6x 7.2x 15.6x 14.5x 26.5x 24.3x Guidewire Software, Inc. $77.86 $5,840 $5,267 14.6% 6.1 21.9% 21.4% NA 36.1% 19.9% 9.6x 8.0x 48.3x 35.5x 89.7x 68.0x HealthEquity, Inc. $50.58 $3,060 $2,849 28.3% 2.6 27.3% 24.2% 52.1% 27.6% 36.5% 12.6x 10.2x 34.4x 27.0x 74.7x 59.0x Ebix, Inc. $65.25 $2,052 $2,338 15.0% 1.4 16.9% 18.9% 10.0% 16.5% 34.6% 6.7x 5.9x 19.4x 16.6x 21.4x 19.0x Benefitfocus, Inc. $33.65 $1,049 $1,102 21.7% NM 10.0% 8.9% NA 69.6% 6.3% 4.3x 3.8x 68.5x 40.4x NM NMCorVel Corporation $54.40 $1,020 $985 NM NA 4.5% NA NA NA NA NA NA NA NA NA NACrawford & Company $11.96 $668 $867 10.0% 1.6 (0.2%) 3.4% 26.4% 11.0% 12.1% 0.8x 0.8x 6.5x 5.8x 15.6x 13.7x Sapiens International Corporation N.V. $13.20 $647 $640 10.0% 3.7 25.3% 20.8% (3.6%) 61.2% 10.6% 2.4x 2.1x 22.2x 13.8x 37.2x 21.0x eHealth, Inc. $23.89 $443 $377 10.0% NM (8.5%) (2.0%) NA NA NA 2.2x 2.0x NM NM NM NMMajesco $4.99 $182 $190 NM NM (7.7%) 5.9% 38.8% 91.2% 4.4% 1.6x 1.4x 37.4x 19.6x NM 35.6x Symbility Solutions Inc. $0.37 $88 $83 NM NM 27.4% 21.4% NA 23.4% 4.9% 2.5x 2.3x 52.1x 42.3x NM NA
Median 12.4% 2.6 10.0% 13.9% 18.2% 27.6% 12.1% 3.4x 3.0x 34.4x 19.6x 31.8x 24.3x

17
PUBLIC COMPANY VALUATIONSIn
vest
men
t Tec
hnol
ogy
Notes: Source: CapIq. Pitchbook.Multiples based on CapIq Consensus Estimates. Multiples <0 and >100 considered NM.
IT &
BPO
Ser
vice
s
Investment TechnologyThe Charles Schwab Corporation $43.74 $58,573 $33,873 19.0% 1.4 15.7% 13.5% NA NA NA 3.9x 3.5x NA 7.1x 27.3x 22.7x TD Ameritrade Holding Corporation $48.80 $27,666 $19,582 18.5% 1.5 13.1% 21.7% NA 22.2% 46.8% 5.2x 4.7x 11.1x 9.1x 27.8x 23.1x Northern Trust Corporation $91.93 $21,005 $16,505 10.3% 1.9 7.2% 8.9% NA NA NA 3.1x 2.9x NA NA 19.6x 17.3x SS&C Technologies Holdings, Inc. $40.15 $8,248 $10,457 12.5% 1.7 13.5% 7.7% 33.5% 10.8% 40.8% 6.2x 5.9x 15.2x 13.8x 20.7x 18.4x Broadridge Financial Solutions, Inc. $80.82 $9,414 $10,244 10.0% 2.4 22.0% 2.6% 26.1% 5.2% 19.0% 2.4x 2.4x 12.8x 12.2x 24.3x 21.2x SEI Investments Co. $61.06 $9,654 $8,994 13.5% 2.0 7.5% 9.4% 54.1% 7.4% 41.2% 6.0x 5.5x 14.5x 13.5x 26.8x 23.1x Computershare Limited $11.35 $6,185 $7,280 8.3% 2.4 4.1% 3.8% 30.2% 9.4% 26.9% 3.4x 3.4x 12.8x 11.7x 20.2x 17.6x DST Systems, Inc. $54.88 $3,321 $3,827 9.3% 1.9 31.1% 15.6% 30.0% 11.1% 21.0% 1.9x 1.7x 8.9x 8.0x 18.0x 15.3x Envestnet, Inc. $51.00 $2,245 $2,477 17.5% 2.3 16.4% 14.1% NA 23.6% 18.9% 3.7x 3.2x 19.4x 15.7x 39.8x 32.1x SimCorp A/S $61.07 $2,413 $2,410 NM NM 29.1% 22.8% 42.1% 15.0% 26.3% 6.0x 5.5x 22.7x 19.7x 31.8x 27.6x Financial Engines, Inc. $34.75 $2,195 $2,025 20.0% 1.3 14.2% 13.2% NA 16.0% 32.7% 4.2x 3.7x 12.8x 11.0x 25.4x 22.2x IRESS Limited $8.94 $1,512 $1,645 10.4% 2.4 21.7% 13.3% 29.6% 14.2% 28.2% 4.8x 4.4x 17.0x 14.9x 24.8x 22.3x Equiniti Group plc $4.04 $1,212 $1,570 NM NM 13.6% 6.6% 40.5% 5.9% 24.5% 2.9x 2.8x 11.9x 11.3x 19.2x 17.7x Sanne Group plc $10.67 $1,475 $1,498 24.0% 1.4 NA 26.3% NA 18.2% 38.5% 9.9x 8.4x 25.8x 21.8x 32.5x 28.1x Blucora, Inc. $25.30 $1,137 $1,431 18.5% 1.0 10.4% 6.5% 27.8% 18.9% 19.9% 2.8x 2.7x 14.3x 12.0x 18.6x 14.7x Fidessa group plc $30.13 $1,160 $1,067 NM NM 15.1% 1.9% 61.8% (3.6%) 25.5% 2.3x 2.2x 8.9x 9.2x 24.3x 22.6x First Derivatives plc $40.22 $1,017 $1,034 NM NM 26.3% 20.8% 82.1% 9.9% 18.1% 4.6x 4.0x 25.3x 23.0x 51.2x 44.4x StatPro Group plc $2.19 $142 $167 NM NM 41.4% 18.0% 75.1% 27.2% 14.2% 2.5x 2.2x 17.9x 14.0x 33.1x 23.2x The Bank of New York Mellon Corporation $53.02 $54,778 ($3,402) 7.5% 2.0 3.9% 4.2% NA NA NA NM NM NA NA 15.0x 13.5x State Street Corporation $95.54 $35,728 ($11,415) 12.2% 1.3 14.1% 13.0% NA NA NA NM NM NA NA 15.5x 13.9x
Median 12.5% 1.9 14.2% 13.1% 37.0% 12.7% 25.9% 3.8x 3.4x 14.4x 12.2x 24.6x 22.3x
IT & BPO ServicesInternational Business Machines Corporation $145.08 $135,206 $168,710 4.9% 2.2 (2.5%) (0.6%) (1.0%) 2.5% 23.6% 2.2x 2.2x 9.2x 9.0x 10.5x 10.5x Accenture plc $135.07 $83,471 $80,127 10.0% 2.2 6.6% 9.0% 7.6% 9.3% 17.1% 2.3x 2.1x 13.2x 12.0x 22.5x 20.2x Tata Consultancy Services Limited $37.30 $71,394 $66,577 14.3% 1.3 7.7% 5.6% 3.1% 5.6% 26.3% 3.6x 3.3x 13.7x 13.0x 18.5x 17.2x Cognizant Technology Solutions Corporation $72.54 $42,844 $39,457 13.8% 1.4 9.7% 9.4% 10.4% 16.6% 19.9% 2.7x 2.4x 13.4x 11.5x 19.6x 16.7x DXC Technology Company $85.88 $24,449 $29,725 23.1% 0.6 60.3% NA NA 31.9% 17.5% 1.5x 1.2x 8.5x 6.4x 14.2x 10.8x Infosys Limited $13.78 $31,493 $26,305 8.9% 1.6 5.8% 6.0% 2.1% 5.1% 26.7% 2.5x 2.3x 9.2x 8.8x 14.5x 14.0x Capgemini SE $117.20 $19,086 $21,558 7.4% 2.3 14.1% 5.2% 21.5% 7.1% 13.4% 1.4x 1.4x 10.6x 9.9x 16.7x 15.5x NTT Data Corporation $10.69 $14,996 $18,428 8.8% 3.0 29.3% 10.0% 17.4% 6.1% 14.3% 1.0x 1.0x 7.1x 6.6x 26.6x 25.6x HCL Technologies Limited $13.39 $19,113 $17,806 8.0% 1.7 14.0% 10.9% 17.1% 1.3% 22.7% 2.3x 2.2x 10.1x 10.0x 14.0x 13.6x Wipro Limited $4.30 $20,817 $17,362 10.0% 1.6 5.5% 1.2% 9.3% (7.0%) 20.7% 2.0x 2.0x 9.9x 10.6x 15.8x 15.5x Atos SE $155.12 $16,243 $16,465 12.4% 1.3 22.4% 7.9% 17.2% 7.0% 12.5% 1.1x 1.1x 8.7x 8.1x 15.6x 14.4x CGI Group Inc. $51.76 $14,977 $16,119 13.7% 1.3 11.0% 6.6% 17.6% 5.9% 18.0% 1.8x 1.8x 10.1x 9.6x 17.3x 15.8x Nomura Research Institute, Ltd. $38.99 $9,350 $8,501 NM NM 11.4% 6.5% 11.8% 6.2% 20.7% 2.1x 2.0x 10.3x 9.7x 23.0x 21.7x Capita plc $7.58 $5,042 $8,006 NM NM 0.5% (6.8%) 7.1% 1.6% 13.3% 1.3x 1.3x 9.9x 9.7x 11.3x 10.5x Genpact Limited $28.75 $5,546 $6,381 11.9% 1.5 4.8% 5.9% 6.5% 8.8% 16.6% 2.4x 2.2x 14.2x 13.1x 18.4x 16.5x Tech Mahindra Limited $7.01 $6,844 $5,749 12.3% 1.2 9.1% 3.2% (7.6%) 12.8% 12.9% 1.3x 1.2x 9.7x 8.6x 14.8x 13.7x Conduent Incorporated $15.67 $3,293 $5,114 NM NM (5.2%) (2.5%) NA 10.7% 11.0% 0.8x 0.9x 7.7x 6.9x 20.8x 16.1x EPAM Systems, Inc. $87.93 $4,618 $4,200 20.3% 1.3 23.3% 21.9% 50.9% 23.8% 17.9% 2.9x 2.4x 16.4x 13.2x 26.5x 21.4x Presidio, Inc. $14.15 $1,290 $2,258 9.0% 1.3 2.1% 4.9% 18.6% 8.6% 8.1% 0.8x 0.7x 9.7x 9.0x 11.6x 10.7x Syntel, Inc. $19.65 $1,644 $1,955 8.5% 1.3 (8.5%) (6.9%) (18.5%) 2.9% 24.8% 2.2x 2.2x 8.9x 8.7x 11.4x 11.3x ExlService Holdings, Inc. $58.32 $1,968 $1,776 14.2% 1.6 10.3% 9.7% 31.4% 16.3% 17.2% 2.3x 2.1x 13.6x 11.7x 22.4x 20.3x WNS (Holdings) Limited $36.50 $1,845 $1,768 14.5% 2.8 16.0% 13.7% 36.4% 9.9% 18.2% 2.6x 2.3x 14.3x 13.0x 39.9x 24.8x Luxoft Holding, Inc. $47.80 $1,600 $1,503 18.5% 0.9 17.9% 18.1% 42.3% 32.8% 15.4% 1.7x 1.4x 11.0x 8.3x 17.3x 13.7x MphasiS Limited $9.46 $1,827 $1,478 10.0% 1.6 7.0% 5.4% 3.0% 11.6% 15.3% 1.5x 1.4x 10.0x 9.0x 16.2x 13.8x Globant S.A. $40.07 $1,400 $1,373 NM NM 24.2% 23.5% 3.7% 28.6% 15.8% 3.4x 2.8x 21.7x 16.9x 32.0x 25.8x Hexaware Technologies Limited $4.13 $1,226 $1,162 12.8% 1.3 15.7% 7.9% 19.1% 11.7% 16.5% 1.9x 1.7x 11.7x 10.4x 17.2x 15.6x Virtusa Corporation $37.78 $1,106 $1,084 20.7% 1.2 15.7% 10.0% 24.0% 46.0% 6.8% 1.2x 1.1x 17.0x 11.6x 25.6x 19.8x Mindtree Limited $7.10 $1,163 $1,030 12.3% 1.5 5.9% 6.0% (8.5%) 22.6% 12.3% 1.3x 1.1x 10.3x 8.4x 18.0x 15.0x Perficient, Inc. $19.67 $691 $753 17.0% 0.9 5.5% 14.9% 42.7% 16.2% 14.4% 1.5x 1.4x 10.6x 9.1x 15.9x 13.6x Persistent Systems Limited $10.23 $818 $721 13.8% 1.2 11.5% 9.8% 29.4% 13.9% 16.6% 1.6x 1.4x 9.4x 8.2x 16.2x 13.8x
Median 12.4% 1.4 10.0% 6.6% 14.4% 9.6% 16.6% 1.9x 1.8x 10.2x 9.7x 17.3x 15.5x
$MM, Except Per Share Data
Stock EPSPrice Equity Enterprise Long Term Revenue Growth EBITDA Growth EBITDA Margin EV / Revenue EV / EBITDA Price / EPS
9/30/17 Value Value Growth PEG 17E/16A NTM 17E/16A NTM 17E 17E 18P 17E 18P 17E 18P

18
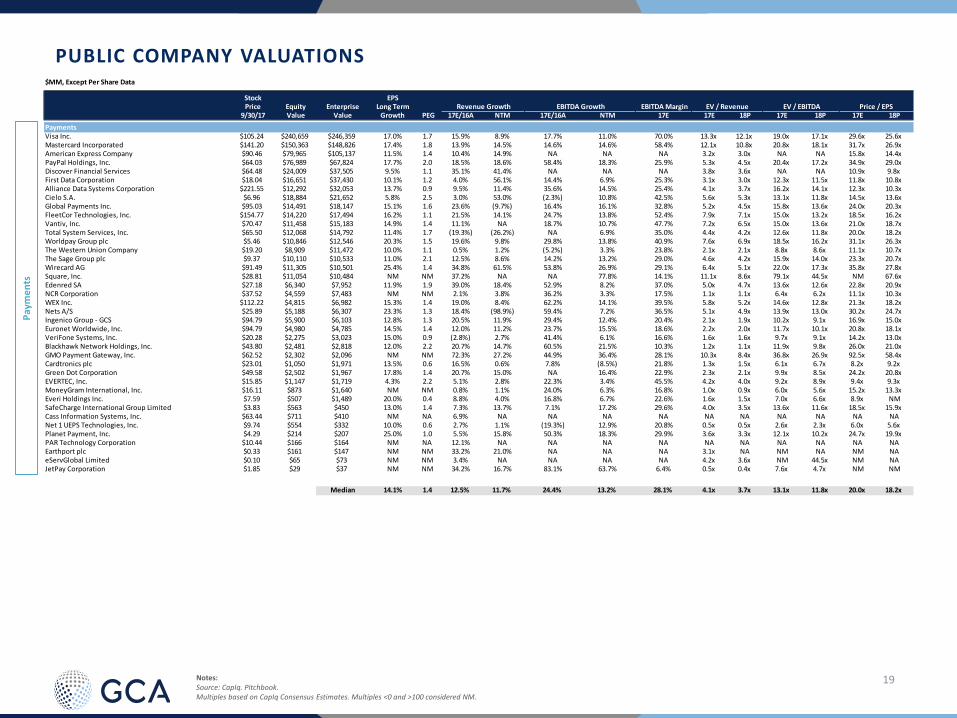
PUBLIC COMPANY VALUATIONS
Notes: Source: CapIq. Pitchbook.Multiples based on CapIq Consensus Estimates. Multiples <0 and >100 considered NM.
Liqu
idity
Ven
ues
Liquidity VenuesCME Group Inc. $135.68 $46,119 $46,905 10.0% 2.8 3.0% 5.1% 6.3% 8.7% 70.4% 12.7x 12.0x 18.0x 16.5x 28.0x 25.6x Intercontinental Exchange, Inc. $68.70 $40,429 $45,946 11.0% 2.1 3.2% 5.0% 8.0% 9.1% 64.1% 9.9x 9.4x 15.4x 14.2x 23.4x 20.5x Hong Kong Exchanges and Clearing Limited $26.89 $33,295 $31,140 6.4% 5.7 13.7% 14.2% 24.7% 11.2% 71.9% 19.2x 17.4x 26.7x 24.0x 36.4x 32.6x Deutsche Börse Aktiengesellschaft $108.39 $20,248 $21,002 11.3% 1.7 (1.3%) (9.4%) 24.3% 8.0% 59.2% 7.1x 6.7x 12.1x 11.2x 19.4x 17.1x London Stock Exchange Group plc $51.35 $17,782 $18,686 16.1% 1.6 21.0% 7.7% 49.8% 13.3% 51.4% 7.5x 6.8x 14.7x 12.9x 25.8x 22.3x B3 S.A. - Brasil, Bolsa, Balcão $7.59 $15,465 $16,737 3.6% 6.0 68.8% 55.5% 74.2% 21.7% 63.9% 13.5x 12.1x 21.1x 17.4x 21.8x 21.7x Nasdaq, Inc. $77.57 $12,938 $15,994 8.5% 2.2 5.5% NA 5.1% 6.1% 50.8% 6.7x 6.4x 13.1x 12.3x 18.6x 17.2x CBOE Holdings, Inc. $107.63 $12,138 $13,303 33.3% 1.0 51.2% NA NA 20.0% 65.0% 13.4x 11.7x 20.6x 17.2x 31.7x 27.5x ASX Limited $41.13 $7,955 $7,242 4.6% 5.0 2.6% NA (9.5%) 5.1% 75.9% 11.8x 11.3x 15.5x 14.8x 23.2x 22.3x MarketAxess Holdings Inc. $184.51 $6,926 $6,723 20.0% 2.3 9.4% 14.0% 8.6% 20.5% 56.0% 16.6x 14.3x 29.7x 24.6x 45.4x 37.9x Singapore Exchange Limited $5.44 $5,830 $5,251 6.9% 3.2 11.4% 8.4% 24.2% 12.7% 57.4% 8.6x 8.0x 15.0x 13.3x 22.0x 19.4x Euronext N.V. $60.86 $4,232 $4,140 5.3% 3.4 19.6% 12.8% 20.3% 8.1% 56.5% 6.6x 6.2x 11.7x 10.8x 17.8x 16.5x TMX Group Limited $56.40 $3,122 $3,544 NM NM (0.2%) NA (1.1%) 4.4% 54.5% 5.9x 5.8x 10.9x 10.4x 14.8x 14.0x Bolsas y Mercados Españoles, Sociedad Holding de Mercado $34.51 $2,869 $2,503 NM NM 12.7% 4.2% 14.3% 0.2% 66.6% 6.5x 6.5x 9.8x 9.8x 15.5x 15.4x Bursa Malaysia Berhad $2.37 $1,273 $1,162 5.7% 4.3 16.1% 8.6% 21.6% 4.1% 59.5% 9.0x 8.6x 15.1x 14.5x 24.3x 23.5x Bolsa Mexicana de Valores, S.A.B. de C.V. $1.68 $994 $910 11.0% 1.5 22.2% 1.9% 30.2% 7.2% 55.2% 5.4x 5.0x 9.8x 9.1x 16.8x 15.4x JSE Limited $9.17 $784 $632 4.6% 3.2 (9.3%) (6.6%) NA 23.7% 38.6% 4.0x 3.6x 10.3x 8.3x 14.6x 12.6x Gielda Papierów Wartosciowych w Warszawie S.A. $12.24 $514 $454 NM NM 24.9% 2.4% 25.8% 2.3% 60.2% 4.9x 4.9x 8.1x 7.9x 13.3x 12.6x Hellenic Exchanges - Athens Stock Exchange SA $5.77 $348 $235 93.5% 0.5 35.4% 50.5% 60.6% 55.9% 38.1% 6.6x 5.3x 17.3x 11.1x 47.9x 28.1x
Median 9.3% 2.5 12.7% 7.7% 21.6% 8.7% 59.2% 7.5x 6.8x 15.0x 12.9x 22.0x 20.5x
$MM, Except Per Share Data
Stock EPSPrice Equity Enterprise Long Term Revenue Growth EBITDA Growth EBITDA Margin EV / Revenue EV / EBITDA Price / EPS
9/30/17 Value Value Growth PEG 17E/16A NTM 17E/16A NTM 17E 17E 18P 17E 18P 17E 18P
19
PUBLIC COMPANY VALUATIONS
Notes: Source: CapIq. Pitchbook.Multiples based on CapIq Consensus Estimates. Multiples <0 and >100 considered NM.
Paym
ents
PaymentsVisa Inc. $105.24 $240,659 $246,359 17.0% 1.7 15.9% 8.9% 17.7% 11.0% 70.0% 13.3x 12.1x 19.0x 17.1x 29.6x 25.6x Mastercard Incorporated $141.20 $150,363 $148,826 17.4% 1.8 13.9% 14.5% 14.6% 14.6% 58.4% 12.1x 10.8x 20.8x 18.1x 31.7x 26.9x American Express Company $90.46 $79,965 $105,137 11.5% 1.4 10.4% 14.9% NA NA NA 3.2x 3.0x NA NA 15.8x 14.4x PayPal Holdings, Inc. $64.03 $76,989 $67,824 17.7% 2.0 18.5% 18.6% 58.4% 18.3% 25.9% 5.3x 4.5x 20.4x 17.2x 34.9x 29.0x Discover Financial Services $64.48 $24,009 $37,505 9.5% 1.1 35.1% 41.4% NA NA NA 3.8x 3.6x NA NA 10.9x 9.8x First Data Corporation $18.04 $16,651 $37,430 10.1% 1.2 4.0% 56.1% 14.4% 6.9% 25.3% 3.1x 3.0x 12.3x 11.5x 11.8x 10.8x Alliance Data Systems Corporation $221.55 $12,292 $32,053 13.7% 0.9 9.5% 11.4% 35.6% 14.5% 25.4% 4.1x 3.7x 16.2x 14.1x 12.3x 10.3x Cielo S.A. $6.96 $18,884 $21,652 5.8% 2.5 3.0% 53.0% (2.3%) 10.8% 42.5% 5.6x 5.3x 13.1x 11.8x 14.5x 13.6x Global Payments Inc. $95.03 $14,491 $18,147 15.1% 1.6 23.6% (9.7%) 16.4% 16.1% 32.8% 5.2x 4.5x 15.8x 13.6x 24.0x 20.3x FleetCor Technologies, Inc. $154.77 $14,220 $17,494 16.2% 1.1 21.5% 14.1% 24.7% 13.8% 52.4% 7.9x 7.1x 15.0x 13.2x 18.5x 16.2x Vantiv, Inc. $70.47 $11,458 $15,183 14.9% 1.4 11.1% NA 18.7% 10.7% 47.7% 7.2x 6.5x 15.0x 13.6x 21.0x 18.7x Total System Services, Inc. $65.50 $12,068 $14,792 11.4% 1.7 (19.3%) (26.2%) NA 6.9% 35.0% 4.4x 4.2x 12.6x 11.8x 20.0x 18.2x Worldpay Group plc $5.46 $10,846 $12,546 20.3% 1.5 19.6% 9.8% 29.8% 13.8% 40.9% 7.6x 6.9x 18.5x 16.2x 31.1x 26.3x The Western Union Company $19.20 $8,909 $11,472 10.0% 1.1 0.5% 1.2% (5.2%) 3.3% 23.8% 2.1x 2.1x 8.8x 8.6x 11.1x 10.7x The Sage Group plc $9.37 $10,110 $10,533 11.0% 2.1 12.5% 8.6% 14.2% 13.2% 29.0% 4.6x 4.2x 15.9x 14.0x 23.3x 20.7x Wirecard AG $91.49 $11,305 $10,501 25.4% 1.4 34.8% 61.5% 53.8% 26.9% 29.1% 6.4x 5.1x 22.0x 17.3x 35.8x 27.8x Square, Inc. $28.81 $11,054 $10,484 NM NM 37.2% NA NA 77.8% 14.1% 11.1x 8.6x 79.1x 44.5x NM 67.6x Edenred SA $27.18 $6,340 $7,952 11.9% 1.9 39.0% 18.4% 52.9% 8.2% 37.0% 5.0x 4.7x 13.6x 12.6x 22.8x 20.9x NCR Corporation $37.52 $4,559 $7,483 NM NM 2.1% 3.8% 36.2% 3.3% 17.5% 1.1x 1.1x 6.4x 6.2x 11.1x 10.3x WEX Inc. $112.22 $4,815 $6,982 15.3% 1.4 19.0% 8.4% 62.2% 14.1% 39.5% 5.8x 5.2x 14.6x 12.8x 21.3x 18.2x Nets A/S $25.89 $5,188 $6,307 23.3% 1.3 18.4% (98.9%) 59.4% 7.2% 36.5% 5.1x 4.9x 13.9x 13.0x 30.2x 24.7x Ingenico Group - GCS $94.79 $5,900 $6,103 12.8% 1.3 20.5% 11.9% 29.4% 12.4% 20.4% 2.1x 1.9x 10.2x 9.1x 16.9x 15.0x Euronet Worldwide, Inc. $94.79 $4,980 $4,785 14.5% 1.4 12.0% 11.2% 23.7% 15.5% 18.6% 2.2x 2.0x 11.7x 10.1x 20.8x 18.1x VeriFone Systems, Inc. $20.28 $2,275 $3,023 15.0% 0.9 (2.8%) 2.7% 41.4% 6.1% 16.6% 1.6x 1.6x 9.7x 9.1x 14.2x 13.0x Blackhawk Network Holdings, Inc. $43.80 $2,481 $2,818 12.0% 2.2 20.7% 14.7% 60.5% 21.5% 10.3% 1.2x 1.1x 11.9x 9.8x 26.0x 21.0x GMO Payment Gateway, Inc. $62.52 $2,302 $2,096 NM NM 72.3% 27.2% 44.9% 36.4% 28.1% 10.3x 8.4x 36.8x 26.9x 92.5x 58.4x Cardtronics plc $23.01 $1,050 $1,971 13.5% 0.6 16.5% 0.6% 7.8% (8.5%) 21.8% 1.3x 1.5x 6.1x 6.7x 8.2x 9.2x Green Dot Corporation $49.58 $2,502 $1,967 17.8% 1.4 20.7% 15.0% NA 16.4% 22.9% 2.3x 2.1x 9.9x 8.5x 24.2x 20.8x EVERTEC, Inc. $15.85 $1,147 $1,719 4.3% 2.2 5.1% 2.8% 22.3% 3.4% 45.5% 4.2x 4.0x 9.2x 8.9x 9.4x 9.3x MoneyGram International, Inc. $16.11 $873 $1,640 NM NM 0.8% 1.1% 24.0% 6.3% 16.8% 1.0x 0.9x 6.0x 5.6x 15.2x 13.3x Everi Holdings Inc. $7.59 $507 $1,489 20.0% 0.4 8.8% 4.0% 16.8% 6.7% 22.6% 1.6x 1.5x 7.0x 6.6x 8.9x NMSafeCharge International Group Limited $3.83 $563 $450 13.0% 1.4 7.3% 13.7% 7.1% 17.2% 29.6% 4.0x 3.5x 13.6x 11.6x 18.5x 15.9x Cass Information Systems, Inc. $63.44 $711 $410 NM NA 6.9% NA NA NA NA NA NA NA NA NA NANet 1 UEPS Technologies, Inc. $9.74 $554 $332 10.0% 0.6 2.7% 1.1% (19.3%) 12.9% 20.8% 0.5x 0.5x 2.6x 2.3x 6.0x 5.6x Planet Payment, Inc. $4.29 $214 $207 25.0% 1.0 5.5% 15.8% 50.3% 18.3% 29.9% 3.6x 3.3x 12.1x 10.2x 24.7x 19.9x PAR Technology Corporation $10.44 $166 $164 NM NA 12.1% NA NA NA NA NA NA NA NA NA NAEarthport plc $0.33 $161 $147 NM NM 33.2% 21.0% NA NA NA 3.1x NA NM NA NM NAeServGlobal Limited $0.10 $65 $73 NM NM 3.4% NA NA NA NA 4.2x 3.6x NM 44.5x NM NAJetPay Corporation $1.85 $29 $37 NM NM 34.2% 16.7% 83.1% 63.7% 6.4% 0.5x 0.4x 7.6x 4.7x NM NM
Median 14.1% 1.4 12.5% 11.7% 24.4% 13.2% 28.1% 4.1x 3.7x 13.1x 11.8x 20.0x 18.2x
$MM, Except Per Share Data
Stock EPSPrice Equity Enterprise Long Term Revenue Growth EBITDA Growth EBITDA Margin EV / Revenue EV / EBITDA Price / EPS
9/30/17 Value Value Growth PEG 17E/16A NTM 17E/16A NTM 17E 17E 18P 17E 18P 17E 18P

20
PUBLIC COMPANY VALUATIONS
Notes: Source: CapIq. Pitchbook.Multiples based on CapIq Consensus Estimates. Multiples <0 and >100 considered NM.
Real
Est
ate
& M
ortg
age
Tech
.Tr
adin
g Te
ch.
$MM, Except Per Share Data
Stock EPSPrice Equity Enterprise Long Term Revenue Growth EBITDA Growth EBITDA Margin EV / Revenue EV / EBITDA Price / EPS
9/30/17 Value Value Growth PEG 17E/16A NTM 17E/16A NTM 17E 17E 18P 17E 18P 17E 18PReal Estate & Mortgage TechnologyThe Priceline Group Inc. $1,830.82 $89,818 $91,947 17.8% 1.4 16.5% 16.1% 14.6% 16.3% 38.0% 7.3x 6.4x 19.3x 16.6x 24.5x 21.2x Expedia, Inc. $143.94 $21,827 $22,862 19.8% 1.4 16.0% 14.5% 70.0% 21.2% 17.9% 2.2x 2.0x 12.5x 10.3x 28.5x 21.9x Nationstar Mortgage Holdings Inc. $18.57 $1,815 $17,075 NM NM (6.5%) NA NA 18.1% 32.0% 9.4x 8.6x 29.5x 25.0x 16.8x 10.5x Fidelity National Financial, Inc. $47.46 $12,949 $15,192 NM NM 4.5% NA (0.9%) 8.3% 17.9% 1.8x 1.7x 9.9x 9.1x 18.4x 17.4x CoStar Group, Inc. $268.25 $9,580 $9,320 19.2% 3.1 14.4% 14.3% 24.9% 33.0% 28.0% 9.7x 8.5x 34.7x 26.1x 60.3x 43.6x Realogy Holdings Corp. $32.95 $4,492 $7,982 20.0% 0.9 6.5% 5.1% 1.2% 5.5% 12.4% 1.3x 1.2x 10.4x 9.8x 19.0x 16.9x Jones Lang LaSalle Incorporated $123.50 $5,599 $7,569 12.3% 1.2 10.7% 5.4% 6.0% 8.3% 9.2% 1.0x 1.0x 11.0x 10.1x 14.9x 13.7x Zillow Group, Inc. $40.15 $7,380 $7,157 20.0% 4.1 25.7% 21.3% NA 36.0% 21.5% 6.7x 5.6x 31.2x 23.0x 81.3x 49.4x REA Group Limited $52.56 $6,923 $7,027 18.1% 1.9 17.9% 20.8% 35.2% 16.8% 57.2% 12.2x 10.5x 21.2x 18.2x 34.1x 28.0x Ocwen Financial Corporation $3.44 $450 $6,890 NM NM (12.1%) NA NA NA NA 5.6x 7.8x NA NA NM NMBlack Knight, Inc. $43.05 $2,962 $5,494 14.2% 2.2 4.9% 6.8% 49.8% 11.5% 47.9% 5.1x 4.7x 10.7x 9.6x NA NACoreLogic, Inc. $46.22 $3,897 $5,449 11.8% 1.7 (4.9%) (1.5%) 11.3% 7.2% 25.1% 2.9x 2.8x 11.7x 10.9x 19.9x 17.9x First American Financial Corporation $49.97 $5,533 $5,105 NM NM 2.9% (0.7%) 23.4% 3.5% 13.3% 0.9x 0.9x 6.7x 6.5x 14.7x 13.8x TripAdvisor, Inc. $40.53 $5,624 $4,987 16.2% 2.2 7.3% 8.1% 51.4% 3.1% 20.5% 3.1x 2.9x 15.3x 14.9x 35.7x 33.7x Rightmove plc $54.23 $4,951 $4,928 11.8% 2.1 19.8% 10.0% 22.3% 9.6% 75.7% 15.1x 13.9x 20.0x 18.3x 25.4x 22.7x Radian Group Inc. $18.69 $4,023 $3,708 7.7% 1.4 0.8% 9.9% NA NA NA 3.0x 2.8x NA NA 10.9x 9.8x RealPage, Inc. $39.90 $3,298 $3,369 NM NM 18.2% 22.2% NA NA NA 5.0x 4.2x NA NA 42.9x 33.5x LendingTree, Inc. $244.45 $2,933 $2,810 25.8% 2.7 53.4% 35.5% 91.2% 30.3% 17.9% 4.8x 3.9x 26.6x 20.4x 68.6x 50.8x Ellie Mae, Inc. $82.13 $2,824 $2,490 15.7% 3.5 12.2% 11.3% 61.1% 28.9% 29.2% 6.2x 5.1x 21.1x 16.4x 55.3x 45.1x ZPG Plc $4.85 $2,110 $2,372 16.9% 1.6 17.5% 22.9% 51.2% 14.7% 43.6% 7.8x 7.4x 18.0x 15.7x 27.4x 22.1x Moneysupermarket.com Group PLC $4.26 $2,284 $2,261 9.4% 2.0 16.4% 8.4% 28.4% 8.1% 38.3% 5.0x 4.6x 13.0x 12.0x 19.2x 17.4x Colliers International Group Inc. $49.52 $1,780 $2,229 15.0% 1.2 12.7% 8.8% 18.9% 10.5% 10.8% 1.0x 1.0x 9.6x 8.7x 17.5x 16.4x Redfin Corporation $25.09 $2,040 $1,985 NM NM 36.2% 33.4% NA NA 0.3% 5.5x 4.1x NM NM NM NMAppFolio, Inc. $47.95 $1,626 $1,594 25.0% NM 32.1% 27.2% NA 31.5% 17.0% 11.4x 9.0x 67.3x 51.2x NM NMBankrate, Inc. $13.95 $1,240 $1,349 10.0% 2.0 16.1% 12.2% 35.7% 10.4% 25.3% 2.7x 2.4x 10.6x 9.6x 19.8x 16.9x Lifull Co., Ltd. $8.69 $1,031 $1,000 NM NM 13.9% 13.3% NA NA 9.4% 5.4x 3.1x 57.4x 18.1x NM 31.1x RE/MAX Holdings, Inc. $63.55 $1,125 $884 8.5% 3.9 11.2% 8.1% 15.1% 7.0% 53.8% 4.5x 4.2x 8.4x 7.8x 33.5x 30.9x Stewart Information Services Corporation $37.76 $896 $874 NM NM (4.0%) (4.1%) 10.3% 22.3% 7.4% 0.5x 0.4x 6.1x 5.0x 15.7x 12.6x Marcus & Millichap, Inc. $26.99 $1,029 $801 10.5% 1.8 (1.7%) 2.1% (9.7%) 5.6% 14.2% 1.1x 1.1x 8.0x 7.6x 18.8x 16.6x Altisource Portfolio Solutions S.A. $25.87 $467 $749 NM NM (13.7%) (18.3%) (45.6%) 14.7% 11.3% 0.9x 1.0x 7.7x 6.7x 16.2x 21.7x Real Matters Inc. $8.50 $743 $677 23.3% NM 11.4% 10.3% (36.3%) 86.3% 3.3% 2.1x 1.7x 64.3x 34.5x NM 63.4x QuinStreet, Inc. $7.35 $336 $287 51.8% NM 4.3% 10.0% NA 37.7% 6.5% 0.9x 0.8x 14.0x 10.2x NM NMAgilysys, Inc. $11.95 $280 $236 25.0% NM 3.4% 8.7% NA NA 4.4% 1.8x 1.6x 40.1x 20.8x NM 66.4x Reis, Inc. $18.00 $207 $188 NM NM 1.3% 7.0% 24.9% 37.3% 24.6% 3.9x 3.5x 15.9x 11.6x NM 56.3x
Median 16.6% 1.9 11.3% 10.0% 22.9% 14.7% 17.9% 4.2x 3.3x 14.7x 11.8x 19.9x 21.9x
Trading TechnologyThe Charles Schwab Corporation $43.74 $58,573 $33,873 19.0% 1.4 15.7% 13.5% NA NA NA 3.9x 3.5x NA 7.1x 27.3x 22.7x TD Ameritrade Holding Corporation $48.80 $27,666 $19,582 18.5% 1.5 13.1% 21.7% NA 22.2% 46.8% 5.2x 4.7x 11.1x 9.1x 27.8x 23.1x E*TRADE Financial Corporation $43.61 $11,992 $12,713 14.7% 1.3 12.1% 6.3% NA NA NA 5.4x 5.0x NA NA 19.4x 17.6x Virtu Financial, Inc. $16.20 $1,465 $1,987 NM NM 25.4% 46.1% NA NA NA 3.7x 2.3x NA NA 27.6x 20.9x Investment Technology Group, Inc. $22.14 $733 $600 NM NM 2.9% 7.9% NA 38.3% 16.1% 1.3x 1.1x 7.8x 5.6x 44.3x 19.2x Global Brokerage, Inc. $1.65 $10 $194 NM NA 7.7% NA NA NA NA NA NA NA NA NA NAINTL FCStone Inc. $38.32 $717 ($557) NM NA 35.7% NA NA NA NA NA NA NA NA NA NAGAIN Capital Holdings, Inc. $6.39 $302 ($706) NM NM (18.0%) 7.7% NA 54.8% 17.1% NM NM NM NM 24.6x 8.8x Interactive Brokers Group, Inc. $45.04 $3,219 ($20,774) 10.0% 3.2 4.8% 12.5% NA 15.7% 65.6% NM NM NM NM 32.0x 29.0x
Median 16.6% 1.5 12.1% 12.5% NA 30.3% 31.9% 3.9x 3.5x 9.5x 7.1x 27.6x 20.9x


