Pergamon Lkrp-Scn Rrmwrh I. Vol 42. No. 4. pp. 45.547375. AY95 Elsevier Science Ltd 0967-0637(94)E0005-4 Prmted in Great Britam ll967N37/94 $Y.5(lf 1).00 Bias in acoustic biomass estimates of Euphausia superba due to die1 vertical migration DAVID A. DEMERIT and ROGER P. HEWITT* (Received 17 December 1993; in revisedform 30 June 1994; uccepted 6 July 1994) Abstract-The die1 vertical migration (DVM) of Antarctic krill (Euphausia superba) can greatly bias the results of qualitative and quantitative hydroacoustic surveys which are conducted with a down-looking sonar and irrespective of the time of day. To demonstrate and quantify these negative biases on both the estimates of biomass distribution and abundance, a time-depth-density analysis was performed. Data were collected, as part of the United States Antarctic Marine Living Resources Program (AMLR). in the vicinities of Elephant Island, Antarctica, during the austral summers of 1992 and 1993. Five surveys were conducted in 1992: two covered a 105 by 105 n.mi. area centered on Elephant Island, two encompassed a 60 by 35 n.mi. arca immediately to the north of the Island, and one covered a 1 n.mi.’ area centered on a large krill swarm to the west of Seal Island. The 1993 data include repetitions of the two small-area and two large-area surveys. Average krill volume dcnsitics were calculated for each hour as well as for three daily periods: day, twilight and night. These data were normalized and presented as a probability of daily average density. With spectral analysis to identify the frequencies of migration, a four-term periodic function was fitted to the probability density function of average daily biomass versus local apparent time. This function was transformed to create a temporal compensation function (TCF) for upwardly adjusting acoustic biomass estimates. The TCF was then applied to the original 19Y2 survey data; the resulting biomass estimates are an average of 49.5% higher than those calculated disregarding biases due to die1 vertical migration. The effect of DVM on the estimates of krill distribution are illustrated by a comparison of compensated and uncompensated density maps of two 1992 surveys. Through this technique, high density krill areas are revealed where uncompen- sated maps indicated low densities. INTRODUCTION EFFECTIVE management of the Antarctic krill fishery requires accurate information about biomass distribution and abundance. To acquire this information over large survey areas, echo integration instruments are used due to their low cost, survey speed and apparent ease of data analysis. However, an application of echo integration theory requires a meticulous and cautious interpretation of the data with respect to many theoretical assumptions. Some major concerns of using echo integration for biomass estimation include calibration inaccuracies (DEMER and HEWITT, 1993); target strength determination and variation (FOOTE et al., 1993); species identification and separation (MADUREIRA et al., 1993a,b; DEMER and HEWITT, submitted), size classification (HOLLIDAY et al., 1989), echo coherence, extinction, shadowing, and multiple scattering (MACLENNAN and SIMMONDS, ‘Supported by the Hertz Foundation. +University of California San Diego, Scripps Institution of Oceanography, La Jolla, CA 92093-0203, U.S.A. tsouthwest Fisheries Science Center, La Jolla, CA 92038. U.S.A. 355
Transcript
Pergamon Lkrp-Scn Rrmwrh I. Vol 42. No. 4. pp. 45.547375. AY95
Elsevier Science Ltd
0967-0637(94)E0005-4 Prmted in Great Britam ll967N37/94 $Y.5(lf 1).00
Bias in acoustic biomass estimates of Euphausia superba due to die1 vertical migration
DAVID A. DEMERIT and ROGER P. HEWITT*
(Received 17 December 1993; in revisedform 30 June 1994; uccepted 6 July 1994)
Abstract-The die1 vertical migration (DVM) of Antarctic krill (Euphausia superba) can greatly bias the results of qualitative and quantitative hydroacoustic surveys which are conducted with a down-looking sonar and irrespective of the time of day. To demonstrate and quantify these negative biases on both the estimates of biomass distribution and abundance, a time-depth-density analysis was performed. Data were collected, as part of the United States Antarctic Marine Living Resources Program (AMLR). in the vicinities of Elephant Island, Antarctica, during the austral summers of 1992 and 1993. Five surveys were conducted in 1992: two covered a 105 by 105 n.mi. area centered on Elephant Island, two encompassed a 60 by 35 n.mi. arca immediately to the north of the Island, and one covered a 1 n.mi.’ area centered on a large krill swarm to the west of Seal Island. The 1993 data include repetitions of the two small-area and two large-area surveys. Average krill volume dcnsitics were calculated for each hour as well as for three daily periods: day, twilight and night. These data were normalized and presented as a probability of daily average density. With spectral analysis to identify the frequencies of migration, a four-term periodic function was fitted to the probability density function of average daily biomass versus local apparent time. This function was transformed to create a temporal compensation function (TCF) for upwardly adjusting acoustic biomass estimates. The TCF was then applied to the original 19Y2 survey data; the resulting biomass estimates are an average of 49.5% higher than those calculated disregarding biases due to die1 vertical migration. The effect of DVM on the estimates of krill distribution are illustrated by a comparison of compensated and uncompensated density maps of two 1992 surveys. Through this technique, high density krill areas are revealed where uncompen- sated maps indicated low densities.
INTRODUCTION
EFFECTIVE management of the Antarctic krill fishery requires accurate information about biomass distribution and abundance. To acquire this information over large survey areas, echo integration instruments are used due to their low cost, survey speed and apparent ease of data analysis. However, an application of echo integration theory requires a meticulous and cautious interpretation of the data with respect to many theoretical assumptions. Some major concerns of using echo integration for biomass estimation include calibration inaccuracies (DEMER and HEWITT, 1993); target strength determination and variation (FOOTE et al., 1993); species identification and separation (MADUREIRA et al., 1993a,b; DEMER and HEWITT, submitted), size classification (HOLLIDAY et al., 1989), echo coherence, extinction, shadowing, and multiple scattering (MACLENNAN and SIMMONDS,
‘Supported by the Hertz Foundation. +University of California San Diego, Scripps Institution of Oceanography, La Jolla, CA 92093-0203, U.S.A. tsouthwest Fisheries Science Center, La Jolla, CA 92038. U.S.A.
355
456 D. A. DEMER and R. P. HEWIU
1992); avoidance (FREON et al., 1993); and the exclusion of animals which reside above a down-looking transducer (EVERSON, 1983; EVERSON and MURPHY, 1987). This paper investigates the biases in estimates of krill distribution and abundance which result from the die1 vertical migration (DVM) of the euphausids above the acoustic observation window.
DVM by zooplankton has been attributed to an evolved strategy of foraging in the phytoplankton-rich shallow waters during darkness and avoiding mortality due to visually oriented predators by residing deeper in the water column during daylight (GLIWICZ, 1986; FROST and BOLLENS, 1992). Another aspect of this behavioral pattern, frequently observed in krill, is shallow-water dispersal and deep-water aggregation of the swarms or patches. Night-time decrease in swarm density may increase foraging efficiency in the surface waters, whereas a daytime compaction of the swarm in deeper waters may enhance schooling dynamics and inter-swarm distances and therefore predator avoidance.
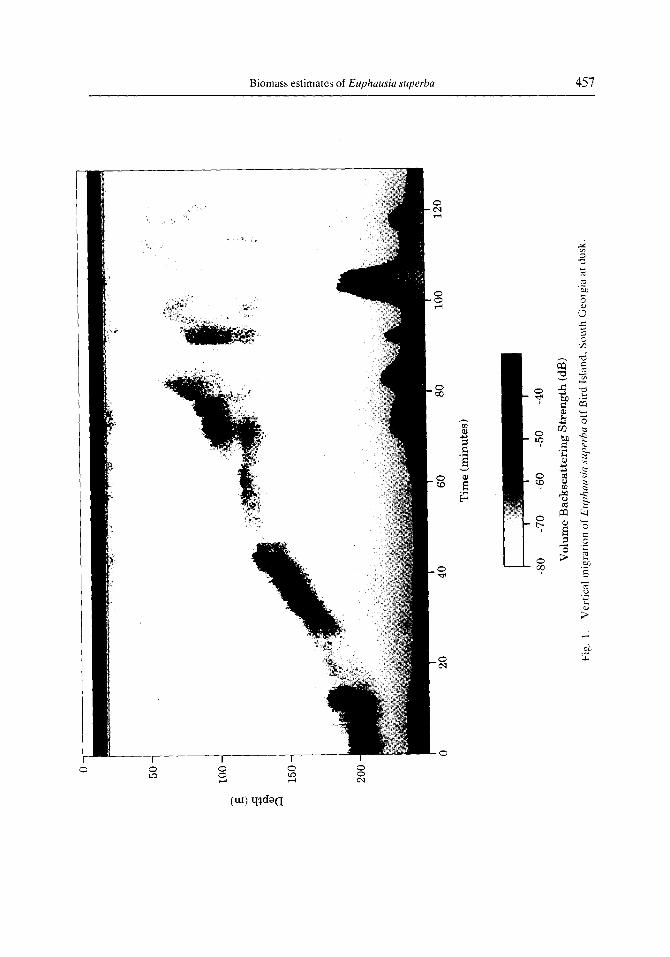
Due to the high cost of ship time, the inconvenience of temporally segmented track lines and the need to minimize survey duration when studying dynamic subjects, acoustic surveys of krill are often conducted regardless of the time of day. A benefit of this survey strategy is that krill behavior has been acoustically observed versus time, and vertical die1 migration has frequently been recorded (Fig. 1). However, this migratory behavior is complex and may vary with season, locality, light-level and possibly other factors. Krill swarms have been recorded at depths ranging from the surface to 200 m regardless of the time of day, and great behavioral differences have been observed between adjacent localities (EVERSON, 1983). Notwithstanding these observations, consistent DVM beha- vioral patterns were observed throughout these surveys, which were conducted within 50 n.mi. of Elephand Island and during the austral summers of two successive years. A ramification of these observations is that during portions of the day, a large percentage of the total krill biomass in the survey zone may reside above a down-looking transducer, and thus outside of the observation window. The resulting krill abundances are underesti- mated and the distribution maps are temporally biased. Thus, a temporal compensation function (TCF) derived from a model of die1 migratory behavior can be applied to survey results, both old and new, to account for this negative bias. The results of this study are applicable to acoustic surveys which are conducted with a down-looking sonar and irrespective of the time of day or ambient light level.
METHODS
Five quantitative acoustic surveys (92A, 92B, 92C, 92D and 92F) were conducted around Elephant Island, Antarctica, from mid-January to mid-March, 1992. Surveys 92A and 92D covered a 105 by 105 n.mi. study area centered on Elephant Island (Fig. 2). Surveys 92B and 92C covered a 60 by 35 n.mi. area immediately north of Elephant Island (Fig. 3). Survey 92F covered a 1 by 1 nmi. area to the west of Seal Island and was centered over a large and persistent krill swarm (61.065”S, 56.01.5”W). Four replicate surveys (93A, 93B, 93E and 93F) were conducted in the same areas from mid-January to mid-March 1993. Surveys 93A and 93E covered the same areas as 92A and 92D and Surveys 93B and 93F were replicates of 92B and 92C (Table 1). The patch-survey (92F) was not repeated in 1993.
Additionally, a single DVM patch study is included which was conducted near Bird Island, South Georgia, on 14 June 1993. During this study, the ship was positioned, just
0
Biomass estimates of Euphausia superba 457
8 N
50
100
w
150,
3
I 8,
I
I I
, I
I I,
I I
> (
4 I
8,
3 I
I
0 40
0 80
0 12
00
1600
20
00
Loca
l A
ppar
ent
Tim
e
0 5
10
Kri
ll D
ensi
ty (
g/m
A3)
Fig.
4.
Ave
rage
vo
lum
etric
kr
ill d
ensi
ty
from
Su
rvey
92
F ve
rsus
de
pth
and
time
of d
ay.
The
die1
ver
tical
m
igra
tion
patte
rn
of E
upha
~.G
a su
perb
a is
ill
ustra
ted
for
a si
ngle
sw
arm
.
50
100
150
I’ fi
( I
I I
r II
1 ‘I
- ‘I
I (
‘1
I ’
I 0
400
800
1200
16
00
2000
Loca
l A
ppar
ent
Tim
e
0 1
2
Kri
ll D
ensi
ty
(g/m
”31
Fig.
5.
A
vera
ge
volu
met
ric
krill
de
nsity
fro
m
Surv
eys
02A
. 92
B.
92C
. 92
D
and
92F
vers
us
dept
h an
d ti
me
of d
ay.
The
gene
ral
trend
of
the
di
e1 v
ertic
al
mig
ratio
n be
havi
oral
pa
ttern
of
Euy
haus
ia
supe
rha
is v
erifi
ed.
56
55
Long
itude
57
56
55
Lo
ngitu
de
54
Fig.
12
. La
rge-
area
di
strib
utio
n m
aps
of k
rill
dens
ity
(92A
), bo
th
unco
mpe
nsat
ed
(left)
an
d co
mpe
nsat
ed
(rig
ht)
for
die1
ver
tical
m
igra
tion
bias
.
53
60
60
Q1
2 9 61
56
55
Long
itude
--
, -..
.,-’
i ,I ‘.’
- ...
:-
-
/
/’ :
-, _~
_ 1.
.
I- -
f _i
i I
57
56
55
Long
itude
Fig.
13
. Sm
all-a
rea
dist
ribut
ion
map
s of
kril
l de
nsity
(9
23).
both
un
com
pens
ated
(le
ft)
and
com
pens
ated
(r
ight
) fo
r di
e1 v
ertic
al
mig
ratio
n bi
as.
Biomass estimates of Euphausia superhu 463
60
61
62 , 56 57 56 55 54
Surveys 9ZA, 92D, 93A, and 93E
Fig. Acoustic transects for Surveys Y2A, 92D. Y3A and Y3E
Longitude (degrees West)
60
L
Surveys 928,92C, 938 and 93F
57 56 55 54
Longitude
Fig. 3. Acoustic transects for Surveys Y2B, 92C. 93B and 93F.
464 D. A. DEMEK and R. P. HEWITT
Tuble I. 1992 and 1993 survey times and durutior~s
AMLR Start date Start time Stop date Stop time Duration Survey (Julian) (GMT) (Julian) (GMT) (Days)
Y2A 19 Jan (1Y) 1240 3 Feb (33) 1815 14.21 92B 4 Feb (35) 22% 6 Fch (37) 2130 1.95 92C 2s Fcb (56) 1612 2X Feb (SY) 0923 2.71 92D 29 Feb (60) 0258 11 Mar (71) 2302 11.85 Y2F 14 Mar (73) 0849 16 Mar (76) 0255 1.7s 93A 21 Jan (21) 2350 I Feb (32) 1645 10.78 938 I Feb (32) 0033 3 Feb (34) 2221 2.Yl 93E 21 Fch (52) 223X 3 Mar (62) 2200 Y.Y7 Y3F 9 Mar (68) lY54 12 Mar (71) 1644 2.8X
prior to sunset, over a 200 m deep krill swarm. Making minimal use of the bow- and stern-thrusters, the ship maintained approximate position over the swarm for over 2 h (Fig. 1). This strategy allowed acoustic observation of a rapid DVM of Eclphausia superba at dusk. Species identification was subsequently performed by sampling with an Isaacs- Kidd midwater trawl (IKMT).
Acoustic data were collected with a split-beam echo sounder configured with a 120 kHz transducer. The transducer beampattern was conical and narrow with 7” between half- power points. A 1 .O ms pulse was transmitted every second, and the maximum range was set to 250 m below the transducer. The transducer was deployed on a dead-weight body which was towed astern and to the port quarter at a speed of 8-10 knots and at a depth of 7 m. The system was calibrated before and after the cruises using standard sphere methods (JOHANNESSON and MITSON, 1983) in a 3 m diameter by 10 m deep tank filled with sea water chilled to OS’C ( DEMER and HEWITT, 1993).
Volume backscattering strengths attributed to krill were integrated over 5 m depth bins over a lo-250 m depth range (or 1 m above the bottom if shallower than 250 m) and averaged over 185.2 m (0.1 n.mi.) intervals
where z increments by 5 from 10 m to 245 m, s v = 0 if 10 log(s.)s -81 dB, and r. = 1 m is the reference range for backscattering strength. The resulting SA values were indexed by time and ship’s position. Average volume backscattering strengths (S”) were calculated by
Assuming sv represent the linear sum of echoes from individual animals within the sample volume (MACLENNAN and SIMMONDS, 1992) average volumetric krill biomass densities (&) were estimated from the average volume backscattering strengths as
Biomass estimates of Euphtrusiu superba 465
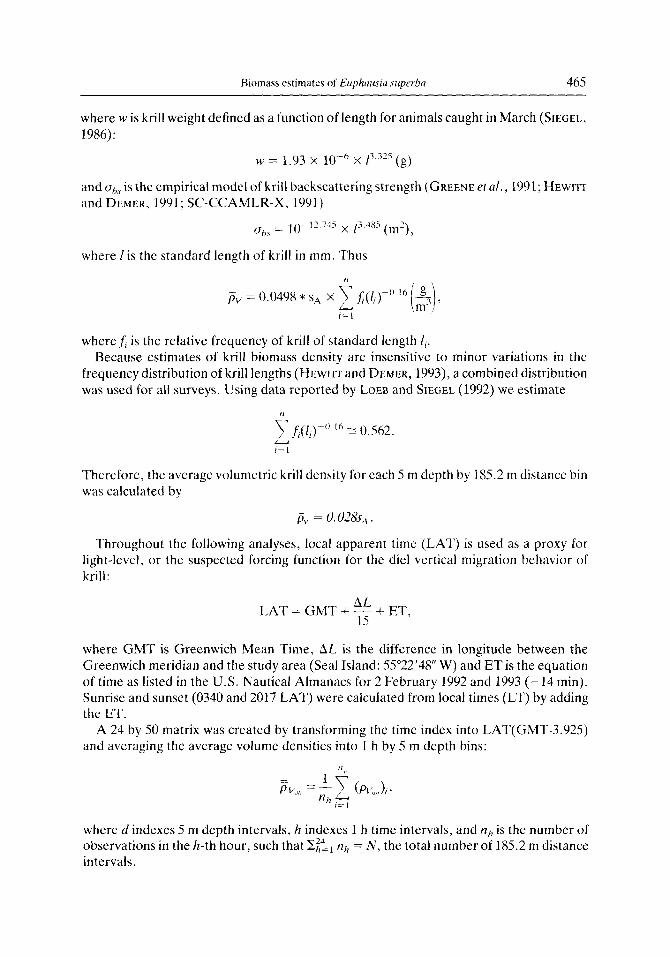
where w is krill weight defined as a function of length for animals caught in March (SIEGEL, 1986):
w = 1.93 x lo-” x I== (g)
and ohs is the empirical model of krill backscattering strength (GREENE ef al., 1991; HEWI~I and DEMER, 1991: SC-CCAMLR-X, 1991)
*hs = ,o-lZ.71” x [‘A”’ (m’),
where I is the standard length of krill in mm. Thus
/5, = 0.0498 * sA x
where h is the relative frequency of krill of standard length 1;. Because estimates of krill biomass density are insensitive to minor variations in the
frequency distribution of krill lengths (HEWIIT and DEMER, 1993), a combined distribution was used for all surveys. Using data reported by LOEB and SIEGEL (1992) we estimate
~ fi(li)-“‘” r 0.562.
Therefore, the average volumetric krill density for each 5 m depth by 185.2 m distance bin was calculated by
Throughout the following analyses, local apparent time (LAT) is used as a proxy for light-level, or the suspected forcing function for the die1 vertical migration behavior of krill:
LAT=GMT+c+ET 15 ’
where GMT is Greenwich Mean Time, AL is the difference in longitude between the Greenwich meridian and the study area (Seal Island: SS”22’48” W) and ET is the equation of time as listed in the U.S. Nautical Almanacs for 2 February 1992 and 1993 (-14 min). Sunrise and sunset (0340 and 2017 LAT) were calculated from local times (LT) by adding the ET.
A 24 by 50 matrix was created by transforming the time index into LAT(GMT-3.925) and averaging the average volume densities into 1 h by 5 m depth bins:
where d indexes 5 m depth intervals, h indexes 1 h time intervals, and nh is the number of observations in the h-th hour, such that I$:%, nh = N, the total number of 185.2 m distance intervals.
466 D. A. DEMER and R. P. HEWITT
Because most of the surveys covered areas of both high and low krill densities irrespective of the time of day (HEWITT and DEMER, 1993), an analysis of the temporal variance of krill density with depth. computed from a single survey. can be spatially confounded. In general, such an analysis results in a patchy distribution of krill density versus time of day; erroneously suggesting that biomass is not conserved throughout the day. Consequently, two methods were explored which significantly reduce the spatial variance within the density-depth-time data and reveal the underlying general DVM pattern:
(1) The average krill density of a single swarm was measured versus depth for an extended period of time (1.75 days). Then, with the methodology described above, the proportion of daily average krill density was plotted versus depth and time (Fig. 4).
(2) Data from all surveys were combined to effectively transform the spatial variability into incoherent noise while increasing the temporal sampling volume. Again, the pro- portion of daily average krill density was plotted versus depth and time (Fig. 5).
In both of these strategies, die1 variations in volumetric krill densities could be attributed to krill escaping the vertical or horizontal extents of the acoustic observation window. Survey biases can result from krill rising into the upper 15 m, descending below 250 m or swimming outside of the 7” beam. To confirm that krill are not diving too deep, but are principally found in the upper 150 m of the water column (MILLER and HAMPTON, 1989; GODLEWSKA and KLUSEK, 1987), the density-depth data from all five of the 1992 surveys were examined. Krill densities, normalized by the average daily density for each survey, were combined by averaging the 5 m depth bins. The result is an estimate of the
Depth Distribution of Krill Biomass, 1992
09 09 :
0.6 06 Cum
* .06 2 f
05 2 0
- Avg.
92A ,~ 928
92c
92D
92F
Depth Bin Centers (m)
Fig. 6. The probability density function (pdf) and the cumulative pdf of krill density versus depth. The first bin (10-15 m) for Survey C is not plotted (0.163).
Biomass estimates of Euphausia superba 467
Hourly Kdl Density, 1992
60 Hours
I
10.’ Cycles / Hour
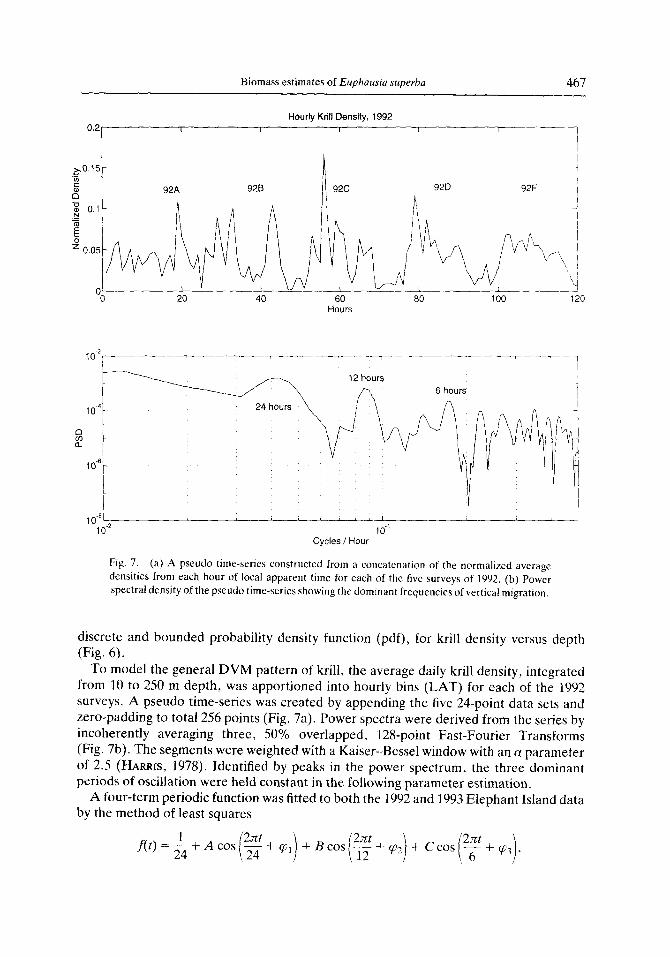
Fig. 7. (a) A pseudo time-series constructed from a concatenation of the normalized average densities from each hour of local apparent time for each of the five surveys of 1992. (b) Power spectral density of the pseudo time-series showing the dominant frequencies of vertical migration.
discrete and bounded probability density function (pdf), for krill density versus depth (Fig. 6).
To model the general DVM pattern of krill, the average daily krill density, integrated from 10 to 250 m depth, was apportioned into hourly bins (LAT) for each of the 1992 surveys. A pseudo time-series was created by appending the five 24-point data sets and zero-padding to total 256 points (Fig. 7a). Power spectra were derived from the series by incoherently averaging three, 50% overlapped, 128-point Fast-Fourier Transforms (Fig. 7b). The segments were weighted with a Kaiser-Bessel window with an a parameter of 2.5 (HARRIS, 1978). Identified by peaks in the power spectrum, the three dominant periods of oscillation were held constant in the following parameter estimation.
A four-term periodic function was fitted to both the 1992 and 1993 Elephant Island data by the method of least squares
f(t) = - + A cos -L- + ~1 2Lq (2 ,j+Hcos~~+~~J+Ccos~+~~i;
468 D. A. DEMER and R. P. HEWII-I
where f(t) is the proportion of daily average density corresponding to decimal time t, the first term is the average proportion of daily average density, A, B and Care the amplitudes and ql, cp2 and q3 are the phases of oscillation at frequenciesf, ,fi andfs, respectively (Fig. Sa,b). To illustrate the variability of the migration pattern between surveys the same data and model were also plotted as cumulative probabilities versus time of day (Fig. 9a,b).
An approximation of the DVM bias and the variance of this bias between surveys was determined by proportioning the average daily krill density into three 8-h time bins: day (0X00-1559), twilight (0400-0759 and 1600-1959), and night (2000-0359). This data was plotted for the five 1992 surveys, both individually and combined (Fig. 10).
For each year, a temporal compensation function (TCF) was derived from the mode1 of the general DVM pattern, such that the maximum value of f(t) is transformed into a correction factor of unity
TCF(t) = ‘%. t
The consistency of the generalized DVM patterns are demonstrated in a comparison of the model pdfs of the 1992 and 1993 data and their associated TCFs (Fig. 1 I).
The negative bias of DVM on acoustic estimates of biomass distribution and abundance is quantitatively estimated by converting the original survey data to LAT and multiplying by the TCF at the corresponding time. Using methods described elsewhere (HEWITT and DEMER, 1993), biomass estimates and coefficients of variation (CVs) were calculated, both with and without the TCF, for Surveys 92A, 92B, 92C and 92D. Furthermore, distribution maps for surveys 92A and 92B are compared with and without compensation for DVM.
RESULTS
A plot of the average volume density of krill from Survey 92F versus depth and time of day illustrates the general die1 vertical migration pattern of Euphausia superba; the center of mass resides in the upper 10-15 m around midnight and deepest during daylight hours; highest densities occur a few hours after sunrise and shortly prior to sunset (Fig. 4). Secondary minimums in the middle of the day are possibly due to the effects of shadowing and/or extinction. During the hours of peak insolation, krill frequently form high-density swarms with large interswarm spacings. This configuration increases the probability of shadowing or the masking of deeper krill from the transmitted pressure wave by the krill residing in the top of the swarm. A similar plot of Surveys 92A, 92B, 92C and 92D verifies that the general DVM pattern occurs on the spatial scales corresponding to the large- and small-area surveys (Fig. 5).
Detected biomass is clearly not conserved throughout the day. This implies that during portions of the night, krill are laterally avoiding detection by swimming away from the vessel, diving below 2.50 m or rising above the transducer. Estimated from the daily average krill densities of Surveys 92A, 92B, 92C and 92D, greater than 95% of the total krill biomass resides in the upper 150 m of the water column, irrespective of the time of day (Fig. 6). This indicates that a deep vertical migration of krill, beyond the maximum depth range of 250 m, is unlikely and is therefore not a cause of survey bias. Rather, a non- constant relationship between average krill density and time of day is due, at least in part, to a vertical migration of the krill above the observation range. During the Elephant Island
Fig. 8. Daily average krill densities from the surveys of (a) 1992 and (b) 1993 proportioned by hour of local apparent time. Overlaid are the corresponding models of the generalized vertical
Fig. Y. Cumulative krill densities versus time of day for each survey compared to the cumulative model pdfs of (a) 1992 and (b) 1993.
Biomass estimates of Euphausia superha 471
Krill Density versus Time of Day, Austral Summer 1992
60
92A
.:
I 92B 92c 92D 92F
.46 m .44
92ABCD 92ABCDF
Fig. 10. Daily average krill density proportloned into three 8-h time bins; day (OSOCr1559). twilight (0400-0759 and 1600&1959). and night (2000-0359).
Die1 Vertical Migration and Temporal Compensation Functions
Fig. Il. Pdfs of krill density versus LAT and their associated TCFs for data collected near Elephant Island, Antarctica during the austral summers of 1992 and 1993.
472 D. A. DEMER and R. P. H~wrn
surveys, corroborating evidence was collected as krill were removed, almost nightly, from the strainers of the survey vessel’s salt water intakes.
Apportioning the total detected biomass into eight hour bins demonstrates the magni- tude of the bias caused by DVM (Fig. 10). In a survey which is not temporally biased, the expected proportion of biomass in each bin is 33.3%. However, during these surveys, the portion conducted during the eight hours of darkness (2000-0359) contributed from as much as 33% (Survey 92A), to as little as 8% (Survey 92C). Averaging over all five surveys, the night-time portions accounted for only 19% of the total detected biomass. In contrast, the twilight periods contributed from 38% (Survey 92A), to 55% (Survey 92B), of the total with an average of 44%.
To obtain a better estimate of this bias it is necessary to separate the confounding of spatial and temporal variance within a survey. To this end, parameters of a four-term periodic function were estimated by a least-squares fit to the density versus time-of-day data from Surveys 92A, 92B, 92C, 92D and 92F, normalized by the average daily density
f(t) = 0.0417 - 0.0143 cos i F + 0.3804) - 0.0136 cos [$ - 0.3185]
- 0.0063 cos i 2 + 2.5466 .
6
This model (r2 = 0.94223), includes both primary and secondary maximums and minimums (Fig. ga). The primary minimum (2241 LAT) occurs 2 h 24 min after sunset and slightly over an hour before midnight. The two primary maximums (0653 and 1817) occur roughly three hours after sunrise and 2 h before sunset. A secondary maximum occurs at noon (1203) Ranked by secondary minima (1044 and 1505). The secondary minima may correspond to the frequently observed swarm characteristics of dispersal in shallow water at night and compaction in deeper water at midday. This behavior may be a strategic balance between efficient foraging in the phytoplankton-rich surface waters and avoidance of visually orienting predators during the day. The secondary minima might be explained by the negatively biasing effects of shadowing and multiple scattering. Shadowing is the effect of shallow animals in a very dense swarm attenuating the acoustic energy before it reaches the deeper animals. Multiple scattering describes the situation when acoustic energy, echoed from an individual within a dense swarm is trapped due to repeated echoes from the surrounding animals (MACLENNAN and SIMMONDS, 1992).
With the primary maximum of the model taken as the best estimate of the unbiased proportion of daily average biomass, a temporal compensation function (TCF) was derived which maps to unity atf(t),,, (0.0693) and a correction factor greater than one for all other times. At the time of greatest bias (2241), the TCF reaches a maximum of 3.9 or an adjustment of nearly four-fold. Biomass estimates were calculated for Surveys 92A, 92B, 92C and 92D, both with and without mutliplying by the TCF (Table 2). Adjusted by the TCF, the resulting biomass estimates increased from 36.X (92C) to 69.2% (92A), with an average increase of 49.5%.
The coefficient of variation (CV). which is a measure of the variance between north- south tracklines, is influenced by both spatial heterogeneities of the biomass and temporal changes in the effective acoustical detection. Thus, application of the TCF should effectively decrease the temporal variance and therefore the CV. This result was only realized in the adjustment of one small-area survey (92C), which exhibited a decrease of
Biomass estimates of Euphuusia superba 473
Table 2. Biomass estimates with and without temporal compensation for bias due to die1 vertical migration
Biomass (g m -‘) cv (%) Area Change Change
Survey (m*) Original Adjusted (70) Original Adjusted (%)
13.9%. Conversely, the CVs of the large-area surveys (92A and 92D) increased by an average of 41 .O%. This discrepancy may reflect the difference in average survey duration for the large-area transects (1.7 day) relative to the small-area transects (0.2 day).
Stability of the DVM model was tested by repeating the parameter estimation for the data from surveys 93A, 93B, 93E and 93F
f(r) = 0.0417 - 0.0222 cos g + 0.4157) - 0.0101 COS [% - 0.35193 i
- 0.0075 cos [,$ + 6.30171
The consistency of the general DVM pattern is illustrated by comparison of the two pdfs (Fig. 11). The data from both years exhibits a dramatic decrease in detected biomass at midnight and two peaks around noon. However, relative to the 1992 pattern, the times of peak density are closer to noon in 1993 with much lower densities recorded at midnight.
Comparisons of the distribution maps of a large-area (92A) and a small-area survey (92B) provide evidence that areas of high krill densities may exist where the original survey results indicated negligible biomass (Figs 12 and 13). This result is very important if both distribution and abundance are considered when the survey data are used for fisheries management. Of particular note are the areas of increased density to the southeast of Clarence Island (92A) and to the north of Elephant Island (92B).
DLSCUSSION
The negative bias of die1 vertical migration on quantitative acoustic surveys conducted with a down-looking transducer and irrespective of the time of day can be significant. To avoid, minimize or compensate for this error, three acoustic measurement options are currently available: (1) acoustic surveys could be conducted only during daylight hours; (2) down-looking sonars can be replaced by, or augmented with, side-looking or deeply- towed up-looking transducers; or (3) a TCFcan be used to adjust the survey data. Due only to the high cost of ship time, the first option is generally impractical. Because the signals of side-looking sonars can be highly degraded by bubble noise. side-lobe reflections from the surface, and downward refraction of the pulse, they are a doubtful solution. EVERSON and BONE (1986) tested a system with an angled upward transducer and reported problems with surface scatter and a lack of ventral or ventro-lateral aspect target strength data. Scattering from elongated zooplankton is highly dependent on the incidence angle of the pulse (STANTON, 1989), but this dependence has been partially characterized for only one
474 D. A. DEMER and R. P. H~wrn
axis of rotation (angle from horizontal). Survey results from a deeply-towed up-looking sonar may be biased by an avoidance reaction of the krill to the towing cable or corrupted by bubble noise. Therefore, until survey methodologies are developed which are more immune to the DVM bias, a TCF should be used to enhance the accuracy of acoustic survey results of krill.
Since light level is suspected to be the primary forcing function for DVM of krill, and because sunrise, sunset and integrated light levels change daily, an additional phase term should be added to the TCF to account for the seasonal variability. As an extension to this analysis, the day-length, as determined from the light-level data, could be fit by the method of least-squares to estimate a phase term in the general model of die1 vertical migration. Additionally, the analysis should be repeated on survey data from different seasons, locations and species to enhance the accuracy of those biomass estimates as well as provide a better understanding of DVM behavior of Euphausia superba dana.
Acknowledgements-Research in the Elephant Island area was supported by the National Oceanic and
Atmospheric Administration (NOAA) as part of the United States Antarctic Marine Living Resources Program. The South Georgia study was part of a joint research project between the National Science Foundation (NSF) and NOAA. WC wish to thank David Greene, Rennie Holt, Duncan McGchec, Jane Rosenberg, and Stephanie Sexton for helping to maintain a vigil over the acoustic data collection; and the officers and crew of the NOAA Ship Surl?eyor and the NSF Ship Nathaniel B. Palmer for their help and support.
REFERENCES
DEMER D. A. and R. P. HEWI~ (1993) Calibration of an acoustic echo-integration system in a deep tank, with gain comparisons over standard sphere material, water temperature and time. Scientific Committee- Conservation of Antarctic Marine Living Resources-Selected Scientific Papers, 9, 127-144.
DEMER D. A., R. P. HEWI= and V. J. LOEB (submitted) In-situ target strength measurements of Antarctic zooplankton (Euphausia superba and Salpa thompsoni) at 120 and 200 kHz, corroboration of scattering models, and a statistical technique for delineating species. Journal of the Acoustical Society of America.
EVERSON I. (1982) Diurnal variations in mean volume backscattering strength of an Antarctic krill (Euphausia superba) patch. Journal of Plankton Research, 4, 155-162.
EVERSON I. (1983) Variations in the vertical distribution and density of krill swarms in the vicinity of South Georgia. Memoirs-National Institute of Polar Research, Special Issue No. 21,84-92.
EVERSON I. and D. G. BONE (1986) Detection of krill (Euphausia superba) near the sea surface: preliminary results using a towed upward-looking echo-sounder. British Antarctic Survey Bulletin, 72,61-70.
EVERSON I., J. L. WATKINS, D. G. BONE and K. G. FOOTE (1990) Implications of a new acoustic target strength for abundance estimates of Antarctic krill. Nature, 34.5, 338-340.
FOOTE K. G., 1. EVERSON, J. L. WATKINS and D. G. BONE (1990) Target strengths of Antarctic krill (Euphuusiu superba) at 38 and 120 kHz. Journal of the Acoustical Society of America, 87, Ifi-24.
FOOTE K. G., D. CHU and T. K. STANTON (1992) Status of krill target strength. Scientific Committee- Conservation of Antarctic Marine Living Resources-Selected Scientific Papers, 9, 101-126.
FREON P., M. SORIA, C. MULLON and F. GERLO~TO (1993) Dirunal variation in fish density estimates during acoustic surveys in relation to spatial distribution and avoidance reaction. Aquatic Living Resources, 6,221- 234.
GREENE C. H., T. K. STANTON, P. H. WIEBE and S. MCCLATCHIE (1991) Acoustic estimates of Antarctic krill. Nature, 349, 110.
GLIWICZ M. Z. (1986) Predation and the evolution of vertical migration in zooplankton. Nature, 320, 746-748. GODLEWSKA M. and K. KLUSEK (1987) Vertical distribution and diurnal migrations of krill--Euphausiu superba
Dana-from hydroacoustical observations, SIBEX, December 1983iJanuary 1984. Polar Biology, 8.17-22. GUNDERSON D. R. (1993) Surveys offisheries resources. Wiley, New York. NY. 231 pp. HARRIS F. J. (1978) On the use of windows for harmonic analysis with the discrete Fourier-transform.
Proceedings of the Institute of Electrical and Electronic Engineers, 66. 51-83. HEWITT R. P. and D. A. DEMER (1991) Krill abundance. Nature, 353,310.
Biomass estimates of Euphausia superba 475
HEWITT R. P. and D. A. DEMER (1993) Dispersion and abundance of Antarctic krill in the vicinity of Elephant Island in the 1992 austral summer. Murine Ecology Progress Series, 99,29-39.
HOLLIDAY D. V., R. E. PIEPER and G. S. KLEPPEL (1989) Determination of zooplankton size and distribution with multifrequency acoustic technology. Journal Du Conseil, 46 Nl, 52-61.
J~HANNESSON K. A. and R. B. MITSON (1983) Fisheries acoustics: a practical manual for aquatic biomass estimation. Food and Agricultural Organization Technical Paper, 240,249 pp.
LOEB V. J. and V. SIEGEL (1992) AMLR Program: krill stock structure in the Elephant Island area, January- March. 1992. United States Antarctic Journal, 214216.
MADUREIRA L. S. P., P. WARD and A. ATKINSON (1993a) Differences in backscatteringstrength determined at 120 and 38 kHz for three species of Antarctic macroplankton. Marine Ecology Progress Series, 93, 17-24.
MADUREIRA L. S. P., 1. EVERSON and E. J. MURPHY (1993b) Interpretation of acoustic data at two frequencies to discriminate between Antarctic krill (Euphausia suprrba dana) and other scatterers. Journal of Plankton Research. 1.5. 787-802.
MACLENNAN D. J. and E. J. SIMMONDS (1992) Fisheries acoustics. Chapman and Hill, London, 325 pp. NEII. W. E. (1990) Induced vertical migration in copepods as a defense against invertebrate predation. Nature,
345,524-526. PUIDDEMANN A. J. and R. PINKEL (1989) Characterization 01 the patterns of diel migration using a Doppler
sonar. Deep Sea Research, 36,509-530. SC-CCAMLR-X (I 991) Report of the Tenth Meeting of the Scientific Committee for the Conservation of Antarctic
Marine Living Resources. Committee for the Conservation of Antarctic Marine Living Resources. Hobart. Tasmania. 271 pp.
SEIGEL V. (1986) Structure and composition of the Antarctic krill stock in the Bransficld Strait (Antarctic Peninsula) during the Second International BIOMASS Experiment (SIBEX). Arch. Fishc. Wiss. 37:51,72.
STANroN T. K. (lY89) Sound scattering by cylinders of finite length. III. Deformed cylinders. Journal of the Acoustic Society of Americu, 86,691-705.
TESLER W. D. (1989) Bias and precision in acoustic biomass estimation. Proceedings ofthe Institute of Acoustics, 11,202-211.
ZARET T. M. and J. S. SUFFERN(l976) Vertical migration in zooplankton as a predator avoidance mechanism. L~irnriolo~) and Oceanography, Nov. 804-812.