27
Bias, Uncertainty and Transferability in Standard Methods of Pipette Calibration George Rodrigues, Ph.D. Senior Scientific Manager ARTEL [email protected] June, 2003 19A4672A
| Date post: | 06-May-2018 |
| Category: |
Documents |
| Upload: | dangnguyet |
| View: | 223 times |
| Download: | 1 times |

Bias, Uncertainty and Transferability in Standard Methods of Pipette Calibration
George Rodrigues, Ph.D. Senior Scientific Manager ARTEL [email protected] June, 2003
19A4672A

ii
Table of Contents Executive Summary.....................................................................................................................................................1
Comparison of Gravimetric Standards .....................................................................................................................2 Overview of the Gravimetric Method ........................................................................................................................2 Historical Overview of Gravimetric Standards .........................................................................................................3 Comparison of ASTM 1154 and ISO 8655 ................................................................................................................4
Summary of Standards Comparison ......................................................................................................................5
Experimental Methods ................................................................................................................................................6 Method 1: Weighing a 10mg Artifact Using an Evaporation Trap ...........................................................................6
Weight following Correction via the ASTM Method............................................................................................9 Weight Following Correction via the ISO Method................................................................................................9
Method 2: Weighing a 10mg Artifact in Controlled Humidity ................................................................................10 Method 3: Weighing a 200µg Artifact in Controlled Humidity ...............................................................................12
Weight following Correction via the ISO Method...............................................................................................14 Weight following Correction via the ASTM Method..........................................................................................15 Comparison of ISO and ASTM Corrections........................................................................................................16
Method 4: Weighing a 200µg Artifact Using a Covered Vessel ..............................................................................17 Experimental Conclusions .......................................................................................................................................18
Transferability of Pipette Calibration .....................................................................................................................19 Impact of Environmental Changes on Transferability.............................................................................................19
Effect of Relative Humidity at 5µL Dispensed Volume......................................................................................19 Effect of Relative Humidity at 0.2µL Dispensed Volume...................................................................................21
Impact of Operator Technique on Transferability...................................................................................................21
Conclusions ................................................................................................................................................................24 About ARTEL...........................................................................................................................................................24
Appendix A: References............................................................................................................................................25
Copyright © 2003 by Artel, Inc. All rights reserved. Printed in USA.
PCS is a registered trademark and Pipette Tracker and Dual-Dye Ratiometric Photometry are trademarks of Artel, Inc. All other marks are property of their respective companies.
ARTEL 25 Bradley Drive Westbrook, ME 04092 1-888-406-3463

Bias, Uncertainty and Transferability in Standard Methods of Pipette Calibration ARTEL
Page 1
Executive Summary This paper compares the bias, uncertainty and transferability in two current standards of pipette calibration: ASTM E 1154; and ISO 8655-6:2002. Both these standards are based on the gravimetric principal, in which the weight of a liquid is measured using a balance and converted to volume using an accepted formula.
The paper compares and contrasts the two important current gravimetric standards, and presents experimental work that quantifies the error contribution of some of the most significant sources pertaining to pipette calibration using gravimetry.
To assess the uncertainty of the measurement method, the uncertainty introduced by the various means described in the respective standards for controlling, measuring, and compensating for the effect of evaporation are evaluated. Data are presented to quantify the uncertainty in estimates of the evaporation rate, and the bias incurred as a result of neglecting evaporation.
To assess the uncertainty attributed to the device under test, experimental work is presented to confirm the significant impact that changes in environmental relative humidity and operator technique exert on the mean volume delivered by air displacement pipettes.

Bias, Uncertainty and Transferability in Standard Methods of Pipette Calibration ARTEL
Page 2
Comparison of Gravimetric Standards This section compares and contrasts the two most widely used current standards for pipette calibration using the gravimetric method, ASTM E 1154 (1997) and the newer ISO 8655-6:2002. It also presents an overview of the gravimetric method, and a brief history of the evolution of today’s standards.
Overview of the Gravimetric Method Gravimetry refers to the measurement of the weight of water and its conversion to volume using an accepted formula (see Figure 1 below). Gravimetric methods involve these basic procedures:
1. A balance of adequate performance is used.
2. A receiving vessel, typically made of glass, is placed on the balance pan.
3. Apart from the balance is a source vessel, which contains the liquid to be dispensed. For calibration purposes under these gravimetric standards, the liquid is water.
4. An initial reading (tare weight) of the receiving vessel is taken.
5. A pipette to be tested is used to aspirate water from the source vessel.
6. This volume of water is then delivered to the receiving vessel.
7. The draft shield of the balance is closed to seal the weighing chamber.
8. A final weight of the sample liquid plus the receiving vessel is taken.
With any gravimetric method, there is some instability due to evaporation in the sample itself. This evaporation must be estimated and appropriate compensation made. Figure 1 shows the equation for converting the weight of a liquid to a volume and compensating for evaporation.
( )eWWPTTZV AAwG +−×= 01),,(
Figure 1: Calculation of delivered volume.
The terms of the equation are as follows: VG is the gravimetric volume measured; W1 is the final weight after dispensing the sample volume; W0 is the initial (tare) weight; e is a correction term for the amount of liquid that evaporates during the weighing cycle. Thus (W1 – W0 + e) yields the differential weight; i.e., the weight of the dispensed liquid as shown on the balance. This weight is converted to volume using the “Z factor,” which properly accounts for the air buoyancy and liquid density effects. The Z factor is a function of the temperature of the water (TW), the temperature of the air (TA), and the barometric pressure (PA). Tables of the Z factor are available; these tables typically make the simplifying assumption that the air and water are at thermal equilibrium.
To summarize, the primary factors influencing this measurement equation are:
• The density of the water as function of its temperature
• Air buoyancy as a function of air temperature and barometric pressure
• Evaporation as a function of temperature and relative humidity
Secondary considerations in gravimetric measurements include:
• A balance of adequate resolution must be used. ISO 8865-6, for example, provides requirements for minimum balance resolution in relationship to the volume to be weighted.
• Any of the normal factors that could influence a weighing on a balance, such as air currents or electrostatic forces, need to be considered and controlled. In particular, air currents can influence not only the settling rate, but also the evaporation rate of the unstable liquid sample.

Bias, Uncertainty and Transferability in Standard Methods of Pipette Calibration ARTEL
Page 3
• Likewise, because the receiving vessel is typically made of glass, and pipette tips are typically made of polypropylene, electrostatic forces can also be significant.
An important advantage of the gravimetric method is that it entails a small materials expense, notwithstanding the acquisition of an appropriate balance. However, proper execution of gravimetric methods of pipette calibration, particular at small volumes, requires considerable time, attention to detail, and some expertise.
Historical Overview of Gravimetric Standards This section summarizes the recent history of consensus standards for pipette calibration using gravimetry. The most influential modern standards are shown on the timeline in Figure 2.
Figure 2: Consensus standards applicable to gravimetric pipette calibration.
The British Standard 6018, approved in 1981, applied to pipettes down to and including 50µL. This was adequate for the volume ranges of glass pipettes and the larger air displacement pipettes in use at that time. However, even in 1981, and more so in subsequent years, pipettes of volumes well below 50µL were produced. The overall market trend has clearly been towards smaller and smaller volume pipetting devices, and the corresponding standards have attempted to follow this trend.
In 1986, British Standard 7532 was released, extending the BS 6018 methods to smaller volumes down to and including 10µL. The major differences between BS 7532 and BS 6018 concerned the inclusion in the latter standard of a means of correcting for evaporation, which at volumes below 50µL was judged to be a significant source of error that required compensation.
These British Standards, as well as other work undertaken in Germany, were used as source material for the revision of the DIN 12650 standard. DIN 12650 was issued in parts during the period from 1978 to 1983, and work to revise this standard was still ongoing in 1998 when the work of the DIN committee was transferred to ISO Technical Committee 48.
In the United States, the ASTM E 41 committee produced the ASTM 1154 in 1989, which was a standard for gravimetric pipette calibration with a scope of applicability down to 1µL. ASTM 1154 was re-approved in 1997, with balloting for re-approval to begin again in the spring of 2003.
In the meantime, work on the DIN 12650 standard (now within ISO TC 48), resulted in the issuance in 2002 of the ISO 8655 family of standards. Part 6 of this standard specifies a gravimetric method of calibration with a lower range of applicability of 0.1µL.
Changes in gravimetric standards for pipette calibration over the last 20+ years have principally resulted in the incremental extension of the lower range of applicability from 50µL down to 0.1µL. It is interesting to note, however, that the methodology for controlling evaporation specified in ISO 8655 is very similar to that described in BS 7532. However, even though evaporative compensation methods have not much changed, the

Bias, Uncertainty and Transferability in Standard Methods of Pipette Calibration ARTEL
Page 4
same lower limit of applicability of the method has been extended by two orders of magnitude. It is open to consideration whether the extension of these methods to increasingly small volumes is rigorously valid. In any event, a significant minority of pipettes currently in use can dispense volumes less than 50µL. And a small but growing number of applications below 0.1µL have evolved for which there are no current standards for gravimetric calibration.
Comparison of ASTM 1154 and ISO 8655 The primary goal of Part 1 of this paper is to compare and contrast the ASTM 1154 and ISO 8655 methods. To facilitate this comparison, we start by examining some details of the language within these standards searching for differences that might introduce bias between them. Then we present an experimental method and data that examines these potential biases. This experimental data can then be used to estimate measurement uncertainty.
There are significant points of disagreement between these two standard methods, particularly as regards the estimation of evaporation. ASTM 1154 specifies a method of evaporation using a blank trial. It states in Section 13.6.2.11:
Perform a control blank for estimation of evaporation by repeating (prior sections) exactly as in a normal sample weighing but without actually delivering any liquid to the weighing vessel.
It is worthwhile to note from a compliance viewpoint the use of the word “exactly.” It raises questions as to how exact a replication is required. In a strict sense this is probably not an assessable clause, as all methods are bound be at some variance from this requirement for an exact estimation. However, the intent of this language is clear: the user is to mimic the normal weighing process as closely as possible, in order to obtain as representative an evaporative estimate as possible.
ISO 8655, in contrast, offers greater compromise with respect to estimating evaporation; it states in Section 7.2.8 that:
After the last weighing leave the weighing vessel on the balance pan for the time measured in (prior section) and record its mass…
Here the general approach to estimating the sample instability is to use a differential weighing over a timed interval. It requires the user to note how long it takes to perform a calibration, leave the balance undisturbed for an equivalent time period, and then use the evaporative weight loss during that period as an estimate to apply to calibration. For addition weighing cases, however, it seems intuitively likely that this method should produce an underestimation of the evaporative weight, because the draft shield remains closed throughout the interval. During normal weighing the shield would be open and closed a number of times, increasing air flow and hence evaporation. Data discussed below will address the significance of this source of potential variability.
ISO 8655 includes further statements regarding evaporative compensation. In Section 7.2.8 it states:
…if a weighing vessel with a lid is used, omit (step 7.2.8), as a correction for evaporation is unnecessary.
Introducing further flexibility, ISO 8655 seemingly clouds the above statement in Section 6.3, which in regard to the problem of evaporative control and correction states:
…an evaporation trap could be used … evaporation can be determined…
When using a lid over the weighing vessel, the letter of the standard requires the user to omit evaporative compensation. The question then arises as to the significance of the evaporative loss that is ignored. Even though a tightly covered weighing vessel greatly improves sample stability, the procedure requires removal of the cover for subsequent additions, each instance of which permits evaporation to occur.

Bias, Uncertainty and Transferability in Standard Methods of Pipette Calibration ARTEL
Page 5
Summary of Standards Comparison To summarize the most relevant points from the above discussion:
• ASTM 1154 describes a single, detailed gravimetric method.
• ASTM 1154 requires that evaporation be estimated by “exact” blank trials.
• ISO 8655 describes a “family of methods” (i.e., options) in which evaporative correction is in some cases optional.
• Where it requires correction, ISO 8655 specifies that evaporation be estimated using a timed trial.
The uncertainty of standard gravimetric calibration methods were investigated experimentally at ARTEL, as described below. Following these discussions, subsequent sections present further experimental data concerning those factors that may influence the uncertainty associated with pipettes themselves.

Bias, Uncertainty and Transferability in Standard Methods of Pipette Calibration ARTEL
Page 6
Experimental Methods The general approach taken in these experiments is to use one or more wire artifacts of known (or determinable) weight as surrogates for a liquid volume of unknown weight. Since these wires are stable artifacts that can be uniquely identified, they can be used to load the balance as needed to assess the repeatability and bias of a variety of weighing process configurations. For each experimental method, three types of weighing processes were evaluated. These are:
• Simple weighing; i.e., weighing on a bare pan
• Dry process weighing, in which the wire artifacts are weighed in the presence of associated equipment such as a receiving vessel, evaporation trap, etc., but with no water in the receiving vessel
• Wet process weighing, which is similar to the dry process, except that water is added to the receiving vessel.
Experimental data was collected by systematically stepping through each of these three measurement processes for a given method. Four different methods were evaluated, as described below. The data collected from each method were analyzed under the minimum requirements of the two gravimetric procedures. By this analysis the uncertainty and bias of each method and standard combination could be estimated.
Method 1: Weighing a 10mg Artifact Using an Evaporation Trap In this method, an evaporation trap was used to increase the relative humidity in the vicinity of the receiving vessel. A significant increase in local relative humidity, and hence a decrease in the evaporation rate, can be obtained in this way; however, there is still instability in the sample.
This method attempts to mimic a pipette calibration process using tare addition. But rather than delivering an unknown quantity of liquid to the receiving vessel, a wire artifact of known mass was instead delivered to the top of the receiving vessel. The mass of this artifact is stable and can be calibrated in a dry environment. The method tests the ability of the measurement process to return the known value corresponding to the mass of the artifact.
The procedure employed in this method is to:
1. Calibrate the weight of the wire artifact
2. Determine its weight using the standard wet measurement process
3. Check whether the weight returned by the calibration method matches that determined by convention “dry” calibration.
The data were gathered in ARTEL’s calibration laboratory using a Mettler AX205 balance with the manufacturer’s evaporation trap in place. Figure 3 shows a photograph of the experimental setup.

Bias, Uncertainty and Transferability in Standard Methods of Pipette Calibration ARTEL
Page 7
Figure 3: Setup used to weigh 10mg samples with an evaporation trap.
The mass of the wire artifact was determined using a Mettler MT5 balance in six-place mode (microgram resolution). The graph in Figure 4 shows the repeatability of the weighing of that artifact.
Figure 4: Weight of wire artifact on a six-place balance.

Bias, Uncertainty and Transferability in Standard Methods of Pipette Calibration ARTEL
Page 8
Figure 5 shows the repeatability of weighing of the wire artifact on the five-place AX205 balance. The reduced repeatability compared to Figure 4 is due to the lower balance resolution.
Figure 5: Weight of wire artifact on a five-place balance.
Next, the evaporation trap was assembled, a glass receiving vessel was placed on the AX205 balance pan, and water was added to the receiving vessel. Then we weighed the wire artifact once again. As Figure 6 shows, the results returned in this phase of the method are lower than the weight obtained in the “dry” case. This difference in the “wet” case is attributable to evaporation.
Figure 6: Weight of wire artifact in “wet” case using evaporation trap.

Bias, Uncertainty and Transferability in Standard Methods of Pipette Calibration ARTEL
Page 9
Weight following Correction via the ASTM Method Using the ASTM 1154 method of mimicking the weighing process described above as precisely as possible, an average correction factor for evaporation can be determined. The result of applying this correction factor to the uncorrected result illustrated in Figure 6 is shown in Figure 7.
Figure 7: Weight of wire artifact following evaporative correction using ASTM method.
Here it is evident that the mean value for the weight of the artifact moves up much closer to the previously determined weight, but scatter increases somewhat. This is due to the variability in evaporation within each individual trial. Thus, the ASTM method seems to provide a good estimate of average evaporation, but with some variability across trials, as is typical in methods of this type.
Weight Following Correction via the ISO Method When weighing the wire artifact with an evaporation trap using the ISO 8655 method, no correction is made to the values obtained, because the standard permits the omission of evaporative correction when appropriate controls (such as an evaporation trap) are used. Thus, a user operating in compliance with ISO 8655 could report a mean result of 9.97mg, whereas a user complying with ASTM 1154 would report a result some 0.40mg higher. Figure 8 plots the relative size of the random errors as standard uncertainties. The sign and magnitude of the bias (converted to nanoliters) is also shown.

Bias, Uncertainty and Transferability in Standard Methods of Pipette Calibration ARTEL
Page 10
Figure 8: Comparison of bias at 10mg with evaporation trap.
The bias between the mean values in the “wet” and “dry” cases is small for the ASTM method. In the case of the ISO method applied without correction, the bias is statistically significant, in that it is larger than the uncertainty attributable to the random error. Under the ISO Guide to the Expression of Uncertainty in Measurement (GUM) this bias should preferably be quantified and corrected, as the GUM states that “It is assumed that the result of a measurement has been corrected for all recognized significant systematic effects and that every effort has been made to identify such effects.” (Section 3.2.4)
Method 2: Weighing a 10mg Artifact in Controlled Humidity This method, which was also a tare addition method, uses elevated relative humidity in the laboratory environment as a means to increase sample stability by reducing evaporation. Both the ASTM 1154 and ISO 8655 standards set minimum facility requirements for relative humidity. In this case, under the ISO method for example, the required relative humidity is greater than 50%.
Data were again gathered in ARTEL’s calibration laboratory using a Mettler AX205 balance. For this method, an elevated relative humidity in the 50-55% range was used instead of an evaporation trap. Figure 9 shows a photograph of this experimental setup.

Bias, Uncertainty and Transferability in Standard Methods of Pipette Calibration ARTEL
Page 11
Figure 9: Setup used to weigh 10mg samples in the presence of humidity controls.
In this method, the control artifact was applied to the receiving vessel as evaporation occurred in the presence of standards compliant humidity controls. In general, evaporation was greater in the humidified laboratory than when using an evaporation trap. Given the same uncertainty for the artifact and “dry” tare addition weighing as in Method 1, this greater evaporation led to a larger combined bias, as graphed in Figure 10.
Figure 10: Comparison of bias at 10mg using controlled relative humidity.
It is interesting to note that, in this method, the values obtained using ASTM corrections yielded a positive bias. This has been noted (with variable degrees of significance) in other experiments conducted at ARTEL. We believe that this fluctuation in the bias is due simply to “luck” in the trials. The ASTM standard calls for each trial to consist of ten sample weighings, with two evaporation trials (one before the first sample and the other after the tenth sample). The average of the two evaporation trials is then used as the correction for evaporation. Depending on the variability in the evaporation rate, and the “luck of the draw”, this can lead to an estimated

Bias, Uncertainty and Transferability in Standard Methods of Pipette Calibration ARTEL
Page 12
rate of evaporation that can be either high or low relative to the actual rate. In this case, it seems likely that evaporation was estimated about 20 micrograms higher than actual, yielding a final result that was positively biased.
The values obtained using the ISO 8655 compensation method, as required in the absence of an evaporation trap, yielded a strong negative bias. The compensation was based on a timed trial and was imperfect, as would be expected given the method.
Method 3: Weighing a 200µg Artifact in Controlled Humidity This method uses straight addition in the presence of elevated relative humidity (50-55%) to weigh a series of ten smaller (200µg) wire artifacts. Data were again gathered in ARTEL’s calibration laboratory, this time using a Mettler MT5 six-place balance. Tare addition was not possible in this trial, because the instability of the sample (held in a pre-filled glass receiving vessel) is great enough that this highly sensitive balance never achieved the stability condition needed to return a zero tare. Thus, the data begins with an initial value for the first wire artifact weighed, and subsequent values are simply added one at a time as each of the ten artifacts are placed on the receiving vessel.
Figure 11 shows a photograph of this experimental setup. Here the receiving vessel is a 2ml glass vial, placed inside the draft shield. The thermometer is used for measuring the temperature of the liquid; the weights are used to verify traceable accuracy of the balance. To the left of the balance is a timer, which was important for this method to control and reproduce the weighing cycle as exactly as possible, to within one second when practical.
Figure 11: Setup used to weigh 200µg samples in the presence of humidity controls.
Each weighing cycle was 60 seconds in duration. After taking an initial reading, the draft shield was opened and the first of the ten artifacts was applied to the receiving vessel. Then the draft shield was closed, and a weight recorded. This procedure was repeated as each of the ten wire artifacts was added to the receiving vessel.
Figure 12 is a photograph of the 200µg wire artifacts used in this method, along with the forceps used to manipulate them. A U.S. dime coin is shown for scale.

Bias, Uncertainty and Transferability in Standard Methods of Pipette Calibration ARTEL
Page 13
Figure 12: Wire artifacts used for straight addition weighing method.
Masses were initially assigned to each of the ten wire artifacts via direct weighing using a dry pan on the MT5 balance. Weighing via calibration was not practical as the masses involved were below 1mg. Artifact #1 had a mean value based on direct weighing of about 201µg. Artifact #4 was the heaviest. The relative weights of the artifacts, as expected, are reflected in the subsequent trial data shown in Figure 13.
Figure 13: Weights of artifacts obtained via addition weighing on a “dry” six-place balance.

Bias, Uncertainty and Transferability in Standard Methods of Pipette Calibration ARTEL
Page 14
Weight following Correction via the ISO Method When the trial is repeated using the ISO 8655 method, the weight change at each addition step prior to correction is significantly smaller. The evaporation rate is equivalent to about half the weight of each artifact, as Figure 14 illustrates.
Figure 14: Weights of wire artifacts obtained via ISO 8655 (uncorrected).
ISO 8655 dictates that, “After the last weighing leave the weighing vessel on the balance pan for the time measured in (prior section) and record its mass…”
For this method, the time measured was ten minutes, reflecting a series of ten 60-second weighing cycles. Thus, after weighing the change due to artifact #10, the balance was left closed for a further ten minutes, at which time an eleventh data point was recorded. That value was divided by ten and applied as a correction factor to each of the previous ten values. The result of correction using the ISO method is shown in Figure 15.

Bias, Uncertainty and Transferability in Standard Methods of Pipette Calibration ARTEL
Page 15
Figure 15: Weights of wire artifacts obtained via ISO 8655 (corrected).
The correction factor moves the data up closer to the actual weights of the artifacts. However, because the draft shield was closed for the entire ten minute interval, unlike during the actual weighing cycles when it was repeatedly opened and closed, the correction underestimates evaporative loss by about 12%.
Weight following Correction via the ASTM Method To measure the bias of the ASTM method, another set of data was collected (see Figure 16)
Figure 16: Weights of wire artifacts obtained via ASTM 1154 (uncorrected).
Following the weighing process, the evaporation rate was estimated by mimicking the original weighing cycle as precisely as possible. With the correction applied, the ASTM data closely matches the assigned masses of the artifacts (see Figure 17).

Bias, Uncertainty and Transferability in Standard Methods of Pipette Calibration ARTEL
Page 16
Figure 17: Weights of wire artifacts obtained via ASTM 1154 (corrected).
Comparison of ISO and ASTM Corrections It is useful to compare the deviations from the values obtained via direct weighing of the artifacts shown in the top three lines in Figure 17 above. Note that the ASTM corrected measurements consistently approach and in some cases achieve zero deviation, whereas the ISO corrected measurements consistently underestimate evaporation. Further statistical processing to investigate both random and systematic errors yields the plot in Figure 18. It shows the combined uncertainties from direct weighing, the dry process weighing cycles, and the “wet” evaporation trials.
Figure 18: Combined biases for ASTM and ISO correction methods at 0.2mg.
Bias, Uncertainty and Transferability in Standard Methods of Pipette Calibration ARTEL
Page 17
Some uncertainty is present in the direct weights of the artifacts. The dry process repeatability, however, showed reduced uncertainty compared with the artifact uncertainty, while the trials to compensate for evaporation show increased variability. The combined standard uncertainty (random component) is on the order of a few nanoliters. The ASTM corrected data were not significantly biased, while the ISO data remained significantly biased (approximately -13nL). Using these ISO results to calibrate a P-2 pipette at its smallest volume setting would induce an uncorrected systematic error of 6.5%.
Method 4: Weighing a 200µg Artifact Using a Covered Vessel This method uses straight addition in a covered receiving vessel to weigh the same series of ten 200µg wire artifacts used in Method 3. The same masses are thus assumed for the artifacts. Data were again gathered in ARTEL’s calibration laboratory, again using a Mettler MT5 six-place balance. Tare addition was again not possible in this trial due to sample instability.
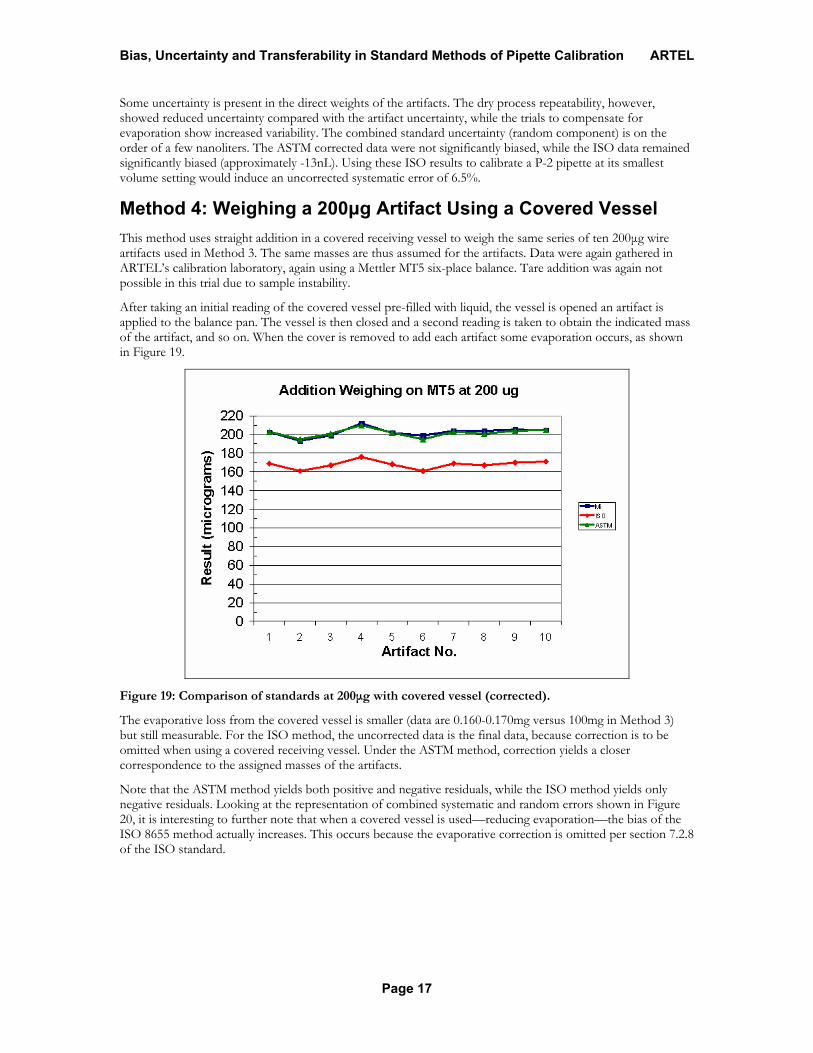
After taking an initial reading of the covered vessel pre-filled with liquid, the vessel is opened an artifact is applied to the balance pan. The vessel is then closed and a second reading is taken to obtain the indicated mass of the artifact, and so on. When the cover is removed to add each artifact some evaporation occurs, as shown in Figure 19.
Figure 19: Comparison of standards at 200µg with covered vessel (corrected).
The evaporative loss from the covered vessel is smaller (data are 0.160-0.170mg versus 100mg in Method 3) but still measurable. For the ISO method, the uncorrected data is the final data, because correction is to be omitted when using a covered receiving vessel. Under the ASTM method, correction yields a closer correspondence to the assigned masses of the artifacts.
Note that the ASTM method yields both positive and negative residuals, while the ISO method yields only negative residuals. Looking at the representation of combined systematic and random errors shown in Figure 20, it is interesting to further note that when a covered vessel is used—reducing evaporation—the bias of the ISO 8655 method actually increases. This occurs because the evaporative correction is omitted per section 7.2.8 of the ISO standard.

Bias, Uncertainty and Transferability in Standard Methods of Pipette Calibration ARTEL
Page 18
Figure 20: Combined biases for ASTM and ISO methods at 0.2mg using a covered vessel.
This most result indicates that the assumption of insignificance made by the ISO method is not warranted. By reducing the evaporation rate but omitting any correction, the bias increases to 17% of the sample size, which is well beyond the specifications for inaccuracy and imprecision of a Gilson P-2 pipette operating at this volume.
Experimental Conclusions The results of the four methods described above point to the need for additional work before the ASTM 1154 and ISO 8655 standards can be considered to be equivalent.
Bias, Uncertainty and Transferability in Standard Methods of Pipette Calibration ARTEL
Page 19
Transferability of Pipette Calibration There is much evidence, both anecdotal and experimental, to suggest that there are concerns to be addressed with regard to the use of air displacement pipettes as transfer standards. It is frequently reported both by ARTEL customers and elsewhere that pipettes calibrated by an accredited laboratory or even the pipette manufacturer, when received and checked by the user in the working environment, exhibit some bias. That is, the recently calibrated pipettes often do not meet the user’s expectations for accuracy and precision when tested in the users own hand in their own laboratory environment.
This section of the paper examines the question of transferability of pipette calibration from the calibration facility to the bench-top. How well do the results obtained at the calibration laboratory predict how the pipette will perform in the user’s hands? Two classes of errors are examined: variability due to environmental changes, and the influence of differing operator technique.
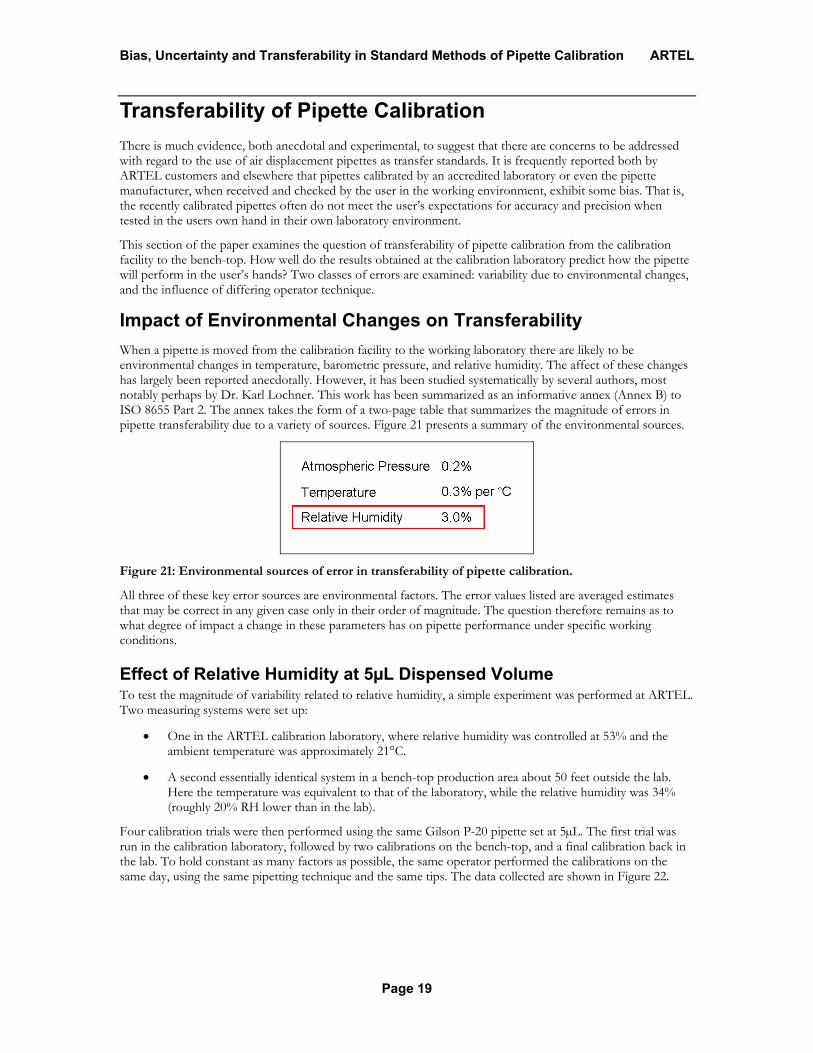
Impact of Environmental Changes on Transferability When a pipette is moved from the calibration facility to the working laboratory there are likely to be environmental changes in temperature, barometric pressure, and relative humidity. The affect of these changes has largely been reported anecdotally. However, it has been studied systematically by several authors, most notably perhaps by Dr. Karl Lochner. This work has been summarized as an informative annex (Annex B) to ISO 8655 Part 2. The annex takes the form of a two-page table that summarizes the magnitude of errors in pipette transferability due to a variety of sources. Figure 21 presents a summary of the environmental sources.
Figure 21: Environmental sources of error in transferability of pipette calibration.
All three of these key error sources are environmental factors. The error values listed are averaged estimates that may be correct in any given case only in their order of magnitude. The question therefore remains as to what degree of impact a change in these parameters has on pipette performance under specific working conditions.
Effect of Relative Humidity at 5µL Dispensed Volume To test the magnitude of variability related to relative humidity, a simple experiment was performed at ARTEL. Two measuring systems were set up:
• One in the ARTEL calibration laboratory, where relative humidity was controlled at 53% and the ambient temperature was approximately 21°C.
• A second essentially identical system in a bench-top production area about 50 feet outside the lab. Here the temperature was equivalent to that of the laboratory, while the relative humidity was 34% (roughly 20% RH lower than in the lab).
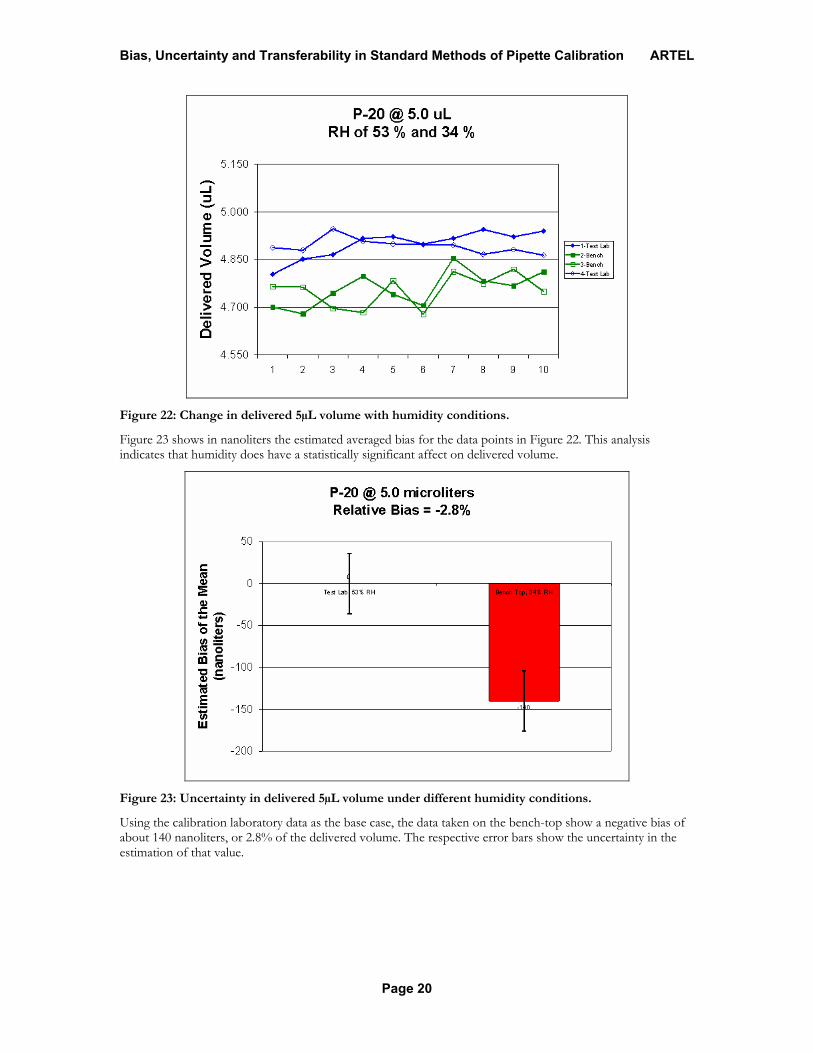
Four calibration trials were then performed using the same Gilson P-20 pipette set at 5µL. The first trial was run in the calibration laboratory, followed by two calibrations on the bench-top, and a final calibration back in the lab. To hold constant as many factors as possible, the same operator performed the calibrations on the same day, using the same pipetting technique and the same tips. The data collected are shown in Figure 22.
Bias, Uncertainty and Transferability in Standard Methods of Pipette Calibration ARTEL
Page 20
Figure 22: Change in delivered 5µL volume with humidity conditions.
Figure 23 shows in nanoliters the estimated averaged bias for the data points in Figure 22. This analysis indicates that humidity does have a statistically significant affect on delivered volume.
Figure 23: Uncertainty in delivered 5µL volume under different humidity conditions.
Using the calibration laboratory data as the base case, the data taken on the bench-top show a negative bias of about 140 nanoliters, or 2.8% of the delivered volume. The respective error bars show the uncertainty in the estimation of that value.

Bias, Uncertainty and Transferability in Standard Methods of Pipette Calibration ARTEL
Page 21
Effect of Relative Humidity at 0.2µL Dispensed Volume To investigate the impact of relative humidity on transferability at smaller volumes, we repeated the experiment just described using a Gilson P-2 pipette set at 0.2µL. Based on physical principles, we would expect that this device would be more sensitive to relative humidity than the prior example. And this is indeed the case, as Figure 24 illustrates.
Figure 24: Uncertainty in delivered 0.2µL volume under different humidity conditions.
Lower humidity conditions produce an absolute change of only 14.2 nanoliters at this small volume setting. However, this indicates a greater relative bias of just over 7%. Again, error bars show the uncertainty in these estimated values.
These two experiments just described provide good confirmation that the relative humidity error noted in Annex B of ISO 8655 predicts within the correct magnitude the variability that a laboratory might expect when a pipette undergoes a 20% change in ambient relative humidity.
Impact of Operator Technique on Transferability In addition to environmental changes, pipetting technique is another factor likely to influence the transferability of pipette calibrations from the calibration facility to the working laboratory. “Technique” in this case refers not to improper operation, but to “legitimate differences” within the range of correct and accepted methods of pipetting. Examples of differences in technique include the depth of immersion of the pipette tip during aspiration; or timing variations in the pipetting cycle. These kinds of differences are often not specified or controlled in a user’s laboratory. The major sources of technique related variability listed in ISO 8655 Annex B are listed in Figure 25.

Bias, Uncertainty and Transferability in Standard Methods of Pipette Calibration ARTEL
Page 22
Figure 25: Principal technique related sources of transferability error.
To investigate the potential impact of technique on transferability, we chose to study the two factors indicated in the figure:
• Changes in the timing of steps in the pipetting cycle
• The impact of pre-wetting the pipette tip prior to aspirating liquid
Note that the total estimated uncertainty for the factors listed in Annex B is roughly 8%, which may be a significant source of concern depending on the use for which a pipette is intended.
To study the impact of uneven timing of the pipetting cycle, a series of 20 liquid deliveries were performed using a Gilson P-20 pipette set to 5µL. Two different timings were used (Techniques A and B). In the ten “even numbered” dispenses, a four-second interval was shifted from the “pre-wetting” phase of the cycle to the “pause” phase relative to the “odd numbered” dispenses. The overall length of the cycle remained unchanged. The data for these dispenses are shown in Figure 26.
Figure 26: Variability in liquid delivery based on uneven timing.
The data show a clear “step” pattern, in which odd-numbered (Technique A) deliveries are consistently lower in volume than even-numbered (Technique B) deliveries. Figure 27 shows a statistical summary of these two subsets of data.

Bias, Uncertainty and Transferability in Standard Methods of Pipette Calibration ARTEL
Page 23
Figure 27: Relative bias due to uneven timing.
The averaged data shows that Technique B results in an actual negative bias of -201 nanoliters, or a relative error of roughly 4% of the delivered volume.
As in the previous experiments, this data suggests that working laboratories will encounter variability in the transferability of pipette calibration due to technique that is similar to the estimates presented in Annex B of ISO 8655.

Bias, Uncertainty and Transferability in Standard Methods of Pipette Calibration ARTEL
Page 24
Conclusions Our data show that, at the smallest volumes, compensation for evaporative loss is typically the largest contributor to both bias and uncertainty in gravimetric methods of pipette calibration. This refers not only to the imperfect estimation of the ‘e’ term in the gravimetric conversion equation, but also the variability in ‘e’ from delivery to delivery. As attempts are made to measure smaller and smaller volumes, both random and systematic evaporative errors become an increasingly significant problem.
Our data also show that, at small volumes, there is statistically significant bias between the pipette calibration results realized in our laboratory when implementing the two different standard methods (ASTM E 1154 and ISO 8655 Part 6). Thus, conformance to the letter of these standards in itself does not guarantee equivalence in calibration results. This points to the need for some validation of a user’s implementation of these standard methods, particularly at the lower ranges of applicability (e.g., when measuring volumes below 50µL). Such validation could involve the use of control artifacts as described in this paper, and/or demonstrated equivalence with alternative methods based on dissimilar physical principles.
It is also worth noting that the test method introduced here, the use of a stable control artifact within the wet measurement process, helps to identify both systematic and random errors in the gravimetric pipette calibration methods. While the author has not noted the use of a stable artifact for this purpose in other published work, this seems to be a useful innovation that others may wish to adopt. Its value lies in offering a way to assess with increased confidence the magnitude of the gravimetric error when weighing unstable samples such as water.
Relative to transfer standards for pipettes, our data further establish that pipettes have significant limitations in this regard. This is due to their susceptibility to environmental affects (temperature, relative humidity, and barometric pressure) as well as their susceptibility to variability in operator technique.
Finally, our data indicate that controlling for evaporation by elevating relative humidity does improve the repeatability of a gravimetric measurement, but at the same time is likely to reduce the transferability of the resulting calibration. In other words, increased relative humidity under controlled conditions improves the stability of the sample being weighed for calibration purposes, but increases uncertainty when the pipette is transferred to the lower and uncontrolled relative humidity of the bench-top. These various effects point to the need for continued research and discussion in how best to prevent pipetting errors due to environmental factors.
About ARTEL ARTEL is a leader in the manufacture of highly sensitive and precise photometric-based analytical systems. ARTEL instruments and systems are used worldwide in life science fields such as biotechnology research, pharmaceutical product development, clinical diagnostics, forensics, process quality control and field testing.
For information on ARTEL technology, products and services call 1-888-406-3463, or visit www.artel-usa.com.

Bias, Uncertainty and Transferability in Standard Methods of Pipette Calibration ARTEL
Page 25
Appendix A: References 1. Guide to the Expression of Uncertainty in Measurement, 1995, International Organization for Standardization
(Geneva, Switzerland).
2. ISO 8655-2:2002, Piston-operated Volumetric Apparatus, Part 2: Piston Pipettes, 2002, International Organization for Standardization (Geneva, Switzerland).
3. ISO 8655-6:2002, Piston-operated Volumetric Apparatus, Part 6: Gravimetric Methods for the Determination of Measurement Error, 2002, International Organization for Standardization (Geneva, Switzerland).
4. Lochner, K.H., Ballweg, T., and Fahrenkrog, H-H., “Factors influencing the measuring accuracy of piston pipettes with air interface,” J. Lab. Med., vol. 20: pp. 430-440, 1996.
5. Standard Specification for Piston or Plunger Operated Volumetric Apparatus, Specification E 1154-89 (Re-approved 1997) , American Society for Testing Materials (ASTM), p. 5, ¶ 11.2.2 and 11.2.3.


