26
Big Data Dr. Michael Stachiw January 10, 2015 What it is, what it means, and where do we go from here..
| Date post: | 24-Dec-2015 |
| Category: |
Documents |
| Upload: | shannon-lambert |
| View: | 213 times |
| Download: | 0 times |

Big Data
Dr. Michael StachiwJanuary 10, 2015
What it is, what it means, and where do we go from here..

Big Data
• Big data is an all-encompassing term for any collection of data sets so large and complex that it becomes difficult to process them using traditional data processing applications *
• * http://en.wikipedia.org/wiki/Big_data

Big Data• Big data is difficult to work with using most relational
database management systems and desktop statistics and visualization packages. What is considered "big data" varies depending on the capabilities of the organization managing the set, and on the capabilities of the applications that are traditionally used to process and analyze the data set in its domain.*
• Big Data is a moving target; what is considered to be "Big" today will not be so years ahead. "*
• *http://en.wikipedia.org/wiki/Big_data

Big Data
• Examples of Big Data– Crop Yield (GPS driven) data– Soil properties (GPS driven) data– Marketing/Sales information• Frequent buyer programs
– Real time performance data. For example• Aircraft• Race cars• NASA rockets

Big Data
• Examples of Big Data (cont.)– Financial (stocks/bonds) trading information– Web real-time marketing (Amazon
recommendation engine for example). – Live Purchase/selection suggestions: Netflix’s
recommendation engine.

Big Data• How does the data get so big?– Tools now available to collect data in real time
– More quantifiable measurements available
– More opportunities to collect data
– Just the fact that there are more people on the planet, interconnected, & global economy create more data opportunities
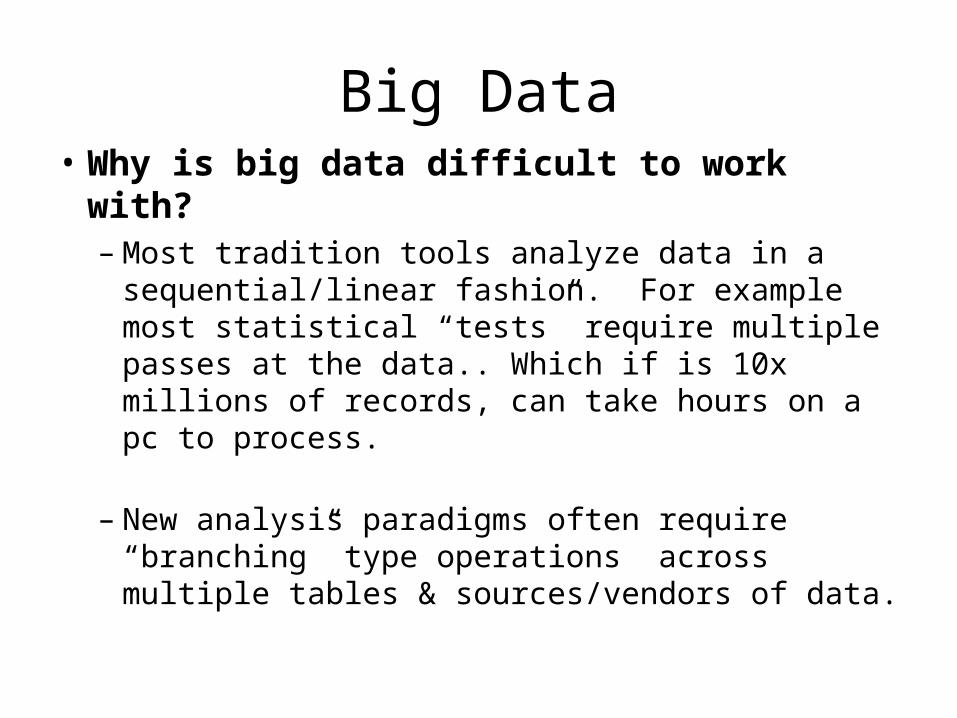
Big Data• Why is big data difficult to work with?– Most tradition tools analyze data in a
sequential/linear fashion. For example most statistical “tests” require multiple passes at the data.. Which if is 10x millions of records, can take hours on a pc to process.
– New analysis paradigms often require “branching” type operations across multiple tables & sources/vendors of data.

Big Data
• Issues other than size to consider:– Data Structure – Privacy– Intellectual Property– Who owns what

Big Data
• Data Structure– The amount of data structure required is
proportional to the size of the data.
– More structure can reduce data size, but can increase processing requirements
– Structure can add value/information to data

Big Data
• Structure.– Multiple-Tables vs one big table
• Unstructured data layout:
Table/Database

Big Data
• Typical structured data layout:
Master Table
Child Table
Child Table
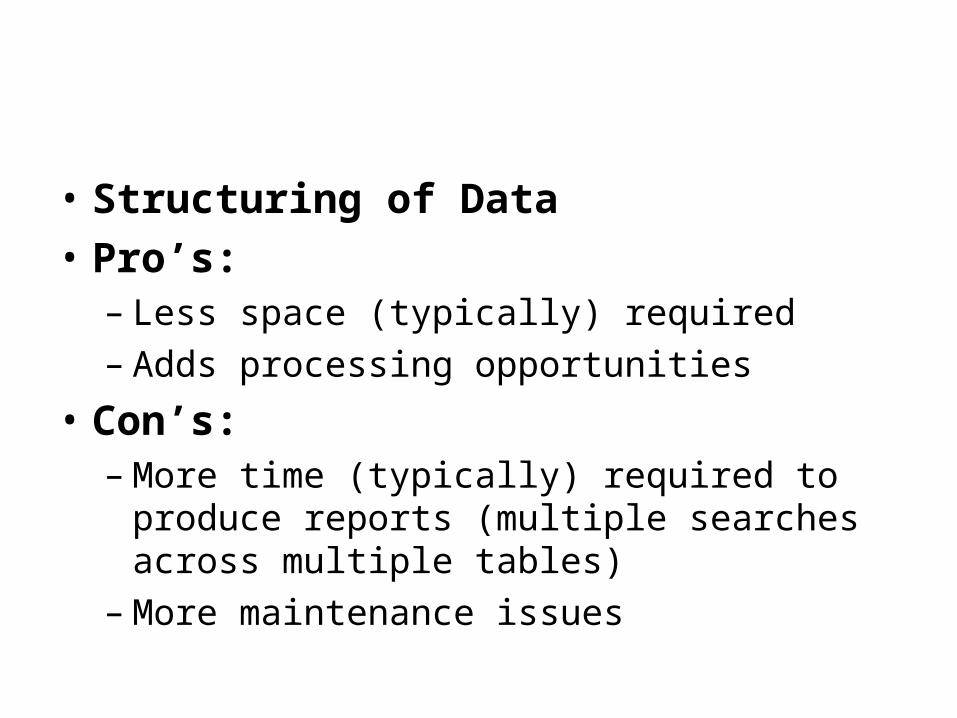
• Structuring of Data• Pro’s:– Less space (typically) required– Adds processing opportunities
• Con’s:– More time (typically) required to produce reports
(multiple searches across multiple tables)– More maintenance issues
Big Data
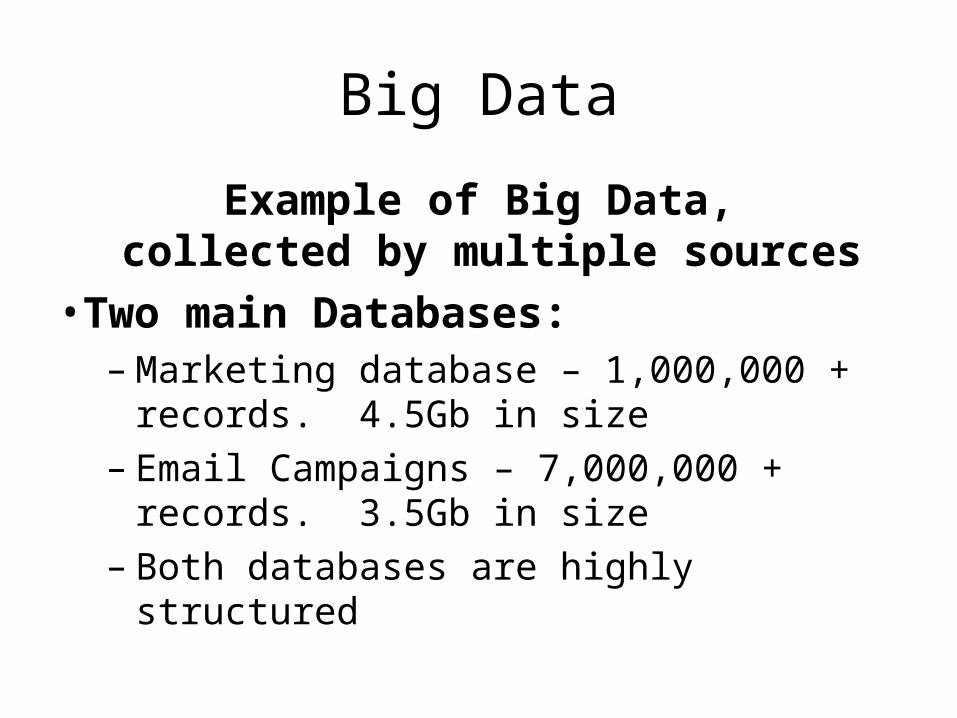
Example of Big Data, collected by multiple sources
•Two main Databases:– Marketing database – 1,000,000 + records. 4.5Gb
in size – Email Campaigns – 7,000,000 + records. 3.5Gb in
size– Both databases are highly structured

Big Data
Snippet of tables list in main marketing database, contains in total 56 tables.

Big Data
Fields within name/address table

Big Data
Partial listing of fields in horse marketing table

Big DataList of tables in email marketing campaigns database

Big Data
NameAddress
Table
Child Table Child
Table
Child Table
Child Table
Marketing Database
Child Table
56 child tables
BroadcastEmails
Child Table
Child Table
Child Table
Child Table
11 child tables
Email Campaign Database
Linked by ID
To use this data, over 8 million records have to be processed

Big Data
• Our Customer (both corporate & independent dealers) have us: Using Geospatial & prospect/customer demographic restrictions– Send out over 100 email blasts/month with over 2
million emails in those blasts– Prepare 50-100 mailing label sets/month– Prepare 30-40 maps/reports each month to
support marketing & sales campaigns

Big Data
• Multiple Issues exemplified by this example– Who owns the data
– Stepping on neighbors toes
– Processing requirements

Big DataMap of independent dealers who assist in collecting and using the databases

Big Data
• US is Approximately – 2,600 miles wide– 1,500 miles tall– Representing 3,900,000 sq miles– Approximately 5,000 independent dealers
associated with my customer– That means on average, each dealer covers 780 sq
miles

Big Data
– As big as that square mile coverage sounds, its only 27.9 x 27.9 miles in size.
– Very easy to have more than one dealer in the same space
• Issues:– Dealer vs Corporate data ownership– Dealer vs Dealer data usage– Vendor vs corporate intellectual property

Big DataExample of proximity of independent dealers to each other

Big DataBuffers (1 mile) around each independent dealer

Big Data
• To contact me:
Dr. Michael StachiwStrategic Mapping & Data Services LLC10715 Kahlmeyer Dr.St Louis, MO 63132314-428-3156


