CAIT-UTC-030 Big Data: Opportunities and Challenges in Asset Management Final Report June 2016 Jie Gong 1 Assistant Professor Kevin Heaslip 2 Associate Professor Farbod Farzan 1 Graduate Research Assistant Susan Brink 3 Graduate Research Assistant Sue McNeil 3 Professor 1 CAIT Rutgers University 2 Department of Civil and Environmental Engineering Utah State University 3 Department of Civil and Environmental Engineering University of Delaware Newark DE 19713 External Project Manager William Kingsland New Jersey Department of Transportation In cooperation with Rutgers, The State University of New Jersey And U.S. Department of Transportation Federal Highway Administration
Transcript
CAIT-UTC-030
Big Data: Opportunities and Challenges in AssetManagement
Final ReportJune 2016
Jie Gong1
Assistant ProfessorKevin Heaslip2
Associate Professor
Farbod Farzan1
Graduate Research AssistantSusan Brink3
Graduate Research Assistant
Sue McNeil3
Professor
1CAITRutgers University
2Department of Civil and EnvironmentalEngineering
Utah State University
3Department of Civil and EnvironmentalEngineering
University of DelawareNewark DE 19713
External Project ManagerWilliam Kingsland
New Jersey Department of Transportation
In cooperation withRutgers, The State University of New Jersey
AndU.S. Department of Transportation
Federal Highway Administration
Disclaimer StatementThe contents of this report relfect the views of the authors, who are responsible for the facts and the
accuracy of the information presented herein. This document is disseminated under the sponsorship of theDepartment of Transportation, University Transportation Centers Program, in the interest of information
exchange. The U.S. Government assumes no liability for the contents or use thereof.
Jie Gong, Kevin Heaslip, Sue McNeil, FarbodFarzan, Susan Brink
CAIT-UTC-030
9. Performing Organization, Name and Address 10. Work Unit No.
Rutgers University, 100 Brett Road, Piscataway NJ 08854Utah State University, Old Main Hill, Logan, UT 84322Dept of Civil and Environmental Engineering, Uni-versity of Delaware, Newark, DE 19716
11. Contract or Grant No.
DTRT12-G-UTC1612. Sponsoring Agency Name and Address 13. Type of Report and Period Covered
Center for Advanced Infrastructure and Transportation Final ReportRutgers, The State University of New Jersey 4/01/13 - 6/30/2016100 Brett Road 14. Sponsoring Agency Code
Piscataway, NJ 0885415. Supplementary Notes
U.S Department of Transportation/Research and Innovative Technology Administration1200 New Jersey Avenue, SEWashington, DC 20590-000116. Abstract
State Departments of Transportation and other transportation agencies collect vast quantities of data but man-aging, accessing and sharing data has been problematic and well documented. This project reviewed the similarchallenges faced by other industries and investigated what approaches have been taken by these industries toaddress those challenges. In the project, we also explored what kinds of data sets in the transportation industryare posing big data challenges, and reviewed relevant studies on emerging applications of these data sets. It isreasonable to conclude that the rise of big data demands more efficient and effective and scalable data analysismethods that must transcend traditional analysis methods in the field of statistics, data mining and machinelearning. Therefore, a detailed literature survey was also conducted on what kind of tools and data analytics havebeen proposed and used for big data analytics. Many use cases are highlighted in the report to demonstrate theopportunities with big data. At the end of the project, a half-day workshop was conducted to disseminate thefindings of this research and solicity inputs from leading industry and academic researcher in the field of engi-neering informatics, cloud computing, and big data analytics. Many presentations in the workshop have echoedthe findings of this project.
17. Key Words 18 Distributional Statement
Big data, transportation asset management, data analyt-ics19. Security Classification 20. Security Classification (of this page) 21. No. of Pages 22. Price
Unclassified Unclassified 92
Form DOT F 1700.7 (8-09)
4
Acknowledgments This project would not have been possible without the support from the Rutgers Center
for Advanced Infrastructure and Transportation. We would like to thank Dr. Ali Maher,
Director of CAIT center and Dr. Patrick Szary, Associate Director of CAIT center for
their support. Finally, we appreciate the support from many CAIT staff members.
5
Table of Contents Acknowledgments ...................................................................................................................................... 4
List of Figures ............................................................................................................................................. 7
List of Tables ............................................................................................................................................... 8
APPENDIX A – Introduction to Big Data – A first lesson to Civil Engineers ................................... 56
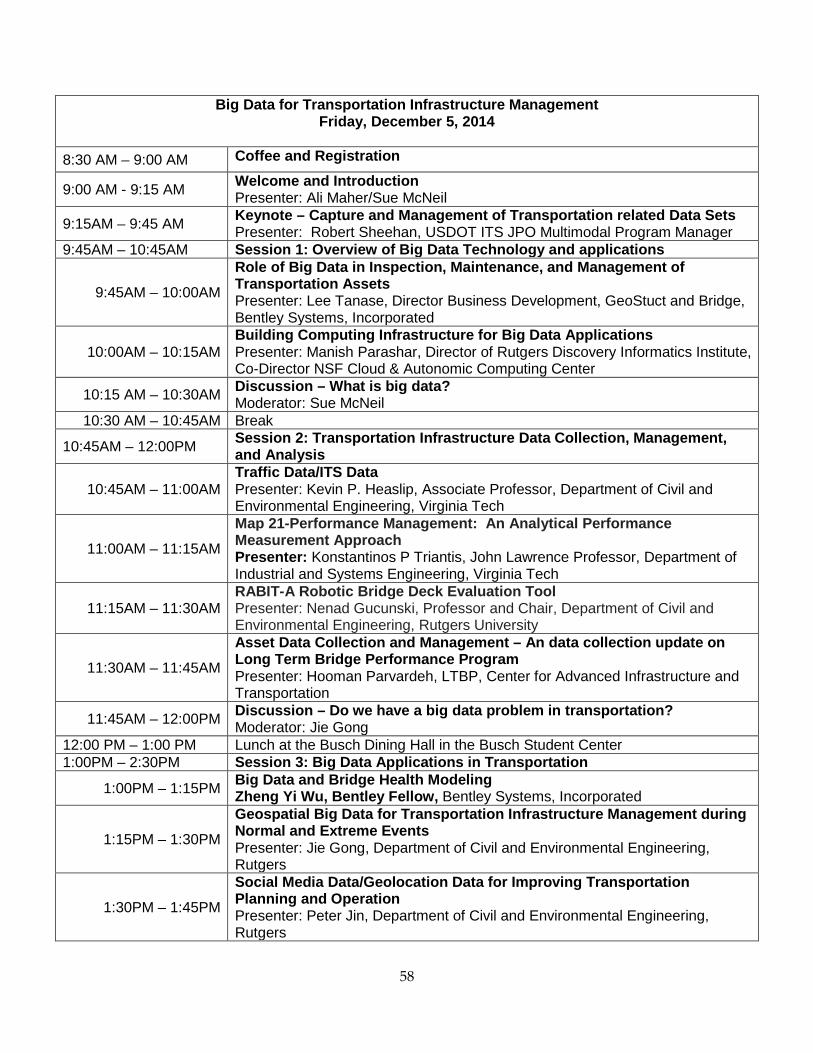
APPENDIX B – Big Data Workshop Agenda ....................................................................................... 57
6
7
List of Figures Figure 1 A Representation of CThe Scale of Big Data ....................................................................... 15 Figure 2 The Impact of Pathways on Reduction in Healthcase Costs (Source: Groves et al, 2013) .......................................................................................................................................................... 19 Figure 3 Remote Sensing Technologies for Transportation Infrastructure Data Collection ......... 35 Figure 4 Highway Mobile LiDAR Data .................................................................................................. 36 Figure 5 Pavement Condition Assessment .......................................................................................... 36
8
List of Tables Table 1 Big Data Characteristics ........................................................................................................... 17 Table 2 Applications of Big Data ............................................................................................................ 17 Table 3 Example Big Data Techniques ................................................................................................ 26 Table 4 Data Types in the HSIS Data Set ............................................................................................ 33 Table 5 Data Types in the NDS data set .............................................................................................. 34 Table 6 NIST Big Data Case Study Template ..................................................................................... 43 Table 7 Detailed explanations of fields ................................................................................................. 43 Table 8 Types of Databases for Storing Big Data ............................................................................... 46 Table 9 A Catalog of Big Data Analytic Tools ...................................................................................... 47
9
INTRODUCTION
Description of the Problem Asset management is largely a data driven process as one of the key elements of asset
management is using data to support decisions. However, the databases representing
inventory and historical records of road, bridge, and roadside assets collected using
video logging, automated pavement distress survey, regular inspections, structural
health monitoring, and other methods can rapidly explode. Such data is key to
maintaining physical assets in a state of good repair and addressing safety issues.
Simple tasks such as capture, curation, storage, search, sharing, and analysis are
challenging as our ability to collect data expands. Ideally “better” data will be
understandable, transparent, interoperable, automated, and visual. Some of the
experiences with "big data" in other fields may help to manage, more pro-actively, our
data assets to support the management of our physical assets. “Big Data” refers to
data sets that are so large and complex they are not easily manipulated using the
commonly available database tools. These challenges are characterized by the three
“V’s” – velocity, volume and variety. This project identifies areas where big data may be
an issue for asset management in DOTs and develops strategies for dealing with big
data.
Relevance to Strategic Goals Each of the USDOT Strategic Goals is supported by data and "big data" plays a role.
Data from diverse and diffuse sources can be used to support and inform decisions and
develop models. This project focuses on data to support decisions related to state of
good repair. In turn, these decisions are strongly influenced by the impact on safety and
economic competitiveness. Many of the tools and techniques to be explored are
broadly applicable to all the strategic goals.
Background "Big Data" promises to provide insights into behavior, performance and interactions. At
the same time, the nature of the data sets poses challenges as not all data have the
same quality. Boyd and Crawford (2011) identify six issues: 1) Automating the analysis
10
changes the definition of knowledge; 2) Objectivity and accuracy; 3) Better data; 4) Data
quality and consistency; 5) Ethics; and 6) Limited access. While some of these issues
are more relevant to the social sciences, all have some relevance to the data needed to
support asset management and the opportunities arising from access to users'
preferences and behavior, and sharing of data across jurisdictions.
State Departments of Transportation have frequently been characterized as “data rich
but information poor.” The departments collect vast quantities of data but managing,
accessing and sharing data has been problematic and well documented. National
Cooperative Highway Research Program Report 706 (Cambridge Systematics Inc,
2011) recognized nine categories of data processes that offer potential for addressing
these issues:
• Collection,
• Archiving/storage,
• Processing,
• Analysis,
• Reporting/dissemination,
• Sharing,
• Access,
• Institutional issues, and
• New technology.
“Big Data” offers solutions in many of these areas, particularly data processing and
analysis in terms of data quality and metadata. However, the challenges associated with
governments using big data are all too familiar – the need to break down silos, the
control tower approach to security and privacy and the enormous variety of data. (Kim
et al, 2014).
11
Research Goals and Objectives The goal of this project is to identify the types of "big data" that can be used for asset
management, and the appropriate tools for the analysis of this data, as well as other
alternatives such as data mining and meta data.
Specific objectives are:
(1) Defining what constitutes "big data" for asset management
(2) Understanding when to use tools such as Hadoop and Mapreduce and their
strengths and limitations (Lin, 2013)
(3) Identifying opportunities for data integration, data mining, visualization, meta data
and other techniques for data aggregation and summarization (techniques such
as PDA (DeCoster, 2004)
(4) Identifying ways to share data.
The products of this research will be a catalog of tools and techniques including where
they should be applied and their limitations for analyzing data to support asset
management.
Overview of the Report This report documents the research approach, methodology, findings, conclusions and
recommendations of this collaborative research project. The following sections outline
the approach and methodology. The next section presents the findings, followed by
sections documenting the conclusions and making recommendations for future work
and application in state Departments of Transportation.
APPROACH This collaborative research project was conducted by researchers at Rutgers University,
Utah State University1, and University of Delaware. The project builds on the research
1 Professor Kevin Heaslip, formerly at Utah State University is now at Virginia Tech.
12
team’s experience and expertise in computing methods and asset inventory data
collection. Three key areas were addressed:
• Data collection, data query and information retrieval, and data visualization.
• The role of data from traffic operations and ITS.
• Techniques for metadata analysis, data aggregation and summarization.
Key elements of the project are the documentation of examples of "big data" in asset
management. The documentation not only includes the type of data (graphics, text,
numerical data), but also include information on data quantity and quality, access, rate
of change (frequency of data collection), access and longevity. Examples of data
include condition data, traffic data, related data such as census, weather and
environmental data and descriptive data. Data of special interest includes research data
and its management. To facilitate the exploration of "big data" we pose questions that
require the use of "big data" techniques to obtain answers. This was accomplished in
consultation with our partners in state DOTs.
The project also explored techniques for analyzing big data based on literature reviews
of applications in other fields such as marketing, biology, and sociology. This served as
the foundation for a catalog of "big data" tools and techniques. As a complement to the
catalog, we also identified environments to support data sharing include applications
such as Mathematica's Alpha and cloud based options.
Finally we will evaluate the tools and techniques in terms of their strengths and
weaknesses for answering "big data" questions related to asset management. Our
team developed criteria that are broadly applicable and helped us to benchmark the
techniques.
METHODOLOGY The project relied largely on literature review, discussion and expert input. The original
proposal involved eight tasks that are summarized here for completeness.
13
Task 1: Identify "big data" relevant to asset management.
This task required exploration of a wide variety of data sets and the relationships
between different types of data that may be used for operations and real-time
management but are rich sources of information on user preferences and behavior
related to usage of physical infrastructure. Other data sets include environmental and
census data and research data particularly in areas like structural health monitoring.
This task will make use of various databases, our research partners, and the literature
in the field.
Task 2: Develop questions related to "big data" and asset management.
These questions are used to guide our search for and evaluation of tools and
techniques. They help us to understand how we can use "big data" to support asset
management. For example, much of the discussion about identifying adaptation
techniques for transportation infrastructure to respond to climate change suggest using
asset management as the decision making strategy. However these decisions require
understanding land use, environmental data, climate models, and infrastructure
deterioration in the context of topography, hydrology and other natural features. We
conferred with our research partners to help with this task.
Task 3: Identify environments to support data sharing.
Much of the relevant data is not widely accessible. Security concerns are often largely
unfounded. Nevertheless security is an issue but the assembling data from multiple
jurisdictions offers opportunities for new insights and adequate data to support model
development. Over the past five years, new technologies including social networking
and ubiquitous and cloud-based computing provide new environments to support the
gathering and sharing of data that has not been fully recognized in asset management.
Task 4: Identify tools and techniques to support "big data" for asset management.
Drawing on the literature, and popular press accounts of big data applications in other
fields we identify tools and techniques, in particular those related to big data analytic.
14
Task 5: Catalog and evaluate the tools and techniques.
We develop a catalog of tools and techniques including an assessment of their
strengths and weakness in the context of the questions identified in Task 2.
Task 6. Develop and conduct a Workshop for practitioners.
Task 7: Develop a graduate course module on "Big Data" and Asset Management
Task 8: Develop the final report.
FINDINGS Our findings are organized around the key questions and concepts:
• What is big data?
• Characteristics of big data
• Tools for working with big data
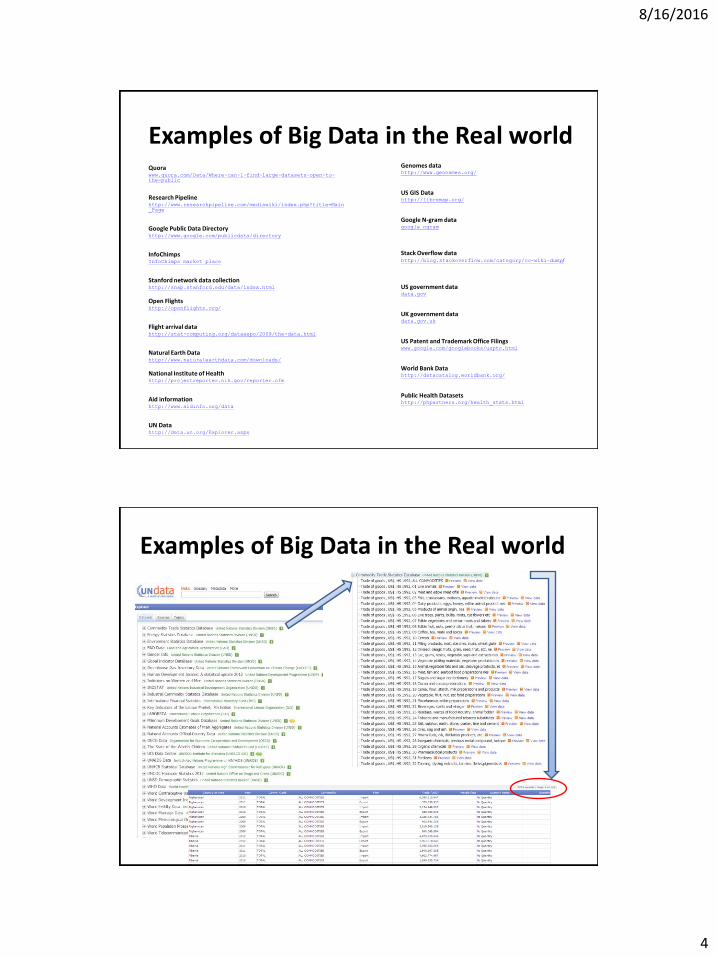
• Examples of big data
• Examples of big data and big data questions in transportation
• Big data and asset management
• Tools for big data and asset management
What is Big Data? Big data is characterized as a collection of data that is very large in size as determined
by the number of bytes of data. “Big” is considered to be of the order of petabytes,
where:
1Pb = 1,000,000,000,000,000 b = 10^15 bytes
Big data is also loosely structured in terms of the format. Error! Reference source not found. is a representation of the size and scale of big data. More formally, big data is a
collection of data sets so large and complex that it becomes difficult to process using
on-hand database management tools or traditional data processing applications. The
challenges include capture, curation, storage, search, sharing, transfer, analysis, and
visualization.
15
What is considered "big data" varies depending on the capabilities of the organization
managing the set, and on the capabilities of the applications that are traditionally used
to process and analyze the data set in its domain. "For some organizations, facing
hundreds of gigabytes of data for the first time may trigger a need to reconsider data
management options. For others, it may take tens or hundreds of terabytes before data
size becomes a significant consideration.
Figure 1 A Representation of CThe Scale of Big Data Elements of "Big Data" include:
• The degree of complexity within the data set
• The amount of value that can be derived from innovative vs. non-innovative
analysis techniques
• The use of longitudinal information supplementing the analysis
While size provides the primary definition of big data, a more refined definition also
recognizes the number of independent data sources, each with the potential to interact.
Big data does not lend itself well to being tamed by standard data management
techniques simply because of its inconsistent and unpredictable combinations.
Although size is the primary distinguish characteristic, data variety and data structure
must also be considered. Small data sets from a variety of sensors can be very big due
16
to their data structure complexity. A well-known example is that a plane on a regular
one hour flight can have a hundred thousand individual sensors monitoring the
operating condition of the airplane. An hour of data collection in this situation would
yield less than 3GB of data, a data volume that is not big at all. However, with so many
sensors, the combinations are incredibly complex and vary with the error tolerance and
characteristics of individual devices. Therefore, the data streaming from a hundred
thousand sensors on an aircraft is big data. In contrast, there are an increasing number
of systems that generate very large quantities of very simple data. Although these data
sets are very large, such as media streaming data sets, they are not big in the same
way as the data coming from arrays of different sensors deployed in advance machinery
systems.
Characteristics of big data There are many recent efforts to characterize big data. A recent research report
(Douglas, 2001) defined data growth challenges and opportunities as being three-
dimensional, i.e. increasing volume (amount of data), velocity (speed of data in and
out), and variety (range of data types and sources). Since then, Gartner (Beyer, 2011),
and now much of the industry, continue to use this "3Vs" model for characterizing big
data. In 2012, Gartner refined its definition as “Big data are high volume, high velocity,
and/or high variety information assets that require new forms of processing to enable
enhanced decision making, insight discovery and process optimization (Douglas,
2012)." Some organizations also added a new V “veracity” as a dimension to
characterize big data. This is due to the fact that the trustworthy of big data becomes a
growing concern as the variety and number of sources grows.
Thinking context-based may add more Vs to definition. For instance, in the context of
travel and transportation “Value” is another V. The notion of value is twofold. It is the
value from improving internal operational capabilities, but it is also about improving the
customer/consumer experience and generating incremental revenue. Berman (2013)
lists some additional characteristics of big data:
• Big data is often housed in multiple locations because of the size and
computational demands of big data.
17
• Big data often has very flexible goals and isn’t designed to answer a specific
question,
• Big data needs to be stored in perpetuity, and
• Big data needs to be queried even to understand what it inside the database.
In summary, the existing literature characterizes big data based on 3Vs, flexible goals,
location, structure, longevity, reproducibility, introspection, condition, and population.
Table 1 provides a quick summary of these attributes.
Table 1 Big Data Characteristics
Attributes Characteristics 3 V’s Volume: a lot of data
Variety: different formats Velocity: content is constantly changing through addition of new data
Flexible goals data isn’t designed to answer a specific question Location Stored in multiple locations Structure Includes many types of data including unstructured Longevity Data often stored in perpetuity Reproducibility Changes in data make analysis unrepeatable Introspection Need to query data for even an understanding of what the data
contains Condition Big data is “dirty” because of multiple sources and after merging can
be fuzzy Population Merge of multiple non-random samples of unknown populations
Examples of Big Data As our world becomes more connected and large numbers of distributed sensors collect
data in every shrinking time steps, big data is ubiquitous and continues to grow and
expand. Companies have been using big data to help us make selections, provide us
with current and relevant information, and make our environments more comfortable
and functional. Table 2 lists some of these typical applications.
Table 2 Applications of Big Data
Area Actions Organizations Consumer behavior and preferences
Movie selection Netflix Social network connections
Facebook
Purchases Amazon Finance Credit card fraud
18
Stock trends Infrastructure Dynamic analysis of
electric power consumption (smart meters
The following sections provide more specific examples of applications in some
pioneering industries such as healthcare, the automotive industry, supply chains and
logistics, retail and entertainment.
Healthcare
According to McKinsey (Groves et al, 2013), companies who miss big data opportunities
of today will miss the next frontier of innovation, competition, and productivity. This
opportunity is emerging with the conversion to Electronic Medical Records (EMR).
Among other things, EMR allow data to be exchanged more easily. To prevent privacy
concerns, the new programs remove names and other personal information from
records being transported into large databases, complying with all health insurance
portability and accountability act (HIPAA) patient-confidentiality standards. Companies
that have already commercialized big data privilege include, but are not limited to:
• Premier, a group purchasing organization and information aggregator. Premier
provides data driven informatics derived from integrated data sets.
• OptumInsight for United Health, Active Health for Aetna, and Healthcore for
Wellpoint. These companies provide services related to data driven issues like
cost and performance benchmarking, as well as opportunities for data integration
using different data sets.
• Italian Medicines Agency. They collect and analyze clinical data on expensive
new drugs as part of national cost-effectiveness program. Based on the results,
it may re-evaluate prices and market access conditions
Examples of the impacts of big data on the healthcare system include:
• The use of pathways - right living, right care, right provider (always treat by high
performing professionals), right value (cost effectiveness of care), right
innovation (identification of new therapies) – to customize healthcare. These
19
value pathways are always evolving as new information becomes available to
inform what is right and most effective, fostering an ecosystem feedback loop.
Error! Reference source not found. shows an assessment of the impact on
healthcare costs.
• Kaiser Permanente has fully implemented its health connect system to ensure
information exchange across all medical facilities and incorporate electronic
health records into clinical practice. The integrated system reduced total office
visits by 26.2% and scheduled telephone visits increased more than eightfold
(Chen et al, 2009).
Figure 2 The Impact of Pathways on Reduction in Healthcase Costs (Source: Groves et al, 2013)
o Example: prevention actions in right living pathways, aspirin use by those
at risk for coronary heart disease, early cholesterol screening for patients
with associated family histories, hypertension screening for adults could
reduce the total healthcare costs by $38 billion.
o Long-term benefits of big data is clear, what about short to medium-term
impacts?
20
o Some companies currently benefit from the inefficiencies that a lack of
liquid data provides, and they could lose business as more information
becomes public.
• Asthmapholis has created a GPS-enabled tracker that monitors inhaler usage by
asthmatics. Information ported to central database, identify population trends,
and developing personalized treatment plans and spot prevention opportunities.
• Ginger.io. Smartphone application for diabetes patients.
o Making core definitions by evidence and value – make it less subjective
o Changing mindset to share instead of protect
o Investment on: Data analysis, data management, and system
management
The Automotive Industry
Increasing digitization and connectivity of modern vehicles provides access to
unprecedented amounts of data. A white paper by T-Systems International GmbH
provides some insights into the variety of applications of big data (T-Systems
International GmbH, 2013).
The industry is facing an array of challenges that cannot be tackled with design,
development, and production excellence alone. Manufacturer-customer communication
can help to tackle these issues. One example of these issues could be “Recalls”.
Recalls are one of the most hotly debated topics on the world’s top automobile forums is
product recalls – a carmaker’s worst nightmare. In addition to the enormous cost of
ordering thousands of vehicles back to dealerships, a recall nearly always damages a
company’s carefully choreographed and cultivated image. According to industry figures,
Japanese automaker Toyota recalled about 10 million vehicles between 2009 and 2010
– for relatively trivial errors such as loose floor mats and sticky gas pedals. Though the
majority of the recalls took place in North America, more than 200,000 vehicles were
affected in Germany. This incident is a clear example of missed opportunities. Long
before the recall, reports from drivers had flooded diverse web forums and social media
platforms, not to mention direct customer contact, as evidenced by actual complaints at
21
dealerships. However, they were apparently unable to read the all-too-clear warning
signs, much less react. Before the floor mat debacle, Toyota did not have an active
social media strategy. On the other hand, applications of social media at various car
dealerships are soaring.
In another example, Ford has a massive, distributed and varied data environment to
begin with—and is creating new data wells with a slew of new connected machines,
including the end product, vehicles. For example, Ford’s modern hybrid Fusion model
generates up to 25 gigabytes per hour—all data that is a potential goldmine for Ford, as
long as it can find the right pickaxes for the job.
Another rising application of big data in the field of automotive industry is car sharing.
For example, Uber is a smartphone-app based taxi booking service which connects
users who need to get somewhere with drivers willing to give them a ride. Uber’s entire
business model is based on the very Big Data principle of crowd sourcing: anyone with
a car who is willing to help someone get to where they want to go can offer to help get
them there. Because Uber holds a vast database of drivers in all of the cities it covers,
they can instantly match customers who ask for a ride with the most suitable drivers.
Other applications of big data within the industry are: 1) User-based insurance services
such as “Pay As You Drive (PAYD); 2) Location-based services (local weather
information, traffic warnings, parking space locators, and 3) autonomous driving.
Supply Chain, Logistics, and Industrial Engineering
Railroad and trucking industries have begun leveraging big data in operations. For
example, the Union Pacific Railroad, the nation's largest railroad company, mounts
infrared thermometers, microphones and ultrasound scanners alongside its tracks.
These sensors scan every train as it passes and send readings to the railroad’s data
centers, where pattern-matching software identifies equipment at risk of failure. Data is
sent via fiber-optic cables that run alongside UP's tracks back to its Omaha-area data
centers. There, complex pattern-matching algorithms flag the outliers, letting experts
decide within five minutes of taking a reading whether a driver should pull a train off the
track for inspection, or perhaps just slow it from 70 to 35 mph until it can be repaired at
22
the next station. Using all of these technologies, UP has cut bearing-related derailments
by 75%. Union Pacific is a choice place to assess the gap between the dream and the
reality of what's commonly called the "Internet of things." Like a lot of technology
movements, the Internet of things is easy to describe but hard to execute. It means
putting sensors on all manner of machines to collect data, linking them over wired and
wireless networks, and then applying data analytics to assess when a train's wheel
needs replacing, a power plant needs fixing, a soybean field needs watering, or a
patient needs reviving. In the trucking industry, companies are using telematics and big
data to streamline trucking fleets and how they can improve fuel usage and routes. It is
estimated that these types of new capabilities can contribute $15 trillion to the global
GDP by 2030 by using systematic, data-driven analysis to trim costs (Ullekh 2012).
Retail
The large amounts of data collected by retailers and financial institutions made it
possible to extract consumer behaviors with business intelligence and analytics. Some
of these applications also drive the need of real-time data processing. For example,
Walmart is using big data from 10 different websites to feed shopper and transaction
data into an analytical system. More specifically, Walmart uses The Inkiru Predictive
Intelligence™ platform, which provides an enhanced view of customers and makes
predictions about their current and future transaction behavior. The Inkiru Predictive
Intelligence Platform includes:
o Predictive algorithms, customized to address your specific business challenges.
The predictive analysis can be implemented to address many challenges on
areas such as revenue enhancement, customer satisfaction, inventory, and loss
management.
o Mapping of information and its interrelationships to better understand each
customer interaction.
o Scoring of customers and their information throughout each transaction, enabling
progressive analysis of each transaction.
o Just-in-time recommendations provided by the system and customized through
the Decision Logic engine. These recommendations help drive behavior within
23
your organization on how to work with each customer while they interact on your
site.
o Decision Logic engine to enable customization of the actions taken as a result of
the platform’s recommendations.
o Online and Offline Champion/Challenger testing to allow businesses to test new
predictive algorithms against actual transaction information with a graduation
cycle to implement the algorithms in a production environment.
o Machine learning techniques that automatically renew algorithms, keeping the
analysis up-to-date and minimizing maintenance and refreshes.
o Integration with data from a variety of external sources to augment your
transactional information, providing a much greater degree of insight about each
customer interaction as it happens.
o Customer Portal providing innovative dashboards that expose the decision logic,
the analysis, and the results of the predictive algorithms, enabling analysts and
business owners to see their results in real time.
The other examples include:
o Sears and Kmart are also trying to improve the personalization of marketing
campaigns, coupons, and offers with big data to compete better with Wal-Mart,
Target, and Amazon.
o Amazon is using Hadoop to support its associates program, in which affiliates
post links to Amazon-based products on their websites and get a percentage of
related revenue. Second, Amazon uses Hadoop to classify high-risk, high-value
items that must be stored in highly secured areas of its fulfillment center.
o Airbnb is an online marketplace that allows anybody to advertise and rent out
spare room to travellers. If you’re living in San Francisco, for example, and have
a free couch, you could make a few bucks if you let a backpacker from France
crash in your living room for a couple nights. Like Amazon, Airbnb uses Hadoop
to store all of its user data – that’s 10 million http requests per day – to support
multiple use cases.
24
o S&P CapitalIQ provides its users with comprehensive information around
particular companies or organizations they may want to invest in. It does this by
allowing users to build personalized, online dashboards that detail the “key
developments” of the companies they’re interested in. They leveraged Hadoop to
suggest to users which companies to keep an eye on by analyzing both user
behavior and tracking and scoring news stories related to the companies it
watches. For example, it analyzes news stories and press releases to determine
which events to highlight in a company’s history. The system learns as it
processes more and more data, so it now knows for example that a company
announcing a “dividend increase” is more noteworthy than a “dividend
affirmation,” which is nothing more than company confirming a previous
announcement (Zeralli and Strenberg, 2012).
Entertainment
There are abundant big data applications in the entertainment industry. Aggregate data
analysis and predictive analytics are helping cable firms redistribute bandwidth, retain
Netflix-centric customers, suggest decent advertisements, and provide custom
packages. Companies such as Time Warner Cable have been using big data to
determine the course of both their marketing efforts and their network infrastructure. Big
Data is also a part of everyday life in the advertising department. According to Time
Warner Cable Media president Joan Gillman, the company uses sophisticated
correlation solutions that meld publicly available data such as voter registration records
and real estate records with local viewing habits. This helps Time Warner's clients
launch custom campaigns tailored to geographic or demographic microsegments of
users. In the video gaming industry, the industry has grown from 200M active users to
1.5B players worldwide. Many games, such as Battlefield and Call of Duty, serve
millions of players a day and numbers close to that concurrently. As they play, they
leave behind traces of themselves, behaviors, activity, and even their own
personalization–all of these digitally recordable as data that tells video game companies
how consumers play their games. Add together the potential 1.5B players, indicates that
so much of data is difficult to sift through it without a plan–or an analytics suite. EA CTO
25
Rajat Taneja has mentioned that EA has turned to the ever-popular Hadoop for collating
and processing all that information, which is then distilled down using map reduce in
order to allow distinct elements of the gameplay to be visualized. A process that used to
take EA days to boil down and recondense now can occur in a matter of minutes;
allowing the game company to mix historical data and current models of player behavior
to see what’s going on.
Electric power
Power systems function near high risk operating points leading to a high risk of
cascading outages which can cover a large geographic area. However, a lot of data is
available from synchrophasors and residential smart meters. This data can be used to
measure critical slowing down to estimate proximity to unstable operating points.
Technology can warn operators when they are approaching critical points and this can
be used to prevent large scale outages (Sánchez and Eduardo, 2012).
Public sector
A significant amount of the current use of big data is within the private sector. However,
there are a lot of opportunities to apply big data in the public sector. For example, one
report out of the UK suggests that potential public sector applications of big data include
real time management information, countering non-compliance, fraud and error,
transforming and personalizing the citizen experience, improving healthcare and patient
outcomes and delivering more timely population estimates as lower cost (Yiu, 2012).
Tools for Working with Big Data The opportunities enabled by big data are always followed by challenges. On the one
hand, Big data bring many attractive opportunities. On the other hand, lots of challenges
lie for handling big data problem. Difficulties arise in processes such as data capturing,
storage, searching, sharing, analysis, and visualization (Ozsu and Valduriez 2011). One
major challenge which exists in computer architecture is the system imbalancement
(heavy CPU but poor I/O) (Ahn 2012). Analysis of Big data also deals with challenges
including data inconsistence and incompleteness, scalability, timeliness and data
security. As the prior step to data analysis, data must be well-constructed. However,
26
considering the variety of data sets in Big Data problems, it is still a big challenge to
purpose efficient representation, access, and analysis of unstructured or semi-
structured data.
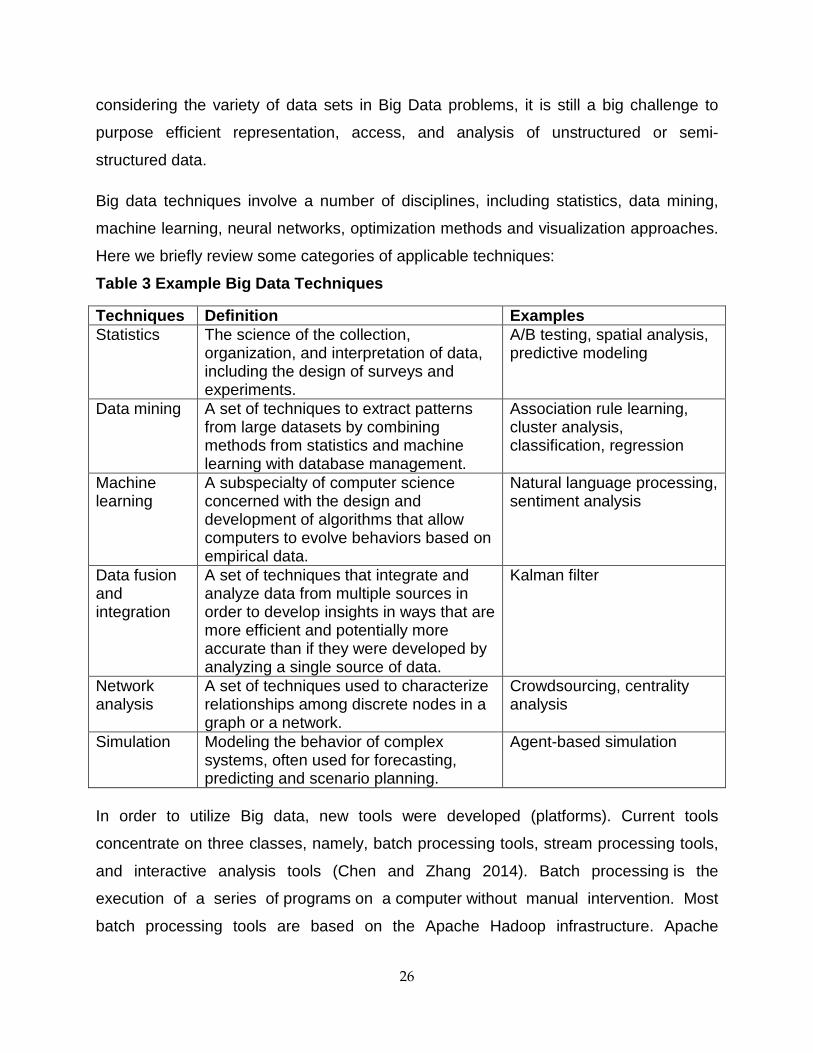
Big data techniques involve a number of disciplines, including statistics, data mining,
machine learning, neural networks, optimization methods and visualization approaches.
Here we briefly review some categories of applicable techniques:
Table 3 Example Big Data Techniques
Techniques Definition Examples Statistics The science of the collection,
organization, and interpretation of data, including the design of surveys and experiments.
Data mining A set of techniques to extract patterns from large datasets by combining methods from statistics and machine learning with database management.
Association rule learning, cluster analysis, classification, regression
Machine learning
A subspecialty of computer science concerned with the design and development of algorithms that allow computers to evolve behaviors based on empirical data.
Natural language processing, sentiment analysis
Data fusion and integration
A set of techniques that integrate and analyze data from multiple sources in order to develop insights in ways that are more efficient and potentially more accurate than if they were developed by analyzing a single source of data.
Kalman filter
Network analysis
A set of techniques used to characterize relationships among discrete nodes in a graph or a network.
Crowdsourcing, centrality analysis
Simulation Modeling the behavior of complex systems, often used for forecasting, predicting and scenario planning.
Agent-based simulation
In order to utilize Big data, new tools were developed (platforms). Current tools
concentrate on three classes, namely, batch processing tools, stream processing tools,
and interactive analysis tools (Chen and Zhang 2014). Batch processing is the
execution of a series of programs on a computer without manual intervention. Most
batch processing tools are based on the Apache Hadoop infrastructure. Apache
27
Hadoop is one of the most well-established software platforms that support data-
intensive distributed applications. It implements the computational paradigm named
Map/Reduce (Deam and Ghemawat 2008). Apache Hadoop platform consists of the
Hadoop kernel, Map/Reduce and Hadoop distributed file system (HDFS), as well as a
number of related projects, including Apache Hive, Apache HBase, and so on. In a
nutshell, the Hadoop framework provides both reliability and data motion to applications.
It implements a computational paradigm – MapReduce, where the application is divided
into many small fragments of work, each of which may be executed or re-executed on
any node in the cluster. The architecture of the Hadoop platform is designed to be
tolerable to node failures. The entire Apache platform now includes a family of tools
including the Hadoop kernel, MapReduce, HDFS, Apache Hive, Apach HBase, and
others.
In summary, MapReduce and Hadoop are the standard methods for computation and
other software and hardware options are limited (Courtney, 2012; Lin, 2012). Some of
the main difficulties with processing big data are the huge variation in batch processing
jobs and the need to minimize data trafficking (Ingersoll 2009). There are many other
big data platforms that have been developed on top of MapReduce and Hadoop. For
example, Mahout and Dryad are two examples of batch processing tools based on
Apache Hadoop infrastructure. The latter is more like necessary for real-time analytic for
stream data applications. Stream processing is a computer programming paradigm,
related to SIMD (single instruction, multiple data), that allows some applications to more
easily exploit a limited form of parallel processing. Storm and S4 are good examples for
large scale streaming data analytic platforms. The last class of tools is often referred as
interactive analysis tools. The interactive analysis processes the data in an interactive
environment, allowing users to undertake their own analysis of information. The user is
directly connected to the computer and hence can interact with it in real time. The data
can be reviewed, compared and analyzed in tabular or graphic format or both at the
same time. Google’s Dremel (Melnik et al. 2010) and Apache Drill (Kelly, J. 2013) are
Big Data platforms based on interactive analysis.
28
There are a growing number of technologies used to aggregate, manipulate, manage,
and analyze big data including granular computing, cloud computing, biological
computing systems and quantum computing. These technologies are invented in order
to manage, analyze, visualize, and exploit informative knowledge from large, diverse,
distributed and heterogeneous data sets. Granular computing (GrC) may refer to a
general computation theory for effectively using granules such as classes, clusters,
subsets, groups and intervals to build an efficient computational model for complex
applications with huge amounts of data, information and knowledge. Cloud computing
refers to usage of virtual computers (Bell et al. 2009). The development of virtualization
technologies have made supercomputing more accessible and affordable. Powerful
computing infrastructures hidden in virtualization software make systems to be like a
true physical computer, but with the flexible specification of details such as number of
processors, memory and disk size, and operating system. Biological computing models
are better appropriate for Big Data because they have mechanisms to organize, access
and process data in ways that are more practical for the ranging and nearly infinite
inputs we deal with every day. This class of computation technique is inspired by human
brain where processing for information is executed in highly distributed and parallel
ways. The multi-located storage schema and synchronous parallel processing
approaches make computation so fast and efficiently. Biologically inspired Computing
(Bongard 2009) shall provide tools to solve Big Data problems from hardware design to
software design.
Critiques on Big Data Technology One of the very controversial aspects of big data is that it is a reversal of traditional
research methods. In traditional data analysis, research question(s) are posed before
analysis, and then data is collected to seek answers for those pre-designed questions.
A sample is taken from a known population to conduct the analysis in a relational
database environment. Big data analytics, however, works with a framework such as
Hadoop that performs data analysis of entire known or unknown populations. This has
been heralded as the “End of Theory” where we no longer need hypotheses and
models; we can simply query a database to understand the correlations (Anderson,
2008). In addition, we can do research and prove ideas that we could never have
29
hypothesized (Sánchez and Eduardo, 2012). This concept is not entirely new as
exploratory data analysis (analysis is guided by the data itself) was created by Tukey
(1977). Statisticians accept data mining if it follows the EDA paradigm looking for
unexpected information rather than trying to confirm something expected (Ratner,
2012).
However, with the increase in big data, the concerns have become quite common.
Some issues are that this new methodology could change the definition of knowledge,
have errors and create new digital divides (Boyd and Crawford, 2011). Also, large
measurement errors in big data can make it impossible to find subtle associations
(Ioannidis, 2013). The other barrier is the continuous flow of big data as opposed to
traditional “stock-data-in-warehouse” situation . This represents a substantial change
from the past, when data analysts performed multiple analyses to find meaning in a
fixed supply data.
Last but not least, leveraging datasets generated by various sources and agencies
brings up new challenges on data ownership, interoperability, security and privacy
which is beyond the definitions of traditional data managements (Al-Khouri 2012). For
example, in traditional analytics there is usually one central governance team focused
on governing the way data is used and distributed in the enterprise, while big data
analytics need multiple governance in play simultaneously, each geared toward
answering a specific business question.
Summary Big data present great opportunities and challenges. The issues of scale, heterogeneity,
lack of structure, error-handling, privacy, timeliness, provenance, and visualization
make it challenging to effectively utilize big data in various applications. These
challenges exist at all stages of the analysis pipeline from data acquisition to result
interpretation. Given these challenges, there is a need for methods that are different
from traditional methods. This is due to several limitations associated with traditional
methods.
30
Traditional architectures struggle to provide fast results to queries on such large data
sets because they rely on monolithic architectures designed in an era of smaller data
sets and slower data growth. They are typically expensive and cumbersome to scale as
data grows due to inflexible systems, requirements that force “super-size” upgrades,
required downtime, and error-prone upgrade processes.
Traditional architectures for data management and analytics are not designed to move
terabytes to petabytes of data through the data pipeline to the analytic application for
processing. The larger the data volume, the larger the time and effort needed to move it
from one location to another. The resulting performance and latency problems are so
severe that application developers and analysts commonly compromise the quality of
their analysis by avoiding big data computations. Thus, the traditional extract-transform-
load (ETL) data approach should be altered with one that minimizes data movement
and improves processing power (SAS 2012). It is not an overstatement that standard
relational databases and SQL reach fundamental capacity and scaling limits when
dealing with big data.
Traditional structured data is always used after it has been collected and organized
neatly, but big data takes any form of data structure. The difference is better described
this way: Unlike relation-based data, big data manages data in any format and does not
require the time and effort to create a model first to capture, process, and analyze the
data (Intel 2012).Since big data analytics handle non-stop streams, it offers
opportunities to seek answers for questions either already posed or newly raised during
the process - questions we may otherwise not be able to ask.
Traditional data management and analytics, such as SQL-based platforms, use a
powerful but fixed syntax. Big data generally needs procedural languages and the ability
to program arbitrary new logic. This is due to that much of the processing requires
iterative logic, complex branching, and special analytic algorithms.
Yan (2013) provided a concise summary of the major differences between traditional
and big data analytics along the dimensions of data features and technologies. In terms
of data features, traditional data analytics only provide environment suitable for
31
structured data only and the usual unit of volume is megabyte or gigabyte, while the big
data analytics need a data handling environment for any kind of data from multiple
sources and the usual unit of volume is terabyte or petabyte. In terms of technology,
traditional data analytics often rely on SQL-based approaches, relational databases,
and batch or offline processing. Big data analytics often rely on massively parallel
processing and NoSQL capabilities, Hadoop framework, streaming processing, live
data, and near real-time processing.
All these characteristics also cause new fundamental challenges to big data research
and industries. Because big data can change constantly, research on it can be
unrepeatable (Berman, 2013). The combination of different sources can make big data
“dirty” and fuzzy and it can consist of unknown combinations of nonrandom populations
(Ratner, 2012). It can also be expensive and politically difficult to collect, store, process
and analyze data (Goldston, 2008). Because of the various sources of the data,
working with big data creates new questions about informed consent (Ioannidis, 2013).
Also, there is a shortage of labor for this work as research on big data requires both
knowledge in big data analysis and domain specific knowledge (Waller and Fawcett,
2014).
Big Data for Transportation Applications The transportation sector is on the edge of a paradigm shift thanks to big data.
Discovering novel ways to manage and analyze big data to create value will increase
the accuracy of predictions, improve management, enhance road use safety, and
transportation infrastructure security. Transportation agencies collect vast quantities of
data to support infrastructure planning, condition monitoring, and operation. At the same
time, an increasing number of transportation system users are generating new types of
data through self-reporting. The notable ones are social media and geolocation data.
Collectively, large data sets related to transportation include, but are not limited to, the
following categories.
• Sensor data
o Structural Health Monitoring data
o Traffic data
32
o WIM
o Video logs
• Demographics
o Trends
o Household
o Survey data
• Infrastructure
o Inventory
o Repair history and costs
• Natural Environment
o Weather data
o Tides
o Air quality
o Flow rates
o Remote sensing data set - Terrain/LIDAR
• Safety performance data
• Social media data
• Geolocation data
There are abundant use cases for big data applications in the transportation industry. In
the following, we provide a detailed analysis on some example large data sets which
likely present a big data problem to transportation agencies. In the meantime, we
discuss application scenarios and use cases of these data sets.
Safety Performance Data
In January of 2014, the Federal Highway Administration issued a broad agency
announcement on requesting proposals on adapting suitable methodologies for
handling, processing, and analyzing massive data sets. This RFP clearly indicated that
ongoing safety programs such as “Second Strategic Highway Research Program
(SHRP2)” are generating petabyte of data. These data promise better understanding of
the causes of vehicle crashes and unsafe behavior. However, traditional data and
33
analysis methods no longer provide dramatic new findings about crash causation and
potential effective countermeasures. Further, traditional methods are limited in
assessing the value of new data, integrating new data, and automating quality control
and quality assurance.
While there are many different types of transportation safety data, two data sets that
have posted significant challenges to traditional data analysis methods are HSIS data
and Naturalistic driving study dataset.
HSIS data - HSIS is a roadway-based system that provides quality data on a large
number of accident, roadway, and traffic variables. It uses data already being collected
by States for managing the highway system and studying highway safety. The data are
acquired annually from a select group of States, processed into a common computer
format, documented, and prepared for analysis. HSIS is used in support of the FHWA
safety research program and provides input for program policy decisions. HSIS is also
available to professionals conducting research under the National Cooperative Highway
Research Program, universities, and others studying highway safety. HSIS data are
stored in a relational database that contains basic crash files, roadway inventory files,
and traffic volume files from these nine States. The database also includes information
about highway intersections, interchanges, and curves/grades from some States. Table
4 details the information available from each of the currently participating States.
Table 4 Data Types in the HSIS Data Set
Naturalistic driving study dataset – Naturalistic driving study data are the result of the
largest, most comprehensive naturalistic driving study (NDS) ever conducted by SHRP2
to monitor how drivers interact with their vehicles and the highway environment. The
California Illinois Maine Minnesota North Carolina Ohio Washington
Crash
Roadway
Traffic Volume
Curve/Grade
Intersection
Interchange
Supplementry
Data FilesStates
34
study collects real-time data on more than 5.8 million trips from more than 3,100
participants, ages 16-80 in 6 study sites across the country. The data will include 33
million travel miles, more than 1.4 million driving hours, and will exceed more than 4
petabytes in size. The NDS database contains continuous data from all trips taken by
volunteers over one to two years. Volunteers’ vehicles are heavily instrumented and
record vehicle location, forward radar, vehicle control positions, and many other data
elements, including video of the forward roadway and of the driver’s face and hands.
Crash investigations are conducted after certain crashes to gather more detailed data.
There are six NDS site states: Florida, Indiana, New York, North Carolina,
Pennsylvania, and Washington. The types of data collected in this study are
summarized in Table 5.
Table 5 Data Types in the NDS data set
Remote Sensing Data Sets
Remote sensing technologies, such as static and mobile LiDAR have been increasingly
used by state DOTs to collect highway inventory data (Figure 3). A general trend of
these technologies is their capability to collect very high resolution spatial data sets,
leading to an exploding amount of data (Figure 4). Remote sensing data sets collected
by other government agencies, such as airborne LiDAR and imagery, are also rapidly
growing in volume and type. Many of these data sets can be leveraged by
MultipleVideos; front, rear, driver face and hands
Accelerometer data; 3 axisGPS location – latitude, longitude, elevation, time, velocityForward radar – positions and velocitiesVehicle network data – speed, accelerator, brake, gear position, steering wheel angle, turn signals, horn, seat belt use, air bag deployment, etc.Illuminance sensorInfrared illuminationIncident push buttonTurn signalsCell phone calls – beginning and end timesPassive alcohol sensorDriver assessment data – vision, cognition, health, medication, driving knowledge and history
Number of lanes
ane type and width
Grade
Cross s lope
Horizonta l curvature: curve s tart, end, di rection, length, and radius
Lighting
Roadway Information Data
NDS Data
35
transportation agencies for infrastructure planning, road inventory, and disaster
response applications. These emerging data collection methods have produced large
and heterogeneous geospatial temporal data sets spanning multiple spatial and
temporal scales and with varying levels of confidence. One particular challenge is that
these data sets are in very low-level data format – three dimensional point data; feature,
pattern, and knowledge extraction from these data sets require significant computation
efforts. The other type of large-size data sets that are routinely collected by state DOTs
are pavement databases. Transportation agencies often use mobile data collection
services such as those provided by Pathway services for annual pavement data
collection. Since each state transportation agency often need to manage thousands of
miles of roadways, these data collection efforts often generate tremendous volumes of
data sets (Figure 5). In summary, effective utilization of the above growing volumes of
remotely sensed data sets poses significant challenges to state transportation agencies.
Processing of these data sets often require sophisticated and scalable machine learning
methods.
Figure 3 Remote Sensing Technologies for Transportation Infrastructure Data Collection
36
Figure 4 Highway Mobile LiDAR Data
Figure 5 Pavement Condition Assessment Social Media Data
Social networks, like Twitter, and Facebook, are now widely used in our society. A total
of 4 out of 5 active internet users visit social networks and blogs. Social Networks and
Blogs account for 23% of the total time users spend on the internet (Nielsen 2009). The
rise of social media has the potential to improve existing transportation service user
satisfaction measurement practices. Many transit agencies are already sophisticated
37
users of Facebook and Twitter. Typically transit agencies use social media to announce
service changes, provide instant notification to users about problems, and to build a
relationship with customers (Harnack 2011). Recently, social network tools have been
used to analyze sustainable transportation organizations (Watts and Witham 2012).
However, no transit agency is analyzing the text input of system users on a real time
basis to identify problems as they are occurring in real-time.
In recent years, Big Data has become a vibrant research field in transportation.
Social media data is widely considered as one important type of Big Data in
transportation research. Sentiment analysis is one emerging data analytics that can be
used for mining the vast quantity of social media data generated by transportation
service users. Thus, combining social media data with sentiment analysis methods
provides a new lens that transportation agencies can potentially use to observe their
service performances. This has encouraged research effort in understanding the
potential role of social media and sentiment analysis in transportation related
operations. These efforts include, but are not limited to, use of social media data and
sentiment analysis for vehicle defect detection (Abrahams et al. 2012), sentiment
analysis for roadway traffic safety enhancement (Chen and Krishman 2013), use of
social media to predict traffic flow under special event conditions (Ni et al. 2013), use of
social media as a novel transit rider satisfaction metric (Collins et al. 2013), international
surveys to gauge the level of acceptance and utilization in using social media for
improving transit operations (Pender et al. 2013), use of social media as a new
intelligent transportation tool (Cao et al. 2014), and integrating social media data for
road traffic prediction (He et al. 2011).
In parallel with academic research studies, industry giants such as IBM have also
invested heavily in developing social media data analytics for business intelligence,
such as Social Media Analytics (IBM 2013). One obvious use of these analytics can be
in the transportation field such as forecasting travel demands. Another similar online
social media analytic platform is Sentiment 140 (Sentiment 140 2014), which allows
users to discover the Twitter sentiment for a product or brand. While these platforms
can provide off-the-shelf analytics capabilities that transportation agencies can use to
38
start reap the benefits of social media data, the methodologies used in these platforms
are a complete black box to transportation agencies. Studies that have benchmarked
the performance of these systems or have evaluated transportation agencies’
experience in using these systems are scarce. It is suffice to say that compared to the
rapid development and implementation of sentiment analysis in other fields, the
potential of opinion mining and sentiment analysis has not been fully realized by transit
agencies. Opinion mining and sentiment analysis of transit social media data also
requires new methods and new models as vocabularies and language patterns are
often sensitive to context and tend to be domain specific.
Applications and Use Cases The travel & transportation industry is an asset intensive business. In order to drive
results, organizations must continually get yield from those assets. Big data provides an
opportunity to connect user preferences and agency decisions. The types of problems
that can be addressed by transportation related big data include:
• Predictions version actual experience
o Transit ridership
o Costs/bids
o Usage
• Incident management and response from crowd sourcing
• Emergency management
• Determining the right action at the right time
The following provides a comprehensive review of existing industry applications and
academic studies that have already tapped into the potential of big data in the
transportation domain.
Smart City - In collaboration with IBM, the Dublin City Council (DCC), which provides
housing, water and transportation services to 1.2 million people, is using big data
strategies to help the area's bus traffic move smoothly. The road and traffic
management at the Dublin City leverages real-time data streams from a variety of
sources including road sensors, video cameras, and GPS updates from the city's 1,000
39
buses. Traffic controllers use these data to overlay real-time locations of Dublin's buses
on a digital map of the city. The advantage of this approach is that it allows Dublin's
traffic managers to quickly visualize potential problems in the city's bus network. For
instance, areas experiencing delays can be quickly pinpointed and the source of the
problem can be quickly identified before it spreads to other routes (Bertolucci 2013). In
addition, instruments include smartphones, sensors, and onboard vehicle hardware are
deployed in the city to enable continuous collection, communication, and processing of
mobility data—anything from traffic and weather conditions to parking spots and
rideshares. There are also novel analytics applications built on top of these large data
sets. For example, transportation planners use Clockwork to design and optimize
transportation systems to improve availability of the fleet, lower costs, and improve
customer good will. It should be noted that transportation systems are made up of a
variety of systems (rail, bus, and subway) as well as their enabling infrastructure (i.e.
power, control, signaling etc.).
London Olympic - During London Olympic, big data has been used to manage traffic.
For example, traffic lights respond to traffic flows in realtime, with the red light being
prolonged at some junctions if the dedicated lanes become too congested. The free
Inrix Traffic app uses multiple data sources to help drivers determine the fastest route
and avoid delays with up-to-the-second traffic information. The app provides traffic
forecasts that help travellers know what to expect on the roads before they take a trip.
Controlling Driving Offenses (Fatemi and Karimi 2013) – This study proposed an
efficient and intelligence model for control driving offenses by using three main
technologies namely, Image Processing, Artificial Intelligence, and Cloud Computing. In
the proposed model, Vertical-Edge Detection Algorithm (VEDA) was used for car
license plate detection process in highways to provide an efficient image processing
process with low quality images that were taken from installed cameras. Furthermore,
two intelligence cloud based Software-as-a-Service applications were used for car
license plate detection, matching violations detected numbers with entrance detected
numbers, and identification of possible exit routes for further processes. The suggested
40
model contains a cloud server for storing databases and violation records which make
them always accessible according to cloud computing concepts.
Traffic Incident Detection (Kinane et al. 2014) – This study presented a system for
heterogeneous stream processing and crowdsourcing supporting intelligent urban traffic
management. Complex events related to traffic congestions are detected from
heterogeneous sources involving fixed sensors mounted at traffic intersections and
mobile sensors mounted on public transport vehicles. To deal with the inherent data
veracity, a crowdsourcing component handles and resolves source disagreement.
Communication between traffic authority, staff and the public (Xian et al. 2013) – This
study attempted to design a traffic safety information platform based on cloud
computing technology, data warehousing and data mining which serves as an excellent
channel for communication between traffic authority, staff and the public. The goal is
quick access to updated road traffic information for city travelers. It aims to take full
advantage of road safety information database in attempt to generalize, judge and
predict various safety information such as traffic accident black-spots, vehicle types
liable to serious accidents and weather based on already occurred accidents on one
hand and gather, tackle and share detailed traffic conditions without delay such as road
condition, potential risks, accidents, disasters and weather on the other hand
Parallelized fusion on multi-sensor transportation data – Xia et al. (2013) proposed an
approach using parallelized fusion on multi-sensor transportation data. The framework
may resolve two main challenges namely processing heterogeneous transportation data
collected from different types of traffic sensors and reducing the high computation
intensity for processing massive transportation data. Parallelized fusion is an embodied
case of CyberITS framework, which is developed for the synthesis of cyber
infrastructure and ITS.
Big data storage and processing solutions for intelligent transportation system – Dai et
al. (2012) presented the new paradigm (the Hadoop stack) that is required for big data
storage and processing using a case study of ITS application. They described how to
optimize the Hadoop deployment through proven methodologies and tools provided by
Intel (such as HiBench and HiTune). Challenges and possible solutions for real-world
big data applications using a case study of an ITS application are demonstrated.
41
Congestion Prediction – Ma et al. (2012) proposed a user-driven Cloud Transportation
system (CTS) which employs a scheme of user-driven crowdsourcing to collect user
data for traffic model construction and congestion prediction including data collection,
filtering, modeling, and intelligent computation. In the study, application scenario,
system architecture, and core CTS services models are described in detail.
Traffic Surveillance in Cloud – Li et al. (2011) investigated the processing of massive
floating car data (FCD) for traffic surveillance in cloud-computing environments, with the
goal of exploring the use of emerging cloud-computing technologies to solve data-
intensive geospatial problems in urban traffic systems. The experimental results
indicated that cloud computing technologies (e.g. Bigtable and MapReduce) can
provide substantial utility for data-intensive geospatial computing, as both scalability and
near real-time computational performance can be adequately enhanced through
proposed data storage, management, and parallel processing models.
GPS Data Processing – Huang and Qiao (2013) presented a novel parallel map
matching algorithm to realize high-performance processing of GPS data. The main idea
is to adapt the serial map matching algorithm for cloud computing environment by
reforming its’ data intensive or I/O-intensive computing stages using MapReduce
paradigm.
Clockwork – Clockwork is a predictive analytic solution that computes the best options
for maintaining and increasing utilization levels at the lowest possible cost for asset
management. Compared to traditional methods that are often based on small subsets of
historical data or past experience, Clockwork can leverage data growing at exponential
scales and turns them into savings and profitability. Asset managers in
the transportation industry can use Clockworks to predict maintenance issues and
schedule appropriate repairs to ensure the fleet is operational and system uptime is
maximized.
GIS-T - Geographic Information Systems for Transportation (GIS-T) refers to the
principles and applications of applying geographic information technologies to
transportation problems.
42
GSM - The most interesting new data source, however, is GSM (Global System for
Mobile Communications) location data, which is location based information retrieved
from mobile phones. Each mobile phone is at all moments connected to a certain GSM
cell site antenna. Such a cell, provided by a mobile provider, knows what mobile phones
are present in that cell. The basic version only knows that a particular mobile phone is
present, the more advanced cells know from what direction (angle) the phone is
connecting to the cell antenna. The most advanced cells also return an indication of the
distance from to mobile phone to the cell antenna. This results in fairly accurate
positioning of a phone. When the phone moves, for example during a car ride, the
mobile phone switches over from one cell to another cell. Monitoring the movement of
an anonymized mobile phone through the provider’s network gives the desired data on
mobility.
Big Data Use Cases and Requirements While there appears to be many use cases for big data in the transportation domain, it is
not clear that whether these use cases can be stated and compared at a high level for
the purposes of extracting requirements or comparing usages across fields. It is
necessary to develop a consensus list of Big Data requirements across all stakeholders
in transportation applications. Recently, NIST has organized a systematic effort to
examine big data use cases in diverse fields and to develop a standard procedure for
defining and comparing requirements across these different use cases (NIST, 2015). A
collection of 51 use cases in the field of Government Operation, Commercial, Defense,
Healthcare and Life Sciences, Deep Learning and Social Media, The Ecosystem for
Research, Astronomy and Physics, Earth, Environmental, and Polar Science, and
Energy was examined in this effort. Surprisingly, transportation use cases were only
marginally included as the only use case related to transportation is cargo shipping.
Nevertheless, the NIST framework for eliciting big data application requirements is a
valuable outcome for use in benchmarking the big data challenges and opportunities in
the transportation sector. The following table provides detailed procedures or steps
used in the NIST case study research.
43
Table 6 NIST Big Data Case Study Template
Table 7 Detailed explanations of fields
Terminology Explanation
Goals Objectives of the use case
Use Case
Description
Brief description of the use case
Current Solutions Describes current approach to processing Big Data at the hardware and
software infrastructure level
Compute
(System):
Computing component of the data analysis system
Storage Storage component of the data analysis system
44
Networking Networking component of the data analysis system
Software Software component of the data analysis system
Big Data
Characteristics
Describes the properties of the (raw) data including the four major ‘V’s’ of Big
Data
Data Source The origin of data, which could be from instruments, Internet of Things, Web,
Surveys, Commercial activity, or from simulations. The source(s) can be
distributed, centralized, local, or remote.
Volume The characteristic of data at rest that is most associated with Big Data. The size
of data varied drastically between use cases from terabytes to petabytes for
science research, or up to exabytes in a commercial use case.
Velocity Refers to the rate of flow at which the data is created, stored, analyzed, and
visualized. For example, big velocity means that a large quantity of data is
being processed in a short amount of time.
Variety Refers to data from multiple repositories, domains, or types.
Variability Refers to changes in rate and nature of data gathered by use case
Big Data Science Describes the high level aspects of the data analysis process
Veracity Refers to the completeness and accuracy of the data with respect to semantic
content
Visualization Refers to the way data is viewed by an analyst making decisions based on the
data. Typically visualization is the final stage of a technical data analysis
pipeline and follows the data analytics stage.
Data Quality This refers to syntactical quality of data. In retrospect, this template field could
have been included in the Veracity field
Data Types Refers to the style of data such as structured, unstructured, images (e.g.,
pixels), text (e.g., characters), gene sequences, and numerical
Data Analytics analytics refers broadly to tools and algorithms used in processing the data at
any stage
Summary The field of big data is rapidly evolving, with new frameworks and tools emerging at an
unprecedented rate. This research project provides a snapshot of this research field
from the perspective of transportation infrastructure management. Applications of
relevant tools and methods for the transportation sector can be examined from the
perspectives of data type, data storage and management, and data analytics.
45
To determine which platform and tools are best for different transportation applications,
it is necessary to characterize data types and analysis requirement. For data types, it is
important to differentiate the following categories:
o Data collected locally and stored in widely distributed repositories (i.e. health
care)
o Data collected with advanced sensing systems and stored in large data centers
(i.e. earth observation systems)
o Data collected through social networking and internet (i.e. social media)
o Data generated during simulation and experimental processes (i.e. astro-physical
simulations)
A common denominator of these data is their sheer volume. Nevertheless, they often
require fundamentally different data management and analysis strategies. For example,
for data collected with advanced sensing systems and stored in large data centers, it is
difficult to migrate; consequently, distributed analyses are being deployed for such
applications. Data generated from social media often require advanced graph-based
analytics that can scale up to very large data sets. Data generated during simulation
and experimental processes require interactive analysis capabilities.
Therefore, it is important to categorize datasets used in transportation applications. It
appears that transportation datasets are multi-modal, spanning multiple categories as
described above. A majority of transportation datasets including traffic data from ITS
infrastructures, asset condition data, and safety performance data are mainly collected
at the point of events but stored in centralized databases. Nevertheless, to tap into
some emerging data sources such as social media data, it is also necessary for
transportation agencies to look into ways to handle social media data which are
massively distributed. Transportation agencies also have the need to access and utilize
data hosted by other agencies such as demographic data, weather forecast data, and
so on. Collectively, these considerations are strong influencing factors on which big data
platform to use as different data platforms excel at different applications. Table 6 shows
a summary of common big data databases from different vendors.
46
Table 8 Types of Databases for Storing Big Data
Type Description Example Tools
Document-
oriented
Document-oriented data stores are mainly designed to store and
retrieve collections of documents or information and support
complex data forms in several standard formats, such as XML.
MongoDB; SimpleDB;
CouchDB
Column-
oriented
A database stores its content in columns aside from rows, with
attribute values belonging to the same column stored contiguously
Google BigTable;
Graph
database
A graph database is designed to store and represent data that
utilize a graph model with nodes, edges, and properties related to
one another through relations
Neo4j
Key-value Key-value is an alternative relational database system that stores
and accesses data designed to scale to a very large size
Apache HBase;
Apache Cassandra;
Voldemort;
Another critical consideration in choosing big data platforms and tools is the
requirement on how these data should be analyzed. There are three dominant
paradigms in big data analytics: (1) batch processing; (2) stream processing; and (3)
interactive analysis. Batch processing explores parallelism in data processing either
through vertical and horizontal scaling. The vertical scaling leverages investment in
adding more CPUs and GPUs into a single computer to scale up processing
capabilities. The horizontal scaling leverages investment in adding more commodity-
grade computers to form clusters of computers to realize distributed processing. Both
approaches enable users to deal with ever increasing volumes of data and prevent data
analysis from degrading into crawls. Nevertheless, batch processing is not designed for
real-time analytics, but stream processing is. Stream processing is a critical need for
transportation agencies as in various scenarios transportation agencies need to analyze
and act on real-time streaming data such as traffic congestion data and incident event
data. In a traditional database model, data is first stored and indexed and then
subsequently processed by queries. In contrast, stream processing takes the inbound
data while it is in flight, as it streams through the server. The interactive analysis
processes the data in an interactive environment, allowing users to undertake their own
analysis of information. This class of analytics has strong applications in large-scale
simulation studies such as traffic simulation and simulating behavior of large
infrastructure systems. Many existing tools can be used to support these big data
47
analytics needs. Table 7 provides a summary of these common tools. Depending on
specific needs, transportation agencies are suggested to choose the most appropriate
tools that can best support the envisioned applications.
Table 9 A Catalog of Big Data Analytic Tools
Category Tools Application Area
Batch
processing
tools
Apache Hadoop &
MapReduce
Data-intensive distributed applications
Dryad Parallel and distributed processing of large data sets using a
very small cluster or a large cluster
Apache Mahout Large-scale data analysis applications with scalable and
commercial machine learning techniques
Apache Spark Batch and stream processing of large data sets
Jaspersoft BI Suite Report generation from columnar databases
Pentaho Business
Analytics
Report generation from both structured and unstructured large
volume of data
Talend Open Studio Visual analysis of big data sets
Real-time
stream
processing
tools
Storm A distributed and fault-tolerant real-time computation system for
processing limitless streaming data
S4 A general-purpose, distributed, scalable, fault-tolerant, pluggable
computing platform for processing continuously unbounded
streams of data
SQLstream s-Server Processing of large-scale streaming data in real-time
Splunk A real-time and intelligent big data platform for exploiting
information from machine-generated big data
Apache Kafka A high-throughput messaging system for managing streaming
and operational data via in-memory analytical techniques for
obtaining real-time decision making.
SAP Hana An in-memory analytics platform aimed for real-time analysis on
business processes, predictive analysis, and sentiment data.
Interactive
analysis tool
Google’s Dremel A system for processing nested data and capable of running
aggregation queries over trillion-row tables in seconds
Apache drill A distributed interactive big data analysis tool capable of
supporting different query languages, data formats, and data
sources.
48
CONCLUSIONS Over the past decade, transportation infrastructure management has become a largely
data driven process in an increasingly networked, digitized, sensor-laden, information-
driven world. Transportation departments collect vast quantities of data sets taking on
varied properties such as volume, velocity, variety, variability and veracity, but
managing, analyzing, accessing and sharing data has been problematic and well
documented. "Big Data" is the broad term given to address these emerging challenges.
This project reviewed the similar challenges faced by other industries and investigated
what approaches have been taken by these industries to address those challenges. The
review results suggest that there is a broad agreement among industry, academic, and
government stakeholders about the remarkable potential of Big Data to spark
innovation, fuel commerce, and drive progress in various sectors.
In this project, we also explored what kinds of data sets in the transportation industry
are posing big data challenges. Our literature review suggests that big data challenges
are ubiquitous in the transportation industry. Infrastructure condition data, traffic data,
safety performance data, driver behavior data, and social media data are very examples
of big data. As these types of data continue to grow in size, they open up a wealth of
applications and ability to answer questions previously out of reach, including the
following:
• How can bridge conditions be rapidly synthesized and further predicted from a
corpus of terabytes of data including design records, construction reports,
inspection reports, photos, structure health monitoring data, non-destructive
testing results, traffic volume, and climate conditions?
• Can new construction materials with advanced properties be predicted before
these materials have even been synthesized?
• How can potential cascading or escalating failures in the transportation systems
and beyond in the face of extreme events reliably be detected early enough to
intervene?
Nevertheless, addressing these questions with big data would require more efficient and
effective and scalable data analysis methods that must transcend traditional analysis
49
methods in the field of statistics, data mining, and machine learning. Therefore, a
detailed literature survey was also conducted in this study on what kind of tools and
data analytics have been developed and used for big data analytics. To this end, we
characterized common big data storage and big data analytic platforms. While there are
many platforms available to use, choices of platforms should be made based on
detailed evaluation on the nature of data problems faced by particular agencies. A short
education module focused on introduction of big data to civil engineers was developed
(see Appendix A). At the end of the project, a half-day workshop was conducted to
disseminate the findings of this research and solicit inputs from leading industry and
academic researchers in the field of engineering informatics, cloud computing, and big
data analytics (see Appendix B). An important message from this workshop is that many
attendees believe the big data challenge faced by state transportation agencies would
be best addressed by a public private partnership approach given the fact that private
industries have been leading the big data R&D activities and have demonstrated many
successful applications in domains including city management, financial investment,
and e-commerce.
RECOMMENDATIONS This exploratory study suggests that the field of Big Data is rapidly maturing in
capabilities, applications, and utility. With the rise of big data, applications of big data in
the transportation industry are rapidly emerging. Given the critical role and the vast
reach of transportation services in our everyday life, leveraging big data to improve
transportation services presents a huge opportunity to transportation agencies although
the transition from the traditional database based approach to a big data based
enterprise approach won’t be an easy journey. The following recommendations to
transportation agencies are made based on this study:
o There is a need for DOT agencies to establish task forces to systematically
evaluate what kind of big data challenges they are facing and they will face. We
highly suggest transportation agencies to use the widely used NIST big data
framework to characterize their big data challenges.
50
o A general observation derived from this study is that the private sectors are
driving the innovations in big data. State DOTs do not have to find solutions by
their own. Public private partnership is the best pathway that can lead to rapid
development in this area.
o While transportation agencies collect a large variety and volume of data, much of
these data are not open data, meaning they are not available to the public. Data
sharing will certainly provide opportunities to developers and researchers, who
will in turn drive the innovations in this field.
o There is a need to educate transportation workforces and students on the
fundamentals of big data and develop dedicated education modules.
o It appears that there is no systematic cataloging of latest development of big data
applications in the transportation industry. Resources related to big data
development in the transportation sector are scattered and difficult to find.
Therefore, this is a need to establish a repository that shows the continuously
updated cutting edge development in this field.
o While there are big data-related funding opportunities available at the federal
level, these opportunities are scarce at the state DOT level. Given the differences
between states in demography, economy, climate, traffic condition, and
transportation assets, state funding for examining big data issues will be critical
in training state DoT employees and students, therefore forging a big data savvy
workforce.
51
REFERENCES Abrahams, A., Jiao, J., Wang, G. A., and Fan, W. (2012) “Vehicle Defect Discovery from
Social Media” Decision Support Systems 54, 87-97.
Al-Khouri, A. “ Data Ownership: Who Owns 'My Data?” International Journal of
Management & Information Technology, ISSN: 2278-5612 Volume 2, No 1,
November, 2012.
Byungik Ahn, Neuron machine: Parallel and pipelined digital neurocomputing
architecture, in: 2012 IEEE International Conference on Computational Intelligence
and Cybernetics (CyberneticsCom), 2012, pp. 143–147.
Anderson, C. (2008). The End of Theory: The Data Deluge Makes the Scientific Method
Xian, X., Chao, B., Feng, C. (2013) “An insight into traffic safety management system
platform based on cloud computing” 13th COTA International Conference of
Transportation Professionals (CICTP 2013), Social and Behavioral Sciences 96 (
2013 ) 2643 – 2646
Yiu, C. (2012). The Big Data Opportunity: Making government faster, smarter and more
personal.
Zeralli, J. and Strenberg, J. (2012) “Big Data: Wall Street Style” Strata Conference.
56
APPENDIX A – Introduction to Big Data – A first lesson to Civil Engineers
57
APPENDIX B – Big Data Workshop Agenda
Big Data for Transportation Infrastructure Management Workshop December 1, 2014
State Departments of Transportation and other transportation agencies collect vast quantities of data but managing, accessing and sharing data has been problematic and well documented. At the same time, asset management is described as a data driven process and a key element of asset management is using data to support decisions. Big data – data sets that are so large and complex that they are not easily manipulated with conventional database tools -- offers new opportunities to use data never previously considered to support asset management. The field of Big Data is rapidly maturing in capabilities, applications, and utility. This workshop will examine the role of big data and analytics in transportation infrastructure management. It will bring leaders from the R+D, practitioner, and end-user communities to examine and propose solutions to economic, legal, and technical barriers which currently hinder big data and analytics to be effectively used by transportation agencies. It will also look at the future of the big data technology and potential future applications.
1. Objective: A look to current and future role of big data and analytics in transportation infrastructure management. One shapes the other.
a. Jie Gong, Assistant Professor, Department of Civil and Environmental Engineering, Rutgers b. Sue McNeil, Professor, Department of Civil and Environmental Engineering, University of
Delaware c. Kevin P. Heaslip, Associate Professor, Department of Civil and Environmental Engineering,
Virginia Tech 5. Outcome:
a. Position paper on the emerging role of big data in transportation applications and barriers to effective use of big data for transportation infrastructure management.
b. Decision on whether an ongoing workgroup should pursue a specific theme. c. Decision on whether a second workshop should be held: objectives, theme,
attendees, and timing. 6. Attendees: a mélange of three communities: R+D, practitioners and end-users.
a. R+D community (those building next-gen hardware, software, apps): i. Academics ii. Industry
b. Practitioners (those generating/manipulating/using data): i. Government ii. Academics iii. Data collectors
c. End-users (those who make decisions based on underlying data, but do not know, nor need to know a thing about Big Data)
58
Big Data for Transportation Infrastructure Management Friday, December 5, 2014
8:30 AM – 9:00 AM Coffee and Registration
9:00 AM - 9:15 AM Welcome and Introduction Presenter: Ali Maher/Sue McNeil
9:15AM – 9:45 AM Keynote – Capture and Management of Transportation related Data Sets Presenter: Robert Sheehan, USDOT ITS JPO Multimodal Program Manager
9:45AM – 10:45AM Session 1: Overview of Big Data Technology and applications
9:45AM – 10:00AM
Role of Big Data in Inspection, Maintenance, and Management of Transportation Assets Presenter: Lee Tanase, Director Business Development, GeoStuct and Bridge, Bentley Systems, Incorporated
10:00AM – 10:15AM Building Computing Infrastructure for Big Data Applications Presenter: Manish Parashar, Director of Rutgers Discovery Informatics Institute, Co-Director NSF Cloud & Autonomic Computing Center
10:15 AM – 10:30AM Discussion – What is big data? Moderator: Sue McNeil
10:30 AM – 10:45AM Break
10:45AM – 12:00PM Session 2: Transportation Infrastructure Data Collection, Management, and Analysis
10:45AM – 11:00AM Traffic Data/ITS Data Presenter: Kevin P. Heaslip, Associate Professor, Department of Civil and Environmental Engineering, Virginia Tech
11:00AM – 11:15AM
Map 21-Performance Management: An Analytical Performance Measurement Approach Presenter: Konstantinos P Triantis, John Lawrence Professor, Department of Industrial and Systems Engineering, Virginia Tech
11:15AM – 11:30AM RABIT-A Robotic Bridge Deck Evaluation Tool Presenter: Nenad Gucunski, Professor and Chair, Department of Civil and Environmental Engineering, Rutgers University
11:30AM – 11:45AM
Asset Data Collection and Management – An data collection update on Long Term Bridge Performance Program Presenter: Hooman Parvardeh, LTBP, Center for Advanced Infrastructure and Transportation
11:45AM – 12:00PM Discussion – Do we have a big data problem in transportation? Moderator: Jie Gong
12:00 PM – 1:00 PM Lunch at the Busch Dining Hall in the Busch Student Center 1:00PM – 2:30PM Session 3: Big Data Applications in Transportation
1:00PM – 1:15PM Big Data and Bridge Health Modeling Zheng Yi Wu, Bentley Fellow, Bentley Systems, Incorporated
1:15PM – 1:30PM
Geospatial Big Data for Transportation Infrastructure Management during Normal and Extreme Events Presenter: Jie Gong, Department of Civil and Environmental Engineering, Rutgers
1:30PM – 1:45PM
Social Media Data/Geolocation Data for Improving Transportation Planning and Operation Presenter: Peter Jin, Department of Civil and Environmental Engineering, Rutgers
59
1:45PM – 2:00PM Discussion – What are the potentials and barriers for applying big data in transportation infrastructure management? Moderator: Kevin Heaslip
Big Data: Human Generated Data and Machine Generated Data
• Before 'hadoop' was in the scene, the machine
generated data was mostly ignored and not captured. It is because dealing with the volume was NOT possible, or NOT cost effective.
8/16/2016
3
Where does Big Data come from?
Sensor Data
Click Stream Data
Social Media Data
Databases
Examples of Big Data in the Real world
8/16/2016
4
Examples of Big Data in the Real world Quora www.quora.com/Data/Where-can-I-find-large-datasets-open-to-the-public
Research Pipeline http://www.researchpipeline.com/mediawiki/index.php?title=Main_Page
Google Public Data Directory http://www.google.com/publicdata/directory
InfoChimps InfoChimps market place
Stanford network data collection http://snap.stanford.edu/data/index.html
Open Flights http://openflights.org/
Flight arrival data http://stat-computing.org/dataexpo/2009/the-data.html
Natural Earth Data http://www.naturalearthdata.com/downloads/
National Institute of Health http://projectreporter.nih.gov/reporter.cfm
Aid information http://www.aidinfo.org/data
UN Data http://data.un.org/Explorer.aspx
Genomes data http://www.geonames.org/
US GIS Data http://libremap.org/
Google N-gram data google ngram
Stack Overflow data http://blog.stackoverflow.com/category/cc-wiki-dump/
US government data data.gov
UK government data data.gov.uk
US Patent and Trademark Office Filings www.google.com/googlebooks/uspto.html
World Bank Data http://datacatalog.worldbank.org/
Public Health Datasets http://phpartners.org/health_stats.html
Examples of Big Data in the Real world
8/16/2016
5
Example Big Data in Transportation
• Sensor data – Structural Health Monitoring data – Traffic data – WIM – Video logs
• Demographics – Trends – Household – Survey data
• Infrastructure – Inventory – Repair history and costs
• Natural Environment – Weather data – Tides – Air quality – Flow rates – Remote sensing data set - Terrain/LIDAR
• Safety performance data • Social media data • Geolocation data
Naturalistic Driving Study Dataset
• The result of the largest, most comprehensive naturalistic driving study (NDS) ever conducted by SHRP2 to monitor how drivers interact with their vehicles and the highway environment
• Statistics – 5.8 million trips from more than 3,100 participants in
6 study sites in U.S.
– 33 million travel miles
– 1.4 million driving hours
– 4 petabytes in size
8/16/2016
6
Naturalistic Driving Study Dataset
• Volunteers’ vehicles are heavily instrumented and record:
– vehicle location, forward radar, vehicle control positions, and many other data elements, including video of the forward roadway and of the driver’s face and hands.
Naturalistic Driving Study Dataset
MultipleVideos; front, rear, driver face and hands
Accelerometer data; 3 axis
GPS location – latitude, longitude, elevation, time, velocity
Forward radar – positions and velocities
Vehicle network data – speed, accelerator, brake, gear position, steering wheel angle, turn signals, horn, seat belt use, air bag deployment, etc.
Illuminance sensor
Infrared illumination
Incident push button
Turn signals
Cell phone calls – beginning and end times
Passive alcohol sensor
Driver assessment data – vision, cognition, health, medication, driving knowledge and history
Number of lanes
ane type and width
Grade
Cross s lope
Horizontal curvature: curve s tart, end, di rection, length, and radius
Lighting
Roadway Information Data
NDS Data
8/16/2016
7
Remote Sensing Data Sets
Remote Sensing Data Sets
• Open Lidar Data in Dutch (http://ahn2.pointclouds.nl/)
Big Data The bigger the picture, The less biased conclusion
8/16/2016
10
Challenges of Big Data • Sheer size of Big Data For a small company that is used to dealing with data in gigabytes, 10TB of data would be BIG. However for companies like Facebook and Yahoo, petabytes is big. Just the size of big data, makes it impossible (or at least cost prohibitive) to store in traditional storage like databases or conventional filers. Using traditional storage filers can cost a lot of money to store Big Data.
• Big Data is unstructured or semi structured A lot of Big Data is unstructured. For example clickstream log data might look like
<timestamp,user_id,page,referer_page>
Not many databases can
cope with storing
billions of rows of data
Lack of structure
makes relational
databases not well suited to store Big Data
Challenges of Big Data • No point in just storing big data, if we can't process it
Storing Big Data is part of the game. We have to process it to mine intelligence out of it. Traditional storage systems are pretty 'dumb' as in they just store bits
**They don't offer any processing power**
• The traditional data processing model
Solution
8/16/2016
11
What is Hadoop?
• Hadoop is an open source software stack that runs on a cluster of machines
• Hadoop provides distributed storage and distributed processing for very large data sets
1. Hadoop Distributed File System (HDFS)
2. Hadoop MapReduce
Why Hadoop? • The short answer is that it simplifies dealing
with Big Data
• The Hadoop framework has built-in power and flexibility to do what you could not do before
8/16/2016
12
Why Hadoop?
Data Sources
Data Cleansing
Data Repositories Front-end Analytics
Data Visualization
OLAP
Data Mining
Reporting
How Hadoop solves the Big Data problem
• Hadoop clusters scale horizontally
• Hadoop can handle unstructured / semi-structured data
• Hadoop clusters provides storage & computing
8/16/2016
13
What is HDFS ?
• Today's big data is 'too big' to store in ONE single computer • No matter how powerful it is and how much storage it has.
• This eliminates lot of storage system and databases that
were built for single machines.
• The file system will look like a unified single file system to the 'outside' world
Hadoop solution : Data is stored on
multiple computers (NODES!)
What is HDFS ?
• We want our system to be cost-effective, so we are not going to use 'expensive' machines.
• Hadoop solution : Run on commodity hardware
• Server class machines
These will be commodity servers that you can order from any of the vendors (Dell, HP, etc)
8/16/2016
14
What is HDFS ?
• Problem : Commodity hardware will fail • The approach we will take is we build the 'intelligence'
into the software.
• Hadoop solution : Software is intelligent enough to deal with hardware failure
• The software detects hardware failures and takes corrective actions automatically -- without human intervention. Our software will be smarter!
What is HDFS ?
• Hardware failure may lead to data loss
• Hadoop Solution : Replicate data
8/16/2016
15
What is HDFS ? • HDFS master / worker design
Master node co-ordinates all the worker nodes
What is HDFS ?
• In an HDFS cluster, there is ONE master node [Name Node (NN) ]and many worker nodes [Data Nodes (DN) ].
A B C
8/16/2016
16
Immutable File System – Read, Write, Sync/Flush – No Random writes
Storage Server used for Computation – Move Computation to Data
Fault Tolerant & Easy Management – Built in Redundancy, Tolerates Disk & Node Failure, Auto-Managing
Not a SAN but high bandwidth network access to data via Ethernet
Used typically to Solve problems not feasible with traditional systems
What is HDFS ?
What Map Reduce does for you?
• Organizes your multiple computers in a cluster in order to perform the calculations you need.
• Takes care of distributing the work between computers and of putting together the results of each computer's computation.
• Takes care of hardware and network failures, so that they do not affect the flow of your computation.
You, in turn… Have to break your problem into separate pieces which can be processed in parallel by multiple machines
I am not sure my company has a big data problem • No 'Big Data Problem‘? then Hadoop probably isn't the best fit for your company
• How much data is considered Big Data? It differs from company to company. For some companies, 10 TB of data would be considered Big Data; for others 1 PB would be Big Data If you don't have a 'Big Data problem' now … Is that because you are not capturing some data? Companies choose to NOT capturing data, because there wasn't a feasible way to store and process it.
Now that Hadoop can help with Big Data, it may be possible to start capturing data that wasn't captured before.
8/16/2016
19
How much does it cost to adopt Hadoop?
• Hardware Cost Hadoop runs on 'commodity' hardware.
Not cheap machines, they are server grade hardware.
Standing up a reasonably large Hadoop cluster, say 100 nodes, will cost a significant amount of money.
For example, lets say a Hadoop node is $5000, so a 100 node cluster would be $500,000 for hardware.
• IT and Operations costs A large Hadoop cluster will require support from various teams like :
Network Admins, IT, Security Admins, System Admins.
One needs to think about operational costs
like Data Center expenses : cooling, electricity,…
$3.3 million IBM Blue
Gene/P supercomputer with two
racks
capable of providing processing power
measured in teraflops One teraflop is the equivalent of one trillion floating-point operations
per second
Blue Gene/P runs on IBM PowerPC 450 processors in
a quad-core architecture
Harnessing Big Data for Business Insights
8/16/2016
20
Relationship between IT spending and revenue
Big Data Targets – Storage Infrastructure
Big Data Targets – Storage Infrastructure
8/16/2016
21
Real World Examples
Rise of Big Data Adoption
Real World Examples
Data Storage • NetApp collects diagnostic data from its storage systems deployed at
customer sites. This data is used to analyze the health of NetApp systems.
• Problem: NetApp collects over 600,000 data transactions weekly, consisting of unstructured logs and system diagnostic information. Tradional data storage systems proved inadequate to capture and process this data.
• Solution: A Cloudera Hadoop system captures the data and allows parallel processing of data.
• Hadoop Vendor: Cloudera • Cluster/Data size: 30+ nodes; 7TB of data / month
8/16/2016
22
Real World Examples (continue)
Financial Services • A leading retail bank is using Cloudera and Datameer to validate data accuracy
and quality to comply with regulations like Dodd-Frank
• Problem: The previous solution using Teradata and IBM Netezza was time consuming and complex, and the data mart approach didn’t provide the data completeness required for determining overall data quality.
• Solution: A Cloudera + Datameer platform allows analyzing trillions of records which currently result in approximately one terabyte per month of reports.
• Hadoop Vendor: Cloudera + Datameer • Cluster/Data size: 20+ nodes; 1TB of data / month
Real World Examples (continue)
Health Care • Storing and processing Medical Records
• Problem: A health IT company instituted a policy of saving seven years of
historical claims and remit data, but its in-house database systems had trouble meeting the data retention requirement while processing millions of claims every day
• Solution: A Hadoop system allows archiving seven years’ claims and remit data, which requires complex processing to get into a normalized format, logging terabytes of data generated from transactional systems daily, and storing them in CDH for analytical purposes
• Hadoop Vendor: Cloudera • Cluster/Data size: 10+ nodes pilot; 1TB of data / day
8/16/2016
23
Real World Examples (continue)
Health Care • Monitoring patient vitals at Los Angeles Childrens Hospital • Researchers at LA Childrens Hospital is using Hadoop to capture and
analyze medical sensor data.
• Problem: Collecting lots (billions) of data points from sensors / machines attached to the patients. This data was periodically purged before because storing this large volume of data on expensive storage was cost-prohibitive.
• Solution: Continuously streaming data from sensors/machines is collected and stored in HDFS. HDFS provides scalable data storage at reasonable cost.
• Hadoop Vendor: Unknown • Cluster/Data size: ???
Real World Examples (continue)
Human Sciences • NextBio is using Hadoop MapReduce and HBase to process massive
amounts of human genome data.
• Problem: Processing multi-terabyte data sets wasn't feasible using traditional databases like mysql.
• Solution: NextBio uses Hadoop map reduce to process genome data in batches and it uses HBase as a scalable data store
• Hadoop Vendor: Intel
8/16/2016
24
Real World Examples (continue)
Telecom • China Telecom Guangdong • Problem: Storing billions of mobile call records and providing real time
access to the call records and billing information to customers. Traditional storage/database systems couldn't scale to the loads and provide a cost effective solution
• Solution: Hbase is used to store billions of rows of call record details. 30TB
Telecom • Nokia • Nokia collects and analyzes vast amounts of data from mobile phones
• Problem:
(1) Dealing with 100TB of structured data and 500TB+ of semi-structured data (2) 10s of PB across Nokia, 1TB / day
• Solution: HDFS data warehouse allows storing all the semi/multi structured data and offers processing data at petabyte scale
• Hadoop Vendor: Cloudera • Cluster/Data size:
(1) 500TB of data (2) 10s of PB across Nokia, 1TB / day
8/16/2016
25
Real World Examples (continue)
Travel • Orbitz
• Problem: Orbitz generates tremendous amounts of log data. The raw logs
are only stored for a few days because of costly data warehousing. Orbitz needed an effective way to store and process this data, plus they needed to improve their hotel rankings.
• Solution: A Hadoop cluster provided a very cost effective way to store vast amounts of raw logs. Data is cleaned and analyzed and machine learning algorithms are run.
• Hadoop Vendor: ? • Cluster/Data size: ?
Real World Examples (continue)
Energy • Seismic Data at Chevron
• Problem: Chevron analyzes vast amounts of seismic data to find potential
oil reserves.
• Solution: Hadoop offers the storage capacity and processing power to analyze this data.
• Hadoop Vendor: IBM Big Insights • Cluster/Data size: ?
8/16/2016
26
Real World Examples (continue)
Energy • OPower • Opower works with utility companies to provide engaging, relevant, and
personalized content about home energy use to millions of households.
• Problem: Collecting and analyzing massive amounts of data and deriving insights into customers' energy usage.
• Solution: Hadoop provides a single storage for all the massive data and machine learning algorithms are run on the data.
• Hadoop Vendor: ? • Cluster/Data size: ?
Real World Examples (continue)
Logistics • Trucking data @ US Xpress • US Xpress - one of the largest trucking companies in US - is using Hadoop
to store sensor data from their trucks. The intelligence they mine out of this, saves them $6 million / year in fuel cost alone.
• Problem: Collecting and and storing 100s of data points from thousands of trucks, plus lots of geodata.
• Solution: Hadoop allows storing enormous amount of sensor data. Also Hadoop allows querying / joining this data with other datasets.
• Hadoop Vendor: ? • Cluster/Data size: ?
8/16/2016
27
Get more detailed… Movie Recommendation Engine
Example
Movie Recommendation Engine
• Predicting list of new items a user would like based on preferences of previous items
8/16/2016
28
Movie Recommendation Flowchart
𝑆 × 𝑈 = 𝑅
Item1 Item2 Item3 Item4 Item5 Item6
Item1 1 4 2 0 1 2 Item1 2 Item1 11
Item2 4 1 1 3 1 6 Item2 1 Item2 14
Item3 2 1 1 5 3 0 Item3 0 Item3 19
Item4 0 3 5 1 2 7 Item4 0 Item4 12
Item5 1 1 3 2 1 1 Item5 4.5 Item5 8
Item6 2 6 0 7 1 1 Item6 0 Item6 15
× =
Similarity Matrix
ejk value: Frequency of their co-ocurance (j-th item is seen, the k-th item is seen as well)
j
k
User’s Preference Vector Each cell represents the user’s preference for j-th item
Recommendation Vector Prediction of recommendation of the j-th item for the user
• Item3 • Item6 • Item4
Recommendations
8/16/2016
29
Why Map Reduce
• Large DATASET
• Problem can be easily split into independent subtasks that can be processed in parallel.
• We are dealing with UNSTRUCTURED data
• It is attractive because it allows a programmer to write software for execution on a computing cluster with little knowledge of parallel or distributed computing.
Map Reduce Phases
1 • Generating List of ItemIDs
2 • Create Preference Vector
3 • Count Unique Users
4 • Transpose Preferences Vectors
5 • Create Similarity Matrix
6 • Pre-partial multiply, Similarity Matrix
7 • Pre-partial multiply, Preferences
8 • Partial Multiply
9 • Filter Items
10 • Aggregate and Recommend
Para
llel C
om
pu
tin
g
8/16/2016
30
The Apache Mahout™ machine learning is built on top of HADOOP (It includes: classification, regression, evolutionary algorithms, and recommenders) Mahout’s recommender engine transforms an expected input format into predicted recommendations
userID,itemID[,preference[,timestamp]]
.
.
.
.
.
.
.
.
.
1 [845:5.0,550:5.0,546:5.0,25:5.0,531:5.0]
2 [546:5.0,288:5.0,11:5.0,25:5.0,531:5.0]
3 [137:5.0,284:5.0,508:4.8,248:4.8,285:4.8]
4 [748:5.0,1296:5.0,546:5.0,568:5.0,538:5.0]
5 [732:5.0,550:5.0,9:5.0,546:5.0,11:5.0]
6 [739:5.0,9:5.0,546:5.0,11:5.0,25:5.0]
Series of Map Reduce phases are used to accomplish predicting recommendations
Ten thousands
of Users
Unstructured Dataset
8/16/2016
31
8/16/2016
32
Type of Databases for Storing Big Data
Type Description Example Tools
Document-oriented Document-oriented data stores are mainly designed to store and
retrieve collections of documents or information and support
complex data forms in several standard formats, such as JSON,
XML, and binary forms (e.g., PDF and MS Word). A document-
oriented data store is similar to a record or row in a relational
database but is more flexible and can retrieve documents based
on their contents (e.g., MongoDB, SimpleDB, and CouchDB)
MongoDB; SimpleDB; CouchDB
Column-oriented A column-oriented database stores its content in columns aside
from rows, with attribute values belonging to the same column
stored contiguously. Column-oriented is different from classical
database systems that store entire rows one after the other
Google BigTable;
Graph database A graph database is designed to store and represent data that
utilize a graph model with nodes, edges, and properties related to
one another through relations
Neo4j
Key-value Key-value is an alternative relational database system that stores
and accesses data designed to scale to a very large size.
Apache HBase; Apache Cassandra;
Voldemort;
Big Data Analytic Tools Category Tools
Batch processing tools Apache Hadoop and MapReduce