42
Big Data Revolution Creating Transparency to Risk and Valuation January 28, 2015 Copyright © 2015 by Canary Analy5cs, Inc. All rights reserved.
| Date post: | 28-Jul-2015 |
| Category: |
Data & Analytics |
| Upload: | housecanary |
| View: | 421 times |
| Download: | 0 times |

Big Data Revolution Creating Transparency to Risk and Valuation
January 28, 2015
Copyright © 2015 by Canary Analy5cs, Inc. All rights reserved.

1
Introductions
Jeremy Sicklick Co-Founder & CEO
Chris Stroud Co-Founder & Chief of Research
Partner & Managing Director, The Boston
Consulting Group
• Led Real Estate – advised top builders,
developers & PE investors
• Prior - Arthur Andersen - CPA
Education
• MBA, The Wharton School, University of
Pennsylvania
• BS, University of Southern California –
Summa Cum Laude
PhD Candidate, Applied Statistics,
University of Texas at San Antonio
• Dissertation Topic – Dynamic Models of
Financial Risk
• Other Research Interests – Bayesian
Hidden Markov Models, Bayesian Decision
Theory, Dynamic Time Series
Education
• MA & BA, Economics, UC Santa Barbara
2
We build products that combine
proprietary data and predictive analytics
to help people make better real estate decisions.
2
2

HouseCanary Overview
3
The most objective, consistent, and
efficient way to appraise homes
The most advanced tool for
real estate professionals
NATIONAL HOME CONSTRUCTION DATABASE
Powered by
The data source for valuing and
appraising new construction
Launching Q4 2015
Patent pending

Big Data Is Growing Exponentially
4
Where We Are Going Where We Have Been
“If you recorded all human
communication from the dawn
of time to 2003, it takes up
about five billion gigabytes
(5,000 petabytes) of storage
space. Now we’re creating that
much data every 7 hours”
Every 7 hours
Source: IDC
6.12 10.87 21.61 40.03 2014 2016 2018 2020
7x…every hour
Data in millions of petabytes
‘Big Data’ will revolutionize real estate like it has other industries

5
Local and Macro Fundamentals
Housing Data
Capital & Credit Markets
Local Market &
Consumer Data
Household-Level
Appraiser Data
120M parcel level details geo-coded
Property details and valuation
• 900+ MLS
• 3,000+ County Assessors
Land supply available
Permits
Flood
Real Estate Is Big Data
Local jobs / employment
Construction jobs
Consumer flows in-out areas
Consumer equity vs. debt
Affordability components
Household net worth
Debt to income
Local economy (GMP)
Recession probability forecasts
Inflation measures
Schools
Crime
Housing Makeup
Livability / amenities
Career & Income
Commute times
Migration patterns
Potential demand
Family makeup
Education level
Rent vs owner
Comparable choices
Value adjustments
Key value drivers
C & Q ratings
Mortgage volume & mix
Mortgage health & delinquency
Homebuilder capital growth
Residential & Mortgage REIT indices
Construction materials futures
Mortgage yields & spreads
Mortgage Debt, ARM, RMBS growth
20,000 home price indices
Sales volume
New starts
Foreclosures
Months supply
Market clusters
Market risk scores
Single vs. multi-family mix
Rent versus own economics

6
Huge volumes of data
may be compelling at first glance,
but without an interpretive
structure they are meaningless.

Great Applications of Big Data are Simple & Powerful
7
Millions of Data Points
+
Predictive Analytics
+
Industry Expertise
+
Simple User Interfaces Transformed Government Intelligence
Common Elements
Understand Weather Data & Forecasts
Transformed Global Search

Big Data Can Augment Human Intellect, Not Replace It
8
Computers Are Less Equipped to Understand Subjective Things
Computers Can Run Large Quantities of Known Calculations
Google Image recognition output as of 11/2014
Stress simulation, 3D CAD model

9
Go to PollEverywhere.com/HCCRN
How well do current data and tools empower you to make better decisions, consistently as an appraiser? o Extremely well
o Ok, but opportunities to improve
o Far below expectations
1

10
1
Source: CRN conference attendee survey, 1/28/2015; N=50
How well do current data and tools empower you to make better
decisions, consistently as an appraiser?
Percent of respondents
Answer: Majority See Opportunity to Improve
18
64
18
-
10
20
30
40
50
60
70
Extremely well Ok, but opportunities to improve
Poorly

Problem: Issues Appraisers Face Today
11
Inefficient Takes 6 hours on average to appraise a property
• Data is fragmented
• Re-keying necessary
• Lack of tools to help with analytics of valuation and risk
Costs $1,000+ through lifecycle of loan
• To review inputs
• To review calculations, approaches and adjustments
• To defend repurchase demands
Focus on re-describing property as opposed to valuing it
• Inefficient use of professional talent
• Not focused on measuring and communicating risk
• Not leveraging data and valuation techniques possible
Inconsistent
Not focused on value & risk

12
Go to PollEverywhere.com/HCCRN
What are the largest challenges facing the appraisal industry today? o Inefficient
o Inconsistent
o Not sufficiently focused on value & risk
o All of the above
2

13
2
Source: CRN conference attendee survey, 1/28/2015; N=50
What are the largest challenge facing the appraisal industry today?
Percent of respondents
32
26
16
4
22
0
5
10
15
20
25
30
35
Inconsistent Inefficient Insufficient focus on risk
Insufficient focus on future value
All of the above
Answer: Consistency, Efficiency are Largest Pain Points

Solution: Apply a Tested Formula
14
Millions of Data Points
+
Predictive Analytics
+
Industry Expertise
+
Simple User Interfaces
Common Elements

Case Examples
15
1 Understand the market and market risk
2 Understand property details and risk
3 Better value collateral and risk
Understand the market and market risk
Case Study 1
16

A–F Submarket Clustering Grading Submarkets
Case Study 1: Market Cluster and Inherent Risk
17
Areas of Focus
Across 20,000 zip codes we cluster markets
Several factors together used to cluster
• Home price • Income & wealth • School scores • Crime level • Owner / rental mix • Commutability
“A’s” move earlier in the cycle with lower overall volatility
How does this help me make better appraisal decisions
Objectively measure risk / volatility of a market

Case Study 1: Buyer vs. Seller Market
18
Buyer’s – Seller’s Market Scores Areas of Focus
Insights on market environment to support value
• Seller’s market – higher probability to reconcile at higher end of range
• Buyer’s market – higher probability to reconcile at lower end of range
How does this help me make better appraisal decisions
Combine factors to summarize market environment
Long time-series of data (ie, decade+) to understand where we are currently
Transparency to underlying drivers

Case Study 1: Market Risk & Affordability
19
Risk Score
Insight on market risk to support value
• Low market risk– reconcile at higher end of range
• High market risk – reconcile at lower end of range
How does this help me make better appraisal decisions
Areas of Focus
Quantified risk score – probability of future downturn (eg, FICO score for real estate)
• Leverage HC predictive analytics for 20,000+ zip codes
Drivers of risk – price, affordability, velocity

Case Study 1: Potential Consumer Demand vs Supply
20
Will become critical at a local level
• As affluent baby boomers downsize
• Interest rates rise
• Ensure sufficient depth of demand to support value at price level by local area
How does this help me make better appraisal decisions
Areas of Focus
Potential demand vs supply
Understand depth of potential buyers who can make down payment & DTI in market versus supply at that price point
Potential Demand by Price / Age

Case Study 1: Understand the Market with Aerial Imagery
21
Market insights to support value
• Nearby beneficial / adverse affects to value
• Holistic view of area at time of appraisal
How does this help me make better appraisal decisions
Areas of Focus
Current imagery (less than 1 month old)
View to new public works, new supply
Nearby drivers of value – positive and negative
Up-to-Date Satellite Imagery
Beta

22
Go to PollEverywhere.com/HCCRN
What is most critical to you to better understand the market and market risk? o Market Risk Clusters & Inherent Local Risk
o Buyer vs. Seller Market summary
o Future Market Risk Score
o Potential Consumer Demand v. Supply
o Up-to-Date Aerial Imagery
o All of the Above are Equally Critical
3

23
3
Source: CRN conference attendee survey, 1/28/2015; N=44
What is most critical to you to better understand the market and
market risk? Percent of respondents
Answer: Broad Interest in Tools to Understand Market Risk
32
20 20
14
0
14
-
5
10
15
20
25
30
35
Potential consumer
demand vs. supply
Market clusters with similar risk
Market risk score
Buyer vs. Seller's market rating
Up-to-date aerial
imagery
All of the above

Understand property details and risk
Case Study 2
24
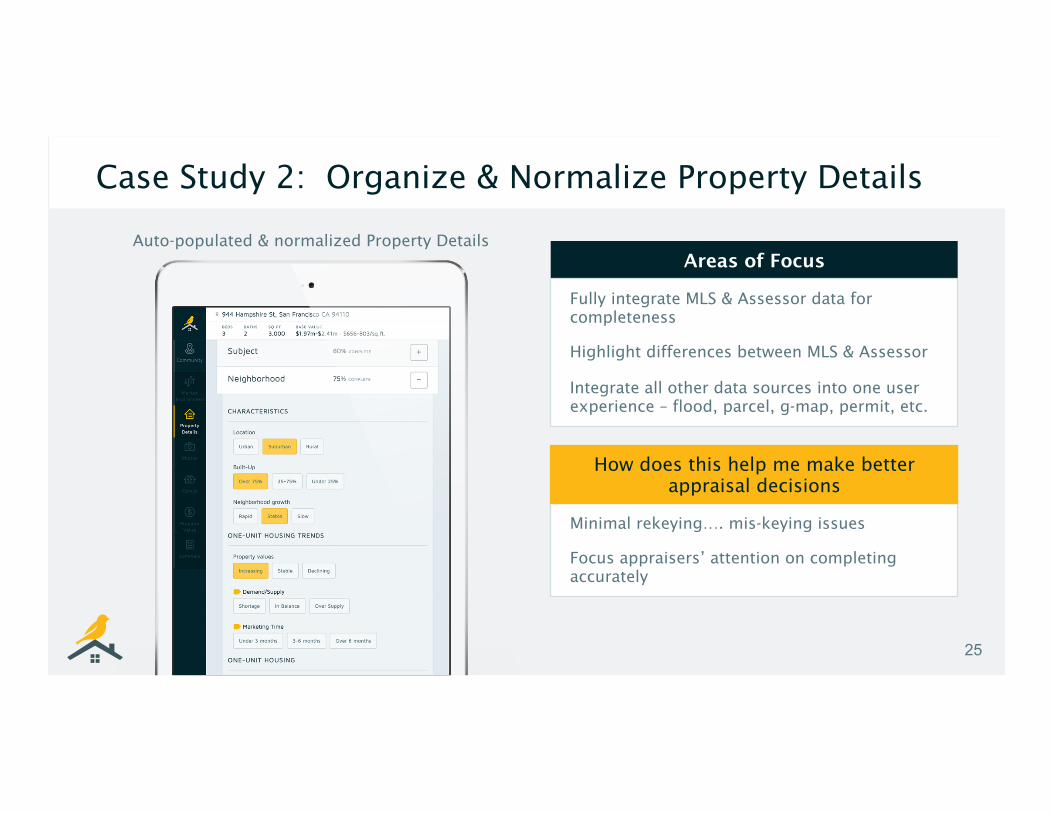
Case Study 2: Organize & Normalize Property Details
25
Auto-populated & normalized Property Details
Minimal rekeying…. mis-keying issues
Focus appraisers’ attention on completing accurately
How does this help me make better appraisal decisions
Areas of Focus
Fully integrate MLS & Assessor data for completeness
Highlight differences between MLS & Assessor
Integrate all other data sources into one user experience – flood, parcel, g-map, permit, etc.

Case Study 2: ‘Smart’ Property Details
26
Highlight changes from prior appraisal
Gauge how others measure C & Q to create a consistent view on a subjective measures
How does this help me make better appraisal decisions
Areas of Focus
Transparency to C & Q ratings across time for noted property
Crowd-sourced understanding of (similar) property’s C & Q rating
Natural language processing to identify and manage data points about subject and comps
Suggested Condition/Quality Ratings

Case Study 2: New Insights on the Property
27
Sales History & Permit Data
Integrated insights on property to support value
Understand consistency of property to area overall
How does this help me make better appraisal decisions
Areas of Focus
Full sales history
Full integration of permits
Plat map of full lot details
Consistency of property to local market

28
Go to PollEverywhere.com/HCCRN
What is most critical to you to better understand property details? o Normalized Property Details that Auto-populate
o “Smart” Details such as C & Q Ratings
o New Insights on Property such as Permits
o All of the Above are Equally Critical
4

29
4
Source: CRN conference attendee survey, 1/28/2015; N=40
• What is most critical to you to better understand property details? Percent of respondents
Answer: Interest in Tools to Improve Property Details
25
13 8
55
-
10
20
30
40
50
60
Normalized property details
that auto-populate
New insights on property such as
permits
"Smart" details such as C & Q
ratings
All of the above

Better value collateral and risk
Case Study 3
30

Case Study 3: Objective Comparability Score
31
Comp Similarity Scores
Objectively derived comparable sales
Brings sales price to current, critical in fast changing markets
How does this help me make better appraisal decisions
Areas of Focus
Objectively derived multi-variate similarity score
Leverage NLP, location data to identify additional characteristics eg, granite, view, remodeled, etc.
Sales price recalculated to current value using 20,000 proprietary zip code price indices
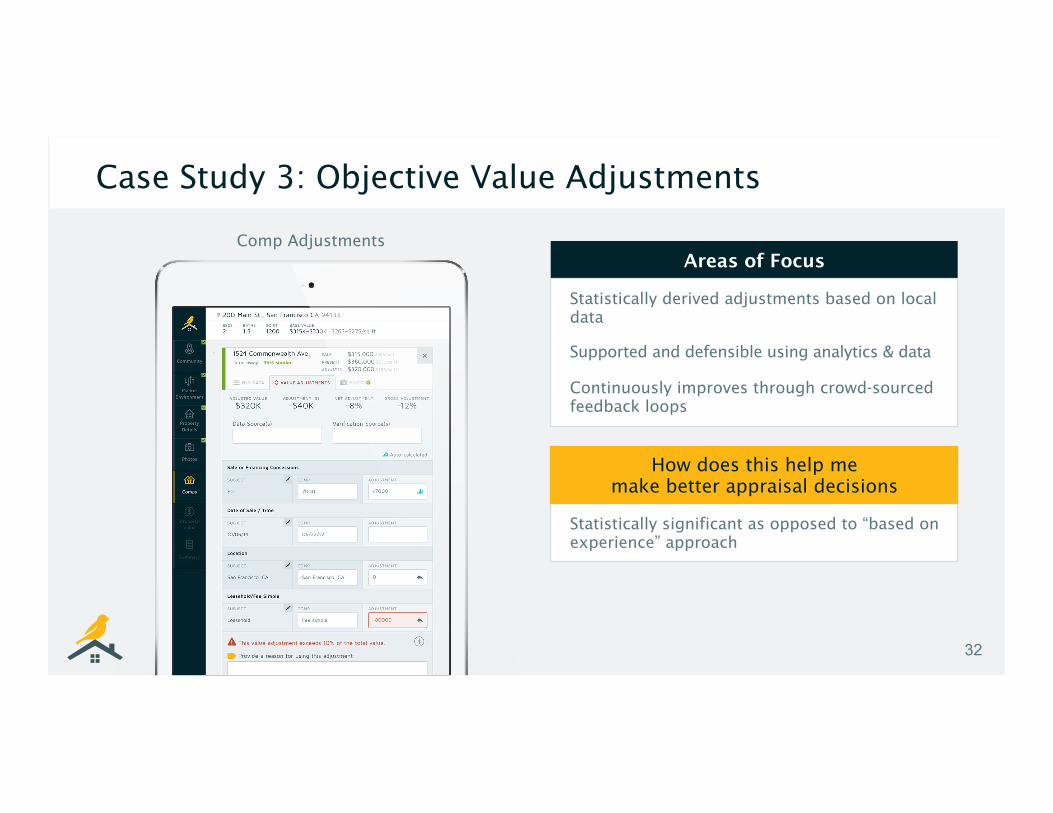
Case Study 3: Objective Value Adjustments
32
Comp Adjustments
Statistically significant as opposed to “based on experience” approach
How does this help me make better appraisal decisions
Areas of Focus
Statistically derived adjustments based on local data
Supported and defensible using analytics & data
Continuously improves through crowd-sourced feedback loops

Case Study 3: Key Value Drivers
33
Value Drivers
Clearly communicate key drivers of value for property and surrounding properties
Identify impact of key drivers to value
How does this help me make better appraisal decisions
Areas of Focus
Identifies key drivers of value
Hierarchy of value drivers
Quantification of value drivers through feedback loops

Case Study 3: Big Data Value Reconciliation
34
Value Reconciliation
Supports appraiser with holistic view
• Valuation
• Risk
How does this help me make better appraisal decisions
Areas of Focus
Define value range from 100+ comparable properties as opposed to 3
Identify market risk and reconciliation range

35
Go to PollEverywhere.com/HCCRN
What is most critical to you to improve property valuation? o Objective Comparability Score
o Objective Value Adjustments
o Key Value Driver Identification
o Big Data Value Reconciliation
o All of the Above are Equally Critical
5

36
5
Source: CRN conference attendee survey, 1/28/2015; N=35
What is most critical to you to improve property valuation?
Percent of respondents
Answer: Interest in Several Tools to Help with Valuation
23 20
11
0
46
-
5
10
15
20
25
30
35
40
45
50
Objective value adjustments
Key value driver identification
Regression-based value
reconciliation
Objective similarity score
All of the above

The Power of Big Data Are In the Feedback Loops
37
Integrated NHCD Tool Better Appraisal
Data & Analytics
Better Valuation &
Risk Accurate & Informative Appraisals
Industry Credibility • Consumers • Lenders • Investors
Better Appraisals

38
Our team is hard at work building products for you.
39
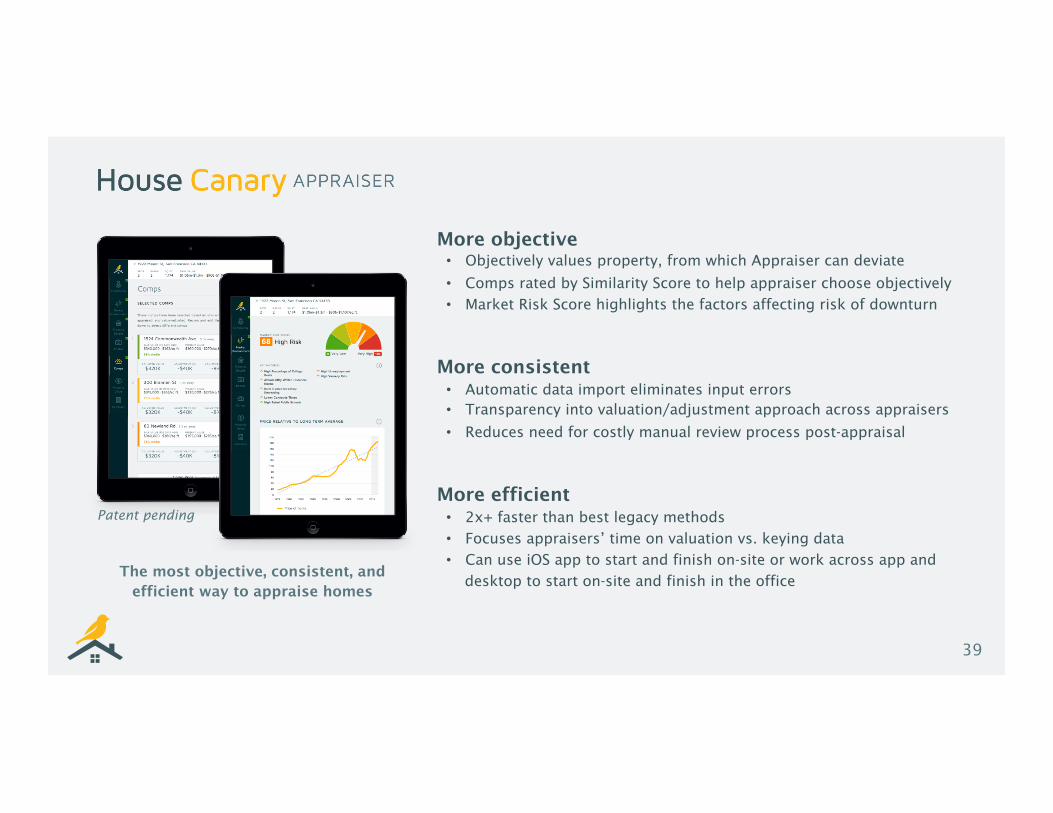
More objective • Objectively values property, from which Appraiser can deviate
• Comps rated by Similarity Score to help appraiser choose objectively
• Market Risk Score highlights the factors affecting risk of downturn
More consistent • Automatic data import eliminates input errors • Transparency into valuation/adjustment approach across appraisers
• Reduces need for costly manual review process post-appraisal
More efficient • 2x+ faster than best legacy methods
• Focuses appraisers’ time on valuation vs. keying data
• Can use iOS app to start and finish on-site or work across app and
desktop to start on-site and finish in the office
Patent pending
The most objective, consistent, and efficient way to appraise homes
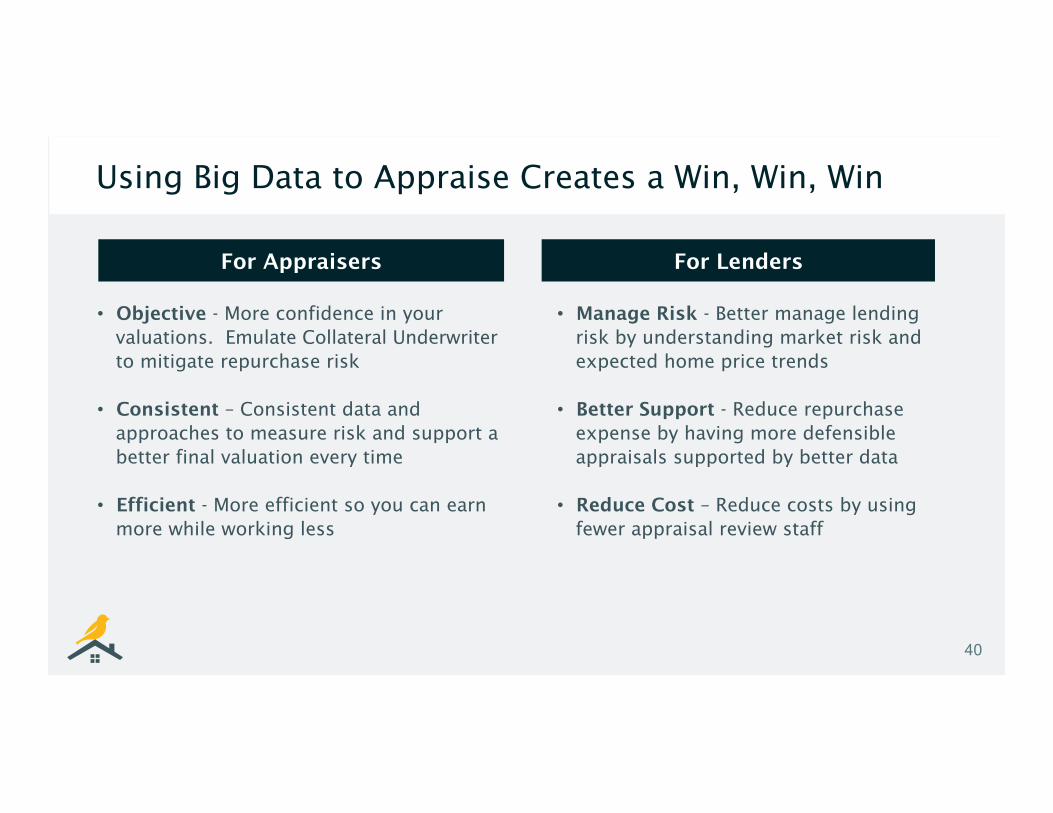
• Objective - More confidence in your valuations. Emulate Collateral Underwriter to mitigate repurchase risk
• Consistent – Consistent data and approaches to measure risk and support a better final valuation every time
• Efficient - More efficient so you can earn more while working less
• Manage Risk - Better manage lending risk by understanding market risk and expected home price trends
• Better Support - Reduce repurchase expense by having more defensible appraisals supported by better data
• Reduce Cost – Reduce costs by using fewer appraisal review staff
Using Big Data to Appraise Creates a Win, Win, Win
40
For Appraisers For Lenders

Jeremy Sicklick
Co-Founder & CEO
HouseCanary, Inc.
300 Brannan St. #501
San Francisco, CA 94107
office: +1-866-729-7770
mobile: +1-213-422-2577
email: [email protected]
The Time Is Right For a New Way to Appraise
We Want to Hear Your Comments, Feedback, etc.
Slide Deck With Responses Posted to housecanary.com/news
41


