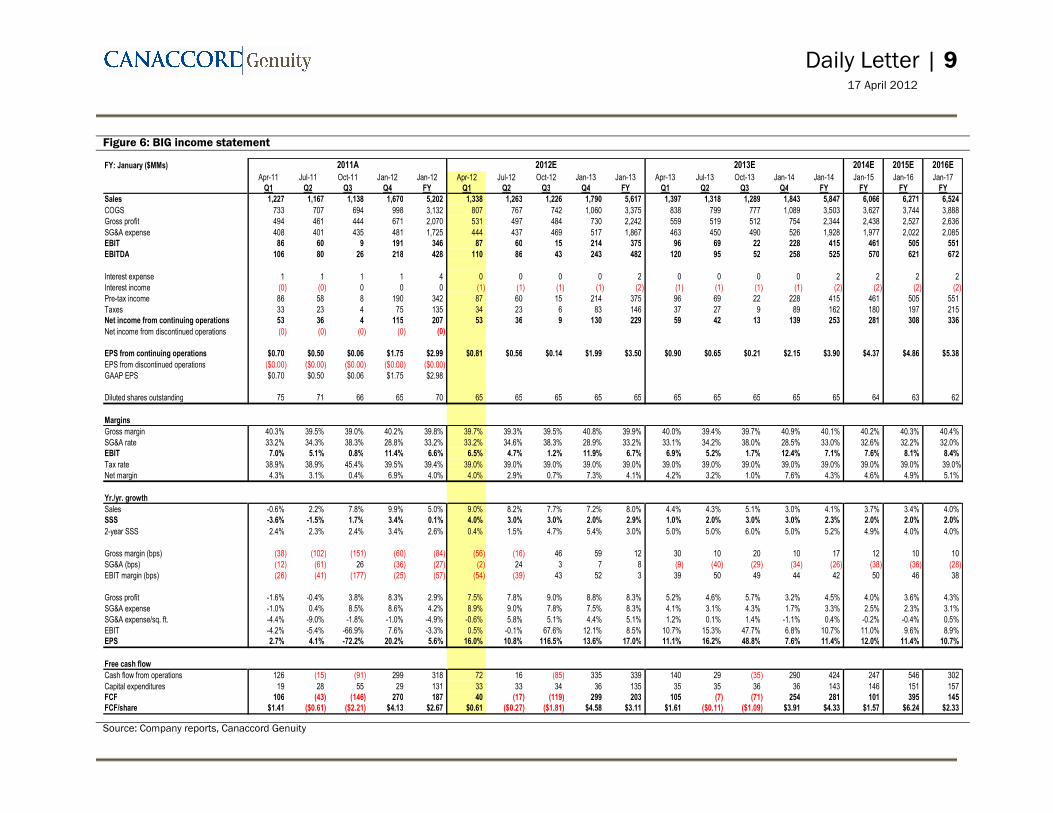
Daily Letter | 1 17 April 2012 Canaccord Canaccord Canaccord Canaccord Genuity Genuity Genuity Genuity is the global capital markets group of Canaccord Financial Inc. (CF : TSX | CF. : AIM) is the global capital markets group of Canaccord Financial Inc. (CF : TSX | CF. : AIM) is the global capital markets group of Canaccord Financial Inc. (CF : TSX | CF. : AIM) is the global capital markets group of Canaccord Financial Inc. (CF : TSX | CF. : AIM) The recommendations and opinions expressed in this Investment Research accurately reflect the Investment Analyst’s personal, The recommendations and opinions expressed in this Investment Research accurately reflect the Investment Analyst’s personal, The recommendations and opinions expressed in this Investment Research accurately reflect the Investment Analyst’s personal, The recommendations and opinions expressed in this Investment Research accurately reflect the Investment Analyst’s personal, indepe indepe indepe independent and objective views about any and all the Designated Investments and Relevant Issuers discussed herein. For important ndent and objective views about any and all the Designated Investments and Relevant Issuers discussed herein. For important ndent and objective views about any and all the Designated Investments and Relevant Issuers discussed herein. For important ndent and objective views about any and all the Designated Investments and Relevant Issuers discussed herein. For important information, please see the Important Disclosures section in the appendix of this document or visit Canaccord Genuity’s Online Disclosure Database . Big Lots BIG : NYSE : US$45.32 BUY Target: US$58.00 Laura Champine, CFA Laura Champine, CFA Laura Champine, CFA Laura Champine, CFA 212.389.8056 [email protected]Jason Smith Jason Smith Jason Smith Jason Smith 212.389.8059 [email protected]COMPANY STATISTICS: 52-week Range: 28.89 - 47.22 Market Cap (M): US$2,963.8 Shares Out (M): 65 EARNINGS SUMMARY: FYE Jan FYE Jan FYE Jan FYE Jan 2011A 2011A 2011A 2011A 2012E 2012E 2012E 2012E 2013E 2013E 2013E 2013E P/Sales (x): 0.6x 0.5x 0.5x Revenue (M): 5,202.3 5,617.5 5,846.8 EPS: 2.99 3.50 3.90 P/E (x): 15.2x 13.0x 11.6x Revenue (M): Revenue (M): Revenue (M): Revenue (M): Q1 1,227.3 1,337.5 1,396.6 Q2 1,167.1 1,263.4 1,317.7 Q3 1,138.3 1,226.3 1,289.3 Q4 1,669.6 1,790.3 1,843.2 Total 5,202.3 5,617.5 5,846.8 EPS: EPS: EPS: EPS: Q1 0.70 0.81 0.90 Q2 0.50 0.56 0.65 Q3 0.06 0.14 0.21 Q4 1.75 1.99 2.15 Total 2.99 3.50 3.90 SHARE PRICE PERFORMANCE: Source: Interactive Data Corporation COMPANY DESCRIPTION: BIG is the nation's largest broadline closeout retailer, operating approximately 1,450 stores in the U.S. and 82 in Canada. BIG offers brand-name closeouts from over 3,000 manufacturers. The product assortment includes consumables, furniture, home furnishings, seasonal, and electronics. All amounts in US$ unless otherwise noted. Consumer & Retail -- Specialty Retail DEEP DIVE: WE EXPECT PRODUCT INITIATIVES TO DRIVE SALES MOMENTUM AT BIG Investment recommendation We believe BIG’s improving product assortment will drive traffic and support the company’s SSS momentum. The company should benefit from efforts to shift sales mix to higher-demand categories, broadening its selection of consumables and underpenetrated discretionary segments. At 13x our FY12 EPS estimate and 6x FY12E EV/EBITDA, we don’t believe shares fully reflect the SSS growth we are projecting in FY12 and beyond. We believe BIG would only need to generate SSS growth in the LSD range to achieve the significant upside potential we project. Investment highlights • We estimate BIG will generate FY12 SSS growth of 2.9% on top of +0.1%, which would be the company’s highest full-year increase since FY06. • We forecast double-digit bottom-line growth in FY12 and expect EPS to increase at a five-year CAGR of 12%. • Shares trade at only 13x our FY12 EPS estimate and 6x FY12E EV/EBITDA. BIG trades at lower multiples than its discounter retail peers despite above-average FY12 growth prospects.
Transcript
Daily Letter | 1 17 April 2012
Canaccord Canaccord Canaccord Canaccord GenuityGenuityGenuityGenuity is the global capital markets group of Canaccord Financial Inc. (CF : TSX | CF. : AIM) is the global capital markets group of Canaccord Financial Inc. (CF : TSX | CF. : AIM) is the global capital markets group of Canaccord Financial Inc. (CF : TSX | CF. : AIM) is the global capital markets group of Canaccord Financial Inc. (CF : TSX | CF. : AIM)
The recommendations and opinions expressed in this Investment Research accurately reflect the Investment Analyst’s personal, The recommendations and opinions expressed in this Investment Research accurately reflect the Investment Analyst’s personal, The recommendations and opinions expressed in this Investment Research accurately reflect the Investment Analyst’s personal, The recommendations and opinions expressed in this Investment Research accurately reflect the Investment Analyst’s personal, indepeindepeindepeindependent and objective views about any and all the Designated Investments and Relevant Issuers discussed herein. For important ndent and objective views about any and all the Designated Investments and Relevant Issuers discussed herein. For important ndent and objective views about any and all the Designated Investments and Relevant Issuers discussed herein. For important ndent and objective views about any and all the Designated Investments and Relevant Issuers discussed herein. For important iiiinnnnffffoooorrrrmmmmaaaattttiiiioooonnnn,,,, pppplllleeeeaaaasssseeee sssseeeeeeee tttthhhheeee IIIImmmmppppoooorrrrttttaaaannnntttt DDDDiiiisssscccclllloooossssuuuurrrreeeessss sssseeeeccccttttiiiioooonnnn iiiinnnn tttthhhheeee aaaappppppppeeeennnnddddiiiixxxx ooooffff tttthhhhiiiissss ddddooooccccuuuummmmeeeennnntttt oooorrrr vvvviiiissssiiiitttt CCCCaaaannnnaaaaccccccccoooorrrrdddd GGGGeeeennnnuuuuiiiittttyyyy’’’’ssss OOOOnnnnlllliiiinnnneeee DDDDiiiisssscccclllloooossssuuuurrrreeee DDDDaaaattttaaaabbbbaaaasssseeee....
Big Lots
BIG : NYSE : US$45.32 BUY
Target: US$58.00
Laura Champine, CFALaura Champine, CFALaura Champine, CFALaura Champine, CFA 212.389.8056
Source: Interactive Data Corporation COMPANY DESCRIPTION: BIG is the nation's largest broadline closeout retailer, operating approximately 1,450 stores in the U.S. and 82 in Canada. BIG offers brand-name closeouts from over 3,000 manufacturers. The product assortment includes consumables, furniture, home furnishings, seasonal, and electronics. All amounts in US$ unless otherwise noted.
Consumer & Retail -- Specialty Retail
DEEP DIVE: WE EXPECT PRODUCT INITIATIVES TO DRIVE SALES MOMENTUM AT BIG Investment recommendation
We believe BIG’s improving product assortment will drive traffic and support the company’s SSS momentum. The company should benefit from efforts to shift sales mix to higher-demand categories, broadening its selection of consumables and underpenetrated discretionary segments. At 13x our FY12 EPS estimate and 6x FY12E EV/EBITDA, we don’t believe shares fully reflect the SSS growth we are projecting in FY12 and beyond. We believe BIG would only need to generate SSS growth in the LSD range to achieve the significant upside potential we project.
Investment highlights
• We estimate BIG will generate FY12 SSS growth of 2.9% on top of +0.1%, which would be the company’s highest full-year increase since FY06.
• We forecast double-digit bottom-line growth in FY12 and expect EPS to increase at a five-year CAGR of 12%.
• Shares trade at only 13x our FY12 EPS estimate and 6x FY12E EV/EBITDA. BIG trades at lower multiples than its discounter retail peers despite above-average FY12 growth prospects.
WE BELIEVE AN IMPROVED ASSORTMENT WILL DRIVE TRAFFIC AND SUPPORT SSS MOMENTUM In May 2011 BIG bolstered its merchandising team by hiring Doug Wurl to serve as EVP of merchandising. Wurl brought a wealth of merchandising experience, having served as general merchandise manager of Sears’ home division for over four years and in leadership positions at Shopko and Macy’s in the years prior. Wurl’s impact on the company’s merchandising strategies and product assortment can already be seen in his short time as GMM. Since his arrival, BIG has taken a more aggressive approach to its closeout strategy, which has enabled it to broaden its product assortment, specifically in consumables. According to management, Wurl has been able to garner better deals from vendors on a more-consistent basis than the company had in the past. BIG has also added more upscale vendors to its roster and has expanded the breadth of its global sourcing. BIG has become more competitive in its pricing strategy, which we believe will continue to drive traffic as budget-conscious shoppers seek out values. Additional changes include a narrower focus on the merchandising schedule, with planning throughout the year now completed in nine-week increments, similar to how the company had previously planned for its Christmas assortment.
The consumables segment is BIG’s largest product category, accounting for 31% of total sales. BIG continued to improve its product assortment throughout FY11, specifically adding a more consistent mix of consumables. BIG has expanded its consumables assortment to include more gourmet and specialty items. BIG has also heightened its focused on improving marketing and in-store execution, including more prevalent signage and the addition of the “Wall of Values” which highlights deals within consumables. Closeout remains the focus within consumables, making up about 70%-80% on average of the total assortment. BIG has broadened its SKU base, which we believe will add some stability in the category. Management commented that an expanded selection of gourmet products and European imports have been well received by consumers. The Fresh Finds captive label program was expanded in Q3, and it continues to resonate with customers. BIG’s captive label brands are developed jointly with various domestic and overseas manufacturers, using a well-respected third party to help develop the line. BIG has been able to generate brand identity and as a result pricing power with some of its captive label products. Sales trends improved in the consumables category in FY11, with comparable sales up in the mid- to high-single-digit range in the final three quarters of the year. We believe an improved consumables assortment was largely responsible for BIG’s SSS recovery in H2/11. We expect a broader mix of basics and the addition of specialty items and more captive label brands to drive traffic into stores in 2012.
Daily Letter | 3 17 April 2012
Figure 1: An improved consumables assortment helped generate SSS momentum in FY11
Q1:11 Q2:11 Q3:11 Q4:11
Consumables yr./yr. growth 3.7% 8.2% 11.4% 9.5%
SSS -3.6% -1.5% 1.7% 3.4%
Source: Company reports
BIG should benefit from an improved product mix within its discretionary assortment as well. The company has shifted its product mix away from apparel and its traditional toy business, increasing inventory and allocating more floor space to better-performing categories. BIG offered a larger seasonal assortment in Q4, adding square footage to display trees and trim. This resulted in a comparable sales increase in the low double digits for the category. We believe the seasonal business sustained momentum in Q1, boosted by warmer weather and a high-quality product assortment that will resonate with shoppers. The seasonal business faces an easy Q1 comparison as difficult weather resulted in DD comparable sales declines in northern regions of the country in FY11.
The company is in the process of completing the expansion of its home business, specifically adding floor space for merchandise such as bedding and table top items to better leverage the strength of its furniture business. Management expects sales growth within the category to accelerate as FY12 progresses. Our recent store checks revealed an attractive assortment of seasonal and home inventory. It is notable the company’s new GMM has a wealth of experience in home, and we believe he has brought in buyers with whom he has worked in the past.
Electronics is a category BIG believes can excel beyond a seasonal business and be a full-year growth driver. Electronics turned in a strong performance in Q4 with comparable sales up nearly 20%, and management commented on the latest conference call that sales momentum has continued in Q1. We believe BIG will benefit from an increased inventory of popular products such as tablets, chargers, headphones and ear-buds, flash drives and memory cards, MP3 players, phone and tablet covers as well as other accessories for mobile devices. The focus here will be on low-end and discount models that will likely appeal to BIG shoppers. The company has not significantly expanded floor space for electronics, but the merchandise is receiving greater exposure in stores. As small items are taking the place of TVs, the company can significantly improve SKU range without needing to take square footage from other categories.
Daily Letter | 4 17 April 2012
Figure 2: FY11 sales mix by product category
Consumables31%
Home16%
Furniture17%
Hardlines & Other8%
Seasonal13%
Play 'n Wear15%
Category ProductsConsumables Food, health, beauty, plastics, paper, and petFurniture Upholstery, mattresses, ready-to-assemble and case goodsHome Domestics, stationary, and home decorativePlay n' Wear Electronics, toys, jewelery, infant, and apparelSeasonal Lawn and garden, Christmas, and summer assortmentsHardlines & Other Appliances, tools, and home maintenance
Source: Company reports, Canaccord Genuity
We expect BIG will generate more-consistent SSS growth in FY12. Our Q1 estimate calls for SSS growth of 4% on top of -3.6%. Management guided for Q1 SSS to be up 2%-4%, and the consensus estimate is 2.7%. For FY12, we forecast a SSS increase of 2.9% on top of +0.1%, which is a 40bps improvement in the two-year stacked SSS trend. This is at the high end of management’s guidance range of +2% to +3% and would represent BIG’s largest full-year SSS gain since FY06.
Daily Letter | 5 17 April 2012
Figure 3: We estimate BIG will generate consistent SSS growth in FY12
-6.0%
-4.0%
-2.0%
0.0%
2.0%
4.0%
6.0%
8.0%
Q1:07 Q1:08 Q1:09 Q1:10 Q1:11 Q1:12E
Yr./yr. SSS growth
Source: Company reports, Canaccord Genuity
WE FORECAST A GROSS MARGIN RECOVERY IN H2/12 BIG’s gross margin contracted 85bps in FY11, largely the result of more competitive pricing and the shift in sales mix to lower-margin consumable products. We believe consumables are in higher demand and turn faster in stores, which should translate to increased levels of store traffic as the assortment improves. The shift in mix within the discretionary businesses should help boost profit given the higher-margin nature of the home and furniture businesses. Lower markdown activity should also help drive margin expansion. Warmer weather should result in improved pricing yr./yr. within seasonal in H1, while BIG plans to lessen its reliance on the segment in Q3, given the high level of markdowns that were necessary in the October quarter in FY11. We forecast gross margin expansion of 60bps in H2/12 as an improved product assortment supports SSS gains and BIG begins to lap a period of higher markdown activity. We estimate BIG’s gross margin will expand 10bps in FY12 and increase 10bps-15bps annually in FY13-FY16.
WE ESTIMATE DOUBLE-DIGIT EPS GROWTH IN FY12 AND BEYOND Our Q1 forecast calls for operating EPS of $0.81, at the high end of management’s guidance range of $0.75-$0.81 and $0.02 above consensus. We project gross margin contraction of 55bps in Q1 as a result of the continued shift in mix to lower-margin consumables and more-competitive pricing. We forecast a flat SG&A expense rate with leverage on 4% SSS growth offset by higher depreciation
Daily Letter | 6 17 April 2012
and incentive costs. For FY12, we estimate EPS of $3.50. FY12 guidance is $3.40-$3.50, and the consensus estimate is $3.50 with a lower implied share count versus our model adding $0.04. We are projecting EPS to increase at a five-year CAGR of 12%.
CANADA APPEARS TO BE IMPROVING, BUT IT IS STILL IN THE EARLY STAGES OF ITS TURNAROUND In mid-2011 BIG completed the $20MM acquisition of Liquidation World, an 89-store closeout franchise in Canada. Our initial visit to three LW locations in Calgary shortly after the acquisition revealed obscure locations, dated buildings, and sparse inventory excluding a solid furniture assortment. BIG closed seven locations and invested $46MM in the Canadian business over H2:11 to build inventory, staff operations, and refurbish store locations. Q4 sales of $37MM came in $7MM above the high end of guidance, which management credited to a strong initial response to the introduction of new products and categories within stores. We view this as a positive sign given the limited assortment available through much of the quarter. Inventory ended FY11 at $22MM, and management plans to sustain levels in the $25MM to $30MM range. BIG expects to reach this level by Q2, but adjustments to product assortment will continue through Q3. Similar to the U.S., we expect BIG to shift its product mix to more in-demand items. This translates to a broader assortment of consumables, which we believe will be a healthy traffic driver. The Canadian operations will not likely see significant marketing support in FY12 as BIG is focused on testing store execution once shelves are fully stocked before launching any sizable marketing agenda.
For FY12 BIG guided for sales in Canada of $140MM-$150MM, up from $60MM over seven months in FY11. Guidance calls for the Canadian operations to be a drag on EPS of $0.21-$0.26 as BIG continues to build up inventory, recruit talent, and refurbish stores. Management indicated it was close to hiring a head merchant, which would largely complete the initial phase of its staffing efforts. Sales dollars are expected to increase and operating losses to decline sequentially throughout FY12 as inventory levels improve. BIG is targeting a breakeven bottom line by FY13.
BIG TRADES AT ATTRACTIVE MULTIPLES COMPARED WITH ITS DISCOUNT RETAIL PEERS We believe shares of BIG are currently undervalued, trading at approximately a 20% discount to peers. We think this discount is based on BIG’s inconsistent sales trends and expect the gap to close as the company reports improved SSS growth in 2012. Based on our FY12 EPS estimates, shares trade at 13x EPS and 6x EV/EBITDA, below the peer averages of 16x and 8x, respectively. We don’t believe the discount is warranted given our forecast for above-average growth in EPS.
Daily Letter | 7 17 April 2012
Figure 4: Shares trade below the peer group’s average
OUR DCF ANALYSIS INDICATES POTENTIAL FOR FURTHER SHARE-PRICE GAINS On our FY12 estimates, BIG shares currently trade at 11x FY12 EV/NOPAT, but our model suggests the stock should trade at a 14x multiple. This suggests BIG holds potential upside of over 25% in the next 12 months.
Daily Letter | 8 17 April 2012
Figure 5: Our discounted NOPAT model implies potential upside of over 25%
Our PT of $58 is based on our discounted NOPAT model. Shares currently trade at a FY12E EV/NOPAT multiple of 11x. Our model suggests BIG should trade at a multiple of 14x. Assuming shares approach their intrinsic value over the next 12 months, BIG offers potential upside of over 25% over its current price. Based on our FY12 estimates, shares currently trade at 13x EPS and 6x EV/EBITDA. Our PT implies multiples of 17x and 8x, respectively.
Investment risks
A slowdown in sales stemming from a product assortment that does not resonate with shoppers would pose a risk to our projections. Macroeconomic factors and extreme weather could also impact sales trends. Rising cost pressures could impact margins. The LW acquisition could require a greater capital investment to refurbish stores and replenish inventories than management anticipates.
Daily Letter | 11 17 April 2012
APPENDIX: IMPORTANT DISCLOSURES Analyst Certification: Each authoring analyst of Canaccord Genuity whose name appears on the front page of this investment
research hereby certifies that (i) the recommendations and opinions expressed in this investment research accurately reflect the authoring analyst’s personal, independent and objective views about any and all of the designated investments or relevant issuers discussed herein that are within such authoring analyst’s coverage universe and (ii) no part of the authoring analyst’s compensation was, is, or will be, directly or indirectly, related to the specific recommendations or views expressed by the authoring analyst in the investment research.
Site Visit: An analyst has visited the issuer's material operations in Columbus, Ohio. No payment or reimbursement was
received from the issuer for the related travel costs.
Price Chart:*
Distribution of Ratings: Global Stock Ratings (as of 2 April 2012)
BUY:BUY:BUY:BUY: The stock is expected to generate risk-adjusted returns of over 10% during the next 12 months. HOLD:HOLD:HOLD:HOLD: The stock is expected to generate risk-adjusted returns of 0-10% during the next 12 months. SELL:SELL:SELL:SELL: The stock is expected to generate negative risk-adjusted returns during the next 12 months. NOT RATED:NOT RATED:NOT RATED:NOT RATED: Canaccord Genuity does not provide research coverage of the relevant issuer. “Risk-adjusted return” refers to the expected return in relation to the amount of risk associated with the designated investment or the relevant issuer.
Risk Qualifier: SPECULATIVE:SPECULATIVE:SPECULATIVE:SPECULATIVE: Stocks bear significantly higher risk that typically cannot be valued by normal fundamental
criteria. Investments in the stock may result in material loss.
Daily Letter | 12 17 April 2012
Canaccord Research Disclosures as of 17 April 2012 CompanyCompanyCompanyCompany DisclosureDisclosureDisclosureDisclosure Big LotsBig LotsBig LotsBig Lots 5, 75, 75, 75, 7
1 The relevant issuer currently is, or in the past 12 months was, a client of Canaccord Genuity or its affiliated
companies. During this period, Canaccord Genuity or its affiliated companies provided the following services to the relevant issuer: A. investment banking services. B. non-investment banking securities-related services. C. non-securities related services.
2 In the past 12 months, Canaccord Genuity or its affiliated companies have received compensation for Corporate Finance/Investment Banking services from the relevant issuer.
3 In the past 12 months, Canaccord Genuity or any of its affiliated companies have been lead manager, co-lead manager or co-manager of a public offering of securities of the relevant issuer or any publicly disclosed offer of securities of the relevant issuer or in any related derivatives.
4 Canaccord Genuity acts as corporate broker for the relevant issuer and/or Canaccord Genuity or any of its affiliated companies may have an agreement with the relevant issuer relating to the provision of Corporate Finance/Investment Banking services.
5 Canaccord Genuity or any of its affiliated companies is a market maker or liquidity provider in the securities of the relevant issuer or in any related derivatives.
6 In the past 12 months, Canaccord Genuity, its partners, affiliated companies, officers or directors, or any authoring analyst involved in the preparation of this investment research has provided services to the relevant issuer for remuneration, other than normal course investment advisory or trade execution services.
7 Canaccord Genuity intends to seek or expects to receive compensation for Corporate Finance/Investment Banking services from the relevant issuer in the next six months.
8 The authoring analyst, a member of the authoring analyst’s household, or any individual directly involved in the preparation of this investment research, has a long position in the shares or derivatives, or has any other financial interest in the relevant issuer, the value of which increases as the value of the underlying equity increases.
9 The authoring analyst, a member of the authoring analyst’s household, or any individual directly involved in the preparation of this investment research, has a short position in the shares or derivatives, or has any other financial interest in the relevant issuer, the value of which increases as the value of the underlying equity decreases.
10 Those persons identified as the author(s) of this investment research, or any individual involved in the preparation of this investment research, have purchased/received shares in the relevant issuer prior to a public offering of those shares, and such person’s name and details are disclosed above.
11 A partner, director, officer, employee or agent of Canaccord Genuity and its affiliated companies, or a member of his/her household, is an officer, or director, or serves as an advisor or board member of the relevant issuer and/or one of its subsidiaries, and such person’s name is disclosed above.
12 As of the month end immediately preceding the date of publication of this investment research, or the prior month end if publication is within 10 days following a month end, Canaccord Genuity or its affiliate companies, in the aggregate, beneficially owned 1% or more of any class of the total issued share capital or other common equity securities of the relevant issuer or held any other financial interests in the relevant issuer which are significant in relation to the investment research (as disclosed above).
13 As of the month end immediately preceding the date of publication of this investment research, or the prior month end if publication is within 10 days following a month end, the relevant issuer owned 1% or more of any class of the total issued share capital in Canaccord Genuity or any of its affiliated companies.
14 Other specific disclosures as described above. Canaccord Genuity is the business name used by certain subsidiaries of Canaccord Financial Inc., including
Canaccord Genuity Inc., Canaccord Genuity Limited, Canaccord Genuity Securities LLC, and Canaccord Genuity Corp. The authoring analysts who are responsible for the preparation of this investment research are employed by Canaccord Genuity Corp. a Canadian broker-dealer with principal offices located in Vancouver, Calgary, Toronto, Montreal, or Canaccord Genuity Inc., a US broker-dealer with principal offices located in Boston, New York, San Francisco and Houston or Canaccord Genuity Securities LLC, a US broker-dealer with principal offices located in New York or Canaccord Genuity Limited., a UK broker-dealer with principal offices located in London and Edinburgh (UK). In the event that this is compendium investment research (covering six or more relevant issuers), Canaccord Genuity and its affiliated companies may choose to provide specific disclosures of the subject companies by
Daily Letter | 13 17 April 2012
reference, as well as its policies and procedures regarding the dissemination of investment research. To access this material or for more information, please send a request to Canaccord Genuity Research, Attn: Disclosures, P.O. Box 10337 Pacific Centre, 2200-609 Granville Street, Vancouver, BC, Canada V7Y 1H2 or [email protected]. The authoring analysts who are responsible for the preparation of this investment research have received (or will receive) compensation based upon (among other factors) the Corporate Finance/Investment Banking revenues and general profits of Canaccord Genuity. However, such authoring analysts have not received, and will not receive, compensation that is directly based upon or linked to one or more specific Corporate Finance/Investment Banking activities, or to recommendations contained in the investment research. Canaccord Genuity and its affiliated companies may have a Corporate Finance/Investment Banking or other relationship with the company that is the subject of this investment research and may trade in any of the designated investments mentioned herein either for their own account or the accounts of their customers, in good faith or in the normal course of market making. Accordingly, Canaccord Genuity or their affiliated companies, principals or employees (other than the authoring analyst(s) who prepared this investment research) may at any time have a long or short position in any such designated investments, related designated investments or in options, futures or other derivative instruments based thereon. Some regulators require that a firm must establish, implement and make available a policy for managing conflicts of interest arising as a result of publication or distribution of investment research. This investment research has been prepared in accordance with Canaccord Genuity’s policy on managing conflicts of interest, and information barriers or firewalls have been used where appropriate. Canaccord Genuity’s policy is available upon request. The information contained in this investment research has been compiled by Canaccord Genuity from sources believed to be reliable, but (with the exception of the information about Canaccord Genuity) no representation or warranty, express or implied, is made by Canaccord Genuity, its affiliated companies or any other person as to its fairness, accuracy, completeness or correctness. Canaccord Genuity has not independently verified the facts, assumptions, and estimates contained herein. All estimates, opinions and other information contained in this investment research constitute Canaccord Genuity’s judgement as of the date of this investment research, are subject to change without notice and are provided in good faith but without legal responsibility or liability. Canaccord Genuity’s salespeople, traders, and other professionals may provide oral or written market commentary or trading strategies to our clients and our proprietary trading desk that reflect opinions that are contrary to the opinions expressed in this investment research. Canaccord Genuity’s affiliates, principal trading desk, and investing businesses may make investment decisions that are inconsistent with the recommendations or views expressed in this investment research. This investment research is provided for information purposes only and does not constitute an offer or solicitation to buy or sell any designated investments discussed herein in any jurisdiction where such offer or solicitation would be prohibited. As a result, the designated investments discussed in this investment research may not be eligible for sale in some jurisdictions. This investment research is not, and under no circumstances should be construed as, a solicitation to act as a securities broker or dealer in any jurisdiction by any person or company that is not legally permitted to carry on the business of a securities broker or dealer in that jurisdiction. This material is prepared for general circulation to clients and does not have regard to the investment objectives, financial situation or particular needs of any particular person. Investors should obtain advice based on their own individual circumstances before making an investment decision. To the fullest extent permitted by law, none of Canaccord Genuity, its affiliated companies or any other person accepts any liability whatsoever for any direct or consequential loss arising from or relating to any use of the information contained in this investment research.
For Canadian Residents: This Investment Research has been approved by Canaccord Genuity Corp., which accepts sole responsibility
for this Investment Research and its dissemination in Canada. Canadian clients wishing to effect transactions in any Designated Investment discussed should do so through a qualified salesperson of Canaccord Genuity Corp. in their particular jurisdiction.
For United Kingdom Residents:
This investment research is distributed in the United Kingdom, as third party research by Canaccord Genuity Limited, which is authorized and regulated by the Financial Services Authority. This research is for distribution only to persons who are Eligible Counterparties or Professional Clients only and is exempt from the general restrictions in section 21 of the Financial Services and Markets Act 2000 on the communication of invitations or inducements to engage in investment activity on the grounds that it is being distributed in the United Kingdom only to persons of a kind described in Article 19(5) (Investment Professionals) and 49(2) (High Net Worth companies, unincorporated associations etc) of the Financial Services and Markets Act 2000 (Financial Promotion) Order 2005 (as amended). It is not intended to be distributed or passed on, directly or indirectly, to any other class of persons. This material is not for distribution in the United Kingdom to retail clients, as defined under the rules of the Financial Services Authority.
For Jersey, Guernsey This research is sent to you by Collins Stewart (CI) Limited ("CSCI") for information purposes and is not to be
Daily Letter | 14 17 April 2012
and Isle of Man Residents:
construed as a solicitation or an offer to purchase or sell investments or related financial instruments. This research has been produced by a group company for circulation to its institutional clients and also CSCI. Its contents have been approved by CSCI and we are providing it to you on the basis that we believe it to be of interest to you. This statement should be read in conjunction with your client agreement, CSCI's current terms of business and the other disclosures and disclaimers contained within this research. If you are in any doubt, you should consult your financial adviser. CSCI is licensed and regulated by the Guernsey Financial Services Commission, the Jersey Financial Services Commission and the Isle of Man Financial Supervision Commission. CSCI is registered in Guernsey and is a wholly owned subsidiary of Canaccord Financial Inc.
For United States Residents:
Canaccord Genuity Inc. and Canaccord Genuity Securities LLC, US registered broker-dealers, accept responsibility for this Investment Research and its dissemination in the United States. This Investment Research is intended for distribution in the United States only to certain US institutional investors. US clients wishing to effect transactions in any Designated Investment discussed should do so through a qualified salesperson of Canaccord Genuity Inc. or Canaccord Genuity Securities LLC. Analyst(s) preparing this report that are not employed by Canaccord Genuity Inc. or Canaccord Genuity Securities LLC are resident outside the United States and are not associated persons or employees of any US regulated broker-dealer. Such analyst(s) may not be subject to Rule 2711 restrictions on communications with a subject company, public appearances and trading securities held by a research analyst account.
For European Residents: If this Investment Research is intended for disclosure in any jurisdiction other than the United Kingdom, the
US or Canada, then the relevant rules and regulatory requirements of that jurisdiction will apply. Additional information is available on request.Additional information is available on request.Additional information is available on request.Additional information is available on request.