Page 1
Big picture on feasibility of
geologic carbon storage in India
Ajay Kumar Singh
CSIR-CIMFR, Dhanbad, India
[email protected]
Workshop on
Carbon Capture, Storage and Re-Use in India
IIT Bombay, Mumbai
30 September 2016
Page 2
Contents of Presentation
• Who we are
• Introduction
• Potential CO2 storage reservoirs
— Oil reservoirs
— Coal seams
— Saline Aquifers
— Basalt Formations
• Conclusions
Page 3
Who We Are?
• CIMFR is a constituent unit of CSIR,
India, an autonomous body funded by
the Ministry of Science and Technology,
Government of India.
• CIMFR’s objectives are to provide
scientific and technological inputs to
mineral sector for optimization of mining
technologies for better safety, economy,
conservation and environmental
management.
Page 4
Contents of Presentation
• Who we are
• Introduction
• Potential CO2 storage reservoirs
— Oil reservoirs
— Coal seams
— Saline Aquifers
— Basalt Formations
• Conclusions
Page 5
CCS is a 3-step
process:
1. Capturing CO2 at
source.
2. Transportation
(usually
pipelines)
3. Storage
(Geologic
storage)
What is CCS?
Page 6
The potential geologic
storage reservoirs in
India are:
1. Depleted oil & gas
reservoirs/EOR or
EGR
2. Un-mineable coal
seams
3. Deep saline aquifers
4. Basalt formations
Geologic Storage of Carbon
Page 7
Contents of Presentation
• Who we are
• Introduction
• Potential CO2 storage reservoirs
— Oil reservoirs
— Coal seams
— Saline Aquifers
— Basalt Formations
• Conclusions
Page 8
CO2 Storage in depleted oil/gas reservoirs
Depending on pressure of injection, it can be miscible or immiscible:
Miscible CO2-EOR: The CO2 mixes with the crude oil, oil swells and
its viscosity is reduced. The reservoir pressure is also maintained.
Extra crude oil in the reservoir to flow easily towards the production
wells for its recovery.
Immiscible CO2-EOR: When CO2 is used to re-pressure the depleted
reservoir as a sweep gas to move oil towards the production well.
Page 9
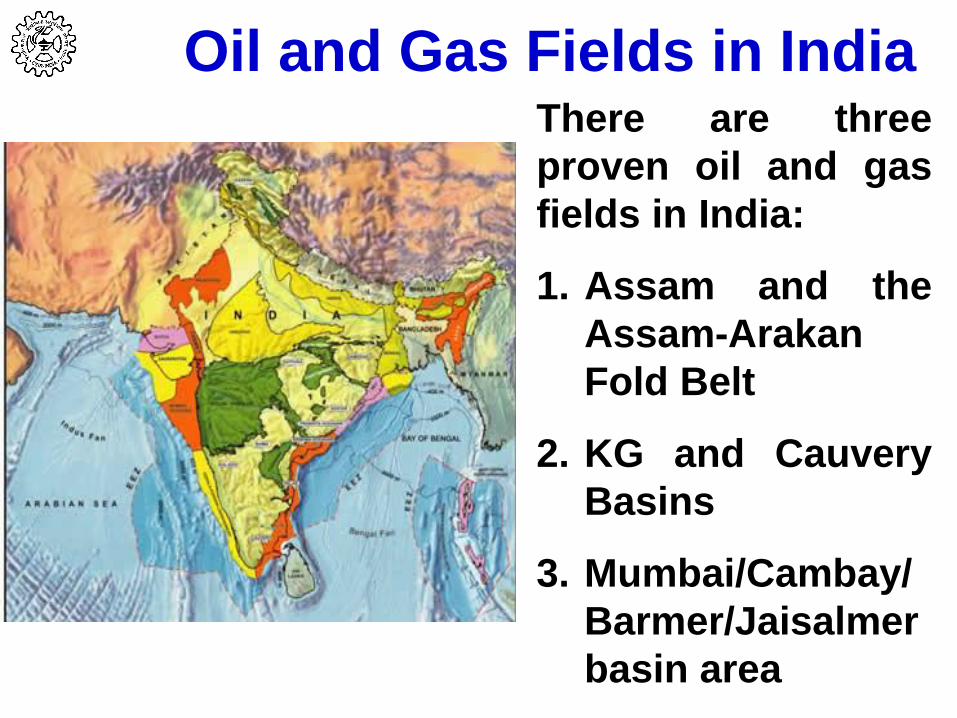
Oil and Gas Fields in IndiaThere are three
proven oil and gas
fields in India:
1. Assam and the
Assam-Arakan
Fold Belt
2. KG and Cauvery
Basins
3. Mumbai/Cambay/
Barmer/Jaisalmer
basin area
Page 10
Need for EOR
• Crude oil production for the
year 2014 was 37.54 MMT as
against production of 38.24
MMT in 2011, showing a
decrease over the last couple
of years.
• Only about 27% of the oil in-
place is being produced
economically.
Natural gas production was
34.106 BCM in 2014 which is
56% lower than the
production of 53.328 BCM
in 2010
Page 11
• There is no case
study available for
any Indian oil field
with CO2 injection.
• However, thermal
recovery technique
(in-situ combustion)
similar to CO2
injection, has been
successfully
attempted.
Indian Case study: Monitoring of
thermal front in Balol oil field
Source: Dimri V.P., Presentation, Int. Conf. CCS-2008
Page 12
•ONGC has an
approved CO2-EOR
project at
Ankleshwar in
Gujarat.
•Source of CO2
ONGC gas
processing
complex at Hazira.
•Theoretical studies
have indicated an
incremental oil
recovery of 5 %
over 35 years
besides the
potential to
sequester 5 to 10
million tons of CO2
CO2 Injector
CO2 Pipeline from
Hazira PlantFirst row of oil Producer.
To be closed after reaching
GOR of 500 v/v
Second row of oil Producer. To be
continued on production till GOR
reaches 500 v/v
CO2 moves through
formation mobilizing
residual oil by swelling,
vaporization and
reduction in residual oil
saturation
Ankleshwar Sands S3+4 : 69.33 MMt
Waterflood Recovery : 54%
Envisaged Tertiary Recovery : 5-7%
Source: Suresh Kumar, Abstract, IWCCS-07
Page 13
Contents of Presentation
• Who we are
• Introduction
• Potential CO2 storage reservoirs
— Oil reservoirs
— Coal seams
— Saline Aquifers
— Basalt Formations
• Conclusions
Page 14
Coal
Ancient Sunlight
Page 15
Indian Coal and lignite Production stood around 677 million
ton in 2015
Source: Office of Coal Controller
Indian Coal production
Page 16
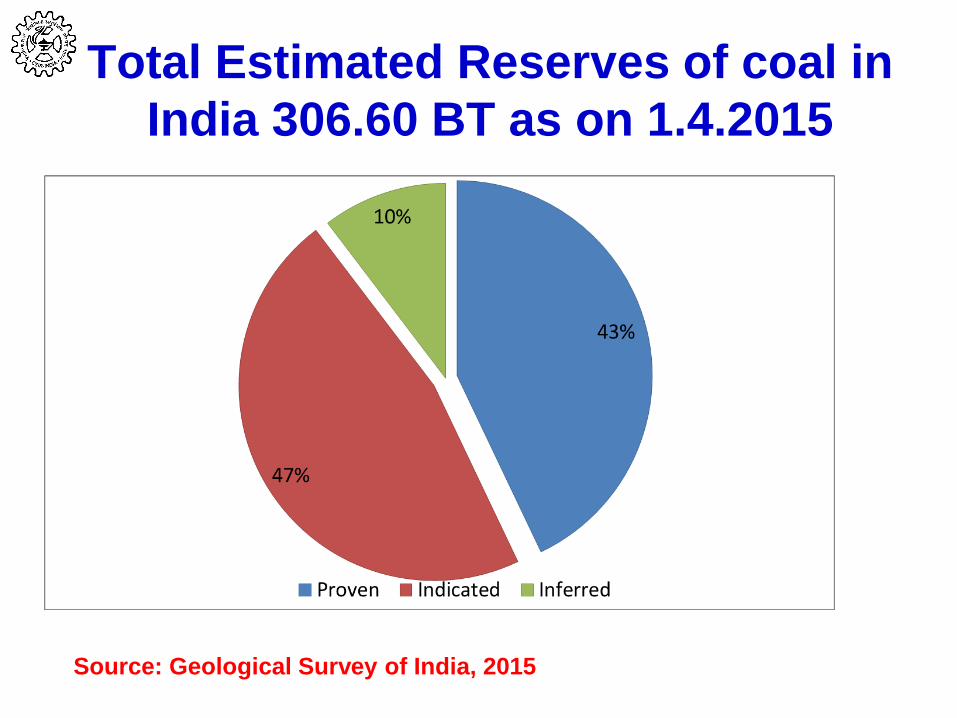
Total Estimated Reserves of coal in
India 306.60 BT as on 1.4.2015
Source: Geological Survey of India, 2015
Page 17
68
1
1
3 2
4
33
6
0
7
5
t p
9
7
19 1
%
%
%
%
%
%
%
%%
%
%
%
%
%%
%
%
%
%
%
%
%
%
%
%%
%
%
%
68° 72° 76° 80° 84° 88° 92° 96°
36°
32°
28°
24°
20°
16°
12°
8°
92°88°84°80°76°72°
1
2
4
5
0
28
1
1
1
4
10
221
212
226
7 8
23 63 35 0
339 32
33 3534
36
3739
4938
4144
4340
42
45 46
4749
48
5051
53
5254
55
696768
56
57
66
65
646362
6160
59
58
15
79
23
2425
26
22
27
3247 3128
5133
343044 43
29
41 353748
45
39 384946
40425052
553653
565457
62 8
6
5964
7
665
7
7
6
78
7
7
1
69
0
.
9
1
2
3
4
56
0
20
111 14
2112
111
# 0
9
1
2
3
4
5
6
8 7
0
2
4 2151
1
1 161
Sr nagar
Smla
Chand garh
New Delhi
JaipurLucknow
Patna
Gangtok Itanagar
Dispur
Kohima
Imphal
Shillong
Aizawl
Agartala
Kolkata
Bhubaneswar
Chennai
Pondicherry
Tiruvanantapuram
Bangalore
Hyderabad
Mumbai
Panaji
Gandhinagar Bhopal
8°
12°
16°
20°
24°
28°
32°
36°
Ranchi
Dehradun
Raipur
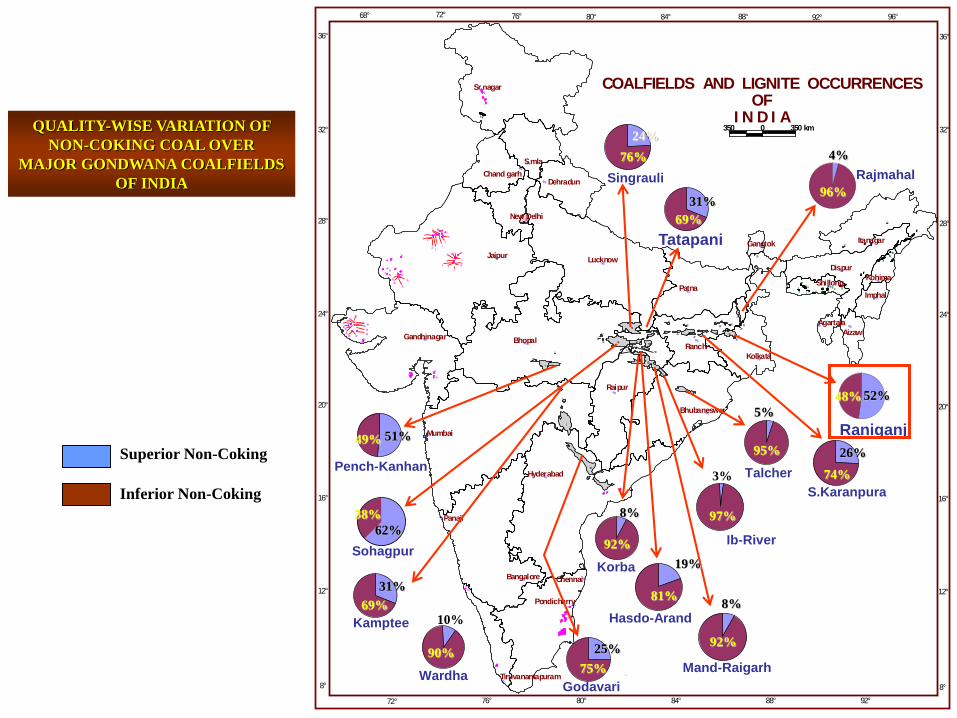
COALFIELDS AND LIGNITE OCCURRENCESOF
I N D I A350 0 350 km
52%48%
26%
74%
96%
4%
Rajmahal
Raniganj
S.Karanpura
51%49%
Pench-Kanhan
62%
38%
Sohagpur
24%
76%
Singrauli
31%
69%
Tatapani
8%
92%
Mand-Raigarh
19%
81%
Hasdo-Arand
3%
97%
Ib-River
95%
5%
Talcher
25%
75%
Godavari
8%
92%
Korba
10%
90%
Wardha
31%
69%
Kamptee
Superior Non-Coking
Inferior Non-Coking
QUALITY-WISE VARIATION OF
NON-COKING COAL OVER
MAJOR GONDWANA COALFIELDS
OF INDIA
Page 18
Coal - a porous rock
Page 19
Production of CBM,
What really happens?
Page 20
Gas
Water
Typical CBM Well in
Production
Page 21
0
20
40
60
80
100
120
0 500 1000 1500 2000 2500
Reservoir Pressure (psi)
% G
as
in
Pla
ce
What about Enhanced Gas Recovery ?!?
Page 22
SUBSTANTIAL RESOURCE NOT
MINEABLE ~
SURFACE CONSTRAINTS, SAFETY
AND TECHNOLOGICAL REASONS
21% OF NET IN-SITU PROVED
RESOURCE EXTRACTABLE WITHIN
PRESENT MINING TECHNOLOGY
(SOURCE CMPDI, Ranchi)
Page 23
Characterisation of resource on chemical and
petrographic parameters at exploration stage
EMERGING POSSIBILITIES OF EXPLOITING
CBM and ECBM
requires
for
Optimal utilisation of resource both at short
and long term perspective
Page 24
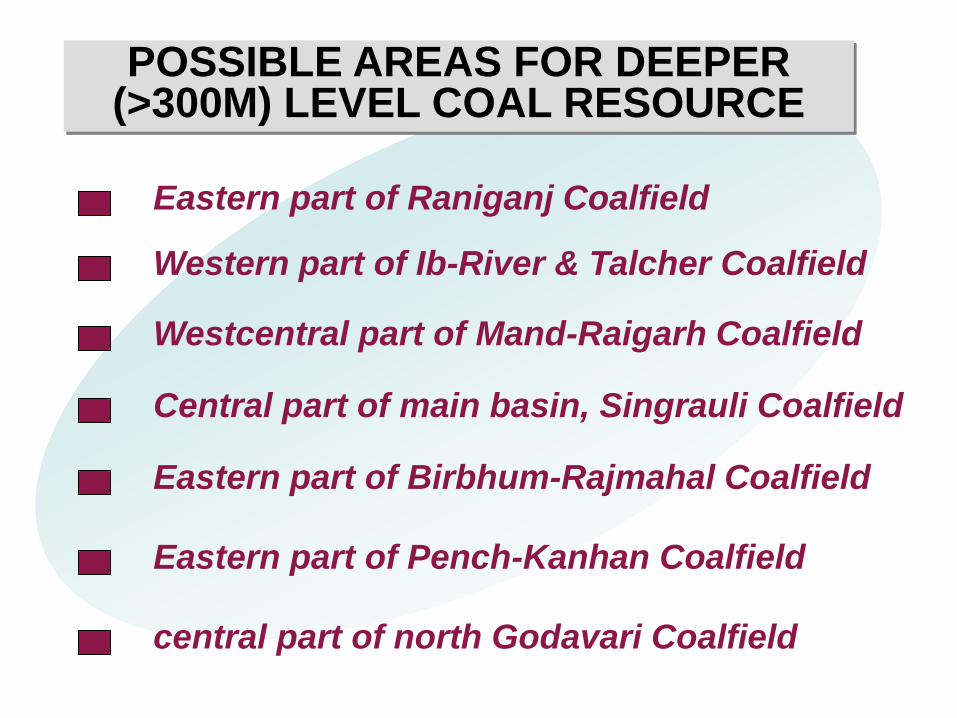
POSSIBLE AREAS FOR DEEPER (>300M) LEVEL COAL RESOURCE
Eastern part of Raniganj Coalfield
Western part of Ib-River & Talcher Coalfield
Westcentral part of Mand-Raigarh Coalfield
Central part of main basin, Singrauli Coalfield
Eastern part of Birbhum-Rajmahal Coalfield
Eastern part of Pench-Kanhan Coalfield
central part of north Godavari Coalfield
Page 25
Quarternary depositsLateriteKamthi FormationBarren MeasuresBarakar FormationKarharbari FormationTalchir FormationMetamorphicsFault
GEOLOGICAL MAP OF TALCHER C F
SCALE
DEEPER LEVEL
Page 26
Anuppur
Shahdol
Intermediate & Deeper level
Page 27
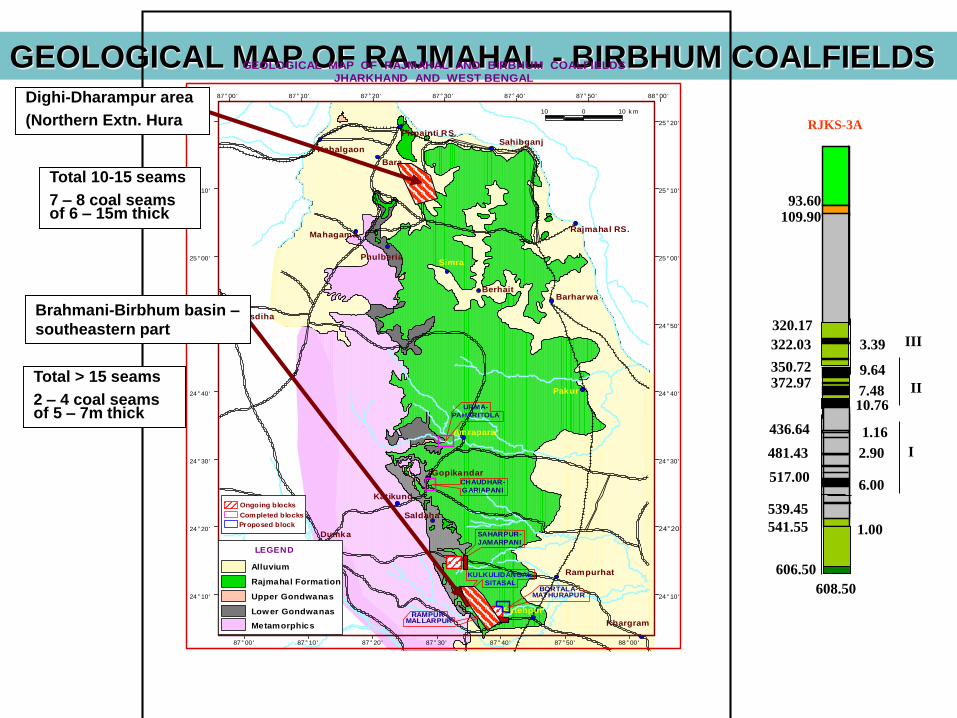
GEOLOGICAL MAP OF RAJMAHAL - BIRBHUM COALFIELDS
Khargram
Fatehpur
Rampurhat
Saldaha
Dumka
Katikund
Gopikandar
Amrapara
Pakur
Barharwa
Hansdiha
Kahalgaon
Bara
Mahagama
PhulberiaSimra
Berhait
Rajmahal RS.
SahibganjPirpainti RS.
87°00' 87°10' 87°20' 87°30' 87°40' 87°50' 88°00'
24°10'
24°30'
24°40'
24°50'
25°00'
25°10'
25°20'
24°20 '
Alluvium
Lower Gondwanas
Metamorphics
Rajmahal Formation
Upper Gondwanas
LEGEND
87°00' 87°10' 87°20' 87°30' 87°40' 87°50' 88°00'
24°10'
24°20'
24°30'
24°40'
24°50'
25°00'
25°10'
25°20'
10 0 10 k m
URMA-
PAHARITOLA
CHAUDHAR-
GARIAPANI
SAHARPUR-
JAMARPANI
KULKULIDANGAL-
SITASAL
RAMPUR-MALLARPUR
BORTALA-MATHURAPUR
Ongoing blocks
Completed blocks
Proposed block
GEOLOGICAL MAP OF RAJMAHAL AND BIRBHUM COALFIELDS
JHARKHAND AND WEST BENGAL
RJKS-3A
93.60109.90
7.48
350.72372.97
322.03
1.16
3.39
9.64
320.17
10.76
436.64
517.00
481.43 2.90
6.00
541.55
608.50
539.45
1.00
I
II
III
606.50
Dighi-Dharampur area
(Northern Extn. Hura
Brahmani-Birbhum basin –
southeastern part
Total 10-15 seams
7 – 8 coal seams of 6 – 15m thick
Total > 15 seams
2 – 4 coal seams of 5 – 7m thick
Page 28
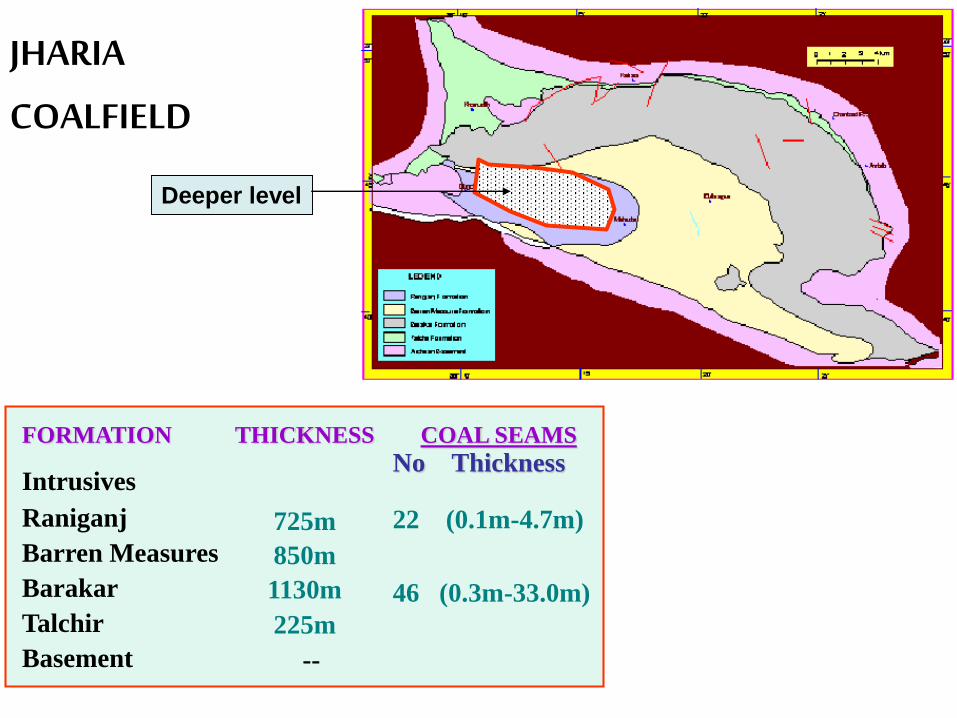
FORMATION
Intrusives
Raniganj
Barren Measures
Barakar
Talchir
Basement
THICKNESS
725m
850m
1130m
225m
--
COAL SEAMS
No Thickness
22 (0.1m-4.7m)
46 (0.3m-33.0m)
JHARIA
COALFIELD
Deeper level
Page 29
EAST BOKARO
COALFIELD
FORMATION
Mahadeva
Panchet
Raniganj
Barren Measures
Barakar
Talchir
Basement
THICKNESS
500m
600m
600m
500m
1000m
80m
--
COAL SEAMS
No Thickness
7 (0.4m-3.0m)
26 (0.4m-63.9m)
Deeper level
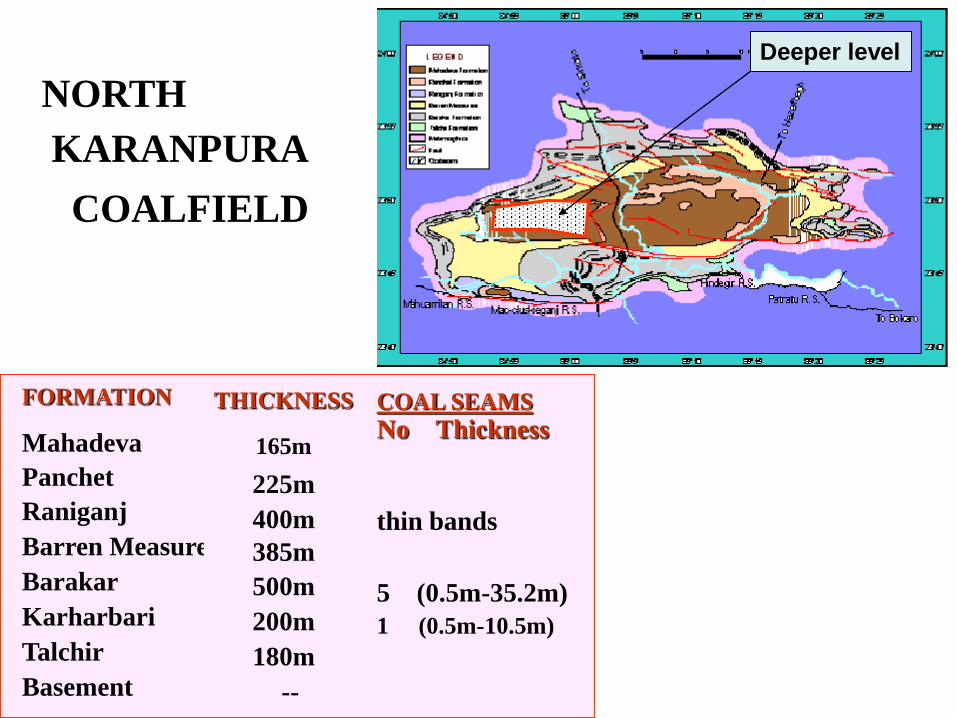
Page 30
FORMATION
Mahadeva
Panchet
Raniganj
Barren Measures
Barakar
Karharbari
Talchir
Basement
THICKNESS
165m
225m
400m
385m
500m
200m
180m
--
COAL SEAMS
No Thickness
thin bands
5 (0.5m-35.2m)
1 (0.5m-10.5m)
NORTH
KARANPURA
COALFIELD
Deeper level
Page 31
SOUTH KARANPURA COALFIELD
FORMATION
Raniganj
Barren Measures
Barakar
Talchir
Basement
THICKNESS
360m
385m
1050m
180m
--
COAL SEAMS
No Thickness
7 (0.8m-3.3m)
42 (0.5m-54.2m)
Deeper level
Page 32
Comparative Adsorption of CO2 and CH4
• Studies conducted so far supports stronger
affinity of CO2 to the coal molecule.
• 2 to 3 molecules of CO2 may displace one
molecule of methane
• It means carbon dioxide is preferentially
adsorbed onto the coal structure over methane
(2:1 ratio).
• Methane sorption capacity for Indian coals has
been investigated by CIMFR.
• Understanding controls on CO2 and CH4
adsorption in coals is important for the modeling
of both CO2 sequestration and CBM production.
Page 33
Methane adsorption
30 60 90 120Pressure kg/cm2
Page 34
Carbon dioxide adsorption
15 30 45 60 75
Pressure kg/cm2
Page 35
Contents of Presentation
• Who we are
• Introduction
• Potential CO2 storage reservoirs
— Oil reservoirs
— Coal seams
— Saline Aquifers
— Basalt Formations
• Conclusions
Page 36
106618Rajasthan
29909Uttar Pradesh
9166Haryana
3509Punjab
AREA SQ.KMSTATE
Saline Aquifers
Source: Bhandari A.K., Presentation, Int. Conf. CCS-2008
Page 37
Deep Saline Aquifers in India
ICOSAR Bulletin, Vol. 2
• The Department of Science and Technology, India has conducted
studies aiming at identification of deep underground saline
aquifers and their suitability for CO2 sequestration in
Sedimentary basins of India namely Ganga, Rajasthan and
Vindhyan basins.
• The Central Ground Water Board and Geological Survey of India
have established the presence of saline aquifers up to depths of
≥ 300m below ground level in the Ganga basin.
• Deep Resistivity studies carried out at 9 sites around New Delhi
have shown the presence of saline aquifers at depths of 800m
and beyond, around Palwal and Tumsara.
Source: Bhandari A.K., Presentation, Int. Conf. CCS-2008
Page 38
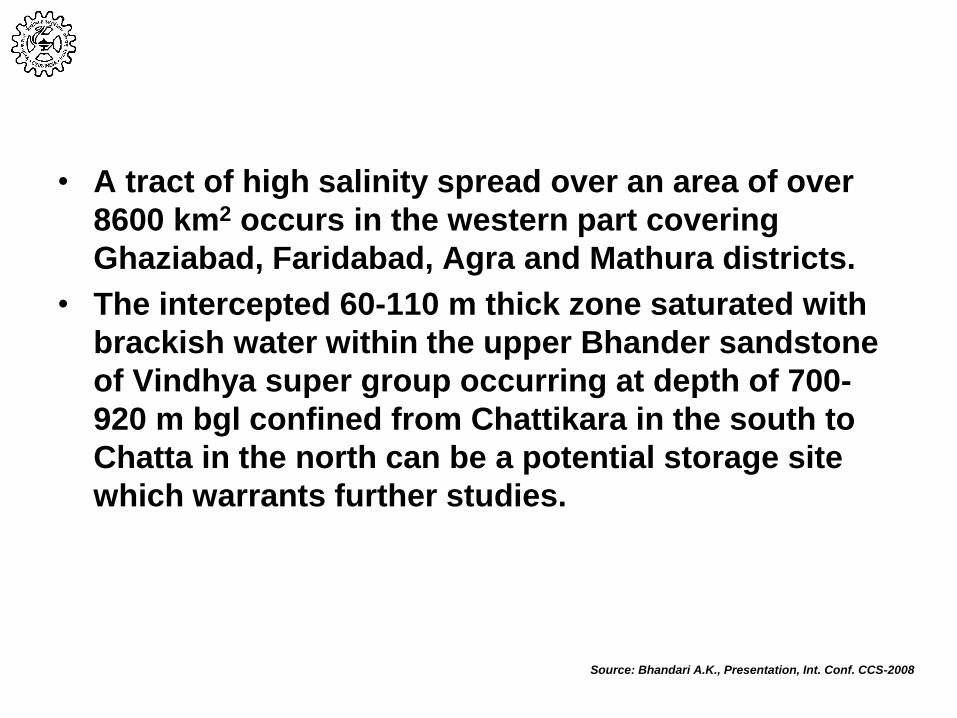
• A tract of high salinity spread over an area of over
8600 km2 occurs in the western part covering
Ghaziabad, Faridabad, Agra and Mathura districts.
• The intercepted 60-110 m thick zone saturated with
brackish water within the upper Bhander sandstone
of Vindhya super group occurring at depth of 700-
920 m bgl confined from Chattikara in the south to
Chatta in the north can be a potential storage site
which warrants further studies.
Source: Bhandari A.K., Presentation, Int. Conf. CCS-2008
Page 39
Contents of Presentation
• Who we are
• Introduction
• Potential CO2 storage reservoirs
— Oil reservoirs
— Coal seams
— Saline Aquifers
— Basalt Formations
• Conclusions
Page 40
Basalts for CO2 storageDeccan Basalts cover an area of 500x103
sq. km. and form one of the largest flood
eruptions in the world.
The thickness of basalts varies from few
hundreds of meters to > 1.5 km.
Basalts provide solid cap rocks and thus
high level of integrity for CO2 storage.
Basalts react with CO2 and convert the
CO2 into the mineral carbonates that
means high level of security.
Intertrappeans between basalt flows
provide major porosity and permeability
along with vescicular, brecciated zones
with in the flows.
Tectonically the traps are considered to
be stable.
Geophysical studies have revealed
presence of thick Mesozoic and
Gondwana sediments below the Deccan
Traps.
Source: Charan S.N., et al. Presentation, Int. Conf. CCS-2008
Page 41
Geological CO2 Sequestration in Basalt
Formations of India: A Pilot Study
Objective:
Evaluation of Basalt Formations of India for
environmentally safe and irreversible long time
storage of CO2.
PARTNERS
INDIA: National Geophysical Research Institute (CSIR), India
USA: Battelle Pacific Northwest National Laboratory, USA
Page 42
The most common flow type of the Deccan Trap and Columbia
River Basalt is the Pahoeho sheet flows. Due to the lesser
viscosity and less strain it forms large horizontal sheets.
Both Deccan Flood Basalts and Columbia River Basalts are
tholeiitic (cinopyroxene and plagioclase) in nature and the
eruptions are of fissure type.
Both are continental basalts. Columbia River
Basalt is fully continental and Deccan Traps
are partly continental.
Both the basaltic flows have traveled
as much as 300 to 500 km from their
sources.
Chemical composition of both the
basalts are similar .
The Indian study will globally establish basalt
formation as a potential storage site for CO2.
Deccan basalts vs Columbia River basalts
Source: Charan S.N., et al. Presentation, Int. Conf. CCS-2008
Page 43
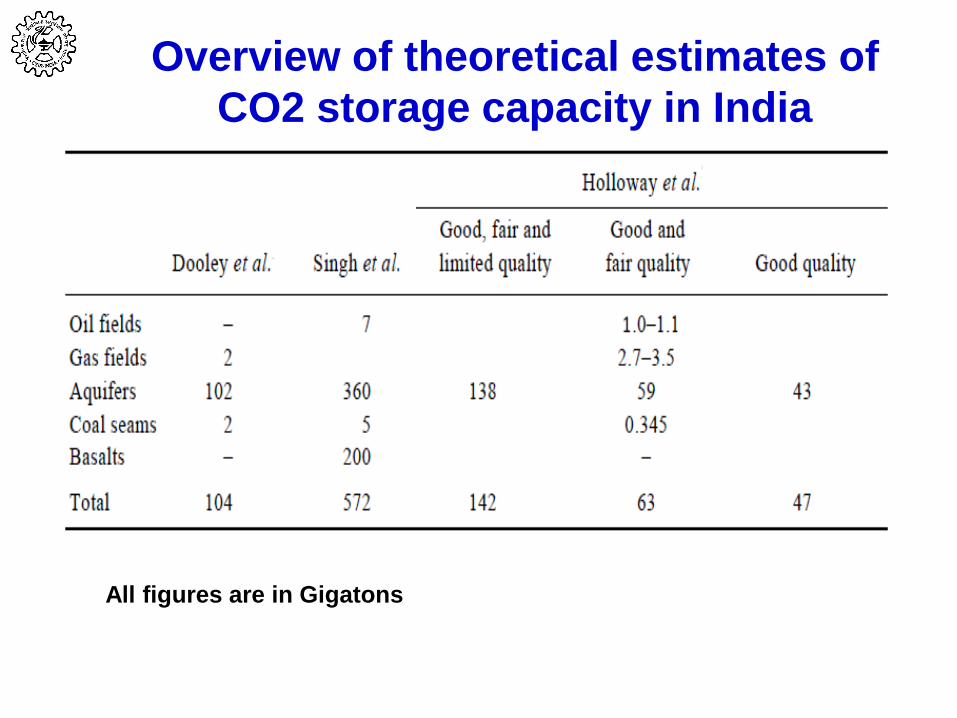
All figures are in Gigatons
Overview of theoretical estimates of
CO2 storage capacity in India
Page 44
Contents of Presentation
• Who we are
• Introduction
• Potential CO2 storage reservoirs
— Oil reservoirs
— Coal seams
— Saline Aquifers
— Basalt Formations
• Conclusion
Page 45
•Carbon capture and storage research offers an opportunity to mitigate
global concerns about climate change and sustainable future.
• CO2 storage R&D is still in early stage in India and developing cost
effective technologies for CCS are the major challenges to the scientist
and researchers.
•The environmental risks involved in the storage of CO2 particularly in
geological formations have to be evaluated in detail by monitoring and
modeling in terms of long term stability.
•Funding mechanisms to support R&D projects for CCS have to be
evaluated. 0.5% cess on power generation in the line of oil cess may be
good enough to sustain the same. The cess can be operated by Energy
Security Development Board, under the aegis of Ministry of Power,
Government of India.
Conclusion
Page 46
THANK YOU
‘If every country was to spend just 2-3% of their GDP,
the impact of possible global climate change could be
mitigated’ - R.K.Pachauri, Economic Times Corp. Excellence Award
for 2006-07, New Delhi (29th Oct., 2007)