Bill Adlard’s market review DJIA S&P 500 FTSE 100 Gold Cable Euro Brent Crude Sunday 30 th September 2012 To view full screen use Ctrl-L or View/Full Screen Mode from the Menu. Images are clearest at 108% zoom. RISK WARNING This free report does not provide investment advice but rather provides an information, educational and analysis service. Bill Adlard, his agents and publishers cannot be held responsible for any losses resulting from any action taken on viewing this report, similarly none of us expect to share in any profits that so result.
Transcript
Bill Adlard’s market review DJIA S&P 500 FTSE 100 Gold Cable Euro Brent Crude
Sunday 30th September 2012
To view full screen use Ctrl-L or View/Full Screen Mode from the Menu. Images are clearest at 108% zoom. RISK WARNING This free report does not provide investment advice but rather provides an information, educational and analysis service. Bill Adlard, his agents and publishers cannot be held responsible for any losses resulting from any action taken on viewing this report, similarly none of us expect to share in any profits that so result.
I'm working with my good friend John Piper to try and bring you monthly updates covering the same markets as I did with Chart-Guide.com, that is the DJIA, S&P 500 and FTSE 100 and some new ones. I won't be issuing buy and sell recommendations since that requires FSA supervision, but I'll be giving my thoughts on the overall analysis and trying to identify important turning points. John will give you the best buy and sell recommendations I know of and you can find details at http://www.johnpiper.info. If you would like to receive my reports please email me at [email protected] and you will be automatically added to the list. Please note you should receive an email response asking you to confirm.
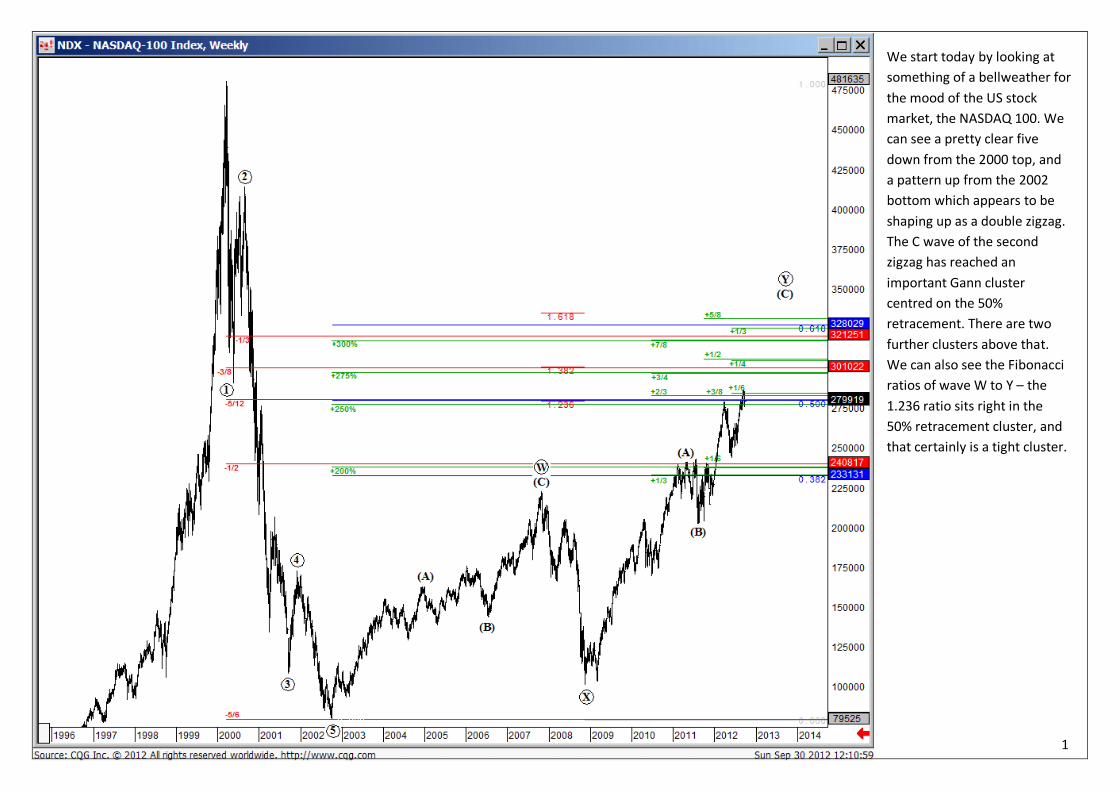
We start today by looking at something of a bellweather for the mood of the US stock market, the NASDAQ 100. We can see a pretty clear five down from the 2000 top, and a pattern up from the 2002 bottom which appears to be shaping up as a double zigzag. The C wave of the second zigzag has reached an important Gann cluster centred on the 50% retracement. There are two further clusters above that. We can also see the Fibonacci ratios of wave W to Y – the 1.236 ratio sits right in the 50% retracement cluster, and that certainly is a tight cluster.
1
``Press Ctrl-Lto view full screen
And the fifth wave looks as if it is about to produce a final up leg. There is wriggle room here, of course, but the overall picture is that the market has made a serious attempt to break above the cluster at 2799, and as long as support is found somewhere round about this level, it should produce an up leg and make a move towards the cluster above which is centred roughly at 3000 which is, of course, a nice round number. I think this probably sets the tone for the US market – still trending up, still finding support, but for how much longer?
2
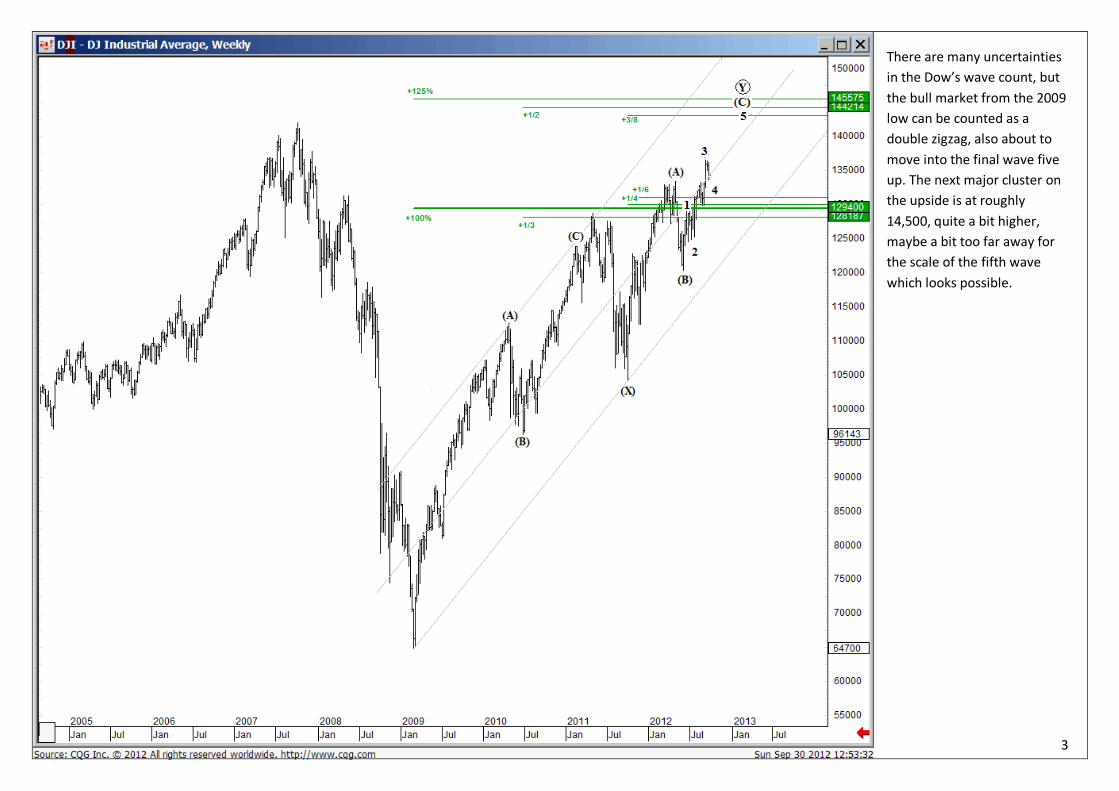
There are many uncertainties in the Dow’s wave count, but the bull market from the 2009 low can be counted as a double zigzag, also about to move into the final wave five up. The next major cluster on the upside is at roughly 14,500, quite a bit higher, maybe a bit too far away for the scale of the fifth wave which looks possible.
3
Here’s the Transports (in blue) paired with the Industrials. Now that really is a striking chart. Notice the way the Industrials have made a very clear new high after the April dip, but the Transports have strongly failed to confirm that since February. That is a sick picture! In Dow theory, a non-confirmation, such as this, is an early warning of a possible primary trend change. This is the most striking example I’ve seen in recent times. You’ll see there was a slight non-confirmation at the July highs. This one is much bigger.
4
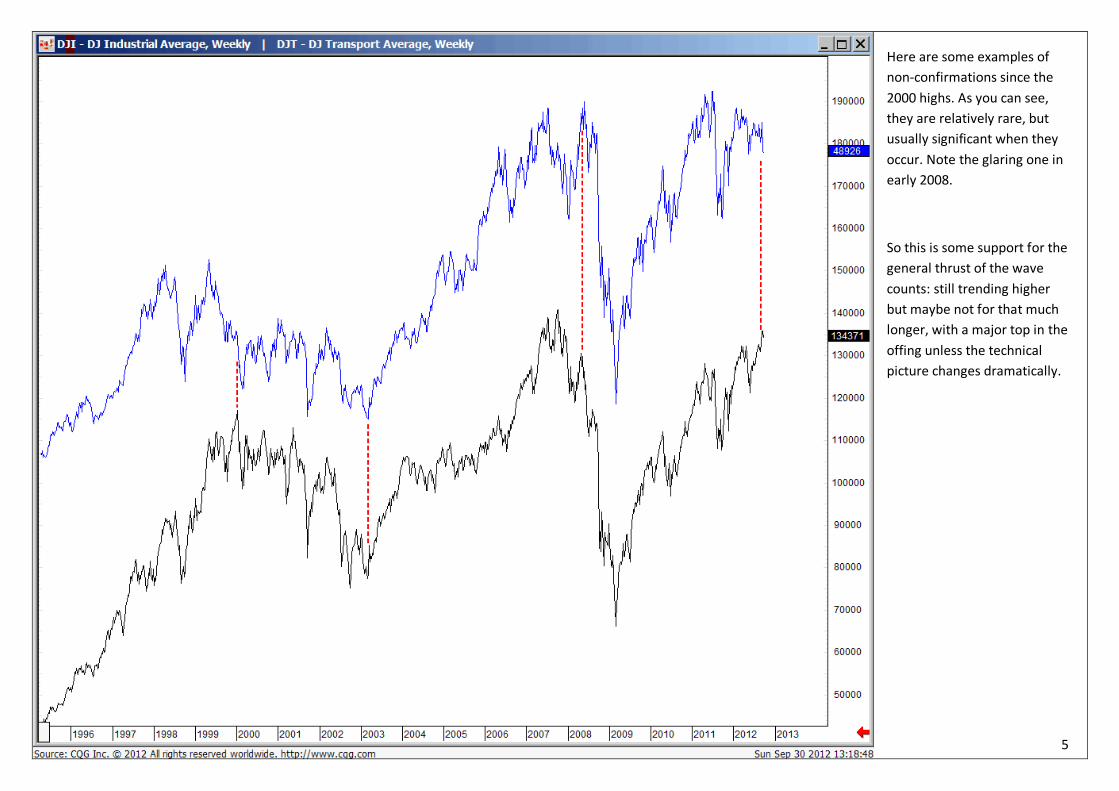
Here are some examples of non-confirmations since the 2000 highs. As you can see, they are relatively rare, but usually significant when they occur. Note the glaring one in early 2008.
So this is some support for the general thrust of the wave counts: still trending higher but maybe not for that much longer, with a major top in the offing unless the technical picture changes dramatically.
5
The S&P 500 has made a clear break above the cluster just above 1350, and it should be on its way to reach a higher Gann level around the 1,500 level. The wave count is tricky because after the wave (B) low, the waves are overlapping, but one possibility is an ending diagonal (C) wave. We’ll have to see how this develops.
6
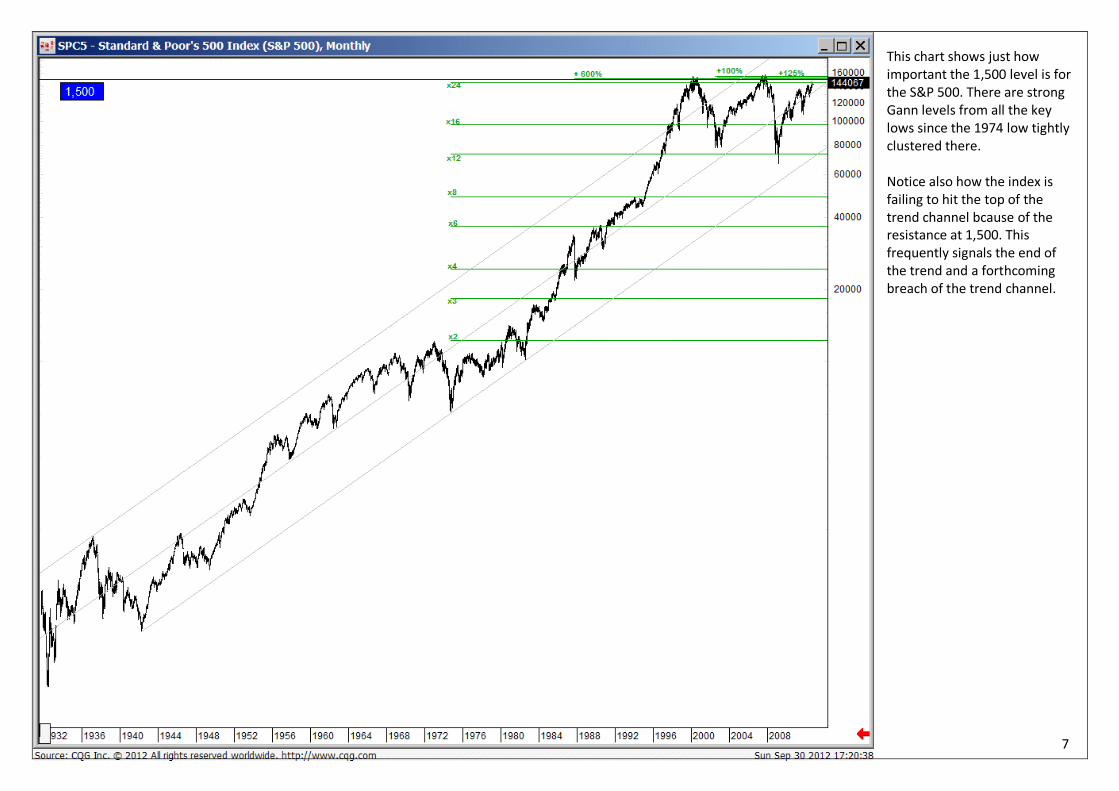
This chart shows just how important the 1,500 level is for the S&P 500. There are strong Gann levels from all the key lows since the 1974 low tightly clustered there. Notice also how the index is failing to hit the top of the trend channel bcause of the resistance at 1,500. This frequently signals the end of the trend and a forthcoming breach of the trend channel.
7
Footsie dipped just after the last issue and then bottomed, as the trading indicators suggested it would, but now it’s almost back to where it was.
I really cannot say what the wave count is here. Everything is so overlapping that the possilities are too numerous. The last recognizable feature was the big zigzag down, so we can assume the trend is up and a higher high should be made eventually.
The trading indicators look as if Footsie will shortly make another bottom on the daily chart, but on the weekly chart the situation is shaping up pretty bearishly.
8
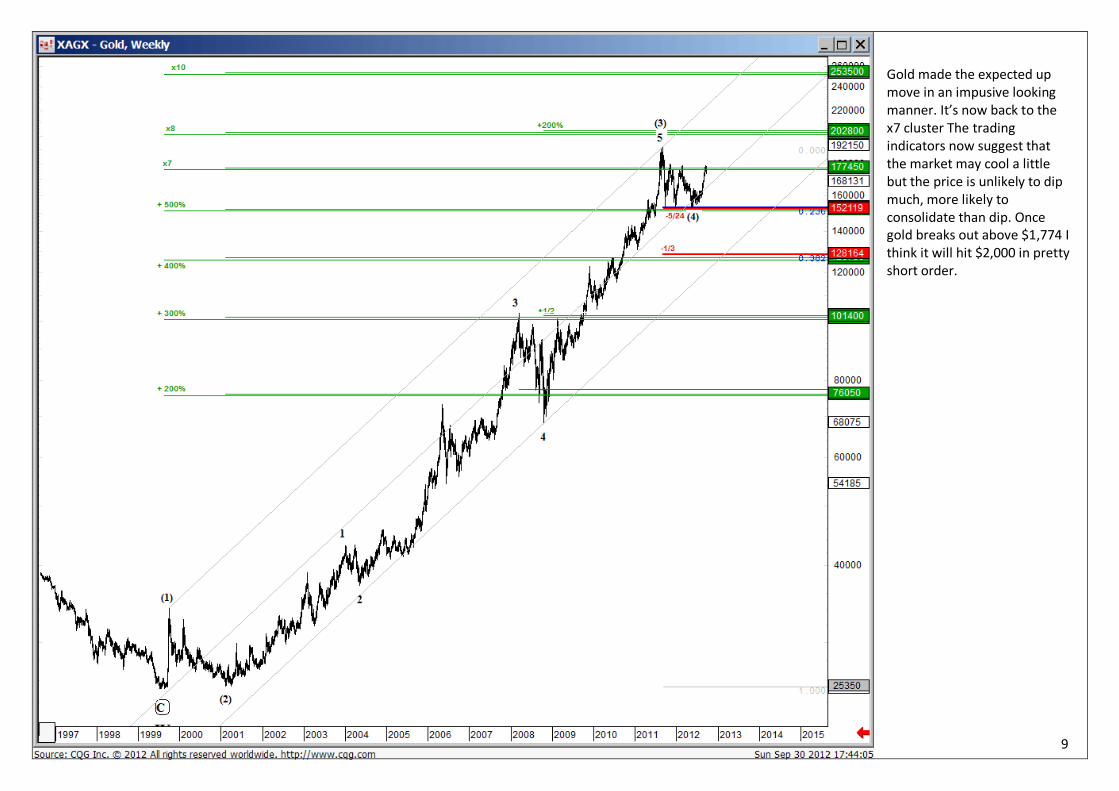
Gold made the expected up move in an impusive looking manner. It’s now back to the x7 cluster The trading indicators now suggest that the market may cool a little but the price is unlikely to dip much, more likely to consolidate than dip. Once gold breaks out above $1,774 I think it will hit $2,000 in pretty short order.
9
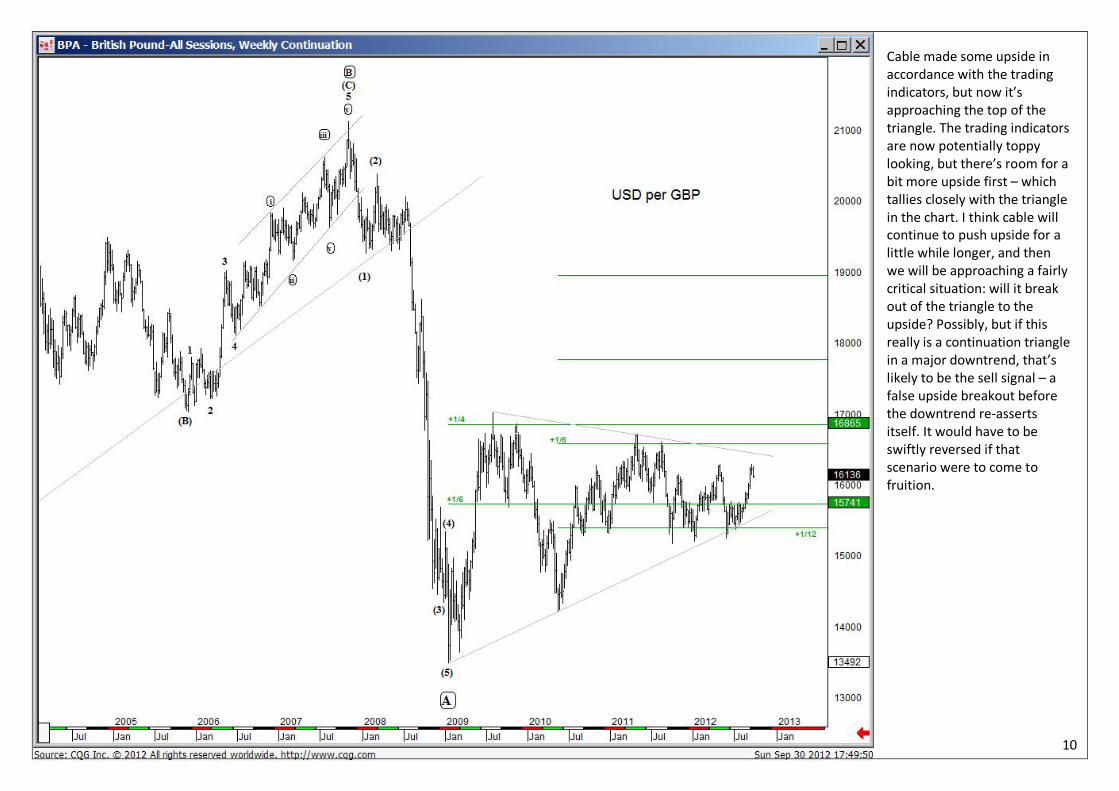
Cable made some upside in accordance with the trading indicators, but now it’s approaching the top of the triangle. The trading indicators are now potentially toppy looking, but there’s room for a bit more upside first – which tallies closely with the triangle in the chart. I think cable will continue to push upside for a little while longer, and then we will be approaching a fairly critical situation: will it break out of the triangle to the upside? Possibly, but if this really is a continuation triangle in a major downtrend, that’s likely to be the sell signal – a false upside breakout before the downtrend re-asserts itself. It would have to be swiftly reversed if that scenario were to come to fruition.
10
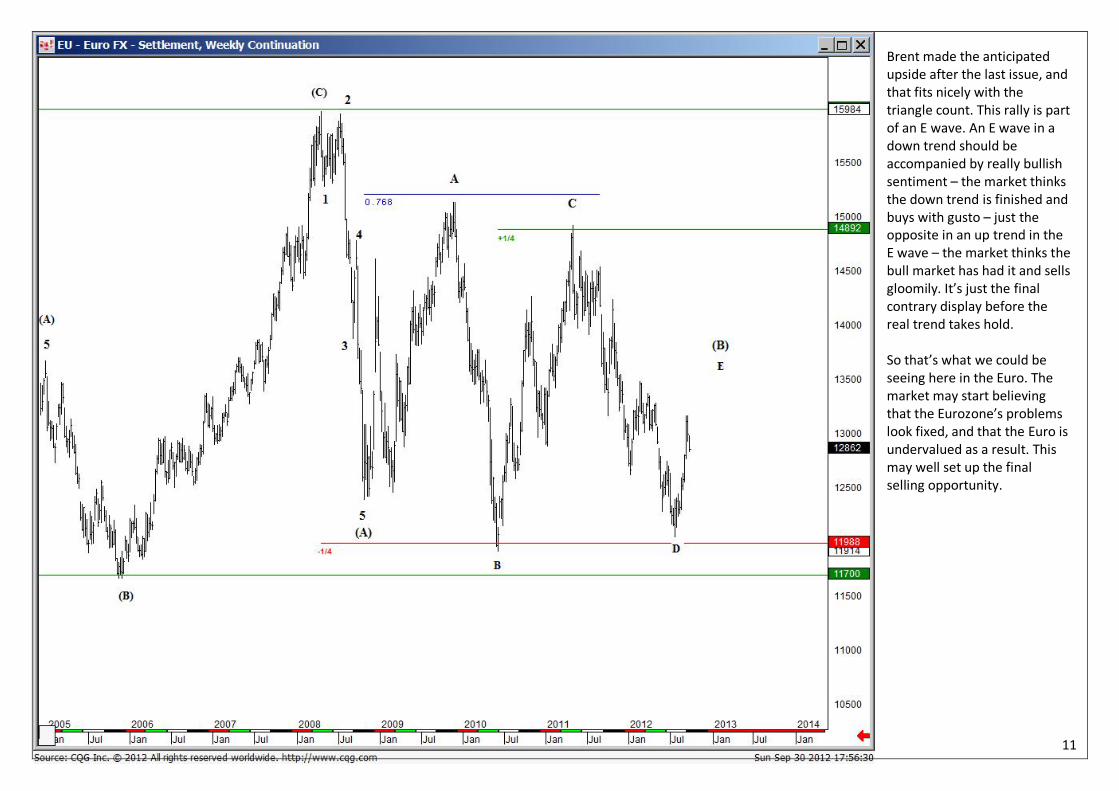
Brent made the anticipated upside after the last issue, and that fits nicely with the triangle count. This rally is part of an E wave. An E wave in a down trend should be accompanied by really bullish sentiment – the market thinks the down trend is finished and buys with gusto – just the opposite in an up trend in the E wave – the market thinks the bull market has had it and sells gloomily. It’s just the final contrary display before the real trend takes hold. So that’s what we could be seeing here in the Euro. The market may start believing that the Eurozone’s problems look fixed, and that the Euro is undervalued as a result. This may well set up the final selling opportunity.
11
Brent just managed to make a higher high, but in a pretty clear three wave form. That suggests to me that we have seen a corrective expanded flat X wave as shown here, which could lead to a further zigzag to the upside – and this would fit with the developing scenario in stock markets and the price of Brent crude.