Binding Interaction and Rotational-Relaxation Dynamics of a CancerCell Photosensitizer with Various Micellar AssembliesBijan Kumar Paul,†,§ Debarati Ray,† and Nikhil Guchhait*
Department of Chemistry, University of Calcutta, 92 A. P. C. Road, Calcutta-700009, India
ABSTRACT: The present work demonstrates the photophysicalcharacterization of the interaction of a promising cancer cellphotosensitizer, harmane (HM), with biomimetic micellar nano-cavities having varying surface charge characteristics. The polarity-sensitive prototropic transformation of HM is remarkably modifiedupon interaction with the macromolecular assemblies of micellarsystems and is manifested through significant modulations on theabsorption and emission profiles of HM. The ground- and excited-states prototropic equilibria of HM are found to be differentiallymodulated in various micellar assemblies. Out of variouspossibilities to assess the drug (HM)−micelle interactionmechanism, the postulate of varying extent of drug penetration into micellar units depending on the compactness of theirheadgroup arrangements is found to suitably rationalize and correlate different experimental findings, including the differences inbinding constant (K) and free energy change (ΔG) of the interaction process. The micropolarity measurement has beenexploited to evaluate the probable binding location of the drug which reveals that the cationic drug molecule does not penetratedeep into the micellar core region and the results are further substantiated from fluorescence quenching experiments. The workalso pays proper attention to delineate the modulation in dynamical behaviors of the drug following interaction with the micellarsystems. Wavelength-sensitive fluorescence parameters reveal the slower rate of solvent-relaxation around the excited probewithin the micelle-encapsulated microheterogeneous environments. The enhancement of fluorescence anisotropy and rotationalrelaxation time of the drug in micellar environments from that in pure aqueous buffer suggests entrapment of the drug inmotionally constrained regions introduced by the micelles.
1. INTRODUCTIONRecently, enormous attention has been given to theinvestigation of structure and properties of chemical entitiesentrapped in molecular assemblies like cyclodextrins, micelles,reverse micelles, microemulsions, vesicles, etc. compared to thatin pure homogeneous media.1−11 This is because of thepromising prospects of organized assemblies on biological,photochemical, and photophysical processes. Micelles are oneof such organized assemblies that has formed the nucleus ofmany-faceted research activities over the past few years.6,10,11
Micelles are highly cooperative, thermodynamically stable,dynamic nanostructures formed out of amphiphilic surfactantmolecules above a critical concentration (precisely a narrowconcentration range) known as the critical micellar concen-tration (CMC). The interactive nature of innumerousfluorophores in micellar systems has been quite extensivelyaddressed in the literature mainly with a view to the ability ofsuch dynamic nanostructures to mimic biological membranes ina much simpler model.11,12 Such studies have significance infundamental research also because of their ability to furnishvaluable information about the underlying noncovalentintermolecular forces.1 In principle, the instrumental role ofnoncovalent intermolecular forces (particularly the hydro-phobic effect) responsible for micelle formation is commonto other related assemblies such as reverse micelles, liposomes,bilayers and biological membranes.11,12 Apart from the inherent
compositional and functional complexities associated with truebiological membranes that have promoted research withrelatively simpler micellar model systems, some additionaltechnical edges are often obtained with micelles, e.g., they areoptically transparent, spectroscopically silent, and relativelyscatter free. Furthermore, the promising prospects in futureapplications like targeted drug delivery,3 nanometer sizedelectronic devices,4 development of energy storage devices,5
etc. have enormously contributed to the growing interest inresearch with various micellar systems.Characterization of drug molecules owes paramount
significance when it is related with a detrimental diseasebecause the number of available drugs in the literature for thetreatment of such diseases is sparse. The naturally occurringalkaloid β-carbolines have captured much attention over thepast few years given the wide range of biological properties,which include their functioning as potential monoamine-oxidase (MAO) enzyme inhibitors and their interaction witha considerable number of neurotransmitters and neuro-modulators of the central nervous system (CNS).13−15
Additionally, the novel biological application of β-carbolinesin the form of photosensitizer to fungi, viruses, bacteria, etc. has
Received: May 3, 2012Revised: June 13, 2012Published: July 11, 2012
been central to an immensely important topic of research inmedical science: photodynamic therapy (PDT).16−18 β-Carbo-lines are reported to be effective in producing singlet oxygenwhich is detrimental to cancerous/malignant cells.18,19 Such awide range of biological activities surrounding β-carbolines hasplayed a pivotal role in forming the nucleus of research toinvestigate the interaction of these derivatives with biological/biomimicking receptors.The field of interaction of β-carbolines with biological
receptors still awaits meticulous exploration. Additionally, thestudied β-carboline derivative HM has remained comparativelyunderutilized in these perspectives.20 Trapping of suchbiologically potent drugs in different biomimetic environmentsbecomes attractive because of their ability to achieve specialchemical efficiency as a result of organization in the reactionmedia. Successful application of micelles in loading andtargeted delivery of drugs and biodetoxofication of drugs (aprocess in which empty micelles can act as sinks to scavengethe drug in blood circulation and prevents its toxic effects)demands meticulous characterization of the interaction of thedrug with the concerned micellar system. The present programis focused on exploring the interaction of the prospective drugmolecule harmane (HM) with micellar assemblies havingvarying surface charges, e.g., anionic micelle sodium dodecylsulfate (SDS), cationic micelle cetyltrimethyl ammoniumbromide (CTAB), and neutral micelle p-tert-octylphenoxypolyoxyethanol, i.e., Triton X-100 (TX-100) (Scheme 1).
Owing to the amphiphilic character of surfactant molecules,they can modify a reaction to a considerable extent if there is acharge separation during the process.21 The pyridine ring inHM is electron deficient and the indole ring is electron excessresulting in two functional sites for acid−base chemistry whichis sensitive to the variation of medium polarity.20,22,23 Thepolarity-dependent prototropic transformation of HM (Scheme1) is found to be differentially modulated within the micellarassemblies having varying surface charges and is reflected onthe absorption and emission spectral profiles. The results of thepresent investigation reveal the conjugate effect of polarity andconfinement on the photophysics and motional restriction of
the drug within the micellar assemblies. The effect of micellarentrapment on the dynamical behavior of the drug is alsoinvestigated in this context. The work also pays attention to themodulations in rotational-relaxation dynamics of the drugwithin micellar nanocavities.Usually biologically active materials for therapeutic activities
are selected with a view to the pharmacokinetic andpharmacodynamic behavior of the exogeneous materials withinthe body, which yield a rational understanding of the ADME(absorption, distribution, metabolism, and excretion) character-istics of the drugs. The appropriate selection of the drugdelivery vehicle naturally constructs an indispensable elementof research along this direction. Despite the mushroomingefforts inclined to this direction, a large part of the research inthe sector still dwells at the stage of prospect and proposition.In the late 1960s, micelles captured considerable attention asprospective drug delivery vehicles owing to their controllableproperties and benign pharmacoligal behavior.24,25 Micelles canoffer a score of advantages as drug carriers. First, micelles canencapsulate sparingly soluble pharmaceuticals and deliver themto the site of action at concentrations which can even exceedtheir intrinsic water solubility, hence enhancing theirbioavailability.26,27 It has been particularly emphasized in thiscontext26 that entrapment of bioactive materials in micellarassemblies is principally governed by noncovalent interactionswhich in turn evinces no alteration of the chemical properties ofthe drugs. This aspect in materializing micelles as prospectivedrug carriers has received much attention in complicated fields,e.g., photodynamic therapy and chemotherapy particularlygiven the high degree of insolubility in water of a large part ofnewly discovered drugs, as has been argued in recentreviews.27−29 Further, with micelle-encapsulated drugs, theprobability of undesirable side effects arising out of contact ofthe drug with inactivating species, such as enzymes present inbiological fluids, is minimized, as compared with those of freedrug.27−29 The small nanoscopic dimension and narrow sizedistribution of micellar units provides a marked edge in termsof retarding the rate of body clearance through renalfiltration.26,27 Recently, chemical modifications of the surfactantmolecules with intentions to modulate the micellar propertiesare also being tested for the use of micelles as delivery vehiclesof photosensitizers in PDT.29 However, in order to achieve thedesired degree of implementation in this research arena,investigation of the properties of photosensitizers in relativelysimple micellar systems might provide a simple basis beforemoving onto the complex systems. This can be fruitful inassessing not only the behavior of the photosensitizers in drugdelivery vehicles but also in complementing requiredmodifications for future applications. Furthermore, theinteraction of drugs with micellar assemblies also is significantin view of the ability of micellar systems to mimic complexbiological membranes in a much simpler model.11,12
2. EXPERIMENTAL SECTION2.1. Materials. HM procured from Sigma Chemical Co.,
USA was used as received. The purity of the compound wastested on a TLC plate before use. The surfactants sodiumdodecyl sulfate (SDS), cetyltrimethyl ammonium bromide(CTAB), and TX-100 were procured from Sigma Chemical Co.and used without further purification. No contribution of thesurfactant solutions on either absorption or fluorescence in thestudied wavelength region was affirmed prior to their use in thepresent study. Tris buffer and hydrochloric acid (HCl) from E-
Scheme 1. (a) Simplified Paradigm Showing the Cation ⇌Neutral Prototropic Equilibrium in HM and (b) ChemicalStructures of the Surfactant Molecules Studied
The Journal of Physical Chemistry B Article
dx.doi.org/10.1021/jp304280m | J. Phys. Chem. B 2012, 116, 9704−97179705
Merck were used to prepare the Tris-HCl buffer (pH 7.4) indeionized water from Milli-Q water purification system(Millipore). The solvent 1,4-dioxane was of UV Spectroscopygrade (Spectrochem, India).Copper(II) perchlorate (Cu(ClO4)2. 6H2O) and potassium
bromide (KBr) for fluorescence quenching studies wereprocured from Sigma-Aldrich, USA and used as received.2.2. Instrumentation and Methods. Steady-State
Spectral Measurements. The absorption and emission spectrawere acquired on Hitachi UV−vis U-3501 spectrophotometerand Perkin-Elmer LS55 fluorimeter, respectively. The concen-tration of HM was maintained at ∼2.0 μM (in order toeliminate the possibilities of aggregation and reabsorption) andpH at 7.40 throughout the study.Steady-State Fluorescence Anisotropy. Steady-state fluo-
rescence anisotropy was measured on Perkin-Elmer LS55fluorimeter. The steady-state anisotropy (r) is defined as30
=−+
rI GI
I GI( )
( 2 )VV VH
VV VH (1)
=GII
HV
HH (2)
where IVV and IVH are the emission intensities when theexcitation polarizer is vertically oriented and the emissionpolarizer is oriented vertically and horizontally, respectively. Gis the correction factor.Time-Resolved Measurements. The time-resolved fluores-
cence decays were acquired on FluoroCube-01-NL spectrom-eter based on the time-correlated single photon counting(TCSPC) technique using a nanoLED at 340 nm and a Laserdiode at 375 nm as the light sources to trigger the fluorescenceof neutral and cationic species of the drug HM, respectively,and the signals were collected at the magic angle of 54.7° toeliminate the contribution from anisotropy decay.30 The decayswere deconvoluted and analyzed on DAS-6 decay analysissoftware.20,22,23,30 Mean (average) fluorescence lifetime (⟨τi0⟩)was calculated from the equation30
τα τα τ
⟨ ⟩ =∑∑i
i i i
i i i0
2
(3)
in which αi represents the relative amplitude of the ithcomponent of decay having the characteristic decay timeconstant τi, such that ∑iαi = 1. The quality of the fits wasjudged from χ2 criterion and visual inspection of the residuals ofthe fitted functions to the actual data.For time-resolved fluorescence anisotropy decay measure-
ments, the polarized fluorescence decays for the parallel [I||(t)]and perpendicular [I⊥(t)] emission polarizations with respect tothe vertical excitation polarization were first collected at theemission maxima of the probe. The anisotropy decay functionr(t) was constructed from these I||(t) and I⊥(t) decays using thefollowing equation:30
=−+
⊥
⊥r t
I t GI t
I t GI t( )
( ) ( )
( ) 2 ( ) (4)
G is the correction factor for the detector sensitivity to thepolarization detection of the emission.Dynamic Light Scattering. Dynamic light scattering (DLS)
measurements were carried out on a Malvern Nano-ZSinstrument employing a 4 mW He−Ne LASER (λ = 632.8
nm) and equipped with a thermostatted sample chamber. Thesample was poured into a DTS0112 low volume disposal sizingcuvette of 1.5 mL (path-length 1 cm). The operating procedurewas programmed by the Malvern instrument software in afashion that there was an average of 25 runs, each run beingaveraged for 15 s, and then a particular hydrodynamic diameterand size distribution was extracted using the DTS software.All experiments were performed at an ambient temperature
of 300.0 K unless otherwise specified.Deconvolution of Spectra. The experimentally obtained
spectra were analyzed by deconvolution into overlappingGaussian curves using the Marquardt−Levenberg algorithm asimplemented in MS Origin 7 to obtain the minimum numberof reproducible spectral components using the adjustableparameters of the center, width, and amplitude of eachGaussian curve.31 Multiple attempts to fit the data withdifferent starting parameters can generally provide a survey ofthe extent of statistically equivalent parameter sets.31
Comparing several deconvolutions of an overall spectrum, a“good” fit is then judged by several criteria including aminimum in the goodness-of-fit parameter χ2 (the weightedsum of the squares of the deviations)31 and a maximum valuefor the square of the multiple correlation coefficient, r2.31 Fromthese statistically acceptable fits, a “good” fit is further judged bythe reproducibility in the values for the centers of the Gaussiancurves. A final, albeit subjective, criterion was to examine thefits for physically plausible results.
3. RESULTS AND DISCUSSION3.1. Steady-State Absorption and Emission Studies.
The absorption profile of HM is characterized by two distinctbroad bands at λabs ≈ 348 nm and 370 nm in aqueous buffer(Figure 1a). The photophysical properties of various β-carboline derivatives have long been seen as an intriguingtopic of research and have been addressed quite extensively inthe literature.20,22,23,32,33 In analogy to literature re-
Figure 1. Representative absorption spectral profile of HM in aqueousbuffer medium in the presence of increasing concentrations of (a)SDS, (b) CTAB, and (c) TX-100. In panel (a) curves (i) → (ix)correspond to [SDS] = 0.0, 0.5, 1.0, 1.5, 2.0, 2.5, 3.0, 3.5, and 4.0 mM.In panel (b) curves (i) → (iii) correspond to [CTAB] = 0.0, 0.75, and1.25 mM. In panel (c) curves (i) → (vii) correspond to [TX-100] =0.0, 0.022, 0.044, 0.088, 0.13, 0.18, and 0.26 mM.
The Journal of Physical Chemistry B Article
dx.doi.org/10.1021/jp304280m | J. Phys. Chem. B 2012, 116, 9704−97179706
ports,20,22,23,32,33 the two absorption bands at ∼348 nm and∼370 nm for HM in aqueous buffer are attributed to theneutral and cationic species of HM (Scheme 1), respectively.The relative intensity of the two absorption spectral bands is
sensitive to the properties of the surrounding environments(e.g., nature of the solvent as well as externally addedadditives).20,22,23,32,33 Figure 1a reveals a discernible modifica-tion of the absorption profile of the drug HM with increasingconcentration of anionic surfactant SDS in terms ofconsiderable broadening of the spectral profile with concom-itant increase of absorbance for the cationic species (λabs ≈ 370nm). However, the modification on absorption profile of thedrug in the presence of the cationic (CTAB, vide Figure 1b)and neutral (TX-100, vide Figure 1c) surfactants bears anoticeable inconformity to the observations in the presence ofthe anionic surfactant (SDS). As seen in Figure 1, panels b andc, the addition of cationic or neutral surfactant to the aqueousbuffer solution of the drug (HM) results in distinct enhance-ment of the absorbance of the neutral band (λabs ≈ 348 nm)relative to that of the cationic counterpart (λabs ≈ 370 nm).Such modulations of the absorption spectra of HM are clearindications that the prototropic equilibrium of HM (Scheme 1)is enormously modified in the microheterogeneous environ-ments of the surfactants compared to that in aqueous bufferphase.20,22,23,32,33 It is thus argued that the ground-stateprototropic equilibrium of HM is more favored to the neutralspecies in the presence of the cationic or neutral surfactants.Given the cationic surface charge of CTAB it is not unlikely
that the ground-state neutral ↔ cation prototropic equilibriumof the drug (HM) is favored more to the neutral species in thepresence of this surfactant molecule (vide Figure 1b). However,a similar pattern of observation in the presence of the neutralsurfactant TX-100 (vide Figure 1c) is noteworthy, and it isargued, in the present conjecture, that a decrease of mediumpolarity in the presence of the surfactants appears to play a keyrole in modulating the prototropic equilibrium of HM withinthe microheterogeneous micellar assemblies. However, the caseof anionic surfactant appears a little puzzling at the moment.The anionic surface charge of the SDS surfactant molecule canbe presumed to stabilize the cationic species of HM over theneutral species which should be manifested through a gradualincrease of the cationic absorption band at λabs ≈ 370 nm at thecost of the neutral counterpart at λabs ≈ 348 nm with increasinganionic surfactant concentration.34 However, the appreciablebroadening of the absorption profile in the present case withincreasing SDS concentration (vide Figure 1a) obscures such aclear distinction and hence invokes complications inquantitative evaluation of the spectral band features. Herein,we endeavor to resolve the problem by deconvolution of theexperimental spectra into individual Gaussian curves followingthe method described in section 2.2. For the resolutions, thehalf-width values and peak maxima were varied slightly on atrial and error basis to obtain the best fit with a minimum in thegoodness fit parameter χ2 and a visual inspection of thesuperposition of the convoluted curves on the experimentallyobtained spectra.31 The results of deconvolution of theabsorption profile of the drug (HM) in aqueous buffer mediumand in the presence of different surfactants are systematicallypresented in Figure 2. For HM in aqueous buffer medium,Gaussian resolution of the absorption spectrum yields twobands corresponding to the neutral (λabs ≈ 348 nm) and thecationic (λabs ≈ 370 nm) species of the drug (Figure 2a). TheGaussian resolution of the experimental absorption spectrum of
the drug in the presence of a substantial concentration of thecationic ([CTAB] = 1.25 mM, Figure 2b) or neutral ([TX-100]= 0.26 mM, Figure 2c) surfactant corroborates to thepredominance of the absorption band of the neutral speciesat λabs ≈ 348 nm only. This observation in turn appears toaccount for the aforementioned inference that in the presenceof the cationic (CTAB) or neutral (TX-100) surfactant theground-state prototropic equilibrium of HM is favored to theneutral species over the cationic counterpart. However, the caseof anionic surfactant (SDS) produces interesting results.Deconvolution of the absorption spectrum of HM in thepresence of the anionic surfactant ([SDS] = 4.0 mM) distinctlyreveals the presence of two resolved bands corresponding tothe neutral (λabs ≈ 348 nm) and the cationic (λabs ≈ 370 nm)species of HM, as displayed in Figure 2d. This finding thuspoints out the fact that even in the presence of a substantialconcentration of the anionic surfactant the ground-stateprototropic equilibrium of the drug is not completely movedto the cationic species, as is advocated by the presence of asignificant contribution from the neutral absorption band (videFigure 2d). It is thus logical to argue at this stage that thesurface charge of the surfactant molecules is not the sole factorin governing the ground-state prototropic equilibrium of HMwithin the microheterogeneous assemblies of the micellarsystems investigated. An interpretation for the significantcontribution from the neutral absorption band of HM evenin the presence of a substantial concentration of the anionicsurfactant thus requires consideration of other factors as arguedin forthcoming discussions.However, the present score of observations also demands the
consideration of other relevant factors, e.g., degree of waterpenetration in the micellar environments, local pH at themicellar surface, and micellar aggregation number. It is knownthat water can penetrate micellar units up to a certain depthdepending on the compactness of the micellar units.35,36 Berr etal. have demonstrated by neutron-scattering experiments thatcompactness of the micelle headgroup increases with increase
Figure 2. Resolved absorption spectra of HM in (a) aqueous buffersolution, (b) 0.8 mM CTAB, (c) 0.40 mM TX-100, and (d) 6.0 mMSDS. The black lines denote the experimental spectra, the blue dottedlines denote the resolved bands into the individual Gaussiancomponents, and the red dashed lines designate the simulated spectrabased on the resolved bands.
The Journal of Physical Chemistry B Article
dx.doi.org/10.1021/jp304280m | J. Phys. Chem. B 2012, 116, 9704−97179707
of surfactant chain length.37 Micelles with smaller headgroupssuch as SDS experience a smaller degree of water penetration incomparison to micelles with larger headgroups such as CTABand TX-100.35,36 Thus a smaller degree of water penetration(micellar hydration) with SDS micelle as compared with CTABand TX-100 micelles is expected to favor the prototropicequilibrium of HM toward the cationic form in CTAB and TX-100, which does not conform to the experimental results. Thusthe model of water penetration (micellar hydration) which failsto account for the experimental observations is negated to playan important role. Another possible factor governing theprototropic equilibrium of HM between the neutral andcationic forms may be ascribed to the change of local pH at themicellar surface. However, the use of aqueous buffered solutionat pH 7.40 is supposed to resist the change of pH of thesolution and hence the local pH near the micellar surface.Recently Chakraborty et al.38 explained this issue usingnonsteroidal anti-inflammatory drugs of the oxicam family aschromophores in micelles of opposite charge (CTAB ascationic micelle and SDS as anionic micelle). They ascribedtheir observation of mutual transformation between thedifferent prototropic species of the drugs to a change in theapparent pKa values of the drugs. They considered the ionicinteraction of the surfactant with the different prototropicspecies of the probe and the hydrophobic interaction betweenthe nonpolar region of the micelles and the probe to bepossible reasons for the apparent shift in the resulting pKavalues. Rottman and Avnir have also assigned a similarinterpretation while explaining their experimental observationwith a single dopant in micelles induced by additional sol−gelentrapment.39 However, the role of the aggregation numberand the size of the three micelles studied within ourexperimental window cannot be ruled out. For the presentlyinvestigated micellar systems, the aggregation number followsthe trend: TX-100 (Nagg = 14340) > CTAB (Nagg = 9241) > SDS(Nagg = 6042). An increase in the aggregation number results inan increase in the surface charge of the micellar units which cansubsequently influence the prototropic equilibrium of the drug.Next, we contemplate the modifications of the emission
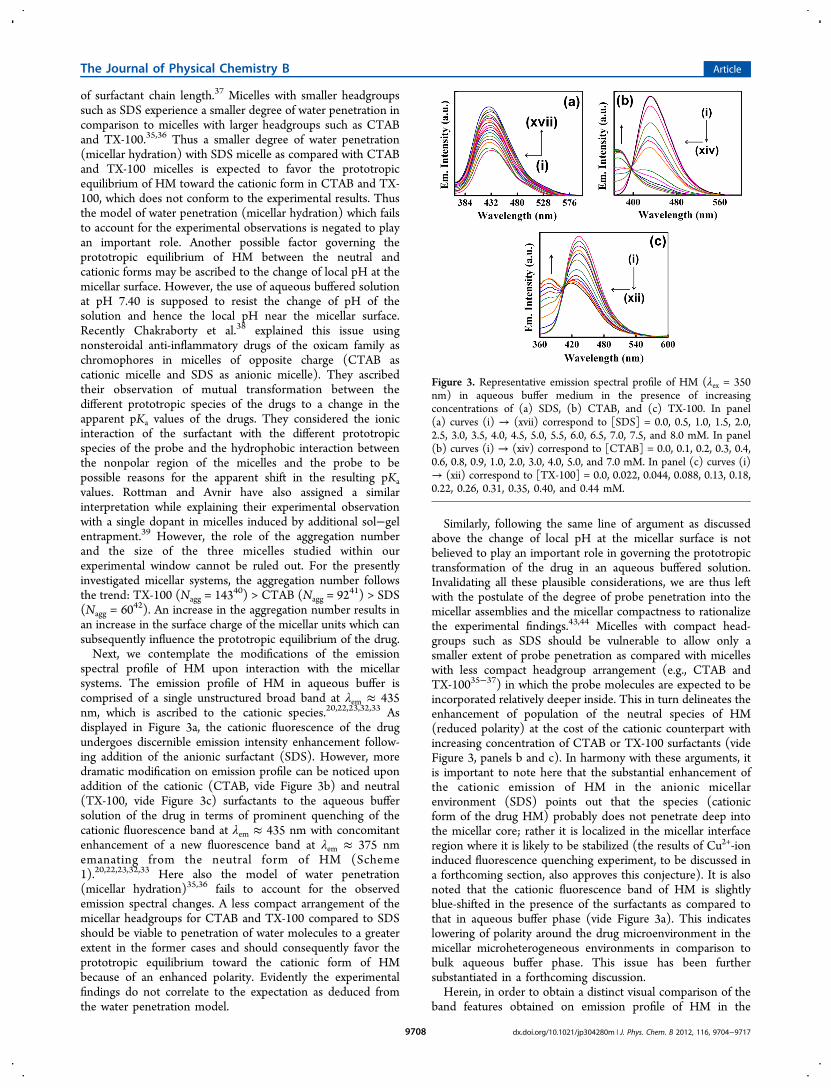
spectral profile of HM upon interaction with the micellarsystems. The emission profile of HM in aqueous buffer iscomprised of a single unstructured broad band at λem ≈ 435nm, which is ascribed to the cationic species.20,22,23,32,33 Asdisplayed in Figure 3a, the cationic fluorescence of the drugundergoes discernible emission intensity enhancement follow-ing addition of the anionic surfactant (SDS). However, moredramatic modification on emission profile can be noticed uponaddition of the cationic (CTAB, vide Figure 3b) and neutral(TX-100, vide Figure 3c) surfactants to the aqueous buffersolution of the drug in terms of prominent quenching of thecationic fluorescence band at λem ≈ 435 nm with concomitantenhancement of a new fluorescence band at λem ≈ 375 nmemanating from the neutral form of HM (Scheme1).20,22,23,32,33 Here also the model of water penetration(micellar hydration)35,36 fails to account for the observedemission spectral changes. A less compact arrangement of themicellar headgroups for CTAB and TX-100 compared to SDSshould be viable to penetration of water molecules to a greaterextent in the former cases and should consequently favor theprototropic equilibrium toward the cationic form of HMbecause of an enhanced polarity. Evidently the experimentalfindings do not correlate to the expectation as deduced fromthe water penetration model.
Similarly, following the same line of argument as discussedabove the change of local pH at the micellar surface is notbelieved to play an important role in governing the prototropictransformation of the drug in an aqueous buffered solution.Invalidating all these plausible considerations, we are thus leftwith the postulate of the degree of probe penetration into themicellar assemblies and the micellar compactness to rationalizethe experimental findings.43,44 Micelles with compact head-groups such as SDS should be vulnerable to allow only asmaller extent of probe penetration as compared with micelleswith less compact headgroup arrangement (e.g., CTAB andTX-10035−37) in which the probe molecules are expected to beincorporated relatively deeper inside. This in turn delineates theenhancement of population of the neutral species of HM(reduced polarity) at the cost of the cationic counterpart withincreasing concentration of CTAB or TX-100 surfactants (videFigure 3, panels b and c). In harmony with these arguments, itis important to note here that the substantial enhancement ofthe cationic emission of HM in the anionic micellarenvironment (SDS) points out that the species (cationicform of the drug HM) probably does not penetrate deep intothe micellar core; rather it is localized in the micellar interfaceregion where it is likely to be stabilized (the results of Cu2+-ioninduced fluorescence quenching experiment, to be discussed ina forthcoming section, also approves this conjecture). It is alsonoted that the cationic fluorescence band of HM is slightlyblue-shifted in the presence of the surfactants as compared tothat in aqueous buffer phase (vide Figure 3a). This indicateslowering of polarity around the drug microenvironment in themicellar microheterogeneous environments in comparison tobulk aqueous buffer phase. This issue has been furthersubstantiated in a forthcoming discussion.Herein, in order to obtain a distinct visual comparison of the
band features obtained on emission profile of HM in the
Figure 3. Representative emission spectral profile of HM (λex = 350nm) in aqueous buffer medium in the presence of increasingconcentrations of (a) SDS, (b) CTAB, and (c) TX-100. In panel(a) curves (i) → (xvii) correspond to [SDS] = 0.0, 0.5, 1.0, 1.5, 2.0,2.5, 3.0, 3.5, 4.0, 4.5, 5.0, 5.5, 6.0, 6.5, 7.0, 7.5, and 8.0 mM. In panel(b) curves (i) → (xiv) correspond to [CTAB] = 0.0, 0.1, 0.2, 0.3, 0.4,0.6, 0.8, 0.9, 1.0, 2.0, 3.0, 4.0, 5.0, and 7.0 mM. In panel (c) curves (i)→ (xii) correspond to [TX-100] = 0.0, 0.022, 0.044, 0.088, 0.13, 0.18,0.22, 0.26, 0.31, 0.35, 0.40, and 0.44 mM.
The Journal of Physical Chemistry B Article
dx.doi.org/10.1021/jp304280m | J. Phys. Chem. B 2012, 116, 9704−97179708
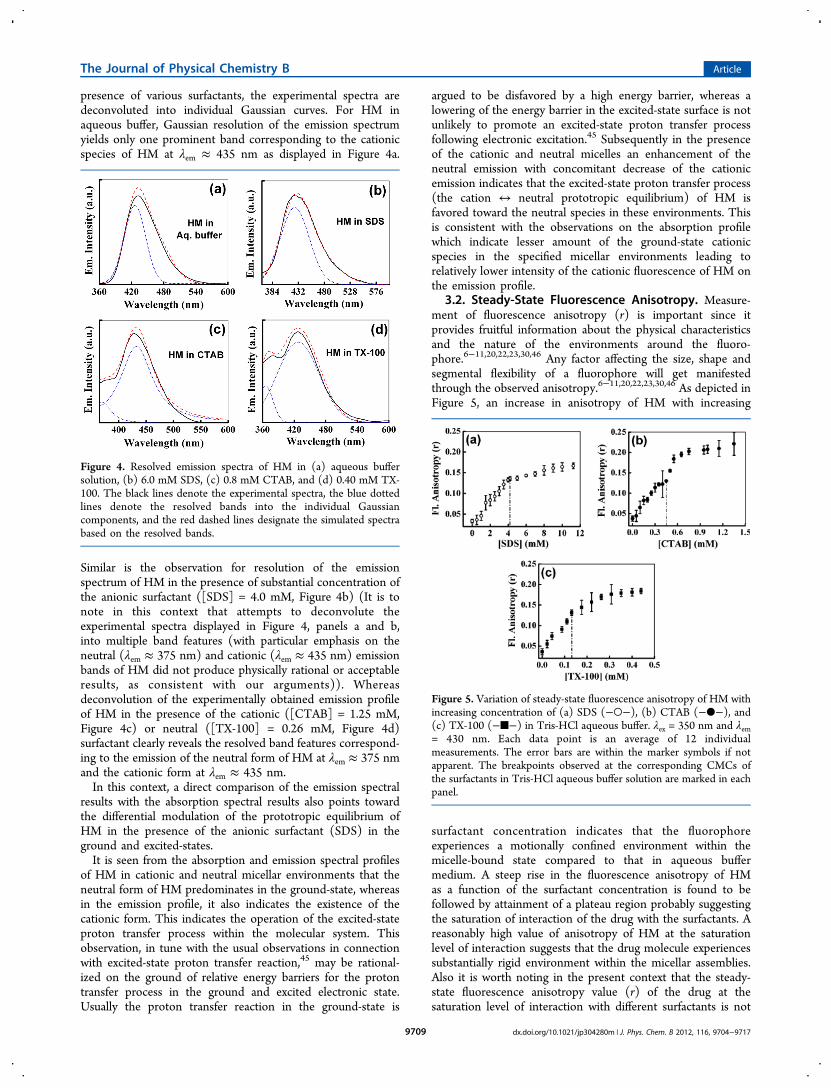
presence of various surfactants, the experimental spectra aredeconvoluted into individual Gaussian curves. For HM inaqueous buffer, Gaussian resolution of the emission spectrumyields only one prominent band corresponding to the cationicspecies of HM at λem ≈ 435 nm as displayed in Figure 4a.
Similar is the observation for resolution of the emissionspectrum of HM in the presence of substantial concentration ofthe anionic surfactant ([SDS] = 4.0 mM, Figure 4b) (It is tonote in this context that attempts to deconvolute theexperimental spectra displayed in Figure 4, panels a and b,into multiple band features (with particular emphasis on theneutral (λem ≈ 375 nm) and cationic (λem ≈ 435 nm) emissionbands of HM did not produce physically rational or acceptableresults, as consistent with our arguments)). Whereasdeconvolution of the experimentally obtained emission profileof HM in the presence of the cationic ([CTAB] = 1.25 mM,Figure 4c) or neutral ([TX-100] = 0.26 mM, Figure 4d)surfactant clearly reveals the resolved band features correspond-ing to the emission of the neutral form of HM at λem ≈ 375 nmand the cationic form at λem ≈ 435 nm.In this context, a direct comparison of the emission spectral
results with the absorption spectral results also points towardthe differential modulation of the prototropic equilibrium ofHM in the presence of the anionic surfactant (SDS) in theground and excited-states.It is seen from the absorption and emission spectral profiles
of HM in cationic and neutral micellar environments that theneutral form of HM predominates in the ground-state, whereasin the emission profile, it also indicates the existence of thecationic form. This indicates the operation of the excited-stateproton transfer process within the molecular system. Thisobservation, in tune with the usual observations in connectionwith excited-state proton transfer reaction,45 may be rational-ized on the ground of relative energy barriers for the protontransfer process in the ground and excited electronic state.Usually the proton transfer reaction in the ground-state is
argued to be disfavored by a high energy barrier, whereas alowering of the energy barrier in the excited-state surface is notunlikely to promote an excited-state proton transfer processfollowing electronic excitation.45 Subsequently in the presenceof the cationic and neutral micelles an enhancement of theneutral emission with concomitant decrease of the cationicemission indicates that the excited-state proton transfer process(the cation ↔ neutral prototropic equilibrium) of HM isfavored toward the neutral species in these environments. Thisis consistent with the observations on the absorption profilewhich indicate lesser amount of the ground-state cationicspecies in the specified micellar environments leading torelatively lower intensity of the cationic fluorescence of HM onthe emission profile.
3.2. Steady-State Fluorescence Anisotropy. Measure-ment of fluorescence anisotropy (r) is important since itprovides fruitful information about the physical characteristicsand the nature of the environments around the fluoro-phore.6−11,20,22,23,30,46 Any factor affecting the size, shape andsegmental flexibility of a fluorophore will get manifestedthrough the observed anisotropy.6−11,20,22,23,30,46 As depicted inFigure 5, an increase in anisotropy of HM with increasing
surfactant concentration indicates that the fluorophoreexperiences a motionally confined environment within themicelle-bound state compared to that in aqueous buffermedium. A steep rise in the fluorescence anisotropy of HMas a function of the surfactant concentration is found to befollowed by attainment of a plateau region probably suggestingthe saturation of interaction of the drug with the surfactants. Areasonably high value of anisotropy of HM at the saturationlevel of interaction suggests that the drug molecule experiencessubstantially rigid environment within the micellar assemblies.Also it is worth noting in the present context that the steady-state fluorescence anisotropy value (r) of the drug at thesaturation level of interaction with different surfactants is not
Figure 4. Resolved emission spectra of HM in (a) aqueous buffersolution, (b) 6.0 mM SDS, (c) 0.8 mM CTAB, and (d) 0.40 mM TX-100. The black lines denote the experimental spectra, the blue dottedlines denote the resolved bands into the individual Gaussiancomponents, and the red dashed lines designate the simulated spectrabased on the resolved bands.
Figure 5. Variation of steady-state fluorescence anisotropy of HM withincreasing concentration of (a) SDS (−○−), (b) CTAB (−●−), and(c) TX-100 (−■−) in Tris-HCl aqueous buffer. λex = 350 nm and λem= 430 nm. Each data point is an average of 12 individualmeasurements. The error bars are within the marker symbols if notapparent. The breakpoints observed at the corresponding CMCs ofthe surfactants in Tris-HCl aqueous buffer solution are marked in eachpanel.
The Journal of Physical Chemistry B Article
dx.doi.org/10.1021/jp304280m | J. Phys. Chem. B 2012, 116, 9704−97179709
equal and hence delineates the differential degrees of motionalrestriction imparted on the drug molecule in different micellarassemblies. Following the same line of argument as discussedabove (section 3.1), the extent of probe penetration into themicellar units can be invoked to rationalize this observation.Micelles with smaller headgroups (e.g., SDS) ensures a morecompact arrangement which in consequence allows relativelylesser degree of probe penetration into the micellar assembliesas against the case of micelles with larger headgroups (e.g.,CTAB and TX-100) incorporating the probe molecules into adeeper inside.34−36 Thus the microenvironment in theimmediate vicinity of the probe molecule is expected to bemore rigid and less polar in the cationic (CTAB) and neutral(TX-100) micelles in comparison to that in the anioniccounterpart (SDS). This accounts for a larger magnitude offluorescence anisotropy of HM in CTAB and TX-100 micellarassemblies compared to that in SDS at the saturation level ofinteraction (vide Figure 5).It is interesting to note at this stage that the variation of
steady-state fluorescence anisotropy (r) of the drug as afunction of the surfactant concentration follows a specificpattern. A close perusal of Figure 5 reveals a breakpoint in thepattern of variation of fluorescence anisotropy in the vicinity ofrespective CMC values of the surfactants in aqueous buffer(Tris-HCl buffer, pH 7.40) medium. The CMC values of thesurfactants thus estimated from Figure 5 are collected in Table1 and found to juxtapose well with reported literature.47−49 It is,
however, pertinent here to underscore that we employ thevariation of fluorescence anisotropy (r) of the probe withsurfactant concentration as the actuating tool for estimation ofthe CMCs, instead of more conventionally applied technique ofusing the variation of fluorescence intensity of a fluorophore. Inthe course of verifying the applicability of different photo-physical parameters of the probe in this respect, we found thatthe complex nature of the variation of fluorescence intensity ofHM with varying surfactant concentrations (section 3.1, Figure3) is not an appropriate choice for precisely locating the CMCs.Conversely, the pattern of variation of fluorescence anisotropy(r) emanated to be an efficient tool in pointing out therespective CMCs of the surfactants studied.3.3. Drug−Micelle Binding. A quantitative assessment for
the drug−micelle binding interaction can be derived in terms ofevaluation of the binding constant (K) and the free energychange (ΔG) for the binding process. The estimation ofbinding constant rests on an analysis of the fluorescenceintensity data of the drug (since the fluorescence intensity ofHM differs significantly upon interaction with the studied
micellar systems) following the method described by Almgrenet al.44 in which the binding constant (K) is expressed throughthe following relationship:
−=
−+
∞I I I I K1 1 1
[M]x 0 0 (5)
in which I0, Ix, and Iα designate respectively the fluorescenceintensity of the drug in the absence of surfactant, at anintermediate concentration of surfactant, and under conditionsof saturation of interaction.The micellar concentration [M] is given as
= −N
[M][S] CMC
agg (6)
in which [S] represents the surfactant concentration, CMC isthe critical micellar concentration, and Nagg is the aggregationnumber of the surfactant under consideration. The values ofNagg and CMCs are collected in Table 1.Figure 6 displays the 1/[Ix − I0] vs 1/[M] plots for HM in
the three different micellar environments and the binding
constant values have been calculated from the intercept to sloperatio of the respective plots following eq 5, and the free energychange (ΔG) for the drug−micelle binding process has beensubsequently calculated from the relationship ΔG = −RT ln K.The data compiled in Table 1 reveals the thermodynamic
feasibility of the drug−micelle binding interaction process in allthree cases under investigation through a negative free energychange.6,7,22,23,30,42,44 Of particular interest in this context is tonote the relative order of magnitude of the binding constants invarious micellar assemblies. The data collected in Table 1evince the same order of drug−micelle binding constant withthe cationic (CTAB) and neutral (TX-100) micelles, whereas itis clearly 1 order of magnitude lower with the anionic micelle(SDS). Apparently a lower magnitude of binding constant ofthe cationic probe (HM) with the anionic micelle (SDS) incomparison to the cationic (CTAB) or neutral (TX-100)counterparts appears to contradict our usual expectations basedon electrostatic stabilization of the interaction between cationicdrug (HM) and anionic micelle (SDS). However, the resultscan be rationalized in terms of the aforementioned postulate of
Table 1. Micellar Parameters of SDS, CTAB, and TX-100 inAqueous Buffer Medium (Tris-HCl Buffer, pH 7.40) andDrug (HM)−Micelle Binding Parameters
aAggregation number (Nagg) of the micellar systems.bCritical micellar
concentration (CMC) values of the surfactants in aqueous buffermedium. cHydrodynamic radius. dDrug (HM)−micelle bindingconstant (K). eFree energy change (ΔG) for the drug (HM)−micellebinding process at the experimental temperature (T = 300.0 K).
Figure 6. Plot of [Ix − I0]−1 vs [M]−1 (mM−1) in (a) SDS, (b) CTAB,
and (c) TX-100 for determination of drug−micelle binding constant.
The Journal of Physical Chemistry B Article
dx.doi.org/10.1021/jp304280m | J. Phys. Chem. B 2012, 116, 9704−97179710
degree of probe penetration into the micellar units (asdiscussed in sections 3.1 and 3.2). Incorporation of the probemolecules into a deeper inside the cationic and neutral micelleshould conform to a more compact arrangement of the probemolecules after interaction with the micellar units as comparedwith the anionic micelle which allows lesser degree of probepenetration (also in anionic micellar environment the cationicspecies of the drug is likely to be stabilized out of favorableelectrostatic interaction whence the cationic drug is argued tobe preferably localized at the micellar interfacial region ratherthan penetrating deep into the micellar core).6,34−36 Thus theresults of the drug−micelle binding constant (vide Table 1) arefound to correlate well to the steady-state anisotropy data asdiscussed in the previous section.3.4. Polarity of the Micellar Microenvironment:
Assessment of the Probable Location of the Drug. Theprecise determination of microscopic polarity of biological andbiomimicking assemblies is an important goal in biological andbiochemical research. Environment sensitive photophysicalproperties of fluorescent probes have been employed in servingthis purpose since a couple of decades.7,20,22,23,34,46,50 The localpolarity of the drug binding site on the micelle can be estimatedby comparing the spectral properties of the drug in theenvironment with those in pure solvent or solvent mixture ofknown polarity. Although the polarity of a microheterogeneousenvironment is not exactly the same as that of a homogeneousfluid, a relative estimate of the micropolarity around thefluorophore generally yields reliable results.7,20,22,23,34,46,50 Thispolarity has been referred as the static polarity by Sytnik andKasha.51 The medium polarity-sensitive prototropic trans-formation of HM has formed the actuating basis in thisstudy. The fluorescence behavior of HM has been monitored invarying compositions of water−1,4-dioxane mixture of knownpolarity and is displayed in Figure 7a. It is seen that decreasing
polarity of the medium (increasing the dioxane proportion inthe water/1,4-dioxane solvent mixture) is associated with aregular depletion of the cationic fluorescence with concomitantemergence of a new band at λem ∼ 375 nm corresponding tothe neutral species of HM (Scheme 1).20,22,23,32,33 Theconsequent increasing degree of destabilization of the cationic
species with decreasing medium polarity corroborates to thisobservation.20,22,23,32,33
The estimation of the polarity of drug microenvironment inmicellar microenvironment has been rested on comparison ofthe fluorescence properties of the drug within the micellarsystems to those observed in the reference solvent mixture. Acalibration curve (in form of a linear regression) has beenconstructed by plotting the relative variation (ICation/INeutral) ofcationic fluorescence intensity (ICation at λem ≈ 435 nm) to thatof the neutral form (INeutral at λem ≈ 375 nm) of HM in water−1,4-dioxane reference solvent mixture as a function of thepolarity equivalent parameter, ET(30).
51,52 The same parameterICation/INeutral has been constructed for modulation of emissionintensity of HM in the cationic (CTAB) and neutral (TX-100)micellar environments (with all experimental conditions andinstrumental settings conserved) and interpolation of the valueon the calibration curve leads to the micropolarity of the drugbinding site in the micellar assemblies as to be 51.41 for CTABand 51.29 for TX-100 on the ET(30) (in kcal mol−1) scale(Figure 7b). Herein, ratiometric calibration scheme (ICation/INeutral) has been emphasized during estimation of the polarityin the immediate vicinity of the drug in micellar micro-heterogeneous environments as it is more fruitful as anactuating tool since it is independent of experimental andinstrumental artifacts like fluctuations in probe concentration,excitation source intensity, light scattering, stability underillumination, and so forth, and hence is independent of theneed of frequent calibration during estimation of the parameter.The estimated values of micropolarity of the drug in the
immediate vicinity of its interaction site within the micellarenvironments thus indicates a reduced polarity in comparisonto that in aqueous buffer phase (ET(30) = 63.1 kcal mol−1).The values are also found to bear reasonable harmony toliterature reports for the polarities of the Stern layer of themicellar systems as determined earlier using betaine dye,53 4-N,N′-dimethylamino-3-hydroxyflavone54 and 1-anilino-8-naph-thalene sulfonate.55 The present results thus suggest that thedrug molecule is probably localized in the Stern layer of thecationic and neutral micellar environments.However, the same technique here cannot be applied for
determination of micropolarity of the drug microenvironmentwithin the anionic micelle (SDS) because the fluorescenceprofile of the drug in anionic micelle (vide Figure 3a) showingonly one band corresponding to the cationic emission of HMcannot be paralleled to the observations illustrated in Figure 7a.Thus in order to cast light on the probable location of theprobe in anionic micellar environment and also to reinforce theinterpretations derived from the micropolarity measurement,the following strategy of externally modifying the fluorescenceproperties of HM in aqueous buffer and micelle-bound HM hasbeen undertaken.
Fluorescence Quenching. In an endeavor to externallymodify the fluorescence of micelle-bound HM we adopted thestrategy of fluorescence quenching of the probe in differentenvironments. This is a simple but efficient strategy forassessing the location of the probe within the micellarenvironments. The bromide (Br−) or copper (Cu2+) ion-induced fluorescence quenching of HM has been followed onthe following Stern−Volmer equation30
= +II
K1 [Q]0SV (7)
Figure 7. (a) Emission profile of HM in varying composition of water-dioxane mixture (λex = 350 nm). Curves (i) → (x) correspond to %dioxane (by volume) = 0, 10, 20, 30, 40, 50, 60, 70, 80, and 90. (b)Construction of calibration curve for micropolarity determination byplotting the ratiometric variation of emission intensities of the cationicto neutral species of HM (ICation/INeutral) as a function of polarityequivalent parameter, ET(30) (in kcal/mol) of reference solventmixtures of water-dioxane. The micropolarity of HM interaction site inCTAB (−▲−, green) and TX-100 (−○−, purple) micellar systemsare indicated in the figure.
The Journal of Physical Chemistry B Article
dx.doi.org/10.1021/jp304280m | J. Phys. Chem. B 2012, 116, 9704−97179711
in which I0 is the original fluorescence intensity, I is thequenched intensity of the fluorophore (HM), [Q] is the molarconcentration of the quencher and KSV is the Stern−Volmerquenching constant. The higher the magnitude of KSV, themore efficient is the quenching ensuring the greater is thedegree of exposure of the quencher to the probe.20,22,23,30,34,42
The Stern−Volmer plots for bromide and Cu2+ ion-inducedquenching of HM in aqueous buffer and various micellarenvironments are displayed in Figure 8, panels a and b,
respectively. The negatively charged Br− ion is found to be anefficient quencher for HM (Figure 8a) corresponding to KSV(±10%) = 12.89 M−1. However, on performing the samequenching experiment on micelle-encapsulated probe (with allexperimental conditions and instrumental settings conserved),the extent of quenching is found to be noticeably modified(vide Figure 8a, Table 2). The quenching efficiency becomes
minimum for HM bound to anionic micelle (SDS), andmaximum for HM bound to cationic micelle (CTAB) while inthe neutral micellar environment (TX-100) the quenchingefficiency is intermediate between those observed in bulkaqueous buffer and anionic SDS micelle (vide Figure 8a, Table2). This scenario is readily understandable since in SDS micellethe repulsive electrostatic interaction between the negativesurface charge of the micelle and that of the quencher (Br− ion)should ensure considerable lowering of the quenchingefficiency by resisting a close accessibility of the quencher tothe fluorophore, while the reverse situation should prevail inthe cationic micellar environment (CTAB) accounting for anenhanced quenching efficiency.20,22,23,30,34,42
In order to further substantiate the results of Br− ion-inducedquenching experiment, the fluorescence quenching experimenthas also been performed with a cationic quencher viz., Cu2+ ion.The results of Cu2+ ion-induced fluorescence quenching on
HM in aqueous buffer and in various micellar environments arefound to follow a qualitatively reverse pattern with respect tothose observed during Br− ion-induced quenching (vide Table2, Figure 8b). The positively charged quencher (Cu2+ ion) isfound to be a feeble quencher for the cationic probe moleculeHM (KSV (±10%) = 5.07 M−1) as can be rationalized on thelexicon of electrostatic repulsion between the like charges of theprobe and the quencher resisting a close approach between theconcerned partners. Whereas in anionic micellar environmentthe Cu2+ ion-induced quenching efficiency is found to beremarkably enhanced (vide Table 2) presumably owing to highlocal concentration of the quencher ions near the surfacebecause of electrostatic attraction and thereby ensuring a closeaccessibility of the quencher to the probe.20,22,23,30,34,42
Cumulatively, the results of cationic (Cu2+ ion) and anionic(Br− ion) quencher induced fluorescence quenching experi-ments of HM in aqueous buffer and different micelle-encapsulated state demonstrate that the probe does notpenetrate deep into the micellar hydrophobic core region,which is characterized by highly viscous hydrocarbon-likeenvironment.20,22,23,30,34,42 For otherwise, had the probe beenlocated in the hydrophobic core of the micelles none of theionic quenchers could have been expected to impart discerniblemodulation in the extent of quenching depending on themicroheterogeneous environment of the probe as the hydro-phobic micellar core region should have restricted thepenetration of the ionic quencher.56
3.5. Wavelength-Sensitive Fluorescence Behavior:The Red-Edge Excitation Effect. A wavelength sensitivetool for directly monitoring the environment and dynamicsaround a fluorophore in a complex microheterogeneous systemand the solvation dynamics in an organized medium is the red-edge excitation shift or REES, i.e., the shifting of the emissionmaxima to the red end of the spectrum upon shifting of theexcitation wavelength to the red end of the absorptionspectrum of the fluorophore.6,7,20,23,30,57,58 Here we havemonitored the dependence of emission maxima of HM onexcitation wavelength in the presence of different surfactantsand the results are displayed in Figure 9a along with arepresentative case showing the occurrence of REES withCTAB-bound micelle in Figure 9b. The occurrence ofexcitation-wavelength dependence is connected to the presenceof ensembles of molecules in the ground-state differing in theirsolvation sites and hence energies.57,58 Precisely, the operation
Figure 8. Stern−Volmer plot for (a) bromide ion (Br−) and (b) Cu2+
ion-induced fluorescence quenching of the drug (HM) in aqueousbuffer (−○−; orange), 0.80 mM CTAB (−●−; green), 0.31 mM TX-100 (−■−; purple), and 6.0 mM SDS (−▲−; pink) micellarenvironments.
Table 2. Fluorescence Quenching Data for HM in AqueousBuffer and Micellar Media
environment quencher KSV (±10%) (M−1)
aqueous buffer Cu2+ 5.07Br− 12.89
SDS Cu2+ 687.4Br− 1.01
CTAB Cu2+
Br− 16.18TX-100 Cu2+ 1.15
Br− 6.72
Figure 9. (a) Red-Edge Excitation Shift (REES) profile for HM in thepresence of varying surfactant concentrations as specified in the figurelegend. The REES profile is described in terms of shifting of theemission maxima to the red upon shifting of the excitation wavelengthto the red end of the absorption spectrum. (b) A representative casefor the occurrence of REES in micelle-bound drug (HM) for [CTAB]= 0.80 mM.
The Journal of Physical Chemistry B Article
dx.doi.org/10.1021/jp304280m | J. Phys. Chem. B 2012, 116, 9704−97179712
of REES is subject to the following conditions: (a) there shouldexist a distribution of solute−solvent interaction energy leadingto inhomogeneous broadening of the absorption spectra whichsubsequently will allow the provision of site photoselection ofenergetically different species. Such inhomogeneous broad-ening is shown to be particularly significant for moleculeshaving a greater dipole moment in the excited-state than in theground-state, and is described by a simple expression accordingto Onsager sphere approximation:57
ν μρΔ = Δ −A k T( )3/2B
1/2(8)
Here A is a constant that depends on the dielectric constant ofthe medium, ρ is the Onsager cavity radius, kB is theBoltzmann’s constant and Δμ is the change of dipole momentfollowing excitation. However, additional broadening, whichcan play even a greater role in inhomogeneous broadening ofabsorption spectra, may be induced by specific interactions ofthe sort of hydrogen bonding, electrostatic interactions and soforth.57,58 (b) Second, the solvent molecules around thefluorophore must be polar and the solvent reorientation time(⟨τsolvent⟩) should be slower or comparable to the fluorescencelifetime (τf) of the fluorophore so that unrelaxed fluorescencecan give rise to excitation-wavelength-dependent emissionbehavior.Figure 9a illustrates that the shift of excitation wavelength
from 380 to 410 nm resulting in shift of the emission maxima ofthe probe to the red.59 The effect is seen in a general mannerfor a range of surfactant concentration, which suggests thatbinding of the probe to the micelles offers restriction to therotation of solvent dipoles around the excited fluorophore.Furthermore, given the complex microheterogeneous nature ofthe micellar environments additional broadening of absorptionspectra (as mentioned above) is not unlikely to contribute tothe operation of REES in the present case.6,7,20,23,30,57,58
In a nut-shell, the present observations imply that binding ofHM to the micellar systems causes considerable restriction tothe orientation of solvent dipoles around the excited-statefluorophore. It is also interesting to note in the present contextthat a high degree of REES is observed for the drug in thecationic (CTAB) and neutral (TX-100) micellar environmentas compared with the anionic micellar assembly (vide Figure9a). This is not surprising given the probable location of thedrug in the Stern layer of the micellar units in the former twocases (CTAB and TX-100) and in the micelle-water interfacialregion in the latter (SDS) since the Stern layer of micellarsystems is documented to be comprised of the micellarheadgroup, counterion and largely structured water mole-cules.12
3.6. Dynamic Light Scattering. Dynamic light scattering(DLS) measurement provides an effective way to investigatethe dimensions of macromolecular and supramolecularassemblies.8,41,42,46 It estimates the diffusion coefficient fromwhich the hydrodynamic radius of the particle (rh) can beevaluated using the Stokes−Einstein−Debye (SED) equationassuming the assembly to be spherical.8,41,42,46 In the presentcase the DLS profiles of the micellar systems investigated isfound to yield fairly monomodal distribution (figures notshown) and the as-obtained hydrodynamic radii are appendedin Table 1, which are found to juxtapose reasonably well withexisting literature.40−42,47−49 It is also noticed that addition ofthe probe to each of the micellar solutions could introducehardly any change in the hydrodynamic radii.
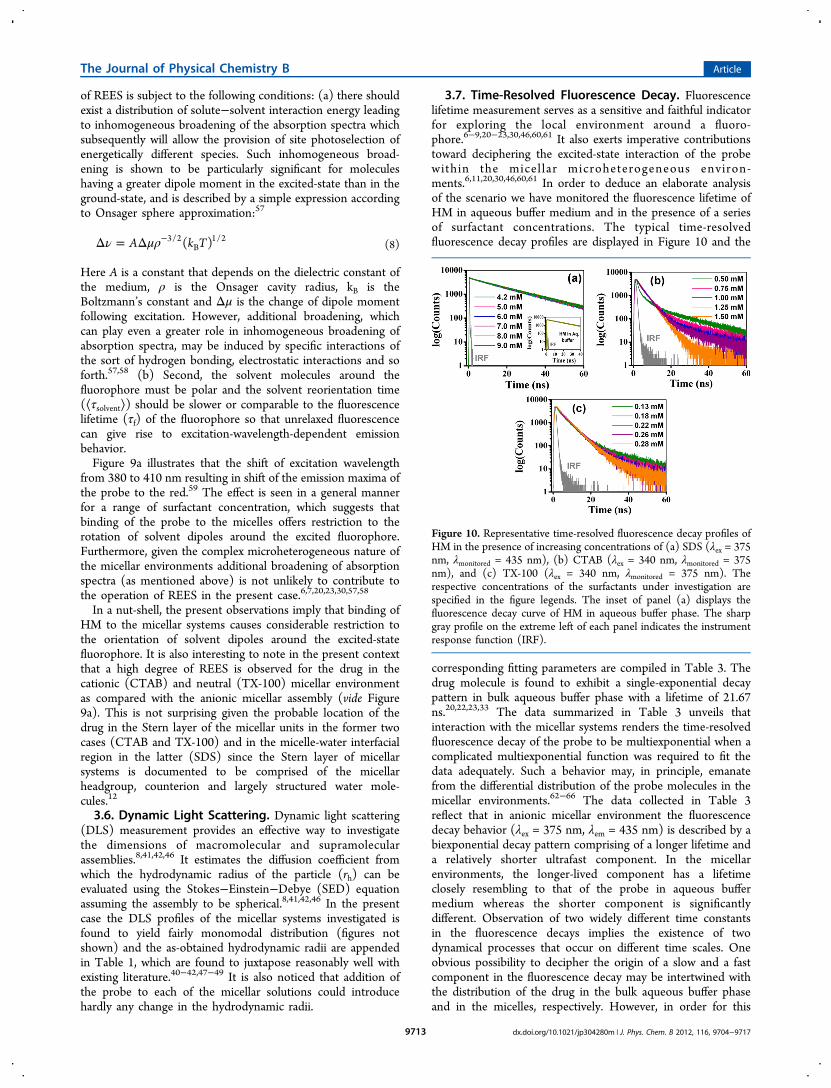
3.7. Time-Resolved Fluorescence Decay. Fluorescencelifetime measurement serves as a sensitive and faithful indicatorfor exploring the local environment around a fluoro-phore.6−9,20−23,30,46,60,61 It also exerts imperative contributionstoward deciphering the excited-state interaction of the probewithin the micel lar microheterogeneous environ-ments.6,11,20,30,46,60,61 In order to deduce an elaborate analysisof the scenario we have monitored the fluorescence lifetime ofHM in aqueous buffer medium and in the presence of a seriesof surfactant concentrations. The typical time-resolvedfluorescence decay profiles are displayed in Figure 10 and the
corresponding fitting parameters are compiled in Table 3. Thedrug molecule is found to exhibit a single-exponential decaypattern in bulk aqueous buffer phase with a lifetime of 21.67ns.20,22,23,33 The data summarized in Table 3 unveils thatinteraction with the micellar systems renders the time-resolvedfluorescence decay of the probe to be multiexponential when acomplicated multiexponential function was required to fit thedata adequately. Such a behavior may, in principle, emanatefrom the differential distribution of the probe molecules in themicellar environments.62−66 The data collected in Table 3reflect that in anionic micellar environment the fluorescencedecay behavior (λex = 375 nm, λem = 435 nm) is described by abiexponential decay pattern comprising of a longer lifetime anda relatively shorter ultrafast component. In the micellarenvironments, the longer-lived component has a lifetimeclosely resembling to that of the probe in aqueous buffermedium whereas the shorter component is significantlydifferent. Observation of two widely different time constantsin the fluorescence decays implies the existence of twodynamical processes that occur on different time scales. Oneobvious possibility to decipher the origin of a slow and a fastcomponent in the fluorescence decay may be intertwined withthe distribution of the drug in the bulk aqueous buffer phaseand in the micelles, respectively. However, in order for this
Figure 10. Representative time-resolved fluorescence decay profiles ofHM in the presence of increasing concentrations of (a) SDS (λex = 375nm, λmonitored = 435 nm), (b) CTAB (λex = 340 nm, λmonitored = 375nm), and (c) TX-100 (λex = 340 nm, λmonitored = 375 nm). Therespective concentrations of the surfactants under investigation arespecified in the figure legends. The inset of panel (a) displays thefluorescence decay curve of HM in aqueous buffer phase. The sharpgray profile on the extreme left of each panel indicates the instrumentresponse function (IRF).
The Journal of Physical Chemistry B Article
dx.doi.org/10.1021/jp304280m | J. Phys. Chem. B 2012, 116, 9704−97179713
proposition to be correct the ratio of the relative amplitudes,i.e., α1/α2, should have been corresponding to the ratio of freedye to the bound dye. In course of verifying the validity of thisconsideration, we have calculated the ratio of relativeconcentration of micelle-bound HM to that in aqueous bufferphase following the method described in the literature (byFayer et al., ref 65) and the value is found to be enormouslydifferent from the ratio α1/α2 (calculation suggests that morethan 95% dye is bound to micelle).20,66 This result explicitlydictates that the observed fluorescence decay in the micellarenvironment can be entrusted only on the dynamics of themicelle-bound probe while negating any considerable con-tribution from the free (unbound) dye. Further, it is imperativeto note in the present context (vide Table 3) that the lifetime ofthe cationic species (longer-lived component, τ1 in Table 3)comprises the major component in the overall decay patternand its relative amplitude is found to gradually increase withincreasing concentration of the anionic surfactant, which can beunderstandably argued on the ground of stabilization of thecationic species in the anionic micellar environment.The fluorescence decay behavior of HM in the presence of
the neutral (TX-100) or cationic (CTAB) micelle (λex = 340nm, λem = 375 nm) is found to bear a discernible harmony witheach other but differs from the findings in the presence of theanionic micelle (ca. Table 3). In the presence of the neutral orcationic micelle the fluorescence decay of the drug is found tobe adequately described by a complicated triexponentialfunction which dictates only a small contribution from thecationic species of HM (the longer-lived component, τ1 inTable 3). It is also encouraging to note that increasingsurfactant concentration (TX-100 and CTAB) accompaniesgradual decrease of relative amplitude of the cationic specieswhich can be argued to reflect decreasing degree of stabilizationof the cationic species of the drug in neutral or cationic micelleenvironments. This pattern of observation is found to be inconsensus with other experimental findings as discussedpreviously. Conversely, the relative increase in the amplitudeof the comparatively shorter component is also noteworthy. At
this juncture it appears logical to attribute this component tothe neutral species of the drug which is progressively stabilizedin the presence of increasing concentration of the neutral orcationic surfactant. This conjecture is further supported by thefluorescence lifetime of HM in bulk 1,4-dioxane medium (τf =2.87 ns) which resembles the observed shorter component inthe presence of the neutral and cationic surfactants (in bulk 1,4-dioxane medium the steady-state emission spectral profile ofthe drug represents the band due to the neutral species only,vide Figure 7). Monitoring the fluorescence decay behavior ofthe probe in cationic and neutral micelles at λex = 375 nm andλem = 435 nm has been found to yield no significant differencein the fluorescence lifetime of the cationic species which israther the minor component in the fluorescence decay pattern.However, it is noteworthy that the fluorescence decay
behavior of HM in micellar environments also reveals thepresence of an ultrafast component. A precise assignment forthis ultrafast decay component is lacking at this moment,however, keeping parity with many recent reports62−65 it is notunlikely in a complex microheterogeneous assembly, in whichthe probe may also undergo complex or/and unequalhydration.
3.8. Rotational-Relaxation Dynamics: Time-ResolvedFluorescence Anisotropy Decay. The time-dependentdecay of fluorescence anisotropy is a sensitive indicator of therotational motion and/or rotational-relaxation of the fluoro-phore in an organized assembly.8,9,20,23,30,56,67−69 Therefore,with a view to delve into the microenvironment in theimmediate vicinity of micelle bound-drug, time-resolvedfluorescence anisotropy decay has been recorded in the studiedmicellar environments. The typical anisotropy decay profile isdisplayed in Figure 11 and the relevant dynamic parameters aresummarized in Table 4. The anisotropy decay is described bythe following equation:30
∑ βθ=r t( )i
i i(9)
Table 3. Time-Resolved Fluorescence Decay Parameters for HM in Aqueous Buffer (Tris-HCl Buffer, pH 7.40) and MicellarEnvironments
dx.doi.org/10.1021/jp304280m | J. Phys. Chem. B 2012, 116, 9704−97179714
in which βi designates the pre-exponential factor for the ithrotational correlation time, θi.
The rotational-relaxation time of the drug is found to benotably enhanced within the microheterogeneous micellarassemblies compared with that in bulk aqueous buffer phaseconfirming the signature for impartation of considerable degreeof rigidity in the micellar microenvironments (vide Table 4).Further, that the rotational-relaxation time of the drug in all thestudied micellar environments (vide Table 4) is faster than thecorresponding fluorescence lifetimes in the same environment(vide Table 3) espouses that the excited-state fluorescencedepolarization of the drug is essentially completed within theexcited-state lifetime.A single exponential decay function has been exploited to
adequately describe the anisotropy decays of HM in aqueousbuffer as well as micellar environments. Now, several argumentsmight emanate to account for the relaxation of the fluorescenceanisotropy of the micelle bound-probe. The followingpossibilities are thus taken into consideration:8,9,20,23,30,56,67−69
(i) the fluorophore rotates within the micelle; (ii) theentrapped fluorophore cannot rotate but the micellar unitcarrying the probe rotates; and (iii) both rotations are possible.The third option is immediately negated with a view to the
observed single exponential anisotropy decay, since abiexponential decay pattern can only suitably interpret thepossibility of both the rotations being operative. Now, in anendeavor to confirm one of the former two possibilities we havecalculated the rotational-relaxation times of the micellar units(θM) according to the Stokes−Einstein−Debye (SED)relation:8,9,30,56
θ π η= rk T
43M h
3
B (10)
Here, η is the coefficient of viscosity of the medium, rh is thehydrodynamic radius of the micellar units (as obtained fromDLS measurement and summarized in Table 1), kB is theBoltzmann constant, and T is the Kelvin temperature. That the
rotational-relaxation times of the micellar units are remarkablyhigher than the corresponding fluorescence depolarizationtimes in respective environments leads to infer that theobserved rotational-relaxation dynamics is attributable to therotational motion of the probe only and not of the micellarunits.8,9,20,23,30,56,67,68
4. CONCLUSIONSThe present work reports the study of interaction of apromising cancer cell photosensitizer HM with micellarassemblies of varying surface charges. The binding interactionof the drug with the micelles is found to be governed by aconjugate effect of polarity and rigidity of the micellarmicroheterogeneous environments. The results of steady-stateand time-resolved fluorometric studies reveal the differentialmodulation of the prototropic equilibrium of the drug (HM) inmicellar environments of varying surface charges. The results ofmicropolarity measurement at the drug interaction site withinthe micelles combined with the results of fluorescencequenching experiments delineate the probable location of thedrug in the Stern layer of the cationic and neutral micellarsystems whereas in the anionic micellar system the drug isprobably localized in the micellar interfacial region. Theseresults have been found to corroborate well to the steady-statefluorescence anisotropy data assessing the relative degrees ofmotional rigidity imparted on the drug molecule in differentmicellar environments. In direct context to these results thewavelength-sensitive fluorescence behavior of the micelle-bound drug also appears consistent. The pattern of drug−micelle binding constant and the free energy change of theinteraction process are also found to be suitably rationalized onthe lexicon of the relative degrees of penetration of the druginto micellar units in the context of probable location of thedrug in various micellar environments.Overall, given the enormous biological applications of β-
carboline drugs and their promising prospects in manyburgeoning research arenas, e.g., photodynamic therapy andso forth, the study of characterization of the strength and modeof binding interaction of such drug molecules with relevantbiological and/or biomimicking receptors appear important.We are optimistic that the presently exploited experimentalprotocols and methodologies can be extended to other systemsalso.
Present Address§Department of Chemistry and Biochemistry, University ofColorado at Boulder, Boulder, Colorado 80309, United States.
Author Contributions†Equal contribution.
NotesThe authors declare no competing financial interest.
■ ACKNOWLEDGMENTSB.K.P. thankfully acknowledges CSIR, India for SeniorResearch Fellowship, D.R. acknowledges UGC, India for JuniorResearch Fellowship. N.G. thanks DST, India for financialassistance through Project No. SR/S1/PC/26/2008.
Figure 11. Typical time-resolved fluorescence anisotropy decay profileof HM in aqueous buffer (−□−; purple), 6.0 mM SDS (−●−; pink),1.00 mM CTAB (−▲−; green), and 0.26 mM TX-100 (−○−;orange).
Table 4. Rotational Dynamical Parameters of HM inAqueous Buffer (Tris-HCl Buffer, pH 7.40) and MicellarEnvironments
■ REFERENCES(1) Rekharsky, M. V.; Inoue, Y. Chem. Rev. 1998, 98, 1875−1917.(2) Villalonga, R.; Cao, R.; Fragoso, A. Chem. Rev. 2007, 107, 3088−3116.(3) Bodor, N. S. Chemical Aspects of Drug Delivery Systems; Karsa, D.R., Stephenson, R. A., Eds.; Royal Society of Chemistry: London,1996.(4) Xia, Y.; Rodgers, J.; Paul, K. E.; Whitesides, G. M. Chem. Rev.1999, 99, 1823−1848.(5) Hashimoto, S.; Thomas, J. K. J. Am. Chem. Soc. 1985, 107, 4655−4662.(6) Paul, B. K.; Samanta, A.; Guchhait, N. Langmuir 2010, 26, 3214−3224.(7) Paul, B. K.; Samanta, A.; Guchhait, N. J. Phys. Chem. B 2010, 114,6183−6196.(8) Paul, B. K.; Guchhait, N. J. Phys. Chem. B 2010, 114, 12528−12540.(9) Paul, B. K.; Guchhait, N. J. Colloid Interface Sci. 2011, 353, 237−247.(10) Rawat, S. S.; Kelkar, D. A.; Chattopadhyay, A. Biophys. J. 2005,89, 3049−3058.(11) Maiti, N. C.; Krishna, M. M.G.; Brito, P. J.; Periasamy, N. J.Phys. Chem. B 1997, 101, 11051−11060.(12) (a) Tanford, C. Science 1978, 200, 1012−1018. (b) Pal, S. K.;Mandal, D.; Bhattacharyya, K. J. Phys. Chem. B 1998, 102, 11017−11023. (c) Sen, P.; Mukherjee, S.; Halder, A.; Bhattacharyya, K. Chem.Phys. Lett. 2004, 385, 357−361. (d) Kalyanasundram, K. Photo-chemistry in Microheterogenous Systems; Academic Press: New York,1987.(13) Bloom, H.; Barchas, J.; Sandler, M.; Usdin, E. Progress in Clinicaland Biological Research. Beta-carbolines and Tetrahydroisoquinolines;Alan R. Liss Inc.: New York, 1982; Vol. 90.(14) Braestrup, C.; Nielsen, M.; Olsen, C. E. Proc. Natl. Acad. Sci.U.S.A. 1980, 77, 2288−2292.(15) Carlini, E. A. Pharmacol., Biochem. Behav. 2003, 75, 112−116.(16) Dolmans, D. E. J. G. J.; Fukumura, D.; Jain, R. K. Nature Rev.Cancer 2003, 3, 380−387.(17) Henderson, B., Dougherty, T., Eds.; Photodynamic Therapy:Basic Principles and Clinical Applications; Marcel Dekker Inc.: NewYork, 1992.(18) Reyman, D.; Pardo, A.; Poyato, J. M. L. J. Phys. Chem. 1994, 98,10408−10411.(19) Beljanski, M.; Beljanski, M. S. Exp. Cell Biol. 1982, 50, 79−87.(20) Paul, B. K.; Guchhait, N. J. Phys. Chem. B 2011, 115, 10322−10334.(21) Moulik, S. P. Curr. Sci. 1996, 71, 368−375.(22) Paul, B. K.; Guchhait, N. Photochem. Photobiol. Sci. 2012, 11,661−673.(23) Paul, B. K.; Guchhait, N. J. Phys. Chem. B 2011, 115, 11938−11949.(24) Yokoyama, M.; Kwon, G. S.; Okano, T.; Sakurai, Y.; Seto, T.;Kataoka, K. Bioconjugate Chem. 1992, 3, 295−301.(25) Wiedmann, T. S.; Kamel, L. J. Pharm. Sci. 2002, 91, 1743−1764.(26) Francis, M. F.; Cristea, M.; Winnik, F. M. Pure Appl. Chem.2004, 76, 1321−1335.(27) Kim, S.; Shi, Y; Kim, J. Y.; Park, K.; Cheng, J.-X. Expert Opin.2010, 7, 49−62.(28) Lipinski, C. A. Drug-like properties and the causes of poorsolubility and poor permeability. J. Pharmacol. Toxicol. Methods 2000,44, 235−249.(29) van Nostrum, C. F. Adv. Drug Delivery Rev. 2004, 56, 9−16.(30) Lakowicz, J. R. Principles of Fluorescence Spectroscopy; Plenum,New York. 1999.(31) Bevington, P. R.; Robinson, D. K. Data Reduction and ErrorAnalysis for the Physical Sciences, 2nd ed.; WCB/McGraw-Hill: Boston,1992.; Chapter 8.(32) Biondic, M. C.; Erra-Balsells, R. J. Chem. Soc., Perkin Trans.1997, 2, 1323−1328.
(33) Gonzalez, M. M.; Arnbjerg, J.; Denofrio, M. P.; Erra-Balsells, R.;Ogilby, P. R.; Cabrarizo, F. M. J. Phys. Chem. A 2009, 113, 6648−6656.(34) Mallick, A.; Chattopadhyay, N. Biophys. Chem. 2004, 109, 261−270.(35) Muller, N. Reaction Kinetics in Micelles In Cordes, E. A., Ed.;Plennum: New York, 1973.(36) Kalyanasundram, K.; Thomas, J. K. J. Am. Chem. Soc. 1977, 99,2039−2044.(37) Berr, S.; Jones, R. R. M.; Johnson, J. S. J. Phys. Chem. 1992, 96,5611−5617.(38) Chakraborty, H.; Banerjee, R.; Sarkar, M. Biophys. Chem. 2003,104, 315−325.(39) Rottman, C.; Avnir, D. J. Am. Chem. Soc. 2001, 123, 5730−5734.(40) Partearroyo, M. A.; Alonso, A.; Goni, F. M.; Tribout, M.;Paredes, S. J. Colloid Interface Sci. 1996, 178, 156−159.(41) Weidemaier, K.; Tavernier, H. L.; Fayer, M. D. J. Phys. Chem. B1997, 101, 9352−9361.(42) Saroja, G.; Ramachandram, B.; Saha, S.; Samanta, A. J. Phys.Chem. B 1999, 103, 2906−2911.(43) Shannigrahi, M.; Bagchi, S. Chem. Phys. Lett. 2004, 396, 367−371.(44) Almgren, M.; Grieser, F.; Thomas, J. K. J. Am. Chem. Soc. 1979,101, 279−291.(45) (a) Arnaut, L. G.; Formosinho, S. J. J. Photochem. Photobiol. A1993, 75, 1−20. (b) Zhao, J.; Ji, S.; Chen, Y.; Guo, H.; Yang, P. Phys.Chem. Chem. Phys. 2012, 14, 8803−8817. (c) Kosower, E. M.;Huppert, D. Annu. Rev. Phys. Chem. 1986, 37, 127−156. (d) Agmon,N. J. Phys. Chem. A 2005, 109, 13−35.(46) Paul, B. K.; Guchhait, N. Spectrochim. Acta A 2011, 81, 590−597.(47) Esposito, C.; Colicchio, P.; Facchiano, A.; Ragone, R. J. ColloidInterface Sci. 1998, 200, 310−312.(48) Geng, F.; Yu, L.; Lu, T.; Li, Z.; Zheng, L.; Li, G. J. Dispersion Sci.Technol. 2008, 29, 1209−1213.(49) Lopez, O.; Cocera, M.; Pons, R.; Azemar, N.; Lopez-Iglesias, C.;Wehrli, E.; Parra, J. L.; de la Maza, A. Langmuir 1999, 15, 4678−4681.(50) Vazquez, M. E.; Blanco, J. B.; Imperiali, B. J. Am. Chem. Soc.2005, 127, 1300−1306.(51) Sytnik, A.; Kasha, M. Proc. Natl. Acad. Sci. U.S.A. 1994, 91,8627−8630.(52) Reichardt, C. Chem. Rev. 1994, 94, 2319−2358.(53) Saroja, G.; Samanta, A. Chem. Phys. Lett. 1995, 246, 506−512.(54) Dennison, S. M.; Guharay, J.; Sengupta, P. K. Spectrochim. ActaA 1999, 55, 903−909.(55) Kalyansundram, K.; Thomas, J. K. J. Phys. Chem. 1977, 81,2176−2180.(56) Paul, B. K.; Guchhait, N. J. Colloid Interface Sci. 2011, 363, 529−539.(57) Demchenko, A. P. Luminesc. 2002, 17, 19−42.(58) Samanta, A. J. Phys. Chem. B 2006, 110, 13704−13716 andreferences therein..(59) During REES measurements meticulous care has been devotedto the selection of excitation wavelength to ensure that the variation ofλex involves shifting to the red end of the absorption spectra and notmerely the absorption maxima. This is a very crucial criterion for REESmonitoring.57,58
(60) Pramanik, R.; Sarkar, S.; Ghatak, C.; Rao, V. G.; Mandal, S.;Sarkar, N. J. Phys. Chem. B 2011, 115, 6957−696.(61) Ashby, K. D.; Das, K.; Petrich, J. W. Anal. Chem. 1997, 69,1925−1930.(62) Rosen, M. J. Surfactant and Interfacial Phenomena; Wiley Inter-Science: New York, 1978.(63) Bhattacharyya, K. Acc. Chem. Res. 2003, 36, 95−101.(64) Dutt, G. B. J. Phys. Chem. B 2003, 107, 10546−10551.(65) Dutta Choudhury, S.; Mohanty, J.; Pal, H.; Bhasikuttan, A. C. J.Am. Chem. Soc. 2010, 132, 1395−1401.(66) Quitevis, E. L.; Marcus, A. H.; Fayer, M. D. J. Chem. Phys. 1993,97, 5792−5769.
The Journal of Physical Chemistry B Article
dx.doi.org/10.1021/jp304280m | J. Phys. Chem. B 2012, 116, 9704−97179716
(67) Chakraborty, A.; Seth, D.; Setua, P.; Sarkar, N. J. Chem. Phys.2008, 128, 204510−204519.(68) Ghatak, C.; Rao, V. G.; Pramanik, R.; Sarkar, S.; Sarkar, N. Phys.Chem. Chem. Phys. 2011, 13, 3711−3720.(69) Paul, B. K.; Guchhait, N. Phys. Chem. Chem. Phys. 2012, 14,8892−8902.
The Journal of Physical Chemistry B Article
dx.doi.org/10.1021/jp304280m | J. Phys. Chem. B 2012, 116, 9704−97179717