17
Bio-fuels : OMCs’ Learning & Perspective 11.05.2016 By: Subodh Kumar, GM I/c (AE&SD), IOCL

Bio-fuels :
OMCs’ Learning & Perspective
11.05.2016
By: Subodh Kumar, GM I/c (AE&SD), IOCL

Need for Biofuels in India
Ethanol Blending in India
Bio-diesel Blending in India
Waste to Fuel
Way Forward
Outline
OMCs – Learning & Perspectives

Crude Ol Import
• Production: 37.5 MMT
• Import: 189.4 MMT ( Rs 687, 369 Cr)
Crude Oil Import
• Production: 36.9 MMT
• Import: 202.8 MMT ( Rs 4.2 Lakh Crore)
Increase in demand of Fossil Fuels
• Increase in Green House Gas Emission
Imperative need for
Renewable Energy like Bio Fuels
Economic and Environmental Issues to drive Bio Fuel Usage
Source: PPAC- 2015-16
Need for Biofuels

Bio-diesel Blending in India
2002
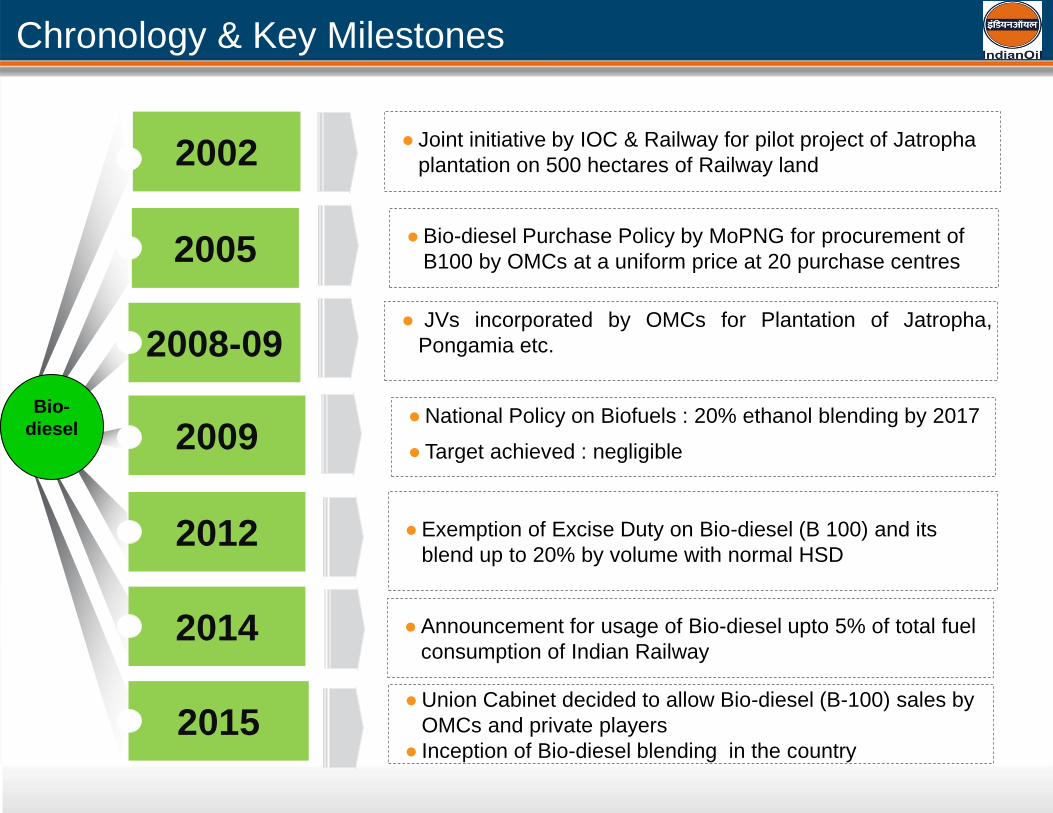
Chronology & Key Milestones
2014
2012
2008-09
2009
2005
2015
●Bio-diesel Purchase Policy by MoPNG for procurement of
B100 by OMCs at a uniform price at 20 purchase centres
●National Policy on Biofuels : 20% ethanol blending by 2017
● Target achieved : negligible
● JVs incorporated by OMCs for Plantation of Jatropha,
Pongamia etc.
●Exemption of Excise Duty on Bio-diesel (B 100) and its
blend up to 20% by volume with normal HSD
●Union Cabinet decided to allow Bio-diesel (B-100) sales by
OMCs and private players
● Inception of Bio-diesel blending in the country
Bio-
diesel
● Joint initiative by IOC & Railway for pilot project of Jatropha
plantation on 500 hectares of Railway land
●Announcement for usage of Bio-diesel upto 5% of total fuel
consumption of Indian Railway

HSD & Bio-diesel Demand Projection
Quantity in TKL
Bio-diesel Demand for Blending (@ 10%) HSD (Diesel) Projection
Source: Petroleum Planning and Analysis Cell and In-house projections
Quantity in TKL
102677 108935
115809 123196
131107
0
20000
40000
60000
80000
100000
120000
140000
2017-18 2018-19 2019-20 2020-21 2021-22
10268 10893
11581 12320
13111
0
2000
4000
6000
8000
10000
12000
14000
2017-18 2018-19 2019-20 2020-21 2021-22

Bio-diesel Blending & Supply Issues
Procurement 2015-16
HSD Industry Sale
2015-16
(TKL)
Bio-diesel (B 100)
Requirement @ 5%
(TKL)
B100 Supply/
Procurement
(TKL)
Blending Target
Achieved
(%)
88,330 4,417 12.3 0.014
Bio-diesel production from domestic non-edible oil seeds is not viable
Low seed yield of existing Jatropha plantations under wasteland conditions
Absence of High Yield Varieties (HYVs)
Higher plantation maintenance cost
Non availability of wastelands on commercial scale
Current Production Scenario
Annual production capacity - 1.2 MMT
Major feedstock - Palm Stearin
Capacity Utilization - very limited
No direct linkage between Crude Palm Oil & Crude Oil import price
Taxation and storage issues
Supply Issues

First generation biodiesel projects (Jatropha plantation and other Tree-
Borne Oilseed crops):
- subject to development of High Yielding Varieties (HYVs)
- Limited contribution due to inherent issues i.e. huge wasteland land
requirement, supplemental irrigation, harvesting etc.
Key drivers - Policy framework along with suitable infrastructure
development :
- Necessary infrastructure already developed by OMCs @ 5% Bio-diesel
Blending
Commercially viable next generation Biofuels
- May change Bio-diesel landscape in the future
Bio-diesel : Way forward

Ethanol Blending in India

2002
EBP: Chronology & Key Milestones
2014
2013
2009
2010
2007
2015
●Mandatory target : 5% ethanol blending with Gasoline
●With fixed Ethanol procurement price : INR 21.50 per litre
● Fixed provisional ex-factory price of INR 27 per litre
●Expert Committee formed for final ethanol pricing policy
●National Policy on Biofuels : 20% ethanol blending by 2017
● Target achieved less than 2%
●Directives for upto 10 % blending; overall 5% blending target
●Ethanol production only from indigenous molasses
●Market driving pricing of ethanol through tenders
●Ethanol Blending Achieved : 3%
EBP
● Inception with non mandatory targets
●Rates determined through tenders; did not take off
●Revised Price Mechanism
● Fixed delivered ethanol price ; INR 48.50 - 49.50 per litre

Gasoline & Ethanol Demand Projection
Quantity in TKL
Ethanol Demand For Blending (@ 10%) Gasoline Projection
Quantity in TKL
28629 31086
33697 36469
39411
42650
2016-17 2017-18 2018-19 2019-20 2020-21 2021-22
Source: Petroleum Planning and Analysis Cell and In-house projections
2863 3109
3370 3647
3941
4265
2016-17 2017-18 2018-19 2019-20 2020-21 2021-22

Ethanol Blending & Supply Issues
Ethanol Blending
Ethanol Supply Issues
200
280
100 50
365 305
382 350
800
1.41
1.82 1.76 1.40
1.61 1.35
2.83
0.00
1.00
2.00
3.00
4.00
5.00
6.00
7.00
0
100
200
300
400
500
600
700
800
900
2007 2008 2009 2010 2011 2012 2013 2014 2015
Ethanol Supplies (TKL) Blend rate (%)
● Feedstock Availability (Molasses)
●Single feedstock & no uniform availability across the country
● Sugarcane as water intensive crop
●Next generation Ethanol - no commercial scale production
● State wise policies and duty structure for Ethanol
●Restriction on movement of Ethanol across states
●Competitive usage by Potable & Chemical Industries
Blending with
Gasoline, 35%
Potable Liquor, 43%
Industrial Consumption, 22%
Total Production: 2600 TKL
Necessary infrastructure available with OMCs @ 10% blending

Waste to Fuel

Indian Perspective
Composting, 279
Vermi-Compost,
138
Bio-gas plant, 172
Pelletization, 29
Waste to Energy, 8
• Total urban MSW : 62 MMT/ annum
o Waste Collection : 68%
• Organic Waste : 51%
• Inert & Non Organic : 32%
• Recyclable : 17%
• MSW Treated & processed : 10 MMT/ annum
• Projected MSW 2031 : 165 MMT/ annum
• Potential
• Bio-gas : 3 MMT/annum
• RDF : 32 TMT ( 5 MW x 88 power plants)
Number of Waste to Fuel Plants

Waste : Revenue Streams
Waste collection &
segregation
Bio-
methanation Compost
Bio-gas
Combustible RDF
Brick
making
Plastic Waste to Fuel
Oil
Recyclables

Swatch Bharat: Waste to Energy at Varanasi
Anaerobic Digester
Waste Receipt & Segregation
by VMC
Organic Waste
Briquetting
Plastic, paper, cloth
Refuse Derived Fuel
Bio-gas Bio-gas storage H2S & CO2 separators
Bio-CNG compressor
Bio-CNG
Bio-fertilizer
Bio gas generator for captive power
• Expected Commissioning – July’17
• 10 x 5 TPD • Produce : Bio-gas (generate electricity for street lamps) & compost • Expected Commissioning : July’16
Decentralized Waste to fuel plants under CSR
Integrated 200 Tonnes/day plant

Thank You….


