This document is downloaded from DR‑NTU (https://dr.ntu.edu.sg) Nanyang Technological University, Singapore. Bioaccumulation and ecotoxicity study of perfluorinated chemicals Liu, Changhui 2014 Liu, C. (2014). Bioaccumulation and ecotoxicity study of perfluorinated chemicals. Doctoral thesis, Nanyang Technological University, Singapore. https://hdl.handle.net/10356/61603 https://doi.org/10.32657/10356/61603 Downloaded on 15 Jan 2022 21:41:27 SGT
Transcript
This document is downloaded from DR‑NTU (https://dr.ntu.edu.sg)Nanyang Technological University, Singapore.
Bioaccumulation and ecotoxicity study ofperfluorinated chemicals
Liu, Changhui
2014
Liu, C. (2014). Bioaccumulation and ecotoxicity study of perfluorinated chemicals. Doctoralthesis, Nanyang Technological University, Singapore.
https://hdl.handle.net/10356/61603
https://doi.org/10.32657/10356/61603
Downloaded on 15 Jan 2022 21:41:27 SGT
BIOACCUMULATION AND ECOTOXICITY STUDY OF PERFLUORINATED CHEMICALS
LIU CHANGHUI
SCHOOL OF CIVIL AND ENVIRONMENTAL ENGINEERING
2014
BIOACCUMULATION AND ECOTOXICITY STUDY OF PERFLUORINATED CHEMICALS
LIU CHANGHUI
School of Civil and Environmental Engineering
A thesis submitted to the Nanyang Technological University in partial fulfillment of the requirement for the degree of Doctor of Philosophy
2014
Acknowledgements
The dissertation was compiled at School of Civil and Environmental Engineering,
Nanyang Technological University. I would like to express my sincere gratitude to those
who have accompanied and continuously support me during my 4 years’ PhD study.
I would like to present my deep gratitude to Prof. Karina Gin for her precious advice and
continuous support from the beginning to the completion. Her sympathy in both research
and life has kept me balanced and her patient guidance has eased the difficulties through
the study. I would not have expected a better advisor.
I am truly grateful to Prof. Victor Chang for his guidance and valuable advices. He was
always supportive of my work, and always provides new prospective of the research ideas
I had. I am lucky to have him as my mentor.
Sincere gratitude to Prof. Martin Reinhard and Prof. Beverly Goh for their valuable
advices.
Big thanks to both Prof. Gin and Prof. Chang’s group members. Thank you all for your
support, sharing of experience, and generous help. You guys brought me much fun and
encouragement to the sometimes tedious and even suffering PhD life. Special thanks to Dr.
Viet Tung Nguyen for his help and guidance with the LC MS/MS. My experiments could
not be completed smoothly without his support.
Sincere thanks also go to our lovely technical staff in the Environment Laboratory for their
kindly help during my experiments.
Finally, sincere thanks to my family for their continuous support and encouragement.
Without them, my pursuit of dream in research would never been possible. Special thanks
to my husband Zhou Yuan, not only for his assistance with Matlab and data analysis but
also for his unconditionally support throughout my PhD study.
i
Contents
Abstract …………………………………………………………………………..…..……vi
List of Publications…………………………………………………...…………………..viii
List of Tables……………………………………………………….......................…….…ix
List of Figures……………………………………………………………………….…...…x
List of Symbols…………………………………………………………………….…...…xii
List of Abbreviations……………………………………...………………………….......xiii
1 Chapter One Introduction ............................................................................1
96%), were purchased from Sigma-Aldrich (St. Louis, MO). The internal standards,
perfluoro-n-[1,2,3,4-13C4]octanoic acid (MPFOA, 99%) and sodium perfluoro-1-[1,2,3,4-13C4]octanesulfonate (MPFOS, 99%) were purchased from Wellington Laboratories
(Guelph, ON). Optimal grade methanol and HPLC grade acetonitrile were obtained from
Fisher Scientific (Pittsburgh, PA). Supeclean ENVI-Carb 120/400 was from Supelco
through Sigma-Aldrich. The stock solution was prepared with PFOS and PFOA at identical
concentrations in optimal grade methanol. The stock solution was stored at 4 ºC.
3.2.1.2 Controlled laboratory experiment
Green mussels, Perna viridis (protein content: 12%; lipid content: 1.4%) from a local
fish farm were firstly acclimated for three days in laboratory conditions. After that, mussels
with shell length of 60-70 mm were transferred to tanks filled with artificial seawater
spiked with 0.4 ng/ml PFCs (0.2 ng/ml PFOS + 0.2 ng/ml PFOA). Duplicated tanks were
used for both exposure set and the control set. The exposure period was 96-hr and the tanks
27
were cleaned and refilled every 24-hr. Mussels were sampled every 24-hr for testing.
3.2.1.3 Field sample collection and preparation
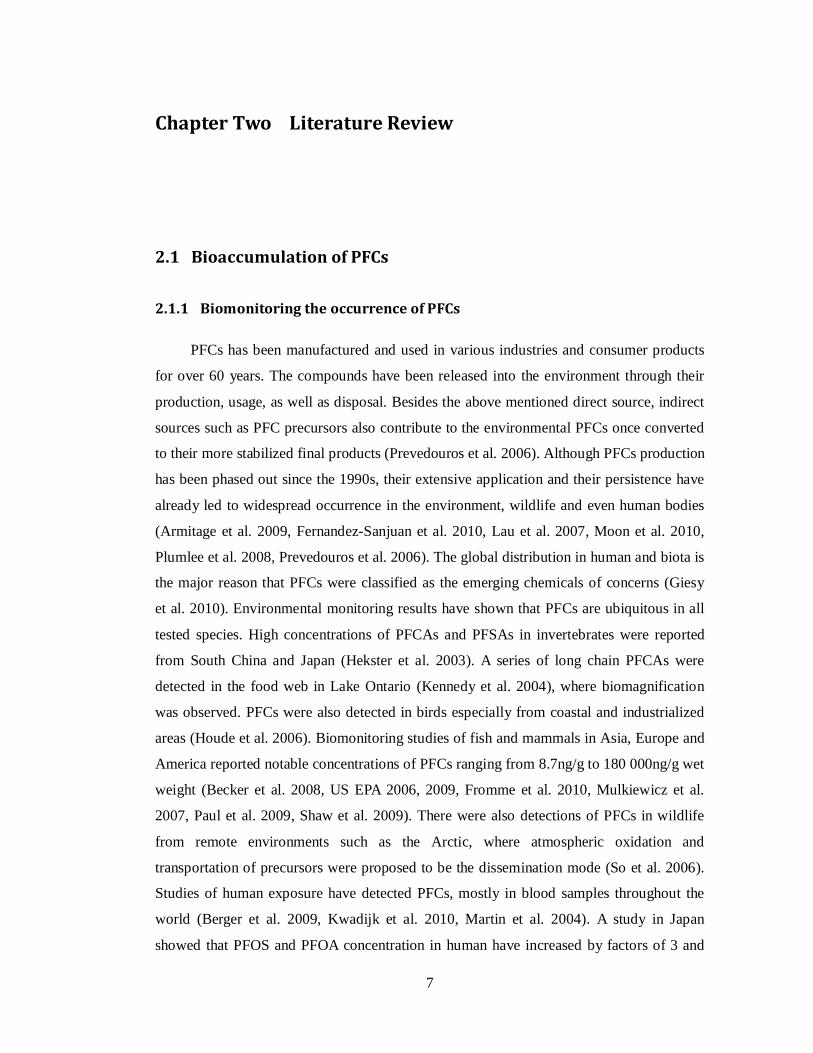
Environmental samples (mussels and seawater) were collected from six locations
around Singapore coastline in late June (Figure 3-1). They were stored in polypropylene
(PP) bags in an ice box during transportation to the laboratory.
Figure 3-1 Sampling locations around Singapore coastal waters.
For both laboratory and environmental samples, the gills of mussels were excised
and freeze-dried at -80°C for 72 hours. The extraction method has been described
elsewhere (Stevenson et al. 2006). In brief, homogenized dry gill tissues were transferred
to a 50ml PP centrifuge tube and 3ml of acetonitrile was added. The mixture was vortexed
and sonicated in a heated water bath for 10 mins. The samples were then centrifuged at
1500 rpm for 10 mins and decanted to 15 ml PP tubes. The above steps were repeated three
times, and all centrifuged extracts were combined. 1.8 ml of the extracts was transferred to
a 2 ml centrifuge tube, and acidified by adding 50 μl glacial acetic acid (1% v/v). The
extracts were then purified by adding 25 mg of dispersed sorbent (ENVI-Carb, 25-50mg).
The tubes were vortexed and centrifuged for 20 min at 18000 rpm. Purified extracts were
diluted 1:1 in ultra pure water (100 μl purified extracts + 100 μl UPW into sample vial).
Prior to analysis, 20μl of internal standards were also added.
28
3.2.1.4 Analytical method
Concentrations of PFCs in mussel tissues were determined using high-performance
liquid chromatography coupled with tandem mass spectrometry (LC MS/MS) (LC:
Shimadzu LC-10 AD; MS/MS: API3000 AB Sciex, Toronto, Canada). The MS/MS was
operated in negative electrospray ionization multiple reaction monitoring (MRM) mode. A
volume injection of 20 μL was injected into a Targa Sprite C18 column (3.5 µm pore size,
40 mm × 2.1 mm ID, Higgins Analytical, CA, USA) using the following chromatography
program: methanol was increased from 35% to 100% from 0 to 7.5 min, held at 100% to
10 min, then returned to 35% until 15 min at a flow rate of 0.25 mL min-1 with 2 mM
ammonium acetate as the second mobile phase (Higgins et al. 2005).
3.2.2 Results and Discussion
3.2.2.1 PFC levels in environmental green mussels
In the environmental samples, the overall tissue concentrations of PFOA and PFOS
ranged from 0.05 to 0.28 ng/g wet weight (ww) and 0.52-1.74 ng/g ww, respectively (Table
3-1). The resulted concentration could be slightly lower if whole body concentration was
used instead of gill concentration. Compared with a study of mussels from South China
and Japan (So et al. 2006), the level of PFOS in green mussels is about 2-3 times higher in
Singapore coastal waters. The PFOS level is also higher than those detected in clams in the
eastern Arctic marine food web (0.28 ng/g ww) (Tomy et al. 2004). However, based on a
review of biomonitoring results of global PFCs, the level of PFOS in Singapore is still
considered low, since it is below the 2 ng/g ww benchmark identified in previous studies
(Houde et al. 2008). Elevated concentrations of PFOS (9-877 ng/g ww) were detected in
invertebrates from the United States and European countries (Houde et al. 2006).
Compared with PFOS, PFOA was rarely detected in marine invertebrates (Houde et al.
2008) or it was detected at very low levels like in the current study. However PFOA was
predominant in fish sampled in Europe and Asia (Houde et al. 2008).
29
Table 3-1 PFOA and PFOS concentrations in mussels around Singapore coastline.
No. Location PFOA
ng/g wet weight
PFOS
ng/g wet weight
Total PFC
(PFOA+PFOS)
S1 Tuas 0.24 1.74 1.98
S2 Laborador Park 0.17 1.70 1.87
S3 East Coast 0.05 0.52 0.57
S4 Changi 0.28 1.46 1.74
S5 Punggol 0.16 1.53 1.69
S6 Lim Chu Kang 0.08 1.01 1.09
In Singapore coastal waters, the highest overall tissue PFC concentration
(PFOS+PFOA) was detected at Tuas (1.98 ng/g ww), which is an area with dense industry.
Industrial influent is identified as one of the major sources of perfluorinated chemicals
(Plumlee et al. 2008). Elevated levels of PFCs have been detected in coastal water in
industrial areas in Hong Kong, South China, Korea and Singapore (Hu et al. 2011, So et al.
2004). Mussels from Punggol, Changi and Laborador Park also contain high
concentrations of PFCs. These sites are either close to ship maintaining yards or busy
shipping lanes, where lubricant, paints and surfactants used in the ship industry could
contribute to the PFCs pollution. The East Coast of Singapore is a recreational area with
less industry, and hence, is less contaminated by perfluorochemicals. The lowest PFC
concentration (0.57 ng/g ww) was detected at this location (Table 3-1).
There could also be a seasonal variance of PFC levels in mussels, although not
measure in the current study. Singapore is characterized by the Northeast and Southwest
Monsoons and the inter-monsoon period. Higher concentrations of PFCs might be
expected during the wet season (typically Dec to Feb) mainly because there will be more
surface runoff inject to the sea, which carries significantly heavier load of PFCs than the
seawater (Hu et al. 2011), and meanwhile possible atmospheric deposit by rainwater.
3.2.2.2 Comparison between PFOA and PFOS
In mussel tissues, the concentrations of PFOS are about 5-10 times higher than the
concentrations of PFOA in the test results. However, in coastal water, the concentration of
30
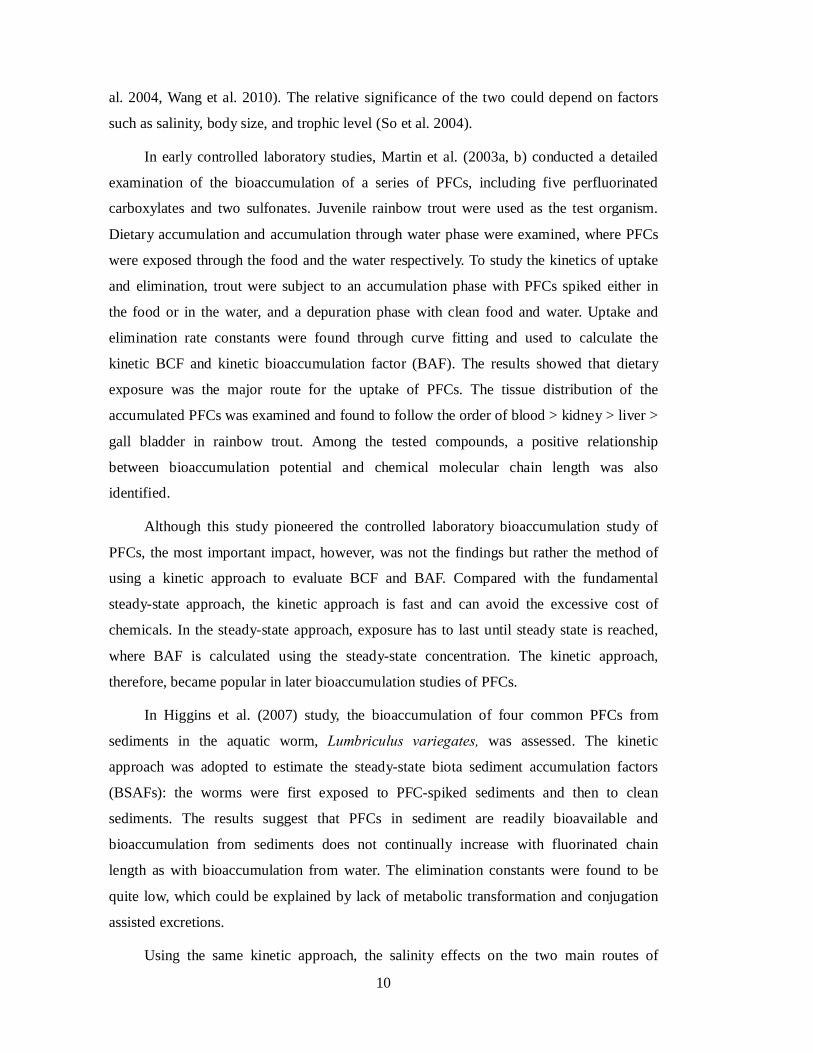
PFOA was generally predominant over PFOS. The percentages of compounds in seawater
and mussel tissue are shown in Figure 3-2. For example at S4, PFOA accounts for 71% of
total PFC (PFOA+PFOS) concentration in seawater, while in mussel tissues, this
compound makes up only 16% of the total PFC concentration. At S5, although PFOA and
PFOS were detected at similar levels in the water, the concentration of PFOS in mussel
tissues was about ten times higher than that of PFOA. Similar results were observed in the
remaining locations as well. Previous monitoring studies have also reported that PFOA was
generally detected at lower level than PFOS in wildlife (Houde et al. 2008).
Figure 3-2 Comparison of percentage composition of each PFC in seawater and mussel tissue.
One possible explanation is that concentrations in seawater fluctuate with time, while
tissue concentration is relatively steady and may not respond to environmental levels so
quickly. However, the most probable reason is that PFOS is more bioaccumulative in
mussel tissues when compared with PFOA. This conclusion is further supported by the
controlled laboratory experimental results.
S1
seawater tissue0%
20%
40%
60%
80%
100%
S2
seawater tissue0%
20%
40%
60%
80%
100%
S3
seawater tissue0%
20%
40%
60%
80%
100%
S4
seawater tissue0%
20%
40%
60%
80%
100%
S5
seawater tissue0%
20%
40%
60%
80%
100%
S6
seawater tissue0%
20%
40%
60%
80%
100%
PFOA PFOS
31
3.2.2.3 Bioaccumulation potential of PFCs
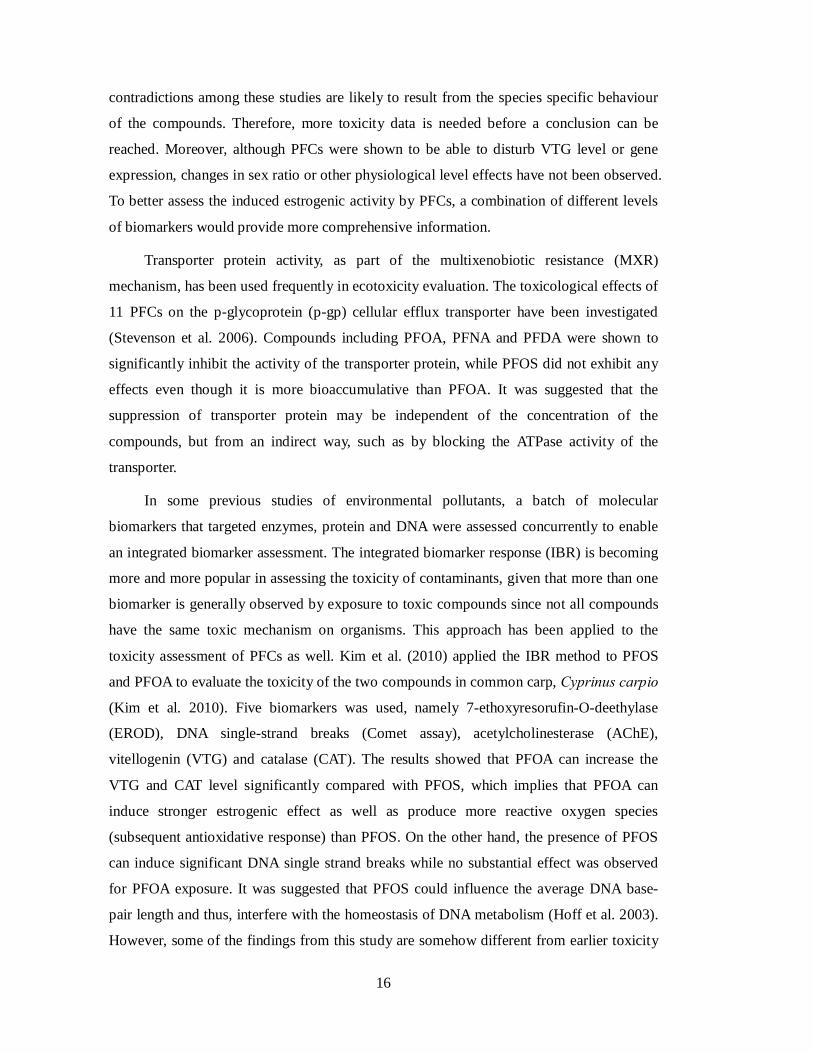
The controlled laboratory exposure experiment showed that both PFOS and PFOA
were accumulated in mussel gills during the exposure period. The time trends of
bioaccumulation are shown in Figure 3-3.
Figure 3-3 Bioaccumulation trends in mussel tissues during 96-hr exposure.
During the 96-hr exposure, the concentrations of both PFOS and PFOA in mussel
gills increased in a linear manner. The rate of bioaccumulation of PFOS, which is
represented by the slope of the line, is approximately 17 times higher than PFOA. At the
end of the exposure period, the concentration of PFOS was approximately 20 times higher
than that of PFOA. These results imply that PFOS has a greater bioaccumulation potential
and serves to explain the monitoring results where the concentration of PFOS in mussel
tissues was higher than PFOA, even though PFOA is prevailing in the ambient
environment. In a study of oysters in temperate waters, accumulation of PFOS in tissues
was found to be about 10 times that of PFOA after 28-d exposure (Jeon et al. 2010). A
similar result was also found in a study of freshwater invertebrates, after exposure to PFOS
for 60 days where the organism concentration reached about 5 times as much as PFOA
(Higgins et al. 2007).
There are some possible explanations for the higher bioaccumulation potential of
PFOS. Firstly, the fluorinated chain for PFOS is longer than PFOA (Table 3-2). Since the
fluorinated chain is the hydrophobic part of a perfluorinated compounds, longer chain
length may result in enhanced hydrophobic interaction. In addition, the functional group of
PFOS (-SO3-) provides stronger ionic interactions than the functional group of PFOA (-
0 20 40 60 80-0.2
0
0.2
0.4
0.6
0.8
1
1.2
1.4
R2 = 0.9775
Time (hr)
ng/g
tiss
ue
PFOA
0 20 40 60 80
0
5
10
15
20
25
R2 = 0.8527
Time (hr)ng
/g ti
ssue
PFOSy=0.0125x y=0.2179x
32
COO-). Both of these structural features favor the partitioning process for PFOS.
Table 3-2 Chemical properties of PFOA and PFOS.
Compounds Chemical structure Fluorinated chain length
Formula Molecular weight
PFOA perfluorooctanoic acid
C7 C8HF15O2 414.07 g/mol
PFOS perfluorooctane sulfonate
C8 C8HF17O3S 500.13 g/mol
3.2.2.4 Mussels as monitoring tool
Results of this study suggest that mussels could be a suitable water quality
monitoring tool. Previous occurrence studies of PFCs only measured the compounds
concentrations in the water phase (Hu et al. 2011, Nguyen et al. 2011). However, these
results normally fluctuate with time and thus, can only reflect the water quality at specific
sampling times. Moreover, levels of contaminations in the water phase may not help the
assessment of the health state of aquatic ecosystem. On the contrary, mussels are sessile
organisms. A measure of tissue concentration could reflect the water condition over a
period of time and thus, the accumulated effects from their living environment. Therefore
mussels could be a good indicator of PFC contamination and also the sentinel organism to
study the ecotoxicological effects of the compounds.
In summary, although Singapore is highly industrialized and urbanized, its marine
contamination of perfluorinated compounds still remains at a low level when compared to
the US and European countries. Heavy industry and busy shipping areas are more likely to
be contaminated by PFCs. In mussel tissues, PFOS was found to be the dominant
compound although PFOA was normally detected at higher concentration than PFOS in the
surrounding seawater. This observation suggests a higher bioaccumulation potential of
PFOS than PFOA in green mussels. To our knowledge, this study represents the first
measurement of accumulation of PFCs in invertebrates in the tropical marine environment.
The results fill in the gaps in the monitoring data of PFCs in marine invertebrates. The
preliminary study also highlights the need for extensive bioaccumulation investigation, as
bioaccumulation results are critical for environmental risk assessment.
33
3.3 Bioaccumulation model of PFCs – the concentration dependency
It is important to understand the behavior of PFCs in the environment: their source,
fate and toxic effects, in order to mitigate possible risks. Hence the study of
bioaccumulation, which is part of environmental fate, is crucial. From a toxicological point
of view, bioaccumulation per se is not necessarily of concern. What is of concern is that
bioaccumulation can cause toxicity to the affected organism or predators of that organism.
Aquatic organisms can accumulate PCBs a 100,000 times that of the water concentration.
Clearly, chemicals which bioaccumulate have the potential to cause unusual impacts, travel
unusual pathways and exert severe toxic effects (MacKay 2001). Bioaccumulation study
generates insights into the “internal dose” of contaminants which is more
ecotoxicologically relevant than the environmental concentration (Fernandez-Sanjuan et al.
2010). Continuous accumulation of certain compounds at low environmental level could
lead to elevated internal concentration. For example, notable concentrations of PFCs were
detected in marine organisms although their concentrations in seawater are relatively low.
Moreover, as a result of their unique properties, an assessment of PFCs bioaccumulation
requires different approaches compared with those well studied POPs. PFCs are both
hydrophobic and oleophobic. They possess high affinity to protein albumin, and therefore,
are sometimes referred to as “proteinophilic” (US EPA 2009, de Vos et al. 2008, Rayne &
Forest 2009). Both monitoring and laboratory studies have demonstrated that PFCs
accumulate mostly in protein-rich compartments such as livers and blood (Kelly et al. 2009,
Kennedy et al. 2004, Shaw et al. 2009). The accumulation mechanism and exposure routes
of PFCs are thus different from other hydrophobic persistent organics, such as PCBs. Thus,
the commonly used octanol-water partition coefficient Kow is inappropriate and inaccurate
to predict the bioaccumulation of PFCs.
Discrepancies in the reported bioaccumulation data (especially the bioaccumulation
factor (BAF)) of PFCs exist among laboratory studies (Kelly et al. 2009, Lau et al. 2007).
There could be several reasons for this. Firstly, bioaccumulation of PFCs could be species
dependent (for example when considering the protein content) and easily affected by
environmental variables. Furthermore, most studies adopted kinetic approaches which
involve a number of assumptions, estimations and curve fittings (Higgins et al. 2007, Jeon
et al. 2010, So et al. 2004, Wang et al. 2010). While the underlying mechanism of PFC
bioaccumulation is still unclear, direct measurement of the bioaccumulation factor or the
34
fundamental steady-state approach may elicit greater and more accurate insight. Moreover,
in some review papers, it has been pointed out that PFCs bioaccumulation is likely to be
concentration dependent (Conder et al. 2008, Kelly et al. 2009). However exposure
concentration has never been considered as a parameter in previous laboratory studies.
With these questions in mind, the purpose of the current study was to examine the
bioaccumulation mechanism of four common PFCs, namely PFOS, PFOA, PFNA and
PFDA, in green mussels Perna viridis, and, in particular, to characterize the concentration
effects on the bioaccumulation process. The validity of the commonly used kinetic
approach was also assessed in this study.
3.3.1 Materials and Methods
3.3.1.1 Chemicals and standards
PFOS (98%), PFOA (96%), perfluorononanoic acid (PFNA, 97%) and
perfluorodecanoic acid (PFDA, 98%) were purchased from Sigma-Aldrich (St. Louis, MO).
The internal standards, MPFOA (99%), MPFOS (99%), perfluoro-n-[1,2,3,4,5-13C5]nonanoic acid (MPFNA, 99%) and perfluoro-n-[1,2-13C2]decanoic acid (MPFDA,
99%) were purchased from Wellington Laboratories (Guelph, ON). Optimal grade
methanol and HPLC grade acetonitrile were obtained from Fisher Scientific (Pittsburgh,
PA). The stock solution was prepared with PFOS, PFOA, PFNA and PFDA at identical
concentrations in optimal grade methanol. The stock solution was stored at 4⁰C.
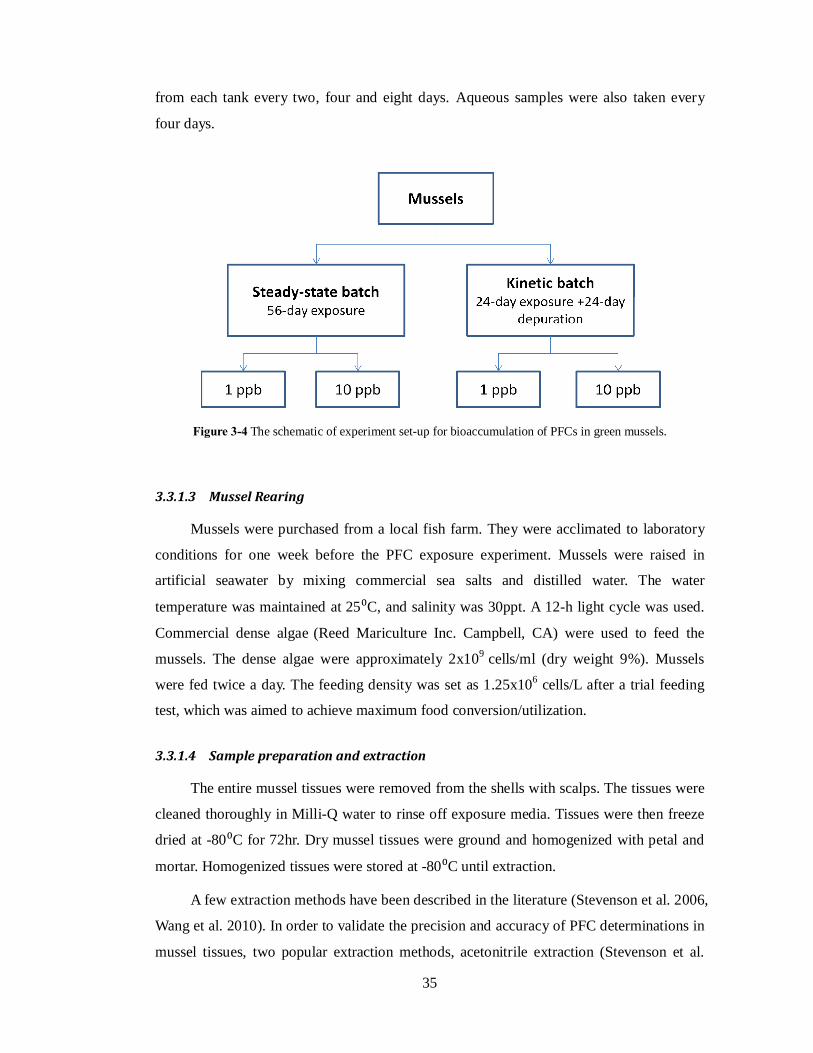
3.3.1.2 Bioaccumulation experiment set-up
To examine the effects of concentration on bioaccumulation, two exposure
concentrations were used: a total PFC concentration of 4 μgL-1 and a total PFC
concentration of 40 μgL-1, with 1 μgL-1 and 10 μgL-1 of each test compound respectively. A
70 liter PP tank was used as the test chamber. 60-65 mussels with shells 60-70mm in length
were raised in artificial seawater. Two sets of duplicate tanks were used for each exposure
concentration. In one set, mussels were exposed to PFCs for up to 56 days; in the other set,
mussels were subject to a 24-day exposure followed by a 24-day depuration phase. The
purpose of this experimental design was to find out and compare the bioaccumulation
factor through both steady-state (former set) and kinetic (later set) approaches (Figure 3-4).
Besides exposure tanks, another duplicate tanks were set as the control, where no PFCs
were present. All tanks were cleaned and refilled every two days. Mussels were sampled
35
from each tank every two, four and eight days. Aqueous samples were also taken every
four days.
Figure 3-4 The schematic of experiment set-up for bioaccumulation of PFCs in green mussels.
3.3.1.3 Mussel Rearing
Mussels were purchased from a local fish farm. They were acclimated to laboratory
conditions for one week before the PFC exposure experiment. Mussels were raised in
artificial seawater by mixing commercial sea salts and distilled water. The water
temperature was maintained at 25⁰C, and salinity was 30ppt. A 12-h light cycle was used.
Commercial dense algae (Reed Mariculture Inc. Campbell, CA) were used to feed the
mussels. The dense algae were approximately 2x10⁹ cells/ml (dry weight 9%). Mussels
were fed twice a day. The feeding density was set as 1.25x10⁶ cells/L after a trial feeding
test, which was aimed to achieve maximum food conversion/utilization.
3.3.1.4 Sample preparation and extraction
The entire mussel tissues were removed from the shells with scalps. The tissues were
cleaned thoroughly in Milli-Q water to rinse off exposure media. Tissues were then freeze
dried at -80⁰C for 72hr. Dry mussel tissues were ground and homogenized with petal and
mortar. Homogenized tissues were stored at -80⁰C until extraction.
A few extraction methods have been described in the literature (Stevenson et al. 2006,
Wang et al. 2010). In order to validate the precision and accuracy of PFC determinations in
mussel tissues, two popular extraction methods, acetonitrile extraction (Stevenson et al.
36
2006) and alkaline digestion with SPE (So et al. 2006) were tested and compared. A pre-
extraction spike experiment showed that for the acetonitrile extraction method, recoveries
for the four analytes were within 75-100%; and for the alkaline digestion and SPE
extraction method, 95-110%. Therefore, the latter was applied in this experiment.
Homogenized dry mussel tissues were transferred to a 50ml PP centrifuge tube. 30ml
of KOH (0.01mol/L in methanol) was added. The mixture was vortexed and shaken at 300
rpm at 25⁰C for 18 hours. Digested samples were then centrifuged at 4000 rpm for 15mins.
0.5 ml of supernatant was diluted to 50ml with Milli-Q water and vortexed. The diluted
extracts were then extracted using Oasis HLB cartridges (0.2g, 6 cm3; Waters). Prior to
loading, cartridges were preconditioned by eluting with 5ml methanol followed by 5 ml
Milli-Q water. Diluted extracts were eluted at 1 drop/sec. Cartridges were vacuum-dried
before elution using 15 ml methanol. Elutes were dried by gentle nitrogen gas (99.99%,
Soxal, Singapore) and reconstituted to 2 ml with methanol. Prior to analysis, 200μl of final
extracts were transferred to a sample vial. 20μl internal standards were then added.
3.3.1.5 Instrumental analysis
Concentrations of PFCs in mussel tissues were determined using high-performance
liquid chromatography coupled with tandem mass spectrometry (LC MS/MS). The
procedures have been described in Section 3.2.1.
3.3.1.6 Quantitation and QC/QA
Calibration curves were constructed from the analysis of 16 calibration standards
(range 0.2-60 ng/ml). Active points on calibration curves were calculated to be within 10%
of their true values. The correlation coefficient was >0.99 for all calibration curves.
Calibration was performed at the beginning and end of every sample batch. The limit of
quantitation (LOQ) of each compound was the lowest concentration in the calibration
curve with a signal to noise ratio (S/N) larger than 3. Solvent blanks were analyzed with
every 12 samples to monitor instrument background. Matrix spike was performed in
selected samples. No significant matrix interference was found (spike recovery within
10%). Contact with glassware and Teflon surfaces was avoided to minimize losses due to
sorption and contamination. All containers were cleaned with methanol followed by Milli-
Q water before usage.
37
3.3.1.7 Data analysis
Bioaccumulation factor was calculated according to
��� = ��
�� (3.1)
where Co is the PFC concentration in the organism at steady state (ng/g); Cw is the PFC
concentration in water, or the exposure concentration (μg/l); BAF is in L/kg. Steady state
was assumed when three or more consecutive measurements were not statistically different,
or when the normalized slope of the fitted line of three or more consecutive measurements
was less than 0.005 (1/day). One-way ANOVA was applied to determine the statistical
significance.
3.3.2 Results and Discussion
3.3.2.1 Bioaccumulation results
Among the tested compounds, the long chain perfluorinated carboxylate and the
perfluorinated sulfonate were found to have the highest bioaccumulation potential. PFDA
possess the largest BAF followed by PFOS (Figure 3-5). PFOA, on the other hand, is the
least accumulative compound with a steady state concentration about 20 times lower than
PFOS. This is consistent with the observation that PFOS is generally detected at higher
level in wildlife than PFOA, although the environmental concentrations of the two are
comparable (Houde et al. 2008, Hu et al. 2011). Compounds with higher BAF take longer
to reach steady state, which is also consistent with previous studies (Martin et al. 2003a, b,
Conder et al. 2008), and their depuration is generally slower too. Field BAF can also be
calculated for PFOS and PFOA using data in previous field experiment (section 3.2). The
results are 191-305 L/kg and 8-13 L/kg for PFOS and PFOA respectively. These values are
comparable but slightly lower than the laboratory BAFs. It could be due to the interactions
from other pollutants in the real environment, especially interactions from each other, for
example, competing for the binding sites.
PFC depuration follows a first-order (exponential) model with rates increasing in the
order of PFDA<PFOS<PFNA<PFOA (Figure 3-6). The fast elimination may be facilitated
by the presence of PFCs in the circulating blood, coupled with extensive blood-water
exchange at mussel gills during respiration (Kelly et al. 2009). It also implies that there
should be a continuous exposure of PFCs at a certain level to maintain an observed tissue
38
concentration.
Figure 3-5 Bioaccumulation of PFCs in green mussels at exposure concentrations of 1ppb and 10ppb during 56-day exposure. Data points are steady-state experimental results; curves are Matlab curve fitting.
Figure 3-6 Depuration kinetics of PFCs after exposure to concentrations of (a)1 ppb and (b)10 ppb.
0 10 20 30 40 500
100
200
300
400
PFOS
Day s
Org
anism
Con
c./E
xpos
ure
Conc
. (C
o/Cw
L/k
g)
0 10 20 30 40 500
5
10
15
PFOA
Day s
Org
anism
Con
c./E
xpos
ure
Conc
. (C
o/Cw
L/k
g)
0 10 20 30 40 500
50
100
150
PFNA
Day s
Org
anism
Con
c./E
xpos
ure
Conc
. (C
o/Cw
L/k
g)
0 10 20 30 40 500
200
400
600
800
1000
PFDA
Day s
Org
anism
Con
c./E
xpos
ure
Conc
. (C
o/Cw
L/k
g)
Exposure Conc. = 1 ppb . Exposure Conc. = 10 ppb
25 30 35 40 45 5010
-2
10-1
100
101
102
103
ke =0.0538
ke =0.1002
ke =0.0928
ke =0.0452
Days
Con
c. in
mus
sel t
issu
e (n
g/g
ww
)
(a)
PFOSPFOAPFNAPFDA
25 30 35 40 45 5010
0
101
102
103
104
ke =0.0503
ke =0.1022
ke =0.0898
ke = 0.0420
Days
Con
c. in
mus
sel t
issu
e (n
g/g
ww
)
(b)
PFOSPFOAPFNAPFDA
39
3.3.2.2 Concentration dependency of PFCs bioaccumulation
Figure 3-5 shows that when exposure concentration (Cw) changes from low (1 μgL-1)
to high (10 μgL-1), steady state organism concentrations (Co) do not increase proportionally.
The BAF values (Equation 3.1) of each compound are different at the two exposure
concentrations (p < 0.01, t test) and decrease with increasing exposure by a factor of 1.3
for PFOA and 1.8 for PFDA (Figure 3-5, Table 3-3B). For each compound, the time to
reach steady state is longer under the lower exposure concentration where the BAF is also
higher. These results show that the bioaccumulation of PFCs is concentration dependent.
Although the concentration dependency of PFCs bioaccumulation has been
mentioned in previous studies (Morikawa et al. 2006, Giesy et al. 2010), insight into the
underlying factors have been lacking. A possible explanation of the observed results is that
bioaccumulation of PFCs is an adsorption-like process in which PFC molecules adsorb to
the surface of quasi-solid materials, and the rationale is that PFC molecules are surface
active chemicals (Conder et al. 2008). The conventional bioaccumulation model only
views tissues as a “bulk phase” and the biological uptake as simple partitioning process.
The mechanism of chemical adsorption is shown as follows (Sylvin 2005):
→+ ←u
e
kk
M S MS (3.2)
M = chemicals S = free binding sites MS = bonded chemicals
ku = uptake rate constant ke = elimination rate constant
For PFCs, the binding sites are most likely at the surface of hemocytes and liver cells.
As mentioned previously, PFCs tend to accumulate in these protein-rich compartments. In
adsorption, the binding sites limit the amount of adsorbate, and the fractional surface
coverage of adsorbent, θ , depends on the concentration of adsorbate:
[ ][ ] [ ]u ek M S k MS=
[ ] [ ][ ] [ ][ ]u
e
kMS M S M S
kα= =
[ ][ ] [ ]
[ ][ ][ ][ ] [ ]
MS M SMS S M S S
αθ
α∴ = =
+ +
[ ][ ]
1 1
(3.3)u
e
M M kM M k
α αθ α
α α= = =
+ +
40
Table 3-3 Bioaccumulation factors and curve fitting parameters.
A: ke estimated from elimination phase where Co=A*exp(-ket); B: BAFss was the average of steady-state results; D: nku and (kuCw+ke) are directly obtained from curve fitting results; E: k’u estimated from initial uptake phase (Jeon et al. 2010); n=12; All curve fittings were carried out by Matlab. Data are provided with standard error (±SE) and R2 in parentheses.* # highlight that data in the columns with the same superscript are significantly different at p<0.01.
41
Therefore the amount of adsorption depends on the chemical concentration. From this
adsorption model, the major findings in this experiment can be well explained: 1) exposure
concentration dependency of BAF, 2) correlation between BAF sensitivity to exposure
concentration and fluorinated chain length, and 3) discrepancy between the kinetic and the
steady-state approach.
(1) Concentration dependency of BAF
As illustrated in Figure 3-5, BAF decreases as exposure concentration Cw increases.
In the adsorption model given by Equation 3.3, M is equivalent to Cw. If n is the total
number of binding sites, Co is equivalent to nθ; and BAF is obtained by substituting
Equation 3.4 into the BAF definition (Equation 3.1):
,
1
o wC n C M
MM
θ
αθ
α
= =
=+
( ) ( )1 1o w
w w w w w
C n n M n CBAF
C C M C C Cθ α α
α α= = = =
+ +
1
(3.4)w
nBAF
Cαα
=+
Equation 3.4 shows that BAF is an inverse function of the exposure concentration Cw. An
increase in Cw will lead to a decrease in BAF. Therefore, when concentration Cw increased
from 1 μgL-1 to 10 μgL-1, the BAF decreased from nα/(1+α·1ppb) to nα/(1+α·10ppb),
which explains the observed results that BAF became lower at the higher exposure
concentration.
(2) Chain length effect
Binding energy vs. chain length. In Equation 3.3, the constant α is determined by
and directly proportional to binding energy (Sylvin 2005). The α value of each compound
can be calculated by Equation 3.3 when Cw and Co are known:
1 1
2 2
o
o
C nC n
θ
θ
=
=
From Equation 3.3
1M
Mαθ
α=
+
42
( )( )
2 11 1
2 2 1 2
11
w w o
w w o
C C CC C C
αθθ α
+= =
+
The results of α follow the order of PFDA>PFOS>PFNA>PFOA (Table 3-3C). This is
consistent with the conclusion that the longer chain perfluorinated acids have enhanced
binding affinity, as observed in many field and laboratory studies (Armitage et al. 2009,
Jeon et al. 2010, Kwadijk et al. 2010, Martin et al. 2003a, b). A linear relationship between
α and fluorinated chain length is shown in Figure 3-7. Bioaccumulation of PFCs was
suggested to be related to the chemical’s hydrophobicity (Martin et al. 2003a, b). As the
hydrophobic portion in the PFC molecule increases with the fluorinated chain length, the
stronger the hydrophobic interaction and thus, the higher the binding energy. Woodcraft et
al. (2010) in their work also demonstrated that increased hydrophobicity creates more
binding sites for the compounds. Besides, it is also believed that bioaccumulation is
governed to some degree by the contribution of ionic interaction of functional groups
(Woodcroft et al. 2010), which explains higher binding energy by sulfonate than
carboxylate for the same fluorinated chain (Figure 3-7: PFOS and PFNA).
Figure 3-7 Linear relationship between binding affinity and fluorinated chain length.
Concentration sensitivity vs. chain length. The concentration induced change in
logBAF (∆log BAF) was found to be linearly related to chain length, as demonstrated in
Figure 3-8 and Figure 3-9. Among the carboxylates, BAF of long chain PFC is affected
6 7 8 9 10 11 120
0.05
0.1
0.15
R2 = 0.9828
Perfluorinated chain length
Bin
ding
affi
nity
α
PFOSPFOAPFNAPFDA
0.10
0.00
43
more significantly by the concentration change. The magnitude of ∆log BAF follows the
order of increasing chain length. The ∆log BAF of sulfonate is larger than that of
carboxylate with the same fluorinated chain length (Figure 3-8: PFNA and PFOS). These
results can be well explained by involving the binding affinity α. In Equation 3.4, dividing
both the denominator and the numerator by α we have:
1α
=+ w
nBAFC
(3.5)
As the number of total binding sites, n, is constant, the effect of Cw on BAF, or in
other words the BAF’s sensitivity to Cw, depends on α value. When α↑, 1/α↓, therefore Cw
will have greater influence on the BAF. Hence the larger the α value, the more sensitive the
BAF to changes in Cw (i.e. the larger concentration induced change in log BAF). From a
physico-chemical point of view, when concentration increases, compounds possessing
higher binding affinity are more likely to be adsorbed than those with low binding affinity.
Thus, the amount of accumulation with respect to concentration change is more significant.
The concentration-induced change in log BAF was found to be linearly correlated with α,
too (Figure 3-9). Since the binding affinity α is closely related with chain length as
discussed earlier, it is feasible to relate chain length with ∆log BAF through α, i.e. longer
chain => larger α => greater influence by Cw.
Figure 3-8 Relationship between log BAF and fluorinated chain length: concentration induced change in log BAF increases with fluorinated chain length.
Figure 3-9 Linear relationship between ∆log BAF and binding affinity (lower curve, left axis); and with fluorinated chain length (upper curve, right axis).
(3) Comparison of kinetic approach and steady-state approach
Besides the fundamental steady-state approach (Equation 3.1) to determine BAF, the
kinetic approach has been popular in laboratory bioaccumulation studies (Martin et al.
2003a, b, Jeon et al. 2010). The kinetic BAF is estimated as the quotient of uptake and
elimination rate constants (Equation 3.7), with the assumption that both uptake and
elimination of chemicals are first order reactions (Tolls et al. 1994):
( )( )
o tu w e o t
dCk C k C
d t= − (3.6)
Solving the above first order differential equation for ( )o tC yields:
( ) ( )[ ]1 expu wo et
e
k CC k t
k= − −
At steady state: ( ) 0o tdC
d t=
0u w e ok C k C− =
and the kinetic BAF is
0 0.05 0.1 0.15 0.2 0.25 0.3 0.35 0.40
0.03
0.06
0.09
0.12
0.15
0.18
R =0.9993Binding Affinity
R =0.9323Chain length
PFOA
PFOA
PFNA
PFNA
PFOS
PFOS
PFDA
PFDA
Bin
ding
Affi
nity
α
∆ log BAF0 0.05 0.1 0.15 0.2 0.25 0.3 0.35 0.4
0
2
4
6
8
10
12
Per
fluor
inat
ed c
hain
leng
th
45
o ukinetic
w e
C kBAFC k
′ = = (3.7)
Controlled laboratory studies have shown that the kinetic approach can generate
similar results as the steady-state method for many POPs (Tolls et al.1994). However, the
validity of the kinetic approach had never been verified for PFCs before it was applied in
several laboratory studies (Jeon et al. 2010, Kwadijk et al. 2010, Martin et al. 2003a, b). In
this study, the kinetic method was for the first time compared with the steady-state method
and the result shows that it is not suitable for the assessment of bioaccumulation of PFCs.
As discussed previously, the BAF is exposure concentration dependent. However, the
expression of Equation 3.7 itself suggests that the kinetic BAF (BAF’kinetic) should be a
constant value independent of exposure concentration. This fundamentally contradicts the
experimental results. Moreover, following the above mentioned kinetic approach as
described in a previous study (Jeon et al. 2010), the resulting uptake rate constant in
Equation 3.7, k’u, varies for the two exposure concentrations (Table 3-3E), which suggests
that k’u here is not a constant as defined. Hence, the previous assumption of ‘first order
uptake reaction’ is inappropriate in the case of PFCs bioaccumulation. Even th ough two
kinetic BAF values can be calculated from the variant k’u, the results were shown to
deviate from the steady-state BAF (BAFss) (Table 3-3B&E).
Based on the experimental results and the special surfactant property of
perfluorinated compounds, we hereby propose a new kinetic equation to describe the
bioaccumulation of PFCs, incorporating the adsorption model (Equation 3.2). Compared
with the old kinetic model (Equation 3.6), accumulation is no longer first order reaction:
the rate of accumulation of PFCs depends on both the exposure concentration and free
binding sites:
( )( ) ( )= −
o tu w e ot t
dCk C S k C
dt (3.8)
where S(t) is the free binding sites at time t (Equation 3.2). The expression for organism
concentration at time t (Co(t)) can be obtained by solving Equation 3.8 as:
( ) ( ){ }1 expu wo u w et
u w e
nk CC k C k tk C k
= − − ++
(3.9)
And the kinetic BAF can be obtained as:
46
=+u
kineticu w e
nkBAF
k C k (3.10)
Compared with Equation 3.7, the exposure concentration effect is incorporated in
Equation 3.10. The proposed expression of the kinetic BAF is consistent with the one
obtained from the steady-state approach (Equation 3.4).
u
e
kk
α =
(3.10)u
u w e
nkk C k+
1u e
u w e
n k kk C k
=+
(3.4) 1w
nC
αα
=+
Curve fittings using Equation 3.9 show agreement with both the steady-state (Figure 3-5)
and kinetic batch (Figure 3-10) experimental results with good reliability, and so does the
resulted BAFkinetic with the steady-state BAF, i.e. BAFss (R2 ≥ 0.94; p < 0.01, F test) (Table
3-3B&D).
0 5 10 15 20 25 30 35 40 45 500
500
1000
1500
2000
2500
Time (days)
Con
c. in
mus
sel t
issu
e (n
g/g
ww
)
(a)
raw datafitted
0 5 10 15 20 25 30 35 40 45 500
20
40
60
80
100
120
140
Time (days)
Con
c. in
mus
sel t
issu
e (n
g/g
ww
)
(b)
raw datafitted
47
Figure 3-10 Kinetic batch results with curve fitting at exposure concentration of 10 ppb: (a) PFOS (b) PFOA
(c) PFNA and (d) PFDA
The maximum value that BAFkinetic can potentially reach is when the exposure
concentration is infinitely low (Cw →0), where
0 0lim lim
w w
ukinetic
C C u w e
u
e
nkBAF
k C knk nk
α→ →
=+
= =
(3.11)
From Equation 3.11, the maximum BAF for the tested compounds were calculated as 415,
16, 157 and 944 L/kg for PFOS, PFOA, PFNA and PFDA respectively.
Time to reach steady state. As mentioned previously, the time to reach the steady
state, tss, varies between the two exposure concentrations. Therefore, tss also appears to be
concentration dependent. Mathematically the time to reach steady state is infinity. However,
the time for Co to reach 95% of steady state concentration, 95%sst , can be used as a
performance metric and derived from Equation 3.9 as:
From
( ) ( ){ }1 expu wo u w et
u w e
nk CC k C k tk C k
= − − + + (3.9)
The steady state concentration is
u wo
u w e
nk CCk C k
=+
At 95% of the steady state concentration, we have:
0 5 10 15 20 25 30 35 40 45 500
100
200
300
400
500
600
700
800
900
1000
Time (days)
Con
c. in
mus
sel t
issu
e (n
g/g
ww
)
(c)
raw datafitted
0 5 10 15 20 25 30 35 40 45 500
500
1000
1500
2000
2500
3000
3500
4000
Time (days)
Con
c. in
mus
sel t
issu
e (n
g/g
ww
)
(d)
raw datafitted
48
( ) ( )95% 95%ssss
o o ttC C= ⋅
or
( ){ }95%1 exp 95%u w u wu w e ss
u w e u w e
nk C nk Ck C k t
k C k k C k− − + = ⋅
+ +
Solving the above equation yields the time to reach 95% of the steady state concentration
as:
( )95% 1ln 1 0.95
−= −
+ssu w e
tk C k
(3.12)
Equation 3.12 shows that when exposure concentration Cw increases, tss will decrease
accordingly, which explains the observed results of longer tss at lower exposure. However,
if the old kinetic method (Equation 3.6) is followed, the 95%sst will be:
( )95% 1ln 1 0.95
−′ = −sse
tk
(3.13)
where tss will depend only on ke and thus, will be a constant value for each compound.
Taken together, the bioaccumulation of PFCs appears to follow an adsorption model.
In consideration of the special partitioning behavior of PFCs, the conventionally used
kinetic model appears to be inappropriate for this group of chemicals. The fundamental
assumption that both uptake and elimination of PFCs are first order reactions merits further
scrutiny.
To our knowledge, this is the first study that demonstrates the concentration
dependency of the bioaccumulation of perfluorinated compounds, and describes the
relationships among various factors using mathematical models. Examination of the
concentration dependency revealed the inadequacy of the conventional kinetic model and a
new model based on the adsorption mechanism was accordingly proposed. This model
provides a more accurate description of the bioaccumulation process and thus, the fate of
PFCs.
It is also noted that protein binding and adsorption have similar mechanisms, both of
which can be described by Equation 3.2. Protein-water partitioning has been suggested to
be useful in evaluating the bioaccumulation of PFCs. As proteins have been considered as
major reservoirs for PFCs, it is expected that protein binding could dominate the
bioaccumulation process. It is therefore, also possible that the observed results in our study
are attributed to this dominant process.
49
Partitioning coefficients used to predict the environmental distribution of chemicals,
such as Kow, are independent of concentration. Although more species- and environmental
factor-dependent, the BAF in many ways is similar to these partitioning coefficients.
Hence, in previous studies, the BAF of perfluorochemicals were always treated as a
constant, regardless of the exposure concentration. In other words, bioaccumulation was
assessed without considering concentration as an influencing parameter. The unique
properties of PFCs, however, suggest that this approach may not be appropriate. This
argument is further supported by the results of this study which has shown the importance
of specifying the environmental concentration when carrying out bioaccumulation studies
of PFCs. Literature reviews have found a lack of consistency in the BAF data from both
laboratory and field studies. This inconsistency may likely be caused by ignoring the
concentration effects as discussed in this study.
3.4 Conclusion
The bioaccumulation behavior of PFCs was examined in controlled laboratory
studies. Bioaccumulation potential of the tested compounds was demonstrated, where long
chain PFCs were found to be more bioaccumulative than short chain ones. More
importantly, this process was also found to be exposure concentration dependent. For all
compounds, the bioaccumulation factor is larger at the lower dosage. This concentration
dependency can be explained by a nonlinear adsorption mechanism. The sensitivity of
BAF to exposure concentration was found to be positively related to fluorinated chain
length and the binding affinity of the compounds. Bioaccumulation of long chain PFCs are
more easily affected by concentration changes. A new kinetic bioaccumulation model
based on the adsorption mechanism was proposed, which provides a more accurate
description of the bioaccumulation process of PFCs.
Toxic effects are directly linked with the inner concentration of the compounds. The
knowledge of the bioaccumulation mechanism of PFCs provides a better understanding of
the partitioning behavior and the inner concentration of these contaminants. With the help
of the bioaccumulation model, toxicity test results could be better explained and
understood. It should also be noted that in the real environment, PFC levels are normally 3-
4 magnitudes lower than the tested concentration, therefore BAF values are expected to be
even higher for individual compounds based on current bioaccumulation model. However,
50
in real environment there will be also mixture effect from other PFCs and environmental
pollutants, which could affect the prediction power of the proposed model.
51
4 Chapter Four Ecotoxicity of PFCs and different modes of
action
4.1 Introduction
Although the production of common PFCs have been phased out by their main
producers, the lack of incentive and desirable performance characteristics of PFCs makes it
difficult to control the production worldwide, especially where economic development
exceeds environmental concerns (Lindstrom et al. 2011). Hence, PFCs will remain in our
environment for a long period of time, and it is therefore important to understand the
environmental and ecological consequences and the associated risks of these contaminants.
As mentioned earlier, to date, available toxicity data of PFCs is still very limited with
respect to target compounds and test species, and the underlying toxic mechanisms of these
emerging pollutants remain unclear. The lack of toxicity information makes it difficult for
an environmental management agency to create regulations and guidelines regarding the
emission and treatment of PFCs in many regions of the world, including Singapore.
The ocean is the final sink for many persistent organic pollutants (POPs) including
PFCs (Theobald et al. 2011), and thus, the health of marine wildlife is always of great
concern. Previous studies clearly indicate exposure and the bioaccumulation potential of
PFCs in marine organisms (Liu et al. 2011, Nguyen et al. 2011, Vestergren & Cousins
2009). Therefore, examination of toxic effects of PFCs on marine wildlife is of great
importance. However at present, knowledge of the toxicological effects of PFC exposure is
largely based on studies on mammalian species. PFC mediated adverse effects on marine
invertebrates have hardly been addressed, and there is still a lack of toxicity data for a
comprehensive ecotoxicological assessment.
In this context, the purpose of this chapter was to evaluate the environmental toxicity
of four commonly detected PFCs, namely PFOS, PFOA, PFNA and PFDA on green mussel
Perna viridis, through biomarker-based toxicity study. Pollutants can affect a biological
system at many levels. Starting with interaction with biomolecules, the effects can cascade
52
through molecular àcellular àphysiological àindividual àpopulation levels (Newman
2009). In order to have a holistic idea of how PFCs could affect the organism, biomarkers
from three different bio-organization levels (biomolecular, cellular and physiological) were
employed. In addition, organic contaminants generally have several classes of toxic mode
of action, including oxidative damage, DNA damage, general cell lesions and membrane
damage (Nobels et al. 2010). In this chapter, six possible toxic modes of action of PFCs
were investigated. In the order of ascending bio-organization level, the examinations
included oxidative toxicity, xenobiotic metablisom, genotoxocity, immunotoxicity and
gerneral health state. The underlying mechanism of toxic actions was also investigated,
where dose-response relationship and exposure time effect were examined. Toxic response
model and structure-activity relationship model were established wherever applicable.
Biomarkers are measureable bio-endpoints at different biological organization levels:
biomolecular, cellular, tissue and organ, etc. For example, Neutral red retention time
measures the lysosome membrane stability, and is a cellular level biomarker. Biomarkers
measure sublethal effects in organisms and provide early warning signals for remedial or
preventive action to be taken (Sarkar et al. 2006). Due to the complexity of contaminants
in the environment and the variety of responses that they induce in organisms, it is
essential that multi-biomarkers are employed (Brooks et al. 2009). A series of biomarkers
from different biological levels can provide a holistic understanding of toxic effects on
target organisms. The biomarkers and their corresponding toxic mode of action and
biological level are illustrated in Figure 4-1.
53
Figure 4-1 Summary of biomarkers applied in the study and their corresponding toxic mode of action and biological levels.
96%), perfluorononanoic acid (PFNA, 97%), perfluorodecanoic acid (PFDA, 98%) were
purchased from Sigma-Aldrich (St. Louis, MO). Chemicals used in the toxicity test were
also purchased from Sigma-Aldrich unless otherwise specified.
55
4.2.1.2 Mussel acclimation and maintenance
In the current study, green mussels, Perna viridis, were selected as the target
organism because in a previous study, they were shown to have great potential to
bioaccumulate PFCs. In addition, mussels have been conventionally used as the sentinel
organisms for environmental monitoring, as they are sessile and filter-feeding organisms
that are in direct contact with contaminated compartments, and can provide a time
integrated indication of contamination with measurable cellular and physiological
responses (Izquierdo et al. 2003). Mussels were purchased from a local fish farm in
Singapore. Only mussels with a shell length of 60-65 mm were selected for the experiment.
Mussels were acclimated to laboratory conditions for one week before the exposure
experiment. They were raised in artificial seawater made by mixing sea salts with distilled
water. The water was maintained at 25°C with salinity at 25ppt. A 12-hr light-dark circle
was employed to simulate the diurnal variation of sunlight. Commercial marine micro
algae (Reed Mariculture Inc. Campbell, CA) were used to feed the mussels every two days
two hours before the water change.
4.2.1.3 The exposure experiment
Six exposure concentrations of individual PFC were applied: 0.1, 1, 10, 100, 1000
and 10000 μg/L. The typical PFC level in ocean water is approximately a few hundred pg
per liter (Cai et al. 2012). These compounds have been detected in oceanic water from 17.8
to 192ng/L in Asian waters (Hu et al. 2011, Wang et al. 2012). In the current study, the
exposure concentration range was selected to include concentrations that were
environmentally relevant, and also concentrations that were high enough to elicit
distinguishable effects in order to elucidate possible modes of action (Arukwe &
Mortensen 2011). Mussels were raised in polypropylene (PP) tanks. For each exposure
concentration, duplicate tanks were used. Another set of duplicate tanks were engaged as
the control, where no PFCs were present. The exposure period was 7 days (Kim et al. 2010;
Yang et al. 2010). All tanks were cleaned and refilled every two days. Mussels were
sampled at the end of exposure. The measured exposure concentrations and concentration
in mussels were reported in the Appendix.
4.2.1.4 Sample preparation
Mussel haemolymph was extracted from the anterior adductor muscle with a
56
hypodermic syringe filled with physiological saline. The physiological saline was prepared
by mixing HEPES 4.77 g, NaCl 25.48 g, MgSO4 13.06 g, KCl 0.75 g, CaCl2 1.47 g and
distilled water to 1 L. The pH was adjusted to be 7.4-7.5 with NaOH. The haemolymph
mixture was then transferred to a microcentrifuge tube before analysis. Mussel soft body
was cut into pieces and homogenized in 100 nM phosphate buffer (pH7.4, KCl 100 mM,
EDTA 1 mM) using a tissue homogenizer. Protease inhibitor (Complete Protease Inhibitor,
Roche) was also added. The homogenate was then centrifuged at 500xg for 20 min at 4°C.
The supernatant was subsequently transferred into clean tubes and centrifuged again at
2000xg for 30 min at 4°C. Finally the supernatant was ultra-centrifuged at 100000xg for 90
min at 4°C. The final supernatant was transferred to clean tubes on ice before analysis. The
protein content of the cytosolic extraction was quantified using the Bradford protein assay
using Bovine Serum Albumin as the standard (Bio-Rad).
4.2.1.5 Biomarkers of antioxidant activity
CAT activity was measured in the whole soft tissues as described elsewhere (Binelli
et al. 2009). The reaction was initiated by adding 20 μl of diluted H2O2 to microplate wells
with 20 μl of cytosolic extract, 30 μl of methanol and 100 μl phosphate buffer. After 20
min incubation at 25°C, 30 μl KOH and 30 μl of chromogen were added subsequently.
After incubation, KIO4 was added and the plate was incubated for 5 min before reading the
absorbance at 540nm. The results of CAT activity were expressed in terms of micromole
formaldehyde per milligram protein per min.
SOD activity was determined as the inhibition of the rate of cytochrome c reduction,
measured at 550 nm, by superoxide anion generated from the xanthine
oxidase/hypoxanthine reaction. The reaction takes place in 0.05 M Na2PO4/NaHPO4 buffer,
pH 7.4, with 48 μM xanthine/0.2 units of xanthine oxidase and with 96 μM EDTA. One
unit of SOD activity is defined as the amount of sample that inhibits by 50% the reduction
of cytochrome c. The SOD activity was expressed as U/mg protein (Vlahogianni et al.
2007).
GPx activity was determined by measure the consumption of NADPH at 340 nm
during the formation of reduced glutathione by glutathione reductase. The enzyme activity
was expressed as nmol NADPH oxidized/min/mg proteins using a molar extinction
coefficient of 6.22 mM-1cm-1
GSH content was quantified by the measurement of TNB, a product in the enzyme
57
recycling reaction. The sulfhydryl group of GSH reacts with DTNB and produces the
yellow color TNB. The rate of TNB production is directly proportional to GSH
concentration in the cytosolic fractions. Absorbance of TNB was measured at 405nm. GSH
concentration was then calculated according to the standard curve.
4.2.1.6 Oxidative toxicity biomarker
Comet Assay The Comet Assay was performed using the Comet Assay Kit from
Cellbiolabs, Inc. In brief, the haemolymph was extracted as previously described. The
suspension was centrifuged at 700xg for 2 min and the supernatant was discarded. The
cells were washed and resuspended in ice-cold PBS at 1x10⁵ cells/ml. The cell sample was
then mixed with pre-liquified agrose at 1:10 (v/v). 75μl of the mixture was transferred
immediately onto microscope slides. The slides were prepared as triplicate for each cell
sample. The slides were then transferred to 4°C in the dark for 15 min and maintained
horizontally. After gelation, the slides were immersed in ice-cold lysis buffer and in ice-
cold alkaline solution each for 30 min at 4°C in the dark. Electrophoresis was performed in
alkaline solution for 30 min at 1 volt/cm, 300mA. After electrophoresis, the slides were
first washed twice in ice-cold DI water and then immersed in 70% ethanol for 5min. 100μl
of Vista Green DNA dye was applied to each slides and incubated at room temperature for
15 min before the slides were observed under epifluorescence microscopy.
Lipid peroxidation The level of lipid peroxidation was evaluated by the
measurement of malondialdehyde (MDA) by recording the amount of thiobarbituric acid
reactive substances (TBARS). 2 ml of the reaction mixture (thiobarbituric acid (0.375%),
trichloroacetic acid (15%) and hydrochloric acid (0.25 N)) were mixed in 1:1:1 ratio and
added to 1 ml of the heat denatured supernatant. TBARS levels was estimated at 535 nm
using MDA as standard. The concentration of lipid peroxidation compounds was expressed
as nmol of MDA per mg of tissue protein (Vlahogianni et al. 2007).
4.2.1.7 Integrated biomarker response
The integration of all measured biomarker responses into one general index was
performed as previously described with modifications. Biomarker response data were first
standardized to allow direct comparison at different exposure concentrations:
i ii
i
X mYs−
= (4.1)
58
where Yi is the standardized biomarker response; Xi is the response value of each
biomarker; mi and si are the mean and the standard deviation of the biomarker, respectively.
The minimum value (mini) and maximum value (maxi) for each biomarker was also
calculated from the standardized response value. The normalized score of each biomarker
response (Bi) was computed as:
minmax
i ii
i
YB
+= (4.2)
Finally, the enhanced integrated biomarker response value (EIBR) was calculated as the
average summation of the individual biomarker score:
1 /niiEIBR B n== ∑ (4.3)
4.2.1.8 Statistical analysis
Data were checked for normality and homogeneity of variance using Kolmogorov
Smirnov and Levene’s test. One way ANOVA followed by Tukey’s post-hoc tests were
performed to compare variables between the control and the exposure samples. The
significance level was set at p<0.05. Statistical analysis was performed using SPSS 19.
4.2.2 Results and Discussion
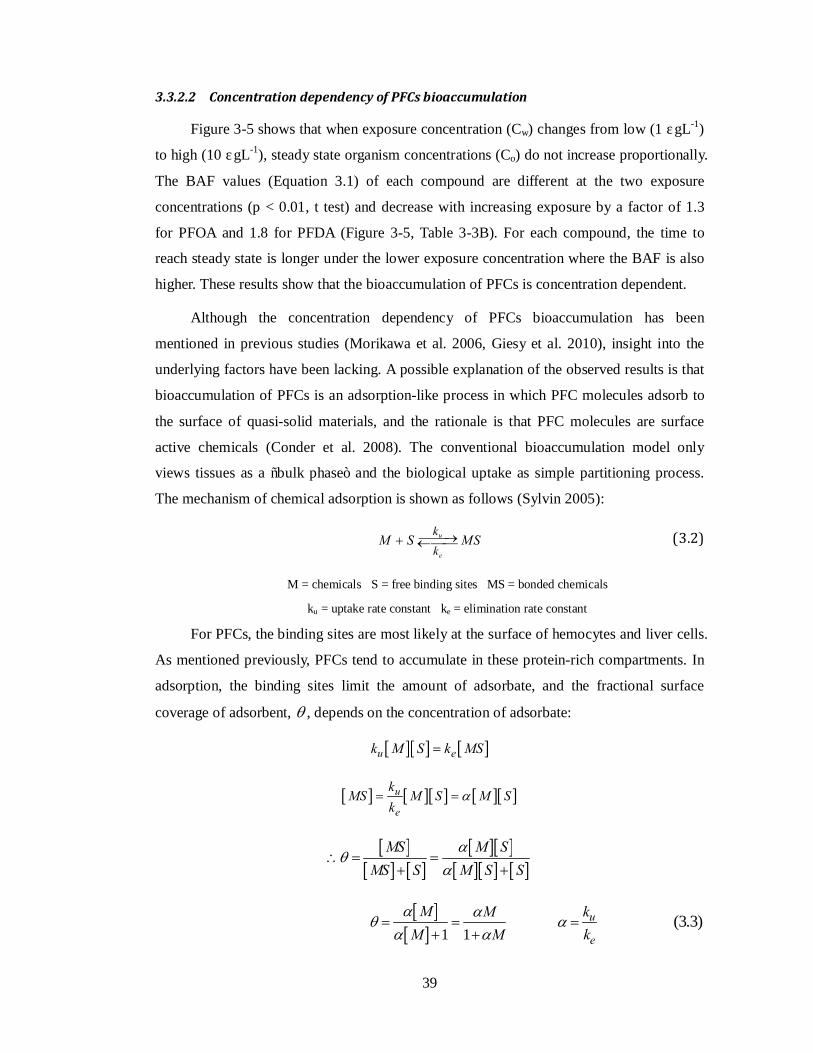
4.2.2.1 Antioxidant response and oxidative stress
As shown in Figure 4-2, the tested PFCs triggered a series of antioxidant enzyme
activity. These activities include activation of CAT and SOD, inhibition of GPx and
reduction of GSH content. Generally speaking, the antioxidant response increases with the
exposure concentration of PFCs, and significant responses were normally observed at
approximately 100μg/L. The induction of antioxidant activity indicates an imbalance of the
cellular oxidative homeostasis and excessive production of ROS in the cells. The presence
of excessive ROS under PFC exposure may then result in oxidative stress related toxicity.
PFCs are suspected peroxisome proliferators (Rosen et al. 2008). They may bind to and
activate the peroxisome proliferator activated receptor protein and promote the catabolism
of fatty acids which leads to excessive ROS production (Arukwe & Mortensen 2011, Yang
2010). Antioxidant responses for PFOA and PFOS have been reported in freshwater fish in
in vitro studies (Liu et al. 2007c), where a higher range of exposure level (1-30mg/L) was
59
adopted. The current study shows that besides PFOA and PFOS, exposure with other long
chain PFCs, such as PFNA and PFDA, can also impose oxidative stress in organism.
Similar increase of antioxidant activity was also observed in organism exposure to toxic
metals and PCBs as part of their antioxidant enzymatic defense system against free radicals
(Faria et al. 2009).
At the initial increase of PFC concentrations (from 0 to 100 μg/L), activation of
enzymes was observed for CAT and SOD, accompanied with a reduction in GSH content
(Figure 4-2). ROS production under PFC exposure was shown to be dose-dependent and
increase with the exposure concentration (Liu et al. 2007a). The increasing antioxidant
enzyme activity is an adaptive response under this situation to remove the excess ROS,
where ROS can be reduced through the antioxidant chain reactions: SOD first catalyzes the
dismutation of superoxide to O2 and H2O2. CAT then catalyzes the reduction of H2O2 to
H2O. H2O2 can also be reduced by oxidizing GSH to GSSG which is catalyzed by GPx.
Antioxidant enzymes play an important role in detoxifying PFC induced ROS. Activation
of these enzymes under mild PFC exposure helps to prevent excess ROS from causing
deleterious cellular effects. However, no significant induction of GPx was observed under
mild PFC exposure (0-100 μg/L) in the current study (Figure 4-2). It is also noticed that,
unlike other enzymes, there is no significant lag phase of SOD activity. This enzyme was
activated even at low exposure concentration of PFCs.
60
10-1
100
101
102
103
104
10
15
20
25
30
35
40
45
50
55
60
Concentration (µg/L)
CA
T ac
tivity
( µm
ol/m
in/m
g pr
otei
n)
PFOSPFOAPFNAPFDA
10-1
100
101
102
103
104
12
14
16
18
20
22
24
26
Concentration (µg/L)
SO
D a
ctiv
ity (U
/mg
prot
ein)
PFOSPFOAPFNAPFDA
(a)
(b)
61
Figure 4-2 Response of antioxidant enzyme activity in green mussels under the exposure of PFCs. (a) CAT, (b) SOD, (c) GPx and (d) GSH. The points represent test results and the lines are dose-response curve fitted
by Matlab.
When PFC exposure concentrations further increase (100-10000 μg/L), a decrease
10-1
100
101
102
103
104
35
40
45
50
55
60
65
70
75
80
Concentration (µg/L)
GP
x ac
tivity
(nm
ol/m
in/m
g pr
otei
n)
PFOSPFOAPFNAPFDA
10-1
100
101
102
103
104
0.2
0.25
0.3
0.35
0.4
0.45
0.5
Concentration (µg/L)
GS
H c
oten
t (m
mol
/mg
prot
ein)
PFOSPFOAPFNAPFDA
(c)
(d)
0.50
0.40
0.30
0.20
62
was observed in both SOD and GPx activities. This possibly indicates that under elevated
exposure of PFCs, the ability of the organism to respond in an adaptive manner has been
compromised. There is also reported evidence that at high level of contamination, SOD
activity could be suppressed by excessive ROS production (Parolini et al. 2010). In
addition, the superoxide radicals that are not detoxified by SOD may then directly inhibit
the GPx activity (Faria et al. 2009).
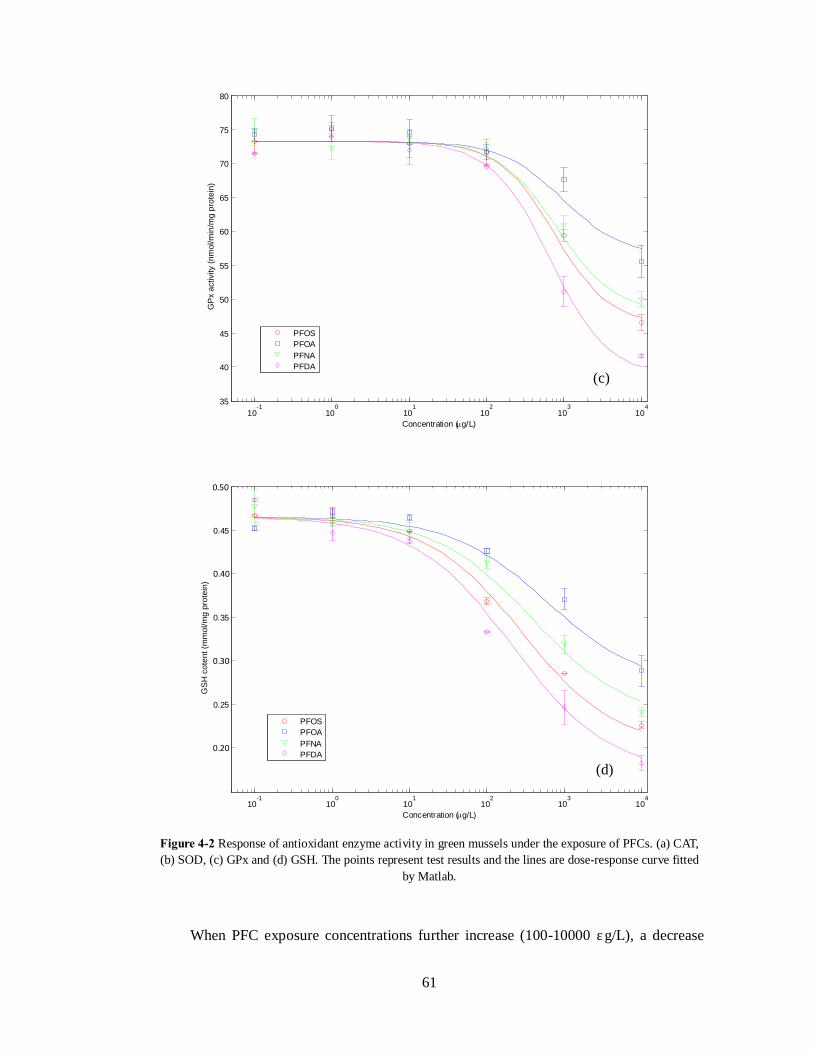
Significant increases in DNA strand breaks (Comet tail moment) and lipid
peroxidation were also observed at high exposure levels (Figure 4-3). The two biomarker
results show that the oxidative stress related damage was induced. It seems that under high
PFC exposure, the ROS production exceeds the antioxidant capacity and the induced
oxidative stress subsequently results in oxidative damage. The initial adaptive response
becomes an adverse response where the antioxidant fails to protect cells by effectively
removing the excessive ROS.
10-1
100
101
102
103
104
10
12
14
16
18
20
22
24
26
28
30
Concentration (µg/L)
Lipi
d pe
roxi
datio
n (n
mol
/mg
prot
ein)
PFOSPFOAPFNAPFDA
(a)
63
Figure 4-3 Response of oxidative damage biomarkers under the exposure of PFCs (a) Lipid peroxidation and (b) Comet assay. The points represent test results and the lines are dose-response curve fitted by Matlab.
Oxidative stress vs. oxidative damage: It is noticed that there are some common
observations in the antioxidant enzymes activities. The magnitude of adverse response at
same exposure generally followed the order of PFOA<PFNA<PFOS<PFDA (Figure 4-2).
The results indicate the increased toxicity potential of these compounds follow the same
order, which is consistent with their bioaccumulation potential identified in Chapter 3. It is
possible that antioxidant enzyme activities are correlated with the tissue concentration of
the contaminants. Antioxidant enzymes work directly with free radicals, their response to
contaminants thus might be less specific to the compounds but more related with the
accumulated concentration. Also, the tested PFCs triggered antioxidant enzyme activities
in a similar manner as shown by their dose-response curves that have a same pattern
(Figure 4-2). This could be due to the fact that these PFCs share similar mechanisms in
inducing the ROS production, as discussed earlier.
The same relationships do not apply to the oxidative damage biomarker results.
Figure 4-3 shows that PFOS exposure is able to cause the most severe oxidative stress
related DNA injuries compared with other compounds. On the other hand, for lipid
degradation, oxidative lipid damage posed by the perfluorinated carboxylates is more
10-1
100
101
102
103
104
10
15
20
25
30
35
40
45
50
Concentration (µg/L)
Com
et ta
il m
omen
t
PFOSPFOAPFNAPFDA
(b)
64
significant than that from the sulfonate, PFOS. The results imply that PFCs may have
different mechanism in causing oxidative damage. PFOS exposure is more likely to lead to
DNA damage while PFCAs tend to cause lipid degradation and potential membrane
damage. This observation supports a previous finding that PFCAs demonstrate higher
toxicity than PFOS in terms of compromising membrane integrity (Kleszczynski &
Skladanowski 2009). The reason for the disparities between antioxidant enzymes and
oxidative stress biomarkers could be that, although ROS is responsible for the oxidative
damages, the reactions could also be affected by parameters such as ambient pH,
composition of cytosol and most probably direct interference from the compounds.
Dose-response curve: The assessment of dose-response relationship is critically
important to determine the magnitude of effect and risks associated with pollutants. The
shape of dose-response curves helps to better understand the toxic behavior of PFCs. Dose-
response curves of chemicals with target biomolecules are usually sigmoid shape (Conolly
& Lutz 2004). In previous studies of PFCs, sigmoid curve was used to simulate the toxicity
results (Latala et al. 2009). However, our experimental results show that the best fitting
curve of the biomarker results is not always sigmoid. Sometimes the curve can be even
non-monotonic (Figure 4-2b). Dose-response relationships of CAT, GPx and GSH content
show the common “S” shape behavior, which can be described by the sigmoid model.
However, the curve for SOD is an inverted “U” shape, which is better modeled by a
quadratic function. Non-monotonic curves can be attributed to diverse biological reactions
that are initiated in different dose ranges (Gao et al. 2009), in this case the ROS promotion
and inhibition, binding effect etc. The non-monotonic behavior is worth noting because a
measured low response in the biomarker result may not only indicate an insignificant toxic
effect, but also severe stress to the organism.
4.2.2.2 Structure-activity relationship
In order to have an overall assessment of the oxidative toxicity, the integrated
biomarker response analysis was applied and the Enhanced Integrated Biomarker Response
(EIBR) values were calculated based on all biomarker results (Equation 4.3). It was found
that the EIBR values of each PFC are positively related to the fluorinated chain length or
fluorinated carbon number, Nfc (Figure 4-4). The result demonstrates that long chain PFCs
potentially impose more oxidative stress to the organism. Oxidative toxicity was also found
to increase with the bioaccumulation potential of PFCs, where compounds with larger BAF
65
impose higher oxidative toxicity.
Figure 4-4 Integrated oxidative toxicity induced by PFCs: compounds comparison according to (a) bioaccumulation factor and (b) perfluorinated carbon number
To further examine the structure-activity relationships of the PFC induced oxidative
toxicity, QSAR models were constructed. Different from conventional QSAR models, the
0 1 2 3 4 5 6 7 80.1
0.2
0.3
0.4
0.5
0.6
0.7
0.8
0.9
1
log(BAF)
EIB
R
100 µg/L100010000
6 6.5 7 7.5 8 8.5 9 9.5 100.1
0.2
0.3
0.4
0.5
0.6
0.7
0.8
0.9
1
Perfluorinated chain Length
EIB
R
100 µg/L100010000
(a)
(b)
1.0
1.0
66
EC50 evaluated from the dose-response curve of integrated oxidative toxicity (EIBR values)
was used as the descriptive summary statistic in this study. BAF and Nfc are not common
descriptors for QSAR model. However, considering their observed relationship with the
PFC induced oxidative toxicity, they were also included in the initial descriptor pool.
The descriptive summary statistic: In conventional QSAR models, the descriptive
summary statistic, EC50 or LC50, is mostly based on a single test result, which may
potentially introduce bias. Taking PFCs as examples, PFOS was found to exhibit higher
genotoxicity than PFCAs with similar chain length, while PFCAs were proved to possess
higher cytotoxicity potential than PFOS with respect to cell membrane damage
(Kleszczynski & Skladanowski 2009). Moreover, PFCs could display different toxicity
potential even for the same toxic mechanism, as described earlier in the current study
where the compounds demonstrated different toxicity potential as shown by their variant
performance in oxidative stress biomarkers. Therefore, the EC50 from a single test may not
be a good representation of general toxicity evaluation. On the contrary, EC50 of an
integrated assessment of multiple toxicity tests provides a more conclusive evaluation of
the toxicity potential. Therefore, the dose-response curves of integrated oxidative toxicity
were constructed using EIBR values (Figure 4-5), from which the EC50 was determined.
Figure 4-5 Dose-response relationships for integrated oxidative response of individual PFC.
10-1
100
101
102
103
104
0
0.1
0.2
0.3
0.4
0.5
0.6
0.7
0.8
0.9
1
Concentration (µg/L)
EIB
R
PFOSPFOAPFNAPFDA
1.0
0.0
67
The descriptor: Molecular descriptors were obtained through E-Dragon server
(http://www.vcclab.org/lab/edragon/) using CORINA with the SMILES of the compounds
as the input. 1664 molecular parameters were generated by the program. BAF and
fluorinated carbon number (Nfc) were also added. Constant values and pairwise correlated
descriptors were excluded in the first step (Papa et al. 2009) where 160 descriptors were
left. By applying the Sequential Feature Forward Selection method the descriptors were
then eliminated down to three. However, considering the number of observations, only one
descriptor should be the used for final QSAR model (Cronin & Schultz 2003). Therefore
correlation analysis was applied to find out the descriptor that alone is capable of providing
good descriptions of the toxicity of the compounds.
The model results: Two best fitting QSAR models were obtained (Equation 4.4 &
4.5), with BAF and Nfc as the descriptors respectively.
In previous studies, the Kow based QSAR model was developed for PFCAs (Wang et
al. 2011a). Hydrophobicity is an important physico-chemical property of organic pollutants
which is important in the uptake and elimination of compounds (Li et al. 2012, Zvinavashe
et al. 2009). Therefore Kow has been a commonly used descriptor to establish the QSAR
(Ding et al. 2011, Wang et al. 2011a). However for PFCs, Kow has been recognized as
inappropriate for assessing the partitioning behavior of these compounds in many
literatures (Kelly et al. 2009, Liu et al. 2011). Unlike common POPs, PFCs tend to
accumulate in protein-rich compartments and compartments that are high in phospholipids
content (Giesy et al. 2010, Quinete et al. 2009, Armitage et al. 2013). Considering the
special “proteinophilic” nature, a direct use of the bioaccumulation factor seems more
appropriate to provide an accurate description of the uptake of PFCs from environment to
biota. Besides, as discussed earlier, the oxidative toxicity of target PFCs was observed to
be positively related with BAF. BAF was shown to be a good descriptor for the QSAR
model:
logEC50 = -0.442 logBAF + 3.419 (4.4)
n = 4, r2 = 0.999, s = 0.012, F = 2233, Q2= 0.997
where r2 is the correlation coefficient, s is the root mean square error, F is the Fisher
criterion and Q2 is cross-validated correlation coefficient.
BAF is an important parameter in describing both uptake and binding behavior of
PFCs, where high bioaccumulation potential also implies high protein binding affinity of
68
the compounds (Liu et al. 2011). Therefore, high bioaccumulation potential favors toxicity
in two aspects: 1) high inner concentration of PFCs, where toxicity is often the result of
concentration as illustrated in Figure 4-2; and 2) strong interaction with the active proteins.
A number of toxic effects imposed by PFCs are resulting from the compounds’ binding
with active proteins (Arukwe & Mortensen 2011). As mentioned earlier, ROS production is
associated with fatty acid oxidation that is triggered by PFCs binding with peroxisome
proliferator activated receptor proteins. PFCs with higher protein binding affinity
potentially have the ability to induce more ROS production. Moreover, protein binding
also depends on the density of compounds (Vuignier et al. 2010). A high inner
concentration of PFCs also favors the binding process and thus ROS production. Therefore,
between the compounds with the same fluorinated chain length, PFOS displayed higher
oxidative toxicity potential than PFNA, probably because of its higher bioaccumulation in
organisms. Some of the previous studies concluded that PFSAs are more toxic than the
corresponding PFCAs (Nobels et al. 2010). The bio-endpoints measured in these studies
could also be linked with binding affinity or inner concentration of the tested PFCs.
Other than BAF based QSAR model, the oxidative toxicity may also be described by
the fluorinated chain length, Nfc:
logEC50 = -7.201 logNfc + 8.915 (4.5)
n = 4, r2 = 0.899, s = 0.132, F = 17.8, Q2=0.467
In previous studies, the bioaccumulation potential of PFCs has been shown to increase with
chain length (Liu et al. 2011). Therefore, a larger Nfc generally results in a higher
bioaccumulation rate. The QSAR model based on chain length offers a more practical and
convenient option to predict and assess the toxicity potential of other PFCs in group, as the
BAF of individual PFC is not always available, and BAF data are still largely obtained
from experimental results. However, there are also some limitations associated with the
chain length based QSAR model. Firstly, the functional group is not taken into
consideration, and thus the actual EC50 for PFSAs may be lower than the estimated value
by the chain length based QSAR (This also explains the lower Q2 value). Secondly, the
bioaccumulation rate may not always increase with chain length (Conder et al. 2008).
When Nfc is larger than 14, bioaccumulation of PFCs may decrease. In this situation the Nfc
based QSAR model may not be appropriate.
In summary, PFC exposure can induce oxidative stress to organisms and lead to a
69
series of antioxidant responses and oxidative damage in green mussels. The oxidative
toxicity was found to be exposure concentration dependent. At low exposure levels,
activation of antioxidant enzymes is an adaptive response to low levels of ROS induced by
PFCs. At high PFC concentration, inhibition of certain enzymes was observed where the
organism’s ability to respond in an adaptive manner was compromised. The oxidative
stress under high contamination level of PFCs also leads to lipid and DNA damages.
The PFC induced oxidative toxicity was found to be positively related to the
bioaccumulation potential of the compounds. High bioaccumulation potential promotes
oxidative toxicity not only because of the resulting high inner concentration in organism,
but also because for “proteinophilic” PFCs, high bioaccumulation also means high binding
affinity with proteins. Both of these conditions favor the excessive ROS production.
Besides bioaccumulation and perfluorinated chain length, the functional group can also
affect the oxidative toxicity. For compounds with same perfluorinated chain, the sulfonate
displays higher toxicity than its correspondence carboxylate. This could be due to the
higher polarity of the -SO3- group which may bring in stronger bindings and interactions.
QSAR models were established to describe the toxicity potential of the compounds, where
the oxidative toxicity of PFCs was found to be well related with BAF and fluorinated chain
length. While the former provides a more accurate model description, the latter is more
convenient in the prediction and risk assessment with certain limitations. Recent studies
have suggested that binding to phospholipids can be an important pathway for the sorption
of PFCs. Therefore the membrane-water partition coefficient, which was used to
characterize sorption to phospholipids, could also be a useful descriptor of PFC
bioaccumulation once the values of this coefficient are established.
4.3 Inhibition of xenobiotic metabolism
Xenobiotic metabolism is the biologically mediated modification of exogenous
compounds through a specialized enzyme system. It is a form of biotransformation that
leads to enhanced elimination and sequestration of compounds foreign to an organism's
normal biochemistry, such as drugs, poisons and environmental pollutants (Newman 2009).
During xenobiotic metabolism, lipophilic compounds are generally converted to more
hydrophilic products that are more amenable to excretion from the organism. Therefore,
xenobiotic metabolism is an important detoxification pathway of contaminants absorbed by
70
the organism from the ambient environment. The process is mediated and catalyzed by a
series of xenobiotic metabolizing enzymes such as cytochrome P450 (CYP)-dependent
mixed function oxidase and glutathione S-transferase (GST).
In the literature, the activities of these enzymes have been used as important
biomarkers in the assessment of the functionality of xenobiotic metabolism and thus the
health status of organisms (Kammann et al. 2005, Ramos & Garcia 2007). For example
GST conjugating activity was found to be positively related with PAH levels in Perna
viridis (Faria et al. 2009). Induction of CYP in organism was also observed in many studies
under exposure to PCBs, PAHs and organochlorine pesticides (Ramos & Garcia 2007,
Sarkar et al. 2006). Ethoxyresorufin-O-deethylase (EROD) has been successfully used as a
biomarker for marine biomonitoring of fish in a number of studies (Kammann et al. 2005,
Skouras et al. 2003). EROD is a highly sensitive indicator of contaminant uptake,
providing evidence of receptor-mediated induction of cytochrome P450-dependant
monooxygenases (the CYP1A1 subfamily specifically) by xenobiotic chemicals (Whyte et
al. 2000). Studies demonstrated that induction of metabolizing enzymes do not merely
indicate exposure to contaminant but is also correlated to harmful biological effects (Yuen
& Au 2006).
Considering its significance in the biological detoxification process, investigation of
xenobiotic metabolism through examination of metabolizing enzyme activities could bring
some insights of the potential adverse effects of PFCs. With this in mind, the activity of
two enzymes, EROD and GST were examined after exposure to the PFOS, PFOA, PFNA
and PFDA, to identify the PFC induced adverse effects in the organism’s detoxification
process.
4.3.1 Materials and Methods
The chemicals, exposure experiment, mussel maintenance, sample preparation and
statistical analysis were described in Section 4.2.1. The exposure concentrations were 0.1,
1, 10, 100 and 1000µg/L of individual PFC. The exposure period was 7 days.
Biomarker analysis
Glutathione S-transferase (GST) activity. GST was measured using 1-chloro-2,4-
dinitrobenzene (CDNB, 1 mM) as a substrate. The change in absorbance was recorded at
340nm. The enzyme activity was expressed as μmol CDNB conjugate formed/min/mg
71
protein using a molar extinction coefficient of 9.6 mM-1cm-1
7-ethoxy resorufin O-deethylase (EROD) activity. EROD activity was measured as
described elsewhere (Jönsson et al. 2002), where mussel gill arches were excised and
placed in ice cold HEPES-Cortland buffer (pH 7.7). The tip pieces were isolated by a cut
above the septum of the gill filaments which resulted in tips pieces about 2 mm long. For
each mussel, 2 mm pieces were selected and groups of ten pieces were placed in
microcentrifuge tubes. 0.5 ml of reaction buffer was added and pre-incubated for 10 min.
The reaction buffer consisted of 7-ethoxyresorufin (1 μM) and dicumarol (10 μM) in
HEPES-Cortland buffer. The reaction buffer was then removed and replaced repeatedly
with 0.7 ml fresh reaction buffer with an incubation period of 10 min and 30 min at 25°C.
Triplicates of 0.2 ml aliquots were transferred from each tube to a fluorescent 96 well
microplate. Resorufin standards (0.5-250 nM) were also included on each plate in
triplicates of 0.2 ml aliquots. The standards were diluted from stock solution (10 mM in
methanol) using reaction buffer. The fluorescence was determined using a microplate
reader at 544 (ex) and 590 (em) nm. The EROD activity was expressed as picomole of
resorufin per miligram protein per min.
4.3.2 Results and Discussion
Inhibition of enzyme activity has been observed for both biomarkers (Figure 4-6).
Xenobiotic metabolism can be separated into two phases of reaction. Phase I is
modification, where enzymes act to introduce reactive and polar groups into their
substrates to increase the reactivity, normally hydrophilicity. One of the most common
modifications is hydroxylation by the CYP group. Phase II is conjugation, where activated
xenobiotic metabolites from Phase I are conjugated with charged species to foster the
elimination of the compounds. One of the most common Phase II reactions is the GST
catalyzed conjugation. The observed inhibition implies that PFCs are able to interrupt the
normal activity of both Phase I and II xenobiotic metabolizing enzymes.
Measurement of CYP in terms of EROD activity has been commonly used as a
biomarker of exposure to persistent organic pollutants. The mixed-function oxygenase
(MFO) system along with its main component, the CYP group of enzymes, plays a
fundamental role in the biotransformation of exogenous compounds. CYP catalyzes the
oxidation of organic substances. It is the major enzyme in xenobiotics metabolism and
accounts for 75% of the total number of different metabolic reactions. The induction of
72
CYP is often an adaptive response to the presence of xenobiotics. Induction of EROD in
marine invertebrates has been frequently observed under the exposure of PCBs, PAHs and
organochlorine pesticides (Binelli et al. 2006, Ramos & Garcia 2007, Sarkar et al. 2006).
However in the current study, there is a lack of significant induction of EROD activity for
the tested compounds at most of the exposure concentrations (Figure 4-6). As EROD
activity describes the rate of CYP mediated xenobiotics metabolism, the current results
imply a lack of biotransformation of the tested PFCs in the organism, which probably
results from the high oxidation state of the functional group and the strong covalent
carbon-fluorine bond. The observed results, however, support a previous conclusion that
PFCs are metabolically inert and are resistant to biodegradation (Freire et al. 2008).
Decreases in the mean value of EROD activity were observed at 1000 µg/L for PFOS,
PFNA and PFDA. Previous studies showed that PFCs can modulate the gene expression of
CYP enzymes (Hagenaars et al. 2008, Hu et al. 2005). It is possible that at higher exposure
concentrations, PFCs can induce inhibition of EROD activity through gene modulation.
Exposure concentration (µg/L)
73
Exposure concentration (µg/L)
Figure 4-6 Response of xenobiotic metabolizing enzyme activity under PFC exposure. Significant responses (p<0.05) are marked with *.
Phase II enzymes play important roles in the detoxification and clearance of many
xenobiotics. They protect cells by conjugating and neutralizing electrophilic compounds
and metabolites from Phase I metabolism, rendering them as more water-soluble products,
and therefore actively transported (Faria et al. 2009). GST is considered a major Phase II
enzyme which is also an important detoxifying enzyme. GST activity is considered a
sensitive biomarker of exposure to a broad range of contaminants in mussels (Faria et al.
2009). Compounds could be glutathione-conjugated by GST in a direct way or
subsequently through the weakly active Phase I biotransformation enzyme. Similarly with
Phase I enzyme, GST can be activated in the presence of xenobiotics. GST conjugating
activity has been shown to increase with PAHs levels in Perna viridis (Faria et al. 2009).
However in the current study, GST was inhibited under PFC exposure and the activity of
the enzyme was found negatively correlated with PFC concentration in green mussels
(Figure 4-6). PFC induced inhibition of GST was also reported in Liu et al.’s study (2007),
where both PFOS and PFOA could significantly reduce the enzyme activity. Down-
regulation of GST can also result in a disturbance in normal redox state which will then
cause oxidative stress through the production of peroxides and free radicals. GSH is a
common antioxidant. ROS can be reduced by oxidizing GSH. Moreover GSH is also one
of the co-factors in GST-catalyzed conjugation. A decrease in GSH content is concomitant
74
to the decrease in GST. Suppressed GSH content under elevated PFC exposure has already
been demonstrated in the previous section.
Studies have shown that PFCs have the ability to interfere transcription factors for
metabolizing enzymes and may affect the transcription of several isozymes and their
detoxification activities (Kennedy et al. 2004, Mortensen et al. 2011, Yeung et al. 2007).
The decrease of EROD or GST activity could be due to the inhibition from the tested
compounds, where PFCs may modulate the gene expression or down-regulate the
transcription of the metabolizing enzymes (Hagenaars et al. 2008, Hu et al. 2005).
The observed deactivation of the enzymes indicates suppression in the cellular
detoxification process under PFC exposure. The results not only suggest a lack of
biotransformation of PFCs in the organism, but also imply that PFC exposure could have
indirect adverse effects on organism health. The PFC induced inhibition of detoxifying
enzymes places potential health risks to the organisms by weakening their self defense
system, especially when other toxic pollutants are present.
4.4 Genotoxicity
In previous section, PFCs were found to be able to induce oxidative stress and
subsequently cause damage to DNA molecules. It has been suggested that some PFCs
could induce disturbance in DNA metabolism homeostasis (Arukwe & Mortensen 2011).
Studies have reported that gene expressions of important biological functions such as
energy consumption and reproduction can be influenced by PFOS exposure (Hagenaars et
al. 2008). In other studies, PFOA was also found to suppress the expression of genes that
were related to inflammation and immunity, and induce apoptosis (Cui et al. 2009, Freire et
al. 2008). Occurrence of genetic damage after PFC exposure was also reported by flow
cytometric analysis studies (Nobels et al. 2010). The results of these studies clearly
indicate a genotoxicity potential of these compounds.
Genotoxicity refers to the damage by a physical or chemical agent of genetic
materials such as chromosomes or DNA (Newman 2009). DNA damage can result in gene
mutation, which could lead to serious biological dysfunctions, and even diseases, and the
effects on the health of an organism normally take a long time to appear (Hagenaars et al.
2008, Villela et al. 2006). The ability of compounds to interfere with DNA integrity and
75
gene expression renders them potentially mutagenic or even carcinogenic. Therefore the
examination of genotoxicity of PFCs can provide important information on their potential
impacts on organism health.
The purpose of the current study was to investigate the genotoxicity potential of
PFOS, PFOA, PFNA and PFDA. Genotoxicity of PFCs was assessed through three
genotoxicity biomarker assays, including Comet Assay, DNA diffusion assay (Halo assay)
and Micronucleus Tests. The time and concentration effects on the compounds’ toxic
behavior were examined. The organism burden of PFCs was also measured so that toxic
behavior could be related to the inner concentration of the compounds.
4.4.1 Materials and Methods
The chemicals, experimental set-up, sample preparation and extraction have been
described in Section 4.2.1.
4.4.1.1 Exposure and depuration experiment
The exposure levels were 0.1, 1, 10, 100 and 1000μg/L of individual PFC. The
exposure period was 7 days, followed by another 7 days for the depuration period during
which no PFCs was present. Mussels were sampled every 24-hour for biomarker tests and
concentration analysis.
4.4.1.2 Biomarkers
Comet assay The Comet assay was performed using the Comet Assay Kit from
Cellbiolabs, Inc. In brief, the haemolymph suspension was centrifuged at 700xg for 2 min
and the supernatant was discarded. The cells were washed and resuspended in ice-cold
PBS at 1x10⁵cells/ml. The cell sample was then mixed with pre-liquified agrose at 1:10
(v/v). 75μl of the mixture was transferred immediately onto microscope slides. The slides
were prepared in triplicate for each cell sample. The slides were then transferred to 4°C in
the dark for 15 min and maintained horizontally. After gelation, the slides were immersed
in ice-cold lysis buffer and in ice-cold alkaline solution each for 30 min at 4°C in the dark.
Electrophoresis was performed in alkaline solution for 30 min at 1 volt/cm, 300mA. After
electrophoresis, the slides were firstly washed in ice-cold DI water and then immersed in
70% ethanol for 5min. 100μl of Vista Green DNA dye was applied to each slide before the
slides were observed under epifluorescence microscopy.
76
Halo Assay Following the same procedures for Comet assay, after lysis in the lysis
buffer, the slides were immersed in alkaline electrophoresis buffer for 5 min. After the
unwinding, each slide was immersed twice in separate neutralizing solution for 30 min.
The neutralizing solution was prepared by mixing Tris-HCl (20mM pH 7.4), spermine
(1mg/ml) and ethanol (50% v/v) in DI water. Finally the slides were immersed in absolute
ethanol for 5min and air dried. 50μl of diluted YOYO-1 dye (0.25μM YOYO, 2.5%DMSO,
0.5% sucrose dissolve in DI water) was applied for 15 min to stain the slides. The slides
were then observed under epifluorescence microscopy.
Micronucleus (MN) test 50 μl of the haemolymph suspension was then spread on a
slide and left for 15min in a humidity chamber at room temperature to allow the hemocytes
to settle down. The hemocytes were then fixed with glutaraldehyde (1% in PBS) for 5 min.
The slides were then air dried. Each slide was stained with 50 μl of bisbenzimide 33258
(1mg/ml) for 10 mins. The slides were then washed and mounted in glycerol: Mcllvane
(1:1 v/v) buffer (pH 7) and kept in the dark at 4°C before being examined with
fluorescence microscope with submerged lens at 100x magnification. Only intact cells with
distinct nuclear and cellular membranes were scored. The micronucleus was identified
according to: 1) spherical cytoplasmatic inclusions with a sharp contour; 2) diametric
smaller than one third of the nucleus; and 3) the color and texture resembling the nucleus,
and no contact with the nucleus.
4.4.1.3 Instrumental analysis
Mussel samples were analyzed by liquid chromatography-tandem mass spectrometry
(LC-MS/MS, triple quadrupole 8030, Shimadzu, Japan) to quantify the organism
concentration of the tested PFCs. Prior to injection, 100 µl of internal standard solution 6
test, ‰ micronucleus) and apoptosis (Halo assay). The results show that the tested PFCs
were able to induce significant genotoxic responses in the target organism (Figure 4-7).
The adverse responses generally increased with the exposure concentration and
demonstrated a concentration dependency. Compared with the control, significant
responses normally occurred only at elevated exposure concentrations (Figure 4-7).
79
(a)
(b)
80
Figure 4-7 Response of genotoxicity biomarkers in green mussels under PFC exposure. Values represent the mean ± standard error. Significant responses (p < 0.05) are marked with *. (a) Comet assay, (b) Halo assay
and (c) MN test
Comet tail moment provides a measure of preliminary DNA fragmentation. DNA
fragments and strand breaks were separated from intact DNA, yielding a classic “comet tail”
under microscope examination. Current results show that all the tested PFCs were able to
cause significant DNA fragmentation at 1000 μg/L. Only PFOS and PFDA exhibited some
induction at lower exposure levels. A larger comet tail moment normally indicates more
DNA fragmentations and thus, more severe DNA injury. At each exposure level, PFOS
exhibited higher induction of comet tail moment than other compounds and displayed
distinct genotoxicity potential. Significant DNA fragmentation has also been shown to be
induced by other organic contaminants such as common pharmaceuticals (Binelli et al.
2009a, Parolini et al. 2010).
Micronucleus (MN) test screens for potential genotoxic compounds, and detects
permanent DNA damage. The MN test indirectly evaluates both chromosomal breaks and
mitosis dysfunction (Villela et al. 2006). The results of the MN test were similar to the
Comet assay results, with PFOS giving the maximum MN frequency, followed by PFDA,
PFNA and PFOA. Significant MN induction has also been found in mussels exposed to
carcinogenic PAHs (Siu et al. 2004). Micronuclei are cytoplasmic bodies having a portion
of chromosome which was not carried to the opposite poles during the anaphase. The
(c)
81
observed formation of micronucleus may result in daughter cells lacking a part of the
chromosome. It has been suggested that there could be a cause and effect relationship
between DNA strand break and chromosome damage (Siu et al. 2004). This helps to
explain the similar dose-response patterns of the results of Comet assay and MN tests.
Halo assay also detects fixed DNA damage in cells. It is a sensitive DNA diffusion
assay for quantification of apoptosis. Nuclear DNA of apoptotic cells has abundant sites
and under alkaline conditions, small pieces of DNA generated diffuse and giving the halo
appearance. Normally a higher percentage of apoptosis indicates more severe DNA
damage. The current result shows that PFOS, PFNA and PFDA are able to induce fixed
DNA damage at exposure concentrations of 100μg/L and higher. The observed Apoptosis
could be triggered by oxidative stress and related disruption in mitochondrial (Liu et al.
2007a). Among the tested compounds, PFOS again demonstrates marked genotoxicity
potential by inducing more than 30% apoptosis than other PFCs. It is also noticed that the
highest responses were not always observed at the highest exposure level. Under elevated
exposure of contaminants, there is a slight decrease in apoptotic cells for PFOS. The reason
is that apoptosis is induced only under mild genotoxic stimuli (Singh 2005). Therefore,
when contaminant concentration is too high, necrosis may occur instead of apoptosis and
the programmed cell death become natural cell death. Necrosis was detected in human
cells exposed to benzo(a)pyrene and atrazine-based herbicide (Jiang et al. 2012, Zeljezic et
al. 2006). In this case, the lowered biomarker response suggests an intensified genotoxic
effect by PFOS.
When comparing the dose-response results of the three biomarkers, they displayed
similar trend with respect to exposure concentration (Figure 4-7). As mentioned earlier, the
Comet assay measures preliminary DNA damage, which is likely to lead to fixed genetic
injuries such as apoptosis or the production of micronuclei. It has been previously
suggested that DNA strand breaks is an apoptosis-inducing factor and also a contributor to
MN induction (Parolini & Binelli 2012). It is possible that the hemocytes activate the
apoptotic processes or produce micronuclei when serious DNA injuries occur. This helps to
explain the similar pattern of the three biomarker results.
Genotoxicity potential of PFCs: In spite of similar response pattern, there are
distinctions in the amount of adverse responses between the tested compounds. At the same
exposure level (mainly 100 and 1000μg/L), the magnitude of toxic response normally
followed the order of PFOA<PFNA<PFDA<PFOS. The integrated biomarker analysis of
82
the three biomarkers also shows that, in terms of the EIBR value, the relative genotoxicity
potential followed the same order (Table 4-2, Figure 4-8). The EC50 values and confidence
interval (CI) calculated using probit analysis based on the integrative genotoxicity are be
67 (61-73), 817 (790-838), 243 (229-251) and 118 (101-124) μg/L for PFOS, PFOA,
PFNA and PFDA respectively. PFOS was shown to have significantly higher response
scores and lower EC50 values compared to the other PFCs. The results suggest that PFOS
has higher genotoxicity potential than the other perfluorinated carboxylates. Among the
three PFCAs, the genotoxicity potential simply increases with their fluorinated chain
length (Figure 4-9).
PFOS related genetic injuries have been reported in many studies (Guruge et al.
2009, Rosen et al. 2008, Yeung et al. 2007). The occurrence of DNA damage after
exposure to PFOS has been observed in common carps (Hoff et al. 2003). Gene expression
studies in zebrafish embryos revealed DNA damage mediated apoptosis after exposure to
PFOS as well (Shi et al. 2008). In some other studies, examination of gene expressions
suggested that the effect of PFC chain length is a more important factor than the functional
group (Hagenaars et al. 2008, Nobels et al. 2010). However, Hagenaars et al. (2008) found
that the effects at gene expression level were higher for the sulfonate than for the
carboxylate. Biomarker results from the present study also show that the functional group
of PFCs is the major factor that affects the compounds’ interaction with genetic materials.
Table 4-2 EIBR values of genotoxicity biomarkers.
PFOS PFOA PFNA PFDA
Perfluorinated carbon no. 8 7 8 9
EIBR at 100 μg/L 0.64±0.04 0.10±0.03 0.30±0.04 0.45±0.04
EIBR at 1000 μg/L 0.86±0.02 0.25±0.04 0.55±0.04 0.72±0.04
EIBR values at each exposure level are statistically different from each other (p<0.01, t-test).
83
Figure 4-8 Comparison of genotoxicity EIBR among tested PFCs.
There are also some inconsistencies in the genotoxicity data of PFOA. PFOA has
been reported to induce apoptosis, strand breaks and MN in human HepG2 cells (Freire et
al. 2008). PFOA induced apoptosis was also reported in Liu et al.’s study (2007) in fish
cells. However, Kim et al. (2010) found no significant induction of DNA fragmentation
from PFOA even at an elevated exposure concentration of 50000μg/L in carps (Kim et al.
2010). In the current study, there is also a lack of significant induction of apoptosis under
PFOA exposure, while a notable response in DNA fragmentation was observed in PFOA
exposed mussels. These contradictions could be possibly due to the fact that PFC induced
genotoxic effects are species specific. In addition, exposure level, exposure duration and
laboratory conditions may also be the causes of variability in the test results.
6 6.5 7 7.5 8 8.5 9 9.5 100
0.1
0.2
0.3
0.4
0.5
0.6
0.7
0.8
0.9
Perfluorinated chain Length
EIB
R
100 µg/L1000
PFNA
PFNA
PFOS
PFOS
PFDA
PFDA
PFOA
PFOA
84
Figure 4-9 Comparison of EC50 based on integrated genotoxicity evaluation.
Possible cause of genotoxicity: It has been suggested that one of the triggers of
DNA damage is oxidative stress (Parolini et al. 2010). This may help to explain the
observed adverse effects in the genotoxicity biomarkers in the present study as well.
Previous study has demonstrated that PFCs can induce excessive production of ROS and
impose oxidative stress in green mussels. The ROS was accused of interfering with DNA,
leading to genetic injuries such as strands breaks (Freire et al. 2008). In addition, PFCs
may also influence the homeostasis of DNA metabolism, as suggested in previous gene
profiling studies (Arukwe & Mortensen 2011). A direct interaction with DNA molecules is
also a possible toxic pathway. Besides the genetic damage measured by the above
biomarkers, genotoxicity could also result from injuries such as double strand breaks,
translocations and inversions, according to studies of other organic pollutants (Parolini et al.
2010).
Exposure time dependency: Other than the exposure concentration, exposure
duration was also a significant factor influencing PFC induced genotoxicity on green
mussels. The adverse effects showed both dose- and time-dependency (Figure 4-10). At the
10
100
1000
6 7 8 9 10
EC50
(μg/
L)
Fluorinated chain length
PFOA
PFNA
PFOS
PFDA
85
Figure 4-10 Time dependency of genotoxicity biomarker responses and bioaccumulation in green mussels.
Co and Cw are the organism and water concentration, respectively (Cw = 100 μg/L).
Exposure Depuration
PFOS
PFNA
PFOS
PFNA
PFOS
PFNA
86
same exposure level, the genotoxicity biomarker response increased with exposure time, as
the organism burden of PFCs increased as a result of bioaccumulation. The amount of PFC
bioaccumulation is also positively related with the exposure concentration, as discussed in
previous chapter. Therefore, the inner PFC concentration may provide an important link to
the observed dose-response and time-response relationship.
During the exposure period, biomarker responses increased with the accumulation of
PFCs in the organism (Figure 4-10). This observation is in agreement with a previous
conclusion that there could be a potential relationship between body burden of organic
contaminants and DNA damage (Siu et al. 2008). During the depuration phase, PFCs are
being eliminated from the organism. However, different response patterns among
biomarkers were observed, where biomarkers showed both reversible and irreversible
behavior after PFC exposure stopped, although for the same biomarker, there was not
much variance in the response pattern of the tested PFCs.
For comet tail moment, toxic responses started decreasing with organism
concentration of PFCs when the exposure stopped. As mentioned previously, the Comet
assay measures only minor DNA fragmentation where the organism’s self-repairing system
is capable of fixing (Villela et al. 2006). This measured DNA damage is a net result of two
concurrent processes: damage and repair (Siu et al. 2008). When PFCs started to
accumulate in the body, the induced DNA fragmentation exceeded the capacity of the
repair system and thus accumulated. When the exposure stopped, the stress reduced as
PFCs were eliminated from the body, and the self-repairing system was capable of fixing
most of the damaged DNA and the amount of DNA fragmentation decreased.
However, unlike the Comet assay, toxic effects measured by the Halo assay and MN
test were not restored at the end of depuration. This could be because both assays measured
permanent damage to genetic material and cell nucleus. Even though the inner
concentration of PFCs decreased after exposure stopped, the damage could not be repaired
and thus, the toxic effects are irreversible. Slight decreases in biomarker responses were
still observed at the end of depuration. The minor reduction in the measured toxic effects
could be caused by cellular renewal mechanism by which damaged cells are removed. The
observed irreversibility of genotoxic effects suggest that injuries of genetic material caused
at high PFC exposure level may not be recovered when exposure stops. Considering the
far-reaching impacts of genotoxicity, as discussed earlier, even an accidental spill of the
contaminants may have prolonged impact on the health of an exposed organism.
87
In summary, the genotoxicity potentials of tested PFCs were demonstrated in the
present study. PFC induced genotoxic effects were shown to increase with both exposure
concentration and time. The results also suggest that among the tested compounds, PFOS
exhibits higher genotoxicity potential compared with other PFCAs. The fluorinated chain
length has been proved in many studies to be the decisive factor influencing toxic activity
of PFCs. However, results of the present study indicate that in terms of genotoxicity, the
functional group plays a more important role. Although significant adverse effects were
only detected at relatively high exposure concentration (approximately 100 μg/L or higher),
a short term exposure at elevated concentration could have prolonged effects on the health
of organisms, since PFC induced damages to genetic materials could be irreversible and
may lead to permanent health effects.
4.5 Immunotoxicity
At molecular level, PFCs were found to be able to activate/inhibit important enzymes
activity, and cause damage to macromolecules such as lipid and DNA. In this section,
cellular level effects of PFCs were studied by examining the immunotoxic biomarkers.
Organisms rely on their innate defence mechanism to identify and protect against
foreign matter (Hannam et al. 2009). The ability of organisms to respond effectively
against pollutants is important to their general health (Giannapas et al. 2012). Disruption of
the immune system results in high health risks to the organism. Adverse effects from
pollutants can be resulted from immune susceptibility even at sublethal level. Previous
studies suggested that the immune system is a sensitive target of PFCs (Corsini et al. 2012).
However, these studies targeted on human health effects and the data is limited to human
cells or rodent species (Dewitt et al. 2012). To date there is little data available on the
immunological effects of PFCs on aquatic invertebrates which represent more than 90% of
the existing species and thus play an important role in the ecosystem functioning (Binelli et
al. 2009a). Considering the widespread contamination of PFCs, it is necessary to extend
the investigation to better understand their ecological impacts. For invertebrates,
hemocytes are an important component of their immune system (Sheir & Handy 2010).
Haemolymph has also been suggested to be the most appropriate tissue for biomonitoring,
because of its direct exposure to environmental contaminants and its physiological role in
transportation of toxic materials (Villela et al. 2006).
88
The aim of this study was to conduct an in vivo investigation on the immunotoxicity
of PFCs in green mussels. Immunological effects of the four long chain PFCs (C7-C9)
were examined by measuring biomarkers of the immune profile, which included Neutral
Red retention, phagocytosis and spontaneous cytotoxicity. Mussels are often used as
sentinel organisms for contamination monitoring (Luengen et al. 2004). The circulation
system of mussels is continuously exposed to their living environment as well as the
contaminants (Thiagarajan et al. 2006). The current study is the first to examine the effect
of PFCs on the immune health of marine invertebrates. The investigation would reveal the
robustness of organism in the presence of PFCs.
4.5.1 Materials and Methods
The chemicals, exposure and depuration experiment, mussel maintenance, sample
preparation, chemical quantification and data analysis were described in Section 4.4.1. The
integrated biomarker response (EIBR) calculation was described in Section 4.2.1.
Biomarkers
Trypan blue exclusion Trypan blue was employed to measure cell viability. The
method has been described elsewhere (Liu et al. 2007). In brief, 0.4% trypan blue was
added to the hemocytes suspension in 1:2.5 ratio (v/v). The cells were then examined under
microscope at 400x magnification. An average of 150 cells was counted in 4 different
fields per culture. Cell viability was evaluated based on the percentage of stained cells.
Neutral red retention time (NRRT) The haemolymph mixture was transferred to a
poly-l-lysine coated microscope slide and the slides were immediately placed into a light-
proof humidity chamber for 15 mins. After incubation, excess haemolymph mixture was
removed. Neutral red working solution was added to the slides and examined under a light
microscope using an x40 objective every 15 min. When not examined, the slides were kept
in the humidity chamber. The time at which 50% of the cells showed stress was recorded as
the retention time. The neutral red working solution was prepared by mixing neutral red
stock solution (20mg/ml in DMSO) with physiological saline at 1:200 (v/v).
Spontaneous cytotoxicity The test method has been described previously (Sheir &
Handy 2010). In brief, the sheep red blood cells were washed with PBS and resuspended in
TBS-Ca to 2x10⁶cells/ml. The mussel hemocytes were washed with TBS and also
resuspended in TBS-Ca to 2x10⁶ cell/ml. 100 μl hemocytes were then mixed with 100 μl
89
sheep RBC and incubated at 25°C for 60 min on a shaker. The samples were centrifuged at
100xg for 5 min after the incubation. 100 μl of the supernatant was transferred to 4
replicate wells in a microplate and the absorbance was read at 405nm. The specific
cytotoxicity was calculated as a percentage relative to the maximum release (100 μl sheep
RBC in 100 μl H2O) and the minimum or the spontaneous release (100 μl sheep RBC in
100 μl TBS-Ca).
Phagocytosis The phagocytosis assay measures the ability of hemocytes to engulf
foreign material which in this case are zymozan particles. The test method has been
described previously (Sheir & Handy 2010). In brief, the zymozan particles were firstly
stained with neutral red and resuspended in TBS at a final concentration of
1x10⁷particles/ml. Mussel haemolymph was diluted with TBS at 1:1 dilution. 50μl of each
haemolymph samples was aliquoted to 4 replicate tubes followed by addition of 50μl of
red-stained zymosan suspension. Zymosan with fixed hemocytes and zymozan in buffer
were used as blank and negative control respectively. After 30min incubation at 10°C, 100
μl Baker’s formol calcium (with 2%NaCl) was added to stop the reaction. The tubes were
centrifuged and supernatant was discarded. The sample was resuspended in 100 μl TBS.
The above procedures were repeated 6 times until there was no evidence of zymosan
remaining in the negative controls. The hemocytes were solubilized by adding 100 μl 1%
acetic acid in 50% ethanol and incubated for 30 mins. They were then transferred to a
microplate and read at 550nm.
4.5.2 Results and Discussion
4.5.2.1 Immunotoxicity biomarker results
The selected immunological biomarkers provide an assessment of the health status of
the internal defence system of the organism. Biomarker results showed that exposure to
PFCs resulted in measurable reductions in the immune fitness of green mussels, as
indicated by the significant decrease in the biomarker response as the exposure level
increases (Figure 4-11). The hemocyte cell viability was measured by trypan blue
exclusion assay. Immune activity depends on viable cell-to-cell interaction. Trypan blue
evaluates cell viability through measuring intact cellular membrane, which is closely
related to the immune mechanism. The results show that the tested compounds can
decrease cell viability in a dose-dependent manner (Figure 4-12). Some have suggested
that the loss of cell viability could be mediated through ROS production (Liu et al. 2007c).
90
PFC induced loss in cell viability has also been reported in other species (Kraugerud et al.
2011, Slotkin et al. 2008, Watanabe et al. 2009).
Exposure concentration (µg/L)
Exposure concentration (µg/L)
(a)
(b)
* *
*
* * *
*
* *
*
*
*
91
Exposure concentration (µg/L)
Figure 4-11 Response of immunotoxicity biomarkers in green mussels under PFC exposure. Significant responses (p<0.05) are marked with*. (a) NRRT, (b) Phagocytosis and (c) Spontaneous cytotoxicity
Exposure concentration (µg/L)
Figure 4-12 Hemocyte cell viability test result under PFC exposure. Significant responses (p<0.05) are marked with*.
(c)
*
* *
* *
* *
*
*
*
*
* *
* *
92
Lysosome is a cellular organelle that can engulf foreign substances and break down
wastes and cell debris. They constitute the main sites of toxic metal and compound
sequestration and detoxification (Dailianis et al. 2003, Giannapas et al. 2012). NRRT
assesses lysosome membrane stability by measuring the Neutral Red retention time. In the
current study, significant reduction of NRRT was observed at 100 μg/L for most
compounds and a further decrease at 1000 μg/L (Figure 4-11). The results show that PFC
exposure may lead to instability of lysosome membrane. Lysosomal membrane damage
can be caused by excessive storage of PFCs in the lysosome, or direct interaction with the
membrane. Previous studies showed that some PFCs can cause an increase in membrane
fluidity through direct interference with the membrane (Hu et al. 2003). Also, PFC
exposure can induce lipid peroxidation, which is the likely cause of damage to the
lysosome membrane as well. The interaction with the organelle membrane could be the
major pathway for PFCs to affect lysosome stability. However, only minor adverse
response was observed in mussels under PFOS exposure compared with other PFCAs. As
lysosomal instability is probably caused by the organelle membrane damage, this result
may be explained by a previous finding that only minor inductions of cellular membrane
damage were obtained from PFOS when compared with other PFCAs (Nobels et al. 2010)
Phagocytosis and spontaneous cytotoxicity are the major mechanisms in the immune
system of invertebrates to suppress infection. Phagocytosis is the cellular process of
engulfing solid particles. It is considered as an important mechanism to remove pathogens
and bacteria. Inhibition of phagocytosis induced by pollutants could suppress the immune-
competency of the organism. Previous studies have reported reductions in phagocytosis in
marine bivalves exposed to oil-contaminated seawater and organic pollutants (Auffret et al.
2004, Hannam et al. 2009). The current study showed that most tested PFCs can also
induce inhibition of phagocytosis, as demonstrated by the decreased biomarker response
(Figure 4-11). This inhibition of phagocytosis could result from the reduced hemocyte cell
viability under PFC exposure, as demonstrated by the trypan blue exclusion test. In
addition, phagocytosis of bivalve hemocytes can be modulated by specific membrane
receptors (Wang et al. 2011b), which in this case could be bonded to and deactivated by
PFCs. Spontaneous cytotoxicity assay measures the ability of mussel hemocytes to
recognize and kill foreign cells. Similar response patterns were observed for spontaneous
cytotoxicity and phagocytosis (Figure 4-11). The reason for this could be that both immune
93
activities are closely related with cellular membrane viability, where functioning of these
immune mechanisms rely on viable cell-to-cell contact between hemocytes and foreign
cells (Hannam et al. 2009).
The PFC induced inhibition of these immunological biomarkers suggests a weakened
internal defense system in the presence of the contaminants. As observed in the current
study, statistically significant decreases in normal immune functionality were associated
with elevated exposure concentration of PFCs, especially at 1000 μg/L level, where the
immune activities could be suppressed by up to 50% of their normal performance. These
results indicate that PFCs have an immunotoxicity potential and will impose health risks to
organisms at high exposure concentrations of the compounds, for example during an
accident spill. Immune modulation has been reported in mussels from polluted sea water
(Hannam et al. 2009), and also under the exposure of toxic metals and organic pollutants
such as PAHs (Giannapas et al. 2012, Thiagarajan et al. 2006). PFCs have also been
reported to modulate immune function in rodent and fish (Son et al. 2009, Yang 2010). In
cultured human cells, PFCs were found to be able to directly affect immune cell activation
and reduce cytokine production (Corsini et al. 2012). As the immune system protects
organisms from foreign substances and pathogens, a weakened immune system implies
that the organism becomes vulnerable to their living environment. Although some studies
have shown that PFCs will not induce lethal toxic effects, the current results suggest that
sublethal effects induced by PFCs could be equally potent: the health of an organism will
be greatly compromised by a susceptible immune system, especially in the presence of
other toxic pollutants or occurrence of disease. It is also worth noting that, in some cases,
contaminants exposure could induce elevated immune responses to sequester potentially
toxic contaminants, especially at low contamination levels (Hannam et al. 2009, Luengen
et al. 2004). However, similar induction was not observed in the current study.
There are several hypotheses of the causes of the observed immunotoxicity under
PFC exposure: 1) Gene regulation. As mentioned, the defence mechanism of phagocytosis
and spontaneous cytotoxicity relies on effective cell attachment. Previous studies have
demonstrated that PFCs can cause suppression of genes that are related to cell adhesion
(Cui et al. 2009, Wei et al. 2009). 2) Binding with functional protein. The susceptibility in
immune functions could also be due to alterations in cytoskeletal proteins which would
then affect cell viability and functionality (Thiagarajan et al. 2006). The alterations could
be caused by direct interaction with PFCs by binding with the cytoskeletal proteins, due to
94
their “proteinophilic” nature (Kelly et al. 2009). For example, the peroxisome proliferator-
activated receptor (PPAR) proteins, which are one of the cytoskeletal proteins, were found
to play an important role in PFCs immunotoxicity (Dewitt et al. 2012). The receptor
proteins regulate important physiological process that impact homeostasis, inflammation,
adipogenesis, wound healing and carcinogenesis (Corsini et al. 2011). PFCs may bind to
and activate PPARs and lead to various effects and responses. 3) Oxidative stress. PFC
induced oxidative stress has been reported in previous study. It has been suggested that
immune susceptibility in hemocytes of bivalves exposed to organic toxicants is probably
related to the depletion of non-enzymatic antioxidant molecules, such as GSH (Giannapas
et al. 2012). Depletion of antioxidant components may cause depletion of antioxidant
capacity and lead to oxidative stress. Studies on the antioxidant responses have
demonstrated the reduction of GSH content under PFC exposure. Excess ROS and the
associated oxidative stress could also be one of the causes of immunotoxicity.
4.5.2.2 Reversible responses and model
Exposure duration was another significant factor influencing the immune fitness of
green mussels. At the same exposure level, adverse responses increased with exposure time
(Figure 4-13). The magnitude of adverse response was found to be associated with the
PFCs burden inside the organism. During the depuration phase, toxic responses started
decreasing when exposure to PFCs stopped (Figure 4-13). The immune fitness shows the
tendency to restore to its original healthy state during the depuration period. The recovery
of immunotoxicity has been reported in studies of different environmental stresses (Wang
et al. 2011b). Reversible effects of PFCs accompanied with depuration of organism burden
of the compounds have also been reported in literature (Du et al. 2009, Hu et al. 2002,
Stevenson et al. 2006). This could be a result of a reversible binding to integral membrane
proteins and tissue proteins.
95
(a) Integrated immunotoxic response (EIBR) vs. time
Exposure Depuration
96
(b) Organism concentration vs. time
Figure 4-13 Relationships between integrated immunotoxicity, organism concentration and time
(Cw=100μg/L).
Immunotoxicity results suggest that the toxic effects are closely related to the
concentration of PFCs in the internal environment of the organism. For organisms exposed
to different levels of PFCs or with different exposure durations, approximately the same
toxic response was obtained when the organism concentration of PFCs reached the same
level. Correlation analysis was performed and the results further confirmed the correlations
between organism PFC concentration and integrated toxic response (Figure 4-14). Models
using organism PFC concentration and BAF as the independent variables were established
accordingly to describe/quantify the integrated immunotoxicity as follows:
log log logoEIBR a C b BAF c= + + (4.6)
n = 4, r2 = 0.877, s = 0.142, F = 596, Q2= 0.872
where EIBR is the integrated immunotoxicity biomarker response value (Equation 4.3); Co
is the organism PFC concentration in ng/kg and BAF is the bioaccumulation factor in L/kg
measured in previous bioaccumulation study. Parameters a, b and c are constant for all the
tested compounds. Based on the current biomarker results, the values of these constant
were found to be 0.983, -0.712 and -2.070 for a, b and c, respectively. Equation 4.6
provides a unified model to evaluated toxicity of different PFCs at various Co by using a
single set of a, b and c values. The model shows that for the same compound,
immunotoxicity increases with the organism concentration of the compound. The toxic
effects also varies among compounds as a factor of the bioaccumulation potential, where
the larger the BAF, the more severe the exhibited immunotoxicity.
The dose-response relationship demonstrates that there is an effective exposure
concentration, approximately 10-100 µg/L, from which significant response can be
observed. Therefore results from exposure levels of 0.1 and 1 µg/L were omitted for the
model development.
97
Figure 4-14 Correlation analysis of immunotoxicity EIBR with organism concentration Co. Dashed line represent 99% confidence interval.
The toxicity model provides a tool to evaluate and predict adverse effects induced in
organism under PFC exposure when the organism concentration is known. However in
reality, it is more conventional and easier to monitor the contaminants concentration in the
water phase. In this case, a toxic response model using exposure concentration would be
more convenient. In PFC bioaccumulation studies, a number of bioaccumulation models
were established which can be used to transform the organism concentration Co to
exposure concentration Cw. For example in Chapter 3, it has been demonstrated that
organism concentration of PFCs can be modeled through the following equation:
( )[ ]{ }u wo w u w e
u w e
nk CC (C t) 1 exp k C k t
k C,
kf= = − − +
+ (4.7)
1500 2000 2500 3000 3500 4000 4500 50000.1
0.15
0.2
0.25
0.3
0.35
0.4
0.45
0.5
Co (ng/kg)
EIB
R fo
r im
mun
otox
icity
bio
mar
ker
110 120 130 140 150 160 170 180 190 2000.1
0.15
0.2
0.25
0.3
0.35
Co (ng/kg)
EIB
R fo
r im
mun
otox
icity
bio
mar
ker
1000 1200 1400 1600 1800 2000 2200 24000.1
0.15
0.2
0.25
0.3
0.35
0.4
0.45
Co (ng/kg)
EIB
R fo
r im
mun
otox
icity
bio
mar
ker
3000 4000 5000 6000 7000 8000 90000.2
0.3
0.4
0.5
0.6
0.7
0.8
0.9
Co (ng/kg)
EIB
R fo
r im
mun
otox
icity
bio
mar
ker
PFOS PFOA
PFNA PFDA
98
By substituting Co in Equation 4.6, the immunotoxicity model could be further modified as
a function of Cw, the exposure concentration:
( )[ ]{ }u wu w e
u w e
10nk C
1 exp k C k tk C k
a
c bBAFEIBR = − − ++
⋅
(4.8)
With this equation, toxicity of PFCs can also be estimated when the exposure level and
exposure period are known. However it should be noted that the Cw based model may not
accurately reflect the pollution status. This is because in the real environment, the
contamination level could be fluctuating during the exposure period.
In summary, the immunotoxicity potential of selected PFCs was demonstrated and PFC
induced inhibition on the organism immune mechanism was observed, which suggest a
weakened internal defence system in the presence of these contaminants. The observed
immunotoxicity was also found to be reversible and correlated with the inner concentration
of the compounds. Based on this correlation, immunotoxicity models were established by
which integrated immunotoxicity biomarker response can be evaluated when the inner
concentration and BAF of compounds are known. For the tested compounds, their
environmental levels are generally below the valid range of the immunotoxicity model,
except for PFOA (50-240 ng/kg in Singapore coastal water), where the model indicates that
current pollution level of PFOA may already affect the health, especially immunity health
of marine organisms. Although not specified by the results of the current study, it should be
noted that besides the low threshold, there might also be a high threshold where the
immune system is totally destroyed by the compounds and is not able to recover. In either
case, the proposed model may not be appropriate.
4.6 Effects on general well-being
In the previous part, PFCs was shown to be able to induce a number of adverse
effects in green mussels in both bio-molecules and cell organelles. Besides molecular and
cellular effects, contaminants can also affect the living function and general well-being of
an organism. The effects are evaluated using bio-endpoints measuring an organism's
physiological activities. Physiological biomarkers have been applied for biomonitoring
purposes in many studies (Hagenaars et al. 2008, Okay & Karacik 2008), and provided
useful information of the general health state of a target organism. Although lower level
99
biomarkers are usually more sensitive, physiological level biomarkers provide more
ecologically relevant evaluation of an individual health. Effects on the general well-being
of an organism and the effective concentration are thus more meaningful for environmental
risk assessment. In order to investigate the effects on the general health of green mussels
under PFC exposure, two physiological biomarkers were examined, namely filtration rate
(FR) and relative condition factor (RCF). These two are common biomarkers in aquatic
wildlife that assess the general well-being of the organisms.
4.6.1 Materials and Methods
The chemicals, mussel maintenance, exposure experiment, sample preparation and
statistical analysis were described in Section 4.2.1. The exposure concentrations of
individual PFC were 0.1, 1, 10, 100 and 1000 µg/L, and the exposure period was 7 days.
Biomarker analysis
Filtration rate The filtration rate was determined as described elsewhere (Okay and
Karacik 2008) with modifications. The filtration rate was based on the filtration of
microalgae by individual mussels in static systems. At the end of the exposure period,
mussels were placed separately in 3L plastic tanks with magnetic stirrers. The tanks were
filled with 2L of artificial seawater and 200 μl dense algae were added to each tank. The
concentration of algae in each tank was determined by a spectrophotometer (750 nm) at 10
min intervals for a total time period of 120 min. The filtration rate of mussels was
evaluated as:
dCV Q Cdt
⋅ = ⋅ (4.9)
1 2
1 2
(ln ln )C C VQ
t t
− ⋅=
− (4.10)
where V = volume of the tank and Q = filtration rate in L/hour
Relative condition factor (RCF) The weight and shell length of mussels were
measured at day 0 and 7 of the exposure experiment. The relative condition factor (RCF)
was calculated as an indicator of the general well-being of the mussel:
100
bWRCFaL
= (4.11)
where W is total body weight (in g) and L is shell length (in cm). The parameters a and b
were determined from the length-weight relationship (W = aLb) of mussels at day 0 and
were assumed constant for all individual mussels. The RCF is calculated as the ratio of
measured body weight and calculated body weight. This procedure allows a comparison of
the condition of each concentration group as well as the control group before and after the
exposure.
4.6.2 Results and Discussion
The length-weight relationship (W = aLb) assumes an important prerequisite in
fishery biological investigations. Together with RCF, they have been applied in the
monitoring of bivalves as indicators of general health state and suitability to the
environment (Bradbury 2005). In the current study, an evident decrease in RCF value in
green mussels was observed after exposure to most tested PFCs (Figure 4-15). This result
is consistent with previous findings of the decrease in the body weight of mice and
freshwater fish under PFC exposure (Hagenaars et al. 2008, Liu et al. 2009). Declines in
both RCF and body weight could be directly equivalent to a decrease in the energy store of
organisms. Microarray studies showed that PFC exposure could down-regulate energy
metabolism related genes, leading to a lower energy uptake (Hagenaars et al. 2008, Wei et
al. 2009). Dorts et al. (2011) in their proteomic analysis also demonstrated that PFC can
induce decreases in proteins and enzymes related to energy metabolism, such as ATP
biosynthesis. In fact, disruption of energy metabolism has often been associated with
exposure to xenobiotics, since detoxicification of xenobiotic is an energy consuming
process. The increased energy expenditure will compromise processes such as growth and
reproduction.
101
Exposure concentration (µg/L)
Exposure concentration (µg/L)
Figure 4-15 Responses of filtration rate (FR) and relative condition factor (RCF) in green mussels under
PFC exposure. Significant responses (p<0.05) are marked with *.
Filtration rate has been used in many studies as a component of “scope for growth”
in bivalve mollusks as a sensitive indicator of pollutant exposure (Canty et al. 2009). It
provides a measure of the fundamental living activity of the organism. In the current study,
a decrease in the filtration rate was observed only at elevated exposure concentration
102
(Figure 4-15). Bivalves open their valves to facilitate the free circulation of water through
gills, allowing them to respire and feed. It has been suggested that organic contaminants
could alter the behavior of bivalves by changing the valve movement and reducing
filtration rate (Faria et al. 2009). Filtration directly relates to food intake and thus energy
intake. Decreasing filtration rate would most likely result in deficiency in energy store,
which then affects the growth rate of the organism. It is also possible that valve movement
was suppressed to a basic maintenance level due to the reduced energy store under PFC
exposure. There is a lack of significant response to PFOA in both filtration rate and RCF.
This could be due to the low accumulation of this compound in the organism, especially
when these higher level biomarkers are generally less sensitive.
The observed responses in both RCF and filtration rate could both be attributed to the
reduced energy store. There might also be a causal relationship between the two where the
reduced filtration rate results in a reduced energy intake which then leads to a lowered RCF.
It has been suggested that a decrease in the energy store could be attributed to DNA
damage. As discussed earlier, DNA damage can cause modulation of genes, including
those genes that are related to energy metabolism. Genotoxicity has been shown to be
closely tied to the survival and development of organisms in other studies as well (Al-
Subiai et al. 2011).
RCF and filtration rate are physiological level biomarkers. They provide an
assessment of living function and general well-being of an organism. Contaminants could
affect a biological system at many levels. Starting with bio-molecules, the effect can
cascade through molecular, cellular, physiological and individual levels. Higher level
effects are more closely related with individual health and are thus of more concerns.
Results in the present study demonstrate that PFCs are able to induce adverse effects in
green mussels at the physiological level, which implies a great health risk from these
compounds.
4.7 Conclusion
The results of the environmental toxicity examination demonstrate that PFCs, at certain
concentrations, could induce toxic responses across different biological levels (bio-
molecular, cellular and physiological levels) of organism and through different toxic modes
of actions. The PFC induced adverse effects indicate that these compounds have the
103
potential to cause oxidative stress and oxidative toxicity, DNA damage and genotoxicity,
inhibition of xenobiotic metabolism, immunotoxicity and also deleterious consequences on
the general well-being of the target organism. Significant toxic response was normally
observed at exposure concentrations of 100-1000 μg/L, where the effective concentration
is generally higher as the biological level of the measured bio-endpoint goes up. Compared
with other environmental pollutants, the effective concentration of PFC is generally higher.
In aquatic invertebrates, the effective concentrations of pharmaceuticals were found to be
approximately 0.1-10 μg/L, and were around 10-100 μg/L for some heavy metals, which
are very close to the environmental occurrence of these pollutants. Although significant
toxic responses were normally observed at concentrations 3-4 orders of magnitude higher
than the environmental levels of PFCs, it should be noted that low external dose does not
necessarily mean low risks. Long term exposure to low contamination level may also lead
to an internal dose which induces toxic responses. It should also be noted that in the
current study, only water exposure is considered. However, in reality there may also be
exposure through dietary, which will enhance the bioaccumulation from the environment
and intensify the toxic effects at same exposure level.
104
5 Chapter Five Integrated assessment of ecotoxicity of PFCs
5.1 Introduction
The environmental toxicity of PFCs has been investigated through biomarker based
toxicity testing in previous study. Due to the complexity of contaminants in the
environment and the variety of responses that they may induce in organisms, it is essential
that multiple biomarkers are employed (Brooks et al. 2009). Therefore, a series of
biomarkers that correspond to different biological levels were employed. The results have
demonstrated that various toxic effects can be induced by PFCs in the target organism.
However, a great challenge is to combine these single toxicity test results for an integrated
assessment, which includes correlations of different toxic effects and overall toxicity
potentials.
In this chapter, biomarker results of various toxic modes of action were analyzed
jointly. The correlations of these biomarkers were investigated to elucidate relationships
between toxic responses at different biological levels, and more importantly, to examine
the possible toxic pathways of the targeted compounds. The complex biomarker responses
were also integrated by the Enhanced Integrated Biomarker Response (EIBR) system and
transformed into a single value that was ecologically relevant and meaningful for
environmental risk assessment. The EIBR enables comparison of PFCs in terms of
integrative toxicity potential and toxic modes of action. Last but not least, the structure-
activity relationships of these compounds were also examined based on the integrated
biomarker results.
Six biomarkers were selected from the biomarker pool, which covered bio-endpoints
of each measured toxic mode of action at the three biological levels (molecular, cellular
and physiological levels). The selected biomarkers are the most representative ones that
test the specific toxic effect. They are also the most commonly applied assays in
environmental toxicity testing.
105
5.2 Examination of toxic pathways
A series of biomarkers corresponding to three different bio-organization levels,
namely, molecular, cellular and physiological level, were tested previously. In order to
elucidate relationships among toxic responses at various biological levels, correlation
analysis was applied to selected biomarkers which included CAT, Comet Assay, EROD,
NRRT, Filtration rate and RCF. The aim was to provide a comprehensive understanding of
how PFCs could affect the target organism from biomolecules to general well-being. The
biomarkers employed and their corresponding biological level and toxic mode of action are
elaborated in the following table. In the correlation analysis, biomarker results of two
compounds, PFOA and PFOS, were included to examine possible variations in the toxic
pathways of the two groups of PFCs, where PFOA and PFOS represent perfluorinated
carboxylate and perfluorinated sulfonate, respectively. Although the production of PFOS
and PFOA has been phased out in the past decade, these two compounds are still the
predominant species of PFCs detected in the environment and biota (Nobels et al. 2010).
An indirect mode of toxic action was also observed, which is a distinctive feature from
many well-studied POPs.
Table 5-1 Selected biomarkers and their corresponding biological levels.
+ |� ���|, at exposure concentration 1000μg/L. Data are provided with standard error (±SE). The presented biomarker scores of all four compounds are statistically different from each other (p < 0.05, t test).CAT=catalase activity, EROD=7-ethoxy resorufin O-deethylase activity, Comet=Comet tail moment, NRRT=neutral red retention time, FR=filtration rate, RCF=relative condition factor.
5.4.2.2 Functional group
Besides the fluorinated chain length effect on toxicity, it is also noticed that in some
cases the two groups of PFCs, i.e. PFCAs and PFSAs, can have distinct modes of action.
As mentioned earlier, for the Comet assay, PFOS produces a much stronger adverse
response compared with the other compounds. The magnitude of toxic response follows
the order: PFOA (C7) < PFNA (C8) < PFDA (C9) < PFOS (C8) (Table 5-4). This suggests
that PFOS can induce a higher level of DNA damage and thus has a higher genotoxicity
potential than the PFCAs. The DNA damage of PFOS has also been documented in various
species (Hoff et al. 2003, Shi et al. 2008). It is possible that compared with the carboxylate
group, the sulfonate group has stronger chemical interactions with DNA molecules or
selected genes that lead to DNA damage. Therefore, in the case of DNA damage, the
functional group is probably the most decisive factor rather than chain length. It is also
noted that current results in green mussels are in contradiction to previous findings in
bacterial profiling assays, where in terms of induction of changes in gene expression, the
effect of chain length is stronger than the effect of functional group (Nobels et al. 2010).
This contradiction may imply that the structure-activity relationship of PFCs can be species
sensitive.
121
In addition to the Comet assay, the sulfonate and the carboxylates also performed
differently in the NRRT. Reduction in the NRRT indicates damage in lysosomal membrane
and a stressed condition of the environment. It is interesting to note that in NRRT, PFOS
exposure did not induce a significant response when compared with other PFCAs (Table 5-
4). This result, however, supports a previous finding in bacteria where high levels of
membrane damage were restricted to only PFCAs, while only minor inductions were
obtained from PFOS (Nobels et al. 2010). Membrane damage can be induced by direct
interaction with the compounds, for example, binding with membrane proteins or
interruption of the lipids (Hu et al. 2003). The current results imply that interactions with
the carboxylate group rather than the sulfonate group are more likely to cause membrane
instability. It is also noteworthy that in the case of NRRT, the adverse responses follow the
order: PFDA<PFNA<PFOA among the PFCAs, which decrease with fluorinated chain
length. It is possible that besides the functional group effects, the molecular weight or the
size of the compounds also play an important role in the membrane interaction, where the
smaller the size, the easier for compounds to be incorporated into and disrupt the biological
membranes.
5.4.2.3 Comparison between C8 compounds
As mentioned earlier, it was previously concluded that for PFCs with the same
fluorinated chain length, the toxicity induced by sulfonate is higher than the corresponding
carboxylate. However, the present study results show some contradictions to this statement.
Between the two compounds with 8 fluorinated carbon, PFOS did not always display
higher toxicity potential than PFNA.
For CAT activity and RCF, PFOS indeed induced slightly higher toxic responses than
PFNA (Table 5-4). Previously, we demonstrated that in green mussels PFOS has a greater
bioaccumulation potential than PFNA (Conder et al. 2008, Liu et al. 2011). A higher
accumulation in organisms could be the reason for PFOS to display higher toxicity
potential in these bio-endpoints that are susceptible to the internal concentration of
contaminants. As discussed earlier, CAT activity reflects the oxidative stress caused by
reactive oxygen species (ROS), where ROS production was proved to be concentration
dependent under PFC exposure (Freire et al. 2008). On the other hand, RCF is linked to the
energy store of organisms, and energy expenditure for detoxicification of xenobiotics also
largely depends on the quantity of the contaminants. Therefore, a larger amount of
122
contaminants accumulated inside organisms could lead to stronger responses in CAT
activity and RCF.
In contrast, for the EROD and FR bioassays, the toxic responses to PFNA were
higher than those to PFOS (Table 5-4). A previous study suggests that toxicity of PFCs can
be hydrophobicity dependent, and is positively related to Kow which describes the
hydrophobicity of the compounds (Wang et al. 2011a). Studies showed that the values of
modeled Kow follow the order of PFOA<PFOS<PFNA<PFDA, where PFNA was more
hydrophobic than PFOS (Kelly et al. 2009). It is possible that for EROD activity and FR,
hydrophobic interactions govern the modes of action of these compounds. Hence PFNA
induced stronger toxic responses than PFOS. Although the direct link between
hydrophobicity and toxicity displayed in these bio-endpoints is lacking, it is conceivable
that hydrophobicity could affect the binding and interaction with proteins and enzymes that
are involved in the above mentioned biomarkers.
While multiple structural effects on the toxicity of PFCs were observed from the
biomarker results, any adverse effect on the organism is likely to be the result of a
combination of various factors. For different bio-reactions and interactions, a predominant
factor that governs the structure-activity relationship and mode of action of the compound
usually emerges.
5.5 EC50 based on integrative toxicity
The EIBR based dose-response relationships can be established from the integrated
biomarker results (Figure 5-4 in Section 5.3.2). The integrated toxicity of PFCs, as
evaluated by the EIBR values, showed similar dose-response relationships for individual
compounds. The EC50 values and confidence interval (CI) based on the integrative toxicity
were calculated using probit analysis. For PFOS, PFOA, PFNA and PFDA, the EC50 values
are 99 (93-105), 635 (620-647), 129 (118-136) and 42 (38-45) μg/L, respectively. The EC50
values were found to be negatively correlated with both fluorinated chain length and the
bioaccumulation factor of the compounds (Figure 5-7), which indicates the importance of
the chain length and organism burden of PFCs in the overall toxicity potential of the
compounds. EC50 are often used as an indicator of the toxicity of a compound to the
environment. The EC50 value based on the integrated toxic response provides an evaluation
of the potency of these contaminants, and thus, criterion for environmental regulation and
123
guidelines. The results could also be used to predict the integrative toxicity of other PFCs
when bioaccumulation factor or chemical structure is known. Besides EC50, the no
observed effect concentration (NOEC) can also be derived from the low end of dose-
response curve, which can provide reference for environmental safe level of the
compounds.
Figure 5-7 Relationship between EIBR based EC50 and bioaccumulation.
5.6 Conclusion
The integrated biomarker assessment and structure-activity analysis revealed the
diverse toxicity patterns of PFCs. Besides the commonly recognized chain length and
functional group effects, several structural factors are also involved in the toxic action of
PFCs. EIBR analysis demonstrate that it is the fluorinated chain length that governs the
integrative toxicity of the compounds. To our knowledge, this is the first environmental
toxicity study of PFCs where biomarkers from multiple biological levels are concurrently
assessed and integrated using a new and improved integrated biomarker index approach.
The resulting evaluation of integrative toxicity and toxic pattern provides a new
perspective of environmental consequences of these pollutants. The observed structure-
activity relationships also help to elucidate the gaps in understanding the mechanisms
y = -0.635x + 3.553R² = 0.972
1
1.5
2
2.5
3
3.5
0.5 1 1.5 2 2.5 3 3.5
logE
C 50
log BAF
PFOA (C7)
PFNA (C8) PFOS (C8)
PFDA (C9)
124
behind PFCs toxicity. PFCs are a group of compounds with similar structures. The findings
of the present study can be applied to predict the toxic behavior of different compounds in
this group. The application of integration of biomarkers from multiple biological levels by
EIBR enables an ecological relevant evaluation of environmental toxicity, and therefore, is
a promising tool for risk assessment.
The estimated EC50 values based on the current study results were higher than the
environmental concentrations so far detected in the Singapore marine waters. The results
imply that current contamination levels may still be safe for marine organisms. However,
the results of the current study proved the toxicity potential of PFCs and their capability to
cause various adverse effects. It is also worth noting that the toxicity evaluation was based
on acute toxicity tests. It is possible that with prolonged exposure and the bioaccumulation
effect, these contaminants could induce severe long-term toxic effects even at low
exposure levels.
125
6 Chapter Six Conclusions and recommendation
6.1 Conclusions
The bioaccumulation and ecotoxicity of four common PFCs were investigated in
indigenous green mussels, Perna viridis. The major findings and conclusions are
summarized as follows:
1. Bioaccumulation of the tested PFCs was shown to be concentration dependent. The
bioaccumulation factors (BAF) were found to range from 15 to 839 L/kg and from
12 to 464 L/kg at exposure concentrations of 1 and 10 μg/L, respectively. The
bioaccumulation potential was found to increase with fluorinated chain length. For
all compounds, the BAF was larger at the lower dosage. The sensitivity of BAF to
exposure concentration was found to be positively related to both fluorinated chain
length and the binding affinity of the compounds. A kinetic model based on an
adsorption mechanism was proposed, which provides a more accurate description
of the bioaccumulation process of PFCs. The investigation of bioaccumulation
enhances the understanding of the partitioning process from environment to
organism and the concentration profile of the contaminants inside the organism.
2. Several toxic modes of action have been investigated and the results demonstrate
that PFCs were able to induce a series of adverse effects and toxicity at different
biological levels. Examination of antioxidant enzyme activity demonstrates that
PFCs can impose severe oxidative stress to the organism and cause significant
induction/inhibition of antioxidant enzyme activities. As metabolic inert
compounds, PFCs minimally go through any biotransformation. However, they
were found to inhibit xenobiotic metabolizing enzymes that play an important role
in detoxification of organic pollutants. Besides enzymes and proteins, the integrity
of other bio-molecules, such as lipid and DNA, were also found to be affected by
these contaminants. Lipid peroxidation, DNA fragmentation and apoptosis were
observed after exposure to PFCs. At cellular level, PFC exposure was shown to
126
result in adverse effects on cell viability, cellular functions and integrity of cell
organelles, and directly suppressed the immune activity thus placing the health of
the organism in jeopardy. At physiological level, PFC exposure exhibited
influences on energy producing activities such as filtration. Some of the tested
compounds also caused significant weight loss and affected the general well-being
of the organism.
3. Correlation analysis revealed the links between toxic responses at different
biological levels. PFC induced excessive production of ROS was shown to be one
of the major pathways for the compounds to cause adverse effects in the tested
organisms. ROS can directly interact with cell organelles and genetic materials and
cause alterations and even damage. DNA damage and alterations in gene expression,
in turn, provide important links between effects at the molecular level to higher
level adverse responses. Cellular damage might also directly lead to effects at
physiological level.
4. Toxic mechanisms of PFCs were examined. The toxicity of PFCs demonstrates
both exposure concentration and exposure time dependency. Adverse effects
measured by biomarkers normally increased with exposure concentration and time.
Exposure concentration was found to be one of the most important factors that
affected the magnitude of toxic effects of PFCs. A similar pattern and trend were
observed in dose-response and time-response relationships where the organism
concentration of PFCs provides an important link. For some toxic modes of action,
the amount of bioaccumulation was found to be the decisive factor of the
magnitude of toxicity (which is related to the higher internal dose and activity of
the more bioaccumulative compounds.), for example, the oxidative toxicity. Both
toxic response models and structure activity models were established to better
describe the underlying mechanisms.
5. The structure-activity relationship of PFCs was examined and the results shows that
a number of structural factors could affect the toxic activity of the compounds. The
fluorinated chain length was found to be the one of the governing factors. The
functional group, due to its effect on polarity and hydrophobicity, was also shown
to play an important role in many cases including bioaccumulation, oxidative
toxicity and especially genotoxicity, where the sulfonate was found to be more
potent than the corresponding carboxylate. Any adverse effect is likely to be the
127
result of a combination of various factors, where there is usually a predominant
factor that governs the structure-activity relationship and mode of action of the
compound.
6. An enhanced Integrated Biomarker Response (EIBR) system was proposed to
assess the integrative toxicity potential of PFCs. The tested compounds exhibited
different toxicity potential in individual toxic modes of action. It is the EIBR that
provides an overall evaluation of the potency of the compounds. The results shows
that among the tested compounds, toxicity potential followed the order of PFDA >
PFOS > PFNA > PFOA. With the same fluorinated chain, the overall toxicity of
PFOS and PFNA were found to be close to each other.
The present study provides important ecotoxicological data and information that
have been missing in previous investigations. These include 1) Ecotoxicity assessment of
commonly detected PFCs besides PFOS and PFOA, 2) PFC induced ecological impacts on
marine invertebrates, 3) A systematic examinations of different toxic modes of action at
different biological levels, 4) Both qualitative and quantitative structure-activity analysis of
PFC induced toxicity, which facilitates the understanding of the toxic mechanism and
prediction of behavior of other compounds in the group, and 5) Mathematical models for
both bioaccumulation and ecotoxicity evaluations. The results of this study have brought a
better understanding of the environmental and ecological consequences of these newly
emerging pollutants. The bioaccumulation and ecotoxicity data and model will facilitate
the risk assessment and environmental management of these contaminants.
6.2 Recommendation
The following work is recommended for future study:
1. Chronic toxicity examination. In the present study, the applied biomarkers
measured only acute and sublethal toxic effects. Chronic effects under prolonged
exposure should be examined in future studies to gain a better understanding of the
long-term impacts of the compounds.
Extended examination of more PFCs. In the current study, four commonly detected PFCs
were investigated. Toxicity data of other compounds may provide additional information
regarding structure-activity relationship of the group and help to optimize the mathematical
128
models of bioaccumulation and toxicity. In the current laboratory study, only toxic effects
from individual compounds were examined. In real environment, PFCs exist in a mixture
form. As the results of bioaccumulation study suggested, distribution of PFCs highly
depends on the number of binding sites, and thus competitions and interactions between
PFCs are expected. This is also true for their toxic activities. Therefore, investigation of
mixture bioaccumulation behavior and mixture toxicity will provide useful information.
2. Isomer specific effects. Environmentally detected PFCs do not all exist in linear
form. For example, prior to its recent phase-out, PFOS was produced by
electrochemical fluorination processes, which yielded mixtures composed of linear
and branched isomers. Recent studies have shown that the isomer proportions in
PFC sources, environment and biota are different, which suggest a possible isomer-
specific behavior of PFCs. The current study only investigated the linear PFCs, and
hence in future work, isomer-specific bioaccumulation and toxicity should also be
examined.
129
7 Reference
Al-Subiai SN, Moody AJ, Mustafa SA, Jha AN (2011) A multiple biomarker approach to investigate the effects of copper on the marine bivalve mollusc, Mytilus edulis. Ecotoxicol. Environ. Saf. 74: 1913-1920
Andersen ME, Butenhoff JL, Chang SC, Farrar DG, Kennedy GL, Lau C, Olsen GW, Seed J, Wallacekj KB (2008) Perfluoroalkyl acids and related chemistries - Toxicokinetics and modes of action. Toxicol. Sci. 102: 3-14
Ankley GT, Kuehl DW, Kahl MD, Jensen KM, Linnum A, Leino RL, Villeneuve DA (2005) Reproductive and developmental toxicity and bioconcentration of perfluorooctanesulfonate in a partial life-cycle test with the fathead minnow (Pimephales promelas). Environmental Toxicology and Chemistry 24: 2316-2324
Armitage JM, MacLeod M, Cousins IT (2009) Comparative Assessment of the Global Fate and Transport Pathways of Long-Chain Perfluorocarboxylic Acids (PFCAs) and Perfluorocarboxylates (PFCs) Emitted from Direct Sources. Environ. Sci. Technol. 43: 5830-5836
Arukwe A, Mortensen AS (2011) Lipid peroxidation and oxidative stress responses of salmon fed a diet containing perfluorooctane sulfonic- or perfluorooctane carboxylic acids. Comparative Biochemistry and Physiology C-Toxicology & Pharmacology 154: 288-295
Auffret M, Duchemin M, Rousseau S, Boutet I, Tanguy A, Moraga D, Marhic A (2004) Monitoring of immunotoxic responses in oysters reared in areas contaminated by the "Erika" oil spill. Aquatic Living Resources 17: 297-302
Austin ME, Kasturi BS, Barber M, Kannan K, MohanKumar PS, MohanKumar SMJ (2003) Neuroendocrine effects of perflurooactane sulfonate in rats. Environ. Health Perspect. 111: 1485-1489
Becker AM, Gerstmann S, Frank H (2008) Perfluorooctanoic acid and perfluorooctane sulfonate in the sediment of the Roter Main river, Bayreuth, Germany. Environ. Pollut. 156: 818-820
Beliaeff B, Burgeot T (2002) Integrated biomarker response: A useful tool for ecological risk assessment. Environmental Toxicology and Chemistry 21: 1316-1322
Berger U, Glynn A, Holmstrom KE, Berglund M, Ankarberg EH, Tornkvist A (2009) Fish consumption as a source of human exposure to perfluorinated alkyl substances in Sweden - Analysis of edible fish from Lake Vattern and the Baltic Sea. Chemosphere 76: 799-804
Berthiaume J, Wallace KB (2002) Perfluorooctanoate, perflourooctanesulfonate, and N-ethyl perfluorooctanesulfonamido ethanol; peroxisome proliferation and mitochondrial biogenesis. Toxicology Letters 129: 23-32
Binelli A, Ricciardi F, Riva C, Provini A (2006) New evidences for old biomarkers: Effects of several xenoblotics on EROD and AChE activities in Zebra mussel (Dreissena polymorpha). Chemosphere 62: 510-519
Binelli A, Cogni D, Parolini M, Riva C, Provini A (2009a) In vivo experiments for the evaluation of genotoxic and cytotoxic effects of Triclosan in Zebra mussel hemocytes. Aquat. Toxicol. 91: 238-244
Binelli A, Parolini M, Cogni D, Pedriali A, Provini A (2009b) A multi-biomarker assessment of the impact of the antibacterial trimethoprim on the non-target organism Zebra mussel (Dreissena polymorpha). Comparative Biochemistry and Physiology C-Toxicology & Pharmacology 150: 329-336
Bjork JA, Wallace KB (2009) Structure-Activity Relationships and Human Relevance for Perfluoroalkyl Acid-Induced Transcriptional Activation of Peroxisome Proliferation in Liver Cell Cultures. Toxicol. Sci. 111: 89-99
Board UESA (2006) Review of EPA's Draft Risk Assessment of Potential Human Health Effects Associated with PFOA and Its Salts. Perfluorooctanoic Acid Human Health Risk Assessment Review Panel. US EPA
Boudreau TM, Sibley PK, Mabury SA, Muir DGC, Solomon KR (2003) Laboratory evaluation of the toxicity of perfluorooctane sulfonate (PFOS) on Selenastrum capricornutum, Chlorella vulgaris, Lemna gibba, Daphnia magna, and Daphnia pulicaria. Archives of Environmental Contamination and Toxicology 44: 307-313
Bradbury A (2005) Length-weight models for intertidal clams in Puget Sound: (Bivalve Regions 1, 5, 6, 7, and 8). Washington, Dept. of Fish and Wildlife, Fish Program, Fish Management Division
Braune BM, Mallory ML, Butt CM, Mabury SA, Muir DCG (2010) Persistent halogenated organic contaminants and mercury in northern fulmars (Fulmarus glacialis) from the Canadian Arctic. Environmental Pollution 158: 3513-3519
Brooks S, Lyons B, Goodsir F, Bignell J, Thain J (2009) Biomarker Responses in Mussels, an Integrated Approach to Biological Effects Measurements. Journal of Toxicology and Environmental Health-Part a-Current Issues 72: 196-208
Butenhoff JL, Kennedy Jr GL, Frame SR, O'Connor JC, York RG (2004) The reproductive toxicology of ammonium perfluorooctanoate (APFO) in the rat. Toxicology 196: 95-116
Butt CM, Berger U, Bossi R, Tomy GT (2010) Levels and trends of poly- and perfluorinated compounds in the arctic environment. Science of the Total Environment 408: 2936-2965
Cai M, Zhao Z, Yin Z, Ahrens L, Huang P, Yang H, He J, Sturm R, Ebinghaus R, Xie Z (2012) Occurrence of perfluoroalkyl compounds in surface waters from the North Pacific to the Arctic Ocean. Environmental Science and Technology 46: 661-668
Canty MN, Hutchinson TH, Brown RJ, Jones MB, Jha AN (2009) Linking genotoxic responses with cytotoxic and behavioural or physiological consequences: Differential sensitivity of echinoderms (Asterias rubens) and marine molluscs (Mytilus edulis). Aquat. Toxicol. 94: 68-76
Chang SC, Thibodeaux JR, Eastvold ML, Ehresman DJ, Bjork JA, Froehlich JW, Lau C, Singh RJ, Wallace KB, Butenhoff JL (2008) Thyroid hormone status and pituitary function in adult rats given oral doses of perfluorooctanesulfonate (PFOS). Toxicology 243: 330-339
Conder JM, Hoke RA, De Wolf W, Russell MH, Buck RC (2008) Are PFCAs bioaccumulative? A critical review and comparison with regulatory lipophilic compounds. Environ. Sci. Technol. 42: 995-1003
Corsini E, Avogadro A, Galbiati V, dell'Agli M, Marinovich M, Galli CL, Germolec DR (2011) In vitro evaluation of the immunotoxic potential of perfluorinated compounds (PFCs). Toxicol. Appl. Pharmacol. 250: 108-116
Corsini E, Sangiovanni E, Avogadro A, Galbiati V, Viviani B, Marinovich M, Galli CL, Dell'Agli M, Germolec DR (2012) In vitro characterization of the immunotoxic potential of several perfluorinated compounds (PFCs). Toxicol. Appl. Pharmacol. 258: 248-255
Cronin MTD, Schultz TW (2003) Pitfalls in QSAR. Journal of Molecular Structure: THEOCHEM 622: 39-51
Cui L, Zhou QF, Liao CY, Fu JJ, Jiang GB (2009) Studies on the Toxicological Effects of PFOA and PFOS on Rats Using Histological Observation and Chemical Analysis. Archives of Environmental Contamination and Toxicology 56: 338-349
Cui L, Liao CY, Zhou QF, Xia TM, Yun ZJ, Jiang GB (2010) Excretion of PFOA and PFOS in male rats during a subchronic exposure. Arch. Environ. Contam. Toxicol. 58: 205-213
Dailianis S, Domouhtsidou GP, Raftopoulou E, Kaloyianni M, Dimitriadis VK (2003) Evaluation of neutral red retention assay, micronucleus test, acetylcholinesterase activity and a signal transduction molecule (cAMP) in tissues of Mytilus galloprovincialis (L.), in pollution monitoring. Marine Environmental Research 56: 443-470
Damiens G, Gnassia-Barelli M, Loques F, Romeo M, Salbert V (2007) Integrated biomarker response index as a useful tool for environmental assessment evaluated using transplanted mussels. Chemosphere 66: 574-583
131
de Vos MG, Huijbregts MAJ, van den Heuvel-Greve MJ, Vethaak AD, de Vijver KIV, Leonards PEG, van Leeuwen SPJ, de Voogt P, Hendriks AJ (2008) Accumulation of perfluorooctane sulfonate (PFOS) in the food chain of the Western Scheldt estuary: Comparing field measurements with kinetic modeling. Chemosphere 70: 1766-1773
Dewitt JC, Peden-Adams MM, Keller JM, Germolec DR (2012) Immunotoxicity of perfluorinated compounds: Recent developments. Toxicologic Pathology 40: 300-311
Ding F, Guo J, Song W, Hub W, Li Z (2011) Comparative quantitative structure-activity relationship (QSAR) study on acute toxicity of triazole fungicides to zebrafish. Chemistry and Ecology 27: 359-368
Ding GH, Wouterse M, Baerselman R, Peijnenburg W (2012) Toxicity of Polyfluorinated and Perfluorinated Compounds to Lettuce (Lactuca sativa) and Green Algae (Pseudokirchneriella subcapitata). Archives of Environmental Contamination and Toxicology 62: 49-55
Dorts J, Kestemont P, Marchand PA, D'Hollander W, Thezenas ML, Raes M, Silvestre F (2011) Ecotoxicoproteomics in gills of the sentinel fish species, Cottus gobio, exposed to perfluorooctane sulfonate (PFOS). Aquat. Toxicol. 103: 1-8
Du YB, Shi XJ, Liu CS, Yu K, Zhou BS (2009) Chronic effects of water-borne PFOS exposure on growth, survival and hepatotoxicity in zebrafish: A partial life-cycle test. Chemosphere 74: 723-729
Fan YO, Jin YH, Ma YX, Zhang YH (2005) Effects of perfluorooctane sulfonate on spermiogenesis function of male rats. Wei sheng yan jiu = Journal of hygiene research 34: 37-39
Faria M, Carrasco L, Diez S, Riva MC, Bayona JM, Barata C (2009) Multi-biomarker responses in the freshwater mussel Dreissena polymorpha exposed to polychlorobiphenyls and metals. Comparative Biochemistry and Physiology C-Toxicology & Pharmacology 149: 281-288
Fernandez-Sanjuan M, Meyer J, Damasio J, Faria M, Barata C, Lacorte S (2010) Screening of perfluorinated chemicals (PFCs) in various aquatic organisms. Analytical and Bioanalytical Chemistry 398: 1447-1456
Fisher AB, Dodia C (2001) Lysosomal-type PLA2 and turnover of alveolar DPPC. American Journal of Physiology - Lung Cellular and Molecular Physiology 280: L748-L754
Freire PF, Martin JMP, Herrero O, Peropadre A, de la Pena E, Hazen MJ (2008) In vitro assessment of the cytotoxic and mutagenic potential of perfluorooctanoic acid. Toxicol. In Vitro 22: 1228-1233
Fromme H, Mosch C, Morovitz M, Alba-Alejandre I, Boehmer S, Kiranoglu M, Faber F, Hannibal I, Genzel-Boroviczeny O, Koletzko B, Volkel W (2010) Pre- and Postnatal Exposure to Perfluorinated Compounds (PFCs). Environ. Sci. Technol. 44: 7123-7129
Gao C, Zhang A, Lin Y, Yin D, Wang L (2009) Quantitative structure-activity relationships of selected phenols with non-monotonic dose-response curves. Chinese Science Bulletin 54: 1786-1796
Giannapas M, Karnis L, Dailianis S (2012) Generation of free radicals in haemocytes of mussels after exposure to low molecular weight PAH components: Immune activation, oxidative and genotoxic effects. Comparative Biochemistry and Physiology C-Toxicology & Pharmacology 155: 182-189
Giesy JP, Naile JE, Khim JS, Jones PD, Newsted JL (2010) Aquatic Toxicology of Perfluorinated Chemicals, Reviews of Environmental Contamination and Toxicology, Vol 202. Reviews of Environmental Contamination and Toxicology, pp. 1-52
Grasty RC, Grey BE, Lau CS, Rogers JM (2003) Prenatal Window of Susceptibility to Perfluorooctane Sulfonate-Induced Neonatal Mortality in the Sprague-Dawley Rat. Birth Defects Research Part B - Developmental and Reproductive Toxicology 68: 465-471
Grasty RC, Bjork JA, Wallace KB, Lau CS, Rogers JM (2005) Effects of prenatal perfluorooctane sulfonate (PFOS) exposure on lung maturation in the perinatal rat. Birth Defects Research Part B - Developmental and Reproductive Toxicology 74: 405-416
Guruge KS, Hikono H, Shimada N, Murakami K, Hasegawa J, Yeung LWY, Yamanaka N, Yamashita N (2009) Effect of perfluorooctane sulfonate (PFOS) on influenza A virus-induced mortality in female B6C3F1 mice. J. Toxicol. Sci. 34: 687-691
Hagenaars A, Knapen D, Meyer IJ, van der Ven K, Hoff P, De Coen W (2008) Toxicity evaluation of perfluorooctane sulfonate (PFOS) in the liver of common carp (Cyprinus carpio). Aquat. Toxicol. 88: 155-163
132
Hagenaars A, Vergauwen L, De Coen W, Knapen D (2011) Structure-activity relationship assessment of four perfluorinated chemicals using a prolonged zebrafish early life stage test. Chemosphere 82: 764-772
Hagger JA, Jones MB, Lowe D, Leonard DRP, Owen R, Galloway TS (2008) Application of biomarkers for improving risk assessments of chemicals under the Water Framework Directive: A case study. Marine Pollution Bulletin 56: 1111-1118
Hannam ML, Bamber SD, Sundt RC, Galloway TS (2009) Immune modulation in the blue mussel Mytilus edulis exposed to North Sea produced water. Environmental Pollution 157: 1939-1944
Hekster FM, Laane R, de Voogt P (2003) Environmental and toxicity effects of perfluoroalkylated substances, Reviews of Environmental Contamination and Toxicology, Vol 179. Reviews of Environmental Contamination and Toxicology, pp. 99-121
Higgins CP, Field JA, Criddle CS, Luthy RG (2005) Quantitative Determination of Perfluorochemicals in Sediments and Domestic Sludge. Environmental Science & Technology 39: 3946-3956
Higgins CP, McLeod PB, Macmanus-Spencer LA, Luthy RG (2007) Bioaccumulation of perfluorochemicals in sediments by the aquatic oligochaete Lumbriculds variegatus. Environ. Sci. Technol. 41: 4600-4606
Hoff PT, Van Dongen W, Esmans EL, Blust R, De Coen WM (2003) Evaluation of the toxicological effects of perfluorooctane sulfonic acid in the common carp (Cyprinus carpio). Aquat. Toxicol. 62: 349-359
Houde M, Martin JW, Letcher RJ, Solomon KR, Muir DCG (2006) Biological monitoring of polyfluoroalkyl substances: A review. Environ. Sci. Technol. 40: 3463-3473
Houde M, Czub G, Small JM, Backus S, Wang XW, Alaee M, Muir DCG (2008) Fractionation and Bioaccumulation of Perfluorooctane Sulfonate (PFOS) Isomers in a Lake Ontario Food Web. Environ. Sci. Technol. 42: 9397-9403
Houde M, De Silva AO, Muir DCG, Letcher RJ (2011) Monitoring of Perfluorinated Compounds in Aquatic Biota: An Updated Review PFCs in Aquatic Biota. Environ. Sci.Technol. 45: 7962-7973
Hu J, Yu J, Tanaka S, Fujii S (2011) Perfluorooctane Sulfonate (PFOS) and Perfluorooctanoic Acid (PFOA) in Water Environment of Singapore. Water, Air, & Soil Pollution 216: 179-191
Hu WY, Jones PD, Upham BL, Trosko JE, Lau C, Giesy JP (2002) Inhibition of gap junctional intercellular communication by perfluorinated compounds in rat liver and dolphin kidney epithelial cell lines in vitro and Sprague-Dawley rats in vivo. Toxicological Sciences 68: 429-436
Hu WY, Jones PD, DeCoen W, King L, Fraker P, Newsted J, Giesy JP (2003) Alterations in cell membrane properties caused by perfluorinated compounds. Comparative Biochemistry and Physiology - C Toxicology and Pharmacology 135: 77-88
Hu WY, Jones PD, Celius T, Giesy JP (2005) Identification of genes responsive to PFOS using gene expression profiling. Environ. Toxicol. Pharmacol. 19: 57-70
Hu XZ, Hu DC (2009) Effects of perfluorooctanoate and perfluorooctane sulfonate exposure on hepatoma Hep G2 cells. Archives of Toxicology 83: 851-861
Ishibashi H, Iwata H, Kim EY, Tao L, Kannan K, Amano M, Miyazaki N, Tanabe S, Batoev VB, Petrov EA (2008) Contamination and effects of perfluorochemicals in baikal seal (Pusa sibirica). 1. Residue level, tissue distribution, and temporal trend. Environmental Science and Technology 42: 2295-2301
Izquierdo JI, Machado G, Ayllon F, d'Amico VL, Bala LO, Vallarino E, Elias R, Garcia-Vazquez E (2003) Assessing pollution in coastal ecosystems: a preliminary survey using the micronucleus test in the mussel Mytilus edulis. Ecotoxicol. Environ. Saf. 55: 24-29
Jeon J, Kannan K, Lim HK, Moon HB, Ra JS, Kim SD (2010) Bioaccumulation of Perfluorochemicals in Pacific Oyster under Different Salinity Gradients. Environ. Sci. Technol. 44: 2695-2701
Jiang Y, Rao K, Yang G, Chen X, Wang Q, Liu A, Zheng H, Yuan J (2012) Benzo(a)pyrene induces p73 mRNA expression and necrosis in human lung adenocarcinoma H1299 cells. Environmental Toxicology 27: 202-210
Jönsson EM, Brandt I, Brunström B (2002) Gill filament-based EROD assay for monitoring waterborne dioxin-like pollutants in fish. Environmental Science and Technology 36: 3340-3344
Kammann U, Lang T, Vobach M, Wosniok W (2005) Ethoxyresorufin-O-deethylase (EROD) activity in dab
133
(Limanda limanda) as biomarker for marine monitoring. Environmental Science and Pollution Research 12: 140-145
Kannan K, Koistinen J, Beckmen K, Evans T, Gorzelany JF, Hansen KJ, Jones PD, Helle E, Nyman M, Giesy JP (2001) Accumulation of perfluorooctane sulfonate in marine mammals. Environ. Sci. Technol. 35: 1593-1598
Kawashima Y, Suzuki S, Kozuka H, Sato M, Suzuki Y (1994) Effects of prolonged administration of perfluorooctanoic acid on hepatic activities of enzymes which detoxify perfoxide and xenobiotic in the rat.Toxicology 93: 85-97
Kelly BC, Ikonomou MG, Blair JD, Surridge B, Hoover D, Grace R, Gobas F (2009) Perfluoroalkyl Contaminants in an Arctic Marine Food Web: Trophic Magnification and Wildlife Exposure. Environ. Sci.Technol. 43: 4037-4043
Kim WK, Lee SK, Jung J (2010) Integrated assessment of biomarker responses in common carp (Cyprinus carpio) exposed to perfluorinated organic compounds. J. Hazard. Mater. 180: 395-400
Kleszczynski K, Gardzielewski P, Mulkiewicz E, Stepnowski P, Skladanowski AC (2007) Analysis of structure-cytotoxicity in vitro relationship (SAR) for perfluorinated carboxylic acids. Toxicol. In Vitro 21: 1206-1211
Kleszczynski K, Skladanowski AC (2009) Mechanism of cytotoxic action of perfluorinated acids. I. Alteration in plasma membrane potential and intracellular pH level. Toxicol. Appl. Pharmacol. 234: 300-305
Kleszczynski K, Skladanowski AC (2011) Mechanism of cytotoxic action of perfluorinated acids. III. Disturbance in Ca(2+) homeostasis. Toxicol. Appl. Pharmacol. 251: 163-168
Kraugerud M, Zimmer KE, Ropstad E, Verhaegen S (2011) Perfluorinated compounds differentially affect steroidogenesis and viability in the human adrenocortical carcinoma (H295R) in vitro cell assay. Toxicology Letters 205: 62-68
Kudo N, Bandai N, Suzuki E, Katakura M, Kawashima Y (2000) Induction by perfluorinated fatty acids with different carbon chain length of peroxisomal beta-oxidation in the liver of rats. Chem.-Biol. Interact. 124: 119-132
Kudo N, Kawashima Y (2003) Toxicity and toxicokinetics of perfluorooctanoic acid in humans and animals. Journal of Toxicological Sciences 28: 49-57
Kwadijk C, Korytar P, Koelmans AA (2010) Distribution of Perfluorinated Compounds in Aquatic Systems in The Netherlands. Environ. Sci. Technol. 44: 3746-3751
Latala A, Nedzi M, Stepnowski P (2009) Acute toxicity assessment of perfluorinated carboxylic acids towards the Baltic microalgae. Environ. Toxicol. Pharmacol. 28: 167-171
Lau C, Thibodeaux JR, Hanson RG, Rogers JM, Grey BE, Stanton ME, Buttenhoff JL, Stevenson LA (2003) Exposure to perfluorooctane sulfonate during pregnancy in rat and mouse. II: Postnatal evaluation. Toxicol. Sci. 74: 382-392
Lau C, Butenhoff JL, Rogers JM (2004) The developmental toxicity of perfluoroalkyl acids and their derivatives. Toxicol. Appl. Pharmacol. 198: 231-241
Lau C, Anitole K, Hodes C, Lai D, Pfahles-Hutchens A, Seed J (2007) Perfluoroalkyl acids: A review of monitoring and toxicological findings. Toxicol. Sci. 99: 366-394
Lee PY, Chen CY (2009) Toxicity and quantitative structure-activity relationships of benzoic acids to Pseudokirchneriella subcapitata. J. Hazard. Mater. 165: 156-161
Li MH (2009) Toxicity of Perfluorooctane Sulfonate and Perfluorooctanoic Acid to Plants and Aquatic Invertebrates. Environmental Toxicology 24: 95-101
Li X, Wang Z, Liu H, Yu H (2012) Quantitative structure-activity relationship for prediction of the toxicity of phenols on Photobacterium phosphoreum. Bulletin of Environmental Contamination and Toxicology 89: 27-31
Lindstrom AB, Strynar MJ, Libelo EL (2011) Polyfluorinated Compounds: Past, Present, and Future. Environ.
134
Sci.Technol. 45: 7954-7961
Liu C, Du Y, Zhou B (2007a) Evaluation of estrogenic activities and mechanism of action of perfluorinated chemicals determined by vitellogenin induction in primary cultured tilapia hepatocytes. Aquat. Toxicol. 85: 267-277
Liu C, Yu K, Shi X, Wang J, Lam PKS, Wu RSS, Zhou B (2007b) Induction of oxidative stress and apoptosis by PFOS and PFOA in primary cultured hepatocytes of freshwater tilapia (Oreochromis niloticus). Aquatic Toxicology 82: 135-143
Liu CH, Gin KYH, Chang VWC, Goh BPL, Reinhard M (2011) Novel Perspectives on the Bioaccumulation of PFCs - the Concentration Dependency. Environ. Sci.Technol. 45: 9758-9764
Liu CH, Chang VWC, Gin KYH (2013) Environmental toxicity of PFCs: An enhanced integrated biomarker (EIBR) assessment and structure-activity analysis. Environmental Toxicology and Chemistry. In press. doi: 10.1002/etc.2306
Liu CS, Yu K, Shi XJ, Wang JX, Lam PKS, Wu RSS, Zhou BS (2007c) Induction of oxidative stress and apoptosis by PFOS and PFOA in primary cultured hepatocytes of freshwater tilapia (Oreochromis niloticus). Aquat. Toxicol. 82: 135-143
Liu L, Liu W, Song JL, Yu HY, Jin YH, Oami K, Sato I, Saito N, Tsuda S (2009) A comparative study on oxidative damage and distributions of perfluorooctane sulfonate (PFOS) in mice at different postnatal developmental stages. J. Toxicol. Sci. 34: 245-254
Liu W, Chen S, Quan X, Jin YH (2008) Toxic effect of serial perfluorosulfonic and perfluorocarboxylic acids on the membrane system of a freshwater alga measured by flow cytometry. Environmental Toxicology and Chemistry 27: 1597-1604
Luengen AC, Friedman CS, Raimondi PT, Flegal AR (2004) Evaluation of mussel immune responses as indicators of contamination in San Francisco Bay. Marine Environmental Research 57: 197-212
MacKay D (2001) Multimedia environmental models : the fugacity approach Lewis Publishers, New York
Maras M, Vanparys C, Muylle F, Robbens J, Berger U, Barber JL, Blust R, De Coen W (2006) Estrogen-like properties of fluorotelomer alcohols as revealed by MCF-7 breast cancer cell proliferation. Environmental Health Perspectives 114: 100-105
Martin JW, Mabury SA, Solomon KR, Muir DCG (2003a) Dietary accumulation of perfluorinated acids in juvenile rainbow trout (Oncorhynchus mykiss). Environ. Toxicol. Chem. 22: 189-195
Martin JW, Mabury SA, Solomon KR, Muir DCG (2003b) Bioconcentration and tissue distribution of perfluorinated acids in rainbow trout (Oncorhynchus mykiss). Environ. Toxicol. Chem. 22: 196-204
Martin JW, Whittle DM, Muir DCG, Mabury SA (2004) Perfluoroalkyl contaminants in a food web from lake Ontario. Environ. Sci. Technol. 38: 5379-5385
Martin MT, Brennan RJ, Hu W, Ayanoglu E, Lau C, Ren H, Wood CR, Corton JC, Kavlock RJ, Dix DJ (2007) Toxicogenomic study of triazole fungicides and perfluoroalkyl acids in rat livers predicts toxicity and categorizes chemicals based on mechanisms of toxicity. Toxicol. Sci. 97: 595-613
Moon HB, Kannan K, Yun S, An YR, Choi SG, Park JY, Kim ZG, Moon DY, Choi HG (2010) Perfluorinated compounds in minke whales (Balaenoptera acutorostrata) and long-beaked common dolphins (Delphinus capensis) from Korean coastal waters. Marine Pollution Bulletin 60: 1130-1135
Morikawa A, Kamei N, Harada K, Inoue K, Yoshinaga T, Saito N, Koizumi A (2006) The bioconcentration factor of perfluorooctane sulfonate is significantly larger than that of perfluorooctanoate in wild turtles (Trachemys scripta elegans and Chinemys reevesii): An Ai river ecological study in Japan. Ecotoxicol. Environ. Saf. 65: 14-21
Mortensen AS, Letcher RJ, Cangialosi MV, Chu S, Arukwe A (2011) Tissue bioaccumulation patterns, xenobiotic biotransformation and steroid hormone levels in Atlantic salmon (Salmo salar) fed a diet containing perfluoroactane sulfonic or perfluorooctane carboxylic acids. Chemosphere 83: 1035-1044
Mulkiewicz E, Jastorff B, Skladanowski AC, Kleszczynski K, Stepnowski P (2007) Evaluation of the acute toxicity of perfluorinated carboxylic acids using eukaryotic cell lines, bacteria and enzymatic assays. Environ. Toxicol. Pharmacol. 23: 279-285
135
Newman MC (2009) Fundamentals of ecotoxicology. CRC Press
Nguyen VT, Reinhard M, Karina GYH (2011) Occurrence and source characterization of perfluorochemicals in an urban watershed. Chemosphere 82: 1277-1285
Nobels I, Dardenne F, De Coen W, Blust R (2010) Application of a multiple endpoint bacterial reporter assay to evaluate toxicological relevant endpoints of perfluorinated compounds with different functional groups and varying chain length. Toxicol. In Vitro 24: 1768-1774
Oakes KD, Sibley PK, Solomon KR, Mabury SA, Van Der Kraak GJ (2004) Impact of perfluorooctanoic acid on fathead minnow (Pimephales promelas) fatty acyl-CoA oxidase activity, circulating steroids, and reproduction in outdoor microcosms. Environmental Toxicology and Chemistry 23: 1912-1919
Oakes KD, Sibley PK, Martin JW, MacLean DD, Solomon KR, Mabury SA, Van Der Kraak GJ (2005) Short-term exposures of fish to perfluorooctane sulfonate: Acute effects on fatty acyl-CoA oxidase activity, oxidative stress, and circulating sex steroids. Environmental Toxicology and Chemistry 24: 1172-1181
Okay OS, Karacik B (2008) Bioconcentration and phototoxicity of selected PAHs to marine mussel Mytilus galloprovincialis. Journal of Environmental Science and Health - Part A Toxic/Hazardous Substances and Environmental Engineering 43: 1234-1242
Papa E, Luini M, Gramatica P (2009) Quantitative structure-activity relationship modelling of oral acute toxicity and cytotoxic activity of fragrance materials in rodents. SAR and QSAR in Environmental Research 20: 767-779
Parolini M, Binelli A, Cogni D, Provini A (2010) Multi-biomarker approach for the evaluation of the cyto-genotoxicity of paracetamol on the zebra mussel (Dreissena polymorpha). Chemosphere 79: 489-498
Parolini M, Binelli A (2012) Cyto-genotoxic effects induced by three brominated diphenyl ether congeners on the freshwater mussel Dreissena polymorpha. Ecotoxicol. Environ. Saf. 79: 247-255
Paul AG, Jones KC, Sweetman AJ (2009) A First Global Production, Emission, And Environmental Inventory For Perfluorooctane Sulfonate. Environ. Sci. Technol. 43: 386-392
Phillips MM, Dinglasan-Panlilio MJA, Mabury SA, Solomon KR, Sibley PK (2007) Fluorotelomer acids are more toxic than perfluorinated acids. Environmental Science and Technology 41: 7159-7163
Plumlee MH, Larabee J, Reinhard M (2008) Perfluorochemicals in water reuse. Chemosphere 72: 1541-1547
Power DM, Llewellyn L, Faustino M, Nowell MA, Björnsson BT, Einarsdottir IE, Canario AVM, Sweeney GE (2001) Thyroid hormones in growth and development of fish. Comparative Biochemistry and Physiology - C Toxicology and Pharmacology 130: 447-459
Prevedouros K, Cousins IT, Buck RC, Korzeniowski SH (2006) Sources, fate and transport of perfluorocarboxylates. Environ. Sci. Technol. 40: 32-44
Quinete N, Wu Q, Zhang T, Yun SH, Moreira I, Kannan K (2009) Specific profiles of perfluorinated compounds in surface and drinking waters and accumulation in mussels, fish, and dolphins from southeastern Brazil. Chemosphere 77: 863-869
Ramos R, Garcia E (2007) Induction of mixed-function oxygenase system and antioxidant enzymes in the coral Montastraea faveolata on acute exposure to benzo(a)pyrene. Comparative Biochemistry and Physiology C-Toxicology & Pharmacology 144: 348-355
Rayne S, Forest K (2009) Perfluoroalkyl sulfonic and carboxylic acids: A critical review of physicochemical properties, levels and patterns in waters and wastewaters, and treatment methods. Journal of Environmental Science and Health Part a-Toxic/Hazardous Substances & Environmental Engineering 44: 1145-1199
Renner R (2006) Leftovers may explain perfluorinated compound puzzle. Environmental Science and Technology 40: 1376-1377
Rosen MB, Lee JS, Ren H, Vallanat B, Liu J, Waalkes MP, Abbott BD, Lau C, Corton JC (2008) Toxicogenomic dissection of the perfluorooctanoic acid transcript profile in mouse liver: Evidence for the involvement of nuclear receptors PPARα and CAR. Toxicol. Sci. 103: 46-56
Sarkar A, Ray D, Shrivastava AN, Sarker S (2006) Molecular biomarkers: Their significance and application
136
in marine pollution monitoring. Ecotoxicology 15: 333-340
Seacat AM, Thomford PJ, Hansen KJ, Olsen GW, Case MT, Butenhoff JL (2002) Subchronic toxicity studies on perfluorooctanesulfonate potassium salt in cynomolgus monkeys. Toxicol. Sci. 68: 249-264
Shaw S, Berger ML, Brenner D, Tao L, Wu Q, Kannan K (2009) Specific accumulation of perfluorochemicals in harbor seals (Phoca vitulina concolor) from the northwest Atlantic. Chemosphere 74: 1037-1043
Sheir SK, Handy RD (2010) Tissue Injury and Cellular Immune Responses to Cadmium Chloride Exposure in the Common Mussel Mytilus edulis: Modulation by Lipopolysaccharide. Archives of Environmental Contamination and Toxicology 59: 602-613
Shi XJ, Du YB, Lam PKS, Wu RSS, Zhou BS (2008) Developmental toxicity and alteration of gene expression in zebrafish embryos exposed to PFOS. Toxicol. Appl. Pharmacol. 230: 23-32
Shipley JM, Hurst CH, Tanaka SS, DeRoos FL, Butenhoff JL, Seacat AM, Waxman DJ (2004) Trans-activation of PPARα and induction of PPARα target genes by perfluorooctane-based chemicals. Toxicological Sciences 80: 151-160
Shoeib M, Harner T, Vlahos P (2006) Perfluorinated chemicals in the arctic atmosphere. Environmental Science and Technology 40: 7577-7583
Singh N (2005) Apoptosis Assessment by the DNA Diffusion Assay. In: Blumenthal R (Editor), Chemosensitivity: Volume II. Methods in Molecular Medicine™. Springer New York, pp. 55-67
Siu SYM, Lam PKS, Martin M, Caldwell CW, Richardson BJ (2008) The use of selected genotoxicity assays in green-lipped mussels (Perna viridis): A validation study in Hong Kong coastal waters. Marine Pollution Bulletin 57: 479-492
Siu WHL, Cao J, Jack RW, Wu RSS, Richardson BJ, Xu L, Lam PKS (2004) Application of the comet and micronucleus assays to the detection of B[a]P genotoxicity in haemocytes of the green-lipped mussel (Perna viridis). Aquat. Toxicol. 66: 381-392
Skouras A, Lang T, Vobach M, Danischewski D, Wosniok W, Scharsack JP, Steinhagen D (2003) Assessment of some innate immune responses in dab (Limanda limanda L.) from the North Sea as part of an integrated biological effects monitoring. Helgoland Marine Research 57: 181-189
Slotkin TA, MacKillop EA, Meinick RL, Thayer KA, Seidler FJ (2008) Developmental neurotoxicity of perfluorinated chemicals modeled in vitro. Environmental Health Perspectives 116: 716-722
So MK, Taniyasu S, Yamashita N, Giesy JP, Zheng J, Fang Z, Im SH, Lam PKS (2004) Perfluorinated compounds in coastal waters of Hong Kong, South China, and Korea. Environ. Sci. Technol. 38: 4056-4063
So MK, Taniyasu S, Lam PKS, Zheng GJ, Giesy JP, Yamashita N (2006) Alkaline digestion and solid phase extraction method for perfluorinated compounds in mussels and oysters from south China and Japan. Arch. Environ. Contam. Toxicol. 50: 240-248
Son HY, Lee S, Tak EN, Cho HS, Shin HI, Kim SH, Yang JH (2009) Perfluorooctanoic acid alters T lymphocyte phenotypes and cytokine expression in mice. Environmental Toxicology 24: 580-588
Stahl T, Mattern D, Brunn H (2011) Toxicology of perfluorinated compounds. Environmental Sciences Europe 23
Stevenson CN, MacManus-Spencer LA, Luckenbach T, Luthy RG, Epel D (2006) New perspectives on perfluorochemical ecotoxicology: inhibition and induction of an efflux transporter in the marine mussel, Mytilus californianus. Environ. Sci.Technol. 40: 5580-5585
Suja F, Pramanik BK, Zain SM (2009) Contamination, bioaccumulation and toxic effects of perfluorinated chemicals (PFCs) in the water environment: a review paper. Water Sci. Technol. 60: 1533-1544
Sylvin M (2005) Surface chemistry (adsorption) Sarup & Sons
Theobald N, Caliebe C, Gerwinski W, Hühnerfuss H, Lepom P (2011) Occurrence of perfluorinated organic acids in the North and Baltic seas. Part 1: Distribution in sea water. Environmental Science and Pollution Research 18: 1057-1069
137
Thiagarajan R, Gopalakrishnan S, Thilagam H (2006) Immunomodulation the marine green mussel Perna viridis exposed to sub-lethal concentrations of Cu and Hg. Archives of Environmental Contamination and Toxicology 51: 392-399
Thompson KC, Wadhia K, Loibner AP (Editors), 2005 Environmental Toxicity Testing. Blackwell Pulishing, Oxford, UK
Tomy GT, Budakowski W, Halldorson T, Helm PA, Stern GA, Friesen K, Pepper K, Tittlemier SA, Fisk AT (2004) Fluorinated organic compounds in an eastern Arctic marine food web. Environ. Sci. Technol. 38: 6475-6481
Vestergren R, Cousins IT (2009) Tracking the Pathways of Human Exposure to Perfluorocarboxylates. Environ. Sci.Technol. 43: 5565-5575
Villela IV, de Oliveira IM, da Silva J, Henriques JAP (2006) DNA damage and repair in haemolymph cells of golden mussel (Limnoperna fortunei) exposed to environmental contaminants. Mutation Research-Genetic Toxicology and Environmental Mutagenesis 605: 78-86
Vlahogianni T, Dassenakis M, Scoullos MJ, Valavanidis A (2007) Integrated use of biomarkers (superoxide dismutase, catalase and lipid peroxidation) in mussels Mytilus galloprovincialis for assessing heavy metals' pollution in coastal areas from the Saronikos Gulf of Greece. Marine Pollution Bulletin 54: 1361-1371
Vuignier K, Schappler J, Veuthey JL, Carrupt PA, Martel S (2010) Drug-protein binding: a critical review of analytical tools. Analytical and Bioanalytical Chemistry 398: 53-66
Wang L, Sun HW, Yang LR, He C, Wu WL, Sun SJ (2010) Liquid chromatography/mass spectrometry analysis of perfluoroalkyl carboxylic acids and perfluorooctanesulfonate in bivalve shells: Extraction method optimization. J. Chromatogr. A 1217: 436-442
Wang T, Lin ZF, Yin DQ, Tian DY, Zhang YL, Kong DY (2011a) Hydrophobicity-dependent QSARs to predict the toxicity of perfluorinated carboxylic acids and their mixtures. Environ. Toxicol. Pharmacol. 32: 259-265
Wang T, Khim JS, Chen C, Naile JE, Lu Y, Kannan K, Park J, Luo W, Jiao W, Hu W, Giesy JP (2012) Perfluorinated compounds in surface waters from Northern China: Comparison to level of industrialization. Environment International 42: 37-46
Wang YJ, Hu MH, Shin PKS, Cheung SG (2011b) Immune responses to combined effect of hypoxia and high temperature in the green-lipped mussel Perna viridis. Marine Pollution Bulletin 63: 201-208
Watanabe MX, Jones SP, Iwata H, Kim E-Y, Kennedy SW (2009) Effects of co-exposure to 2,3,7,8-tetrachlorodibenzo-p-dioxin and perfluorooctane sulfonate or perfluorooctanoic acid on expression of cytochrome P450 isoforms in chicken (Gallus gallus) embryo hepatocyte cultures. Comp. Biochem. Phys. C 149: 605-612
Wei Y, Dai J, Liu M, Wang J, Xu M, Zha J, Wang Z (2007) Estrogen-like properties of perfluorooctanoic acid as revealed by expressing hepatic estrogen-responsive genes in rare minnows (Gobiocypris rarus). Environmental Toxicology and Chemistry 26: 2440-2447
Wei Y, Liu Y, Wang J, Tao Y, Dai J (2008) Toxicogenomic analysis of the hepatic effects of perfluorooctanoic acid on rare minnows (Gobiocypris rarus). Toxicol. Appl. Pharmacol. 226: 285-297
Wei Y, Shi X, Zhang H, Wang J, Zhou B, Dai J (2009) Combined effects of polyfluorinated and perfluorinated compounds on primary cultured hepatocytes from rare minnow (Gobiocypris rarus) using toxicogenomic analysis. Aquat. Toxicol. 95: 27-36
Wells PG, McCallum GP, Chen CS, Henderson JT, Lee CJJ, Perstin J, Preston TJ, Wiley MJ, Wong AW (2009) Oxidative stress in developmental origins of disease: Teratogenesis, neurodevelopmental deficits, and cancer. Toxicol. Sci. 108: 4-18
Whyte JJ, Jung RE, Schmitt CJ, Tillitt DE (2000) Ethoxyresorufin-O-deethylase (EROD) activity in fish as a biomarker of chemical exposure. Crit. Rev. Toxicol. 30: 347-570
Woodcroft MW, Ellis DA, Rafferty SP, Burns DC, March RE, Stock NL, Trumpour KS, Yee J, Munro K (2010) Experimental characterization of the mechanism of perfluorocarboxylic acids' liver protein
138
bioaccumulation: the key role of the neutral species. Environ. Toxicol. Chem. 29: 1669-1677
Wu Y, Chang VWC (2012) Development of analysis of volatile polyfluorinated alkyl substances in indoor air using thermal desorption-gas chromatography-mass spectrometry. Journal of Chromatography A 1238: 114-120
Yang JH (2010) Perfluorooctanoic acid induces peroxisomal fatty acid oxidation and cytokine expression in the liver of male Japanese medaka (Oryzias latipes). Chemosphere 81: 548-552
Yang Q, Xie Y, Depierre JW (2000) Effects of peroxisome proliferators on the thymus and spleen of mice. Clinical and Experimental Immunology 122: 219-226
Yeung LWY, Guruge KS, Yamanaka N, Miyazaki S, Lam PKS (2007) Differential expression of chicken hepatic genes responsive to PFOA and PFOS. Toxicology 237: 111-125
Yuen BBH, Au DWT (2006) Temporal changes of ethoxyresorufin-O-deethylase (EROD) activities and lysosome accumulation in intestine of fish on chronic exposure to dietary benzo[a]pyrene: Linking erod induction to cytological effects. Environmental Toxicology and Chemistry 25: 2593-2600
Zeljezic D, Garaj-Vrhovac V, Perkovic P (2006) Evaluation of DNA damage induced by atrazine and atrazine-based herbicide in human lymphocytes in vitro using a comet and DNA diffusion assay. Toxicol. In Vitro 20: 923-935
Zhang H, Shi Z, Liu Y, Wei Y, Dai J (2008) Lipid homeostasis and oxidative stress in the liver of male rats exposed to perfluorododecanoic acid. Toxicol. Appl. Pharmacol. 227: 16-25
Zvinavashe E, Du T, Griff T, Berg HHJvd, Soffers AEMF, Vervoort J, Murk AJ, Rietjens IMCM (2009) Quantitative structure-activity relationship modeling of the toxicity of organothiophosphate pesticides to Daphnia magna and Cyprinus carpio. Chemosphere 75: 1531-1538
139
Appendix
Section A
Table A. Nomenclature, formulas, and molecular structures of target PFCs.
Name Chemical structure Formula Molecular weight Fluorinated chain length
Perfluorinated carboxylate
PFOA perfluorooctanoic acid
C8HF15O2
414.07 g/mol C7
PFNA perfluorononanoic acid
C9HF17O2 464.08 g/mol C8
PFDA perfluorodecanoic acid
C10HF19O2
514.09 g/mol C9
Perfluorinated sulfonate
PFOS perfluorooctane sulfonate
C8HF17O3S
500.13 g/mol C8
140
Appendix
Section B
Table B1 Measured exposure concentration corresponding to the nominal concentration.