Page 1
Bioaugmentation with Sidestream Granular Sludge for Nitrification in Activated Sludge
Wastewater Treatment: Pilot-Scale Investigation
John Andrews Carter
A Thesis
submitted in partial fulfillment of the
requirements for the degree of
Master of Science
University of Washington
2020
Committee:
H David Stensel, Chair
Mari-Karoliina H. Winkler
Program Authorized to Offer Degree:
Civil and Environmental Engineering
Page 2
©Copyright 2020
John Andrews Carter
Page 3
University of Washington
Abstract
Bioaugmentation with Sidestream Granular Sludge for Nitrification in Activated Sludge
Wastewater Treatment: Pilot-Scale Investigation
John Andrews Carter
Chair of the Supervisory Committee:
H David Stensel
Department of Civil and Environmental Engineering
Stricter effluent permits and growing metropolitan areas have contributed to a move towards the
intensification of biological treatment processes for water resource recovery facilities (WRRFs).
Process intensification with aerobic granular sludge (AGS) has the potential to increase the
treatment capacity of WRRFs and enable or increase biological nutrient removal without
increasing footprint. Growth of AGS in continuous flow activated sludge (CFAS) facilities has
yet to be fully realized, despite the success of AGS wastewater treatment in sequencing batch
reactors (SBRs). Sidestream growth and bioaugmentation of AGS aim to take advantage of the
selection pressures for growth of granular sludge in SBRs to increase the treatment and nutrient
removal capacity of a CFAS system. A sidestream SBR fed acetate and anaerobic digestion
Page 4
centrate diluted with final effluent was used to grow AGS enriched with ammonia oxidizing
bacteria (AOB) and polyphosphate accumulating organisms (PAOs) to evaluate the effect of
sidestream AGS bioaugmentation on a low solids retention time (SRT) non-nitrifying CFAS
system in a pilot plant study. The CFAS system had a hydraulic separator unit for the purpose of
uncoupling the SRTs of granular and flocculent sludge to enhance the impact of
bioaugmentation.
The sidestream SBR was operated for a 6.5-month period at an NH3-N loading of 0.31 ± 0.04
g/L-d, an SRT of 25-30 days, and a mixed liquor suspended solids (MLSS) concentration
between 8.6 and 14.4 g/L. The sidestream NH3-N loading averaged 21% of the mainstream NH3-
N loading, to represent a typical proportion for full-scale treatment systems with anaerobic
sludge digestion. Specific nitrification rates (SNRs) varied between 1.2 and 1.4 mg NH3-N/g
VSS-hr. A low DO:NH3-N concentration ratio of 0.06 mg/mg or less during the aeration phase
resulted in suppression of nitrite oxidizing bacteria (NOB) growth and thus shortcut nitrogen
removal with over 89% simultaneous nitrification/denitrification. NOB suppression was evident
because of an effluent NO2-:/NO3-N ratio of greater than 1.0 and a qPCR AOB to NOB ratio of
between 3 and 4. A high COD:N removed ratio of 6.0 – 7.0 resulted in PAOs to be in the
granule outer aerobic layers besides the inner core to thus compete with AOBs for space and
dissolved oxygen, which would limit AOB activity causing a lower SNR than expected based on
prior operation with the same reactor.
The mainstream pilot was seeded with return activated sludge from a local WRRF and operated
at two different time periods: Phase 1 and Phase 2. Phase 1 provided initial operating experience
Page 5
for the CFAS system but was shut down for pilot plant repairs and modifications before
bioaugmentation could be started.
Phase 2 lasted 56 days with 3 operating conditions: 1) 16 days for baseline flocculent sludge
operation, 2) a spike of sidestream AGS and operation for 20 days, and 3) 20 days with continual
sidestream bioaugmentation. After bioaugmentation the separator only captured 40-50% of the
granular sludge, which limited the fraction of granules in the MLSS from 17.1 to 40.5%, the
granular to floc SRT ratio to an average of 1.5, and the nitrification efficiency to increase by 20
to 30%.
Page 6
Acknowledgements
I would like to express my sincere gratitude towards:
Professor Stensel and Professor Winkler for their countless guidance, patience, and the fantastic
opportunity to work on this project.
Bob Bucher, Pardi Sukapanpotharam, and Eron Jacobson for their assistance, patience, and hard
work in orchestrating this project.
Maxwell Armenta and Bryce Figdore for their work preceding this study.
Annie Dubner and Renjie Song for their assistance with lab work.
Bao Ngyuen Quoc for his qPCR and FISH work for this study.
The Winkler Lab for their friendliness and support in making learning and working in the lab an
absolute pleasure.
This work was supported by the King County (Seattle, Washington, USA) Department of
Natural Resources Wastewater Technology Evaluation Program Graduate Student Research
Fellowship, the National Science Foundation (GOALI 1603707), and the Water Research
Foundation (Project TIRR3C15).
Page 7
1
Table of Contents
Abstract .......................................................................................................................................... iii
Acknowledgements ........................................................................................................................ vi
List of Figures ................................................................................................................................. 4
List of Tables .................................................................................................................................. 9
List of Acronyms .......................................................................................................................... 12
List of Units and Symbols............................................................................................................. 13
1 Introduction and Objectives ..................................................................................................... 1
2 Background .............................................................................................................................. 7
2.1 PAO-NDN Granules ........................................................................................................ 8
2.2 Granule PAO and GAO Populations ................................................................................ 9
2.3 Granule Nitrifier Populations ......................................................................................... 10
2.4 Denitrifying Polyphosphate and Glycogen Accumulating Organisms .......................... 11
2.5 Simultaneous Nitrification and Denitrification .............................................................. 12
2.6 Exogenous Carbon used for Denitrification ................................................................... 13
2.7 Shortcut Nitrogen Removal ............................................................................................ 14
2.7.1 Repression of NOB in Flocculent Sludge ............................................................... 15
2.7.2 Repression of NOB in Granular Sludge.................................................................. 15
2.8 Mainstream Systems with Granular Activated Sludge .................................................. 17
Page 8
2
2.8.1 Full-Scale Sequencing Batch Reactors with Activated Granular Sludge ............... 17
2.8.2 Continuous Flow Applications of Activated Granular Sludge ............................... 17
3 Methods ................................................................................................................................. 21
3.1 Sidestream Reactor Description ..................................................................................... 21
3.1.1 Sidestream Reactor Feed System ............................................................................ 23
3.1.2 Sidestream Reactor Aeration, Anaerobic Mixing, and DO Control ....................... 25
3.2 Mainstream Reactor Description .................................................................................... 26
3.2.1 Preanoxic/Anaerobic/Anaerobic Reactor Description ............................................ 27
3.2.2 Aerobic Reactor Description................................................................................... 30
3.2.3 Granular Separator Description .............................................................................. 33
3.2.4 Secondary Clarifier Description ............................................................................. 36
3.3 Sampling Program .......................................................................................................... 38
3.3.1 Sample Handling ..................................................................................................... 38
3.3.2 Sidestream Reactor Sampling Methods .................................................................. 39
3.3.3 Mainstream Sampling Methods .............................................................................. 40
3.4 Analytical Methods ........................................................................................................ 41
3.4.1 Sieve Analysis and Size Distribution ...................................................................... 44
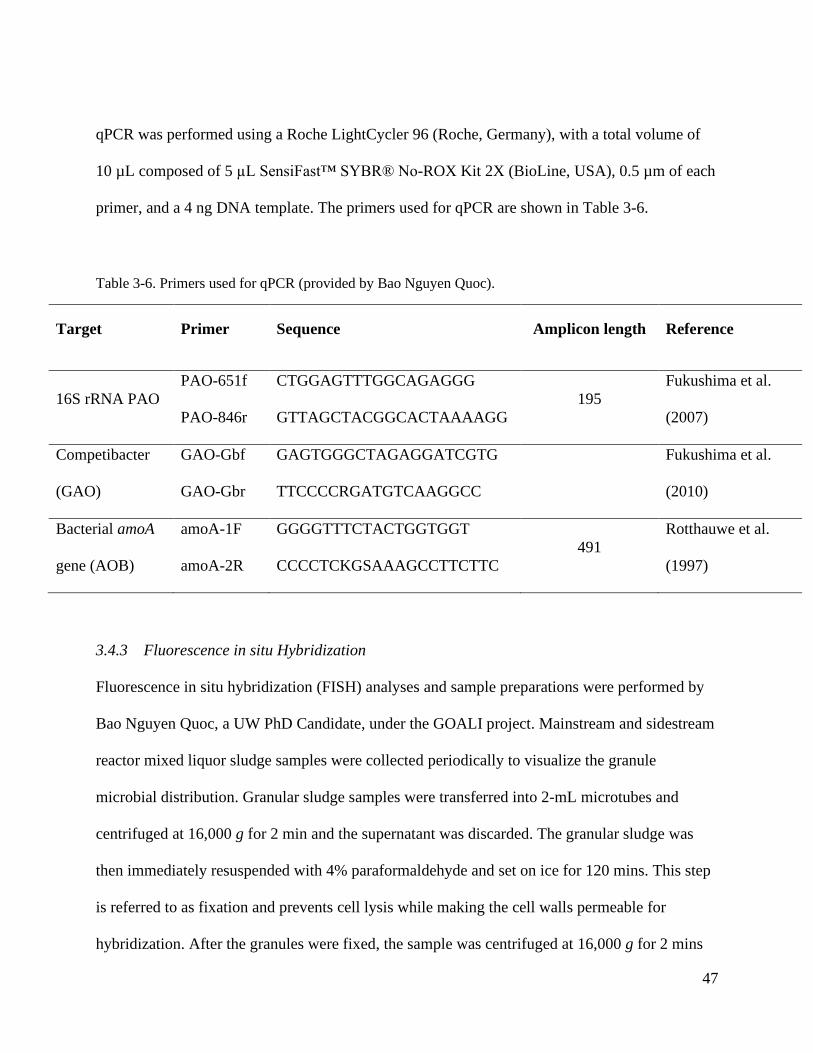
3.4.2 Quantitative Polymerase Chain Reaction ............................................................... 46
3.4.3 Fluorescence in situ Hybridization ......................................................................... 47
3.5 Biological Kinetics Tests ............................................................................................... 50
Page 9
3
3.5.1 Mainstream Specific Nitrification Rates ................................................................. 50
3.5.2 Sidestream Anaerobic Acetate Utilization Kinetics ............................................... 52
3.6 Biological Kinetics Computations ................................................................................. 52
3.6.1 Sidestream Specific Nitrification Rate.................................................................... 53
3.6.2 Mainstream Aeration Tank Nitrification Rate and Specific Nitrification Rate ...... 55
3.6.3 Sidestream Anaerobic Acetate Utilization Kinetics ............................................... 58
4 Results and Discussion .......................................................................................................... 61
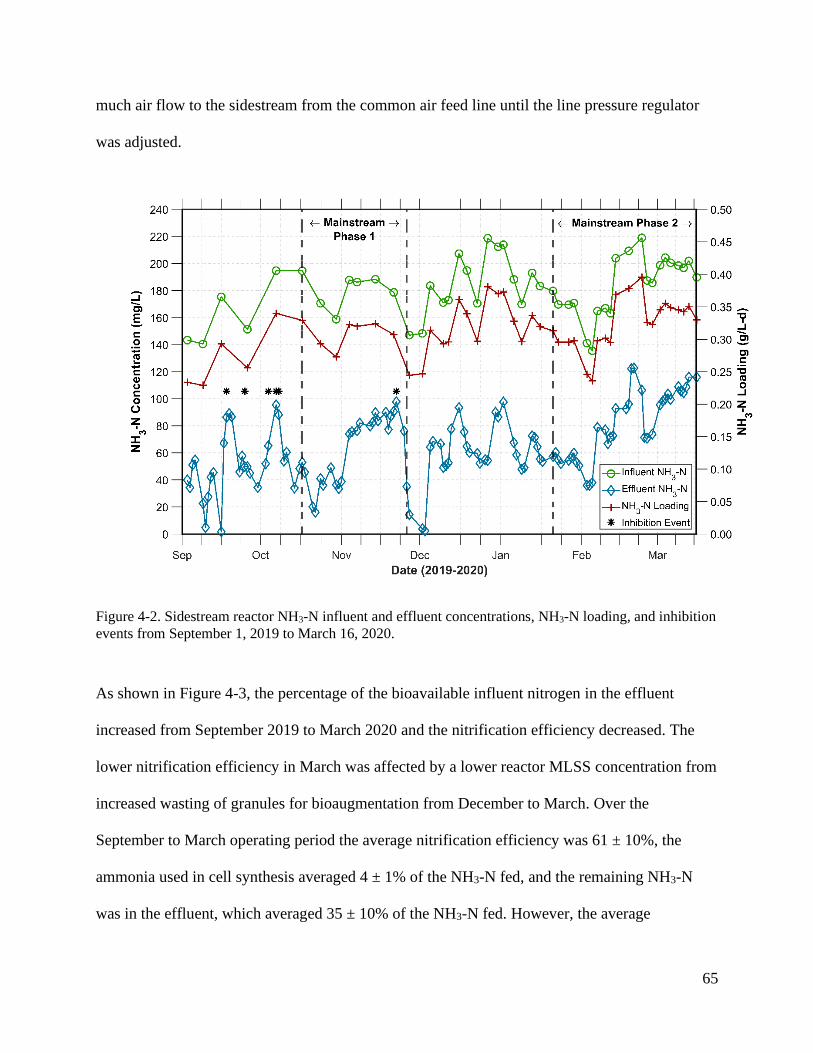
4.1 Sidestream Operation and Treatment Performance ....................................................... 61
4.1.1 Sidestream Operating Conditions ........................................................................... 61
4.1.2 Sidestream Treatment Performance ........................................................................ 64
4.1.3 Sidestream Granular Sludge Characteristics ........................................................... 72
4.1.4 Sidestream Shortcut N Removal ............................................................................. 74
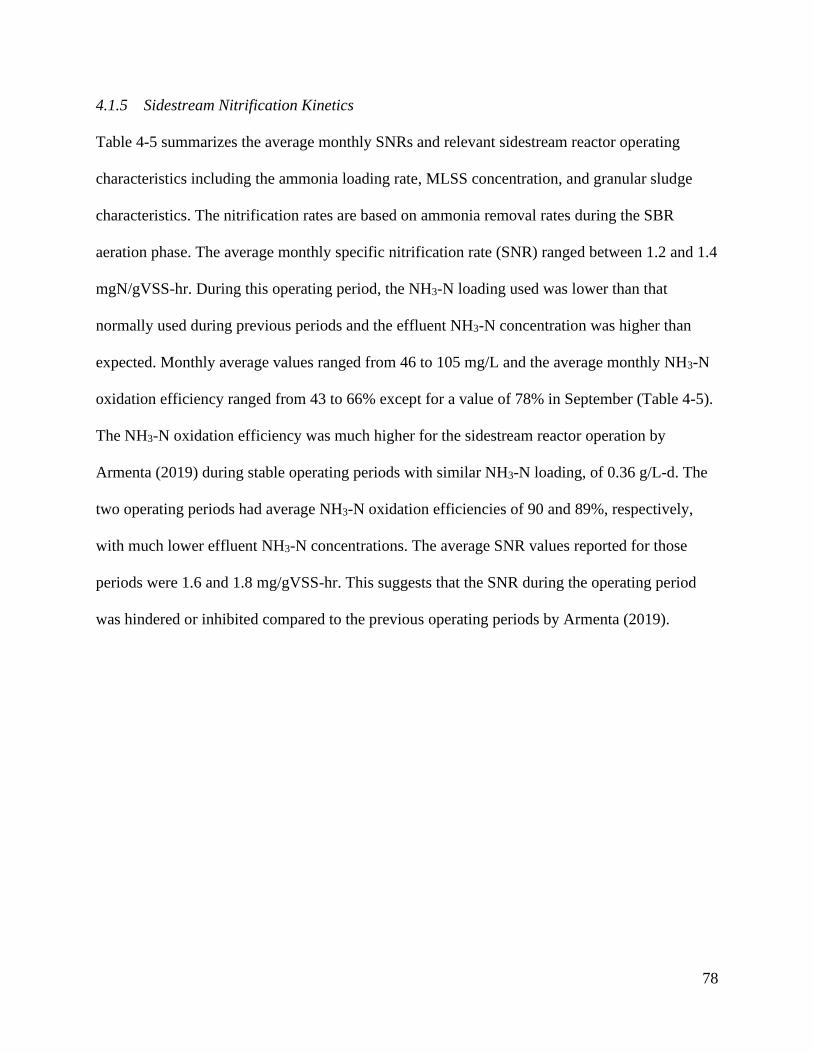
4.1.5 Sidestream Nitrification Kinetics ............................................................................ 78
4.1.6 Sidestream Acetate Utilization Kinetics ................................................................. 88
4.2 Mainstream Phase 1 Operation and Treatment Performance ......................................... 90
4.2.1 Mainstream Phase 1 Operating Conditions............................................................. 90
4.2.2 Mainstream Phase 1 Treatment Performance ......................................................... 92
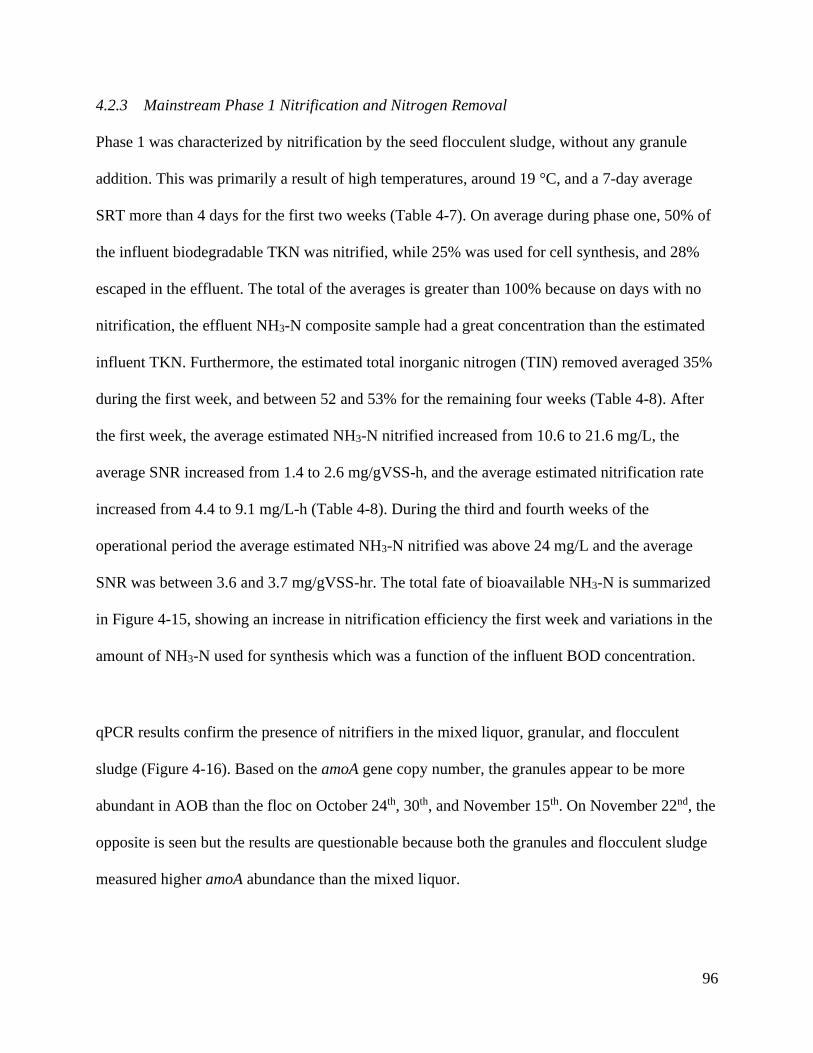
4.2.3 Mainstream Phase 1 Nitrification and Nitrogen Removal ...................................... 96
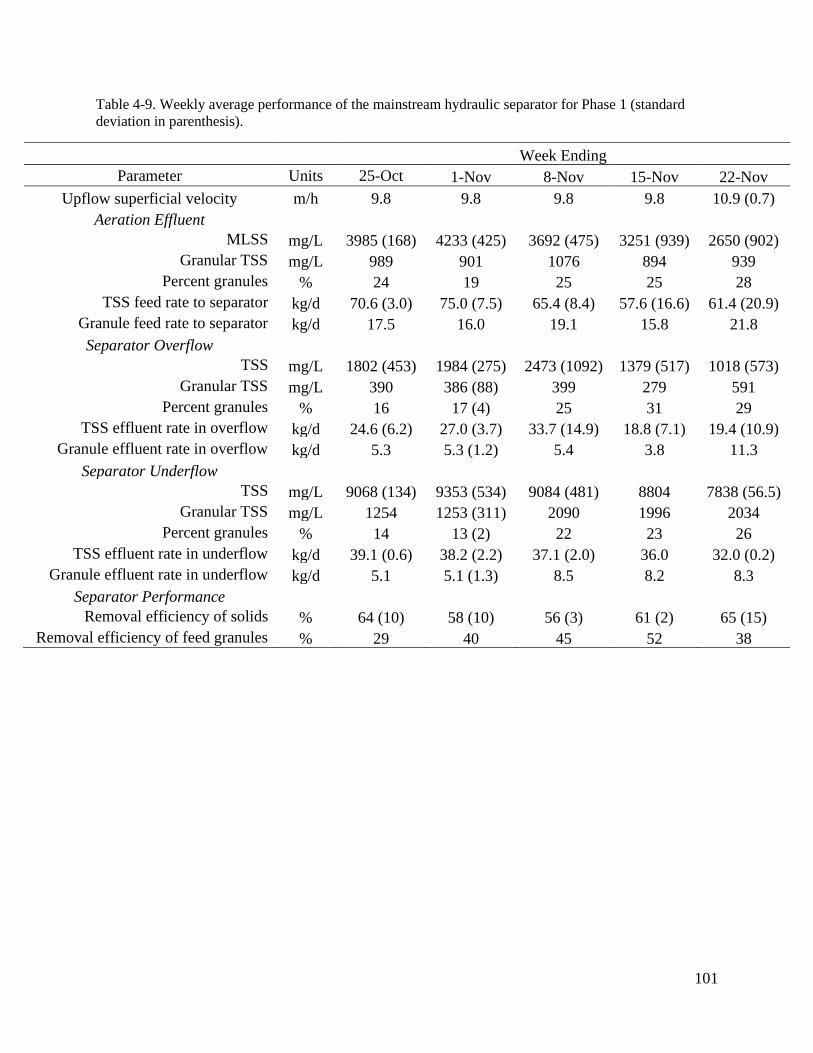
4.2.4 Mainstream Phase 1 Separator Performance ........................................................ 100
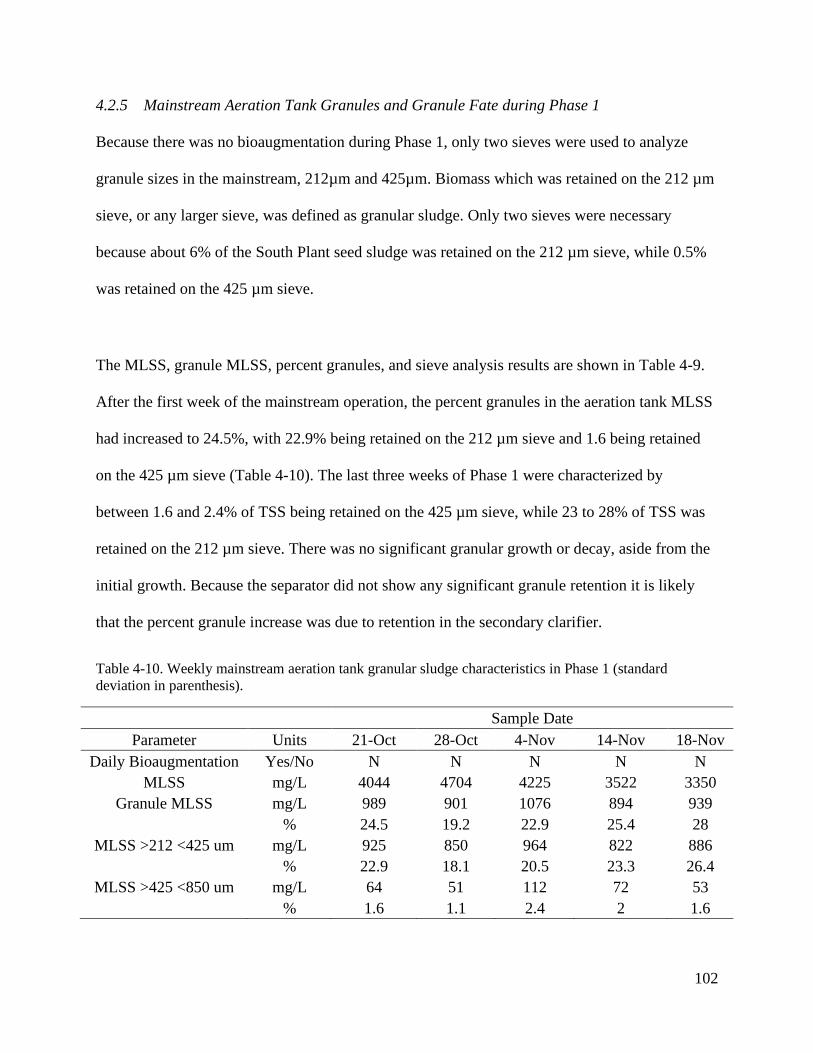
4.2.5 Mainstream Aeration Tank Granules and Granule Fate during Phase 1 .............. 102
Page 10
4
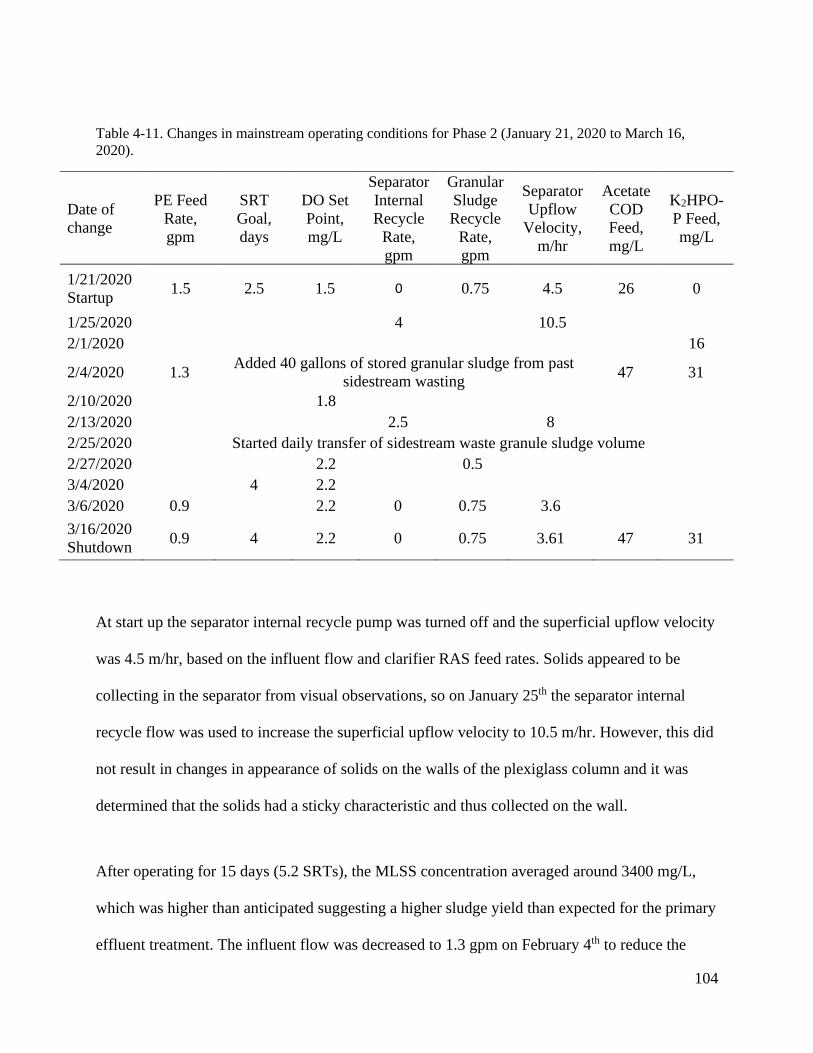
4.3 Mainstream Phase 2 Operation and Treatment Performance ....................................... 103
4.3.1 Mainstream Phase 2 Operating Conditions........................................................... 103
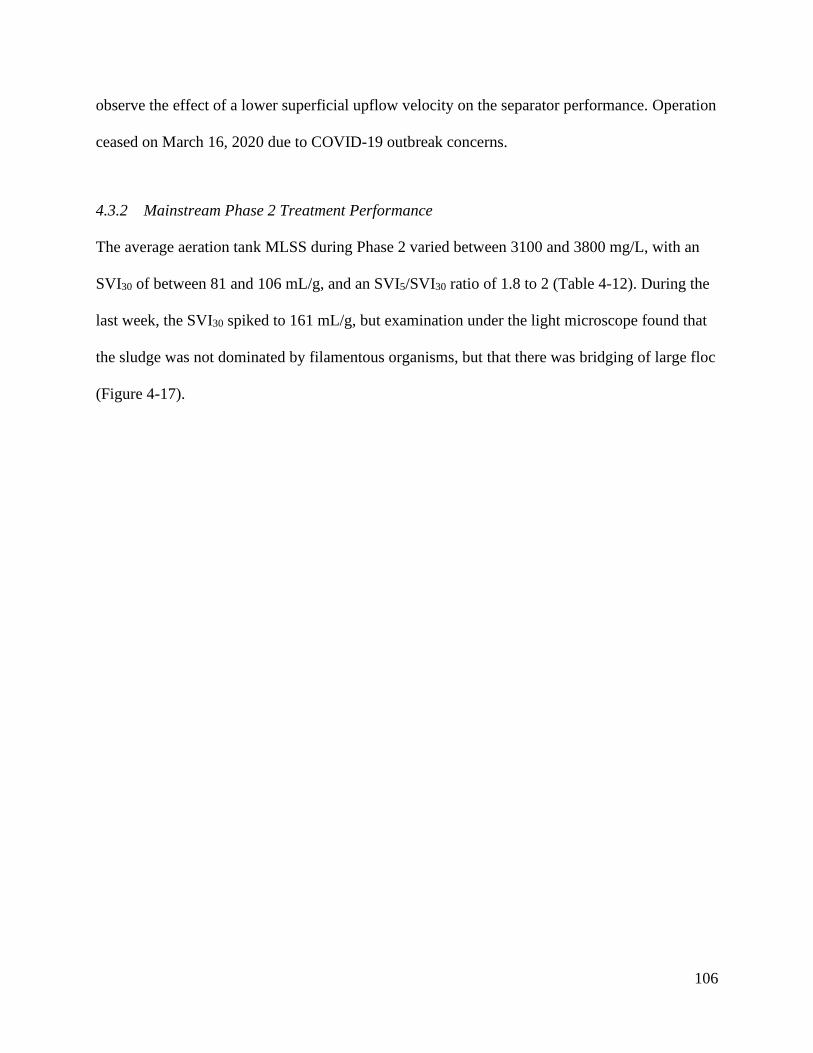
4.3.2 Mainstream Phase 2 Treatment Performance ....................................................... 106
4.3.3 Mainstream Phase 2 Nitrification and Nitrogen Removal .................................... 109
4.3.4 Mainstream Phase 2 Separator Performance ........................................................ 117
4.3.5 Fate of Granules in the Mainstream Aeration Tank during Phase 2 ..................... 125
5 Summary and Conclusion .................................................................................................... 131
6 Future Research ................................................................................................................... 134
7 References ........................................................................................................................... 136
Appendix A: Supplemental Pilot Facility Fabrication Information .............................. 144
Sidestream Sequencing Batch Reactor Pilot ....................................................................... 144
Mainstream Continuous Flow Pilot ..................................................................................... 144
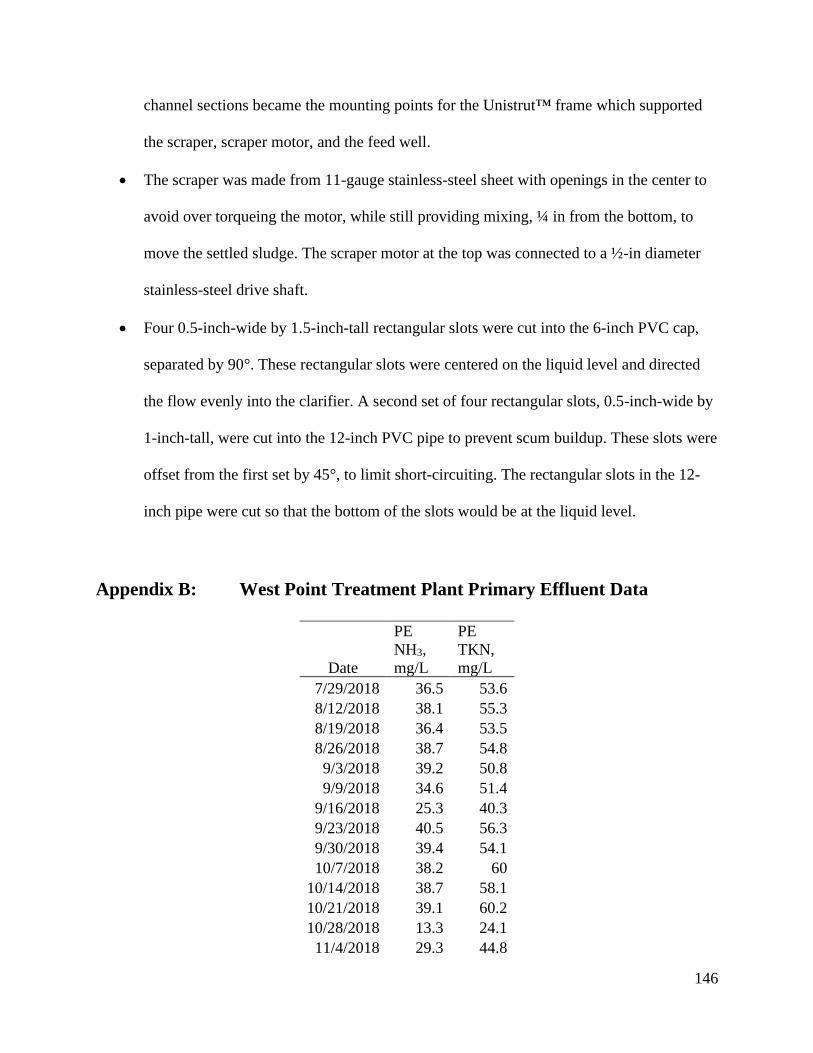
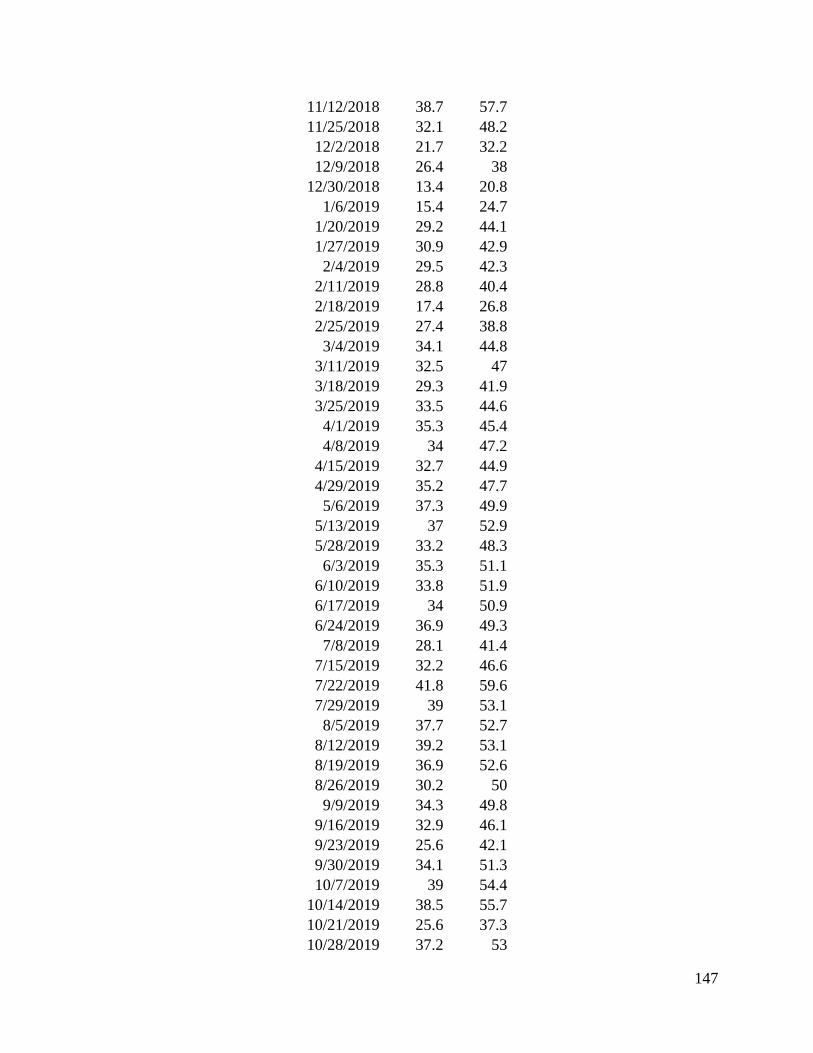
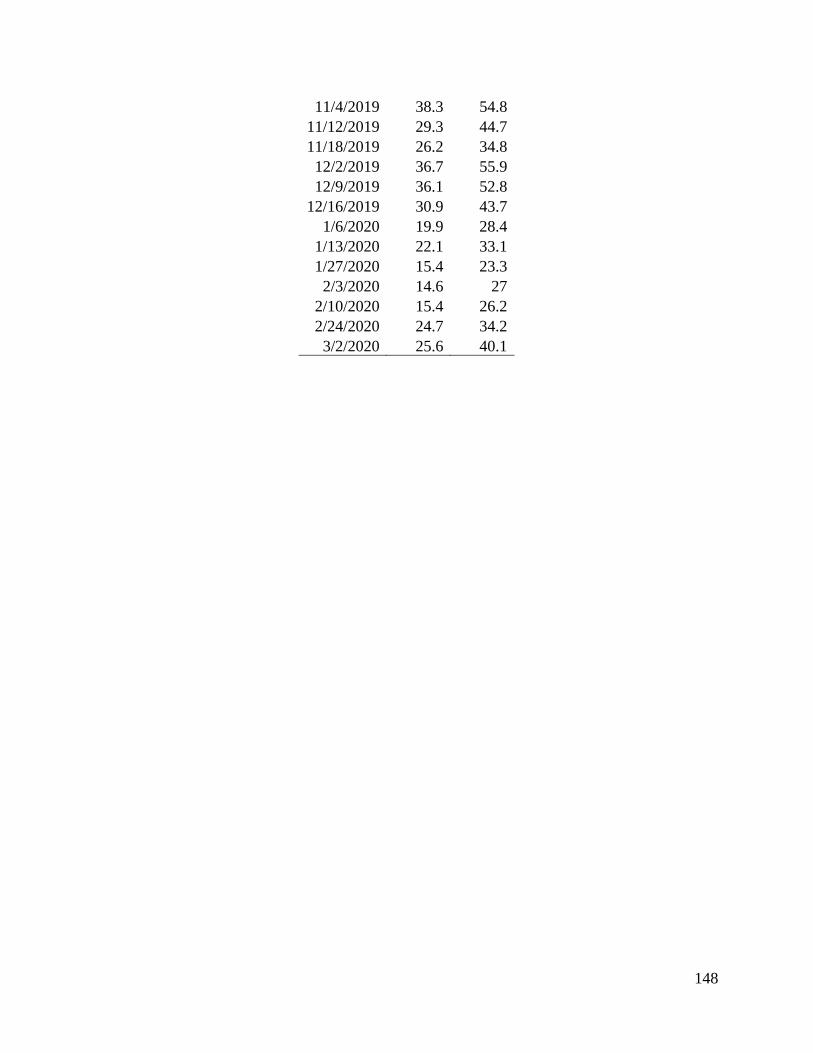
Appendix B: West Point Treatment Plant Primary Effluent Data ............................... 146
List of Figures
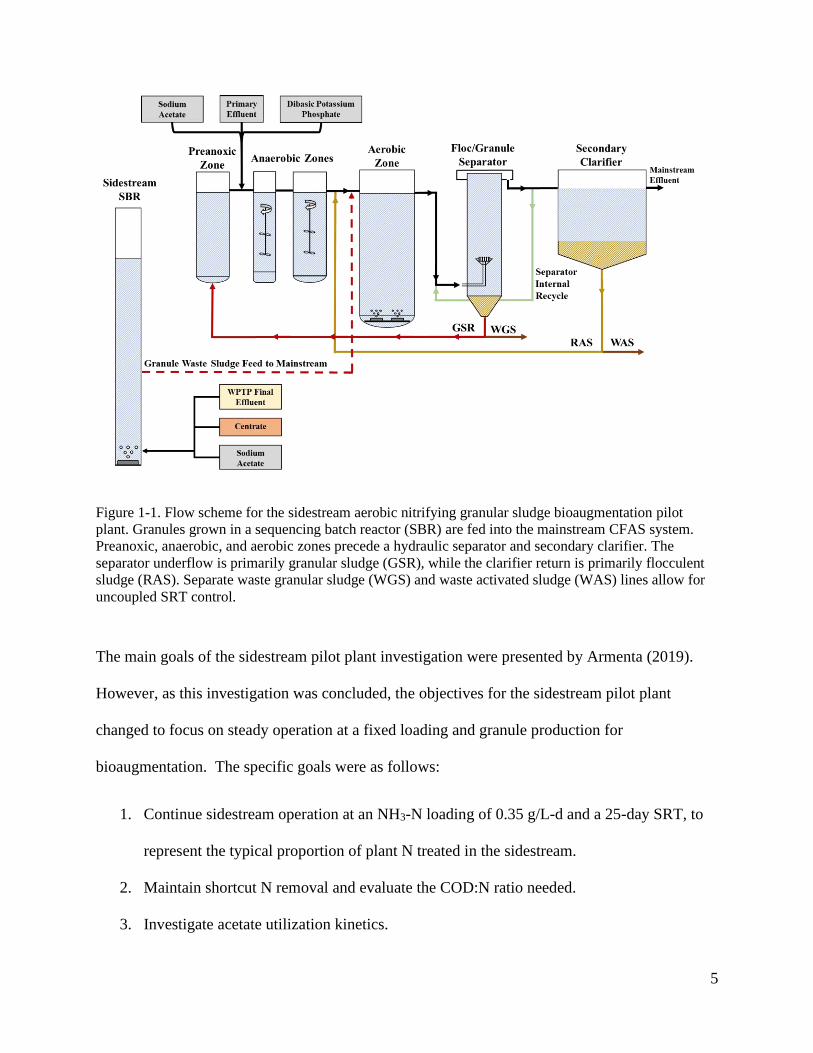
Figure 1-1. Flow scheme for the sidestream aerobic nitrifying granular sludge bioaugmentation
pilot plant. Granules grown in a sequencing batch reactor (SBR) are fed into the mainstream
CFAS system. Preanoxic, anaerobic, and aerobic zones precede a hydraulic separator and
secondary clarifier. The separator underflow is primarily granular sludge (GSR), while the
Page 11
5
clarifier return is primarily flocculent sludge (RAS). Separate waste granular sludge (WGS) and
waste activated sludge (WAS) lines allow for uncoupled SRT control. ......................................... 5
Figure 2-1. Anaerobic (AN) and aerobic (OX) phases for anaerobic COD removal, SND, and
orthophosphate (PO43-) removal by aerobic granular sludge. Diffusion resistance, DO
concentration, and oxygen uptake on outer granule layers creates conditions for an anoxic (AO)
zone within granules for denitrification to occur in an aerated reactor. Chemical pathways are
simplified, and spatial representation of microbial populations is ideal. (Armenta, 2019) ............ 9
Figure 3-1. Sidestream sequencing batch reactor including 1) feed sources and volumes fed per
cycle, 2) DO and pH probes, and 3) decant, sampling, and sludge working depth. (Adapted from
Armenta, 2019) ............................................................................................................................. 21
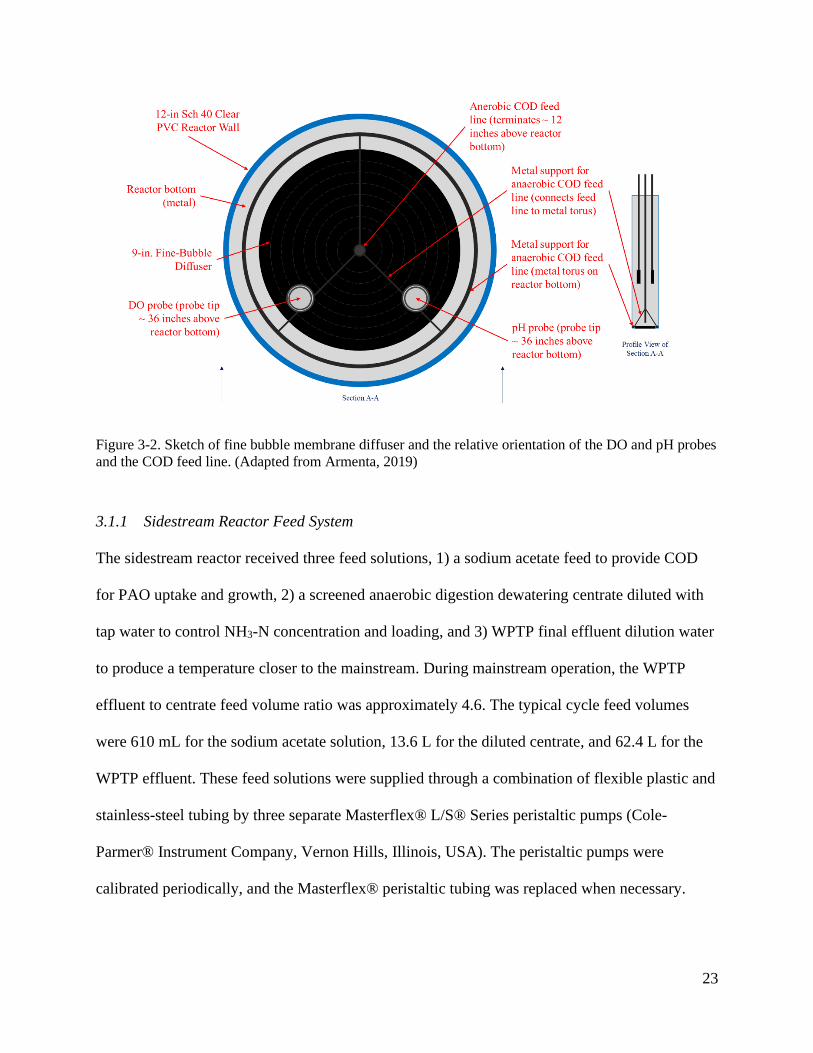
Figure 3-2. Sketch of fine bubble membrane diffuser and the relative orientation of the DO and
pH probes and the COD feed line. (Adapted from Armenta, 2019) ............................................. 23
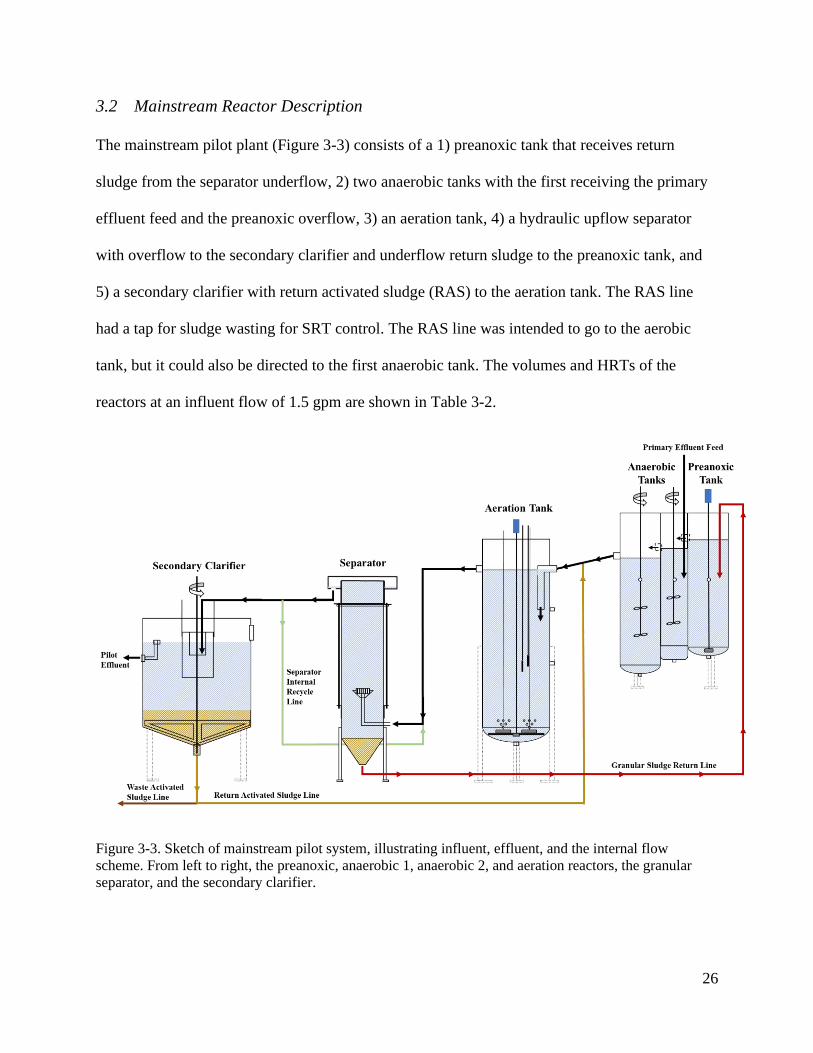
Figure 3-3. Sketch of mainstream pilot system, illustrating influent, effluent, and the internal
flow scheme. From left to right, the preanoxic, anaerobic 1, anaerobic 2, and aeration reactors,
the granular separator, and the secondary clarifier. ...................................................................... 26
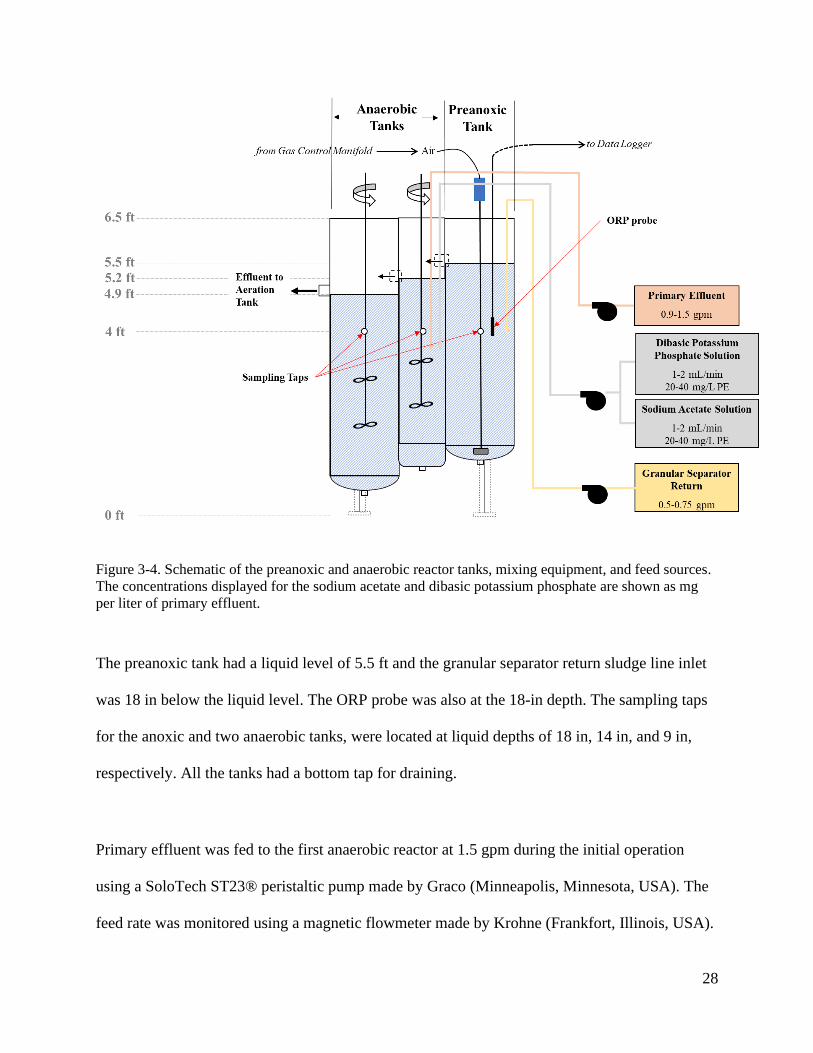
Figure 3-4. Schematic of the preanoxic and anaerobic reactor tanks, mixing equipment, and feed
sources. The concentrations displayed for the sodium acetate and dibasic potassium phosphate
are shown as mg per liter of primary effluent. .............................................................................. 28
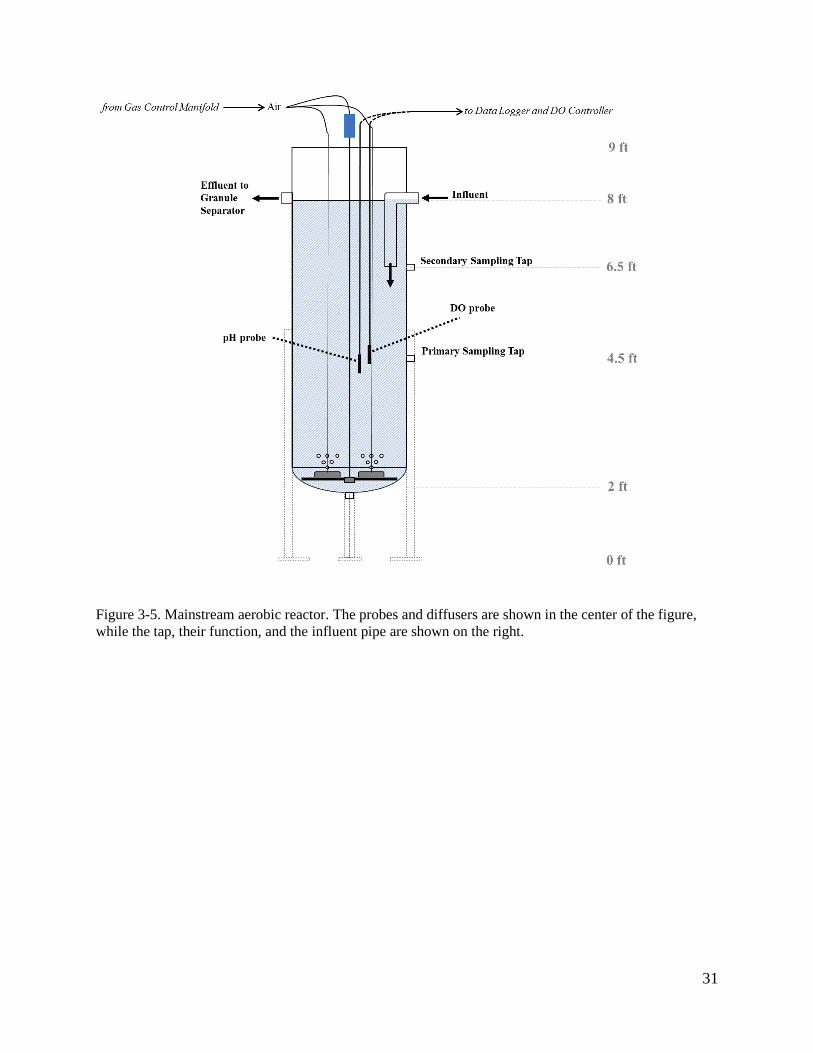
Figure 3-5. Mainstream aerobic reactor. The probes and diffusers are shown in the center of the
figure, while the tap, their function, and the influent pipe are shown on the right. ...................... 31
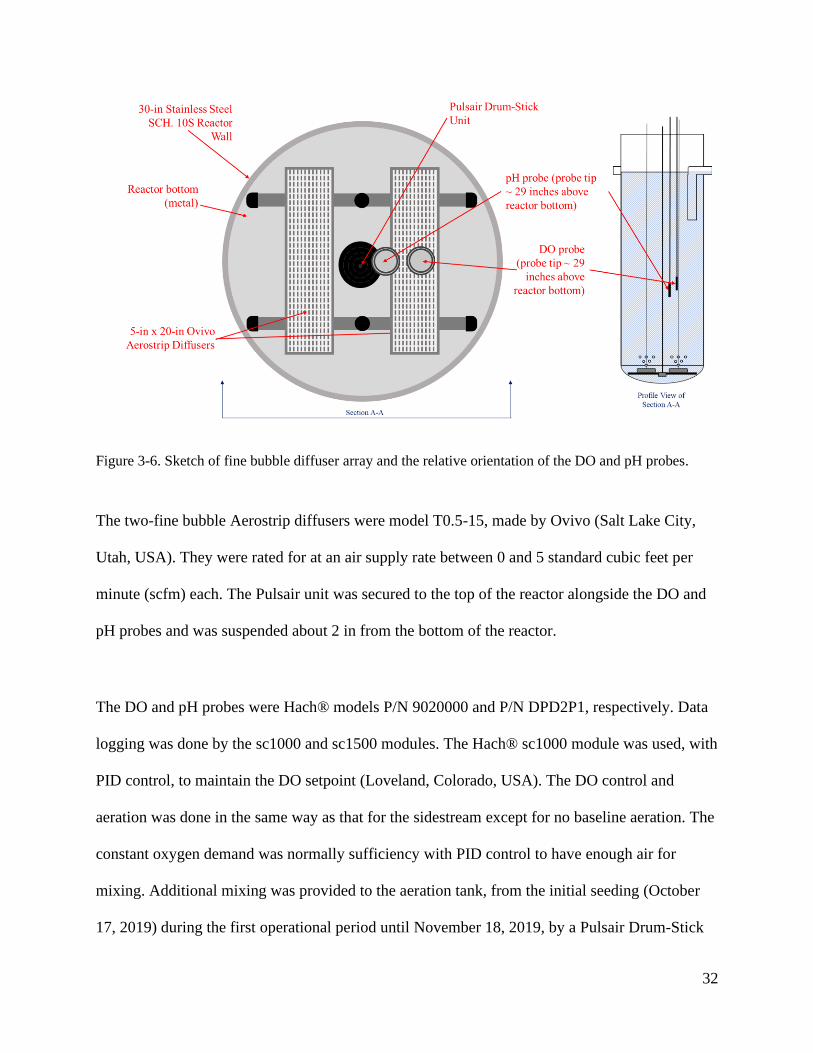
Figure 3-6. Sketch of fine bubble diffuser array and the relative orientation of the DO and pH
probes. ........................................................................................................................................... 32
Page 12
6
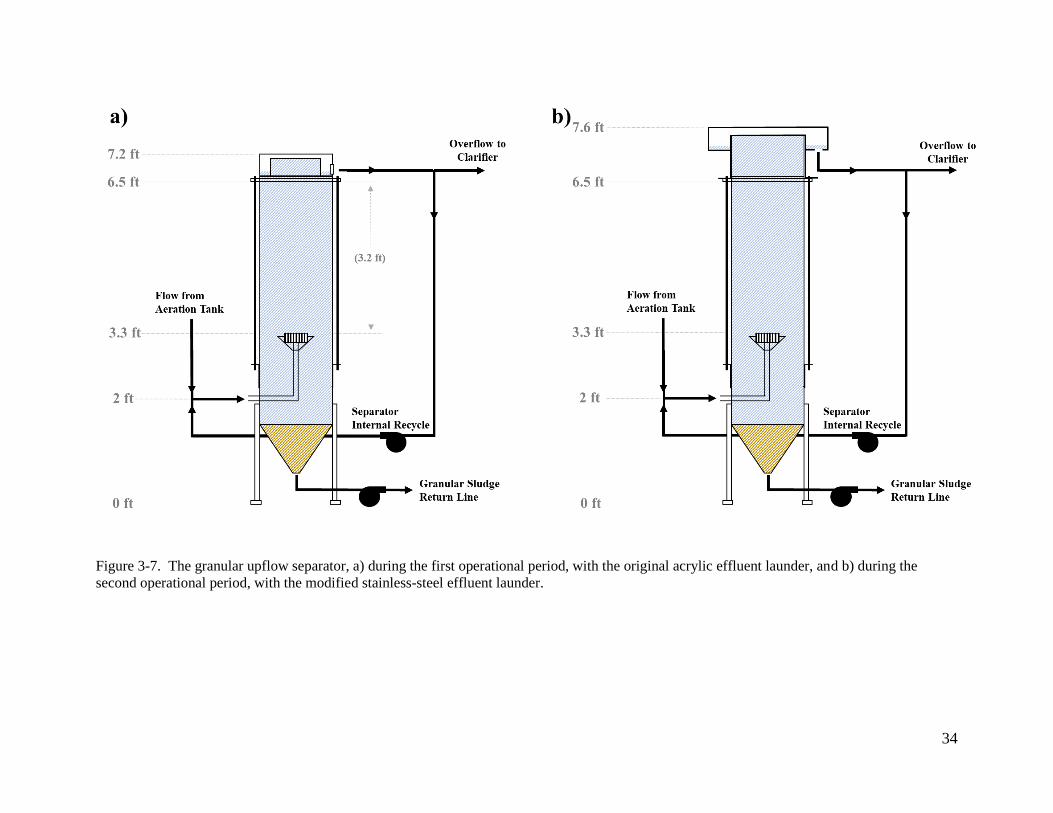
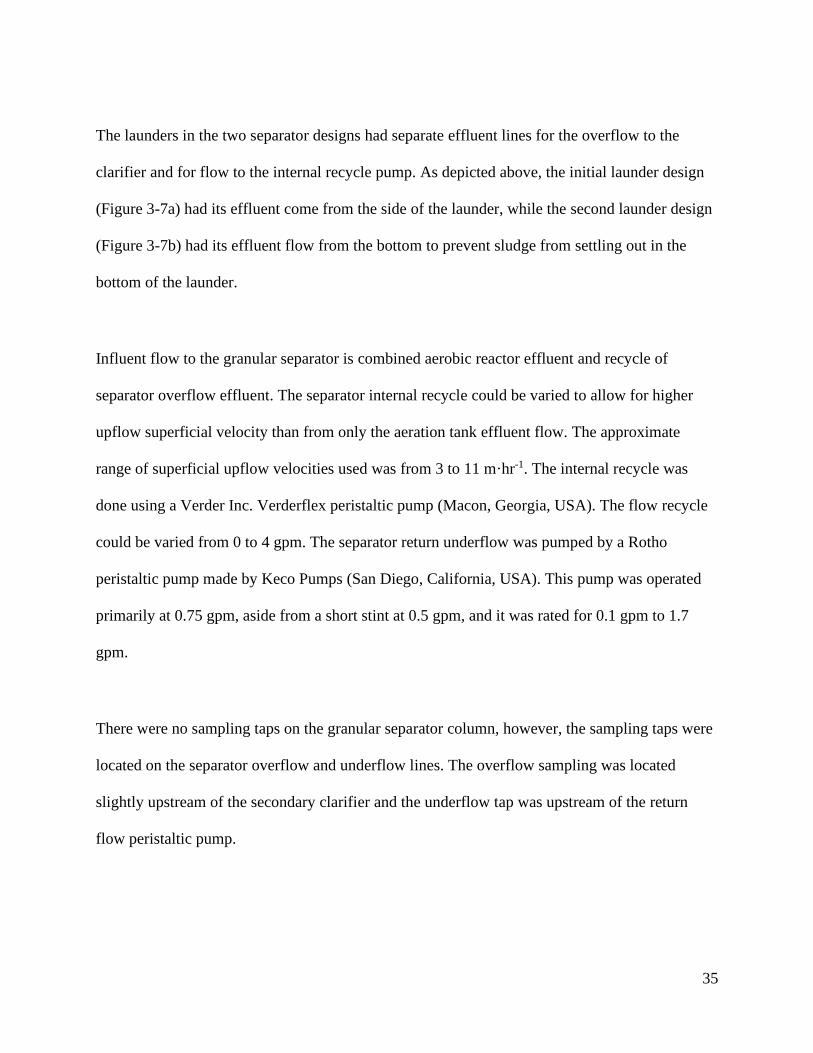
Figure 3-7. The granular upflow separator, a) during the first operational period, with the
original acrylic effluent launder, and b) during the second operational period, with the modified
stainless-steel effluent launder. ..................................................................................................... 34
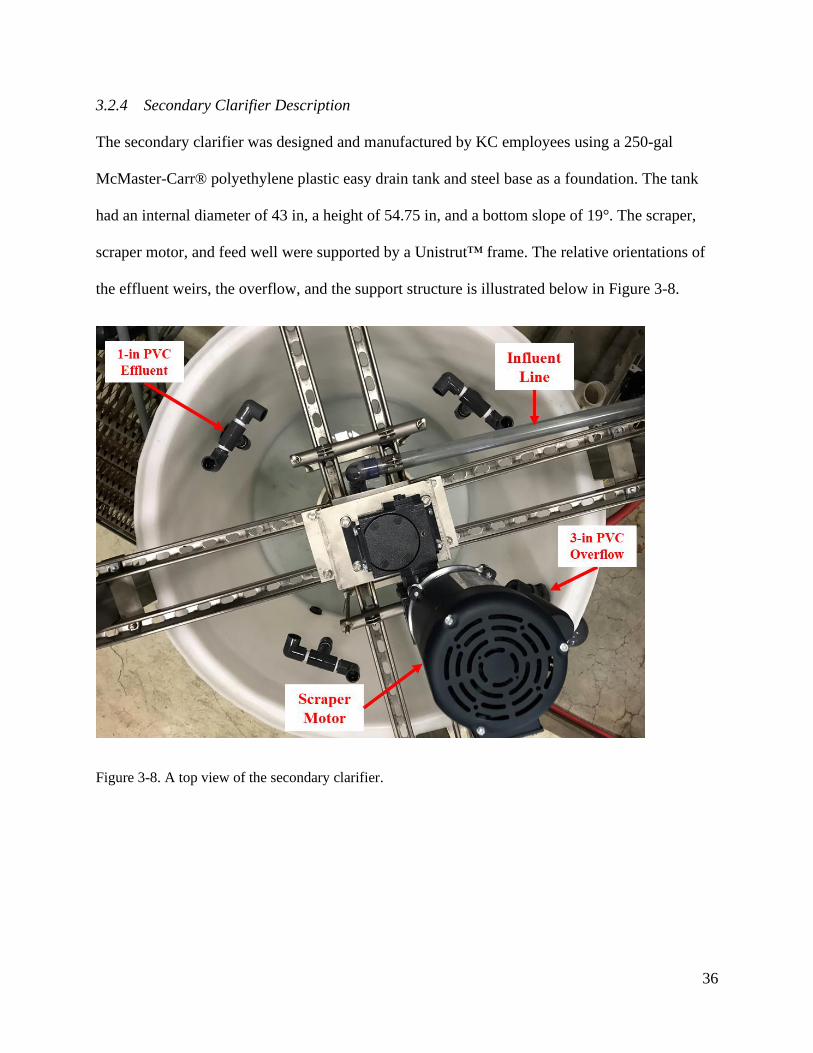
Figure 3-8. A top view of the secondary clarifier. ........................................................................ 36
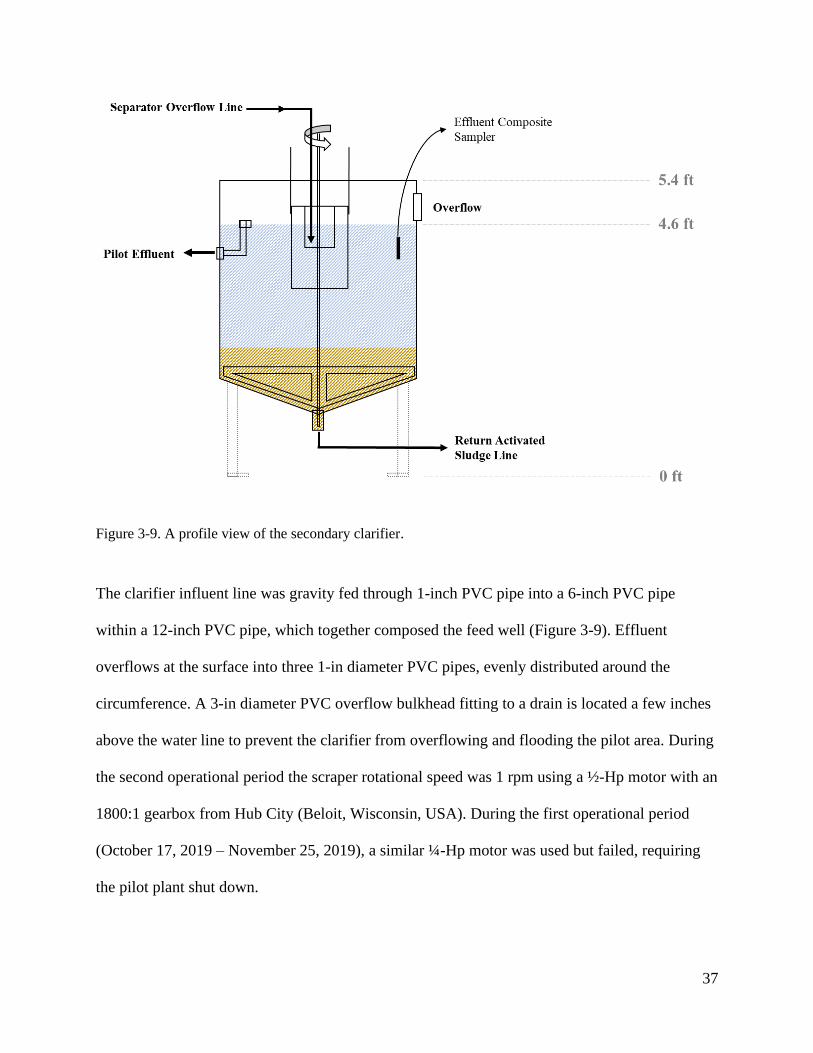
Figure 3-9. A profile view of the secondary clarifier. .................................................................. 37
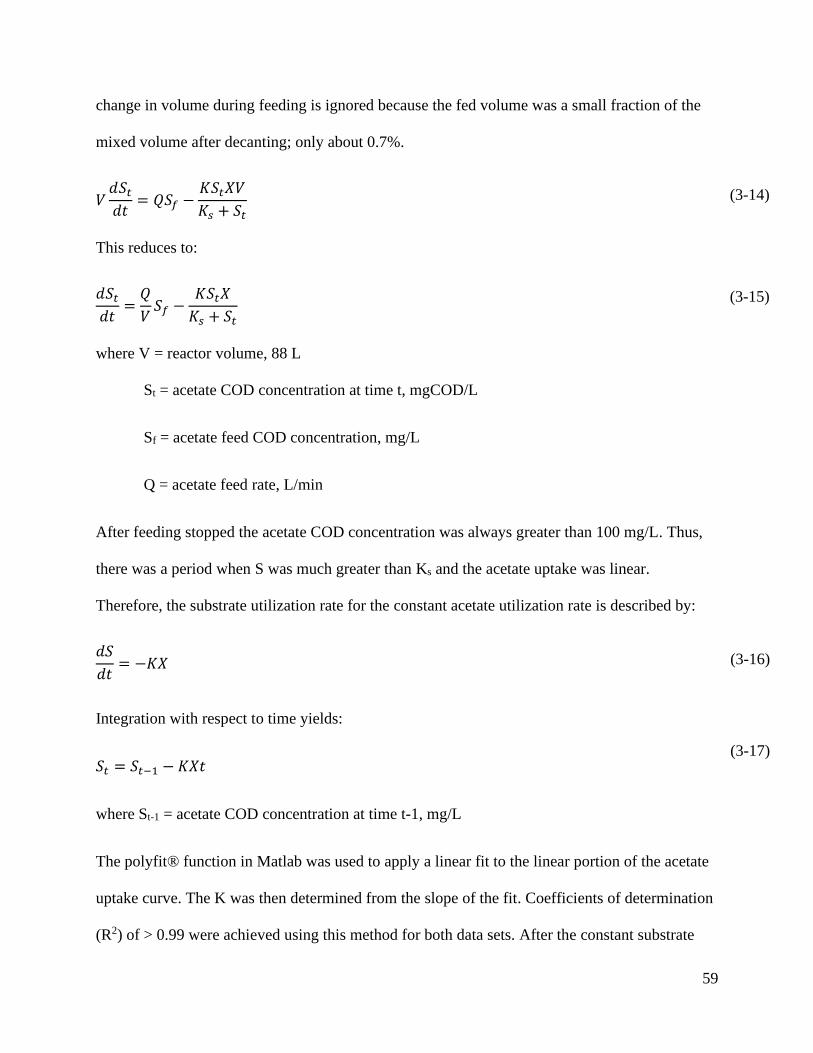
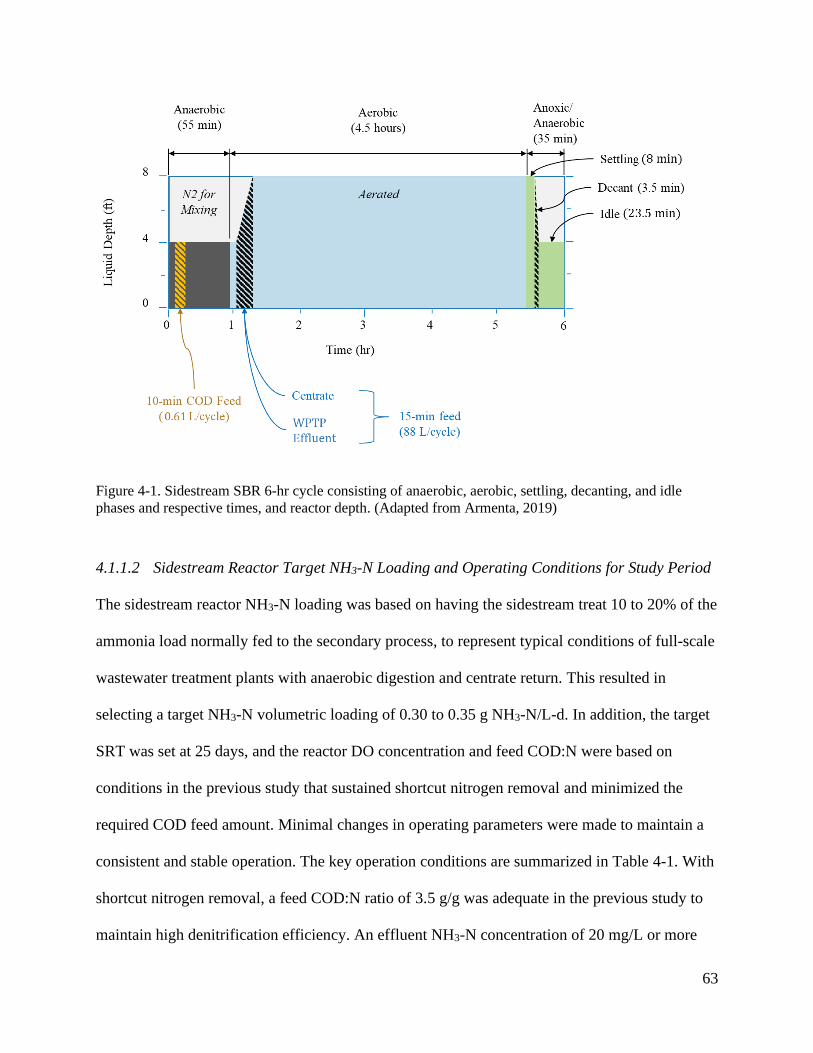
Figure 4-1. Sidestream SBR 6-hr cycle consisting of anaerobic, aerobic, settling, decanting, and
idle phases and respective times, and reactor depth. (Adapted from Armenta, 2019) ................. 63
Figure 4-2. Sidestream reactor NH3-N influent and effluent concentrations, NH3-N loading, and
inhibition events from September 1, 2019 to March 16, 2020. .................................................... 65
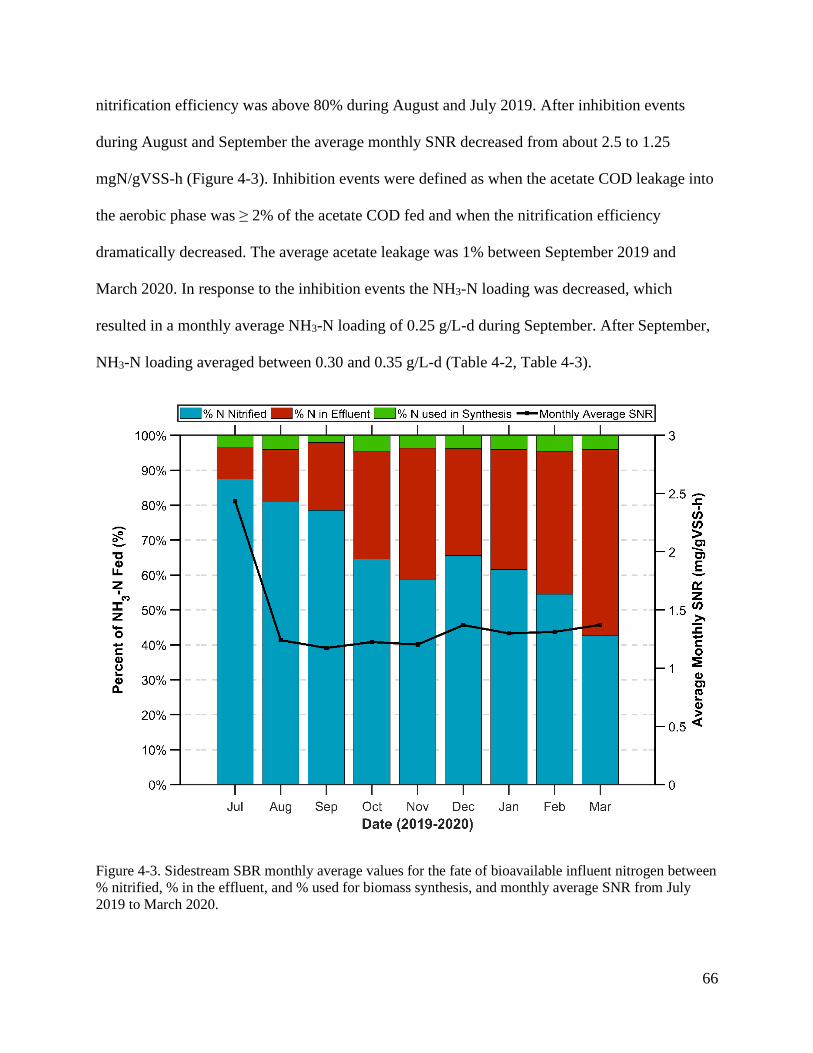
Figure 4-3. Sidestream SBR monthly average values for the fate of bioavailable influent nitrogen
between % nitrified, % in the effluent, and % used for biomass synthesis, and monthly average
SNR from July 2019 to March 2020. ............................................................................................ 66
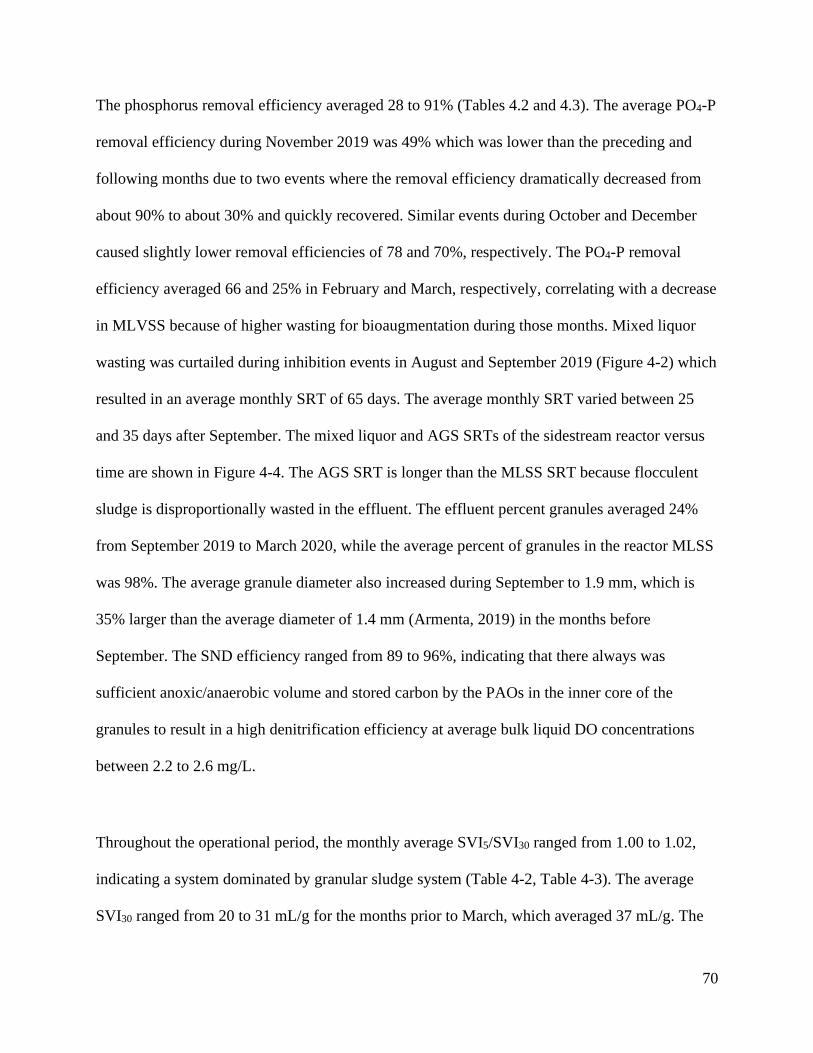
Figure 4-4. Sidestream SBR 7-day average MLSS SRT and AGS SRTs from September 2019 to
March 2020. Because of the reduced wasting in August and September the AGS SRT ranged
from 100 to 600 days (data points not shown). ............................................................................. 71
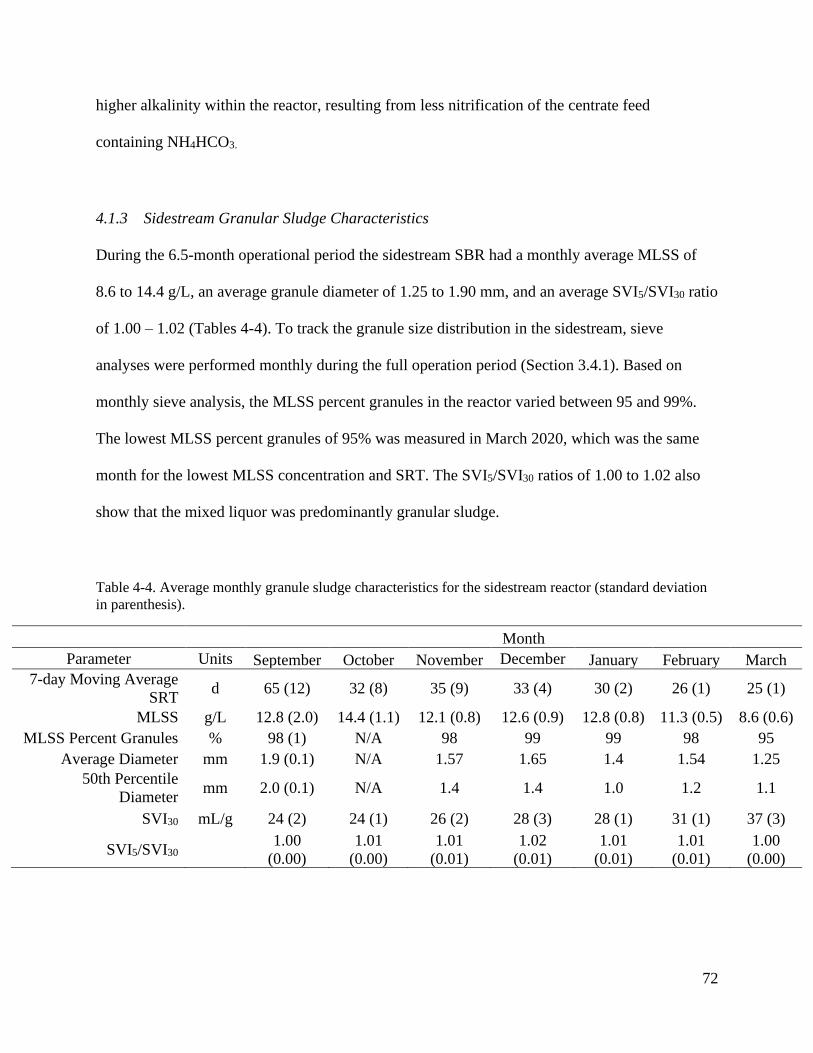
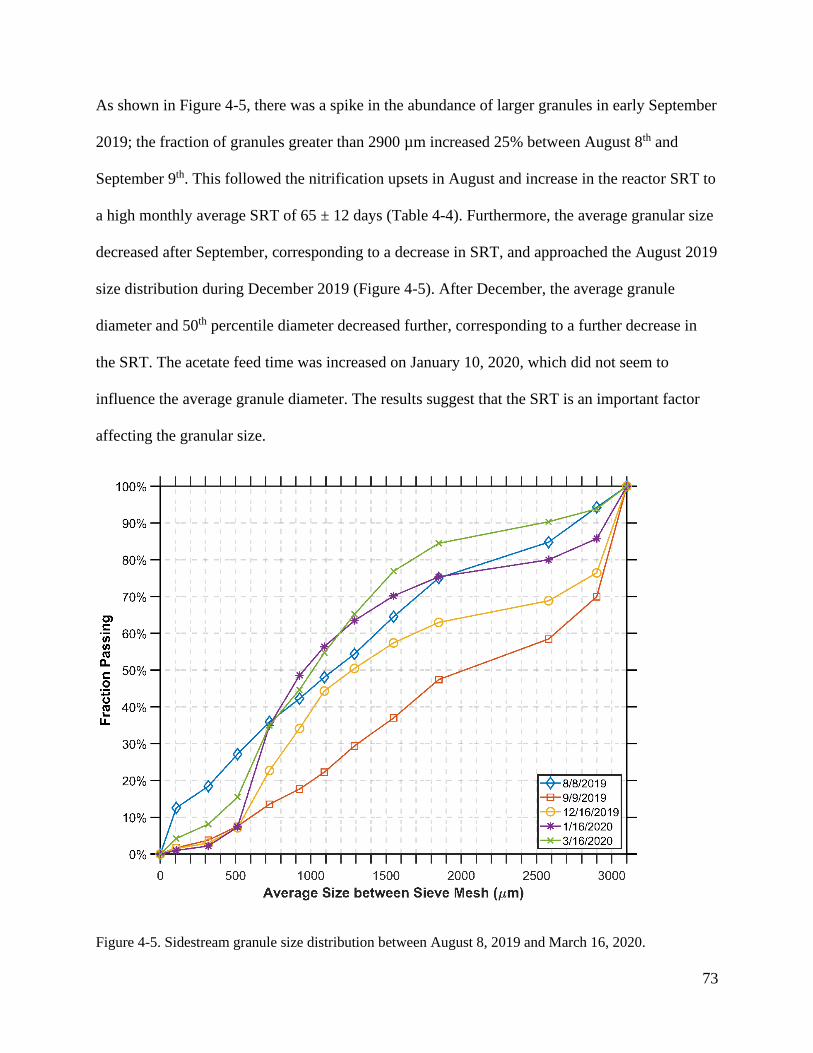
Figure 4-5. Sidestream granule size distribution between August 8, 2019 and March 16, 2020. 73
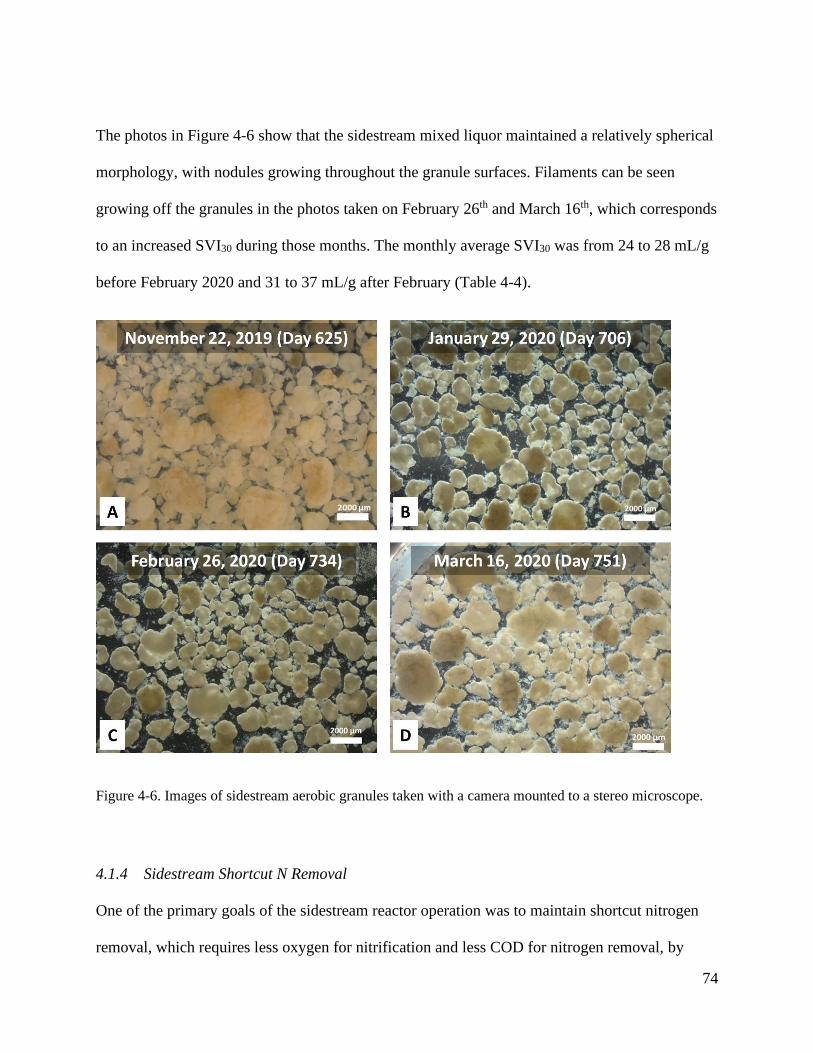
Figure 4-6. Images of sidestream aerobic granules taken with a camera mounted to a stereo
microscope. ................................................................................................................................... 74
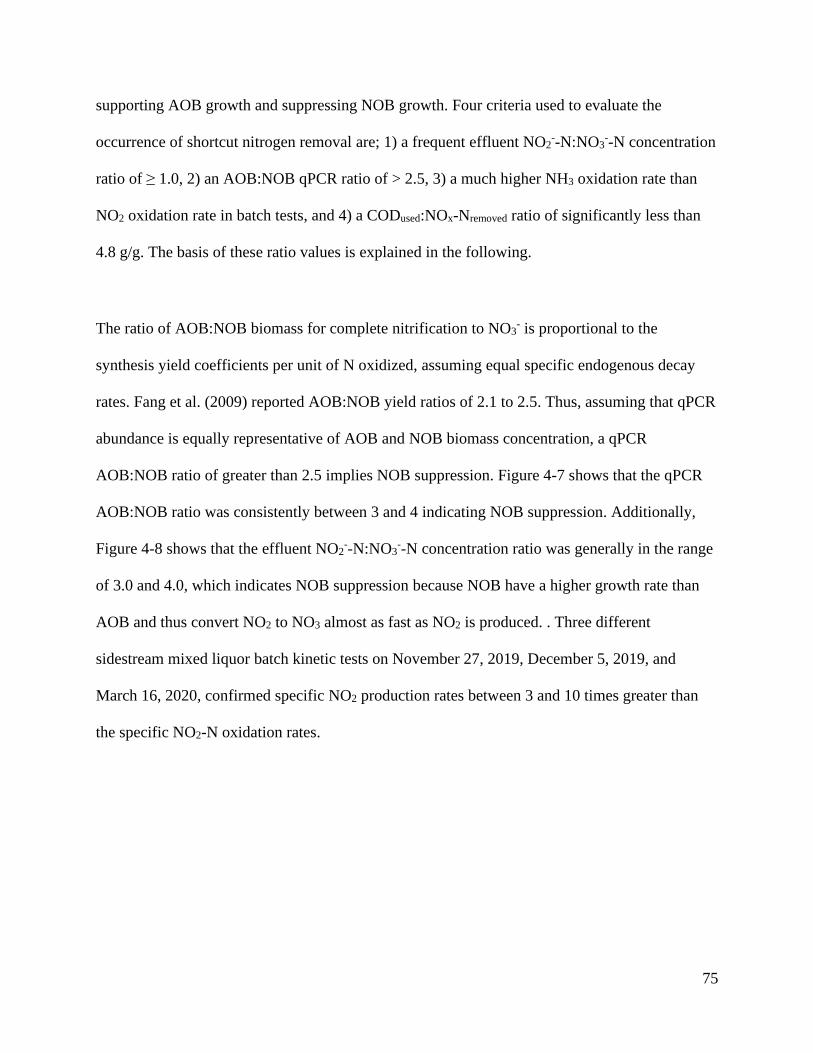
Figure 4-7. The sidestream SBR qPCR AOB:NOB ratio and the ratio expected for complete
nitrification. qPCR data was provided by Bao Ngyuen Quoc, UW PhD candidate. .................... 76
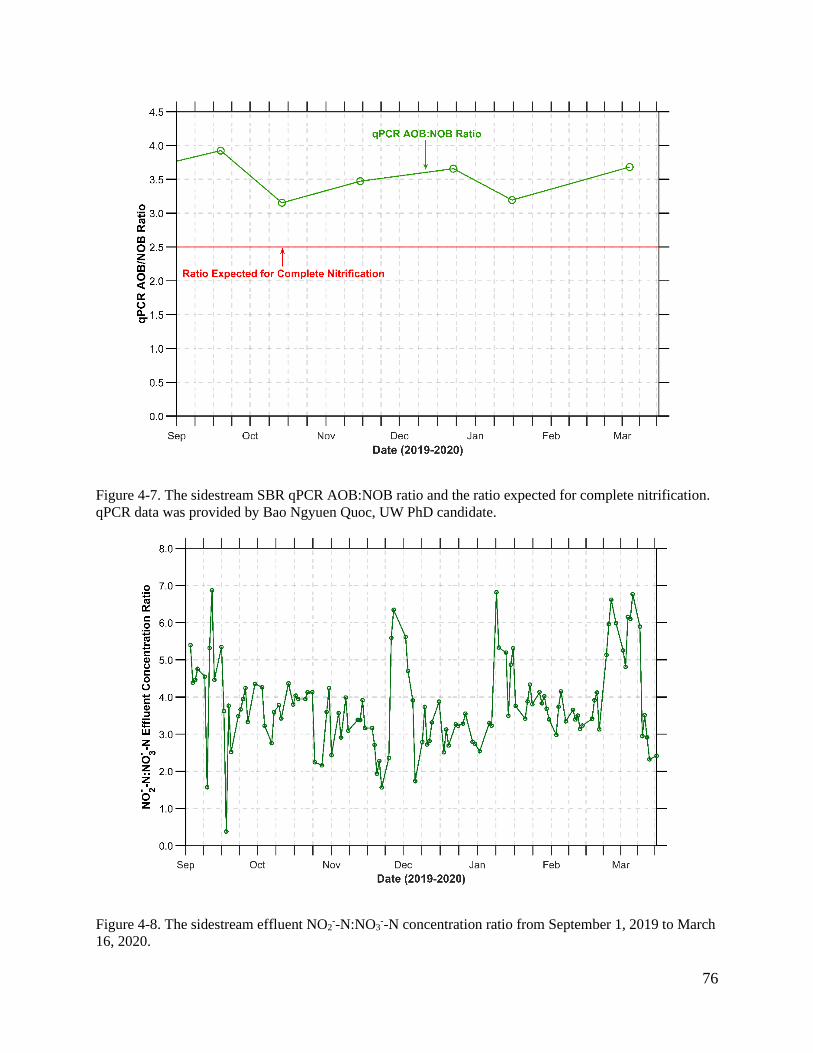
Figure 4-8. The sidestream effluent NO2--N:NO3
--N concentration ratio from September 1, 2019
to March 16, 2020. ........................................................................................................................ 76
Page 13
7
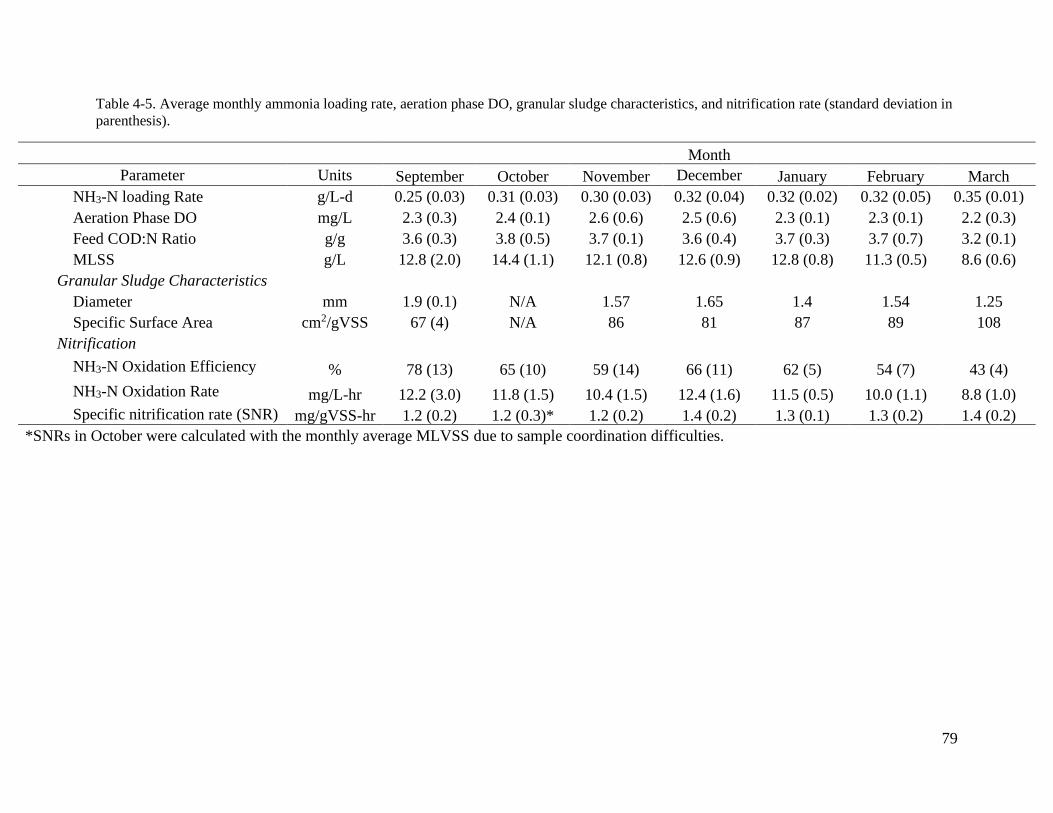
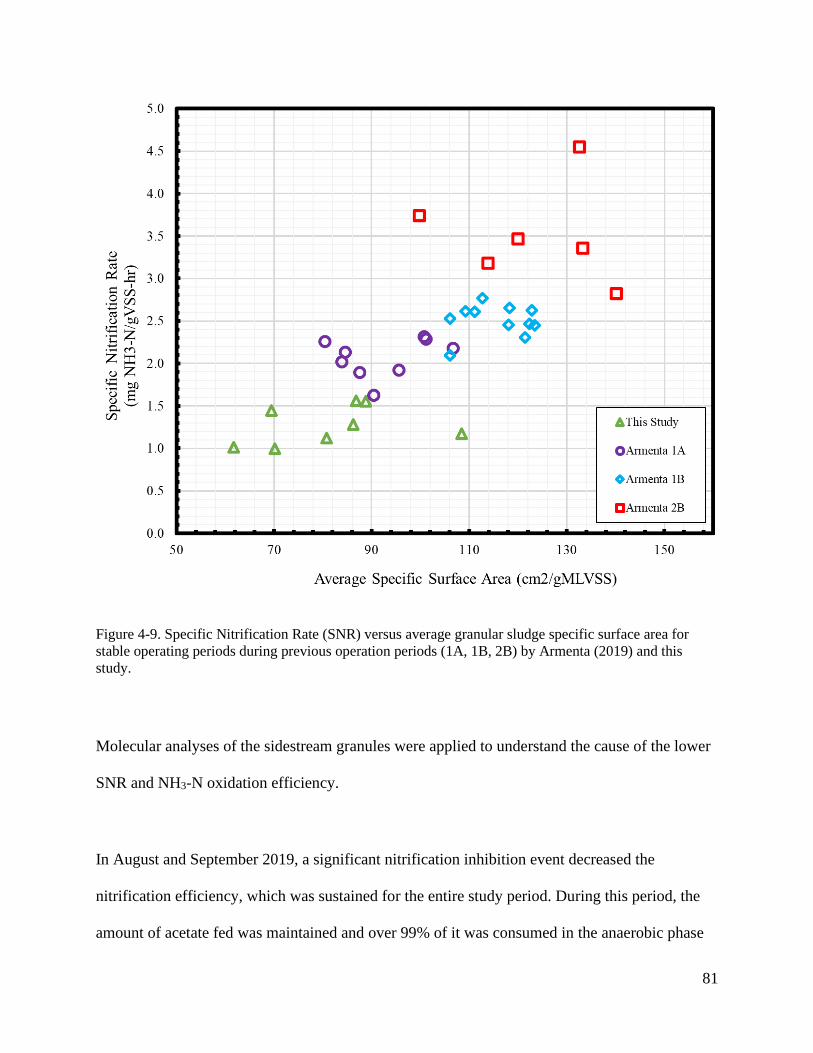
Figure 4-9. Specific Nitrification Rate (SNR) versus average granular sludge specific surface
area for stable operating periods during previous operation periods (1A, 1B, 2B) by Armenta
(2019) and this study. .................................................................................................................... 81
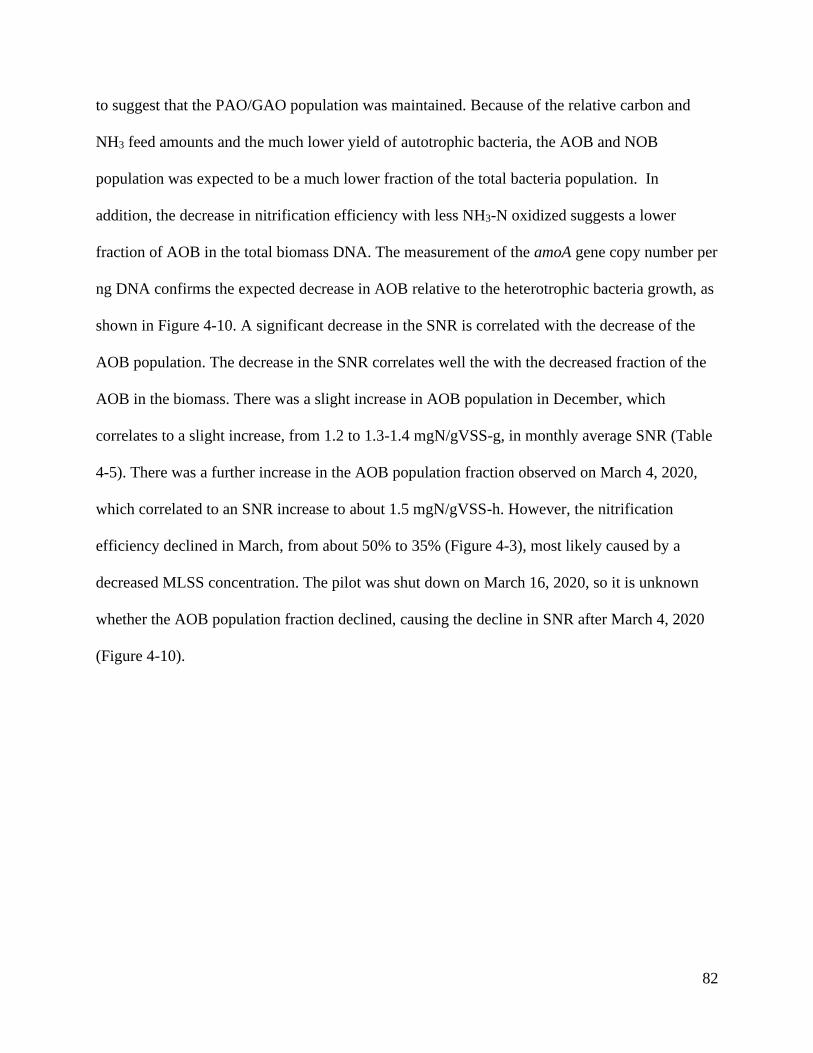
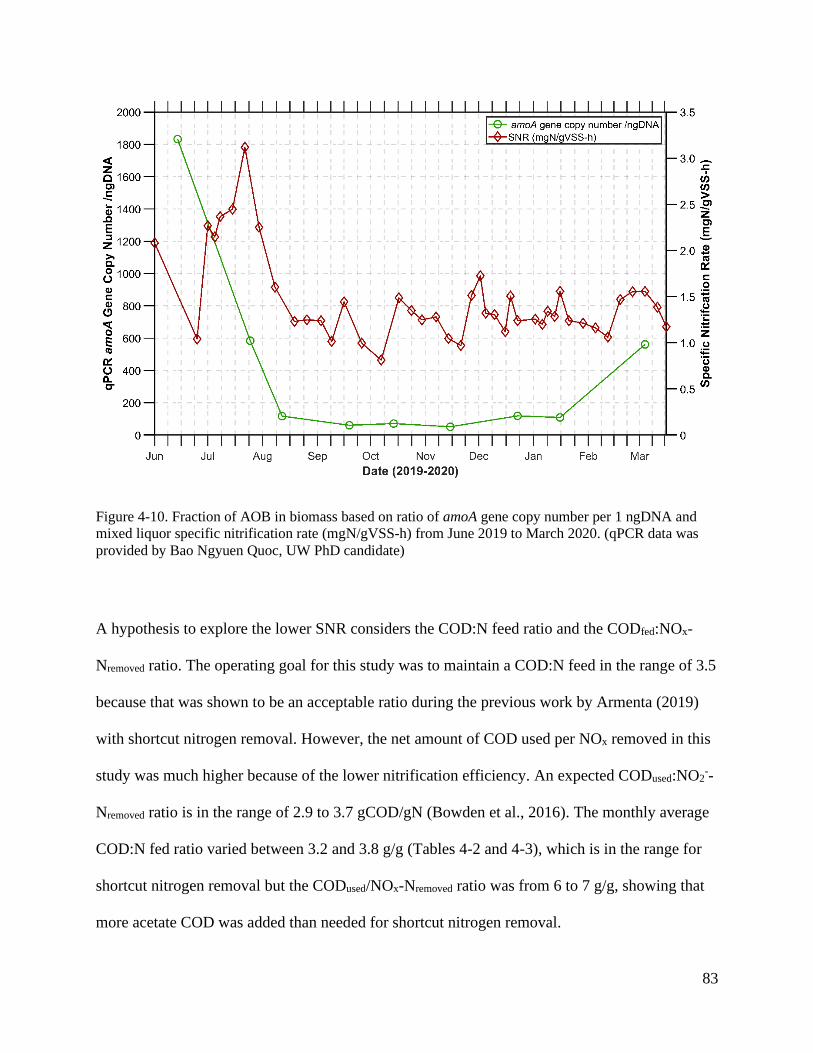
Figure 4-10. Fraction of AOB in biomass based on ratio of amoA gene copy number per 1
ngDNA and mixed liquor specific nitrification rate (mgN/gVSS-h) from June 2019 to March
2020. (qPCR data was provided by Bao Ngyuen Quoc, UW PhD candidate) ............................. 83
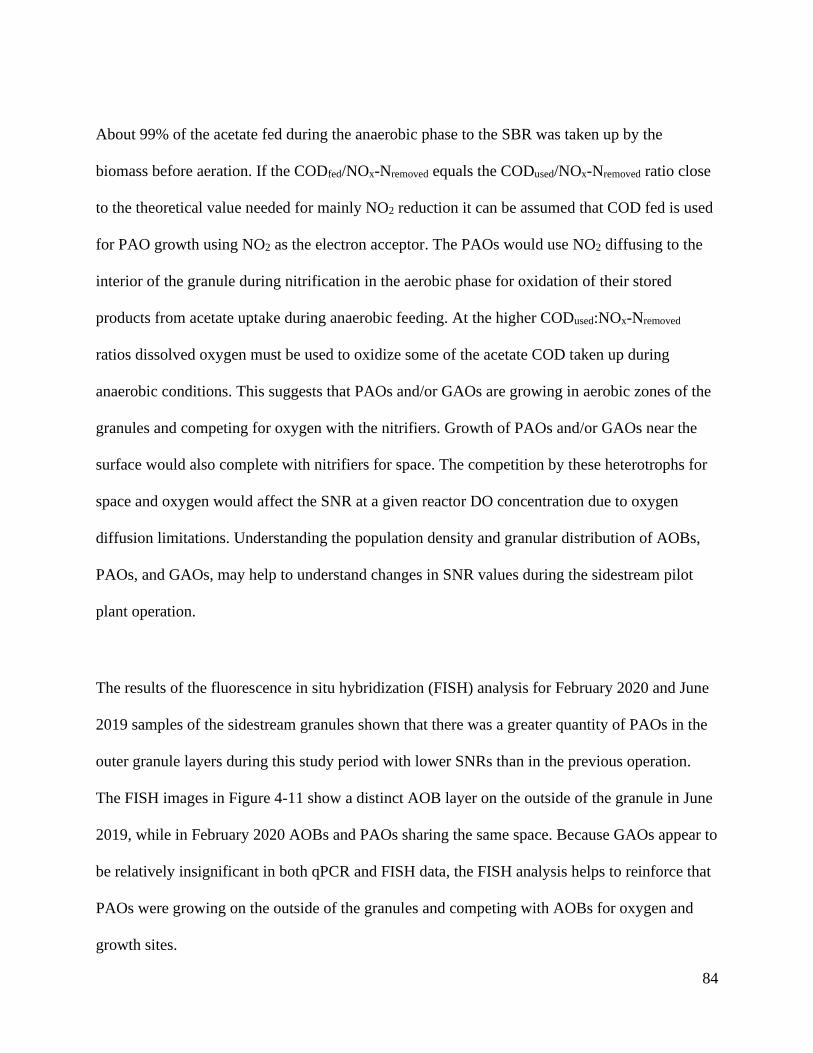
Figure 4-11. Fluorescence in situ hybridization (FISH) images of sidestream SBR granules from
June 2019 and February 2020. PAOs are represented in blue, while AOBs are in red, GAOs are
in green. FISH analysis was performed by Bao Ngyuen Quoc, UW PhD candidate. ................. 85
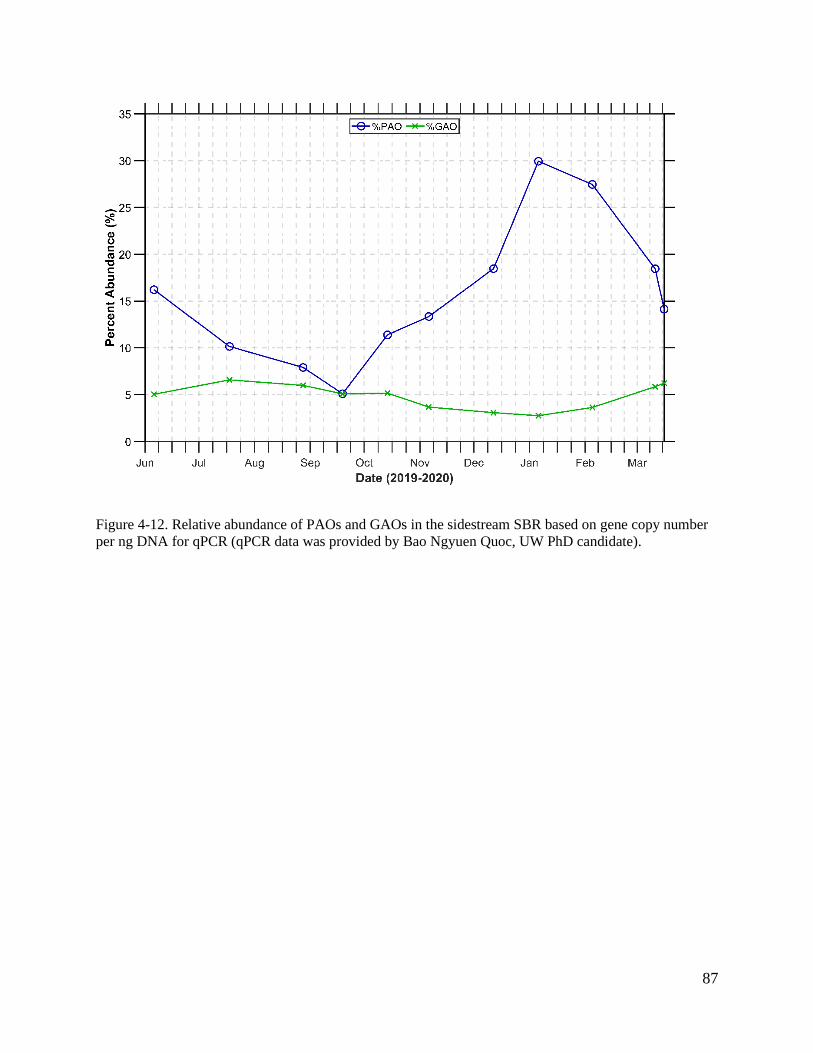
Figure 4-12. Relative abundance of PAOs and GAOs in the sidestream SBR based on gene copy
number per ng DNA for qPCR (qPCR data was provided by Bao Ngyuen Quoc, UW PhD
candidate). ..................................................................................................................................... 87
Figure 4-13. Sidestream SBR acetate utilization kinetics batch test on September 30, 2019. The
linear model is Equation 3-17, while the asymptotic model is Equation 3-18, and the model
during uptake is Equation 3-15. The measured acetate-COD data is displayed on the left graph in
blue. ............................................................................................................................................... 89
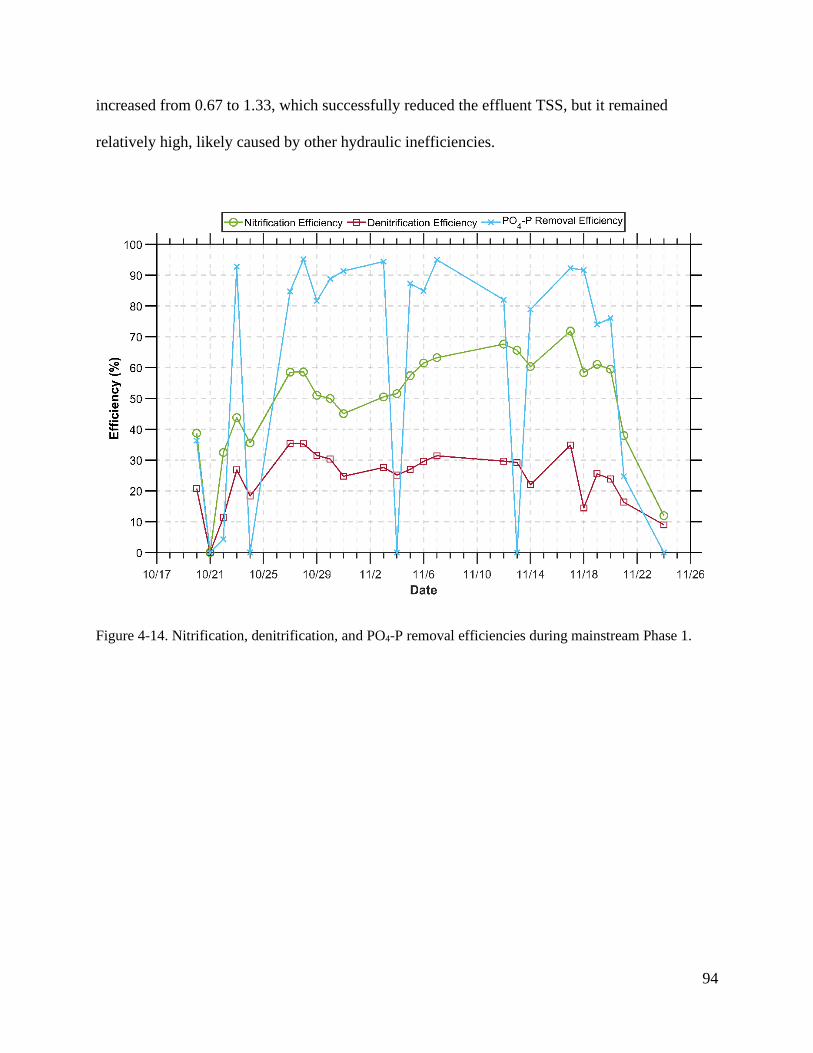
Figure 4-14. Nitrification, denitrification, and PO4-P removal efficiencies during mainstream
Phase 1. ......................................................................................................................................... 94
Figure 4-15. Mainstream Phase 1 weekly average fate of influent bioavailable NH3-N. ............. 98
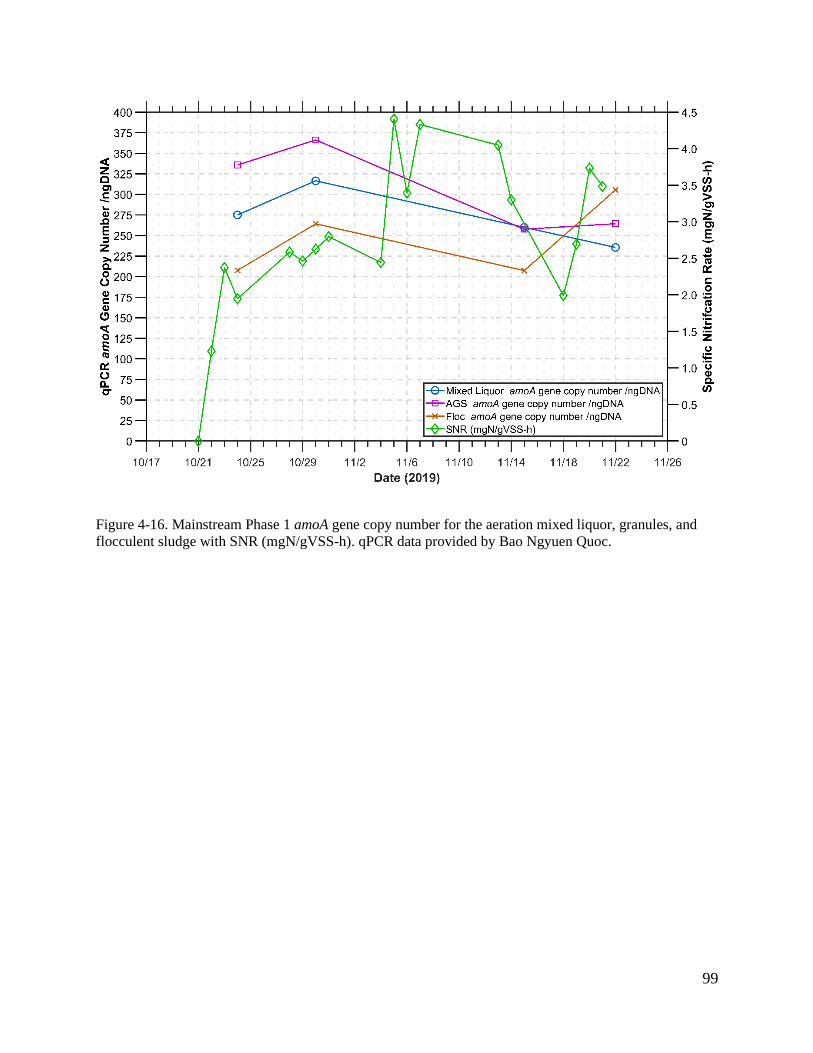
Figure 4-16. Mainstream Phase 1 amoA gene copy number for the aeration mixed liquor,
granules, and flocculent sludge with SNR (mgN/gVSS-h). qPCR data provided by Bao Ngyuen
Quoc. ............................................................................................................................................. 99
Page 14
8
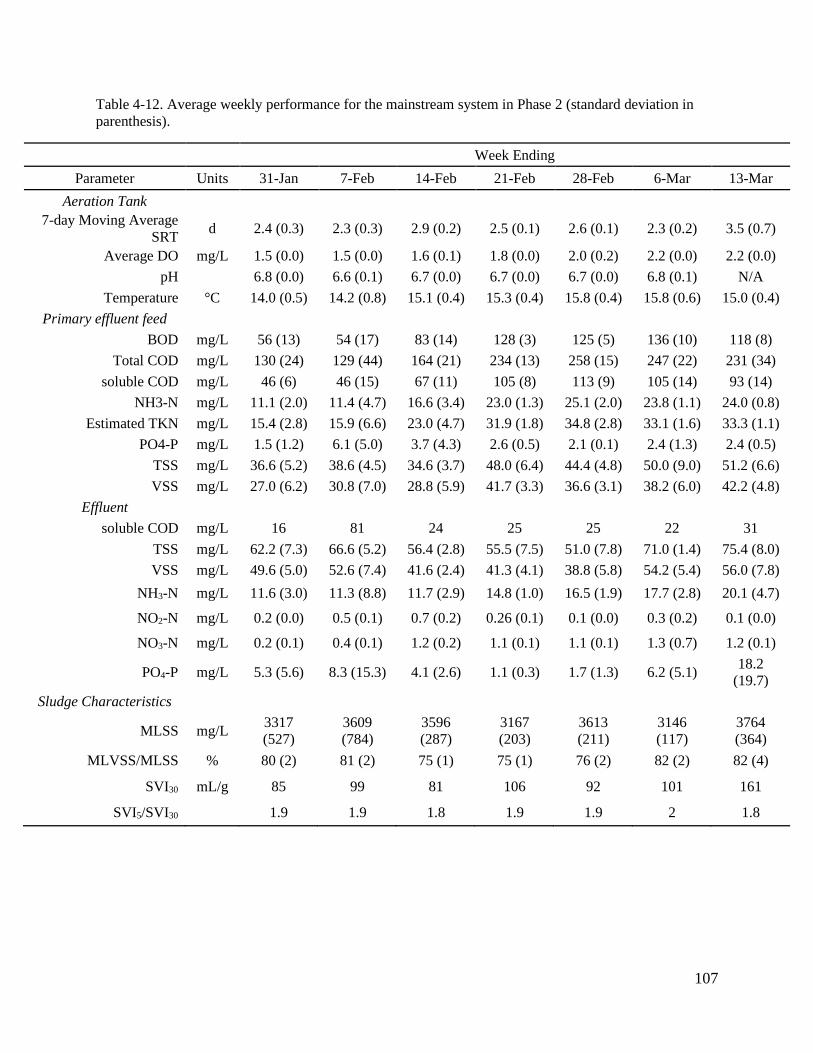
Figure 4-17. Images taken on March 16, 2020 of Phase 2 mainstream mixed liquor using a
smartphone through a light microscope viewfinder. Stalked ciliates can be seen growing in the
bridged flocculent sludge (original magnification 100x). ........................................................... 108
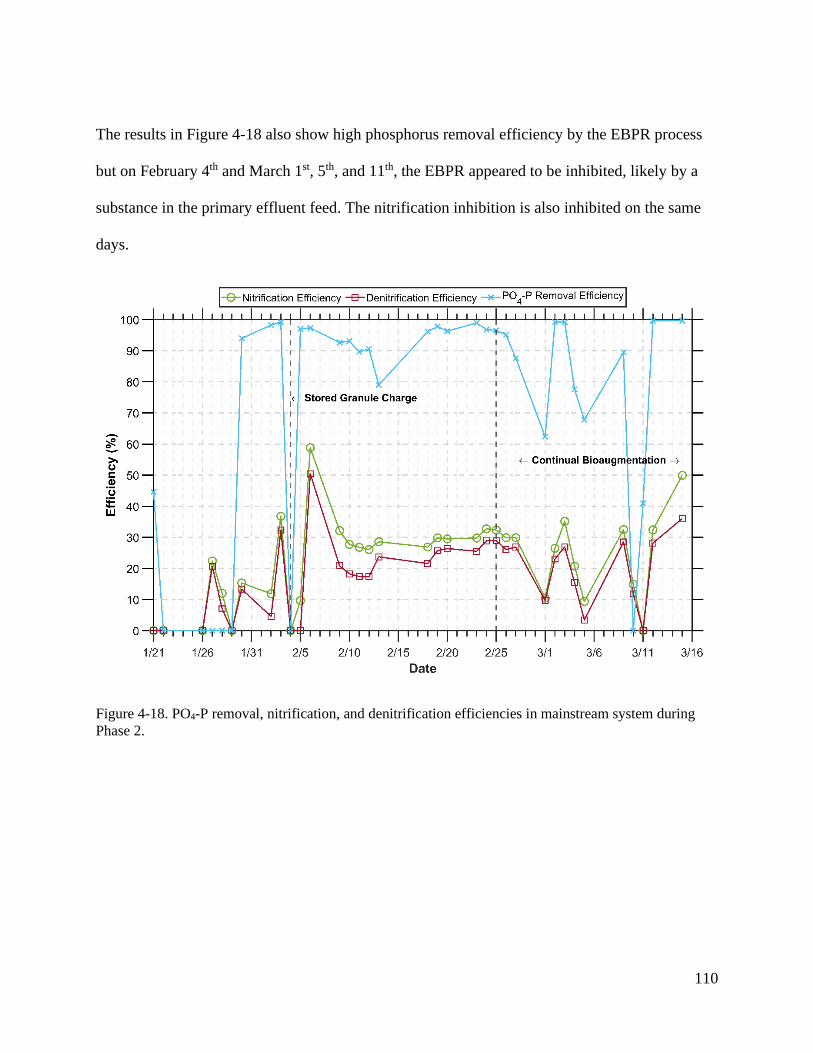
Figure 4-18. PO4-P removal, nitrification, and denitrification efficiencies in mainstream system
during Phase 2. ............................................................................................................................ 110
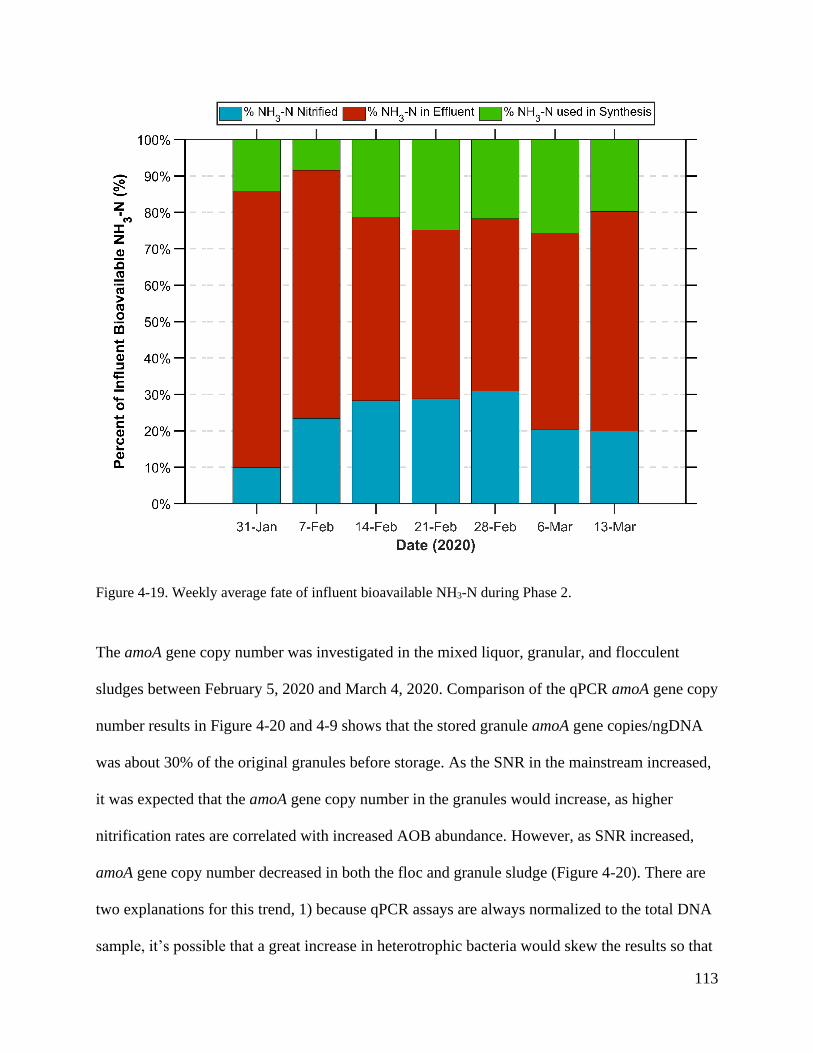
Figure 4-19. Weekly average fate of influent bioavailable NH3-N during Phase 2. .................. 113
Figure 4-20. Mainstream Phase 2 amoA gene copy number for the aeration mixed liquor,
granules, and flocculent sludge and SNR (mgN/gVSS-h) values. (qPCR data provided by Bao
Ngyuen Quoc) ............................................................................................................................. 115
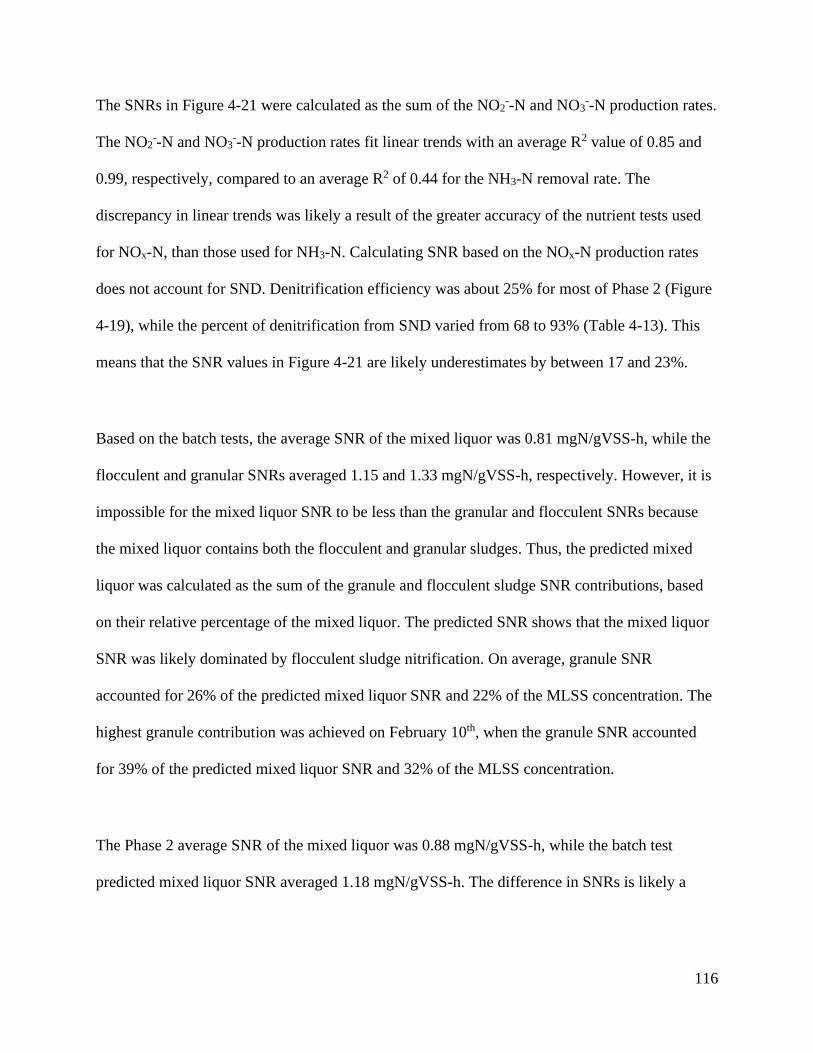
Figure 4-21. Phase 2 specific nitrification rate (SNR) calculated from NOx-N production rates
measured in batch kinetic tests of mainstream mixed liquor samples. The predicted mixed liquor
SNR is based on the rates of the granular and flocculent sludges and their percent abundance in
the mixed liquor. ......................................................................................................................... 117
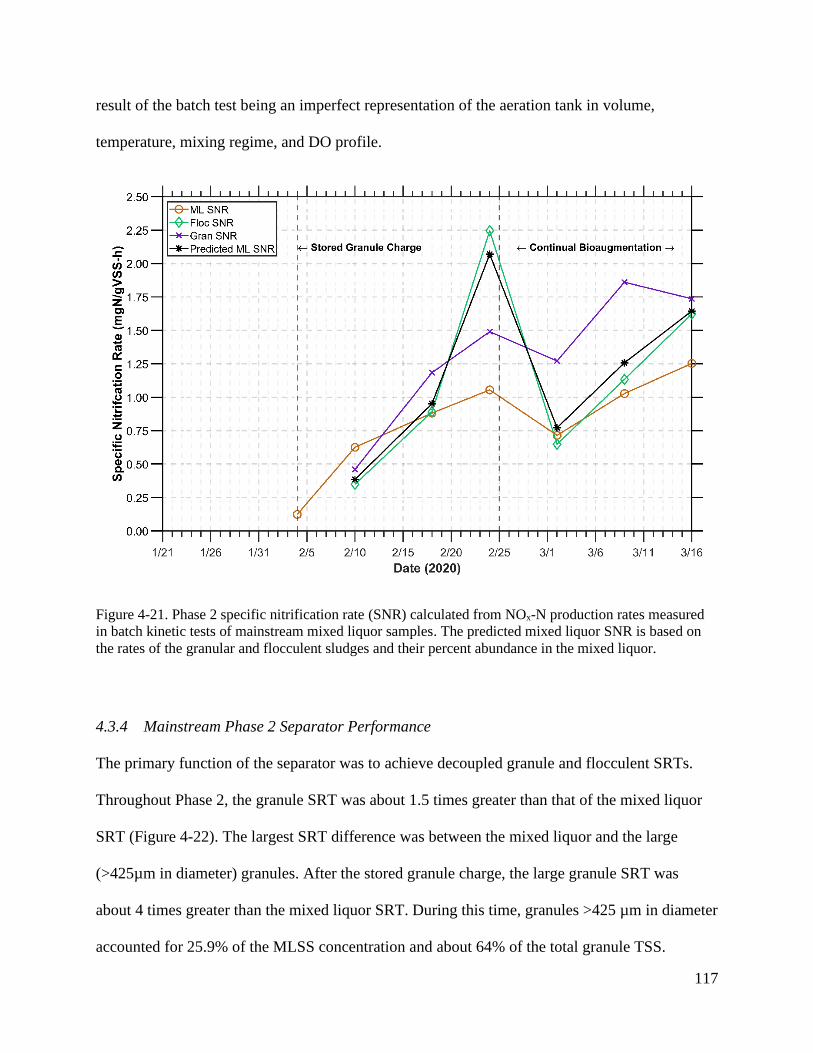
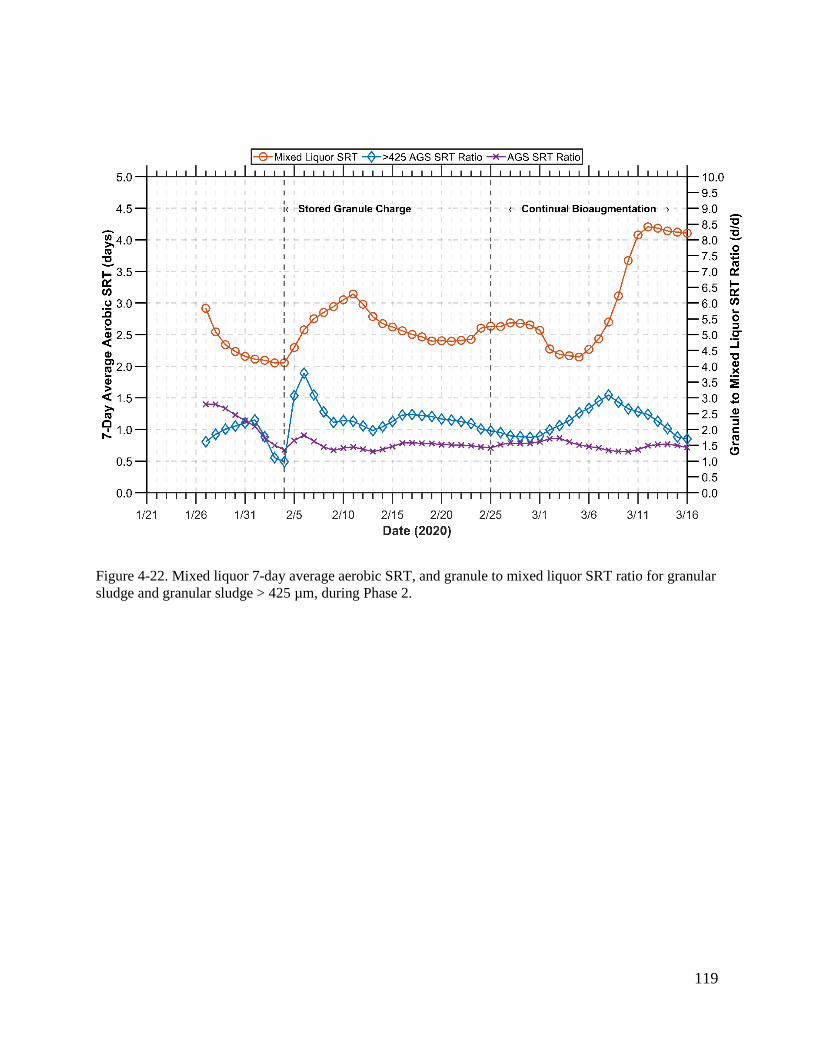
Figure 4-22. Mixed liquor 7-day average aerobic SRT, and granule to mixed liquor SRT ratio for
granular sludge and granular sludge > 425 µm, during Phase 2. ................................................ 119
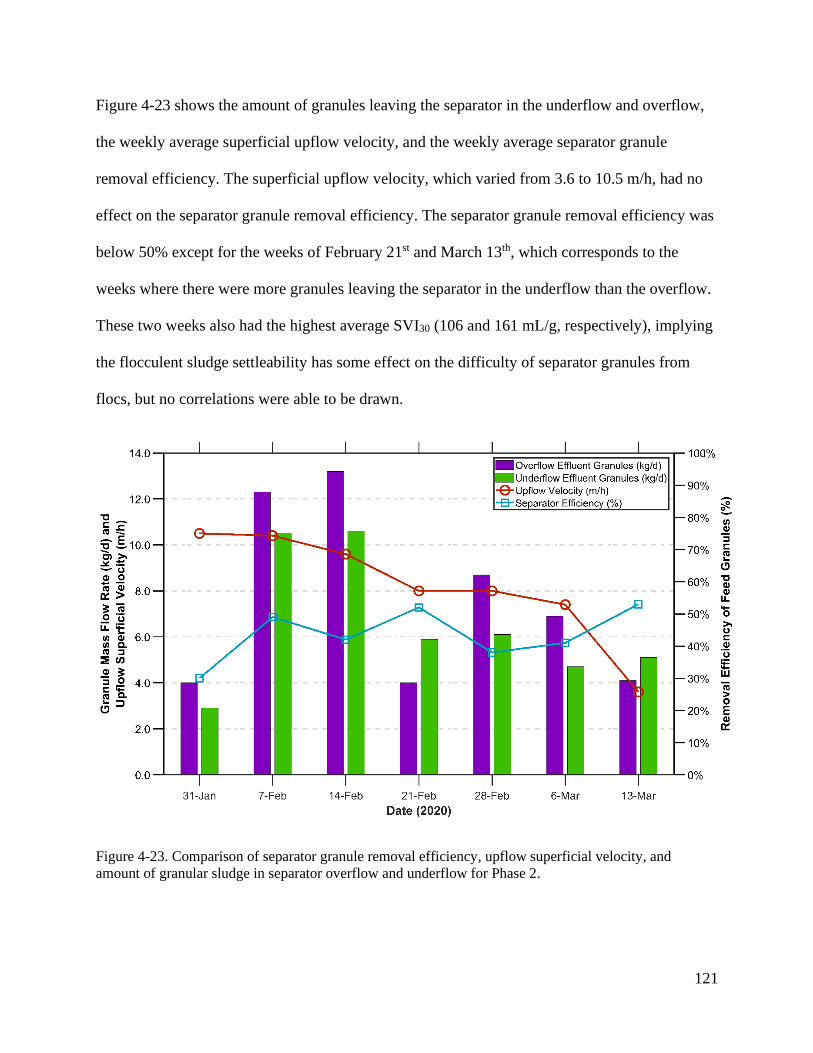
Figure 4-23. Comparison of separator granule removal efficiency, upflow superficial velocity,
and amount of granular sludge in separator overflow and underflow for Phase 2. .................... 121
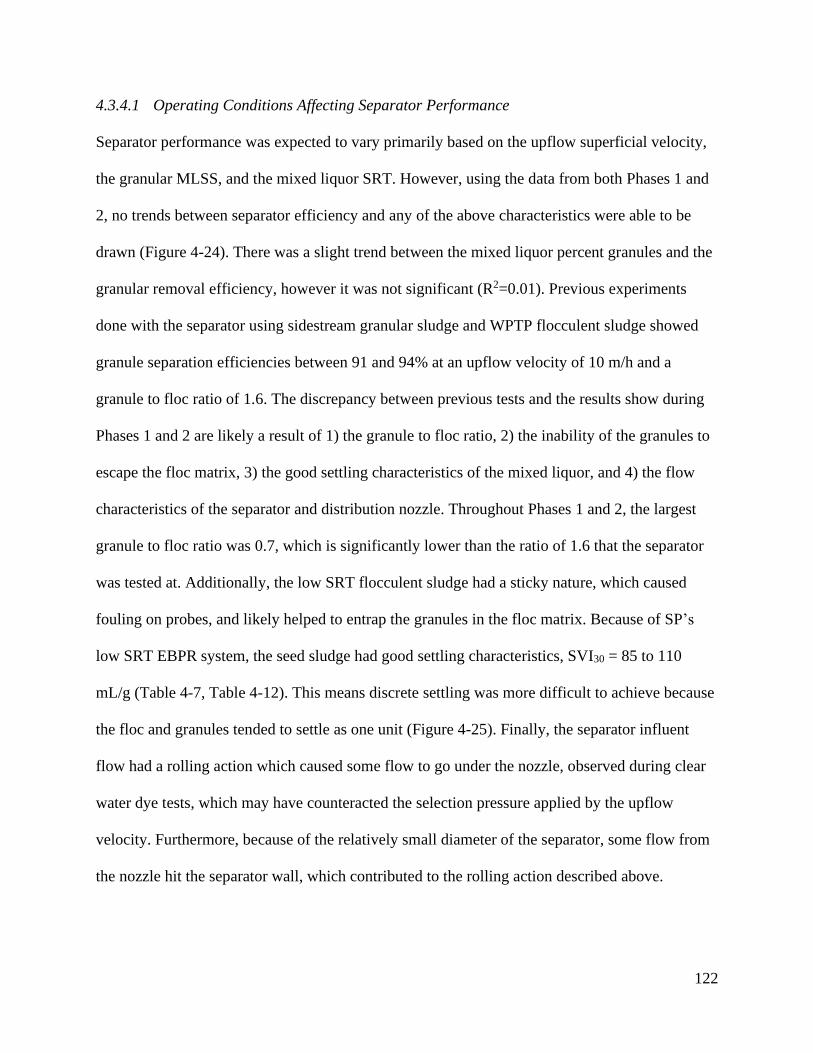
Figure 4-24. Removal efficiency of feed granules correlated to upflow velocity and mixed liquor
percent granules, data from Phases 1 and 2 is used. ................................................................... 123
..................................................................................................................................................... 124
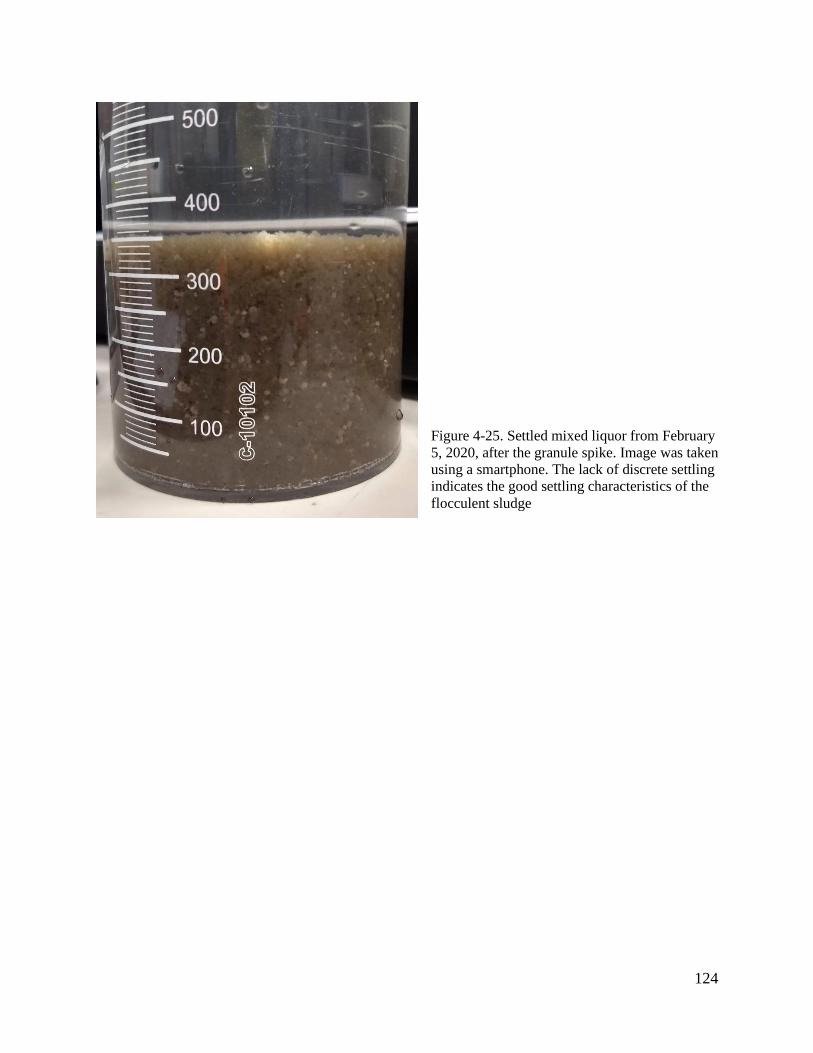
Figure 4-25. Settled mixed liquor from February 5, 2020, after the granule spike. Image was
taken using a smartphone. The lack of discrete settling indicates the good settling characteristics
of the flocculent sludge ............................................................................................................... 124
Page 15
9
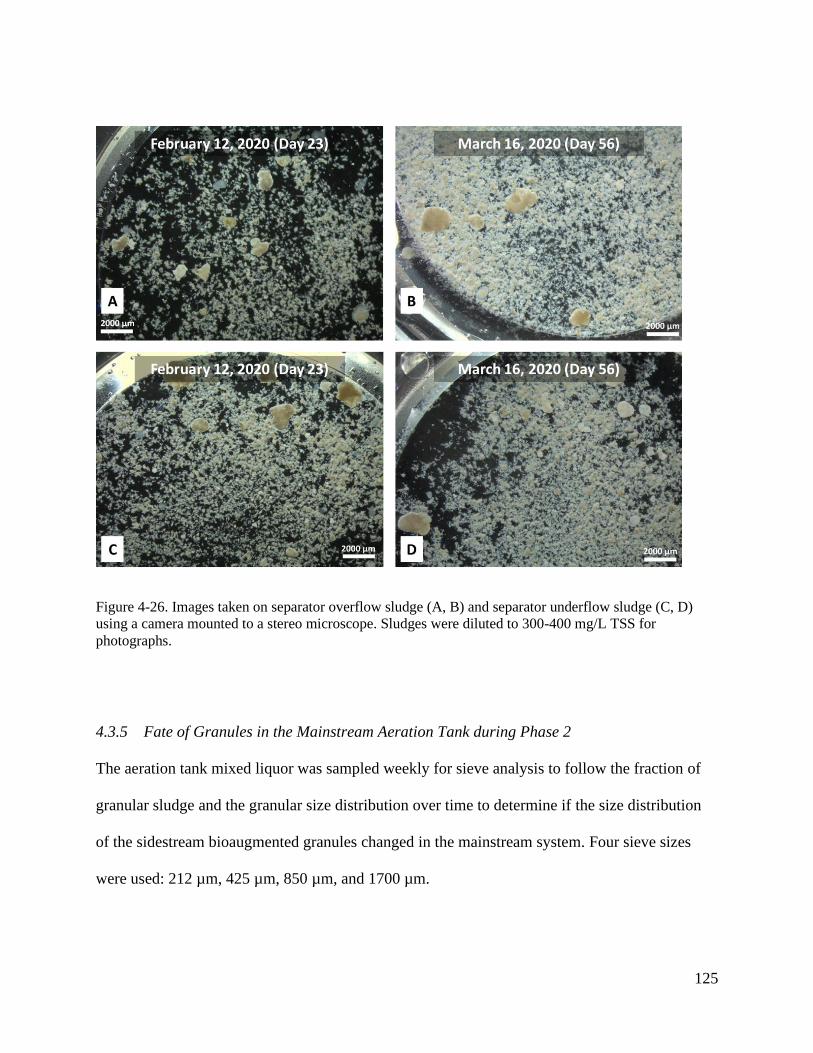
Figure 4-26. Images taken on separator overflow sludge (A, B) and separator underflow sludge
(C, D) using a camera mounted to a stereo microscope. Sludges were diluted to 300-400 mg/L
TSS for photographs. .................................................................................................................. 125
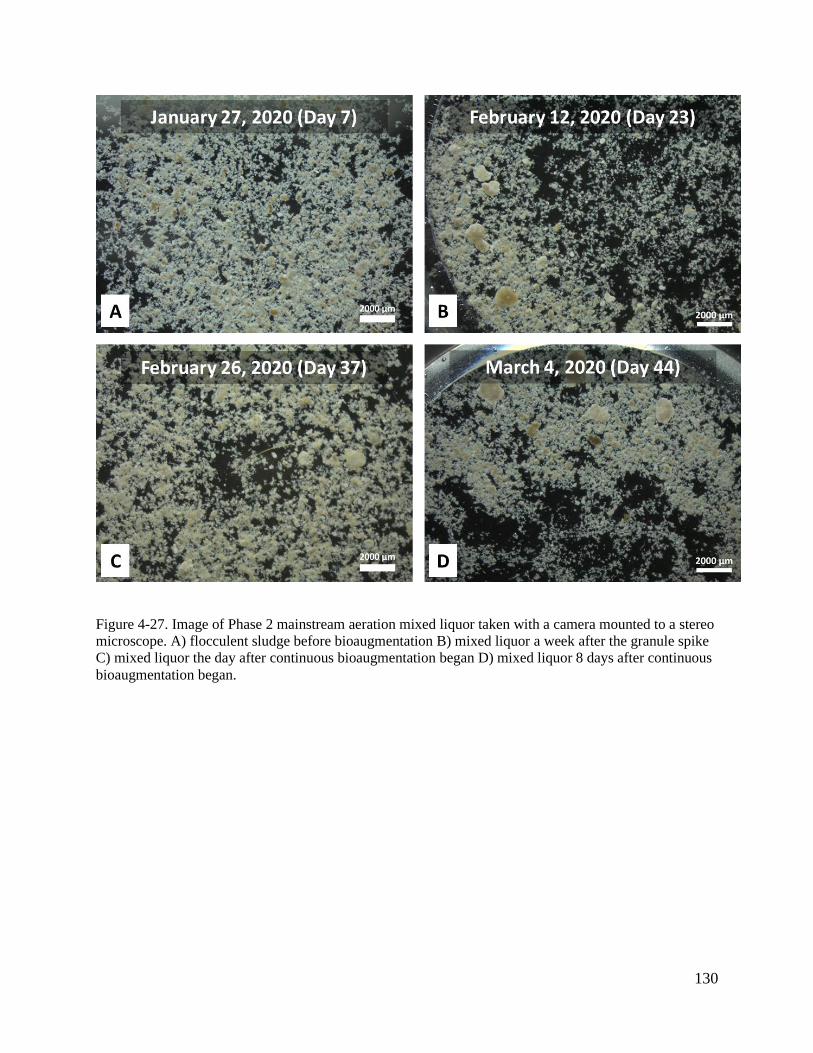
Figure 4-27. Image of Phase 2 mainstream aeration mixed liquor taken with a camera mounted to
a stereo microscope. A) flocculent sludge before bioaugmentation B) mixed liquor a week after
the granule spike C) mixed liquor the day after continuous bioaugmentation began D) mixed
liquor 8 days after continuous bioaugmentation began. ............................................................. 130
List of Tables
Table 2-1. Lab-scale studies of NOB suppression using DO:NH3-N ratio, with airlift granular
sludge reactors. ............................................................................................................................. 16
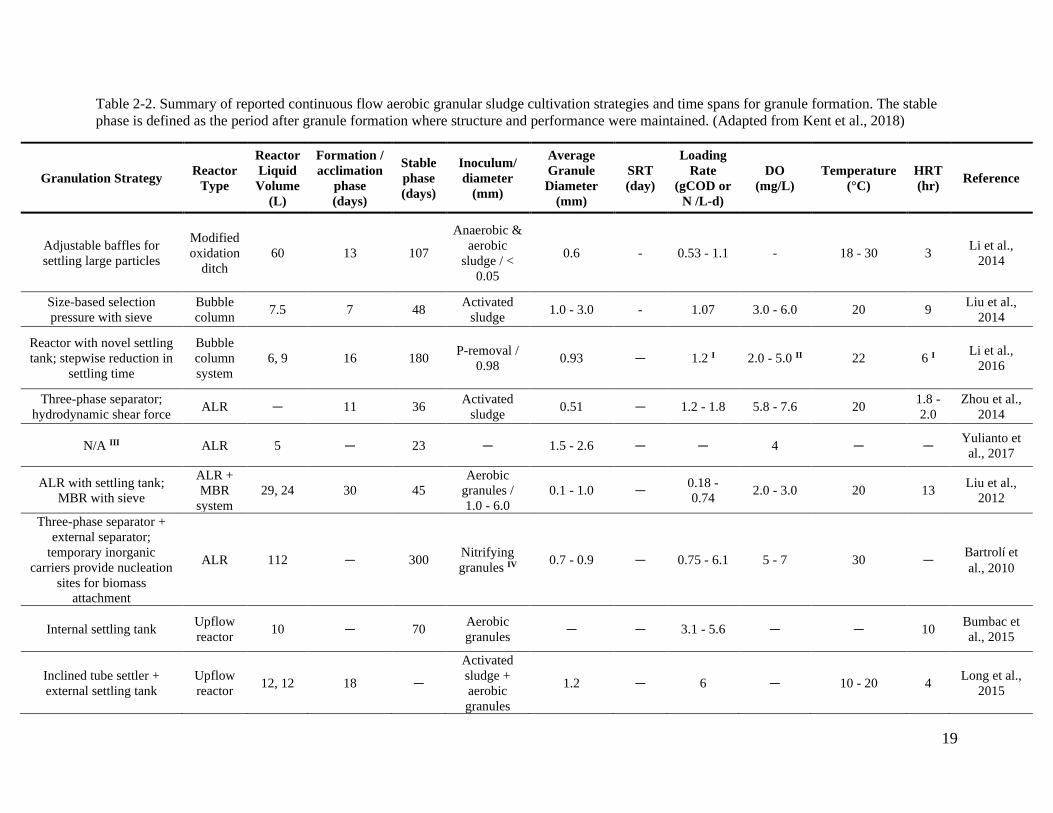
Table 2-2. Summary of reported continuous flow aerobic granular sludge cultivation strategies
and time spans for granule formation. The stable phase is defined as the period after granule
formation where structure and performance were maintained. (Adapted from Kent et al., 2018) 19
Table 3-1. Anaerobic N2 mixing and baseline air mixing rates, sparge rates, and gas superficial
upflow velocities. .......................................................................................................................... 25
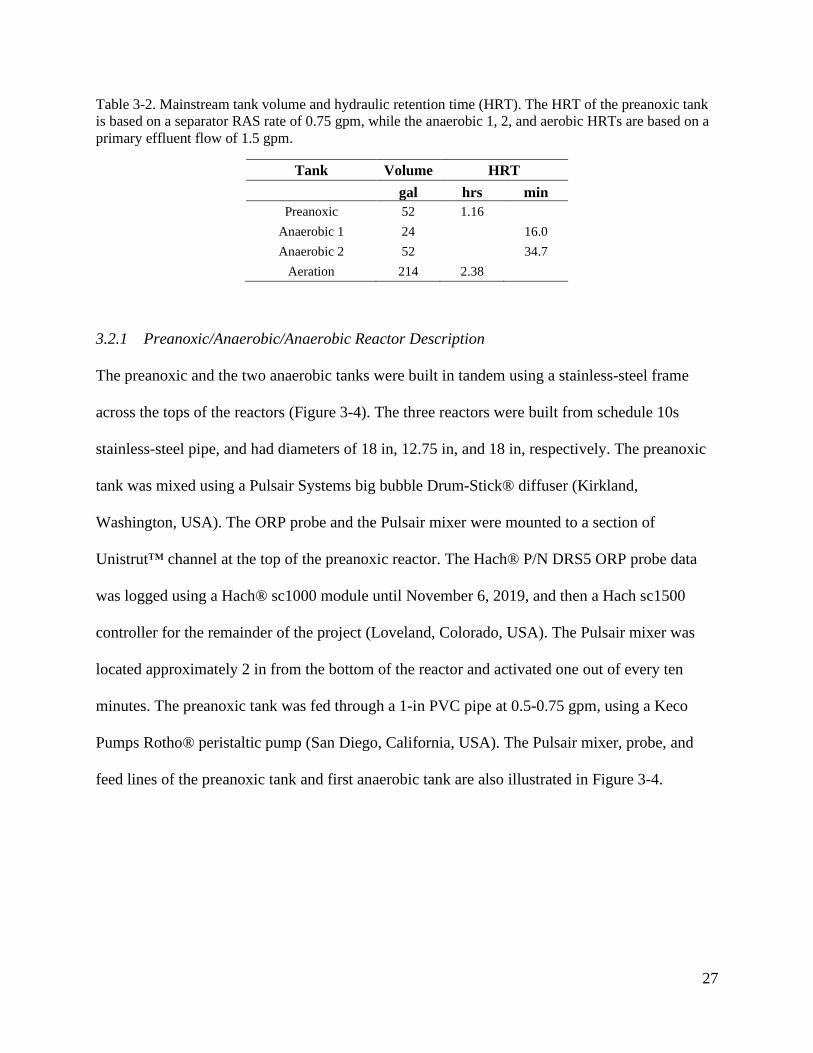
Table 3-2. Mainstream tank volume and hydraulic retention time (HRT). The HRT of the
preanoxic tank is based on a separator RAS rate of 0.75 gpm, while the anaerobic 1, 2, and
aerobic HRTs are based on a primary effluent flow of 1.5 gpm. .................................................. 27
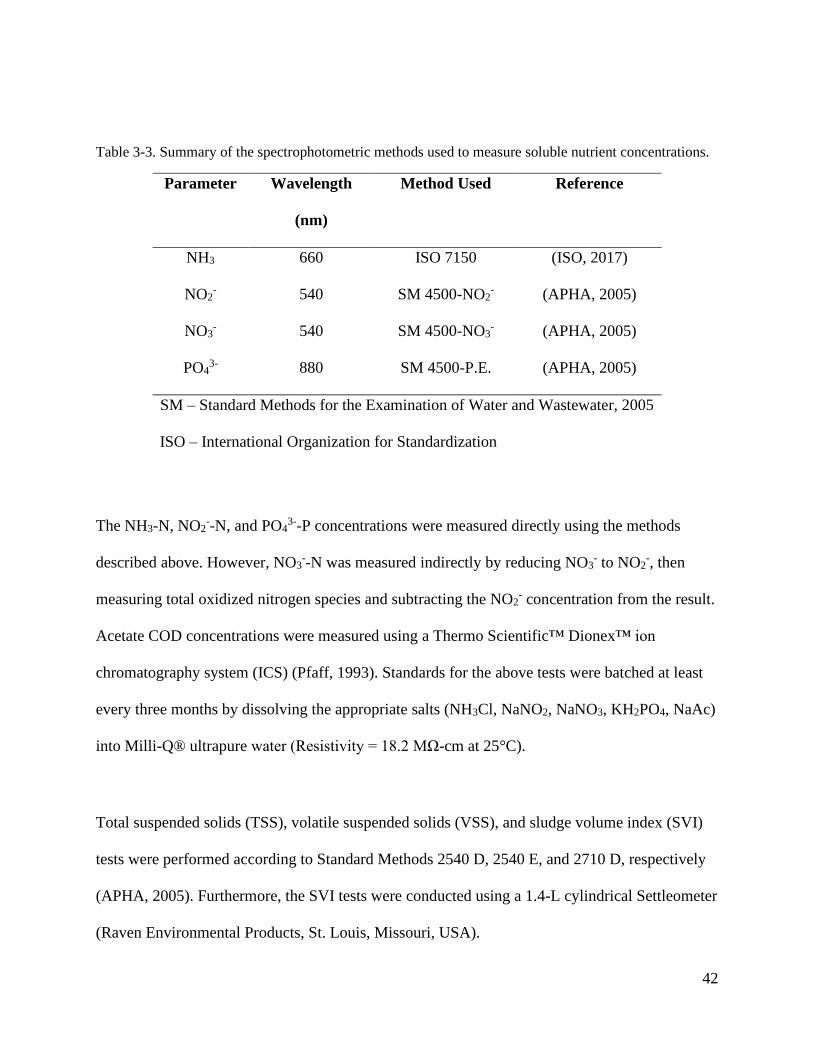
Table 3-3. Summary of the spectrophotometric methods used to measure soluble nutrient
concentrations. .............................................................................................................................. 42
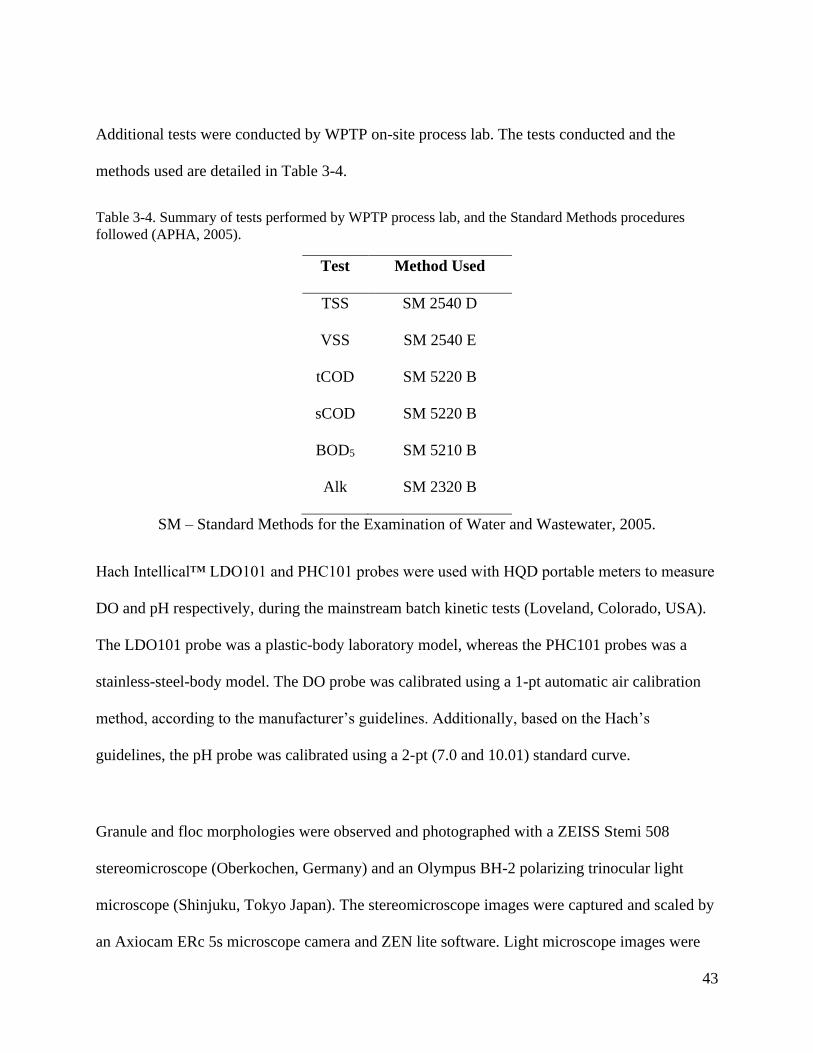
Table 3-4. Summary of tests performed by WPTP process lab, and the Standard Methods
procedures followed (APHA, 2005). ............................................................................................ 43
Page 16
10
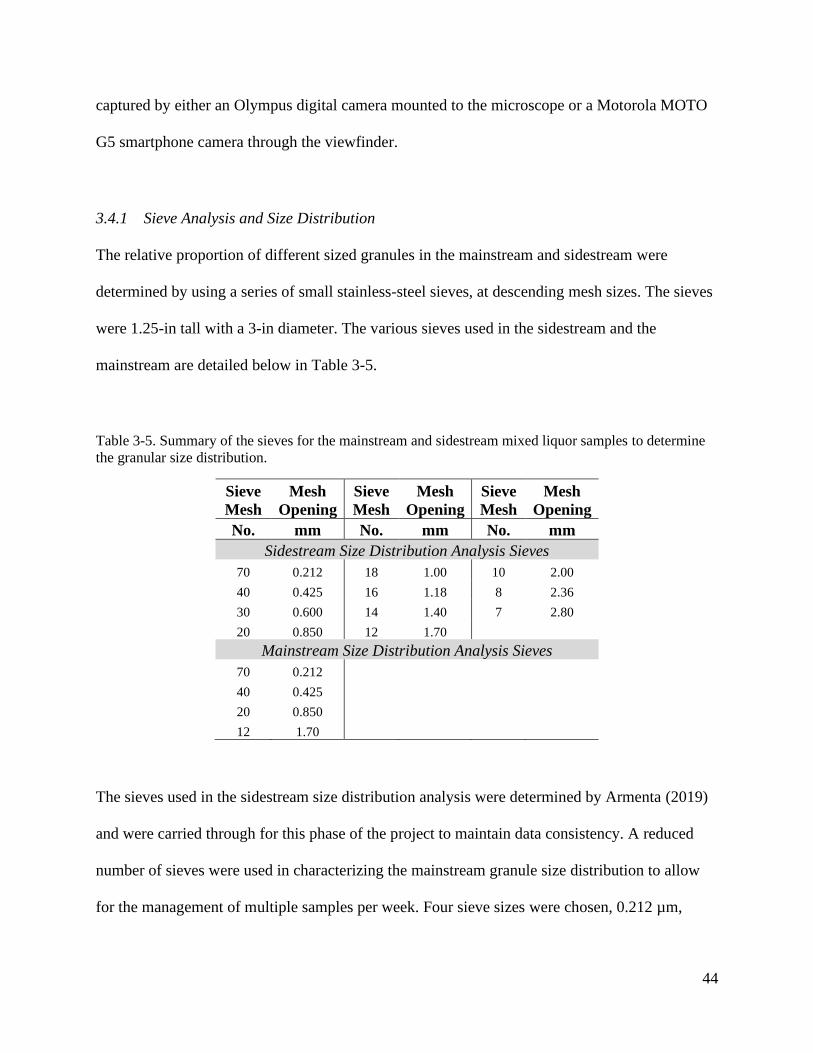
Table 3-5. Summary of the sieves for the mainstream and sidestream mixed liquor samples to
determine the granular size distribution. ....................................................................................... 44
Table 3-6. Primers used for qPCR (provided by Bao Nguyen Quoc). ......................................... 47
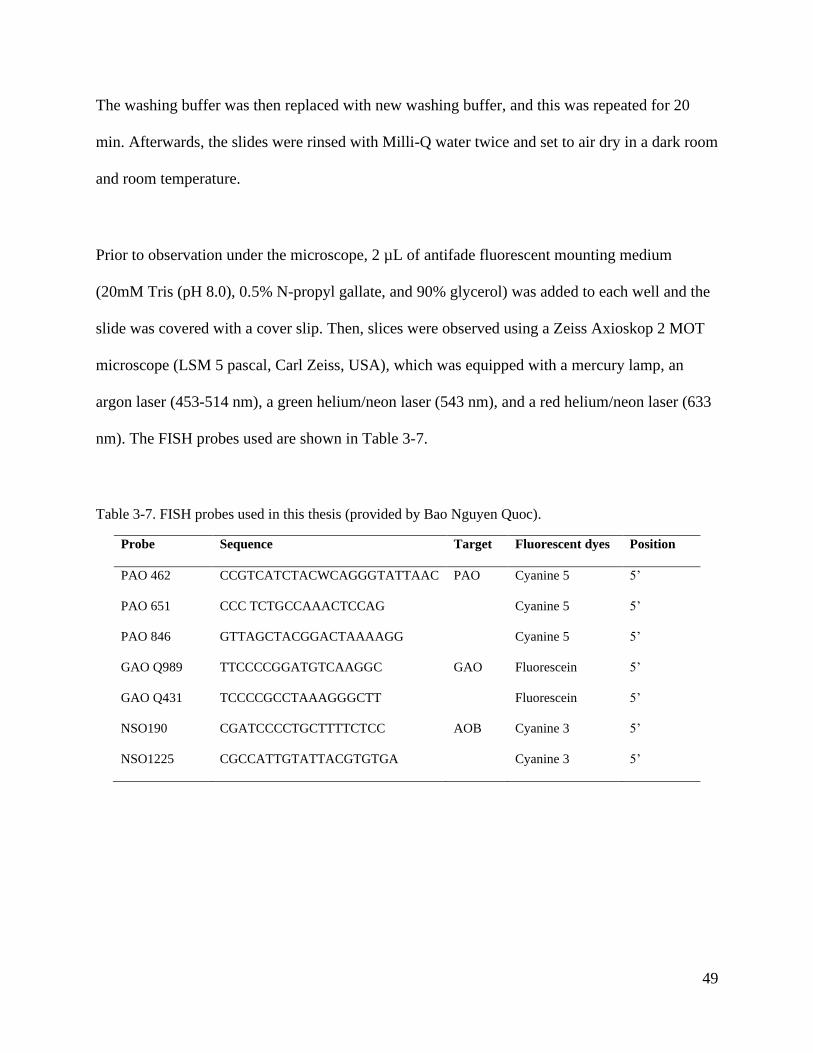
Table 3-7. FISH probes used in this thesis (provided by Bao Nguyen Quoc). ............................. 49
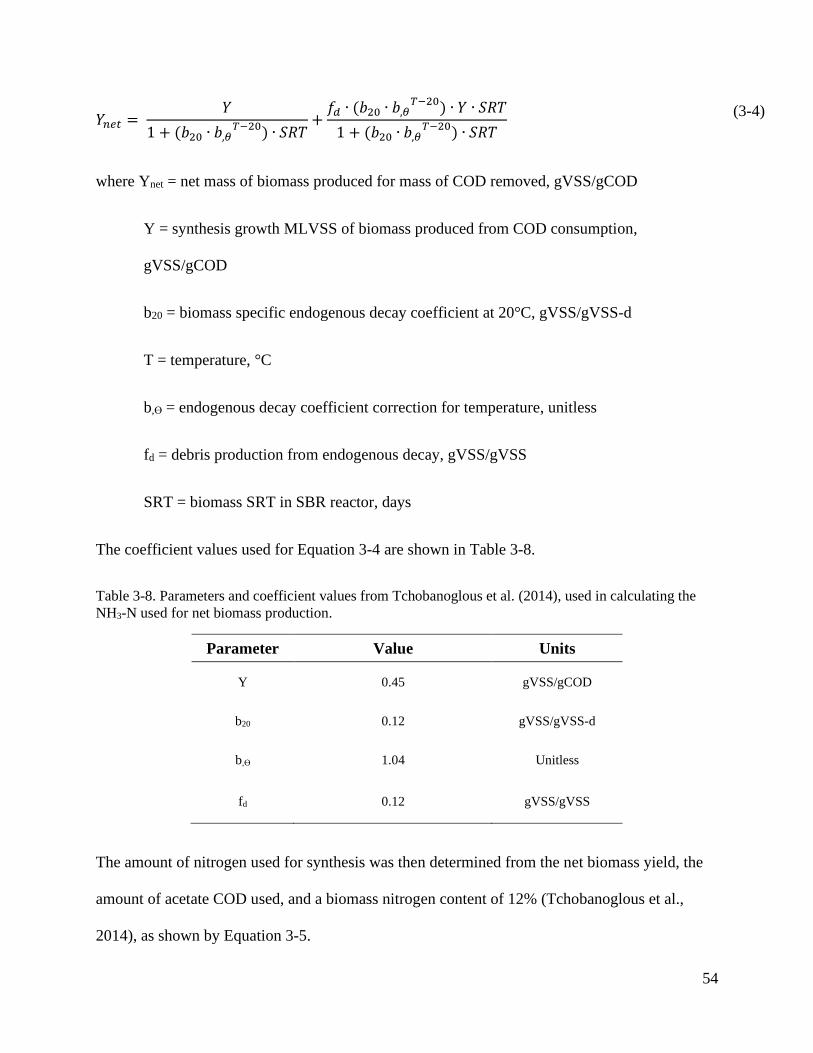
Table 3-8. Parameters and coefficient values from Tchobanoglous et al. (2014), used in
calculating the NH3-N used for net biomass production. ............................................................. 54
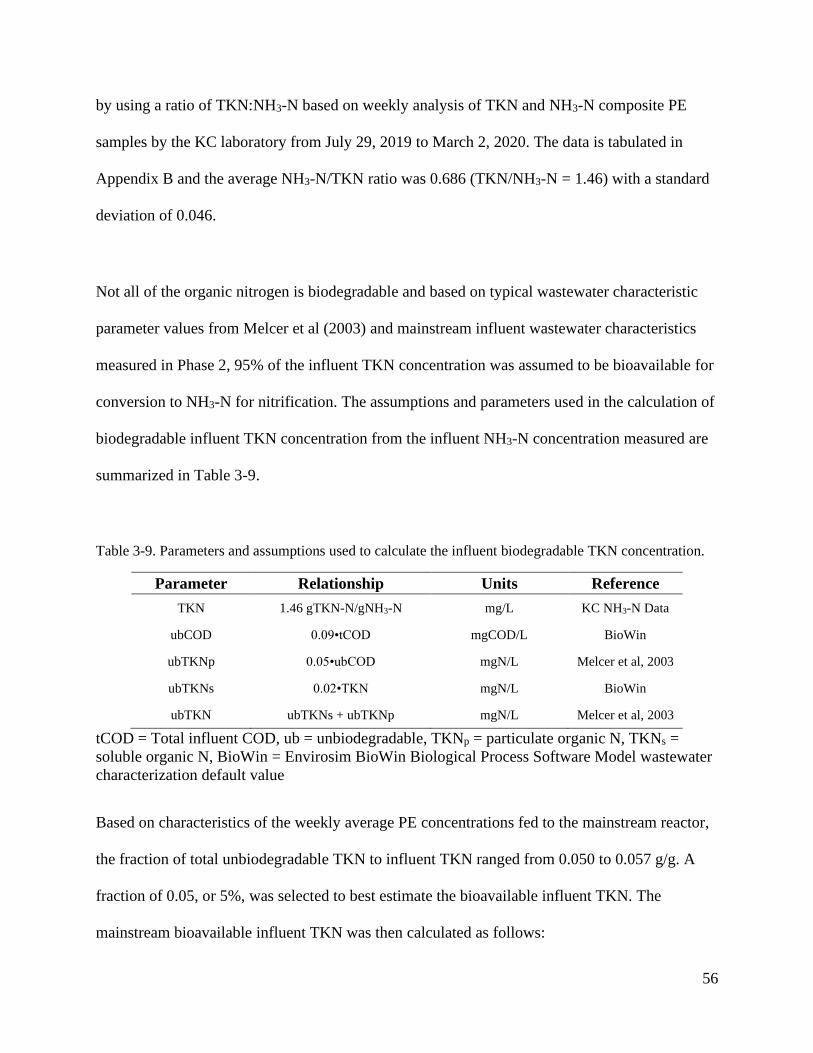
Table 3-9. Parameters and assumptions used to calculate the influent biodegradable TKN
concentration. ................................................................................................................................ 56
Table 4-1. Summary of the target operating conditions for the sidestream reactor from September
1, 2019 to March 16, 2020. ........................................................................................................... 64
Table 4-2. Monthly average treatment performance for the sidestream reactor between Sep 1,
2019 and Dec 31, 2019 (standard deviation in parenthesis). ........................................................ 68
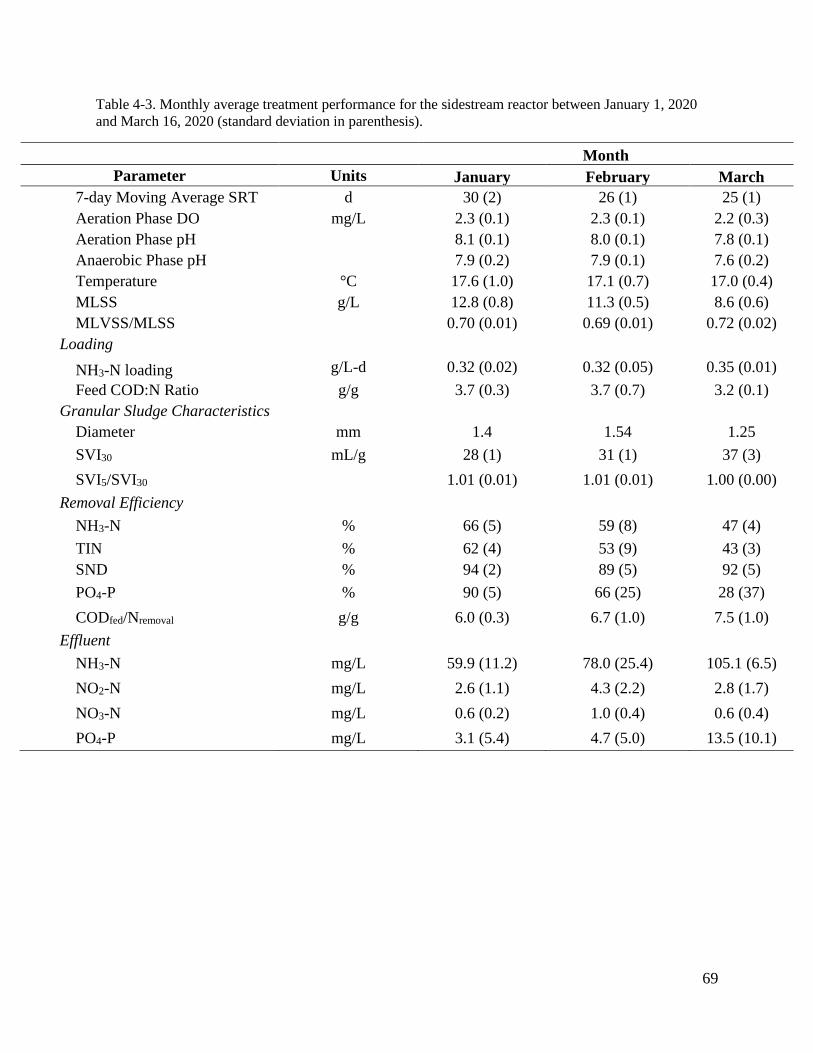
Table 4-3. Monthly average treatment performance for the sidestream reactor between January 1,
2020 and March 16, 2020 (standard deviation in parenthesis). .................................................... 69
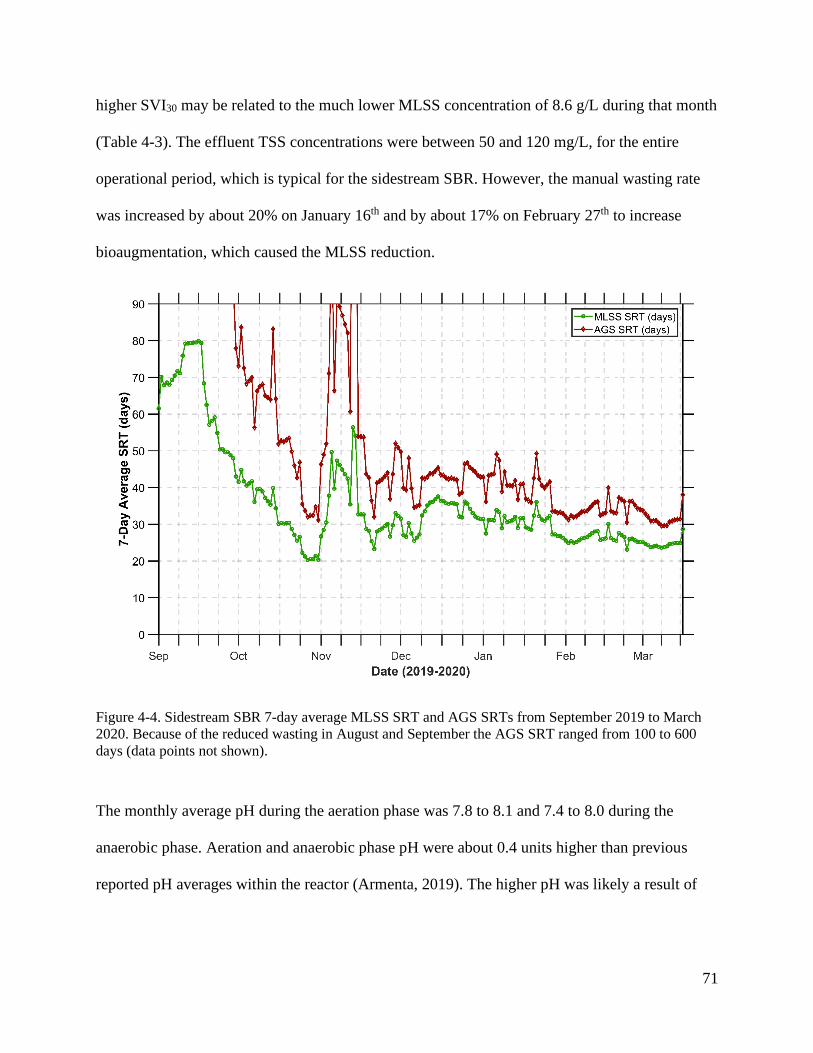
Table 4-4. Average monthly granule sludge characteristics for the sidestream reactor (standard
deviation in parenthesis). .............................................................................................................. 72
Table 4-5. Average monthly ammonia loading rate, aeration phase DO, granular sludge
characteristics, and nitrification rate (standard deviation in parenthesis). .................................... 79
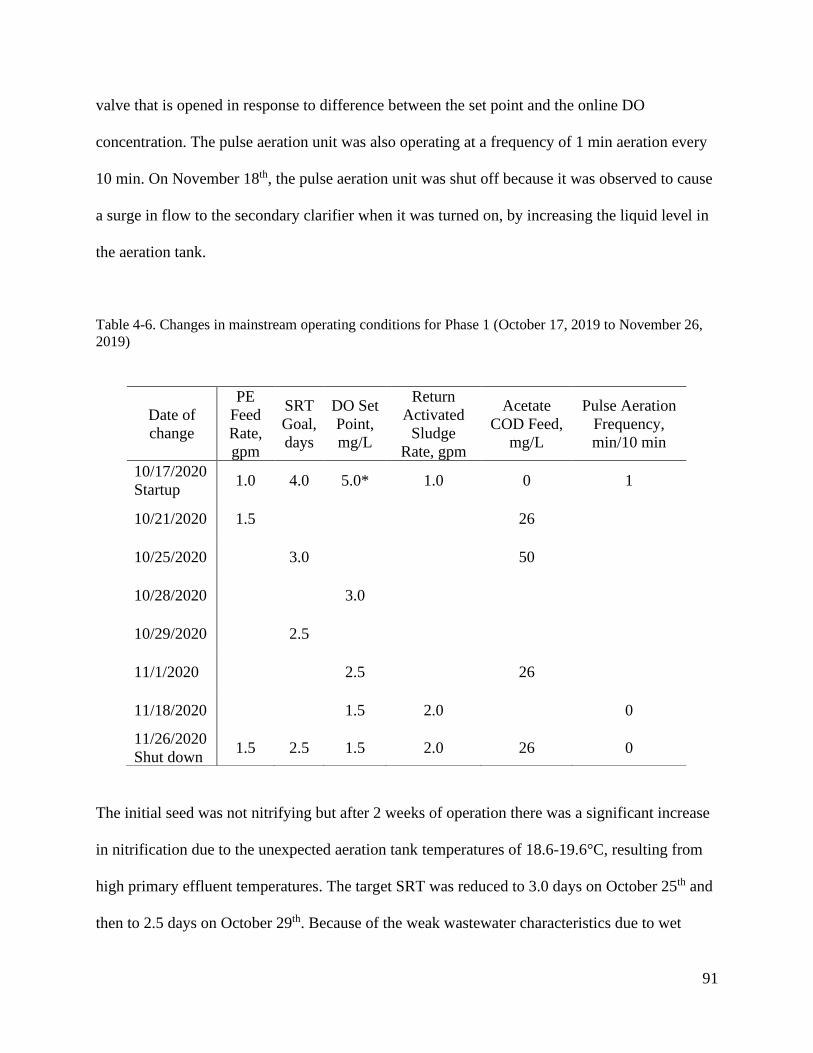
Table 4-6. Changes in mainstream operating conditions for Phase 1 (October 17, 2019 to
November 26, 2019) ..................................................................................................................... 91
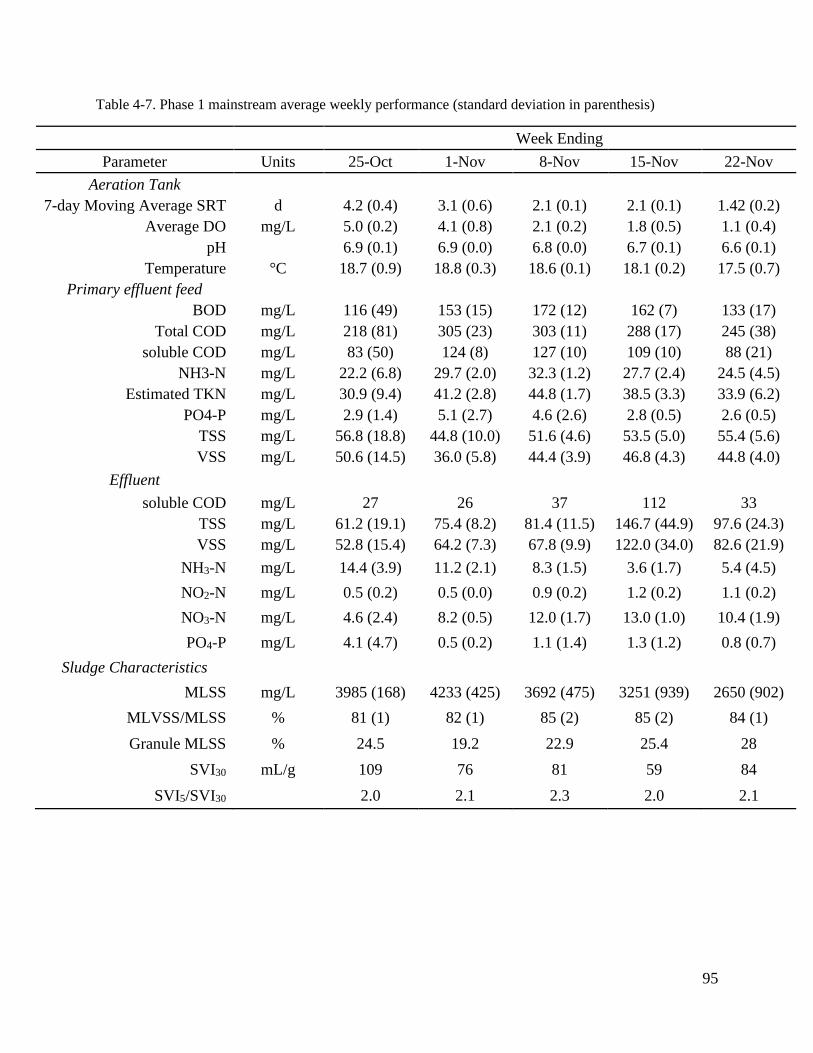
Table 4-7. Phase 1 mainstream average weekly performance (standard deviation in parenthesis)
....................................................................................................................................................... 95
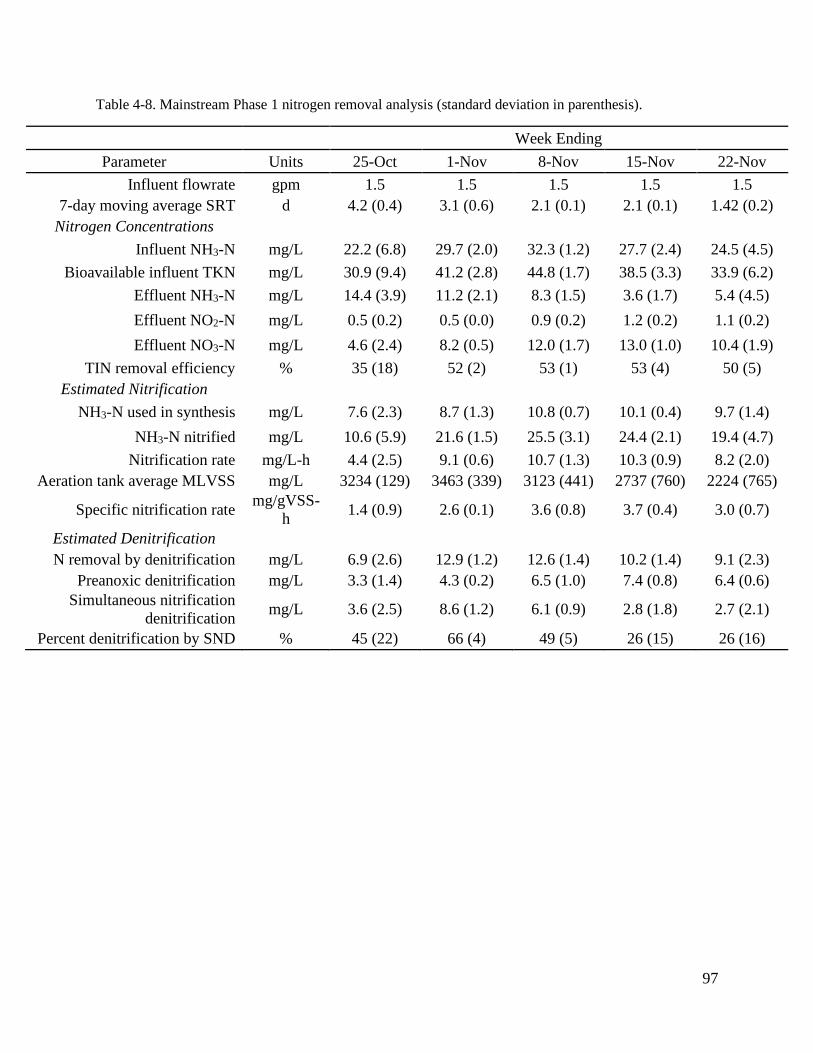
Table 4-8. Mainstream Phase 1 nitrogen removal analysis (standard deviation in parenthesis). . 97
Page 17
11
Table 4-9. Weekly average performance of the mainstream hydraulic separator for Phase 1
(standard deviation in parenthesis). ............................................................................................ 101
Table 4-10. Weekly mainstream aeration tank granular sludge characteristics in Phase 1
(standard deviation in parenthesis). ............................................................................................ 102
Table 4-11. Changes in mainstream operating conditions for Phase 2 (January 21, 2020 to March
16, 2020). .................................................................................................................................... 104
Table 4-12. Average weekly performance for the mainstream system in Phase 2 (standard
deviation in parenthesis). ............................................................................................................ 107
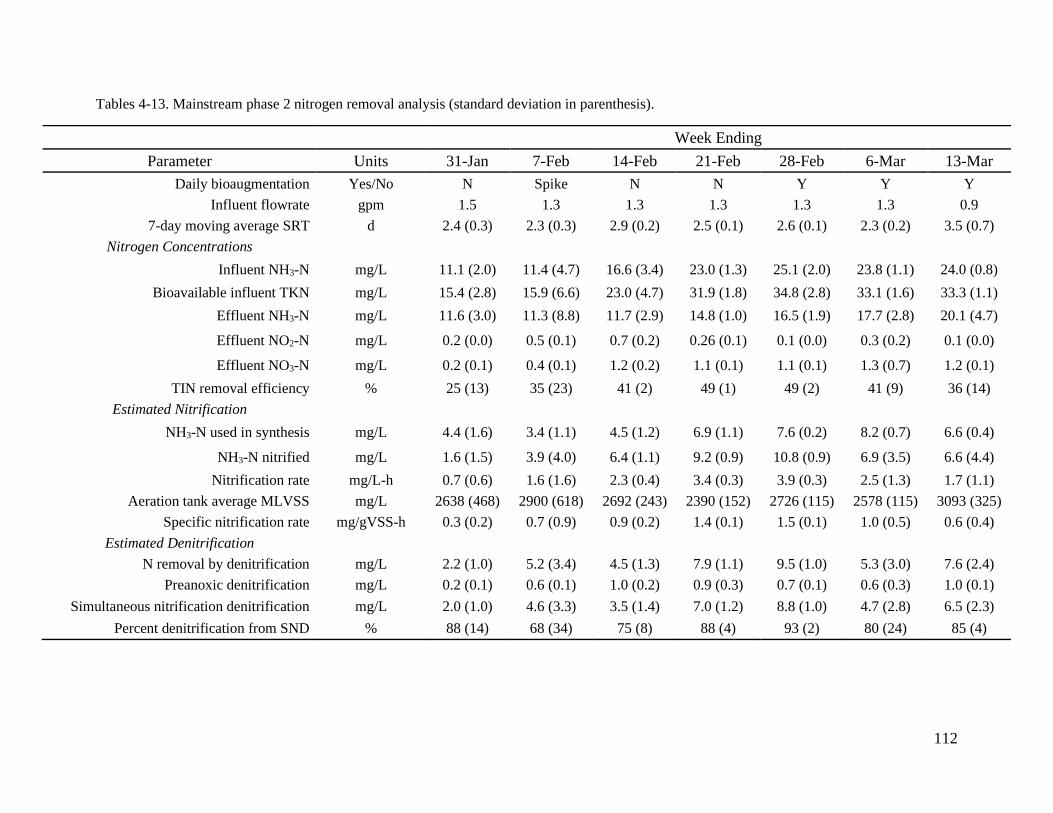
Tables 4-13. Mainstream phase 2 nitrogen removal analysis (standard deviation in parenthesis).
..................................................................................................................................................... 112
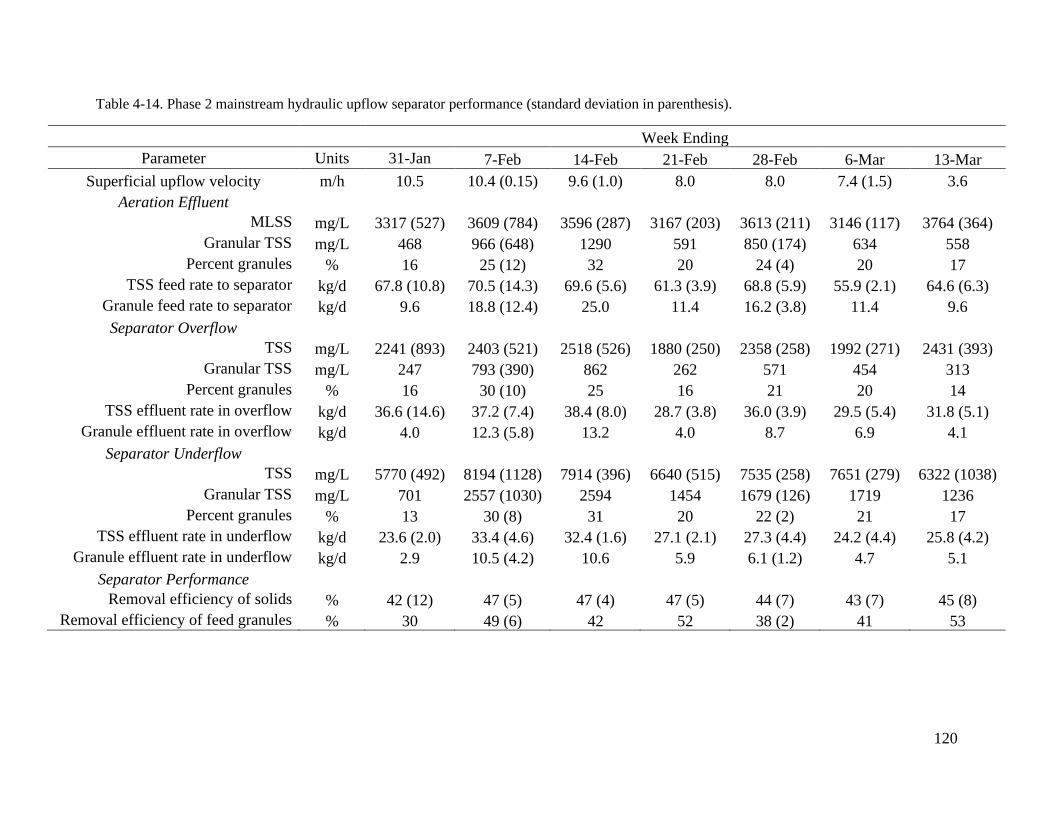
Table 4-14. Phase 2 mainstream hydraulic upflow separator performance (standard deviation in
parenthesis). ................................................................................................................................ 120
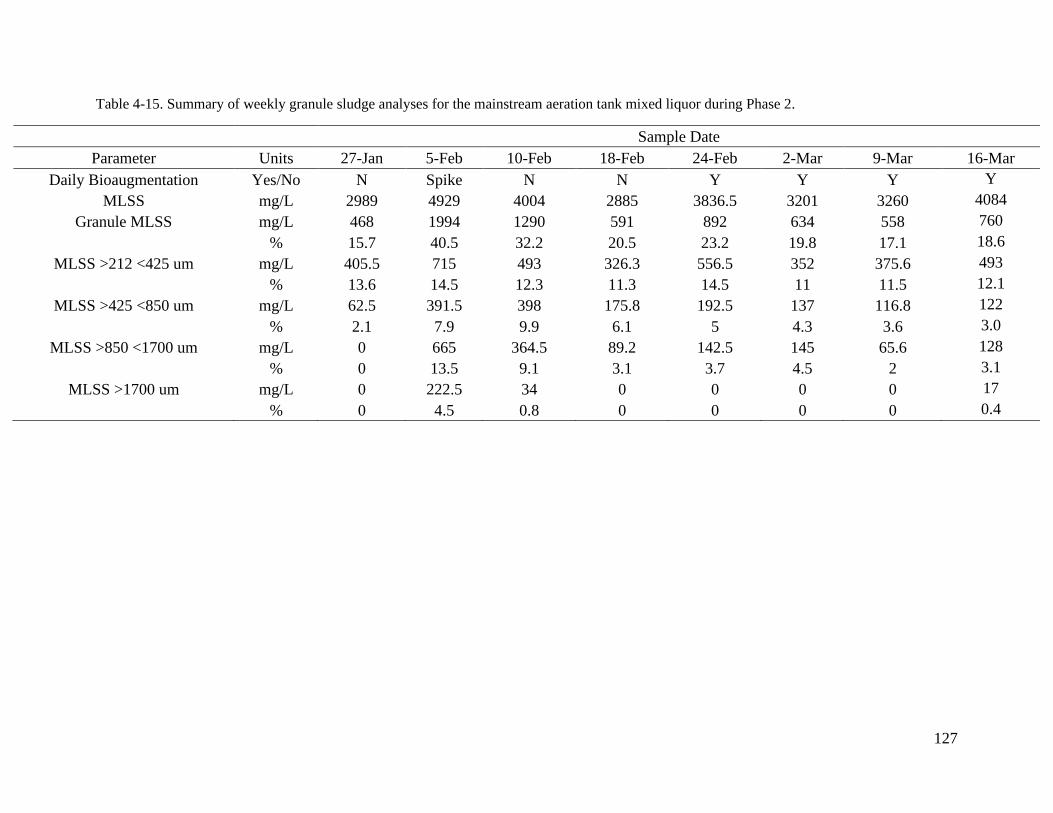
Table 4-15. Summary of weekly granule sludge analyses for the mainstream aeration tank mixed
liquor during Phase 2. ................................................................................................................. 127
Page 18
12
List of Acronyms
AGS aerobic granular sludge
AN anaerobic
AO anoxic
AOB ammonia oxidizing bacteria
BOD biological oxygen demand (5-day)
CAS conventional activated sludge
CFAS continuous flow activated sludge
COD chemical oxygen demand
DO dissolved oxygen
EBPR enhanced biological phosphorus removal
FISH fluorescence in situ hybridization
GAO glycogen accumulating organisms
HRT hydraulic retention time
ISO International Organization for Standardization
KC King County
MLSS mixed liquor suspended solids
MLVSS mixed liquor volatile suspended solids
NDN nitrifying and denitrifying
NOB nitrite oxidizing bacteria
NRT nominal retention time
PAO polyphosphate accumulating organism
Page 19
13
pH negative log10c, where c is the hydrogen ion concentration in moles per liter
PHA Polyhydroxyalkanoate
PVC polyvinyl chloride
qPCR quantitative polymerase chain reaction
RAS return activated sludge
SBR sequencing batch reactor
SM Standard Methods for Examination of Water and Wastewater
SNR specific nitrification rate
SP South Plant
SRT solids retention time
SVI sludge volume index
VER volume exchange ratio
VSS volatile suspended solids
TIN total inorganic nitrogen
TKN total Kjeldahl nitrogen
TSS total suspended solids
WPTP West Point Treatment Plant
WRRF water resource recovery facility
List of Units and Symbols
% percent
°C degrees Celsius
Page 20
14
d day(s)
ft foot/feet
gal gallon(s)
gpm gallons per minutes
Hp horsepower
hr hour
in inch(es)
L liter(s)
m meter(s)
min minute(s)
rpm rotations per minute
scfm standard cubic feet per minute
Page 21
1
1 Introduction and Objectives
As environmental awareness spreads, there is an increasing desire for the expansive cities we
live in to exist in harmony with the earth. To bring our cities closer to environmental neutrality
our waste must be effectively treated to minimize negative impact on the ecosystem. This goal
has driven greater restrictions on nutrient effluent limits from water resource recovery facilities
(WRRFs), to prevent eutrophication of the surrounding waters. A move towards intensification
of biological wastewater treatment to provide greater treatment capacity in existing tankage
without increasing footprint has led to interest and research into aerobic granular sludge (AGS).
AGS has the potential to increase the capacity and biological nutrient removal capability of
existing continuous flow activated sludge (CFAS) WRRFs.
The use of AGS may be able to mitigate the high cost and construction complexity associated
with upgrading existing CFAS systems for nutrient removal. Many existing systems may require
additional tank volume for nitrogen removal because the autotrophic bacteria required that
oxidize ammonia (NH3) to nitrite (NO2-) and nitrate (NO3
-) (nitrification) are slow growers and
require solid retention times (SRTs) that are 2-3 times longer than that for BOD removal. Longer
SRTs require greater tank volume and associated costs which may be difficult to achieve in
WRRFs that exist in well-established residential and industrial areas with limited space. Growing
nitrifying AGS in sidestream treatment of anaerobic digester sludge dewatering centrate and
feeding the nitrifying AGS into an existing low-SRT CFAS process could enable or increase
nitrogen removal with little or no additional tank volume. The process described above is
referred to as bioaugmentation and has been demonstrated at full scale for a flocculent sludge
system with nitrifying bacteria grown in an aerobic sidestream reactor treating anaerobic
Page 22
2
digestion centrate with the flocculent sludge produced fed to the mainstream activated sludge
process (Bowden et al., 2016). Flocculent sludge bioaugmentation however, has provided a
limited improvement in nitrification because the bioaugmented flocculent sludge has the same
SRT as the CFAS system.
The physical characteristics of AGS provide a number of possible improvements for nutrient
removal with activated sludge treatment. The dense spherical morphology of AGS results in a
much higher settling velocity than that of flocculent sludge, and thus AGS has the potential for
decoupling the SRT of bioaugmented granules and mainstream flocculent sludge. Under
appropriate conditions, it is possible to separate bioaugmented AGS from the AGS/flocculent
sludge mixed liquors. AGS consists of deep dense biofilms, which result in oxygen and substrate
gradients from aerobic conditions at the surface to anoxic and anaerobic conditions further in the
biofilm. The different redox conditions with depth allow nitrification, denitrification, and
enhanced biological phosphorus removal (EBPR) to be performed within a single granule. The
improved settling and thickening ability of AGS allows systems to carry a higher mixed liquor
suspended solids (MLSS) concentration and thus greater treatment capacity and nutrient removal
from AGS bioaugmentation.
Growth and nutrient removal by AGS with nitrification, denitrification, and EBPR by
polyphosphate accumulating organisms (PAOs) (referred to as PAO-NDN granules) in a bench-
scale sequencing batch reactor (SBR) was demonstrated by Figdore et al. (2018a). Additionally,
short-cut nitrogen removal and EBPR were demonstrated by AGS bioaugmentation in a low SRT
non-nitrifying flocculent sludge SBR from granules grown in a sidestream SBR treating digester
Page 23
3
centrate. Short-cut nitrogen removal refers to NO2- being converted directly to N2 gas, instead of
being converted to NO3- first. The findings by Figdore et al. (2018a) confirmed the potential of
bioaugmentation with decoupled SRTs. However, the simulated mainstream system was an SBR
fed synthetic wastewater. Further research was needed to evaluate the feasibility of AGS
bioaugmentation treating real wastewater in a CFAS system.
To-date AGS has found success in full-scale SBRs, namely Nereda®, but there is much interest
in applying the technology in the more commonly used CFAS systems (Pronk et al., 2015; Kent
et al., 2018). The technologies that have been applied to mainstream sludge densification, which
were summarized by Kent et al. (2018), are hydrocyclones, sieves, and hydraulic designs for
gravity separation. Additionally, AGS growth and treatment was demonstrated in a pilot scale
aerobic-only plug-flow reactor system with a batch separator to selectively retain granules, by
Sun et al. (2019). However, there has been no pilot or full-scale research into the sidestream
bioaugmentation of a CFAS system.
This thesis follows a series of research work started by Bryce Figdore and continued by Maxwell
Armenta aimed at developing a sidestream AGS system with nitrification bioaugmentation to a
mainstream CFAS system with low SRT flocculent sludge and long SRT AGS mixed liquor. At
laboratory scale Figdore (2018a) found that PAO-NDN granules, could be grown on West Point
Treatment Plant (WPTP) centrate and be sustained with effective nitrification in an SBR treating
synthetic wastewater. Armenta (2019) found that sidestream granule PAO-NDN growth could be
sustained for over 1.5 years in a pilot plant SBR treating WPTP centrate with shortcut nitrogen
Page 24
4
removal. The work presented in this thesis and in Armenta (2019) was supported by microbial
work done by Bao Ngyuen Quoc, a UW PhD candidate.
The major objective of this research was to continue the sidestream reactor operation and
investigate the ability for sidestream AGS bioaugmentation to enhance nitrification and nitrogen
removal in a low SRT flocculent sludge mainstream system. The scheme of the mainstream and
sidestream pilot plants is illustrated below in Figure 1-1. The mainstream pilot consisted of an
anoxic reactor, two anaerobic reactors, an aerobic zone, a hydraulic upflow separator, and a
secondary clarifier. The anaerobic zone functions to select for PAOs in the granules, to
encourage granule growth and EBPR. The hydraulic upflow separator was intended to take
advantage of the difference in settling velocities of granular and flocculent sludge, allowing for
the granular sludge to settle out to the bottom and be returned to the anaerobic zone, while the
flocculent sludge exits in the separator overflow to the secondary clarifier. The secondary
clarifier underflow return activated sludge (RAS) is directed to the aerobic zone.
The sidestream pilot SBR functioned to grow PAO-NDN granules with anaerobic and aerobic
periods to favor PAO and ammonia oxidizing bacteria (AOB) growth. Acetate was fed during
the anerobic phase to foster PAO growth, and the WPTP final effluent dilution water and
centrate were fed at the start of the aerobic phase to grow nitrifiers at close to mainstream
temperature. The WPTP final effluent is after chlorination and dichlorination of secondary
effluent from a BOD-removal only high purity oxygen activated sludge system.
Page 25
5
Figure 1-1. Flow scheme for the sidestream aerobic nitrifying granular sludge bioaugmentation pilot
plant. Granules grown in a sequencing batch reactor (SBR) are fed into the mainstream CFAS system.
Preanoxic, anaerobic, and aerobic zones precede a hydraulic separator and secondary clarifier. The
separator underflow is primarily granular sludge (GSR), while the clarifier return is primarily flocculent
sludge (RAS). Separate waste granular sludge (WGS) and waste activated sludge (WAS) lines allow for
uncoupled SRT control.
The main goals of the sidestream pilot plant investigation were presented by Armenta (2019).
However, as this investigation was concluded, the objectives for the sidestream pilot plant
changed to focus on steady operation at a fixed loading and granule production for
bioaugmentation. The specific goals were as follows:
1. Continue sidestream operation at an NH3-N loading of 0.35 g/L-d and a 25-day SRT, to
represent the typical proportion of plant N treated in the sidestream.
2. Maintain shortcut N removal and evaluate the COD:N ratio needed.
3. Investigate acetate utilization kinetics.
Page 26
6
4. Continue to evaluate SNR and granule size characteristics.
5. Evaluate the microbial characteristics of the sidestream reactor granules using molecular
methods.
The specific goals of the mainstream pilot plant were as follows:
1. Investigate sidestream bioaugmentation with PAO-NDN granules on a low SRT non-
nitrifying continuous flow conventional activated sludge system, with selective retention
of the granular sludge.
2. Determine the nitrification biokinetics of the pilot plant mainstream mixed liquor,
flocculent sludge, and granular sludge.
3. Investigate the persistence and size of bioaugmented granules and the ability to grow
granules in the mainstream, through examination of changes in granule total suspended
solids (TSS), size distribution, and morphology.
4. Evaluate the impact of sidestream AGS bioaugmentation on the mainstream nitrification
efficiency.
5. Evaluate the microbial composition and nitrifying bacteria concentration of the
mainstream activated sludge flocs and granules using molecular methods.
Page 27
7
2 Background
Mainstream and sidestream pilot operation, monitoring, and goals during this period were
informed by research done by Figdore et al. (2018a, b, c) and Armenta (2019). There were three
publications by Figdore et al. which drove the sidestream and mainstream pilot design and
research. The first publication evaluated three different types of AGS for their bioaugmentation
potential (Figdore et al., 2018b). The granules tested were, 1) nitrification only (NIT granules),
2) nitrification and denitrification with ordinary heterotrophic organisms (NDN-OHO granules),
and 3) nitrification, denitrification, and enhanced biological phosphorus removal (PAO-NDN
granules). The three granules were tested in lab scale SBRs fed with media emulating digester
dewatering centrate and evaluated on four criteria, 1) treatment performance, 2) granule physical
characteristics, 3) growth and production rates of granular mass, and 4) nitrification capacity.
After each granule had undergone a thorough testing period, it was determined that the PAO-
NDN granules performed the best on each criterion (Figdore et al., 2018b). However, NIT
granules also showed good potential for bioaugmentation, performing similarly to the PAO-NDN
granules on treatment performance and nitrification capacity. Following these results, both NIT
and PAO-NDN granules were tested as bioaugmentation material at the lab-scale (Figdore et al.,
2018a, c). Both tests were done in 2.5-day aerobic SRT flocculent sludge SBRs using sidestream
granules grown in SBRs fed WPTP centrate. Figdore et al. (2018c) showed that NIT granules
could be effectively used for bioaugmentation. Effluent NH3-N was less than 1 mg/L for a 30-
day bioaugmentation period and nitrification disappeared once the granules were removed from
the system (Figdore et al., 2018c). Additionally, it was shown that the nitrifiers stayed attached
to the granules, with few leeching into the flocculent sludge. After testing NIT granules, the
Page 28
8
PAO-NDN granules were evaluated by with a 40-day bioaugmentation period. During the
period, it was shown that PAO-NDN granules are effective for bioaugmentation, producing an
effluent NH3-N of 0.6 to 1.7 mg/L (Figdore et al., 2018a). Like the first test, nitrification
vanished once the granules were removed and it was confirmed that most of the nitrifiers stayed
on the granules with minimal nitrifiers in the flocculent sludge. As both bioaugmentation
systems were successful, PAO-NDN granules were chosen to be tested on the pilot scale, due to
their faster growth and ability to denitrify and remove phosphorus. The pilot scale sidestream
SBR was built and operated for a 10.5-month period described by Maxwell Armenta in his
master’s thesis (Armenta, 2019). During this period, PAO-NDN granules were successfully
grown and maintained while being fed WPTP centrate and final effluent dilution water. The
sidestream SBR was operated with a high NH3-N loading rate, 0.38 ± 0.07 g/L-d, and good NH3-
N and total inorganic nitrogen (TIN) removal performance, 95% and 85% respectively.
Furthermore, sustained shortcut nitrogen removal was demonstrated.
2.1 PAO-NDN Granules
PAO-NDN granules accomplish simultaneous nitrification, denitrification, and EBPR by taking
advantage of the various redox zones inherent to the granular structure. These different
conditions within the biofilm are caused by diffusion limiting oxygen penetration and an
anaerobic feed, allowing for a substrate rich anoxic layer (De Kreuk et al., 2007). As illustrated
below on the right side of Figure 2-1, AOB and nitrite oxidizing bacteria (NOB) within the
aerobic zone of the granule convert NH3 to NO2- and NO2
- to NO3- respectively. In the anoxic
zone of the granule, PAOs and glycogen accumulating organisms (GAOs) utilize
polyhydroxyalkanoate (PHA) stored within their cells to reduce NO2- and NO3
- to nitrogen gas.
Page 29
9
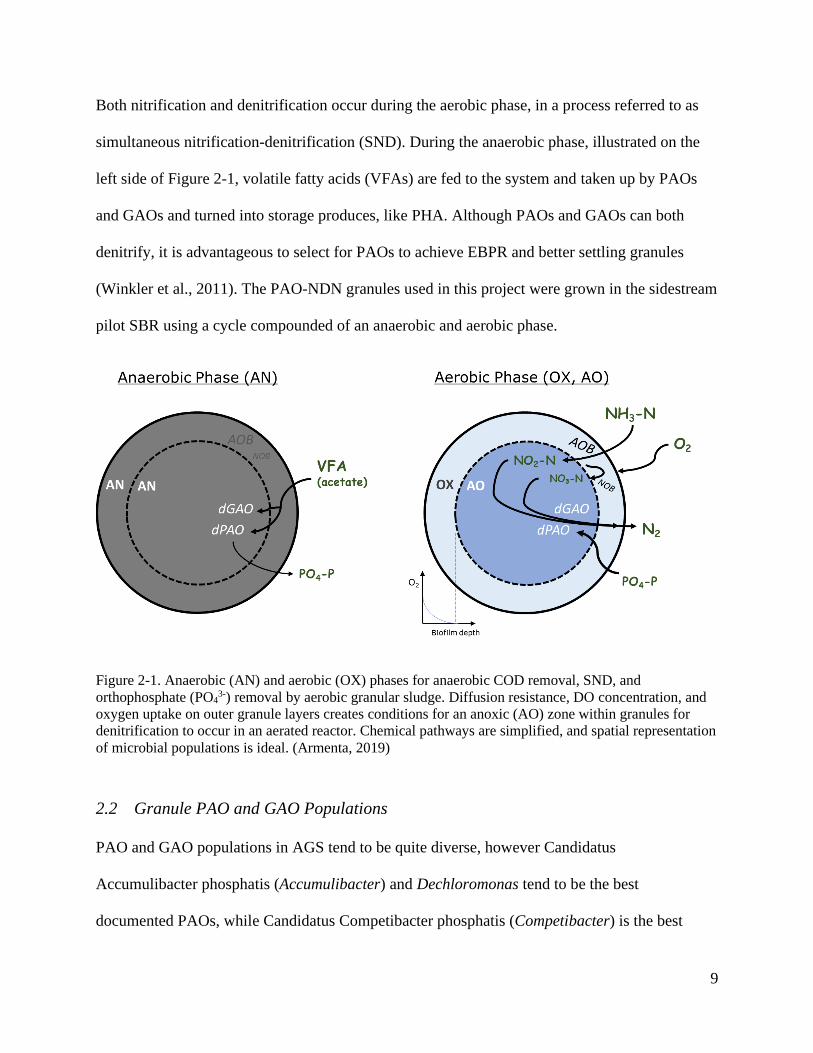
Both nitrification and denitrification occur during the aerobic phase, in a process referred to as
simultaneous nitrification-denitrification (SND). During the anaerobic phase, illustrated on the
left side of Figure 2-1, volatile fatty acids (VFAs) are fed to the system and taken up by PAOs
and GAOs and turned into storage produces, like PHA. Although PAOs and GAOs can both
denitrify, it is advantageous to select for PAOs to achieve EBPR and better settling granules
(Winkler et al., 2011). The PAO-NDN granules used in this project were grown in the sidestream
pilot SBR using a cycle compounded of an anaerobic and aerobic phase.
Figure 2-1. Anaerobic (AN) and aerobic (OX) phases for anaerobic COD removal, SND, and
orthophosphate (PO43-) removal by aerobic granular sludge. Diffusion resistance, DO concentration, and
oxygen uptake on outer granule layers creates conditions for an anoxic (AO) zone within granules for
denitrification to occur in an aerated reactor. Chemical pathways are simplified, and spatial representation
of microbial populations is ideal. (Armenta, 2019)
2.2 Granule PAO and GAO Populations
PAO and GAO populations in AGS tend to be quite diverse, however Candidatus
Accumulibacter phosphatis (Accumulibacter) and Dechloromonas tend to be the best
documented PAOs, while Candidatus Competibacter phosphatis (Competibacter) is the best
Page 30
10
documented GAO (Oehmen et al., 2010). Dechloromonas-related organisms have been shown to
exhibit characteristics of PAOs (Zong et al., 2007) and GAOs (Ahn et al., 2007). However,
Dechloromonas is usually referred to as a PAO. Accumulibacter is known to have two distinct
types (type I and type II), which contain clades IA-IC and clades IIA-IIF, respectively (Nielsen
et al., 2019; He et al., 2007). Additionally, Competibacter contains sub-groups 1-7 (Oehmen et
al., 2010). Oehmen et al. (2010) detailed the denitrification capacity of the different types of
Accumulibacter and sub-groups of Competibacter. However, later research illustrated the likely
sub-clade diversity of PAOs (Section 2.4).
Microbial characterization of PAO-NDN granules by Figdore et al. (2018a, b) and Armenta
(2019) revealed that Accumulibacter, Dechloromonas, and Competibacter were the dominant
PAOs and GAOs. The first bench scale SBR tests by Figdore et al. (2018b) found that
Dechloromonas was dominant, with an abundance of 28%. Secondly, Figdore et al., (2018a)
discovered Accumlibacter and Competibacter to be the dominant PAO and GAO, respectively,
with relative abundances of greater than 10% each. Armenta (2019) found that Accumlibacter
and Dechloromonas were dominant in the sidestream SBR used to grow PAO-NDN granules for
bioaugmentation in September 2018, with a combined relative abundance greater than 20%.
2.3 Granule Nitrifier Populations
Nitrification in municipal WRRFs is primarily conducted by AOBs and NOBs. AOB populations
are predominantly reported in WRRFs as being from the Nitrosomonas and Nitrosospira genus.
Between the two, Nitrosospira are generally reported to be more abundant. However,
Nitrosomonas has been reported as more abundant in PAO-NDN granules by both Figdore
Page 31
11
(2018b) and Armenta (2019), with relative abundances of greater than 99% and 65%,
respectively.
Among NOB populations, Nitrobacter and Nitrospira are the most reported genera in municipal
WRRFs. Nitrotoga was reported to be the dominant NOB genus in PAO-NDN granules by
Fidgore (2018b), although only at a relative abundance of 0.4%. NOB genera tend to be much
more diverse than AOB in municipal WRRFs. Contrary to the findings by Figdore et al (2018b),
Armenta (2019) found that Nitrospira were the most dominant NOB genus in the PAO-NDN
sidestream SBR pilot, with over 80% relative abundance.
2.4 Denitrifying Polyphosphate and Glycogen Accumulating Organisms
Although PAOs have been historically used in anaerobic-aerobic systems, to utilize O2 as the
primary electron acceptor, both PAOs and GAOs have been shown to contain groups capable of
reducing NO3- and NO2
- to oxidize PHA. The groups capable of denitrification are termed
denitrifying polyphosphate accumulating organisms (dPAOs) and denitrifying glycogen
accumulating organisms (dGAOs). Meinhold et al. (1999) showed that there were two unique
groups of PAOs, dPAOs and non-denitrifying PAOs. Furthermore, Zeng et al. (2003)
demonstrated the existence of dGAOs and their ability to anoxically reduce NO3- and NO2
-.
Accumlibacter clade I was documented to denitrify with NO3- by both Oehmen et al. (2010) and
Flowers et al. (2009). Additionally, both studies determined that Accumlibacter clade II could
not denitrify with NO3-. Furthermore, Flowers et al. (2009) found that Accumlibacter clade II
contained genes enabling NO2- reduction. These results were supported by Lanham et al. (2011),
who found that Accumlibacter clade I could reduce NO3- and NO2
-. On the contrary,
Page 32
12
Accumlibacter clades I, IA, IC, IIC, and IIF were reported to be unable to reduce NO3-, instead
relying on NO3- reducers, like Dechloromonas and Competibacter, to provide NO2
- (Kim et al.,
2013; Rubio-Rincón et al., 2017; Saad et al., 2016).
2.5 Simultaneous Nitrification and Denitrification
SND has proven to be effective within flocculent sludge (Munch et al., 1996), biofilm (Helmer
and Kunst, 1998), granular sludge (De Kreuk et al., 2005), and hybrid reactors (Jianlong et al.,
2008). All these systems rely upon DO concentration gradients resulting from biomass diffusion
limitations to create aerobic and anoxic zones in the biomass for nitrification and denitrification,
respectively (Figure 2-1). These conditions are achieved in flocculent sludge by the optimization
of three parameters, 1) bulk liquid DO, 2) floc size, and 3) readily biodegradable COD (rbCOD)
addition (Pochana and Keller, 1999). Munch et al. (1996) showed that nitrification rate increased
with greater DO, while denitrification rate decreased, in anaerobic-aerobic bench-scale SBRs.
Within their reactors, a DO concentration of 0.5 mg/L led to equal nitrification and
denitrification rates, allowing for complete SND. The low DO concentrations necessary for SND
in a flocculent sludge provide opportunities for operation cost savings. Bertanza (1997)
described upgrading existing WRRFs to conduct up to 90% N removal, without adding anoxic
zones, by using DO and ORP measurements to actively control aeration. Because of the
dispersed structure of flocculent sludge, active DO control has proved useful to ensure adequate
anoxic volume for SND. Zhao et al. (1999) utilized a two-stage process, an anaerobic zone
followed by an intermittent aeration zone, to achieve SND efficiencies of up to 50% by
maintaining a low DO (less than 0.6 mg/L) with ORP control. Additionally, Guo et al. (2009)
showed up to 45% SND with DO concentrations between 0.4 and 0.8 mg/L in a lab-scale SBR.
Page 33
13
SND within aerobic granules is fundamentally the same as for flocculent sludge, but granule size
and density increase oxygen diffusion limitation and provide more anoxic volume at higher DO
concentrations when compared with flocculent sludge. AGS is generally grown in SBRs,
allowing for anaerobic feeding to favor PAOs and GAOs. De Kruek et al. (2005) showed up to
94% N removal efficiency at a DO of 1.8 mg/L, resulting from dPAO populations inside the
granules. They also illustrated the reliance of SND efficiency on bulk liquid DO concentration,
detailing 35% and 56% N removal efficiency at concentrations of 9.1 and 3.6 mgDO/L,
respectively. This result was supported by Bassin et al. (2012), who maintained greater than 80%
N removal at bulk liquid DO concentrations of less than 2.0 mg/L. Bassin et al., however,
observed that dGAO were primarily responsible for the reduction of NO3- to NO2
-. To try to
optimize cost, Yuan and Gao (2010) suggested a DO concentration of 2.5 mg/L was optimal for
aerobic granular sludge SBRs, based on reaction duration and aeration and mixing costs. Overall,
the dense biofilm structure of aerobic granules allows for SND to occur with higher DO
concentration than with flocculent sludge, which allows for increased nitrification rates.
2.6 Exogenous Carbon used for Denitrification
To achieve full N removal, many biological nitrogen removal WRRFs must add supplemental
carbon to their influent wastewaters to reach the COD:N ratio necessary for denitrification. The
carbon consumed per NOx removed ratio is dependent on the oxygen equivalent of the species
reduced and the synthesis yield achieved with the carbon source (Tchobanoglous et al., 2014b).
Because of the favorability of using O2 as an electron acceptor, NO2-/NO3
- are only utilized in
anoxic conditions. The oxygen equivalent of NO3- is greater than that of NO2
-, which are 2.86
and 1.71 g O2/g NOx--N removed, respectively (Tchobanoglous et al., 2014b; Bowden et al.,
Page 34
14
2016). This means that the carbon consumption ratio is 40% lower for NO2- than NO3
-. The COD
consumption ratio can be estimated with Equation 2-1.
𝐶𝑂𝐷𝐶𝑅 =𝑂𝐸𝑞
1 − 1.42 ∙ 𝑌𝐻
where: CODCR = COD consumption ratio, g COD-used/g NOX-N-removed
OEq = oxygen equivalent, 2.86 g O2/g NO3--N or 1.71 g O2/g NO2
--N-removed
YH = synthesis yield, g VSS/ g COD
The above model is difficult to utilize to estimate the COD:N in the sidestream or the
mainstream pilot because it only pertains to the immediate uptake of a COD source and the
denitrifying synthesis yield. The effective yield is lower due to the long SRT and SND aeration
time, with carbon released due to endogenous decay. Furthermore, the COD fed is not directly
used for cell synthesis and denitrification, instead, COD is anaerobically converted to PHA for
storage by PAOs and GAOs. Krasnits et al. (2013) detailed that greater than 80% of fed acetate
COD was converted to PHA in GAOs and PAOs, accounting for glycogen used in substrate
uptake. Thus, a reduced amount of COD fed is available for usage in synthesis and
denitrification.
2.7 Shortcut Nitrogen Removal
Shortcut nitrogen removal, or denitrification using NO2- instead of NO3
-, offers significant
operations cost savings, by reducing the carbon and oxygen required for N removal by up to 40%
and 25%, respectively (Bowden et al., 2016). AOB activity combined with NOB suppression
(2-1)
Page 35
15
drives shortcut nitrogen removal, by stopping the oxidation of NO2- to NO3
- and allowing for full
nitritation and denitritation.
2.7.1 Repression of NOB in Flocculent Sludge
Bowden et al. (2016) summarized four flocculent sludge NOB inhibition strategies, 1) selective
NOB washout using temperature and SRT control, 2) low DO concentration, 3) intermittent
aeration, and 4) free ammonia (FA) and free nitrous acid (FNA) concentration. An SRT of less
than 2-3 days at a temperature above 20°C is reported to cause selective washout. Furthermore,
low DO or intermittent aeration at DO concentrations between 0.3 and 2.0 mg/L cause inhibition
of NOB (Bowden et al., 2016). AOB and NOB are both inhibited by high FA and FNA
concentrations, AOB inhibition has been reported at 7.0 mg/L FA and 0.065 to 0.83 mg/L FNA
(Tchobanoglous et al., 2014a; Anthonsien et al., 1976) while NOB inhibition has been reported
at 0.04 to 50 mg/L FA and 0.01 to 1.0 mg/L FNA (Blackburne et al., 2007). Blackburne et al.
(2007) reported inhibition of Nitrospira and Nitrobacter NOBs at 0.04 to 0.08 mg/L FA and
about 50 mg/L FA, respectively. However, Tchobanoglous et al., (2014a) summarized inhibition
of NOB in the range of 0.1 to 8.9 mg/L FA. The large range in FA inhibition concentrations for
AOB and NOB points to FA inhibition concentration as being species dependent. Both AOB and
NOB have been shown to acclimate to higher FA concentrations when exposed to long term high
concentrations (Tchobanoglous et al., 2014a; Kouba et al., 2014).
2.7.2 Repression of NOB in Granular Sludge
The low SRT for selective NOB washout is difficult to apply to AGS reactors, which generally
require an SRT of 10 to 50 days. Instead, the stratification of AOB and NOB in granules is relied
Page 36
16
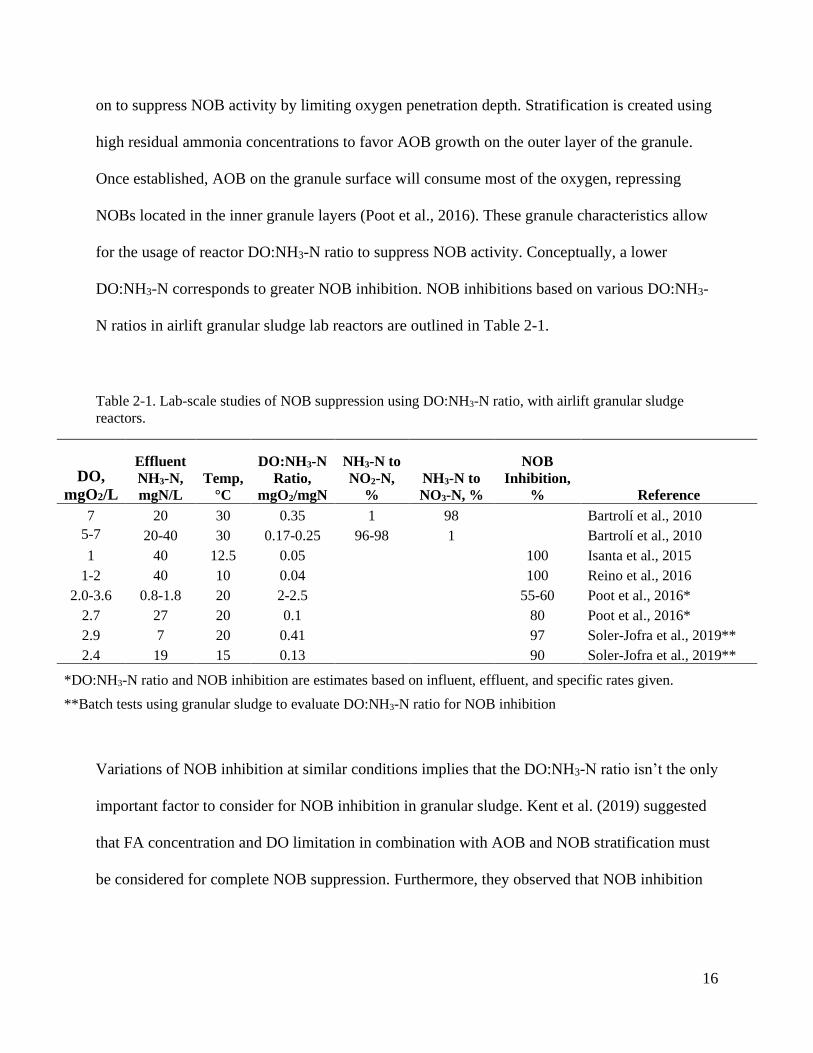
on to suppress NOB activity by limiting oxygen penetration depth. Stratification is created using
high residual ammonia concentrations to favor AOB growth on the outer layer of the granule.
Once established, AOB on the granule surface will consume most of the oxygen, repressing
NOBs located in the inner granule layers (Poot et al., 2016). These granule characteristics allow
for the usage of reactor DO:NH3-N ratio to suppress NOB activity. Conceptually, a lower
DO:NH3-N corresponds to greater NOB inhibition. NOB inhibitions based on various DO:NH3-
N ratios in airlift granular sludge lab reactors are outlined in Table 2-1.
Table 2-1. Lab-scale studies of NOB suppression using DO:NH3-N ratio, with airlift granular sludge
reactors.
DO,
mgO2/L
Effluent
NH3-N,
mgN/L
Temp,
°C
DO:NH3-N
Ratio,
mgO2/mgN
NH3-N to
NO2-N,
%
NH3-N to
NO3-N, %
NOB
Inhibition,
% Reference
7 20 30 0.35 1 98 Bartrolí et al., 2010
5-7 20-40 30 0.17-0.25 96-98 1 Bartrolí et al., 2010
1 40 12.5 0.05 100 Isanta et al., 2015
1-2 40 10 0.04 100 Reino et al., 2016
2.0-3.6 0.8-1.8 20 2-2.5 55-60 Poot et al., 2016*
2.7 27 20 0.1 80 Poot et al., 2016*
2.9 7 20 0.41 97 Soler-Jofra et al., 2019**
2.4 19 15 0.13 90 Soler-Jofra et al., 2019**
*DO:NH3-N ratio and NOB inhibition are estimates based on influent, effluent, and specific rates given.
**Batch tests using granular sludge to evaluate DO:NH3-N ratio for NOB inhibition
Variations of NOB inhibition at similar conditions implies that the DO:NH3-N ratio isn’t the only
important factor to consider for NOB inhibition in granular sludge. Kent et al. (2019) suggested
that FA concentration and DO limitation in combination with AOB and NOB stratification must
be considered for complete NOB suppression. Furthermore, they observed that NOB inhibition
Page 37
17
from FA concentration was most effective with smaller granules, while bulk liquid DO
concentration and nitrifier stratification was more crucial with larger diameter granules.
2.8 Mainstream Systems with Granular Activated Sludge
2.8.1 Full-Scale Sequencing Batch Reactors with Activated Granular Sludge
Nereda® AGS SBRs have found success treating domestic sewage since 2009, the first full-scale
installation operations data was documented in 2013 with a MLSS and a sludge volume index
(SVI5) in the range of 8 g/L and 45 mL/g, respectively (Pronk et al., 2015). Furthermore, the
SBR was reported to easily reach effluent requirements of 7 mgN/L and 1 mgP/L in summer and
winter conditions. Pronk et al. (2015) also showed a significant degree of granulation, with 80%
and 60% of the biomass greater than 0.2 and 1.0 mm, respectively. Li et al., (2014b) also
reported the effective startup and operation of a full-scale AGS SBR, which obtained an average
SVI30 and granule diameter of 47.1 mL/g and 0.5 mm, respectively. Effective ammonia removal
of about 96% was achieved, although the TN removal efficiency was about 60%. AGS has
proved to be effective for reducing footprint and energy costs, while maintaining effective COD
and nutrient removal using SBRs (Pronk et al., 2015; Li et al., 2014b). However, SBRs can be
difficult to install because flow equalization tanks are needed to maintain consistent flow to a
batch process.
2.8.2 Continuous Flow Applications of Activated Granular Sludge
Despite the success of AGS in SBR processes, it has been complicated to apply the technology to
continuous flow systems. Continuous flow systems provide three general benefits over SBR
processes, as summarized by Kent et al. (2018), 1) ease of operation, 2) treatment volume and
Page 38
18
consistency, and 3) current infrastructure. Airlift reactors, hydraulic separators (both internal and
external), bubble columns, baffles, sieves, and other selection pressure strategies have been
tested to cultivate continuous flow aerobic granules (Table 2-2). Bubble columns and airlift
reactors have been favored in continuous flow granulation research because of their similarities
to SBRs in shape. Using these technologies, average granule diameters up to 3 mm have been
achieved. However, their similarities to SBRs in shape make them more difficult to apply to the
CFAS systems commonly used. Sajjad et al. (2016) used an SBR to grow granules, so that they
could be seeded into an MBR pilot facility. After seeding with granules there was a decrease in
membrane fouling and an improvement in particle size and SVI5, from 200 to 625 µm and 145 to
45 mL/g, respectively. Wei et al. (2019) documented between 0.5 to 80.2 percent granules in the
MLSS of 17 CFAS treatment facilities. They also detailed a correlation between high percent
granules and the treatment plants resemblance to a plug-flow system with a high F/M ratio, with
the usage of two or more anaerobic selector stages. The granules observed were mostly small,
with diameters between 212 and 600 µm. Sun et al. (2019) tested a pilot-scale plug-flow reactor
with in-line separators for selective granule retention and achieved an average granule diameter
of 3.4 mm within 90 days of operation. Furthermore, Downing et al. (2017) documented
granulation (average diameters between 0.30 and 0.75 mm) in a full-scale CFAS system using a
selector with a plug-flow conditions allowing for a high F/M in the selector, relative to the rest of
the process. Although a full-scale AGS continuous flow system has yet to be realized, various
selection strategies have been researched, documenting the levels of success of numerous novel
designs to create mainstream continuous flow granulation.
Page 39
19
Table 2-2. Summary of reported continuous flow aerobic granular sludge cultivation strategies and time spans for granule formation. The stable
phase is defined as the period after granule formation where structure and performance were maintained. (Adapted from Kent et al., 2018)
Granulation Strategy Reactor
Type
Reactor
Liquid
Volume
(L)
Formation /
acclimation
phase
(days)
Stable
phase
(days)
Inoculum/
diameter
(mm)
Average
Granule
Diameter
(mm)
SRT
(day)
Loading
Rate
(gCOD or
N /L-d)
DO
(mg/L)
Temperature
(°C)
HRT
(hr) Reference
Adjustable baffles for
settling large particles
Modified
oxidation
ditch
60 13 107
Anaerobic &
aerobic
sludge / <
0.05
0.6 - 0.53 - 1.1 - 18 - 30 3 Li et al.,
2014
Size-based selection
pressure with sieve
Bubble
column 7.5 7 48
Activated
sludge 1.0 - 3.0 - 1.07 3.0 - 6.0 20 9
Liu et al.,
2014
Reactor with novel settling
tank; stepwise reduction in
settling time
Bubble
column
system
6, 9 16 180 P-removal /
0.98 0.93 ― 1.2 I 2.0 - 5.0 II 22 6 I
Li et al.,
2016
Three-phase separator;
hydrodynamic shear force ALR ― 11 36
Activated
sludge 0.51 ― 1.2 - 1.8 5.8 - 7.6 20
1.8 -
2.0
Zhou et al.,
2014
N/A III ALR 5 ― 23 ― 1.5 - 2.6 ― ― 4 ― ― Yulianto et
al., 2017
ALR with settling tank;
MBR with sieve
ALR +
MBR
system
29, 24 30 45
Aerobic
granules /
1.0 - 6.0 0.1 - 1.0 ―
0.18 -
0.74 2.0 - 3.0 20 13
Liu et al.,
2012
Three-phase separator +
external separator;
temporary inorganic
carriers provide nucleation
sites for biomass
attachment
ALR 112 ― 300 Nitrifying
granules IV 0.7 - 0.9 ― 0.75 - 6.1 5 - 7 30 ―
Bartrolí et
al., 2010
Internal settling tank Upflow
reactor 10 ― 70
Aerobic
granules ― ― 3.1 - 5.6 ― ― 10
Bumbac et
al., 2015
Inclined tube settler +
external settling tank
Upflow
reactor 12, 12 18 ―
Activated
sludge +
aerobic
granules
1.2 ― 6 ― 10 - 20 4 Long et al.,
2015
Page 40
20
Table 2-2. (continued)
Two-zone sedimentation
tank + micropowder with
metal ions
CFR 27 61 94 Activated
sludge 0.1 ―
0.11 -
0.21 ― 20-30 18
Zou et al.,
2018
Mixed sedimentation tank
for selective wasting CFR 65 ― ―
Activated
sludge 0.1 - 0.2 18 1.3 - 1.5 1.5 - 2.5 20 6
Devlin et
al., 2018
Settling zone; gradually
reducing HRT to increase
EPSs
Aerated
CSTR 1.5 ― 145
Nitritation
granules /
0.9
1.2 33 - 56 1.5 - 3.3 0.8 - 1.5 28 0.9 -
2
Qian et al.,
2017
Two external separators +
feast-famine conditions PFR 128 51 69
Activated
sludge 3.4 4 1.2 >3 10 - 22.5 6.5
Sun et al.,
2019
Hydraulically-induced
biomass collisions and
filamentous entanglement V
CMAS Lab 21 70 Sludge from
secondary
clarifier
0.18 - 1.25 18 1.35 4.2 25 - 27 8 Chen et al.,
2015
Internal settling tank;
intermittent inoculation
from SBR VI
MBR 14000 40 80 Aerobic
granules 0.625 ― 0.6 - 1.2 ― ― 8
Sajjad et al.,
2016
Feast-famine conditions CFR ― VII ― ― Activated
sludge 0.30 - 0.75 ― 0.002 ― ― ―
Downing et
al., 2017
I Based on combined HRT from both aerobic and anaerobic tanks
II Corresponding only to the aerobic tank in the system
III It is not clear whether a means for selection pressure is present or not.
IV Biofilm was grown around activated carbon carriers, then the carriers were removed, leading seeded granules
V Lack of or insufficient means for selection pressure
VI Data only from stage II or the experiment, where intermittent seeding from an SBR occurred
VII Full scale facility with capacity of 164 mgd
ALR, airlift reactor, CFR, continuous flow reactor, CMAS, completed mixed activated sludge, MBR, membrane bioreactor, PFR, plug-flow reactor
Page 41
21
3 Methods
3.1 Sidestream Reactor Description
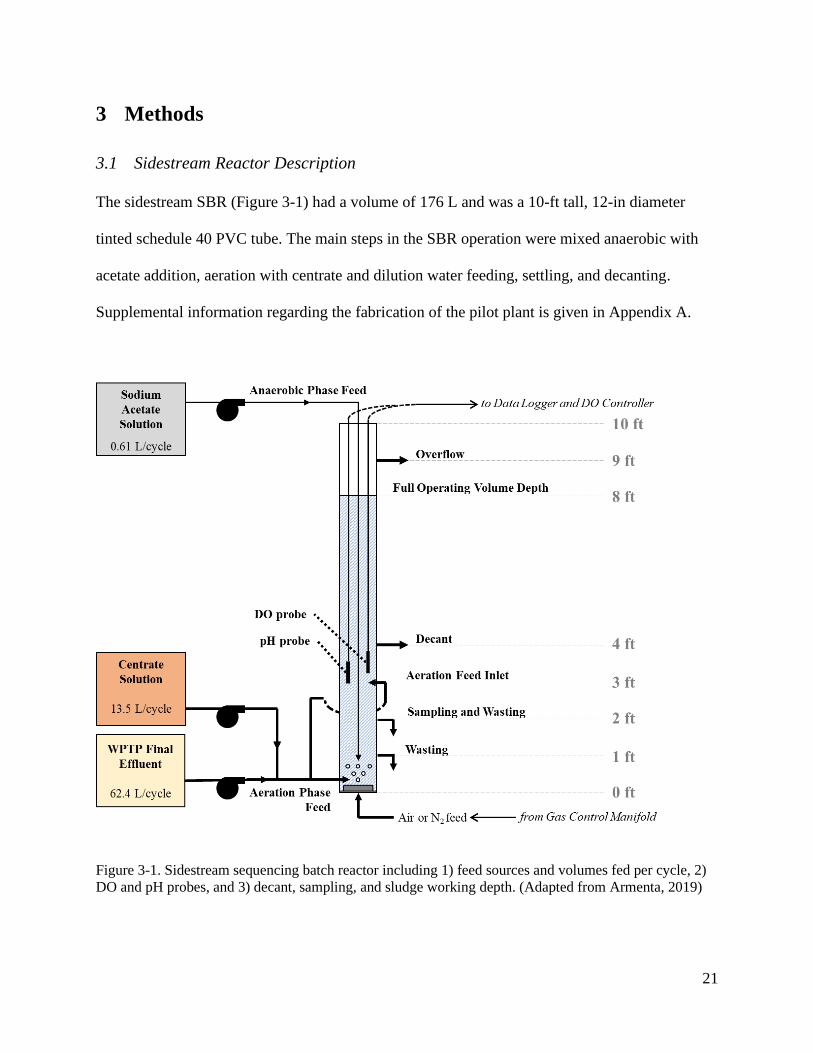
The sidestream SBR (Figure 3-1) had a volume of 176 L and was a 10-ft tall, 12-in diameter
tinted schedule 40 PVC tube. The main steps in the SBR operation were mixed anaerobic with
acetate addition, aeration with centrate and dilution water feeding, settling, and decanting.
Supplemental information regarding the fabrication of the pilot plant is given in Appendix A.
Figure 3-1. Sidestream sequencing batch reactor including 1) feed sources and volumes fed per cycle, 2)
DO and pH probes, and 3) decant, sampling, and sludge working depth. (Adapted from Armenta, 2019)
Page 42
22
As shown in Figure 3-1, the reactor overflow was located 9 ft above the bottom of the reactor.
The reactor full liquid level operating volume (176 L) was controlled by a float switch at a height
of 8 ft. When the float switch was triggered, it shut off the WPTP final effluent feed pump. The
decant line was located at a depth of 4 ft so that half of the reactor volume (88 L) was discharged
each cycle, setting the volume exchange ratio (VER) at 0.5. The decant drained by gravity
through a line with a solenoid valve that was actuated to control the discharge time. Reactor
sampling and sludge wasting were normally from the 2 ft tap, but wasting was sometimes done
at the 1 ft tap to try to waste larger granules. Aeration feed was through two taps simultaneously,
using the tap at 3 ft and a tap below the 1 ft wasting tap. The sodium acetate COD feed line was
discharged at 1 ft above the bottom of the reactor. The DO and pH probes and the COD feed line
were mounted to a Unistrut™ channel at the top of the reactor. A 9-in diameter Environmental
Dynamics International (EDI) FlexAir™ membrane disc diffuser was mounted in the center of
the bottom of the reactor. The diffuser orientation and layout are illustrated in Figure 3-2
(Environmental Dynamics International, Columbia, Missouri, USA).
Page 43
23
Figure 3-2. Sketch of fine bubble membrane diffuser and the relative orientation of the DO and pH probes
and the COD feed line. (Adapted from Armenta, 2019)
3.1.1 Sidestream Reactor Feed System
The sidestream reactor received three feed solutions, 1) a sodium acetate feed to provide COD
for PAO uptake and growth, 2) a screened anaerobic digestion dewatering centrate diluted with
tap water to control NH3-N concentration and loading, and 3) WPTP final effluent dilution water
to produce a temperature closer to the mainstream. During mainstream operation, the WPTP
effluent to centrate feed volume ratio was approximately 4.6. The typical cycle feed volumes
were 610 mL for the sodium acetate solution, 13.6 L for the diluted centrate, and 62.4 L for the
WPTP effluent. These feed solutions were supplied through a combination of flexible plastic and
stainless-steel tubing by three separate Masterflex® L/S® Series peristaltic pumps (Cole-
Parmer® Instrument Company, Vernon Hills, Illinois, USA). The peristaltic pumps were
calibrated periodically, and the Masterflex® peristaltic tubing was replaced when necessary.
Page 44
24
All the feed solutions were batched and managed by KC staff. The sodium acetate solution was
batched every one-to-four days in a 5-gal plastic container, by dissolving NaC2H3O2 into tap
water. To prevent biofilm growth, multiple 5-gal containers were used and periodically swapped
out so that the container not in use could be held at a 1-4-day contact time with a sodium
hypochlorite solution. The soak solution was prepared by pouring approximately one liter of
bleach into the 5-gal container and filling with tap water. The pH of the solution was between 8.5
and 9.
The centrate feed solution was batched every 1 to 7 days. The centrate was carried from the
WPTP dewatering building to the pilot area and allowed to settle for 10 to 60 min and then
screened using a 425µm sieve, before being added to the 100-gal plastic feed tank. Tap water
was added to the feed tank to dilute the centrate to the desired NH3-N concentration. The centrate
feed tank was mechanically mixed for 1 min after batch feeding. The centrate feed tank was
periodically drained and cleaned to prevent high solids accumulation at the bottom.
The WPTP final effluent dilution water was available from a plant reuse water line in the pilot
plant building. The water was pumped to the sidestream reactor from a tap at the bottom of a
100-gal plastic tank. The tank was fed at the top from a valve in the water line that was
controlled by a float switch to maintain the tank liquid level. The float switch closed the valve
when the liquid level returned to the 100-gal volume. Similar to the centrate feed tank, the WPTP
effluent feed tank was cleaned periodically to control biofilm growth.
Page 45
25
3.1.2 Sidestream Reactor Aeration, Anaerobic Mixing, and DO Control
Nitrogen gas for mixing in the anaerobic phase and air for the aeration phase were provided
through the diffuser at the bottom of the SBR and regulated by a gas control manifold. The
manifold consisted of pressure regulators followed by Gilmont™ glass float rotameters (Vernon
Hills, Illinois, USA). The rotameters have a flow rate capacity of 86.95 L/min at standard
conditions (1.0 atm and 70°F, or 21.1°C). The anaerobic N2 and baseline aeration mixing
intensity is described below in Table 3-1. Additional aeration was regulated to maintain the DO
setpoint.
Table 3-1. Anaerobic N2 mixing and baseline air mixing rates, sparge rates, and gas superficial upflow
velocities.
Mixing Type SBR Phase
Flow Rate
(L/min)
Sparge Rate
(scfm/ft2)
Superficial
Upflow Velocity
(m/hr)
N2 Anaerobic 7.8 3.3 6.4
Baseline Air Aerobic 4-6 1.7-2.5 3.3-4.9
As previously mentioned, additional aeration was provided intermittently to maintain the DO
setpoint. This was done through PID control using a Moore Controller (Moore Industries, North
Hills, California, USA) until September 23, 2019 and then using a Hach® sc1000 module for the
remainder of the project (Loveland, Colorado, USA). Both controllers utilized 60-sec-moving-
average DO from the in-situ probes as the bulk liquid DO concentration. The aeration rate was
changed in proportion to the bulk liquid DO concentration and the DO concentration setpoint.
Page 46
26
3.2 Mainstream Reactor Description
The mainstream pilot plant (Figure 3-3) consists of a 1) preanoxic tank that receives return
sludge from the separator underflow, 2) two anaerobic tanks with the first receiving the primary
effluent feed and the preanoxic overflow, 3) an aeration tank, 4) a hydraulic upflow separator
with overflow to the secondary clarifier and underflow return sludge to the preanoxic tank, and
5) a secondary clarifier with return activated sludge (RAS) to the aeration tank. The RAS line
had a tap for sludge wasting for SRT control. The RAS line was intended to go to the aerobic
tank, but it could also be directed to the first anaerobic tank. The volumes and HRTs of the
reactors at an influent flow of 1.5 gpm are shown in Table 3-2.
Figure 3-3. Sketch of mainstream pilot system, illustrating influent, effluent, and the internal flow
scheme. From left to right, the preanoxic, anaerobic 1, anaerobic 2, and aeration reactors, the granular
separator, and the secondary clarifier.
Page 47
27
Table 3-2. Mainstream tank volume and hydraulic retention time (HRT). The HRT of the preanoxic tank
is based on a separator RAS rate of 0.75 gpm, while the anaerobic 1, 2, and aerobic HRTs are based on a
primary effluent flow of 1.5 gpm.
Tank Volume HRT
gal hrs min
Preanoxic 52 1.16
Anaerobic 1 24 16.0
Anaerobic 2 52 34.7
Aeration 214 2.38
3.2.1 Preanoxic/Anaerobic/Anaerobic Reactor Description
The preanoxic and the two anaerobic tanks were built in tandem using a stainless-steel frame
across the tops of the reactors (Figure 3-4). The three reactors were built from schedule 10s
stainless-steel pipe, and had diameters of 18 in, 12.75 in, and 18 in, respectively. The preanoxic
tank was mixed using a Pulsair Systems big bubble Drum-Stick® diffuser (Kirkland,
Washington, USA). The ORP probe and the Pulsair mixer were mounted to a section of
Unistrut™ channel at the top of the preanoxic reactor. The Hach® P/N DRS5 ORP probe data
was logged using a Hach® sc1000 module until November 6, 2019, and then a Hach sc1500
controller for the remainder of the project (Loveland, Colorado, USA). The Pulsair mixer was
located approximately 2 in from the bottom of the reactor and activated one out of every ten
minutes. The preanoxic tank was fed through a 1-in PVC pipe at 0.5-0.75 gpm, using a Keco
Pumps Rotho® peristaltic pump (San Diego, California, USA). The Pulsair mixer, probe, and
feed lines of the preanoxic tank and first anaerobic tank are also illustrated in Figure 3-4.
Page 48
28
Figure 3-4. Schematic of the preanoxic and anaerobic reactor tanks, mixing equipment, and feed sources.
The concentrations displayed for the sodium acetate and dibasic potassium phosphate are shown as mg
per liter of primary effluent.
The preanoxic tank had a liquid level of 5.5 ft and the granular separator return sludge line inlet
was 18 in below the liquid level. The ORP probe was also at the 18-in depth. The sampling taps
for the anoxic and two anaerobic tanks, were located at liquid depths of 18 in, 14 in, and 9 in,
respectively. All the tanks had a bottom tap for draining.
Primary effluent was fed to the first anaerobic reactor at 1.5 gpm during the initial operation
using a SoloTech ST23® peristaltic pump made by Graco (Minneapolis, Minnesota, USA). The
feed rate was monitored using a magnetic flowmeter made by Krohne (Frankfort, Illinois, USA).
Page 49
29
The phosphate and acetate feed solutions were pumped at between 1 and 2 mL/min using a
Masterflex® L/S® Series peristaltic pump (Cole-Parmer® Instrument Company, Vernon Hills,
Illinois, USA). These two feed solutions were used to provide a more typical municipal
wastewater strength by offsetting the more dilute wastewater due to wet weather higher flow
conditions at the WRRF. The sodium acetate solution and dibasic potassium phosphate solution
were batched every one-to-seven days by KC staff in 5-gal plastic containers, by dissolving
NaC2H3O2 or K2HPO4, respectively, into tap water. The used 5-gal containers were periodically
swapped out so that each container could be cleaned with a 1-4-day sodium hypochlorite solution
soak.
Both anaerobic reactors were mechanically mixed using Indco Inc. HS-VS Gear Clamp Mixers®
(New Albany, Indiana, USA). As their title implies, the mixers were clamped onto the top edge
of each reactor and the mixer shafts were tilted into the reactors. Each mixer was equipped with
two 5-inch hydrofoil propellers, with the lower one at the end of the shaft and the second one 12
inches above that (Figure 3-4). The two differences between the mixers in the first and second
anaerobic tanks were the mixer shaft length and the mixing frequency. The mixer shaft going
into the second reactor is longer, at 66 in, compared to 61 in the first anaerobic reactor, to
account for the difference in liquid level between the two reactors. Mixing frequency was set
visually to minimize rotations per minute (rpm) while maintaining a well-mixed reactor. The first
anaerobic reactor mixer rotational speed was estimated by KC at 60 rpm and the second reactor
at 30 rpm.
Page 50
30
3.2.2 Aerobic Reactor Description
The aerobic reactor liquid volume was 214 gal and was built from schedule 10s stainless steel
pipe, at a height of 84 in and a 30-in diameter (Figure 3-5). The influent was submerged at 18
inches below the liquid surface. The operating liquid depth was 6 ft and the DO and pH probes
were located at a liquid level of about 2.5 ft, as was the commonly used mixed liquor sampling
tap. The upper sampling tap was located at a liquid level of 4.5 ft. A drain valve was installed at
the bottom of the reactor. To prevent the reactor from overflowing if the effluent line became
backed up, the reactor was designed with about 14 in of freeboard. Two fine bubble diffusers and
a pulse air unit were installed towards the bottom of the aeration tank to regulate DO and provide
adequate mixing. The location of the probes, the diffusers, and the Pulsair mixer are shown in
Figures 3-5 and 3-6.
Page 51
31
Figure 3-5. Mainstream aerobic reactor. The probes and diffusers are shown in the center of the figure,
while the tap, their function, and the influent pipe are shown on the right.
Page 52
32
Figure 3-6. Sketch of fine bubble diffuser array and the relative orientation of the DO and pH probes.
The two-fine bubble Aerostrip diffusers were model T0.5-15, made by Ovivo (Salt Lake City,
Utah, USA). They were rated for at an air supply rate between 0 and 5 standard cubic feet per
minute (scfm) each. The Pulsair unit was secured to the top of the reactor alongside the DO and
pH probes and was suspended about 2 in from the bottom of the reactor.
The DO and pH probes were Hach® models P/N 9020000 and P/N DPD2P1, respectively. Data
logging was done by the sc1000 and sc1500 modules. The Hach® sc1000 module was used, with
PID control, to maintain the DO setpoint (Loveland, Colorado, USA). The DO control and
aeration was done in the same way as that for the sidestream except for no baseline aeration. The
constant oxygen demand was normally sufficiency with PID control to have enough air for
mixing. Additional mixing was provided to the aeration tank, from the initial seeding (October
17, 2019) during the first operational period until November 18, 2019, by a Pulsair Drum-Stick
Page 53
33
unit, identical to the one used in the preanoxic reactor (Kirkland, Washington, USA). While it
was being utilized, the Pulsair unit provided large bubble mixing to the aeration tank at a
frequency of 1 min per 10 min. Compressed air was provided to the diffusers from the same gas
control manifold used to provide air and N2 to the sidestream. The aeration to the mainstream
aerobic reactor was controlled using a modulating air value made by Emerson Process (51000
NPS with Baumann 16 Actuator, and Fisher™ 3660 Pneumatic Positioner) (Monterey,
California, USA). The aeration intensity was measured using a Kurz air flow meter, Series 504
FTB, which operated between 0 and 10 scfm. After the first start up, the pulse air mixing was not
used because it caused variation in flow to the separator due to the increased liquid depth when
aeration was increased.
3.2.3 Granular Separator Description
The separator was an 18-inch diameter, 80-gal cylinder made of clear acrylic above a painted
steel 45° cone base that connected at the bottom to the underflow recycle line. The height of the
separator from below the effluent launder to the bottom of the cone-shaped base was 7 ft 2 in.
The granular upflow separator had a special inlet nozzle located at a 4 ft liquid depth to provide a
uniform radial discharge of the feed mixed liquor. The resultant superficial upflow velocity was
selected to be high enough to carry out slower settling floc and allow the faster settling granules
to move to the separator bottom for discharge to the granular sludge return line to the preanoxic
reactor. After the first operational period, the acrylic effluent launder was modified by expanding
it to the full separator inner diameter to provide a more uniform upward flow pattern. A
schematic of the separator design is shown in Figure 3-7a, b.
Page 54
34
Figure 3-7. The granular upflow separator, a) during the first operational period, with the original acrylic effluent launder, and b) during the
second operational period, with the modified stainless-steel effluent launder.
Page 55
35
The launders in the two separator designs had separate effluent lines for the overflow to the
clarifier and for flow to the internal recycle pump. As depicted above, the initial launder design
(Figure 3-7a) had its effluent come from the side of the launder, while the second launder design
(Figure 3-7b) had its effluent flow from the bottom to prevent sludge from settling out in the
bottom of the launder.
Influent flow to the granular separator is combined aerobic reactor effluent and recycle of
separator overflow effluent. The separator internal recycle could be varied to allow for higher
upflow superficial velocity than from only the aeration tank effluent flow. The approximate
range of superficial upflow velocities used was from 3 to 11 m·hr-1. The internal recycle was
done using a Verder Inc. Verderflex peristaltic pump (Macon, Georgia, USA). The flow recycle
could be varied from 0 to 4 gpm. The separator return underflow was pumped by a Rotho
peristaltic pump made by Keco Pumps (San Diego, California, USA). This pump was operated
primarily at 0.75 gpm, aside from a short stint at 0.5 gpm, and it was rated for 0.1 gpm to 1.7
gpm.
There were no sampling taps on the granular separator column, however, the sampling taps were
located on the separator overflow and underflow lines. The overflow sampling was located
slightly upstream of the secondary clarifier and the underflow tap was upstream of the return
flow peristaltic pump.
Page 56
36
3.2.4 Secondary Clarifier Description
The secondary clarifier was designed and manufactured by KC employees using a 250-gal
McMaster-Carr® polyethylene plastic easy drain tank and steel base as a foundation. The tank
had an internal diameter of 43 in, a height of 54.75 in, and a bottom slope of 19°. The scraper,
scraper motor, and feed well were supported by a Unistrut™ frame. The relative orientations of
the effluent weirs, the overflow, and the support structure is illustrated below in Figure 3-8.
Figure 3-8. A top view of the secondary clarifier.
Page 57
37
Figure 3-9. A profile view of the secondary clarifier.
The clarifier influent line was gravity fed through 1-inch PVC pipe into a 6-inch PVC pipe
within a 12-inch PVC pipe, which together composed the feed well (Figure 3-9). Effluent
overflows at the surface into three 1-in diameter PVC pipes, evenly distributed around the
circumference. A 3-in diameter PVC overflow bulkhead fitting to a drain is located a few inches
above the water line to prevent the clarifier from overflowing and flooding the pilot area. During
the second operational period the scraper rotational speed was 1 rpm using a ½-Hp motor with an
1800:1 gearbox from Hub City (Beloit, Wisconsin, USA). During the first operational period
(October 17, 2019 – November 25, 2019), a similar ¼-Hp motor was used but failed, requiring
the pilot plant shut down.
Page 58
38
RAS from the bottom of the clarifier was pumped at 1-2 gpm in a 1-inch PVC pipe to either the
aeration tank or the first anaerobic tank using a Grace SoloTech ST23 peristaltic pump
(Minneapolis, Minnesota, USA). Sludge wasting for SRT control was done from the RAS line.
During the first operational period wasting was done 5-days per week by manually turning ball
valves to direct RAS flow to a plastic 50-gal tank used to measure and sample the waste
activated sludge (WAS). During the second operational period, a Masterflex peristaltic pump
was used to waste with a ChronTrol tabletop controller to run the pump for 15 min every 3 hr, 7-
days per week (San Diego, California, USA). The same batch tank was also used for measuring
and sampling the waste sludge 5-days per week.
3.3 Sampling Program
The sampling program involved a sample schedule followed by KC and UW, sample handling
and storage procedures, and sampling methods for the sidestream and mainstream systems.
3.3.1 Sample Handling
A sampling program was established with KC staff assisting at the plant and the sampling by
UW was done 2-3 times per week. Consistent sampling and standard storage techniques were
used. Samples for TBOD, TCOD, alkalinity, and mixed liquor samples for TSS, VSS, and
granule size distributions were stored at 4°C until analyzed. Samples for soluble COD, inorganic
nitrogen, orthophosphate, and acetate, were taken and immediately filtered using a 0.45-µm
syringe filter and then stored at 4°C until analyzed. A storage cooler and reusable frozen gel
packs were used to keep samples cold during transportation from WPTP to UW. Once samples
arrived at UW, they were immediately stored at 4°C until they were removed for analysis.
Page 59
39
Samples which were collected by KC employees for analysis at UW were stored on site at 4°C
until they were picked within 24-72 hrs by a UW researcher. According to Armenta (2019),
difference in holding times of influent and effluent liquid samples from 1 to 3 days, did not
influence analytical measurements.
3.3.2 Sidestream Reactor Sampling Methods
All the samples from the sidestream SBR were taken at the 2-ft tap after opening and ejecting
300-500 mL of the reactor liquid, the ejected volume was returned to the reactor after the
sampling period. The centrate, WPTP final effluent dilution water, and decant effluent were
sampled using a plastic dipper. Both the centrate and WPTP final effluent dilution water were
sampled from their feed containers, close to the outlet pipes. The decant effluent sample was
taken after the decant effluent collection tank was manually well mixed. Furthermore, because
granules tended to accumulate in the decant tank during draining after each cycle, the tank was
flushed prior to the next decant sampling event. For granular size distribution analysis,
approximately 500 mL of mixed liquor was sampled into a 1-L beaker during aeration, the 2-ft
tap was flushed prior to sampling. Then, the 1-L beaker was well mixed by a magnetic stir plate
and bar while removing two samples of 20-30 mL a broken-tip plastic pipette. For MLSS and
MLVSS analysis, 400 mL was taken from the 2-ft tap during the aeration phase, after the tap was
flushed. The granules were then lightly blended to get a more uniform TSS concentration
distribution in the 400-mL sample. Then, two samples of 8-12 mL were taken from the mixed
blended sludge using a plastic pipette.
Page 60
40
3.3.3 Mainstream Sampling Methods
The mainstream pilot plant required sampling locations at the preanoxic tank, both anaerobic
reactors, the aeration tank, the separator underflow and overflow, and at the RAS line, to ensure
that operations and performance could be properly tracked. Furthermore, as with the sidestream,
any sampling done through a tap was first flushed by 300-500 mL of the liquid in the reactor.
After the sampling periods, the flushed volume was returned to the reactor. Samples from the
anoxic reactor were sampled using the 4-ft sampling tap, immediately after the Pulsair unit
mixed the reactor. Both the first and second anaerobic reactors were sampled from their 4-ft
sampling taps. Because those reactors had continuous mechanically mixing, there was no sample
timing constraint. The aerobic reactor was sampled from the lower sampling tap, at 4.5 ft. The
separator overflow was sampled from a ball valve from the effluent pipe to the secondary
clarifier. This line was also flushed before sampling, and the flushed volume was poured into the
clarifier feed well. The separator underflow was sampled, just upstream of the granular sludge
return pump, using a similar ball valve as the overflow. Again, the line was flushed before
sampling and the flushed volume was poured back into the aeration tank.
The waste activated sludge (WAS) sampling method was different for operating phase 1 and 2.
For both periods a plastic dipper was used to sample the WAS tank. During the phase 1, RAS
wasting was done in 2 to 3 10-to-30-gal batches, spaced throughout the workday. A 100-mL
sample was collected in a sample container from the WAS tank for each batch. After wasting had
been concluded, the samples were mixed to create a daily WAS sample. During phase 2, because
wasting was done automatically, one of the eight daily wasting events was sampled. Samples
were taken from the WAS batch waste tank by closing the drain valve before a wasting event.
Page 61
41
Then, after the wasting event, the WAS was mixed, sampled into a sample container, and the
drain valve was opened. The mainstream influent and effluent were sampled using two separate
refrigerated 24-hr composite samplers. The influent was sampled from a PVC wet well which
was fed primary influent from same line feeding the first anaerobic tank. The sump was fed
primary effluent at the bottom and had an effluent weir at the top, allowing for composite
samples, taken once per hour, to measure the influent to the pilot. The pilot plant effluent was
sampled between two of the effluent collection pipes, close to the secondary clarifier wall, from
1 ft below the liquid level, once per hour. The composite samplers were sampled and reset every
24 hours during the week and every 72 hours for the weekend.
3.4 Analytical Methods
Nutrient concentrations were determined using a Thermo Scientific™ Gallery™ Automated
Photometric Analyzer. This device was used to spectrophotometrically measure NH3-N, NO2--N,
NO3--N, and orthophosphate for the entire study period. The respective wavelength and method
used for each parameter is shown in Table 3-3.
Page 62
42
Table 3-3. Summary of the spectrophotometric methods used to measure soluble nutrient concentrations.
Parameter Wavelength
(nm)
Method Used Reference
NH3 660 ISO 7150 (ISO, 2017)
NO2- 540 SM 4500-NO2
- (APHA, 2005)
NO3- 540 SM 4500-NO3
- (APHA, 2005)
PO43- 880 SM 4500-P.E. (APHA, 2005)
SM – Standard Methods for the Examination of Water and Wastewater, 2005
ISO – International Organization for Standardization
The NH3-N, NO2--N, and PO4
3--P concentrations were measured directly using the methods
described above. However, NO3--N was measured indirectly by reducing NO3
- to NO2-, then
measuring total oxidized nitrogen species and subtracting the NO2- concentration from the result.
Acetate COD concentrations were measured using a Thermo Scientific™ Dionex™ ion
chromatography system (ICS) (Pfaff, 1993). Standards for the above tests were batched at least
every three months by dissolving the appropriate salts (NH3Cl, NaNO2, NaNO3, KH2PO4, NaAc)
into Milli-Q® ultrapure water (Resistivity = 18.2 MΩ-cm at 25°C).
Total suspended solids (TSS), volatile suspended solids (VSS), and sludge volume index (SVI)
tests were performed according to Standard Methods 2540 D, 2540 E, and 2710 D, respectively
(APHA, 2005). Furthermore, the SVI tests were conducted using a 1.4-L cylindrical Settleometer
(Raven Environmental Products, St. Louis, Missouri, USA).
Page 63
43
Additional tests were conducted by WPTP on-site process lab. The tests conducted and the
methods used are detailed in Table 3-4.
Table 3-4. Summary of tests performed by WPTP process lab, and the Standard Methods procedures
followed (APHA, 2005).
Test Method Used
TSS SM 2540 D
VSS SM 2540 E
tCOD SM 5220 B
sCOD SM 5220 B
BOD5 SM 5210 B
Alk SM 2320 B
SM – Standard Methods for the Examination of Water and Wastewater, 2005.
Hach Intellical™ LDO101 and PHC101 probes were used with HQD portable meters to measure
DO and pH respectively, during the mainstream batch kinetic tests (Loveland, Colorado, USA).
The LDO101 probe was a plastic-body laboratory model, whereas the PHC101 probes was a
stainless-steel-body model. The DO probe was calibrated using a 1-pt automatic air calibration
method, according to the manufacturer’s guidelines. Additionally, based on the Hach’s
guidelines, the pH probe was calibrated using a 2-pt (7.0 and 10.01) standard curve.
Granule and floc morphologies were observed and photographed with a ZEISS Stemi 508
stereomicroscope (Oberkochen, Germany) and an Olympus BH-2 polarizing trinocular light
microscope (Shinjuku, Tokyo Japan). The stereomicroscope images were captured and scaled by
an Axiocam ERc 5s microscope camera and ZEN lite software. Light microscope images were
Page 64
44
captured by either an Olympus digital camera mounted to the microscope or a Motorola MOTO
G5 smartphone camera through the viewfinder.
3.4.1 Sieve Analysis and Size Distribution
The relative proportion of different sized granules in the mainstream and sidestream were
determined by using a series of small stainless-steel sieves, at descending mesh sizes. The sieves
were 1.25-in tall with a 3-in diameter. The various sieves used in the sidestream and the
mainstream are detailed below in Table 3-5.
Table 3-5. Summary of the sieves for the mainstream and sidestream mixed liquor samples to determine
the granular size distribution.
Sieve
Mesh
Mesh
Opening
Sieve
Mesh
Mesh
Opening
Sieve
Mesh
Mesh
Opening
No. mm No. mm No. mm
Sidestream Size Distribution Analysis Sieves
70 0.212 18 1.00 10 2.00
40 0.425 16 1.18 8 2.36
30 0.600 14 1.40 7 2.80
20 0.850 12 1.70
Mainstream Size Distribution Analysis Sieves
70 0.212
40 0.425
20 0.850
12 1.70
The sieves used in the sidestream size distribution analysis were determined by Armenta (2019)
and were carried through for this phase of the project to maintain data consistency. A reduced
number of sieves were used in characterizing the mainstream granule size distribution to allow
for the management of multiple samples per week. Four sieve sizes were chosen, 0.212 µm,
Page 65
45
0.425 µm, 0.850 µm, and 1700 µm, to cover the range of granule sizes typically present in the
study.
The size distribution sieve method used for both the sidestream and the mainstream mixed liquor
involved stacking the sieves from the smallest mesh size at the bottom to the largest mesh size at
the top. Then, a plastic beaker was placed underneath the sieve stack to catch any particles or
water which fell through the bottom mesh. Next, a 20-30 mL sample was poured over the top
sieve and DI water was rinsed over the top mesh until all particles smaller than the mesh size had
passed through the mesh. Once all the particles smaller than the mesh size had been washed
through, the size was backwashed into a container labeled with the mesh size of that sieve. This
process, of wash, remove, backwash, was then repeated for each sieve in the stack. Once all
sieves had been processed, TSS and VSS were measured for each size range using Standard
Methods 2540 D and E (APHA, 2005).
The particle size distribution, assuming the granules were spherical, was then calculated by
Equation 3-1 (Armenta, 2019).
𝐹𝑟𝑎𝑐𝑡𝑖𝑜𝑛 𝑜𝑓 𝑀𝑎𝑠𝑠 𝑓𝑜𝑟 𝑝𝑎𝑟𝑡𝑖𝑐𝑙𝑒 𝑠𝑖𝑧𝑒 𝑟𝑎𝑛𝑔𝑒 (𝐹𝑀𝑛) =𝑇𝑆𝑆𝑛
∑ 𝑇𝑆𝑆𝑛𝑛1
where TSSn = mass retained on sieve n divided by total sample volume
Equation 3-2 was used determine the average granule size.
𝑊𝑒𝑖𝑔ℎ𝑡𝑒𝑑 𝑎𝑣𝑒𝑟𝑎𝑔𝑒 𝑑𝑖𝑎𝑚𝑒𝑡𝑒𝑟 𝑜𝑓 𝑚𝑖𝑧𝑒𝑑 𝑙𝑖𝑞𝑢𝑜𝑟 𝑔𝑟𝑎𝑛𝑢𝑙𝑒𝑠, 𝑚𝑚 = ∑ 𝐹𝑀𝑛(𝐷𝑛)
𝑛
1
(3-1)
(3-2)
Page 66
46
where n = sieve size sequence number
Dn = average size of opening of sieve n and sieve n-1, mm
3.4.2 Quantitative Polymerase Chain Reaction
All quantitative polymerase chain reaction (qPCR) analyses and preparations were performed by
Bao Nguyen Quoc, a UW PhD Candidate under the GOALI project. Mixed liquor sludge
samples were regularly collected from the mainstream and sidestream reactors to track the
relative abundances of AOBs, NOBs, GAOs, and PAOs. Granules were sieved using 212, 425,
600, 850, 1180, and 1400 µm sieves to determine the relative abundance within each size
fraction.
Granules of each size fraction, or flocculent sludge, was transferred into 2-mL microtubes and
centrifuged at 16,000 xg for 2 min in a Centrifuge 415D (Eppendorf, Germany). The supernatant
was discarded, and the pellet was stored at -80 °C until analyzed. DNA was extracted, mostly
following the manufacturer’s guidelines, from 70 – 80 mg of AGS or floc, using DNeasy
PowerBiofilm Kit (Qiagen, Germany). There were three deviations from the guidelines, 1)
PowerBiofilm bead tubes were incubated at 65 °C for 10 min, 2) a Bead Beater FastPrep®-24
Instrument (MP, USA) was used for the mechanical cell lysing step at 4 m/s for 20 s, and 3)
DNA samples were incubated with 200 µL of inhibitor removal solution for 30 min. DNA
concentration and quality were first examined spectrophotometrically using a NanoDrop 2000,
then DNA concentration was diluted with Ultrapure™ DNase/RNase-Free distilled water to 2
ng/µL. The DNA concentration was determined using the Qubit™ dsDNA HS Assay kit
(ThermoFisher Scientific, USA).
Page 67
47
qPCR was performed using a Roche LightCycler 96 (Roche, Germany), with a total volume of
10 µL composed of 5 µL SensiFast™ SYBR® No-ROX Kit 2X (BioLine, USA), 0.5 µm of each
primer, and a 4 ng DNA template. The primers used for qPCR are shown in Table 3-6.
Table 3-6. Primers used for qPCR (provided by Bao Nguyen Quoc).
Target Primer Sequence Amplicon length Reference
16S rRNA PAO
PAO-651f
PAO-846r
CTGGAGTTTGGCAGAGGG
GTTAGCTACGGCACTAAAAGG
195
Fukushima et al.
(2007)
Competibacter
(GAO)
GAO-Gbf
GAO-Gbr
GAGTGGGCTAGAGGATCGTG
TTCCCCRGATGTCAAGGCC
Fukushima et al.
(2010)
Bacterial amoA
gene (AOB)
amoA-1F
amoA-2R
GGGGTTTCTACTGGTGGT
CCCCTCKGSAAAGCCTTCTTC
491
Rotthauwe et al.
(1997)
3.4.3 Fluorescence in situ Hybridization
Fluorescence in situ hybridization (FISH) analyses and sample preparations were performed by
Bao Nguyen Quoc, a UW PhD Candidate, under the GOALI project. Mainstream and sidestream
reactor mixed liquor sludge samples were collected periodically to visualize the granule
microbial distribution. Granular sludge samples were transferred into 2-mL microtubes and
centrifuged at 16,000 g for 2 min and the supernatant was discarded. The granular sludge was
then immediately resuspended with 4% paraformaldehyde and set on ice for 120 mins. This step
is referred to as fixation and prevents cell lysis while making the cell walls permeable for
hybridization. After the granules were fixed, the sample was centrifuged at 16,000 g for 2 mins
Page 68
48
and the paraformaldehyde supernatant was discarded. Subsequently, the granular sludge was
resuspended with 1x phosphate buffer saline (PBS), centrifuged at 16,000 g for 2 min, and the
supernatant was then discarded. The PBS wash was repeated once. Samples were then stored in
Ethanol/PBS 1.25:1 solution at -20°C until analyzed. The ethanol solution keeps the granules
from being frozen.
Fixed granules were removed from the Ethanol/PBS solution and rinsed with Milli-Q water
before being frozen at -10°C in a tissue freezing medium (Richard-Allan Scientific™ Neg-50™,
ThermoFisher Scientific, USA) and cut into 10-14 µm slices using a microtome-cryostat
(CryoStar NX50, Thermofisher Scientific, USA). The slices accounted for between 0.3 and 7%
of the granule biofilm depth, depending on the granule diameter. Then, granule slices were
adhered to gelatin-coated glass microscope slides and incubated at 46°C until dried. Each slide
had 6 wells separated with a Teflon coating to prevent mixing of probes between wells. The
granule cells were then dehydrated by dipping the slides in three consecutive ethanol solutions
(50%, 80%, and 90% (v/v) concentrations) for 3 mins each. Next, 10 µL of hybridization buffer
solution (0.9 M NaCl, 0.02 M Tris-HCl, 35% (v/v) formamide, 0.02% (w/v) sodium dodecyl
sulfate (SDS)) was added to each well. Afterwards, 1 µL of fluorescently labelled
oligonucleotide probe mix (0.5 pmol for Cy3/Cy5 and 0.83 pmol for fluorescein-labelled probes)
was added to each well. Hybridization then took place in a humid chamber for 6 hrs at 46°C.
Immediately after hybridization, unbound probes were washed off by placing the slide above a
60°C water bath and adding 20 µL of washing buffer (20mM Tris-HCl (pH 8), 0.01% (w/v)
SDS, 0.08 mM NaCl, and 0.005 mM EDTA), preheated to 60°C, to each well, and set for 3 min.
Page 69
49
The washing buffer was then replaced with new washing buffer, and this was repeated for 20
min. Afterwards, the slides were rinsed with Milli-Q water twice and set to air dry in a dark room
and room temperature.
Prior to observation under the microscope, 2 µL of antifade fluorescent mounting medium
(20mM Tris (pH 8.0), 0.5% N-propyl gallate, and 90% glycerol) was added to each well and the
slide was covered with a cover slip. Then, slices were observed using a Zeiss Axioskop 2 MOT
microscope (LSM 5 pascal, Carl Zeiss, USA), which was equipped with a mercury lamp, an
argon laser (453-514 nm), a green helium/neon laser (543 nm), and a red helium/neon laser (633
nm). The FISH probes used are shown in Table 3-7.
Table 3-7. FISH probes used in this thesis (provided by Bao Nguyen Quoc).
Probe Sequence Target Fluorescent dyes Position
PAO 462
PAO 651
PAO 846
CCGTCATCTACWCAGGGTATTAAC
CCC TCTGCCAAACTCCAG
GTTAGCTACGGACTAAAAGG
PAO Cyanine 5
Cyanine 5
Cyanine 5
5’
5’
5’
GAO Q989
GAO Q431
TTCCCCGGATGTCAAGGC
TCCCCGCCTAAAGGGCTT
GAO Fluorescein
Fluorescein
5’
5’
NSO190
NSO1225
CGATCCCCTGCTTTTCTCC
CGCCATTGTATTACGTGTGA
AOB Cyanine 3
Cyanine 3
5’
5’
Page 70
50
3.5 Biological Kinetics Tests
3.5.1 Mainstream Specific Nitrification Rates
During the second mainstream operational period, weekly batch tests were performed to
determine the aeration tank mixed liquor specific nitrification rates (SNRs). The NH3-N removal,
NO2-N production, and NO3-N production rates were determined for aeration tank granular
sludge, flocculent sludge, and overall mixed liquor. The batch tests were performed at 2 mg·L-1
DO concentration to observe nitrification rates at a similar DO concentration to the mainstream.
The test procedure consisted of first obtaining 3 liters aeration tank mixed liquor in a 1-L beaker
and a 2-L plastic container. The 1-L beaker was used to test the overall mixed liquor SNR
directly, while the 2-L plastic container was sieved to obtain the flocculent and granule mixed
liquor samples. After a 10-min settling period in the 2-L container the supernatant was poured
off. The remaining mixed liquor was then sieved on a 212-µm sieve to capture the granular
sludge. To ensure that no particles stuck to the granules and that all material was provided with
ample opportunity to pass through the sieve, mainstream pilot effluent was used to thoroughly
rinse the material retained on the sieve. The flocculent (passing) and granular (retained) sludges
were collected in separate containers. Once the 2 L of mixed liquor had been sieved, the granular
sludge and flocculent sludge were diluted individually with mainstream pilot effluent to a total
volume of 1 L, each.
Each of the three sludge samples (mixed liquor, mixed liquor granules, and mixed liquor
flocculent sludge) were then tested with the procedure described below. One liter of the sample
to be tested was placed in a 1-L beaker and spiked with 30 mL of 1000-mg·L-1 NH3-N stock
Page 71
51
solution. A porous stone was used to distribute air/N2 flows to maintain an average DO of 2
mg·L-1. The DO generally ranged from 1.5 to 2.5 mg·L-1. Additionally, CO2 could be delivered
through the porous stone to maintain a pH of 7-8. Because the gas flow through the stone was
often insufficient to keep the beaker fully mixed, supplemental mechanical mixing was supplied
using a magnetic stir plate and bar. The stir plate speed was minimized while ensuring the
particles were sufficiently suspended. The batch test reactor was sampled at the beginning of the
experiment and every 10 min for between 50 min and 60 min for NH3-N, NO2-N, and NO3-N
concentrations. At each sampling interval, the DO, pH, and temperature was recorded. At the end
of the sampling period, at least two 10-mL samples of the test beaker liquid were taken for TSS
analysis.
The NH3-N removal, NO2--N production, and NO3
--N production rates were determined by
fitting a linear trend line to Excel® data plots. The rates were then corrected to 20°C using a
temperature activity coefficient of 1.072 (Melcer et al, 2003). Furthermore, the rates were
divided by the VSS concentration to obtain the specific rates (mgN/gVSS-hr). The NO2--N
production rate was determined by the sum of the NO3--N and NO2
--N accumulation rates, to
account for NO2--N that was converted to NO3
--N. The test NH3-N removal rate was then
checked with the NO2--N production rate to validate the test. In cases where the NO2
--N
production rate was greater than that NH3-N removal rate, the NO2--N production rate was used
to determine the SNR. The lower observed NH3-N rate could have been affected by NH3-N
production from biomass endogenous decay.
Page 72
52
3.5.2 Sidestream Anaerobic Acetate Utilization Kinetics
To better understand the acetate utilization kinetics in the sidestream SBR, two tests were
conducted on August 26 and September 30, 2019. The tests were conducted by sampling during
the anaerobic phase of the sidestream SBR. The anaerobic phase was fully mixed with nitrogen
gas and consisted of a 5-min idle phase, a 10-min acetate feeding period, and a 45-min uptake
period.
Samples were collected and handled according to Sections 3.3.1 and 3.3.2. However, ejected
reactor liquid, used to clear the sampling line before each sample, was returned to the SBR every
5 mins. The total volume taken from the reactor was about 10%, so with the regular return
sampling and ejecting did not cause a significant change in reactor volume. Sampling was started
at the beginning of anaerobic feeding and occurred every 1 to 1.5 minutes for the first 25
minutes, then every 5 mins for the remainder of the anaerobic phase. A total of 23 and 22
samples were collected on August 26 and September 30, respectively. The samples were then
analyzed for acetate-COD using an ICS (Section 3.4).
3.6 Biological Kinetics Computations
Specific nitrification rates (SNRs) for the sidestream granular sludge is an important parameter
for assessing the nitrification capacity of the bioaugmented biomass and the potential impact for
nitrogen removal in the mainstream system. The SNRs of the mainstream mixed liquor was also
an important parameter for assessing the impact of bioaugmentation and the fate of the
sidestream fed granules. Determining the SNR value of the mixed liquor in the sidestream
reactor and mainstream aeration tank relied on mass balance computations that included the
Page 73
53
reactor influent and effluent NH3-N concentrations and considerations of contributions by
influent organic nitrogen and consumption for growth of heterotrophic bacteria. The following
subsections describe the computational procedure to determine the SNR of the sidestream
granules and the SNR of the mainstream aeration tank mixed liquor. In addition, the procedure to
determine the acetate uptake biokinetics during feeding in the anaerobic phase of the sidestream
SBR is presented.
3.6.1 Sidestream Specific Nitrification Rate
The sidestream SNR was calculated by determining the amount of feed NH3-N that was nitrified,
the rate that it was oxidized, and dividing by the reactor VSS concentration. All mass
calculations were normalized to the feed flow. The amount of NH3-N nitrified accounts for the
influent, effluent and cell synthesis.
𝑁𝑂 = 𝑁𝑜 − 𝑁𝑒 − 𝑁𝑠𝑦𝑛
where NO = NH3-N nitrified, mg/L
No = Influent NH3-N, mg/L
Ne = Effluent NH3-N, mg/L
Nsyn = Nitrogen used for biomass growth, mg/L
The NH3-N used in cell synthesis was calculated based on the net biomass production, or net
yield, from heterotrophic biomass growth on the acetate COD fed, cell debris from endogenous
decay, and reactor SRT using Equation 3-4, which was adapted from Tchobanoglous et al.
(2014).
(3-3)
Page 74
54
𝑌𝑛𝑒𝑡 = 𝑌
1 + (𝑏20 ∙ 𝑏,𝜃𝑇−20) ∙ 𝑆𝑅𝑇
+𝑓𝑑 ∙ (𝑏20 ∙ 𝑏,𝜃
𝑇−20) ∙ 𝑌 ∙ 𝑆𝑅𝑇
1 + (𝑏20 ∙ 𝑏,𝜃𝑇−20) ∙ 𝑆𝑅𝑇
where Ynet = net mass of biomass produced for mass of COD removed, gVSS/gCOD
Y = synthesis growth MLVSS of biomass produced from COD consumption,
gVSS/gCOD
b20 = biomass specific endogenous decay coefficient at 20°C, gVSS/gVSS-d
T = temperature, °C
b,Ɵ = endogenous decay coefficient correction for temperature, unitless
fd = debris production from endogenous decay, gVSS/gVSS
SRT = biomass SRT in SBR reactor, days
The coefficient values used for Equation 3-4 are shown in Table 3-8.
Table 3-8. Parameters and coefficient values from Tchobanoglous et al. (2014), used in calculating the
NH3-N used for net biomass production.
Parameter Value Units
Y 0.45 gVSS/gCOD
b20 0.12 gVSS/gVSS-d
b,Ɵ 1.04 Unitless
fd 0.12 gVSS/gVSS
The amount of nitrogen used for synthesis was then determined from the net biomass yield, the
amount of acetate COD used, and a biomass nitrogen content of 12% (Tchobanoglous et al.,
2014), as shown by Equation 3-5.
(3-4)
Page 75
55
𝑁𝑠𝑦𝑛 = (0.12)(𝐶𝑂𝐷)(𝑌𝑛𝑒𝑡)
where Nsyn = NH3-N used for biomass production, mg/L
COD = acetate COD used, mg/L
The sidestream reactor nitrification rate equals the amount of NH3-N oxidized per hour during
the SBR 4.5-hr aeration phase.
𝑅𝑛𝑖𝑡 = 𝑁𝑂
𝑡𝑎𝑒𝑟
where Rnit = NH3-N oxidation rate, mg/L-hr
taer = SBR cycle aeration time, hr
The SNR equals the nitrification rate divided by the MLVSS concentration.
𝑆𝑁𝑅 = 𝑅𝑛𝑖𝑡
𝑋
where SNR = specific nitrification rate, mg/g-hr
X = reactor MLVSS concentration, g/L
3.6.2 Mainstream Aeration Tank Nitrification Rate and Specific Nitrification Rate
The nitrification in the mainstream aeration tank and SNR of the mixed liquor was determined in
the same manner as that for the sidestream reactor with the exception that it included the
biodegradable organic nitrogen in the influent primary effluent (PE) wastewater in addition to
the NH3-N. Organic nitrogen plus inorganic NH3-N is represented by total Kjeldhal nitrogen
(TKN). The PE influent TKN value was determined from the influent NH3-N concentration data
(3-5)
(3-6)
(3-7)
Page 76
56
by using a ratio of TKN:NH3-N based on weekly analysis of TKN and NH3-N composite PE
samples by the KC laboratory from July 29, 2019 to March 2, 2020. The data is tabulated in
Appendix B and the average NH3-N/TKN ratio was 0.686 (TKN/NH3-N = 1.46) with a standard
deviation of 0.046.
Not all of the organic nitrogen is biodegradable and based on typical wastewater characteristic
parameter values from Melcer et al (2003) and mainstream influent wastewater characteristics
measured in Phase 2, 95% of the influent TKN concentration was assumed to be bioavailable for
conversion to NH3-N for nitrification. The assumptions and parameters used in the calculation of
biodegradable influent TKN concentration from the influent NH3-N concentration measured are
summarized in Table 3-9.
Table 3-9. Parameters and assumptions used to calculate the influent biodegradable TKN concentration.
Parameter Relationship Units Reference
TKN 1.46 gTKN-N/gNH3-N mg/L KC NH3-N Data
ubCOD 0.09•tCOD mgCOD/L BioWin
ubTKNp 0.05•ubCOD mgN/L Melcer et al, 2003
ubTKNs 0.02•TKN mgN/L BioWin
ubTKN ubTKNs + ubTKNp mgN/L Melcer et al, 2003
tCOD = Total influent COD, ub = unbiodegradable, TKNp = particulate organic N, TKNs =
soluble organic N, BioWin = Envirosim BioWin Biological Process Software Model wastewater
characterization default value
Based on characteristics of the weekly average PE concentrations fed to the mainstream reactor,
the fraction of total unbiodegradable TKN to influent TKN ranged from 0.050 to 0.057 g/g. A
fraction of 0.05, or 5%, was selected to best estimate the bioavailable influent TKN. The
mainstream bioavailable influent TKN was then calculated as follows:
Page 77
57
𝑏𝑇𝐾𝑁𝑜 = 𝑁𝑜(1.46)(0.95)
where bTKNo = bioavailable influent N, mg/L
1.46 = gTKN/gNH3-N
0.95 = gbTKNo/gTKN
No = influent NH3-N concentration, mg/L
The amount of nitrification in the aeration tank is the difference between the influent bTKN and
effluent NH3-N concentration minus the amount of nitrogen used for cell synthesis.
𝑁𝑂 = 𝑏𝑇𝐾𝑁𝑜 − 𝑁𝑒 − 𝑁𝑠𝑦𝑛
where bTKNo = bioavailable influent nitrogen, mg/L
The equations to determine the amount of nitrogen used for biomass synthesis (Nsyn) is the same
as that used in 3.6.1 to calculate the Ynet (Equation 3-4) and Nsyn (Equation 3-5).
The mass of nitrogen oxidized in mg/d is:
𝑚𝑁𝑂 = 𝑄(𝑁𝑂)
where mNO = mass of nitrogen oxidized, mg/d
Q = influent flow rate, L/d
The aeration tank nitrification rate is then:
𝑅𝑛𝑖𝑡 =𝑚𝑁𝑂
(24)(𝑉𝑎𝑒𝑟)
where Vaer = aeration tank volume, L
(3-8)
(3-9)
(3-10)
(3-11)
Page 78
58
Rnit = nitrification rate, mg/L-h
24 = h/d
The SNR is calculated as before by Equation 3-7:
𝑆𝑁𝑅𝑎𝑒𝑟 =𝑅𝑛𝑖𝑡
𝑋𝑎𝑒𝑟
where SNRaer = specific nitrification rate in the aeration tank, mg/gVSS-h
Xaer = MLVSS concentration, g/L
3.6.3 Sidestream Anaerobic Acetate Utilization Kinetics
Acetate utilization kinetics during feeding in the sidestream SBR anaerobic phase are described
by Michaelis-Menten kinetics for substrate utilization.
𝑅𝑠 =𝐾𝑆𝑋
𝐾𝑠 + 𝑆
where Rs = substrate utilization rate, mg/L-hr
S = substrate COD concentration, mg/L
X = solids concentration, mgVSS/L
K = maximum specific substrate utilization rate coefficient, mgCOD/mgVSS-min
Ks = half-velocity coefficient, mg/L
The acetate kinetics were evaluated with in situ tests (Section 3.5.2) and the maximum uptake
rate (K) and the apparent half-saturation constant (Ks) were determined using Mathworks
Matlab®. A mass balance describes the acetate COD uptake during the feeding period. The
(3-13)
(3-12)
Page 79
59
change in volume during feeding is ignored because the fed volume was a small fraction of the
mixed volume after decanting; only about 0.7%.
𝑉𝑑𝑆𝑡
𝑑𝑡= 𝑄𝑆𝑓 −
𝐾𝑆𝑡𝑋𝑉
𝐾𝑠 + 𝑆𝑡
This reduces to:
𝑑𝑆𝑡
𝑑𝑡=
𝑄
𝑉𝑆𝑓 −
𝐾𝑆𝑡𝑋
𝐾𝑠 + 𝑆𝑡
where V = reactor volume, 88 L
St = acetate COD concentration at time t, mgCOD/L
Sf = acetate feed COD concentration, mg/L
Q = acetate feed rate, L/min
After feeding stopped the acetate COD concentration was always greater than 100 mg/L. Thus,
there was a period when S was much greater than Ks and the acetate uptake was linear.
Therefore, the substrate utilization rate for the constant acetate utilization rate is described by:
𝑑𝑆
𝑑𝑡= −𝐾𝑋
Integration with respect to time yields:
𝑆𝑡 = 𝑆𝑡−1 − 𝐾𝑋𝑡
where St-1 = acetate COD concentration at time t-1, mg/L
The polyfit® function in Matlab was used to apply a linear fit to the linear portion of the acetate
uptake curve. The K was then determined from the slope of the fit. Coefficients of determination
(R2) of > 0.99 were achieved using this method for both data sets. After the constant substrate
(3-17)
(3-16)
(3-14)
(3-15)
Page 80
60
uptake period, Equation 3-13 was used to solve for Ks. Without feeding, the substrate utilization
rate was equal to the change in the substrate concentration over time.
𝑑𝑆𝑡
𝑑𝑡= −
𝐾𝑆𝑡𝑋
𝐾𝑠 + 𝑆𝑡
Equation 3-18 was then solved in Matlab® using the ode23® function, which solves differential
equations using an explicit Runge-Kutta method. To determine Ks, the value was varied from 0
in 0.1-unit increments until an R2 of >0.999 was achieved. Once Ks and K had been determined,
Equation 3-15 was solved using ode23® to model the acetate kinetics during anaerobic feeding.
(3-18)
Page 81
61
4 Results and Discussion
The following sections cover the pilot plant field investigation from September 1, 2019 to March
16, 2020. The sidestream pilot SBR was operated continuously for the 6.5-period while the
mainstream CFAS pilot had two operating phases. In Phase 1 the mainstream was started up on
October 17, 2019 with KC South Plant EBPR sludge and operated until November 26, 2019,
when it was shut down due to a failure of the secondary clarifier scrapper motor. There was no
granule bioaugmentation during Phase 1 because the flocculent seed sludge began nitrifying
during the first week of operation. Phase 2 began on January 21, 2020. After two weeks (more
than 5 SRTs) of operation with low nitrification, the mainstream was charged with stored
granules and monitored for about 3 weeks before continual bioaugmentation began.
Bioaugmentation lasted for about 3 weeks until the pilot facility was shut down on March 16,
2020 due to restrictions from COVID-19. The operation and results of the sidestream SBR and
mainstream CFAS Phases 1 and 2 are discussed in Sections 4.1, 4.2, and 4.3, respectively.
4.1 Sidestream Operation and Treatment Performance
4.1.1 Sidestream Operating Conditions
The sidestream reactor was operated continuously for over 2 years from its start-up on February
8, 2018 until the shutdown on March 16, 2020. The operational period for this report is from
September 1, 2019 to March 16, 2020. Operating conditions prior to this have been described by
Armenta (2019).
Page 82
62
4.1.1.1 Sequencing Batch Reactor Operating Phases
The sidestream SBR was fed 4 times per day for a 6-hr operating cycle. The reactor operation
had 4 6-hr cycles per day, which included a 55-min anaerobic phase, 4.5-hr aerobic phase, 8-min
of settling, a 3.5-min decant, and a 23.5-min idle phase (Figure 4-1). The 55-min anaerobic phase
had 5-min of N2 sparge mixing before a 10-min acetate feed period. Within 5 min after the start
of the aeration phase, the feed centrate (13.5 L) and final effluent dilution water (74.5 L) were
added over a 15-min period. These same operating conditions were used the month prior to this
study.
On January 10, 2019, the acetate feeding period was increased to 15 minutes, but the same
volume was fed by decreasing the feed pumping rate. The change was made to lower the bulk
liquid acetate COD concentration during the feeding period, based on the rationale that a lower
bulk liquid concentration results in lower biofilm penetration depth by diffusion and would thus
favor smaller size granules. A smaller average granule size for the same amount of biomass
produced would increase specific surface area, which is expected to then increase the specific
nitrification rate because most of the nitrifiers grow on the oxygen rich outer portion of the
granules.
Page 83
63
Figure 4-1. Sidestream SBR 6-hr cycle consisting of anaerobic, aerobic, settling, decanting, and idle
phases and respective times, and reactor depth. (Adapted from Armenta, 2019)
4.1.1.2 Sidestream Reactor Target NH3-N Loading and Operating Conditions for Study Period
The sidestream reactor NH3-N loading was based on having the sidestream treat 10 to 20% of the
ammonia load normally fed to the secondary process, to represent typical conditions of full-scale
wastewater treatment plants with anaerobic digestion and centrate return. This resulted in
selecting a target NH3-N volumetric loading of 0.30 to 0.35 g NH3-N/L-d. In addition, the target
SRT was set at 25 days, and the reactor DO concentration and feed COD:N were based on
conditions in the previous study that sustained shortcut nitrogen removal and minimized the
required COD feed amount. Minimal changes in operating parameters were made to maintain a
consistent and stable operation. The key operation conditions are summarized in Table 4-1. With
shortcut nitrogen removal, a feed COD:N ratio of 3.5 g/g was adequate in the previous study to
maintain high denitrification efficiency. An effluent NH3-N concentration of 20 mg/L or more
Page 84
64
with a control DO of 2.0 mg/L suppressed NOB growth to produce a high proportion of NO2-N
from nitrification. The DO concentration was increased from 2.0 to 2.2 in mid-September to
increase the nitrification rate of the granular sludge in response to observing lower SNRs than for
previous months of operation.
Table 4-1. Summary of the target operating conditions for the sidestream reactor from September 1, 2019
to March 16, 2020.
Date of
Change
Ammonia
Loading
g NH3-N/L-d
COD:NH3-N
Feed Ratio
gCOD/gN
Target
SRT
days
DO Set
Point
mg/L
9/1/2019 0.30 3.5 25 2.0
9/19/2019 2.2
12/1/2019 0.35
4.1.2 Sidestream Treatment Performance
The results in Figure 4-2 show variations in the NH3-N loading to the sidestream SBR and the
influent and effluent NH3-N concentrations. The influent concentration is based on the combined
flows to the SBR. The NH3-N loading varied from 0.25 to 0.45 g/L-d due to the variations in the
centrate used for each feed batch. However, the monthly average NH3-N loading ranged from
0.25 to 0.35 g/L-d, as shown in Tables 4-2 and 4-3. Variations in the effluent NH3-N
concentration generally followed the influent NH3-N loading variations. However, in March
2020 the effluent NH3-N concentration was higher than for operations at similar NH3-N loading,
and a gradual increase to 100 mg/L was observed. Additionally, in late November 2019 and early
December 2020, a decrease in effluent NH3-N from about 100 to 0 mg/L was caused by an
increase in daily average DO, which gradually increased from 2.3 to 4.6 mg/L. The increase in
DO occurred when the mainstream system was shut down after Phase 1, which resulted in too
Page 85
65
much air flow to the sidestream from the common air feed line until the line pressure regulator
was adjusted.
Figure 4-2. Sidestream reactor NH3-N influent and effluent concentrations, NH3-N loading, and inhibition
events from September 1, 2019 to March 16, 2020.
As shown in Figure 4-3, the percentage of the bioavailable influent nitrogen in the effluent
increased from September 2019 to March 2020 and the nitrification efficiency decreased. The
lower nitrification efficiency in March was affected by a lower reactor MLSS concentration from
increased wasting of granules for bioaugmentation from December to March. Over the
September to March operating period the average nitrification efficiency was 61 ± 10%, the
ammonia used in cell synthesis averaged 4 ± 1% of the NH3-N fed, and the remaining NH3-N
was in the effluent, which averaged 35 ± 10% of the NH3-N fed. However, the average
Page 86
66
nitrification efficiency was above 80% during August and July 2019. After inhibition events
during August and September the average monthly SNR decreased from about 2.5 to 1.25
mgN/gVSS-h (Figure 4-3). Inhibition events were defined as when the acetate COD leakage into
the aerobic phase was ≥ 2% of the acetate COD fed and when the nitrification efficiency
dramatically decreased. The average acetate leakage was 1% between September 2019 and
March 2020. In response to the inhibition events the NH3-N loading was decreased, which
resulted in a monthly average NH3-N loading of 0.25 g/L-d during September. After September,
NH3-N loading averaged between 0.30 and 0.35 g/L-d (Table 4-2, Table 4-3).
Figure 4-3. Sidestream SBR monthly average values for the fate of bioavailable influent nitrogen between
% nitrified, % in the effluent, and % used for biomass synthesis, and monthly average SNR from July
2019 to March 2020.
Page 87
67
The average monthly operating conditions and performance are summarized in Tables 4-2 for
September 2019 through December 2019 and Table 4-3 for January 2020 through March 16,
2020.
Page 88
68
Table 4-2. Monthly average treatment performance for the sidestream reactor between Sep 1, 2019 and
Dec 31, 2019 (standard deviation in parenthesis).
Month
Parameter Units September October November December
7-day Moving Average SRT d 65 (12) 32 (8) 35 (9) 33 (4)
Aeration Phase DO mg/L 2.3 (0.3) 2.4 (0.1) 2.6 (0.6) 2.5 (0.6)
Aeration Phase pH 7.8 (0.1) 7.8 (0.1) 8.0 (0.2) 8.1 (0.1)
Anaerobic Phase pH 7.4 (0.1) 7.4 (0.1) 7.8 (0.2) 8.0 (0.1)
Temperature °C 20.6 (1.7) 18.3 (1.7) 17.1 (0.9) 16.3 (0.4)
MLSS g/L 12.8 (2.0) 14.4 (1.1) 12.1 (0.8) 12.6 (0.9)
MLVSS/MLSS 0.80 (0.02) 0.74 (0.01) 0.73 (0.03) 0.70 (0.02)
Loading
NH3-N loading g/L-d 0.25 (0.03) 0.31 (0.03) 0.30 (0.03) 0.32 (0.04)
Feed COD:N Ratio g/g 3.6 (0.3) 3.8 (0.5) 3.7 (0.1) 3.6 (0.4)
Granular Sludge Characteristics
Diameter mm 1.9 (0.1) N/A 1.57 1.65
SVI30 mL/g 24 (2) 24 (1) 26 (2) 28 (3)
SVI5/SVI30 1.00 (0.00) 1.01 (0.00) 1.01 (0.01) 1.02 (0.01)
Removal Efficiency
NH3-N % 81 (12) 69 (11) 62 (15) 69 (11)
TIN % 74 (6) 67 (10) 54 (4) 61 (9)
SND % 92 (8) 96 (1) 89 (15) 91 (19)
PO4-P % 91 (5) 78 (20) 49 (41) 70 (36)
CODfed/Nremoval g/g 4.7 (1.1) 6.1 (1.2) 6.6 (1.3) 5.6 (0.8)
Effluent
NH3-N mg/L 46.8 (23.1) 48.7 (20.2) 73.6 (21.8) 59.3 (23.3)
NO2-N mg/L 1.9 (2.8) 1.8 (0.6) 3.1 (5.1) 4.4 (9.3)
NO3-N mg/L 0.7 (1.1) 0.5 (0.2) 0.7 (0.8) 1.0 (1.8)
PO4-P mg/L 4.0 (7.3) 2.8 (5.8) 4.8 (6.1) 3.0 (5.5)
Page 89
69
Table 4-3. Monthly average treatment performance for the sidestream reactor between January 1, 2020
and March 16, 2020 (standard deviation in parenthesis).
Month
Parameter Units January February March
7-day Moving Average SRT d 30 (2) 26 (1) 25 (1)
Aeration Phase DO mg/L 2.3 (0.1) 2.3 (0.1) 2.2 (0.3)
Aeration Phase pH 8.1 (0.1) 8.0 (0.1) 7.8 (0.1)
Anaerobic Phase pH 7.9 (0.2) 7.9 (0.1) 7.6 (0.2)
Temperature °C 17.6 (1.0) 17.1 (0.7) 17.0 (0.4)
MLSS g/L 12.8 (0.8) 11.3 (0.5) 8.6 (0.6)
MLVSS/MLSS 0.70 (0.01) 0.69 (0.01) 0.72 (0.02)
Loading
NH3-N loading g/L-d 0.32 (0.02) 0.32 (0.05) 0.35 (0.01)
Feed COD:N Ratio g/g 3.7 (0.3) 3.7 (0.7) 3.2 (0.1)
Granular Sludge Characteristics
Diameter mm 1.4 1.54 1.25
SVI30 mL/g 28 (1) 31 (1) 37 (3)
SVI5/SVI30 1.01 (0.01) 1.01 (0.01) 1.00 (0.00)
Removal Efficiency
NH3-N % 66 (5) 59 (8) 47 (4)
TIN % 62 (4) 53 (9) 43 (3)
SND % 94 (2) 89 (5) 92 (5)
PO4-P % 90 (5) 66 (25) 28 (37)
CODfed/Nremoval g/g 6.0 (0.3) 6.7 (1.0) 7.5 (1.0)
Effluent
NH3-N mg/L 59.9 (11.2) 78.0 (25.4) 105.1 (6.5)
NO2-N mg/L 2.6 (1.1) 4.3 (2.2) 2.8 (1.7)
NO3-N mg/L 0.6 (0.2) 1.0 (0.4) 0.6 (0.4)
PO4-P mg/L 3.1 (5.4) 4.7 (5.0) 13.5 (10.1)
Page 90
70
The phosphorus removal efficiency averaged 28 to 91% (Tables 4.2 and 4.3). The average PO4-P
removal efficiency during November 2019 was 49% which was lower than the preceding and
following months due to two events where the removal efficiency dramatically decreased from
about 90% to about 30% and quickly recovered. Similar events during October and December
caused slightly lower removal efficiencies of 78 and 70%, respectively. The PO4-P removal
efficiency averaged 66 and 25% in February and March, respectively, correlating with a decrease
in MLVSS because of higher wasting for bioaugmentation during those months. Mixed liquor
wasting was curtailed during inhibition events in August and September 2019 (Figure 4-2) which
resulted in an average monthly SRT of 65 days. The average monthly SRT varied between 25
and 35 days after September. The mixed liquor and AGS SRTs of the sidestream reactor versus
time are shown in Figure 4-4. The AGS SRT is longer than the MLSS SRT because flocculent
sludge is disproportionally wasted in the effluent. The effluent percent granules averaged 24%
from September 2019 to March 2020, while the average percent of granules in the reactor MLSS
was 98%. The average granule diameter also increased during September to 1.9 mm, which is
35% larger than the average diameter of 1.4 mm (Armenta, 2019) in the months before
September. The SND efficiency ranged from 89 to 96%, indicating that there always was
sufficient anoxic/anaerobic volume and stored carbon by the PAOs in the inner core of the
granules to result in a high denitrification efficiency at average bulk liquid DO concentrations
between 2.2 to 2.6 mg/L.
Throughout the operational period, the monthly average SVI5/SVI30 ranged from 1.00 to 1.02,
indicating a system dominated by granular sludge system (Table 4-2, Table 4-3). The average
SVI30 ranged from 20 to 31 mL/g for the months prior to March, which averaged 37 mL/g. The
Page 91
71
higher SVI30 may be related to the much lower MLSS concentration of 8.6 g/L during that month
(Table 4-3). The effluent TSS concentrations were between 50 and 120 mg/L, for the entire
operational period, which is typical for the sidestream SBR. However, the manual wasting rate
was increased by about 20% on January 16th and by about 17% on February 27th to increase
bioaugmentation, which caused the MLSS reduction.
Figure 4-4. Sidestream SBR 7-day average MLSS SRT and AGS SRTs from September 2019 to March
2020. Because of the reduced wasting in August and September the AGS SRT ranged from 100 to 600
days (data points not shown).
The monthly average pH during the aeration phase was 7.8 to 8.1 and 7.4 to 8.0 during the
anaerobic phase. Aeration and anaerobic phase pH were about 0.4 units higher than previous
reported pH averages within the reactor (Armenta, 2019). The higher pH was likely a result of
Page 92
72
higher alkalinity within the reactor, resulting from less nitrification of the centrate feed
containing NH4HCO3.
4.1.3 Sidestream Granular Sludge Characteristics
During the 6.5-month operational period the sidestream SBR had a monthly average MLSS of
8.6 to 14.4 g/L, an average granule diameter of 1.25 to 1.90 mm, and an average SVI5/SVI30 ratio
of 1.00 – 1.02 (Tables 4-4). To track the granule size distribution in the sidestream, sieve
analyses were performed monthly during the full operation period (Section 3.4.1). Based on
monthly sieve analysis, the MLSS percent granules in the reactor varied between 95 and 99%.
The lowest MLSS percent granules of 95% was measured in March 2020, which was the same
month for the lowest MLSS concentration and SRT. The SVI5/SVI30 ratios of 1.00 to 1.02 also
show that the mixed liquor was predominantly granular sludge.
Table 4-4. Average monthly granule sludge characteristics for the sidestream reactor (standard deviation
in parenthesis).
Month
Parameter Units September October November December January February March
7-day Moving Average
SRT d 65 (12) 32 (8) 35 (9) 33 (4) 30 (2) 26 (1) 25 (1)
MLSS g/L 12.8 (2.0) 14.4 (1.1) 12.1 (0.8) 12.6 (0.9) 12.8 (0.8) 11.3 (0.5) 8.6 (0.6)
MLSS Percent Granules % 98 (1) N/A 98 99 99 98 95
Average Diameter mm 1.9 (0.1) N/A 1.57 1.65 1.4 1.54 1.25
50th Percentile
Diameter mm 2.0 (0.1) N/A 1.4 1.4 1.0 1.2 1.1
SVI30 mL/g 24 (2) 24 (1) 26 (2) 28 (3) 28 (1) 31 (1) 37 (3)
SVI5/SVI30 1.00
(0.00)
1.01
(0.00)
1.01
(0.01)
1.02
(0.01)
1.01
(0.01)
1.01
(0.01)
1.00
(0.00)
Page 93
73
As shown in Figure 4-5, there was a spike in the abundance of larger granules in early September
2019; the fraction of granules greater than 2900 µm increased 25% between August 8th and
September 9th. This followed the nitrification upsets in August and increase in the reactor SRT to
a high monthly average SRT of 65 ± 12 days (Table 4-4). Furthermore, the average granular size
decreased after September, corresponding to a decrease in SRT, and approached the August 2019
size distribution during December 2019 (Figure 4-5). After December, the average granule
diameter and 50th percentile diameter decreased further, corresponding to a further decrease in
the SRT. The acetate feed time was increased on January 10, 2020, which did not seem to
influence the average granule diameter. The results suggest that the SRT is an important factor
affecting the granular size.
Figure 4-5. Sidestream granule size distribution between August 8, 2019 and March 16, 2020.
Page 94
74
The photos in Figure 4-6 show that the sidestream mixed liquor maintained a relatively spherical
morphology, with nodules growing throughout the granule surfaces. Filaments can be seen
growing off the granules in the photos taken on February 26th and March 16th, which corresponds
to an increased SVI30 during those months. The monthly average SVI30 was from 24 to 28 mL/g
before February 2020 and 31 to 37 mL/g after February (Table 4-4).
Figure 4-6. Images of sidestream aerobic granules taken with a camera mounted to a stereo microscope.
4.1.4 Sidestream Shortcut N Removal
One of the primary goals of the sidestream reactor operation was to maintain shortcut nitrogen
removal, which requires less oxygen for nitrification and less COD for nitrogen removal, by
Page 95
75
supporting AOB growth and suppressing NOB growth. Four criteria used to evaluate the
occurrence of shortcut nitrogen removal are; 1) a frequent effluent NO2--N:NO3
--N concentration
ratio of ≥ 1.0, 2) an AOB:NOB qPCR ratio of > 2.5, 3) a much higher NH3 oxidation rate than
NO2 oxidation rate in batch tests, and 4) a CODused:NOx-Nremoved ratio of significantly less than
4.8 g/g. The basis of these ratio values is explained in the following.
The ratio of AOB:NOB biomass for complete nitrification to NO3- is proportional to the
synthesis yield coefficients per unit of N oxidized, assuming equal specific endogenous decay
rates. Fang et al. (2009) reported AOB:NOB yield ratios of 2.1 to 2.5. Thus, assuming that qPCR
abundance is equally representative of AOB and NOB biomass concentration, a qPCR
AOB:NOB ratio of greater than 2.5 implies NOB suppression. Figure 4-7 shows that the qPCR
AOB:NOB ratio was consistently between 3 and 4 indicating NOB suppression. Additionally,
Figure 4-8 shows that the effluent NO2--N:NO3
--N concentration ratio was generally in the range
of 3.0 and 4.0, which indicates NOB suppression because NOB have a higher growth rate than
AOB and thus convert NO2 to NO3 almost as fast as NO2 is produced. . Three different
sidestream mixed liquor batch kinetic tests on November 27, 2019, December 5, 2019, and
March 16, 2020, confirmed specific NO2 production rates between 3 and 10 times greater than
the specific NO2-N oxidation rates.
Page 96
76
Figure 4-7. The sidestream SBR qPCR AOB:NOB ratio and the ratio expected for complete nitrification.
qPCR data was provided by Bao Ngyuen Quoc, UW PhD candidate.
Figure 4-8. The sidestream effluent NO2--N:NO3
--N concentration ratio from September 1, 2019 to March
16, 2020.
Page 97
77
The DO:NH3-N ratio has proven to be indicative of NOB suppression in granular sludge, at
ratios less than 0.41 mgO2/mgN providing 80 to 100% inhibition (Table 2-1). The mechanism for
NOB inhibition based on DO:NH3-N ratio is a result of the diffusion limitations of granules and
the need for AOB to produce NO2 first before NOBs can grow, which should favor their growth.
At higher bulk liquid NH3-N concentration, increased AOB growth rate may allow them to
dominate the granule outer layer. AOBs also have a higher biomass yield than NOBs, which
favors their dominance on the granule outer layer. DO consumption by AOB and diffusion
limitation can result in lower NOB activity in the inner granule layers. At the same bulk liquid
NH3-N concentration, a higher DO concentration would increase both AOB and NOB activity,
but at a lower DO concentration the NOB activity would be decreased more than the AOB
activity due to less oxygen in the inner layers and a higher half velocity coefficient values for
NOB than for AOB. Thus lower DO:NH3-N ratios favor AOB growth more than NOB growth
and higher DO:NH3-N ratios are expected to decrease the AOB/NOB growth ratio. In this study
the critical DO:NH3-N ratio was calculated as the DO concentration at the end of aeration
divided by the effluent NH3-N concentration, because any DO:NH3-N ratio during aeration
before that is lower due to the higher NH3-N concentration.
Monthly average DO:NH3-N ratios of between 0.02 and 0.58 mg/mg were measured in the
sidestream SBR between September 1, 2019 and March 16, 2020. The months of September and
December both had high DO:NH3-N averages with high standard deviations, 0.34 ± 1.01 and
0.58 ± 1.20 mg/mg, respectively. This is likely a result of the large variation in effluent NH3-N
during those months (Figure 4-2). During every other month, the average DO:NH3-N ratio was
between 0.02 and 0.06 mg/mg, indicative of NOB inhibition.
Page 98
78
4.1.5 Sidestream Nitrification Kinetics
Table 4-5 summarizes the average monthly SNRs and relevant sidestream reactor operating
characteristics including the ammonia loading rate, MLSS concentration, and granular sludge
characteristics. The nitrification rates are based on ammonia removal rates during the SBR
aeration phase. The average monthly specific nitrification rate (SNR) ranged between 1.2 and 1.4
mgN/gVSS-hr. During this operating period, the NH3-N loading used was lower than that
normally used during previous periods and the effluent NH3-N concentration was higher than
expected. Monthly average values ranged from 46 to 105 mg/L and the average monthly NH3-N
oxidation efficiency ranged from 43 to 66% except for a value of 78% in September (Table 4-5).
The NH3-N oxidation efficiency was much higher for the sidestream reactor operation by
Armenta (2019) during stable operating periods with similar NH3-N loading, of 0.36 g/L-d. The
two operating periods had average NH3-N oxidation efficiencies of 90 and 89%, respectively,
with much lower effluent NH3-N concentrations. The average SNR values reported for those
periods were 1.6 and 1.8 mg/gVSS-hr. This suggests that the SNR during the operating period
was hindered or inhibited compared to the previous operating periods by Armenta (2019).
Page 99
79
Table 4-5. Average monthly ammonia loading rate, aeration phase DO, granular sludge characteristics, and nitrification rate (standard deviation in
parenthesis).
Month
Parameter Units September October November December January February March
NH3-N loading Rate g/L-d 0.25 (0.03) 0.31 (0.03) 0.30 (0.03) 0.32 (0.04) 0.32 (0.02) 0.32 (0.05) 0.35 (0.01)
Aeration Phase DO mg/L 2.3 (0.3) 2.4 (0.1) 2.6 (0.6) 2.5 (0.6) 2.3 (0.1) 2.3 (0.1) 2.2 (0.3)
Feed COD:N Ratio g/g 3.6 (0.3) 3.8 (0.5) 3.7 (0.1) 3.6 (0.4) 3.7 (0.3) 3.7 (0.7) 3.2 (0.1)
MLSS g/L 12.8 (2.0) 14.4 (1.1) 12.1 (0.8) 12.6 (0.9) 12.8 (0.8) 11.3 (0.5) 8.6 (0.6)
Granular Sludge Characteristics
Diameter mm 1.9 (0.1) N/A 1.57 1.65 1.4 1.54 1.25
Specific Surface Area cm2/gVSS 67 (4) N/A 86 81 87 89 108
Nitrification
NH3-N Oxidation Efficiency % 78 (13) 65 (10) 59 (14) 66 (11) 62 (5) 54 (7) 43 (4)
NH3-N Oxidation Rate mg/L-hr 12.2 (3.0) 11.8 (1.5) 10.4 (1.5) 12.4 (1.6) 11.5 (0.5) 10.0 (1.1) 8.8 (1.0)
Specific nitrification rate (SNR) mg/gVSS-hr 1.2 (0.2) 1.2 (0.3)* 1.2 (0.2) 1.4 (0.2) 1.3 (0.1) 1.3 (0.2) 1.4 (0.2)
*SNRs in October were calculated with the monthly average MLVSS due to sample coordination difficulties.
Page 100
80
Ammonia oxidation rate depends on reactor NH3-N, DO, and AOB concentrations and growth
kinetics (Tchobanoglous et al., 2014). The relationship between nitrification kinetics and NH3-N
and DO concentrations is described by Michaelis-Menten substrate utilization kinetics. The
reactor effluent NH3-N concentration was typically greater than 40 mg/L (Figure 4-2), which is
high enough to not limit the nitrification rate. Thus, the rate was related to the DO concentration
and AOB concentration available on the outer aerobic layers of the granules. The SNR, which is
related to the granular mass, would also be affected by the granular size. Assuming spherical
granules and AOB activity in the outer layer, as the granule diameter increases the surface area
to volume ratio decreases and thus the SNR would decrease. Therefore, a smaller average
granule diameter should correlate to a higher SNR. The effect of granular size is evaluated in
Figure 4-9 by comparing the SNR values to the average specific surface area of the granular
sludge for this study and for Armenta (2019) results from stable performance periods. Though a
trend of a lower SNR with a lower specific surface area is indicated by Armenta’s results, there
is no such trend for the data in this study. Lower and similar SNRs are shown for specific surface
areas ranging from 60 to 110 cm2/gMLVSS.
Page 101
81
Figure 4-9. Specific Nitrification Rate (SNR) versus average granular sludge specific surface area for
stable operating periods during previous operation periods (1A, 1B, 2B) by Armenta (2019) and this
study.
Molecular analyses of the sidestream granules were applied to understand the cause of the lower
SNR and NH3-N oxidation efficiency.
In August and September 2019, a significant nitrification inhibition event decreased the
nitrification efficiency, which was sustained for the entire study period. During this period, the
amount of acetate fed was maintained and over 99% of it was consumed in the anaerobic phase
Page 102
82
to suggest that the PAO/GAO population was maintained. Because of the relative carbon and
NH3 feed amounts and the much lower yield of autotrophic bacteria, the AOB and NOB
population was expected to be a much lower fraction of the total bacteria population. In
addition, the decrease in nitrification efficiency with less NH3-N oxidized suggests a lower
fraction of AOB in the total biomass DNA. The measurement of the amoA gene copy number per
ng DNA confirms the expected decrease in AOB relative to the heterotrophic bacteria growth, as
shown in Figure 4-10. A significant decrease in the SNR is correlated with the decrease of the
AOB population. The decrease in the SNR correlates well the with the decreased fraction of the
AOB in the biomass. There was a slight increase in AOB population in December, which
correlates to a slight increase, from 1.2 to 1.3-1.4 mgN/gVSS-g, in monthly average SNR (Table
4-5). There was a further increase in the AOB population fraction observed on March 4, 2020,
which correlated to an SNR increase to about 1.5 mgN/gVSS-h. However, the nitrification
efficiency declined in March, from about 50% to 35% (Figure 4-3), most likely caused by a
decreased MLSS concentration. The pilot was shut down on March 16, 2020, so it is unknown
whether the AOB population fraction declined, causing the decline in SNR after March 4, 2020
(Figure 4-10).
Page 103
83
Figure 4-10. Fraction of AOB in biomass based on ratio of amoA gene copy number per 1 ngDNA and
mixed liquor specific nitrification rate (mgN/gVSS-h) from June 2019 to March 2020. (qPCR data was
provided by Bao Ngyuen Quoc, UW PhD candidate)
A hypothesis to explore the lower SNR considers the COD:N feed ratio and the CODfed:NOx-
Nremoved ratio. The operating goal for this study was to maintain a COD:N feed in the range of 3.5
because that was shown to be an acceptable ratio during the previous work by Armenta (2019)
with shortcut nitrogen removal. However, the net amount of COD used per NOx removed in this
study was much higher because of the lower nitrification efficiency. An expected CODused:NO2--
Nremoved ratio is in the range of 2.9 to 3.7 gCOD/gN (Bowden et al., 2016). The monthly average
COD:N fed ratio varied between 3.2 and 3.8 g/g (Tables 4-2 and 4-3), which is in the range for
shortcut nitrogen removal but the CODused/NOx-Nremoved ratio was from 6 to 7 g/g, showing that
more acetate COD was added than needed for shortcut nitrogen removal.
Page 104
84
About 99% of the acetate fed during the anaerobic phase to the SBR was taken up by the
biomass before aeration. If the CODfed/NOx-Nremoved equals the CODused/NOx-Nremoved ratio close
to the theoretical value needed for mainly NO2 reduction it can be assumed that COD fed is used
for PAO growth using NO2 as the electron acceptor. The PAOs would use NO2 diffusing to the
interior of the granule during nitrification in the aerobic phase for oxidation of their stored
products from acetate uptake during anaerobic feeding. At the higher CODused:NOx-Nremoved
ratios dissolved oxygen must be used to oxidize some of the acetate COD taken up during
anaerobic conditions. This suggests that PAOs and/or GAOs are growing in aerobic zones of the
granules and competing for oxygen with the nitrifiers. Growth of PAOs and/or GAOs near the
surface would also complete with nitrifiers for space. The competition by these heterotrophs for
space and oxygen would affect the SNR at a given reactor DO concentration due to oxygen
diffusion limitations. Understanding the population density and granular distribution of AOBs,
PAOs, and GAOs, may help to understand changes in SNR values during the sidestream pilot
plant operation.
The results of the fluorescence in situ hybridization (FISH) analysis for February 2020 and June
2019 samples of the sidestream granules shown that there was a greater quantity of PAOs in the
outer granule layers during this study period with lower SNRs than in the previous operation.
The FISH images in Figure 4-11 show a distinct AOB layer on the outside of the granule in June
2019, while in February 2020 AOBs and PAOs sharing the same space. Because GAOs appear to
be relatively insignificant in both qPCR and FISH data, the FISH analysis helps to reinforce that
PAOs were growing on the outside of the granules and competing with AOBs for oxygen and
growth sites.
Page 105
85
Figure 4-11. Fluorescence in situ hybridization (FISH) images of sidestream SBR granules from June 2019 and February 2020. PAOs are
represented in blue, while AOBs are in red, GAOs are in green. FISH analysis was performed by Bao Ngyuen Quoc, UW PhD candidate.
Page 106
86
The qPCR results in Figure 4-12 show that the GAO abundance was about 5% throughout the
operating period but the PAO abundance varied with time. From early September to January it
increased from about 5% to 30% and then declined to about 15% in March. In a similar
sidestream laboratory SBR treating WPTP centrate, Figdore et al. (2018a) found, through mixed
liquor sample sequencing, that PAOs and GAOs accounted for 13 and 11% of the bacteria
abundance, respectively. The other bacteria (~75% of the total) had to grow on endogenous
decay byproducts from the primary substrate consumers, PAOs and GAOs. When the PAO
abundance was increased from September to January the only significant operating change was
the reduction in SRT. The amount of endogenous decay is less at lower SRTs which may explain
the decrease in the other bacteria and the relative increase in the PAO abundance. However, the
cause of the decrease in PAO abundance from January to March is not known and the SRT
decreased further during the period. An increase in PAO abundance suggests a decrease in the
amount of other bacteria grown on byproducts of endogenous decay. One explanation for the
decrease is that a different PAO or GAO was present that was not detected by the qPCR probes
used.
Page 107
87
Figure 4-12. Relative abundance of PAOs and GAOs in the sidestream SBR based on gene copy number
per ng DNA for qPCR (qPCR data was provided by Bao Ngyuen Quoc, UW PhD candidate).
Page 108
88
4.1.6 Sidestream Acetate Utilization Kinetics
Acetate utilization kinetics were assessed with in situ tests for the sidestream reactor to
determine the maximum uptake rate (K) and the apparent half-saturation constant (Ks) for the
Michaelis-Menten substrate utilization kinetic model. Tests were performed on August 26 and
September 30, 2019 to follow the acetate COD concentration during the anaerobic phase during
and after feeding. But an inhibition event prevented obtaining useful acetate utilization data for
kinetic analysis. However, the test of September 30th yielded useful results. The computation
method used was given in Section 3.6.3. The maximum specific substrate utilization rate, K, was
2.7 mgCOD/gVSS-d and the half-velocity coefficient, Ks, was 9.7 mgCOD/L (Figure 4-13).
Diffusion limitation likely elevated the observed Ks to0 be higher than a Ks value for suspended
or dispersed biomass.
Page 109
89
Figure 4-13. Sidestream SBR acetate utilization kinetics batch test on September 30, 2019. The linear model is Equation 3-17, while the
asymptotic model is Equation 3-18, and the model during uptake is Equation 3-15. The measured acetate-COD data is displayed on the left graph
in blue.
Page 110
90
4.2 Mainstream Phase 1 Operation and Treatment Performance
4.2.1 Mainstream Phase 1 Operating Conditions
The plan for Phase 1 was to establish a stable operation and collect process performance at low
SRT without nitrification before starting granular sludge bioaugmentation from the sidestream.
EBPR was expected to continue as was occurring at the South Plant. After seeding the mixed
liquor suspended solids (MLSS) concentration was about 3500 mg/L, and the system was
operated at its target condition; an expected temperature of 16°C, a primary influent flow rate of
1.5 gpm, and an initial SRT of 4.0 days. The SRT was selected to simulate the King County
South Plant winter operation in which EBPR occurred but not nitrification. The SRT was based
on the aeration tank mass and was controlled by manual RAS volume wasting 1-3 times per day,
Monday through Friday.
Table 4-6 summarizes the operational changes made on respective dates during Phase 1 in
response to the mainstream performance in effort to operate without nitrification. The primary
effluent feed rate was 1.0 gpm for the first 4 days and then increased to the target flow of 1.5
gpm. At the primary effluent feed flow rate of 1.5 gpm, the 3.6 ft diameter clarifier surface
overflow rate was 214 gpd/ft2. The granular return sludge rate was always maintained at 0.75
gpm during Phase 1 and the RAS rate was at 1.0 gpm for the first month of operation. This
resulted in a separator superficial upflow velocity of 9.8 m/h, which based on prior pilot plant
testing would theoretically allow granules of size 0.425 µm or greater to settle to the separator
underflow. A high DO of 5.0 mg/L was initially set upon start up to ensure that there would be
sufficient air for mixing because a lower oxygen demand than design was expected due to the
lack of nitrification in the seed sludge. A low DO concentration set point and a low oxygen
demand could result in insufficient aeration for mixing due to air flow control by a modulating
Page 111
91
valve that is opened in response to difference between the set point and the online DO
concentration. The pulse aeration unit was also operating at a frequency of 1 min aeration every
10 min. On November 18th, the pulse aeration unit was shut off because it was observed to cause
a surge in flow to the secondary clarifier when it was turned on, by increasing the liquid level in
the aeration tank.
Table 4-6. Changes in mainstream operating conditions for Phase 1 (October 17, 2019 to November 26,
2019)
The initial seed was not nitrifying but after 2 weeks of operation there was a significant increase
in nitrification due to the unexpected aeration tank temperatures of 18.6-19.6°C, resulting from
high primary effluent temperatures. The target SRT was reduced to 3.0 days on October 25th and
then to 2.5 days on October 29th. Because of the weak wastewater characteristics due to wet
Date of
change
PE
Feed
Rate,
gpm
SRT
Goal,
days
DO Set
Point,
mg/L
Return
Activated
Sludge
Rate, gpm
Acetate
COD Feed,
mg/L
Pulse Aeration
Frequency,
min/10 min
10/17/2020
Startup 1.0 4.0 5.0* 1.0 0 1
10/21/2020 1.5 26
10/25/2020 3.0 50
10/28/2020 3.0
10/29/2020 2.5
11/1/2020 2.5 26
11/18/2020 1.5 2.0 0
11/26/2020
Shut down 1.5 2.5 1.5 2.0 26 0
Page 112
92
weather sodium acetate was added to the feed on October 21st at 26 mg/L, based on the feed flow
rate and was increased to 50 mg/L on October 25th to ensure that there would be sufficient
readily available biodegradable COD (rbCOD) for PAO growth. The aeration target DO was set
at 3.0 mg/L on October 28th, reduced to 2.5 mg/L on November 1st, and finally reduced to 1.5
mg/L on November 18th. As nitrification increased there was rising sludge in the final clarifier
and on November 18th the RAS rate was increase to 2.0 gpm to reduce the sludge blanket time in
an attempt to reduce denitrification in the clarifier. The resultant flow to the separator increased
the superficial upflow velocity to 11.3 m/hr.
4.2.2 Mainstream Phase 1 Treatment Performance
The goal of Phase 1 was to document a stable operation and treatment performance with
flocculent sludge at a low SRT, without nitrification, prior to granular bioaugmentation.
However, due to issues with the flocculent sludge beginning to nitrify and the secondary clarifier
scraper motor failure which ended Phase 1, no granules were added to the system. Instead, data
collected during Phase 1 detailed the effective BOD and nutrient treatment of the mainstream
pilot, the growth of small granules, and the maintenance of a good SVI30 within the system.
Additionally, Phase 1 informed necessary pilot plant modifications such as the clarifier motor
replacement, the hydraulic upflow separator effluent launder replacement, the surge issue with
the Pulsair unit in the aeration tank, and the necessity of having semi-continuous wasting.
Nitrification and PO4-P removal quickly developed at the beginning of Phase 1, after the first
week, and average weekly nitrification efficiencies were between 50 and 60%, and the PO4-P
removal efficiencies were above 80%, aside from inhibitions on October 24th, November 4th,
13th, and 24th (Figure 4-14). No nitrification was observed with the EBPR inhibition, and the
Page 113
93
system operation in terms of aeration DO, SRT control, and pH was not changed. This suggests
that the EBPR inhibition may have been caused by something in the primary effluent feed.
Denitrification was observed at between 30 and 40% for most of Phase 1. The recycle to the
preanoxic tank was 50% of the feed flow and on average accounted for 58% of the total N
removal, indicating some SND in the aeration tank (Figure 4-14). Nitrification, denitrification,
and phosphorus removal decreased after the temperature dropped to below 18°C and the 7-day
average SRT dropped below 1.5 days on November 18th.
A small growth of granules was observed during Phase 1. The seed sludge contained about 6%
granules, which increased to 25% within the first week of operation (Table 4-7). The increase in
small granules was likely due to retention in the secondary clarifier. The SVI30 ranged from 59 to
109 mg/L, was not affected by the slight changes in mixed liquor percent granules, and there was
no clear trend of change in the SVI5/SVI30, which ranged from 2.0 to 2.3.
The effluent TSS was high for the duration of Phases 1 and 2, the weekly average effluent TSS
ranged from 60 to 147 mg/L and 51 to 75 mg/L, respectively (Table 4-7, Table 4-12). During
Phase 2, batch quiescent 45-min settling tests were performed with clarifier influent. These
batch tests produced supernatant TSS concentrations between 15 and 25 mg/L, illustrating that
the high effluent TSS was likely a result of some hydraulic inefficiencies within the small
secondary clarifier. However, during the fourth week of Phase 1, floating sludge was observed
on the clarifier surface. This was caused by denitrification in the clarifier, resulting from higher
NOx-N concentrations in the clarifier influent. To mitigate this effect, the RAS ratio was
Page 114
94
increased from 0.67 to 1.33, which successfully reduced the effluent TSS, but it remained
relatively high, likely caused by other hydraulic inefficiencies.
Figure 4-14. Nitrification, denitrification, and PO4-P removal efficiencies during mainstream Phase 1.
Page 115
95
Table 4-7. Phase 1 mainstream average weekly performance (standard deviation in parenthesis)
Week Ending
Parameter Units 25-Oct 1-Nov 8-Nov 15-Nov 22-Nov
Aeration Tank
7-day Moving Average SRT d 4.2 (0.4) 3.1 (0.6) 2.1 (0.1) 2.1 (0.1) 1.42 (0.2)
Average DO mg/L 5.0 (0.2) 4.1 (0.8) 2.1 (0.2) 1.8 (0.5) 1.1 (0.4)
pH 6.9 (0.1) 6.9 (0.0) 6.8 (0.0) 6.7 (0.1) 6.6 (0.1)
Temperature °C 18.7 (0.9) 18.8 (0.3) 18.6 (0.1) 18.1 (0.2) 17.5 (0.7)
Primary effluent feed
BOD mg/L 116 (49) 153 (15) 172 (12) 162 (7) 133 (17)
Total COD mg/L 218 (81) 305 (23) 303 (11) 288 (17) 245 (38)
soluble COD mg/L 83 (50) 124 (8) 127 (10) 109 (10) 88 (21)
NH3-N mg/L 22.2 (6.8) 29.7 (2.0) 32.3 (1.2) 27.7 (2.4) 24.5 (4.5)
Estimated TKN mg/L 30.9 (9.4) 41.2 (2.8) 44.8 (1.7) 38.5 (3.3) 33.9 (6.2)
PO4-P mg/L 2.9 (1.4) 5.1 (2.7) 4.6 (2.6) 2.8 (0.5) 2.6 (0.5)
TSS mg/L 56.8 (18.8) 44.8 (10.0) 51.6 (4.6) 53.5 (5.0) 55.4 (5.6)
VSS mg/L 50.6 (14.5) 36.0 (5.8) 44.4 (3.9) 46.8 (4.3) 44.8 (4.0)
Effluent
soluble COD mg/L 27 26 37 112 33
TSS mg/L 61.2 (19.1) 75.4 (8.2) 81.4 (11.5) 146.7 (44.9) 97.6 (24.3)
VSS mg/L 52.8 (15.4) 64.2 (7.3) 67.8 (9.9) 122.0 (34.0) 82.6 (21.9)
NH3-N mg/L 14.4 (3.9) 11.2 (2.1) 8.3 (1.5) 3.6 (1.7) 5.4 (4.5)
NO2-N mg/L 0.5 (0.2) 0.5 (0.0) 0.9 (0.2) 1.2 (0.2) 1.1 (0.2)
NO3-N mg/L 4.6 (2.4) 8.2 (0.5) 12.0 (1.7) 13.0 (1.0) 10.4 (1.9)
PO4-P mg/L 4.1 (4.7) 0.5 (0.2) 1.1 (1.4) 1.3 (1.2) 0.8 (0.7)
Sludge Characteristics
MLSS mg/L 3985 (168) 4233 (425) 3692 (475) 3251 (939) 2650 (902)
MLVSS/MLSS % 81 (1) 82 (1) 85 (2) 85 (2) 84 (1)
Granule MLSS % 24.5 19.2 22.9 25.4 28
SVI30 mL/g 109 76 81 59 84
SVI5/SVI30 2.0 2.1 2.3 2.0 2.1
Page 116
96
4.2.3 Mainstream Phase 1 Nitrification and Nitrogen Removal
Phase 1 was characterized by nitrification by the seed flocculent sludge, without any granule
addition. This was primarily a result of high temperatures, around 19 °C, and a 7-day average
SRT more than 4 days for the first two weeks (Table 4-7). On average during phase one, 50% of
the influent biodegradable TKN was nitrified, while 25% was used for cell synthesis, and 28%
escaped in the effluent. The total of the averages is greater than 100% because on days with no
nitrification, the effluent NH3-N composite sample had a great concentration than the estimated
influent TKN. Furthermore, the estimated total inorganic nitrogen (TIN) removed averaged 35%
during the first week, and between 52 and 53% for the remaining four weeks (Table 4-8). After
the first week, the average estimated NH3-N nitrified increased from 10.6 to 21.6 mg/L, the
average SNR increased from 1.4 to 2.6 mg/gVSS-h, and the average estimated nitrification rate
increased from 4.4 to 9.1 mg/L-h (Table 4-8). During the third and fourth weeks of the
operational period the average estimated NH3-N nitrified was above 24 mg/L and the average
SNR was between 3.6 and 3.7 mg/gVSS-hr. The total fate of bioavailable NH3-N is summarized
in Figure 4-15, showing an increase in nitrification efficiency the first week and variations in the
amount of NH3-N used for synthesis which was a function of the influent BOD concentration.
qPCR results confirm the presence of nitrifiers in the mixed liquor, granular, and flocculent
sludge (Figure 4-16). Based on the amoA gene copy number, the granules appear to be more
abundant in AOB than the floc on October 24th, 30th, and November 15th. On November 22nd, the
opposite is seen but the results are questionable because both the granules and flocculent sludge
measured higher amoA abundance than the mixed liquor.
Page 117
97
Table 4-8. Mainstream Phase 1 nitrogen removal analysis (standard deviation in parenthesis).
Week Ending
Parameter Units 25-Oct 1-Nov 8-Nov 15-Nov 22-Nov
Influent flowrate gpm 1.5 1.5 1.5 1.5 1.5
7-day moving average SRT d 4.2 (0.4) 3.1 (0.6) 2.1 (0.1) 2.1 (0.1) 1.42 (0.2)
Nitrogen Concentrations
Influent NH3-N mg/L 22.2 (6.8) 29.7 (2.0) 32.3 (1.2) 27.7 (2.4) 24.5 (4.5)
Bioavailable influent TKN mg/L 30.9 (9.4) 41.2 (2.8) 44.8 (1.7) 38.5 (3.3) 33.9 (6.2)
Effluent NH3-N mg/L 14.4 (3.9) 11.2 (2.1) 8.3 (1.5) 3.6 (1.7) 5.4 (4.5)
Effluent NO2-N mg/L 0.5 (0.2) 0.5 (0.0) 0.9 (0.2) 1.2 (0.2) 1.1 (0.2)
Effluent NO3-N mg/L 4.6 (2.4) 8.2 (0.5) 12.0 (1.7) 13.0 (1.0) 10.4 (1.9)
TIN removal efficiency % 35 (18) 52 (2) 53 (1) 53 (4) 50 (5)
Estimated Nitrification
NH3-N used in synthesis mg/L 7.6 (2.3) 8.7 (1.3) 10.8 (0.7) 10.1 (0.4) 9.7 (1.4)
NH3-N nitrified mg/L 10.6 (5.9) 21.6 (1.5) 25.5 (3.1) 24.4 (2.1) 19.4 (4.7)
Nitrification rate mg/L-h 4.4 (2.5) 9.1 (0.6) 10.7 (1.3) 10.3 (0.9) 8.2 (2.0)
Aeration tank average MLVSS mg/L 3234 (129) 3463 (339) 3123 (441) 2737 (760) 2224 (765)
Specific nitrification rate mg/gVSS-
h 1.4 (0.9) 2.6 (0.1) 3.6 (0.8) 3.7 (0.4) 3.0 (0.7)
Estimated Denitrification
N removal by denitrification mg/L 6.9 (2.6) 12.9 (1.2) 12.6 (1.4) 10.2 (1.4) 9.1 (2.3)
Preanoxic denitrification mg/L 3.3 (1.4) 4.3 (0.2) 6.5 (1.0) 7.4 (0.8) 6.4 (0.6)
Simultaneous nitrification
denitrification mg/L 3.6 (2.5) 8.6 (1.2) 6.1 (0.9) 2.8 (1.8) 2.7 (2.1)
Percent denitrification by SND % 45 (22) 66 (4) 49 (5) 26 (15) 26 (16)
Page 118
98
Figure 4-15. Mainstream Phase 1 weekly average fate of influent bioavailable NH3-N.
Page 119
99
Figure 4-16. Mainstream Phase 1 amoA gene copy number for the aeration mixed liquor, granules, and
flocculent sludge with SNR (mgN/gVSS-h). qPCR data provided by Bao Ngyuen Quoc.
Page 120
100
4.2.4 Mainstream Phase 1 Separator Performance
The main purpose of the mainstream separator was to decouple the SRTs of the flocculent sludge
and the granular sludge to accumulate and sustain the granule sludge nitrification capability.
However, the mainstream operation had to be terminated for repair before sidestream granule
bioaugmentation was initiated. Thus, for Phase 1 the separator performance was monitored to
determine if the granule portion in the activated sludge, from seeding or from growth, could be
selectively retained over floc. The upflow superficial velocity was maintained at 9.8 m/h for the
first four weeks of operation and was then increased to 11.3 m/h on November 18, 2019 for the
remainder of the phase (Table 4-9). The average weekly TSS concentration in the separator
overflow ranged from 1020 to 2470 mg/L, which was less than the aeration tank feed MLSS
concentration. Based on the mass rate of solids to the separator and the mass rate of solids in the
separator underflow, the separator solids removal efficiency was 56 to 65%. On occasions when
there was TSS data for the separator overflow, but not the underflow, the underflow solids
removed rate was assumed to be equal to difference between the separator influent and overflow
solids rates. However, the granular solids removal efficiency performance was less at about 29%
during the first week, and from 38 to 52% for the remainder of the phase. Thus, decoupling of
the granule and floc SRTs for the Phase 1 mixed liquor was not demonstrated.
Page 121
101
Table 4-9. Weekly average performance of the mainstream hydraulic separator for Phase 1 (standard
deviation in parenthesis).
Week Ending
Parameter Units 25-Oct 1-Nov 8-Nov 15-Nov 22-Nov
Upflow superficial velocity m/h 9.8 9.8 9.8 9.8 10.9 (0.7)
Aeration Effluent
MLSS mg/L 3985 (168) 4233 (425) 3692 (475) 3251 (939) 2650 (902)
Granular TSS mg/L 989 901 1076 894 939
Percent granules % 24 19 25 25 28
TSS feed rate to separator kg/d 70.6 (3.0) 75.0 (7.5) 65.4 (8.4) 57.6 (16.6) 61.4 (20.9)
Granule feed rate to separator kg/d 17.5 16.0 19.1 15.8 21.8
Separator Overflow
TSS mg/L 1802 (453) 1984 (275) 2473 (1092) 1379 (517) 1018 (573)
Granular TSS mg/L 390 386 (88) 399 279 591
Percent granules % 16 17 (4) 25 31 29
TSS effluent rate in overflow kg/d 24.6 (6.2) 27.0 (3.7) 33.7 (14.9) 18.8 (7.1) 19.4 (10.9)
Granule effluent rate in overflow kg/d 5.3 5.3 (1.2) 5.4 3.8 11.3
Separator Underflow
TSS mg/L 9068 (134) 9353 (534) 9084 (481) 8804 7838 (56.5)
Granular TSS mg/L 1254 1253 (311) 2090 1996 2034
Percent granules % 14 13 (2) 22 23 26
TSS effluent rate in underflow kg/d 39.1 (0.6) 38.2 (2.2) 37.1 (2.0) 36.0 32.0 (0.2)
Granule effluent rate in underflow kg/d 5.1 5.1 (1.3) 8.5 8.2 8.3
Separator Performance
Removal efficiency of solids % 64 (10) 58 (10) 56 (3) 61 (2) 65 (15)
Removal efficiency of feed granules % 29 40 45 52 38
Page 122
102
4.2.5 Mainstream Aeration Tank Granules and Granule Fate during Phase 1
Because there was no bioaugmentation during Phase 1, only two sieves were used to analyze
granule sizes in the mainstream, 212µm and 425µm. Biomass which was retained on the 212 µm
sieve, or any larger sieve, was defined as granular sludge. Only two sieves were necessary
because about 6% of the South Plant seed sludge was retained on the 212 µm sieve, while 0.5%
was retained on the 425 µm sieve.
The MLSS, granule MLSS, percent granules, and sieve analysis results are shown in Table 4-9.
After the first week of the mainstream operation, the percent granules in the aeration tank MLSS
had increased to 24.5%, with 22.9% being retained on the 212 µm sieve and 1.6 being retained
on the 425 µm sieve (Table 4-10). The last three weeks of Phase 1 were characterized by
between 1.6 and 2.4% of TSS being retained on the 425 µm sieve, while 23 to 28% of TSS was
retained on the 212 µm sieve. There was no significant granular growth or decay, aside from the
initial growth. Because the separator did not show any significant granule retention it is likely
that the percent granule increase was due to retention in the secondary clarifier.
Table 4-10. Weekly mainstream aeration tank granular sludge characteristics in Phase 1 (standard
deviation in parenthesis).
Sample Date
Parameter Units 21-Oct 28-Oct 4-Nov 14-Nov 18-Nov
Daily Bioaugmentation Yes/No N N N N N
MLSS mg/L 4044 4704 4225 3522 3350
Granule MLSS mg/L 989 901 1076 894 939 % 24.5 19.2 22.9 25.4 28
MLSS >212 <425 um mg/L 925 850 964 822 886 % 22.9 18.1 20.5 23.3 26.4
MLSS >425 <850 um mg/L 64 51 112 72 53
% 1.6 1.1 2.4 2 1.6
Page 123
103
4.3 Mainstream Phase 2 Operation and Treatment Performance
4.3.1 Mainstream Phase 2 Operating Conditions
Phase 2 began on January 21, 2020 after completing repair and modifications to the mainstream
system. The system was seeded with non-nitrifying EBPR activated sludge from the King
County South Plant to an initial MLSS concentration of 3600 mg/L. Table 4-11 summarizes the
key mainstream operating conditions and changes made from January 21st to its final operation
on March 16th. At the start, the primary effluent feed flow was 1.5 gpm, the clarifier RAS rate
was 1.5 gpm (1.0 recycle ratio), and the separator recycle flow rate was 0.75 gpm (0.50 recycle
ratio). The RAS flow rate was not changed during Phase 2 but a higher recycle ratio occurred
because of a decrease in the influent flow rate. The target aerobic SRT was 2.5 days but
increased to 4.0 days on March 4th to provide more nitrification. Sodium acetate addition at
startup was 26 mg/L, based on the primary effluent feed rate, and was increased to 47 mg/L on
February 4th. In view of weaker wastewater strength due to wet weather flow, potassium dibasic
phosphate was added at 16 mg/L on February 1st and increased to 31 mg/L on February 4th.
Page 124
104
Table 4-11. Changes in mainstream operating conditions for Phase 2 (January 21, 2020 to March 16,
2020).
Date of
change
PE Feed
Rate,
gpm
SRT
Goal,
days
DO Set
Point,
mg/L
Separator
Internal
Recycle
Rate,
gpm
Granular
Sludge
Recycle
Rate,
gpm
Separator
Upflow
Velocity,
m/hr
Acetate
COD
Feed,
mg/L
K2HPO-
P Feed,
mg/L
1/21/2020
Startup 1.5 2.5 1.5 0 0.75 4.5 26 0
1/25/2020 4 10.5
2/1/2020 16
2/4/2020 1.3 Added 40 gallons of stored granular sludge from past
sidestream wasting 47 31
2/10/2020 1.8
2/13/2020 2.5 8
2/25/2020 Started daily transfer of sidestream waste granule sludge volume
2/27/2020 2.2 0.5
3/4/2020 4 2.2
3/6/2020 0.9 2.2 0 0.75 3.6
3/16/2020
Shutdown 0.9 4 2.2 0 0.75 3.61 47 31
At start up the separator internal recycle pump was turned off and the superficial upflow velocity
was 4.5 m/hr, based on the influent flow and clarifier RAS feed rates. Solids appeared to be
collecting in the separator from visual observations, so on January 25th the separator internal
recycle flow was used to increase the superficial upflow velocity to 10.5 m/hr. However, this did
not result in changes in appearance of solids on the walls of the plexiglass column and it was
determined that the solids had a sticky characteristic and thus collected on the wall.
After operating for 15 days (5.2 SRTs), the MLSS concentration averaged around 3400 mg/L,
which was higher than anticipated suggesting a higher sludge yield than expected for the primary
effluent treatment. The influent flow was decreased to 1.3 gpm on February 4th to reduce the
Page 125
105
aeration tank MLSS concentration. On February 4th, 40 gallons of granular sludge wasted from
the sidestream system and stored at 4°C during the prior 6 months, were added to the mainstream
system to jumpstart the granular/flocculent sludge system operation.
On February 10th, the aeration DO set point was increased from 1.5 to 1.8 mg/L to improve
nitrification by the bioaugmented granules. On February 13th, the separator internal recycle flow
was decreased to reduce the superficial upflow velocity from 10.2 to 8.0 m/hr, to observe the
effect on the separator granular sludge recovery efficiency. Prior to that time the separator
granular sludge recovery efficiency was in the range of 45 to 50%.
On February 25th, daily bioaugmentation of granules from the sidestream reactor began. Each
day, Monday to Friday, the waste sludge from the sidestream reactor was manually added to the
mainstream aeration tank. The sidestream reactor granule mixed liquor contained about 95%
granules with an average granule size in the range of 1.5 mm.
Due to the lower than expected nitrification efficiency the aeration DO set point was increased
from 1.8 to 2.2 mg/L on February 27th. The separator underflow recycle ratio was also decreased
from 0.58 to 0.38 to determine if that would improve the separator granular sludge recovery
efficiency. On March 4th, the aerobic SRT was increased to 4.0 days to improve nitrification
efficiency. Part of the logic for this SRT increase was that the potentially improved SVI by
operating a granular/flocculent sludge system would allow a higher solids loading on the
secondary clarifier and thus allow a higher MLSS and SRT concentration. The influent feed rate
was decreased from 1.3 to 0.9 gpm on March 6th to provide more aeration time and lower the
effluent NH3-N concentration. Also on March 6th, the separator internal recycle was stopped to
Page 126
106
observe the effect of a lower superficial upflow velocity on the separator performance. Operation
ceased on March 16, 2020 due to COVID-19 outbreak concerns.
4.3.2 Mainstream Phase 2 Treatment Performance
The average aeration tank MLSS during Phase 2 varied between 3100 and 3800 mg/L, with an
SVI30 of between 81 and 106 mL/g, and an SVI5/SVI30 ratio of 1.8 to 2 (Table 4-12). During the
last week, the SVI30 spiked to 161 mL/g, but examination under the light microscope found that
the sludge was not dominated by filamentous organisms, but that there was bridging of large floc
(Figure 4-17).
Page 127
107
Table 4-12. Average weekly performance for the mainstream system in Phase 2 (standard deviation in
parenthesis).
Week Ending
Parameter Units 31-Jan 7-Feb 14-Feb 21-Feb 28-Feb 6-Mar 13-Mar
Aeration Tank
7-day Moving Average
SRT d 2.4 (0.3) 2.3 (0.3) 2.9 (0.2) 2.5 (0.1) 2.6 (0.1) 2.3 (0.2) 3.5 (0.7)
Average DO mg/L 1.5 (0.0) 1.5 (0.0) 1.6 (0.1) 1.8 (0.0) 2.0 (0.2) 2.2 (0.0) 2.2 (0.0)
pH 6.8 (0.0) 6.6 (0.1) 6.7 (0.0) 6.7 (0.0) 6.7 (0.0) 6.8 (0.1) N/A
Temperature °C 14.0 (0.5) 14.2 (0.8) 15.1 (0.4) 15.3 (0.4) 15.8 (0.4) 15.8 (0.6) 15.0 (0.4)
Primary effluent feed
BOD mg/L 56 (13) 54 (17) 83 (14) 128 (3) 125 (5) 136 (10) 118 (8)
Total COD mg/L 130 (24) 129 (44) 164 (21) 234 (13) 258 (15) 247 (22) 231 (34)
soluble COD mg/L 46 (6) 46 (15) 67 (11) 105 (8) 113 (9) 105 (14) 93 (14)
NH3-N mg/L 11.1 (2.0) 11.4 (4.7) 16.6 (3.4) 23.0 (1.3) 25.1 (2.0) 23.8 (1.1) 24.0 (0.8)
Estimated TKN mg/L 15.4 (2.8) 15.9 (6.6) 23.0 (4.7) 31.9 (1.8) 34.8 (2.8) 33.1 (1.6) 33.3 (1.1)
PO4-P mg/L 1.5 (1.2) 6.1 (5.0) 3.7 (4.3) 2.6 (0.5) 2.1 (0.1) 2.4 (1.3) 2.4 (0.5)
TSS mg/L 36.6 (5.2) 38.6 (4.5) 34.6 (3.7) 48.0 (6.4) 44.4 (4.8) 50.0 (9.0) 51.2 (6.6)
VSS mg/L 27.0 (6.2) 30.8 (7.0) 28.8 (5.9) 41.7 (3.3) 36.6 (3.1) 38.2 (6.0) 42.2 (4.8)
Effluent
soluble COD mg/L 16 81 24 25 25 22 31
TSS mg/L 62.2 (7.3) 66.6 (5.2) 56.4 (2.8) 55.5 (7.5) 51.0 (7.8) 71.0 (1.4) 75.4 (8.0)
VSS mg/L 49.6 (5.0) 52.6 (7.4) 41.6 (2.4) 41.3 (4.1) 38.8 (5.8) 54.2 (5.4) 56.0 (7.8)
NH3-N mg/L 11.6 (3.0) 11.3 (8.8) 11.7 (2.9) 14.8 (1.0) 16.5 (1.9) 17.7 (2.8) 20.1 (4.7)
NO2-N mg/L 0.2 (0.0) 0.5 (0.1) 0.7 (0.2) 0.26 (0.1) 0.1 (0.0) 0.3 (0.2) 0.1 (0.0)
NO3-N mg/L 0.2 (0.1) 0.4 (0.1) 1.2 (0.2) 1.1 (0.1) 1.1 (0.1) 1.3 (0.7) 1.2 (0.1)
PO4-P mg/L 5.3 (5.6) 8.3 (15.3) 4.1 (2.6) 1.1 (0.3) 1.7 (1.3) 6.2 (5.1) 18.2
(19.7)
Sludge Characteristics
MLSS mg/L 3317
(527)
3609
(784)
3596
(287)
3167
(203)
3613
(211)
3146
(117)
3764
(364)
MLVSS/MLSS % 80 (2) 81 (2) 75 (1) 75 (1) 76 (2) 82 (2) 82 (4)
SVI30 mL/g 85 99 81 106 92 101 161
SVI5/SVI30 1.9 1.9 1.8 1.9 1.9 2 1.8
Page 128
108
Figure 4-17. Images taken on March 16, 2020 of Phase 2 mainstream mixed liquor using a smartphone
through a light microscope viewfinder. Stalked ciliates can be seen growing in the bridged flocculent
sludge (original magnification 100x).
Because Phase 2 took place during the winter months, the average weekly temperature in the
aeration tank varied from 14.0 to 15.8 °C. Similarly, to the Phase 1, the pH of the aeration tank
during Phase 2 was relatively low, varying between 6.6 and 6.8. As mentioned above, low
alkalinity is characteristic of Western Washington wastewater. This is further exacerbated by the
winter wet weather conditions. Because the King County collection system has some areas with
combined wastewater and stormwater sewers, the influent wastewater tends to be very dilute
after wet weather events. The large variation in influent BOD during Phase 2, from 54 mg/L to
136 mg/L, was also characteristic of wet weather conditions.
Due to wet weather flows, the influent wastewater was relatively weak. For instance, the average
weekly influent PO4-P concentration varied between 1.5 and 6.1 mg/L (Table 4-12). The weekly
average effluent PO4-P varied between 1.1 and 18.2 mg/L. The standard deviation in the effluent
Page 129
109
PO4-P is notably large, varying from ± 0.3 to ± 19.7 mg/L. This is largely due to brief inhibition
events on February 4th and March 1st, 5th, and 10th, where the effluent PO4-P would spike for 24
hours, before returning to pre-inhibition levels (Figure 4-18). These inhibition events also
appeared to affect the nitrifiers in the system, during all the events the nitrification efficiency
would decrease a similar magnitude to the phosphorus removal efficiency and return to pre-
inhibition levels within 24 to 48 hrs (Figure 4-18). Due to the brevity of the events, it is likely
that inhibition was caused by a constituent in the primary effluent feed.
The weekly average effluent NH3-N concentrations were relatively high throughout Phase 2,
varying between 11.3 and 20.1 mg/L (Table 4-12). Based on the influent estimated TKN, there
was no nitrification during operation with only the South Plant seed sludge. However, after the
addition of waste sidestream granules on February 4, 2020, a limited degree of nitrification was
observed. The weekly average effluent NO2-N and NO3-N concentrations stayed low during
Phase 2, varying from 0.1 to 0.7 mg/L and from 0.2 to 1.3 mg/L, respectively.
4.3.3 Mainstream Phase 2 Nitrification and Nitrogen Removal
Nitrification and denitrification efficiency are shown in Figure 4-18, before and after granular
sludge addition. After stored granular sludge was added to the mainstream, on February 4, 2020,
the nitrification efficiency reached 60% and the denitrification efficiency was 50%. However,
these efficiencies declined to about 30% and 25%, respectively, presumably due to a low of
granules in sludge wasting. Continual bioaugmentation was started on February 25, 2020, but the
subsequent operating time was too short to enable the assessment of the long-term performance
with sidestream bioaugmentation.
Page 130
110
The results in Figure 4-18 also show high phosphorus removal efficiency by the EBPR process
but on February 4th and March 1st, 5th, and 11th, the EBPR appeared to be inhibited, likely by a
substance in the primary effluent feed. The nitrification inhibition is also inhibited on the same
days.
Figure 4-18. PO4-P removal, nitrification, and denitrification efficiencies in mainstream system during
Phase 2.
Page 131
111
During Phase 2, the weekly average TIN removal efficiency was about 25% before
bioaugmentation, and between 35 and 49% after sidestream bioaugmentation (Table 4-13). After
bioaugmentation the average estimated amount of NH3-N nitrified increased from 1.6 mg/L to
between 6.4 and 10.8 mg/L. Additionally, the SNR increased from about 0.3 mg/gVSS-h to
between 0.9 and 1.5 mg/gVSS-h. The increase in ammonia removal by nitrification occurred
after the granule bioaugmentation spike on February 4, 2020, when 40 gal of sidestream granules
were added to the mainstream system and continued during daily bioaugmentation. Weekly
average values are shown in Figure 4-19 for the fate of the feed bioavailable nitrogen between
NH3-N for biomass synthesis, nitrification, and the effluent.
Page 132
112
Tables 4-13. Mainstream phase 2 nitrogen removal analysis (standard deviation in parenthesis).
Week Ending
Parameter Units 31-Jan 7-Feb 14-Feb 21-Feb 28-Feb 6-Mar 13-Mar
Daily bioaugmentation Yes/No N Spike N N Y Y Y
Influent flowrate gpm 1.5 1.3 1.3 1.3 1.3 1.3 0.9
7-day moving average SRT d 2.4 (0.3) 2.3 (0.3) 2.9 (0.2) 2.5 (0.1) 2.6 (0.1) 2.3 (0.2) 3.5 (0.7)
Nitrogen Concentrations
Influent NH3-N mg/L 11.1 (2.0) 11.4 (4.7) 16.6 (3.4) 23.0 (1.3) 25.1 (2.0) 23.8 (1.1) 24.0 (0.8)
Bioavailable influent TKN mg/L 15.4 (2.8) 15.9 (6.6) 23.0 (4.7) 31.9 (1.8) 34.8 (2.8) 33.1 (1.6) 33.3 (1.1)
Effluent NH3-N mg/L 11.6 (3.0) 11.3 (8.8) 11.7 (2.9) 14.8 (1.0) 16.5 (1.9) 17.7 (2.8) 20.1 (4.7)
Effluent NO2-N mg/L 0.2 (0.0) 0.5 (0.1) 0.7 (0.2) 0.26 (0.1) 0.1 (0.0) 0.3 (0.2) 0.1 (0.0)
Effluent NO3-N mg/L 0.2 (0.1) 0.4 (0.1) 1.2 (0.2) 1.1 (0.1) 1.1 (0.1) 1.3 (0.7) 1.2 (0.1)
TIN removal efficiency % 25 (13) 35 (23) 41 (2) 49 (1) 49 (2) 41 (9) 36 (14)
Estimated Nitrification
NH3-N used in synthesis mg/L 4.4 (1.6) 3.4 (1.1) 4.5 (1.2) 6.9 (1.1) 7.6 (0.2) 8.2 (0.7) 6.6 (0.4)
NH3-N nitrified mg/L 1.6 (1.5) 3.9 (4.0) 6.4 (1.1) 9.2 (0.9) 10.8 (0.9) 6.9 (3.5) 6.6 (4.4)
Nitrification rate mg/L-h 0.7 (0.6) 1.6 (1.6) 2.3 (0.4) 3.4 (0.3) 3.9 (0.3) 2.5 (1.3) 1.7 (1.1)
Aeration tank average MLVSS mg/L 2638 (468) 2900 (618) 2692 (243) 2390 (152) 2726 (115) 2578 (115) 3093 (325)
Specific nitrification rate mg/gVSS-h 0.3 (0.2) 0.7 (0.9) 0.9 (0.2) 1.4 (0.1) 1.5 (0.1) 1.0 (0.5) 0.6 (0.4)
Estimated Denitrification
N removal by denitrification mg/L 2.2 (1.0) 5.2 (3.4) 4.5 (1.3) 7.9 (1.1) 9.5 (1.0) 5.3 (3.0) 7.6 (2.4)
Preanoxic denitrification mg/L 0.2 (0.1) 0.6 (0.1) 1.0 (0.2) 0.9 (0.3) 0.7 (0.1) 0.6 (0.3) 1.0 (0.1)
Simultaneous nitrification denitrification mg/L 2.0 (1.0) 4.6 (3.3) 3.5 (1.4) 7.0 (1.2) 8.8 (1.0) 4.7 (2.8) 6.5 (2.3)
Percent denitrification from SND % 88 (14) 68 (34) 75 (8) 88 (4) 93 (2) 80 (24) 85 (4)
Page 133
113
Figure 4-19. Weekly average fate of influent bioavailable NH3-N during Phase 2.
The amoA gene copy number was investigated in the mixed liquor, granular, and flocculent
sludges between February 5, 2020 and March 4, 2020. Comparison of the qPCR amoA gene copy
number results in Figure 4-20 and 4-9 shows that the stored granule amoA gene copies/ngDNA
was about 30% of the original granules before storage. As the SNR in the mainstream increased,
it was expected that the amoA gene copy number in the granules would increase, as higher
nitrification rates are correlated with increased AOB abundance. However, as SNR increased,
amoA gene copy number decreased in both the floc and granule sludge (Figure 4-20). There are
two explanations for this trend, 1) because qPCR assays are always normalized to the total DNA
sample, it’s possible that a great increase in heterotrophic bacteria would skew the results so that
Page 134
114
AOB would have a lower relative abundance, and 2) qPCR detected the DNA of inactive AOB
from the stored granules, which were washed out because they could not be revived. Assuming
that the rate of washout of the inactive fraction was higher than the growth rate of new AOB, the
apparent amoA gene copy number would be reduced, while the SNR increases. Continual
bioaugmentation was started on February 25th, but the sample on the 27th did not show any
increase in AOB abundance likely because too few granules had been added to the mainstream to
affect the abundance. However, after a couple weeks of bioaugmentation, the fraction of added
granules was significantly higher. On March 4th, the amoA gene copy number was about 225 per
ngDNA, which is reflected by a spike in the SNR to 1.64 mgN/gVSS-h (Figure 4-20). The
following two samples, on March 11th and 16th, both had amoA gene copy numbers of 128 and
115, respectively. Thus, the value on March 4th is likely an outlier because the amoA gene copy
number is shown to drop, despite continual granule addition. The inhibition events on February
4th and March 1st, 5th, and 11th, are reflected in the SNR values, however, the amoA gene copy
number was unaffected.
Page 135
115
Figure 4-20. Mainstream Phase 2 amoA gene copy number for the aeration mixed liquor, granules, and
flocculent sludge and SNR (mgN/gVSS-h) values. (qPCR data provided by Bao Ngyuen Quoc)
4.3.3.1 Mainstream Batch Nitrification Kinetics Testing
Batch nitrification kinetics tests were performed weekly after February 4, 2020, to track the
relative nitrification rates of the granular sludge, flocculent sludge, and mixed liquor. The
procedure for these tests is described in Section 3.5. Batch kinetic tests were performed at an
average DO of 2 mg/L, to model the conditions in the aeration tank. These kinetics tests indicate
that the flocculent sludge developed some nitrification ability, from nitrifier growth and/or
nitrifiers falling off of the bioaugmented granules, and that the SNRs of the flocculent, granular,
and mixed liquor sludge generally increased during Phase 2 (Figure 4-21).
Page 136
116
The SNRs in Figure 4-21 were calculated as the sum of the NO2--N and NO3
--N production rates.
The NO2--N and NO3
--N production rates fit linear trends with an average R2 value of 0.85 and
0.99, respectively, compared to an average R2 of 0.44 for the NH3-N removal rate. The
discrepancy in linear trends was likely a result of the greater accuracy of the nutrient tests used
for NOx-N, than those used for NH3-N. Calculating SNR based on the NOx-N production rates
does not account for SND. Denitrification efficiency was about 25% for most of Phase 2 (Figure
4-19), while the percent of denitrification from SND varied from 68 to 93% (Table 4-13). This
means that the SNR values in Figure 4-21 are likely underestimates by between 17 and 23%.
Based on the batch tests, the average SNR of the mixed liquor was 0.81 mgN/gVSS-h, while the
flocculent and granular SNRs averaged 1.15 and 1.33 mgN/gVSS-h, respectively. However, it is
impossible for the mixed liquor SNR to be less than the granular and flocculent SNRs because
the mixed liquor contains both the flocculent and granular sludges. Thus, the predicted mixed
liquor was calculated as the sum of the granule and flocculent sludge SNR contributions, based
on their relative percentage of the mixed liquor. The predicted SNR shows that the mixed liquor
SNR was likely dominated by flocculent sludge nitrification. On average, granule SNR
accounted for 26% of the predicted mixed liquor SNR and 22% of the MLSS concentration. The
highest granule contribution was achieved on February 10th, when the granule SNR accounted
for 39% of the predicted mixed liquor SNR and 32% of the MLSS concentration.
The Phase 2 average SNR of the mixed liquor was 0.88 mgN/gVSS-h, while the batch test
predicted mixed liquor SNR averaged 1.18 mgN/gVSS-h. The difference in SNRs is likely a
Page 137
117
result of the batch test being an imperfect representation of the aeration tank in volume,
temperature, mixing regime, and DO profile.
Figure 4-21. Phase 2 specific nitrification rate (SNR) calculated from NOx-N production rates measured
in batch kinetic tests of mainstream mixed liquor samples. The predicted mixed liquor SNR is based on
the rates of the granular and flocculent sludges and their percent abundance in the mixed liquor.
4.3.4 Mainstream Phase 2 Separator Performance
The primary function of the separator was to achieve decoupled granule and flocculent SRTs.
Throughout Phase 2, the granule SRT was about 1.5 times greater than that of the mixed liquor
SRT (Figure 4-22). The largest SRT difference was between the mixed liquor and the large
(>425µm in diameter) granules. After the stored granule charge, the large granule SRT was
about 4 times greater than the mixed liquor SRT. During this time, granules >425 µm in diameter
accounted for 25.9% of the MLSS concentration and about 64% of the total granule TSS.
Page 138
118
Similarly, after about two weeks of continual bioaugmentation, when the granules >425 µm in
diameter accounted for 5.6% of the MLSS concentration and 33% of the granule TSS, the >425
granule SRT was about 3 times greater than the mixed liquor SRT. However, this difference in
large granule and mixed liquor SRT declined in early March. The increases in granule to mixed
liquor SRT ratio appears to correspond to higher separator removal efficiencies (greater than
50%), however, high separator removal efficiencies were also observed with low granule to
mixed liquor SRT ratio during the week ending with February 21st. Overall, the variation in
separator efficiency had little effect on the granule to mixed liquor SRT ratio, as the ratio is fairly
constant at about 1.5 while the separator efficiency varied from 38 to 53 (Table 4-14). The small
difference in granule and mixed liquor SRTs is indicative that the separator failed to achieve
significant granule and flocculent TSS separation.
Page 139
119
Figure 4-22. Mixed liquor 7-day average aerobic SRT, and granule to mixed liquor SRT ratio for granular
sludge and granular sludge > 425 µm, during Phase 2.
Page 140
120
Table 4-14. Phase 2 mainstream hydraulic upflow separator performance (standard deviation in parenthesis).
Week Ending
Parameter Units 31-Jan 7-Feb 14-Feb 21-Feb 28-Feb 6-Mar 13-Mar
Superficial upflow velocity m/h 10.5 10.4 (0.15) 9.6 (1.0) 8.0 8.0 7.4 (1.5) 3.6
Aeration Effluent
MLSS mg/L 3317 (527) 3609 (784) 3596 (287) 3167 (203) 3613 (211) 3146 (117) 3764 (364)
Granular TSS mg/L 468 966 (648) 1290 591 850 (174) 634 558
Percent granules % 16 25 (12) 32 20 24 (4) 20 17
TSS feed rate to separator kg/d 67.8 (10.8) 70.5 (14.3) 69.6 (5.6) 61.3 (3.9) 68.8 (5.9) 55.9 (2.1) 64.6 (6.3)
Granule feed rate to separator kg/d 9.6 18.8 (12.4) 25.0 11.4 16.2 (3.8) 11.4 9.6
Separator Overflow
TSS mg/L 2241 (893) 2403 (521) 2518 (526) 1880 (250) 2358 (258) 1992 (271) 2431 (393)
Granular TSS mg/L 247 793 (390) 862 262 571 454 313
Percent granules % 16 30 (10) 25 16 21 20 14
TSS effluent rate in overflow kg/d 36.6 (14.6) 37.2 (7.4) 38.4 (8.0) 28.7 (3.8) 36.0 (3.9) 29.5 (5.4) 31.8 (5.1)
Granule effluent rate in overflow kg/d 4.0 12.3 (5.8) 13.2 4.0 8.7 6.9 4.1
Separator Underflow
TSS mg/L 5770 (492) 8194 (1128) 7914 (396) 6640 (515) 7535 (258) 7651 (279) 6322 (1038)
Granular TSS mg/L 701 2557 (1030) 2594 1454 1679 (126) 1719 1236
Percent granules % 13 30 (8) 31 20 22 (2) 21 17
TSS effluent rate in underflow kg/d 23.6 (2.0) 33.4 (4.6) 32.4 (1.6) 27.1 (2.1) 27.3 (4.4) 24.2 (4.4) 25.8 (4.2)
Granule effluent rate in underflow kg/d 2.9 10.5 (4.2) 10.6 5.9 6.1 (1.2) 4.7 5.1
Separator Performance
Removal efficiency of solids % 42 (12) 47 (5) 47 (4) 47 (5) 44 (7) 43 (7) 45 (8)
Removal efficiency of feed granules % 30 49 (6) 42 52 38 (2) 41 53
Page 141
121
Figure 4-23 shows the amount of granules leaving the separator in the underflow and overflow,
the weekly average superficial upflow velocity, and the weekly average separator granule
removal efficiency. The superficial upflow velocity, which varied from 3.6 to 10.5 m/h, had no
effect on the separator granule removal efficiency. The separator granule removal efficiency was
below 50% except for the weeks of February 21st and March 13th, which corresponds to the
weeks where there were more granules leaving the separator in the underflow than the overflow.
These two weeks also had the highest average SVI30 (106 and 161 mL/g, respectively), implying
the flocculent sludge settleability has some effect on the difficulty of separator granules from
flocs, but no correlations were able to be drawn.
Figure 4-23. Comparison of separator granule removal efficiency, upflow superficial velocity, and
amount of granular sludge in separator overflow and underflow for Phase 2.
Page 142
122
4.3.4.1 Operating Conditions Affecting Separator Performance
Separator performance was expected to vary primarily based on the upflow superficial velocity,
the granular MLSS, and the mixed liquor SRT. However, using the data from both Phases 1 and
2, no trends between separator efficiency and any of the above characteristics were able to be
drawn (Figure 4-24). There was a slight trend between the mixed liquor percent granules and the
granular removal efficiency, however it was not significant (R2=0.01). Previous experiments
done with the separator using sidestream granular sludge and WPTP flocculent sludge showed
granule separation efficiencies between 91 and 94% at an upflow velocity of 10 m/h and a
granule to floc ratio of 1.6. The discrepancy between previous tests and the results show during
Phases 1 and 2 are likely a result of 1) the granule to floc ratio, 2) the inability of the granules to
escape the floc matrix, 3) the good settling characteristics of the mixed liquor, and 4) the flow
characteristics of the separator and distribution nozzle. Throughout Phases 1 and 2, the largest
granule to floc ratio was 0.7, which is significantly lower than the ratio of 1.6 that the separator
was tested at. Additionally, the low SRT flocculent sludge had a sticky nature, which caused
fouling on probes, and likely helped to entrap the granules in the floc matrix. Because of SP’s
low SRT EBPR system, the seed sludge had good settling characteristics, SVI30 = 85 to 110
mL/g (Table 4-7, Table 4-12). This means discrete settling was more difficult to achieve because
the floc and granules tended to settle as one unit (Figure 4-25). Finally, the separator influent
flow had a rolling action which caused some flow to go under the nozzle, observed during clear
water dye tests, which may have counteracted the selection pressure applied by the upflow
velocity. Furthermore, because of the relatively small diameter of the separator, some flow from
the nozzle hit the separator wall, which contributed to the rolling action described above.
Page 143
123
Overall, the four factors described caused the separator overflow and underflow to exhibit near
identical granule and floc ratio characteristics (Figure 4-26).
Figure 4-24. Removal efficiency of feed granules correlated to upflow velocity and mixed liquor percent
granules, data from Phases 1 and 2 is used.
Page 144
124
Figure 4-25. Settled mixed liquor from February
5, 2020, after the granule spike. Image was taken
using a smartphone. The lack of discrete settling
indicates the good settling characteristics of the
flocculent sludge
Page 145
125
Figure 4-26. Images taken on separator overflow sludge (A, B) and separator underflow sludge (C, D)
using a camera mounted to a stereo microscope. Sludges were diluted to 300-400 mg/L TSS for
photographs.
4.3.5 Fate of Granules in the Mainstream Aeration Tank during Phase 2
The aeration tank mixed liquor was sampled weekly for sieve analysis to follow the fraction of
granular sludge and the granular size distribution over time to determine if the size distribution
of the sidestream bioaugmented granules changed in the mainstream system. Four sieve sizes
were used: 212 µm, 425 µm, 850 µm, and 1700 µm.
Page 146
126
A summary of the weekly mixed liquor granular sludge analysis is shown in Table 4-15.
Granules accounted for 12.5% of the SP seed sludge MLSS concentration based on the definition
of granular sludge being retained on a 212 µm sieve. Only 2.9% of the SP seed sludge was
retained on the 425 µm sieve and there was no retention on the 850 µm sieve. At the end of the
first week of operation without bioaugmentation, the amount of granular sludge in the mixed
liquor increased slightly to 15.7%, with 2.1% being retained on the 425 µm sieve.
Page 147
127
Table 4-15. Summary of weekly granule sludge analyses for the mainstream aeration tank mixed liquor during Phase 2.
Sample Date
Parameter Units 27-Jan 5-Feb 10-Feb 18-Feb 24-Feb 2-Mar 9-Mar 16-Mar
Daily Bioaugmentation Yes/No N Spike N N Y Y Y Y
MLSS mg/L 2989 4929 4004 2885 3836.5 3201 3260 4084
Granule MLSS mg/L 468 1994 1290 591 892 634 558 760 % 15.7 40.5 32.2 20.5 23.2 19.8 17.1 18.6
MLSS >212 <425 um mg/L 405.5 715 493 326.3 556.5 352 375.6 493 % 13.6 14.5 12.3 11.3 14.5 11 11.5 12.1
MLSS >425 <850 um mg/L 62.5 391.5 398 175.8 192.5 137 116.8 122 % 2.1 7.9 9.9 6.1 5 4.3 3.6 3.0
MLSS >850 <1700 um mg/L 0 665 364.5 89.2 142.5 145 65.6 128 % 0 13.5 9.1 3.1 3.7 4.5 2 3.1
MLSS >1700 um mg/L 0 222.5 34 0 0 0 0 17
% 0 4.5 0.8 0 0 0 0 0.4
Page 148
128
The data for the February 5, 2020 sample shows that after the spike of stored granules to the
mainstream on February 4th, the percent granules in the mixed liquor increased to 40.5% and
62.5% of the granules present were within the size range covered by the 4 sieves. The faction of
mixed liquor in the >850 and <1700 µm size range was 13.5%. A week later the granular fraction
in that size range had decreased to 9.1% and the granule fraction of the mixed liquor had
decreased to 32.3%. For sizes greater than 1700 µm, the granule fraction decreased from 4.5% to
0.8% of the mixed liquor, but for the size range between 425 and 850 µm it had increased from
7.9% to 9.9%. These results suggest that some of the larger granules broke up and there was loss
of granules from the system, presumably due to the unexpected low efficiency of the separator
and thus loss of granules of all sizes in the sludge wasting from the clarifier return line.
Two weeks after the granular spike, on February 18th, the granular TSS was only 20% of the
MLSS. Some deterioration of larger size granules is also indicated by a reduction in the fraction
of granules for sizes above 425 µm and an increase in the fraction of granules for sizes >212 µm
and >425 µm. In the two weeks after February 25th with sidestream bioaugmentation, there was
no buildup of granules and no significant change in the fraction of granules in the mixed liquor
(19.8% and 17.1%, respectively). During those two weeks of continual bioaugmentation, there
was a steady decrease at all granule sizes. For the last week of operation, the fraction of granular
sludge was 4.6% lower than for the sample on February 24th, but there was an increase in the
granules >850 µm, likely indicating a slight buildup from continual bioaugmentation. The
change in granular size in the mixed liquor can be seen in the stereo microscope photos shown in
Figure 4-27. Reduction in the size of granules bioaugmented from the sidestream reactor may
Page 149
129
have been due to agitation from the anaerobic tank mixing intensity, recycle pumping, and/or its
feeding regime.
It is possible that the integrity of the granules was affected by the different substrate feed regime
in the anaerobic phase of the sidestream and mainstream reactors. The bulk liquid acetate COD
concentration in the sidestream reactor anaerobic phase was more than 200 mg/L, whereas the
bulk liquid acetate COD concentration in the mainstream anaerobic zone averaged 7 mg/L
during Phase 2. A higher bulk liquid concentration allows for deeper penetration of growth
substrate and thus would encourage a deeper biofilm or larger granule.
Page 150
130
Figure 4-27. Image of Phase 2 mainstream aeration mixed liquor taken with a camera mounted to a stereo
microscope. A) flocculent sludge before bioaugmentation B) mixed liquor a week after the granule spike
C) mixed liquor the day after continuous bioaugmentation began D) mixed liquor 8 days after continuous
bioaugmentation began.
Page 151
131
5 Summary and Conclusion
A mainstream CFAS pilot plant was operated with a hydraulic separator to treat WPTP primary
effluent alongside a pilot sidestream AGS SBR, which produced nitrifying granular sludge for
bioaugmentation of the mainstream system. The sidestream reactor was maintained for the 6.5-
month research period and it was fed acetate in an anerobic phase and centrate diluted with
WPTP final effluent at the start of the aerobic phase to produce a mixed liquor dominated by
PAO-NDN granules for bioaugmentation. The average diameter of the sidestream granular
sludge ranged from 1.25 to 1.9 mm and over 90% simultaneous nitrification and denitrification
occurred during the aerobic phase. The sidestream system processed anaerobic digestion centrate
that contained an average of 21% of the nitrogen load to the mainstream treatment, which is
within a typical range for municipal full-scale facilities with anaerobic digestion and sludge
dewatering.
The mainstream pilot plant system had two operating phases: the first lasting 40 days with only
flocculent sludge mixed liquor, and the second lasting 56 days, with about two weeks of
flocculent sludge operation, a granular sludge spike which was monitored for 20 days, and 20
days of continual sidestream bioaugmentation. During phase 2, nitrification efficiency increased
from 10 to 30%. Sidestream bioaugmented granules in the mainstream were maintained at a
lower level than expected and at an SRT of only 50% higher than that of the mixed liquor due to
a hydraulic granular/floc separator efficiency of less than 55%. There was also some
deterioration in the granular size fed form the sidestream reactor. The following conclusions
result from this pilot plant study:
Page 152
132
1. The sidestream reactor operation was maintained at a NH3-N loading of 0.30 to 0.35 g/L-
d and produced a mixed liquor with over 95% granules at an average size of 1.25 to 1.9
mm.
2. Shortcut nitrogen removal and NOB suppression was achieved in the sidestream SBR as
evidenced by a high NO2--N/NO3
--N effluent ratio, a high NO2--N/NO3
--N production
rate ratio in batch tests, and a mixed liquor AOB:NOB abundance ratio of 3 to 4 from
qPCR analyses.
3. The shortcut nitrogen removal was enabled by operation of the sidestream SBR with a
final aeration DO:NH3-N ratio of 0.02 – 0.58 mg/mg.
4. The Michaelis-Menten kinetic model fit for acetate uptake by the sidestream granules had
a maximum specific acetate uptake rate of 2.7 gCOD/gVSS-day and an acetate half-
saturation coefficient of 9.7 mg/L.
5. The sidestream reactor SNR were from 1.2 to 1.4 mg/gVSS-h.
6. The operation had a higher COD:N feed ratio than needed to have just enough stored
carbon by PAOs and GAOs after anaerobic feeding to use the NO2/NO3 produced during
aeration, which resulted in PAO growth in the aerobic outer layers of the granule to
impede the nitrification efficiency.
7. The sidestream reactor denitrification efficiency ranged from 89 to 96% at average
aeration phase DO concentrations from 2.2 to 2.6 mg/L.
8. Significant growth of small granules was shown in the mainstream during Phase 1, with
up to 25% of the MLSS being retained on a 212 µm sieve.
9. Larger size granules from the sidestream reactor deteriorated within the mainstream
system, which had more granule agitation due to pumping and mixing and also had a
Page 153
133
lower substrate concentration feeding regime in the anaerobic phase compared to the
sidestream SBR.
10. The granule separation efficiency ranged from 30 to 53% with upflow superficial
velocities from 3.6 to 10.5 m/h and a granule content of 16 to 41% in the MLSS feed.
11. The mainstream nitrification efficiency was shown to increase from 10% to 30% with
sidestream bioaugmentation.
12. During Phase 2 bioaugmentation the average aerobic SRT of the granular and flocculant
sludges were 4.4 and 2.5 days, respectively, and the granule to mixed liquor SRT ratio
averaged 1.5, showing marginal uncoupling of granule and floc SRTs.
13. Granules maintained their nitrification capability once added to the mainstream, based on
batch nitrification tests.
Page 154
134
6 Future Research
Additional research should be focused on developing an understanding of the potential and
possible applications for bioaugmentation with sidestream AGS by evaluating the cause of the
granule size reduction, startup procedure, methods to improve uncoupling of the granular and
flocculent sludge SRTs, and performance with long-term continual bioaugmentation. Because
both phases of this study were cut short, future research is needed to understand the treatment
performance of long-term sidestream bioaugmentation with AGS. Furthermore, additional
research is needed to determine the shear strength of granules and their potential to survive the
pumping and mixing stresses associated with a mainstream system.
Various methods should be considered to improve decoupling of granular and flocculent sludge
SRTs. Based on the testing done with the hydraulic upflow separator used in this study the
granule to floc MLSS ratio is crucial for granule and floc separation. However, more research is
needed to determine the optimal granule to floc ratio and the operating performance of various
ratios. Additional suggestions for improving SRT decoupling between granule and flocculent
sludges are as follows:
• Improving the hydraulic upflow separator with the use of computational fluid dynamics,
taking into account the sludge solids, to better understand the hydraulics of the separator to
enable optimization of design for granule/floc separation by minimizing any rolling actions to
turbulent flows.
Page 155
135
• Feeding secondary clarifier waste activated sludge from the mainstream to the sidestream
SBR during continual bioaugmentation. This would allow for selective wasting of flocculent
sludge using the selection pressures present in a sidestream SBR while supplementing continual
bioaugmentation with additional granules.
• Modifying the mainstream secondary clarifier to allow for the selective wasting of lighter
mixed liquor. For example, wasting could be done solely from sludge settling on the outer parts
of the clarifier where lighter sludges are more likely to settle.
• Evaluate the effect of granule starvation and different bulk liquid substrate feeding
conditions on the effect of granular integrity and size.
Page 156
136
7 References
Ahn, J., Schroeder, S., Beer, M., McIlroy, S., Bayly, R. C., May, J. W., … Seviour, R. J. (2007).
Ecology of the microbial community removing phosphate from wastewater under
continuously aerobic conditions in a sequencing batch reactor. Applied and Environmental
Microbiology, 73(7), 2257–2270. https://doi.org/10.1128/AEM.02080-06
Anthonisen, A. C., Loehr, R. C., Prakasam, T. B. S., & Srinath, E. G. (1976). Inhibition of
nitrification by ammonia and nitrous acid. Journal of the Water Pollution Control
Federation, 48(5), 835–852. https://doi.org/10.1016/0168-6496(92)90072-2
Armenta, M. (2019). Operation and Performance of a Sidestream Aerobic Granular Sludge
(University of Washington). https://doi.org/10.1017/CBO9781107415324.004
Bartrolí, A., Pérez, J., & Carrera, J. (2010). Applying ratio control in a continuous granular
reactor to achieve full nitritation under stable operating conditions. Environmental Science
and Technology, 44(23), 8930–8935. https://doi.org/10.1021/es1019405
Bassin, J. P., Kleerebezem, R., Dezotti, M., & van Loosdrecht, M. C. M. (2012). Simultaneous
nitrogen and phosphate removal in aerobic granular sludge reactors operated at different
temperatures. Water Research, 46(12), 3805–3816.
https://doi.org/10.1016/j.watres.2012.04.015
Bertanza, G. (1997). Simultaneous Nitrification-Denitrification Process in Extended Aeration
Plants: Pilot and Real Scale Experiences. Water Science and Technology, 35(6), 53–61.
Blackburne, R., Vadivelu, V. M., Yuan, Z., & Keller, J. (2007). Kinetic characterisation of an
enriched Nitrospira culture with comparison to Nitrobacter. Water Research, 41(14), 3033–
3042. https://doi.org/10.1016/j.watres.2007.01.043
Boncescu, C., & Robescu, L. D. (2018). Modeling efficiency of biological process with aerobic
granular sludge. International Multidisciplinary Scientific GeoConference Surveying
Geology and Mining Ecology Management, SGEM, 18(5.2), 649–654.
https://doi.org/10.5593/sgem2018/5.2/S20.084
Bowden, G., Tsuchihashi, R., & Stensel, H. D. (2016). Technologies for Sidestream Nitrogen
Removal. In Water Intelligence Online (Vol. 15). https://doi.org/10.2166/9781780407890
Bumbac, C., Ionescu, I. A., Tiron, O., & Badescu, V. R. (2015). Continuous flow aerobic
granular sludge reactor for dairy wastewater treatment. Water Science and Technology,
71(3), 440–445. https://doi.org/10.2166/wst.2015.007
Camejo, P. Y., Owen, B. R., Martirano, J., Ma, J., Kapoor, V., Santo Domingo, J., … Noguera,
D. R. (2016). Candidatus Accumulibacter phosphatis clades enriched under cyclic anaerobic
Page 157
137
and microaerobic conditions simultaneously use different electron acceptors. Water
Research, 102, 125–137. https://doi.org/10.1016/j.watres.2016.06.033
Carvalho, G., Lemos, P. C., Oehmen, A., & Reis, M. A. M. (2007). Denitrifying phosphorus
removal: Linking the process performance with the microbial community structure. Water
Research, 41(19), 4383–4396. https://doi.org/10.1016/j.watres.2007.06.065
Chen, X., Yuan, L., Lu, W., Li, Y., Liu, P., & Nie, K. (2015). Cultivation of aerobic granular
sludge in a conventional, continuous flow, completely mixed activated sludge system.
Frontiers of Environmental Science and Engineering, 9(2), 324–333.
https://doi.org/10.1007/s11783-014-0627-3
Cofré, C., Campos, J. L., Valenzuela-Heredia, D., Pavissich, J. P., Camus, N., Belmonte, M., …
Val del Río, A. (2018). Novel system configuration with activated sludge like-geometry to
develop aerobic granular biomass under continuous flow. Bioresource Technology,
267(May), 778–781. https://doi.org/10.1016/j.biortech.2018.07.146
de Kreuk, M. K., Kishida, N., & van Loosdrecht, M. C. M. (2007). Aerobic granular sludge -
State of the art. Water Science and Technology, 55(8–9), 75–81.
https://doi.org/10.2166/wst.2007.244
De Kreuk, M. K., Picioreanu, C., Hosseini, M., Xavier, J. B., & Van Loosdrecht, M. C. M.
(2007). Kinetic model of a granular sludge SBR: Influences on nutrient removal.
Biotechnology and Bioengineering, 97(4), 801–815. https://doi.org/10.1002/bit.21196
De Kreuk, M. K., Heijnen, J. J., & Van Loosdrecht, M. C. M. (2005). Simultaneous COD,
nitrogen, and phosphate removal by aerobic granular sludge. Biotechnology and
Bioengineering, 90(6), 761–769. https://doi.org/10.1002/bit.20470
de Sousa Rollemberg, S. L., Mendes Barros, A. R., Milen Firmino, P. I., & Bezerra dos Santos,
A. (2018). Aerobic granular sludge: Cultivation parameters and removal mechanisms.
Bioresource Technology, 270(July), 678–688.
https://doi.org/10.1016/j.biortech.2018.08.130
Devlin, T. R., di Biase, A., Kowalski, M., & Oleszkiewicz, J. A. (2017). Granulation of activated
sludge under low hydrodynamic shear and different wastewater characteristics. Bioresource
Technology, 224, 229–235. https://doi.org/10.1016/j.biortech.2016.11.005
Devlin, T. R., & Oleszkiewicz, J. A. (2018). Cultivation of aerobic granular sludge in continuous
flow under various selective pressure. Bioresource Technology, 253(November 2017), 281–
287. https://doi.org/10.1016/j.biortech.2018.01.056
Downing, L., Redmond, E., Klopping, P., & Young, M. (2017). Selective pressures for
granulation in full-scale, flow through activated sludge system. Water Environment
Federation Technical Exhibition and Conference 2017, WEFTEC 2017, 7(Figure 1), 4479–
4483. https://doi.org/10.2175/193864717822155849
Page 158
138
Fang, F., Ni, B. J., Li, X. Y., Sheng, G. P., & Yu, H. Q. (2009). Kinetic analysis on the two-step
processes of AOB and NOB in aerobic nitrifying granules. Applied Microbiology and
Biotechnology, 83(6), 1159–1169. https://doi.org/10.1007/s00253-009-2011-y
Figdore, B. A., David Stensel, H., & Winkler, M. K. H. (2018a). Bioaugmentation of sidestream
nitrifying-denitrifying phosphorus-accumulating granules in a low-SRT activated sludge
system at low temperature. Water Research, 135, 241–250.
https://doi.org/10.1016/j.watres.2018.02.035
Figdore, B. A., Stensel, H. D., & Winkler, M. K. H. (2018b). Comparison of different aerobic
granular sludge types for activated sludge nitrification bioaugmentation potential.
Bioresource Technology, 251(August 2017), 189–196.
https://doi.org/10.1016/j.biortech.2017.11.004
Figdore, B. A., Winkler, M.-K. H., & Stensel, H. D. (2018c). Bioaugmentation with Nitrifying
Granules in Low-SRT Flocculent Activated Sludge at Low Temperature. Water
Environment Research, 90(4), 343–354.
https://doi.org/10.2175/106143017x15054988926488
Flowers, J. J., He, S., Yilmaz, S., Noguera, D. R., & McMahon, K. D. (2009). Denitrification
capabilities of two biological phosphorus removal sludges dominated by different
“Candidatus Accumulibacter” clades. Environmental Microbiology Reports, 1(6), 583–588.
https://doi.org/10.1111/j.1758-2229.2009.00090.x
Franca, R. D. G., Pinheiro, H. M., van Loosdrecht, M. C. M., & Lourenço, N. D. (2018).
Stability of aerobic granules during long-term bioreactor operation. Biotechnology
Advances, 36(1), 228–246. https://doi.org/10.1016/j.biotechadv.2017.11.005
Gao, D., Liu, L., Liang, H., & Wu, W. M. (2011). Aerobic granular sludge: Characterization,
mechanism of granulation and application to wastewater treatment. Critical Reviews in
Biotechnology, 31(2), 137–152. https://doi.org/10.3109/07388551.2010.497961
Guo, J., Peng, Y., Wang, S., Zheng, Y., Huang, H., & Wang, Z. (2009). Long-term effect of
dissolved oxygen on partial nitrification performance and microbial community structure.
Bioresource Technology, 100(11), 2796–2802.
https://doi.org/10.1016/j.biortech.2008.12.036
He, Q., Zhou, J., Song, Q., Zhang, W., Wang, H., & Liu, L. (2017). Elucidation of microbial
characterization of aerobic granules in a sequencing batch reactor performing simultaneous
nitrification, denitrification and phosphorus removal at varying carbon to phosphorus ratios.
Bioresource Technology, 241, 127–133. https://doi.org/10.1016/j.biortech.2017.05.093
He, S., Gall, D. L., & McMahon, K. D. (2007). “Candidatus accumulibacter” population
structure in enhanced biological phosphorus removal sludges as revealed by polyphosphate
kinase genes. Applied and Environmental Microbiology, 73(18), 5865–5874.
https://doi.org/10.1128/AEM.01207-07
Page 159
139
Helmer, C., & Kunst, S. (1998). Simultaneous Nitrification/Denitrification in an Aerobic Biofilm
System. Water Science and Technology, 37(4–5), 183–187.
Isanta, E., Reino, C., Carrera, J., & Pérez, J. (2015). Stable partial nitritation for low-strength
wastewater at low temperature in an aerobic granular reactor. Water Research, 80, 149–158.
https://doi.org/10.1016/j.watres.2015.04.028
Jahn, L., Svardal, K., & Krampe, J. (2019). Comparison of aerobic granulation in SBR and
continuous-flow plants. Journal of Environmental Management, 231(October 2018), 953–
961. https://doi.org/10.1016/j.jenvman.2018.10.101
Kent, T. R., Bott, C. B., & Wang, Z. W. (2018). State of the art of aerobic granulation in
continuous flow bioreactors. Biotechnology Advances, 36(4), 1139–1166.
https://doi.org/10.1016/j.biotechadv.2018.03.015
Kent, T. R., Sun, Y., An, Z., Bott, C. B., & Wang, Z. W. (2019). Mechanistic understanding of
the NOB suppression by free ammonia inhibition in continuous flow aerobic granulation
bioreactors. Environment International, 131(July), 105005.
https://doi.org/10.1016/j.envint.2019.105005
Kim, J. M., Lee, H. J., Lee, D. S., & Jeon, C. O. (2013). Characterization of the denitrification-
associated phosphorus uptake properties of “Candidatusaccumulibacter phosphatis” clades
in sludge subjected to enhanced biological phosphorus removal. Applied and Environmental
Microbiology, 79(6), 1969–1979. https://doi.org/10.1128/AEM.03464-12
Kong, Y., Xia, Y., Nielsen, J. L., & Nielsen, P. H. (2007). Structure and function of the
microbial community in a full-scale enhanced biological phosphorus removal plant.
Microbiology, 153(12), 4061–4073. https://doi.org/10.1099/mic.0.2007/007245-0
Kouba, V., Catrysse, M., Stryjova, H., Jonatova, I., Volcke, E. I. P., Svehla, P., & Bartacek, J.
(2014). The impact of influent total ammonium nitrogen concentration on nitrite-oxidizing
bacteria inhibition in moving bed biofilm reactor. Water Science and Technology, 69(6),
1227–1233. https://doi.org/10.2166/wst.2013.757
Krasnits, E., Beliavsky, M., Tarre, S., & Green, M. (2013). PHA based denitrification: Municipal
wastewater vs. acetate. Bioresource Technology, 132, 28–37.
https://doi.org/10.1016/j.biortech.2012.11.074
Lanham, A. B., Moita, R., Lemos, P. C., & Reis, M. A. M. (2011). Long-term operation of a
reactor enriched in Accumulibacter clade I DPAOs: Performance with nitrate, nitrite and
oxygen. Water Science and Technology, 63(2), 352–359.
https://doi.org/10.2166/wst.2011.063
Li, D., Lv, Y., Zeng, H., & Zhang, J. (2016). Startup and long term operation of enhanced
biological phosphorus removal in continuous-flow reactor with granules. Bioresource
Technology, 212, 92–99. https://doi.org/10.1016/j.biortech.2016.04.008
Page 160
140
Li, J., Cai, A., Wang, M., Ding, L., & Ni, Y. (2014). Aerobic granulation in a modified oxidation
ditch with an adjustable volume intraclarifier. Bioresource Technology, 157, 351–354.
https://doi.org/10.1016/j.biortech.2014.01.130
Li, J., Ding, L. Bin, Cai, A., Huang, G. X., & Horn, H. (2014). Aerobic sludge granulation in a
full-scale sequencing batch reactor. BioMed Research International, 2014.
https://doi.org/10.1155/2014/268789
Liu, H., Li, Y., Yang, C., Pu, W., He, L., & Bo, F. (2012). Stable aerobic granules in continuous-
flow bioreactor with self-forming dynamic membrane. Bioresource Technology, 121, 111–
118. https://doi.org/10.1016/j.biortech.2012.07.016
Liu, H., Xiao, H., Huang, S., Ma, H., & Liu, H. (2014). Aerobic granules cultivated and operated
in continuous-flow bioreactor under particle-size selective pressure. Journal of
Environmental Sciences (China), 26(11), 2215–2221.
https://doi.org/10.1016/j.jes.2014.09.004
Long, B., Yang, C. Z., Pu, W. H., Yang, J. K., Liu, F. B., Zhang, L., & Cheng, K. (2015). Rapid
cultivation of aerobic granular sludge in a continuous flow reactor. Journal of
Environmental Chemical Engineering, 3(4), 2966–2973.
https://doi.org/10.1016/j.jece.2015.10.001
Meinhold, J., Filipe, C. D. M., Daigger, G. T., & Isaacs, S. (1999). 1999. Meinhold et al.
Characterization of denitrifying fraction of PAO in BioP removal.pdf (pp. 31–42). pp. 31–
42. Water Science Technology.
Melcer, H., Dold, P. L., Jones, R. M., Bye, C. M., Takács, I., Stensel, H. D., … Bury, S. (2003).
Methods for Wastewater Characterization in Activated Sludge Modeling. Retrieved from
https://books.google.com.sg/books?id=JbtuFC3QHecC
Metcalf & Eddy. (2014). Wastewater Engineering: Treatment and Resource Recovery (5th ed.;
G. Tchobanoglous, H. D. Stensel, R. Tsuchihashi, & F. L. Burton, Eds.). Retrieved from
https://books.google.com.cu/books?id=6KVKMAEACAAJ
Münch, E. V., Lant, P., & Keller, J. (1996). Simultaneous nitrification and denitrification in
bench-scale sequencing batch reactors. Water Research, 30(2), 277–284.
https://doi.org/10.1016/0043-1354(95)00174-3
Nielsen, P. H., McIlroy, S. J., Albertsen, M., & Nierychlo, M. (2019). Re-evaluating the
microbiology of the enhanced biological phosphorus removal process. Current Opinion in
Biotechnology, 57(Figure 1), 111–118. https://doi.org/10.1016/j.copbio.2019.03.008
Oehmen, A., Carvalho, G., Lopez-Vazquez, C. M., van Loosdrecht, M. C. M., & Reis, M. A. M.
(2010). Incorporating microbial ecology into the metabolic modelling of polyphosphate
accumulating organisms and glycogen accumulating organisms. Water Research, 44(17),
4992–5004. https://doi.org/10.1016/j.watres.2010.06.071
Page 161
141
Oehmen, A., Carvalho, G., Freitas, F., & Reis, M. A. M. (2010). Assessing the abundance and
activity of denitrifying polyphosphate accumulating organisms through molecular and
chemical techniques. Water Science and Technology, 61(8), 2061–2068.
https://doi.org/10.2166/wst.2010.976
Plunkett, R. L., & Gemmill, C. L. (1951). The kinetics of invertase action. The Bulletin of
Mathematical Biophysics, 13(4), 303–312. https://doi.org/10.1007/BF02477924
Pochana, K., & Keller, J. (1999). Study of Factors Affecting Simultaneous Nitrification and
Denitrification (SND). Water Science and Technology, 39(6), 61–68.
Poot, V., Hoekstra, M., Geleijnse, M. A. A., van Loosdrecht, M. C. M., & Pérez, J. (2016).
Effects of the residual ammonium concentration on NOB repression during partial
nitritation with granular sludge. Water Research, 106, 518–530.
https://doi.org/10.1016/j.watres.2016.10.028
Pronk, M., de Kreuk, M. K., de Bruin, B., Kamminga, P., Kleerebezem, R., & van Loosdrecht,
M. C. M. (2015). Full scale performance of the aerobic granular sludge process for sewage
treatment. Water Research, 84, 207–217. https://doi.org/10.1016/j.watres.2015.07.011
Qian, F., Wang, J., Shen, Y., Wang, Y., Wang, S., & Chen, X. (2017). Achieving high
performance completely autotrophic nitrogen removal in a continuous granular sludge
reactor. Biochemical Engineering Journal, 118, 97–104.
https://doi.org/10.1016/j.bej.2016.11.017
Reino, C., Suárez-Ojeda, M. E., Pérez, J., & Carrera, J. (2016). Kinetic and microbiological
characterization of aerobic granules performing partial nitritation of a low-strength
wastewater at 10 °C. Water Research, 101, 147–156.
https://doi.org/10.1016/j.watres.2016.05.059
Rubio-Rincón, F. J., Lopez-Vazquez, C. M., Welles, L., van Loosdrecht, M. C. M., &
Brdjanovic, D. (2017). Cooperation between Candidatus Competibacter and Candidatus
Accumulibacter clade I, in denitrification and phosphate removal processes. Water
Research, 120, 156–164. https://doi.org/10.1016/j.watres.2017.05.001
Saad, S. A., Welles, L., Abbas, B., Lopez-Vazquez, C. M., van Loosdrecht, M. C. M., &
Brdjanovic, D. (2016). Denitrification of nitrate and nitrite by ‘Candidatus Accumulibacter
phosphatis’ clade IC. Water Research, 105, 97–109.
https://doi.org/10.1016/j.watres.2016.08.061
Sajjad, M., Kim, I. S., & Kim, K. S. (2016). Development of a novel process to mitigate
membrane fouling in a continuous sludge system by seeding aerobic granules at pilot plant.
Journal of Membrane Science, 497, 90–98. https://doi.org/10.1016/j.memsci.2015.09.021
Smolders, G. J. F., van Loosdretch, M. C. M., & Heijnen, J. J. (1995). bio P model-smolders
1995.pdf (pp. 79–93). pp. 79–93. Water Science Technology.
Page 162
142
Smolders, G. J. F., van der Meij, J., van Loosdrecht, M. C. M., & Heijnen, J. J. (1994).
Stoichiometric model of the aerobic metabolism of the biological phosphorus removal
process. Biotechnology and Bioengineering, 44(7), 837–848.
https://doi.org/10.1002/bit.260440709
Stokholm-Bjerregaard, M., McIlroy, S. J., Nierychlo, M., Karst, S. M., Albertsen, M., & Nielsen,
P. H. (2017). A critical assessment of the microorganisms proposed to be important to
enhanced biological phosphorus removal in full-scale wastewater treatment systems.
Frontiers in Microbiology, 8(APR), 1–18. https://doi.org/10.3389/fmicb.2017.00718
Sun, Y., Angelotti, B., & Wang, Z. W. (2019). Continuous-flow aerobic granulation in plug-flow
bioreactors fed with real domestic wastewater. Science of the Total Environment, 688, 762–
770. https://doi.org/10.1016/j.scitotenv.2019.06.291
WANG, J., PENG, Y., WANG, S., & GAO, Y. (2008). Nitrogen Removal by Simultaneous
Nitrification and Denitrification via Nitrite in a Sequence Hybrid Biological Reactor.
Chinese Journal of Chemical Engineering, 16(5), 778–784. https://doi.org/10.1016/S1004-
9541(08)60155-X
Wang, X., Chen, Z., Shen, J., Zhao, X., & Kang, J. (2019). Impact of carbon to nitrogen ratio on
the performance of aerobic granular reactor and microbial population dynamics during
aerobic sludge granulation. Bioresource Technology, 271(September 2018), 258–265.
https://doi.org/10.1016/j.biortech.2018.09.119
Wastewater, M., & District, R. (2017). Weftec 2017. 40(4), 129–140.
https://doi.org/https://doi.org/10.2175/193864717822156785
Wei, S., David Stensel, H., Quoc, B. N., Lee, P. H., Huang, X., & Winkler, M. K. H. (2019).
What’s in your sludge? Hunting for baby granules in full-scale activated sludge treatment
plants. WEFTEC 2019 - 92nd Annual Water Environment Federation’s Technical
Exhibition and Conference, (2016), 1318–1323.
Weissbrodt, D. G., Neu, T. R., Kuhlicke, U., Rappaz, Y., & Holliger, C. (2013). Assessment of
bacterial and structural dynamics in aerobic granular biofilms. Frontiers in Microbiology,
4(JUL), 1–18. https://doi.org/10.3389/fmicb.2013.00175
Winkler, M. K. H., Bassin, J. P., Kleerebezem, R., de Bruin, L. M. M., van den Brand, T. P. H.,
& Van Loosdrecht, M. C. M. (2011). Selective sludge removal in a segregated aerobic
granular biomass system as a strategy to control PAO-GAO competition at high
temperatures. Water Research, 45(11), 3291–3299.
https://doi.org/10.1016/j.watres.2011.03.024
Winkler, M. K. H., Le, Q. H., & Volcke, E. I. P. (2015). Influence of Partial Denitrification and
Mixotrophic Growth of NOB on Microbial Distribution in Aerobic Granular Sludge.
Environmental Science and Technology, 49(18), 11003–11010.
https://doi.org/10.1021/acs.est.5b01952
Page 163
143
Winkler, M. K. H., Meunier, C., Henriet, O., Mahillon, J., Suárez-Ojeda, M. E., Del Moro, G.,
… Weissbrodt, D. G. (2018). An integrative review of granular sludge for the biological
removal of nutrients and recalcitrant organic matter from wastewater. Chemical
Engineering Journal, 336(December 2017), 489–502.
https://doi.org/10.1016/j.cej.2017.12.026
Yuan, X., & Gao, D. (2010). Effect of dissolved oxygen on nitrogen removal and process control
in aerobic granular sludge reactor. Journal of Hazardous Materials, 178(1–3), 1041–1045.
https://doi.org/10.1016/j.jhazmat.2010.02.045
Yulianto, A., Soewondo, P., Handajani, M., & Ariesyady, H. D. (2017). Preliminary study on
aerobic granular biomass formation with aerobic continuous flow reactor. AIP Conference
Proceedings, 1823(March 2017). https://doi.org/10.1063/1.4978186
Zeng, R. J., Yuan, Z., & Keller, J. (2003). Enrichment of denitrifying glycogen-accumulating
organisms in anaerobic/anoxic activated sludge system. Biotechnology and Bioengineering,
81(4), 397–404. https://doi.org/10.1002/bit.10484
Zhang, Z., Yu, Z., Dong, J., Wang, Z., Ma, K., Xu, X., … Zhu, L. (2018). Stability of aerobic
granular sludge under condition of low influent C/N ratio: Correlation of sludge property
and functional microorganism. Bioresource Technology, 270(866), 391–399.
https://doi.org/10.1016/j.biortech.2018.09.045
Zhao, H. W., Mavinic, D. S., Oldham, W. K., & Koch, F. A. (1999). Controlling factors for
simultaneous nitrification and denitrification in a two-stage intermittent aeration process
treating domestic sewage. Water Research, 33(4), 961–970. https://doi.org/10.1016/S0043-
1354(98)00292-9
Zhou, D., Niu, S., Xiong, Y., Yang, Y., & Dong, S. (2014). Microbial selection pressure is not a
prerequisite for granulation: Dynamic granulation and microbial community study in a
complete mixing bioreactor. Bioresource Technology, 161, 102–108.
https://doi.org/10.1016/j.biortech.2014.03.001
Zou, J., Tao, Y., Li, J., Wu, S., & Ni, Y. (2018). Cultivating aerobic granular sludge in a
developed continuous-flow reactor with two-zone sedimentation tank treating real and low-
strength wastewater. Bioresource Technology, 247(September 2017), 776–783.
https://doi.org/10.1016/j.biortech.2017.09.088
Page 164
144
Appendix A: Supplemental Pilot Facility Fabrication Information
Sidestream Sequencing Batch Reactor Pilot
• To ensure mechanical stability, the reactor tube was mounted to a stainless-steel pedestal
with a PVC flange. Additionally, a Unistrut™ frame was built with two crossbars, one
just above 4 ft and one just below 8 ft, to further stabilize the reactor.
• The stability of the end of the COD feed line was ensured by three stainless steel
supports, which connected to a torus laid against the reactor bottom, around the diffuser
(Figure 3-2).
Mainstream Continuous Flow Pilot
• The stainless-steel biological reactors were manufactured by KC employees from ASTM
A312 type 316L, schedule 10s pipe.
• The granule/floc separator and upflow feed nozzle was designed and manufactured by
Ovivo.
• The secondary clarifier was constructed by KC employees using a polyethylene plastic
easy-drain tank from McMaster-Carr® and a custom fabricated metal frame using the
McMaster-Carr tank stand as a base.
Aerobic Reactor
• The bottom of the pipe was rounded into a dome, consistent with the anaerobic and
anoxic reactors.
• The four support legs and the top edge were constructed using 3-in x 3-in x ¼-in
stainless-steel L-channel. Small 6-in square base plates were welded onto the bottom of
Page 165
145
the support legs to create a stable platform for the reactor. Including the support legs, the
reactor stood at a total height of 9 ft and ¼ in.
• The two fine bubble diffusers were attached together using two Unitstrut™ channels
(Figure 3-6). The two diffusers were separated by about 6 in and lowered down into the
center of the aeration tank for installation. The diffuser array was heavy enough to remain
in position without additional securing methods.
Hydraulic Upflow Separator
• The first launder design was made using acrylic and was secured to the top of the
separator by a flange which was attached to the separator body and supported with
several triangular acrylic members. A rubber gasket was sandwiched between the launder
flange and the flanged top of the separator. To keep the two sandwiched together, twelve
holes for ½-in bolts were evenly distributed across the circumference, these were filled in
by eight ½-in bolts and four sections of all thread. The four all thread bars secured the top
of the launder flange to the steel base, keeping the gasket in compression, and ensuring
the launder’s stability. While the additional eight bolts functioned to keep the gasket and
flanges sandwiched together.
• The influent diffuser was designed by Ovivo and 3D printed out of plastic.
Secondary Clarifier
• To modify the tank base to support the necessary equipment, four 6.5-ft sections of
stainless-steel angle channel were attached to the corners of the base. These angle
Page 166
146
channel sections became the mounting points for the Unistrut™ frame which supported
the scraper, scraper motor, and the feed well.
• The scraper was made from 11-gauge stainless-steel sheet with openings in the center to
avoid over torqueing the motor, while still providing mixing, ¼ in from the bottom, to
move the settled sludge. The scraper motor at the top was connected to a ½-in diameter
stainless-steel drive shaft.
• Four 0.5-inch-wide by 1.5-inch-tall rectangular slots were cut into the 6-inch PVC cap,
separated by 90°. These rectangular slots were centered on the liquid level and directed
the flow evenly into the clarifier. A second set of four rectangular slots, 0.5-inch-wide by
1-inch-tall, were cut into the 12-inch PVC pipe to prevent scum buildup. These slots were
offset from the first set by 45°, to limit short-circuiting. The rectangular slots in the 12-
inch pipe were cut so that the bottom of the slots would be at the liquid level.
Appendix B: West Point Treatment Plant Primary Effluent Data
Date
PE
NH3,
mg/L
PE
TKN,
mg/L
7/29/2018 36.5 53.6
8/12/2018 38.1 55.3
8/19/2018 36.4 53.5
8/26/2018 38.7 54.8
9/3/2018 39.2 50.8
9/9/2018 34.6 51.4
9/16/2018 25.3 40.3
9/23/2018 40.5 56.3
9/30/2018 39.4 54.1
10/7/2018 38.2 60
10/14/2018 38.7 58.1
10/21/2018 39.1 60.2
10/28/2018 13.3 24.1
11/4/2018 29.3 44.8
Page 167
147
11/12/2018 38.7 57.7
11/25/2018 32.1 48.2
12/2/2018 21.7 32.2
12/9/2018 26.4 38
12/30/2018 13.4 20.8
1/6/2019 15.4 24.7
1/20/2019 29.2 44.1
1/27/2019 30.9 42.9
2/4/2019 29.5 42.3
2/11/2019 28.8 40.4
2/18/2019 17.4 26.8
2/25/2019 27.4 38.8
3/4/2019 34.1 44.8
3/11/2019 32.5 47
3/18/2019 29.3 41.9
3/25/2019 33.5 44.6
4/1/2019 35.3 45.4
4/8/2019 34 47.2
4/15/2019 32.7 44.9
4/29/2019 35.2 47.7
5/6/2019 37.3 49.9
5/13/2019 37 52.9
5/28/2019 33.2 48.3
6/3/2019 35.3 51.1
6/10/2019 33.8 51.9
6/17/2019 34 50.9
6/24/2019 36.9 49.3
7/8/2019 28.1 41.4
7/15/2019 32.2 46.6
7/22/2019 41.8 59.6
7/29/2019 39 53.1
8/5/2019 37.7 52.7
8/12/2019 39.2 53.1
8/19/2019 36.9 52.6
8/26/2019 30.2 50
9/9/2019 34.3 49.8
9/16/2019 32.9 46.1
9/23/2019 25.6 42.1
9/30/2019 34.1 51.3
10/7/2019 39 54.4
10/14/2019 38.5 55.7
10/21/2019 25.6 37.3
10/28/2019 37.2 53
Page 168
148
11/4/2019 38.3 54.8
11/12/2019 29.3 44.7
11/18/2019 26.2 34.8
12/2/2019 36.7 55.9
12/9/2019 36.1 52.8
12/16/2019 30.9 43.7
1/6/2020 19.9 28.4
1/13/2020 22.1 33.1
1/27/2020 15.4 23.3
2/3/2020 14.6 27
2/10/2020 15.4 26.2
2/24/2020 24.7 34.2
3/2/2020 25.6 40.1