Page 1
Biochar from Oil Cakes: An E�cient Adsorbent forthe Removal of Acid Dyes From Wool Dye HouseE�uentseiko jose ( [email protected] )
Central Sheep and Wool Research InstituteReena Roy
Assam Agricultural University Faculty of Home ScienceAva Phukan
Assam Agricultural University Faculty of Home ScienceDinesh Shakyawar
Central Sheep and Wool Research InstituteAnuradha Sankaran
PSNA College of Engineering and Technology
Research Article
Keywords: Acid dyes, Biochar, Dye removal, E�uent treatment, Oil cakes
Posted Date: August 17th, 2021
DOI: https://doi.org/10.21203/rs.3.rs-795342/v1
License: This work is licensed under a Creative Commons Attribution 4.0 International License. Read Full License
Version of Record: A version of this preprint was published at Clean Technologies and EnvironmentalPolicy on January 17th, 2022. See the published version at https://doi.org/10.1007/s10098-021-02253-2.
Page 2
1
Biochar from oil cakes: An efficient adsorbent for the removal of acid dyes from wool dye house effluent 1
2
Seiko Jose1*, Reena Roy2, Ava Rani Phukan2, Dinesh Babu Shakyawar1, AnuradhaSankaran3 3
1 Textile Manufacturing and Textile Chemistry Division, ICAR - Central Sheep and Wool Research Institute, 4
Avikanagar, India, 304501 5
2 Department of Textiles and Apparel Design, Assam Agricultural University, Jorhat, Assam, India, 785013 6 3 Department of Chemistry, PSNA College of Engineering and Technology, Dindigul, Tamil Nadu, India, 624622 7
8
*Corresponding author 9
Email :[email protected] 10
11
Abstract 12
Textile dyeing industries are one of the major culprits for environmental pollution. The industries are 13
adopting various processes for the removal of dyes and chemicals from the effluent before disposing to the land or 14
water bodies. In the reported study, biochars were prepared from almond, coconut, and mustard oil cakes by 15
chemical activation with phosphoric acid followed by low temperature pyrolysis. The ball milling technique was 16
employed to reduce the particle size of the biochars below 300 nm. The synthesized biochars were used for the 17
removal of color from the acid dye effluent from the wool dyeing unit. The results showed that very small quantities 18
(2.0 %) of biochars are sufficient to remove around 92% color from the dye effluent. The batch adsorption and 19
kinetic studies indicate the highest efficiency of color removal for the biochar derived from almond oil cake, 20
followed by mustard and coconut. The adsorption properties of the synthesized biochars were found to be greatly 21
depending on the type of oil cake used. It is concluded that the biochars produced from the oil cakes may be a partial 22
replacement of petroleum based activated carbon for the color removal from wool textile dye effluent. 23
Key words : Acid dyes, Biochar, Dye removal, Effluent treatment, Oil cakes 24
1. Introduction 25
Textile industries opened up large employment opportunities in many countries. On another hand, they are 26
causing environmental pollution also. Many countries imposed stringent regulations for the disposal of dye effluents 27
to the land or nearby water bodies. The buyers are also conducting strict auditing in their production units to ensure 28
that the supplier is maintaining all ecological regulations from the raw material to the end product. Thus, to fulfill 29
the government regulations and customer demands, the textile industry need to stick on eco-friendly processing 30
Page 3
2
techniques to the maximum possible extent. The use of enzymes for pretreatment, high exhaustive dyes, and herbal 31
colors are some of the good initiative steps taken in this regard. 32
During the dyeing process, depending upon the class of dye and the nature of the textile fiber, it is 33
estimated that 15-20 % of the dyes remained in the dye bath and discharged as effluent. The dye house effluents may 34
contain heavy metals, ammonia, acids, alkalies, salts, and large amounts of pigments, many of which are toxic and 35
low bio-degradable materials (Crini, 2006; Mohan and Karthikeyan., 2004). The textile industrial effluents are 36
subjected to various treatments before discharging into the water bodies or land. The main methods used to treat 37
colored effluents are oxidation, coagulation, flocculation, biological treatment, and membrane filtration. The 38
disposal of improperly treated dye house effluent may cause a menace to the quality of the receiving water bodies, 39
the aquatic eco-system, and humans due to objectionable color, odor, high BOD and COD, TDS, and other toxic 40
compounds (Jose et al., 2020 a). In particular, acid dyes are widely employed in wool and silk dying industries. Such 41
textile dyes are typically very stable with half-lives of 2– 13 years in the environment, and they have been detected 42
in several rivers, lakes, and terrestrial soils, causing toxicological problems to the aquatic environment (Copaciu et 43
al., 2016). 44
Land disposal or burning is the most common disposal method adopted by farmers and industries, which 45
causes land, aquatic, and air pollution. There is an increase in research interest is observed in the scientific 46
community to covert the agro residues generated during cultivation, harvesting, and processing of crops into useful 47
outcomes. Many of the agro-residues have been used for the preparation of textiles, dyes, enzymes, activated carbon, 48
etc (Jose et al., 2020). Oil cakes as an agro-residue are obtained after the extraction of oil from dried kernels. Early 49
days, oil cakes had not acquired much commercial value except as feed for cattle and poultry. However, new 50
technologies open up enormous potential for oil cakes and it is reported to have the potentiality in the production of 51
enzymes, antioxidants, antibiotics, vitamins, biopesticides, etc (Ramachandran et al., 2007). 52
Pyrolysis is the conventional method of preparation of activated carbon and biochar. During this process, 53
the biomass is converted into carbon by the release of volatile matter. The yield and properties of the activated 54
carbon and biochar greatly depend on the raw materials, activating chemicals, and pyrolysis conditions (Yuan et al., 55
2020). The high cost effect of activated carbon restricts its use as a commercial adsorbent. Biochars prepared from 56
agro-residues such as rice husk, rice straw, hazelnut shell, pine needles, wheat straw, sunflower straw, etc, could 57
find potential applications in pesticide and heavy metal removal (Dawood et al., 2017), fertilizer, porous carbon 58
Page 4
3
catalysts (Wang et al.,2019 ; Panahi, et al., 2020; Vaughn et al., 2018), etc. A dearth of literature is available on the 59
preparation of biochar from oil cakes. 60
In the present attempt, biochars were prepared from almond, coconut, and mustard oil cakes through 61
chemical activation followed by pyrolysis. The physical and adsorption characteristics of the biochars were 62
investigated. The synthesized biochars were employed for the removal of color from acid dyes of real textile dye 63
effluent from the wool processing pilot plant using batch adsorption experimental studies. 64
2. Material and Methods 65
Oil cakes used for the study were collected directly from oil mills from various locations of India and used 66
without further purification. Optilan Turquiose (acid dye) was purchased from local dye suppliers, Jaipur, India. 67
Chemicals viz, orthophosphoric acid (assay - 98 %), and acetic acid (assay - 99.5 %), were purchased from Merck, 68
India. 69
2.1 Collection of dye effluent 70
The effluent used for the study was taken from the wool dyeing pilot plant at M/S Central Sheep and Wool 71
Research Institute, Avikanagar, Rajasthan, India. The dyeing of wool fabric with acid dye (10 g/l Optilan Turquiose) 72
was performed by maintaining 1:20 material to liquid ratio (MLR) keeping the pH 5.0 using acetic acid. The dyeing 73
was carried out at 90 °C for 30 min without using any auxiliaries, except 0.5 g/L nonionic wetting agent (Ultravon, 74
JU). After dyeing, the effluent was collected, filtered, and used for the characterization and batch experimental 75
studies. 76
2.2 Preparation of biochars 77
The oil cakes of almond, coconut, and mustard were pulverized in a grinder. The finely powdered oil cakes 78
were filtered through 200 mesh size nylon filter to get particles of almost the same size. Three hundred grams of 79
each powder were individually triggered to acid activation separately using 1.0 N and 2.5 N orthophosphoric acid 80
for 24 h, with continuous stirring in a mechanical shaker. The impregnation ratio of acid to oil cakes was kept at 4:1. 81
After acidification, the oil cakes were squeezed to remove the acid and dried at 105 °C for 60 min. The dried oil 82
cakes were then charred and further pyrolysed in a muffle furnace at 350℃ for 2 h with a heating rate of 20℃/min 83
in air atmosphere. The biochar thus obtained was washed with hot and then cold water to attain neutral pH and 84
dried. 85
The yield of biochar was calculated using the equation (1), 86
Page 5
4
Yield of Biochar = (weight of biochar/ weight of oil cake) x 100 (1) 87
The particle size of the biochars was further reduced by 2 h of ball milling in Pulverisette (model-6 88
ClassicLine, Fritsch, Russia).To narrow down the experiment, a preliminary exercise was conducted. The dye 89
effluent was treated with 0.5 % weight percentage of each adsorbent for 30 min and the absorbency values were 90
noted (Table 1). Based on the absorbency value, the best one from each oil cake was selected for further 91
characterization and batch adsorption studies, namely 2.5 N PAB, 1.0 N PCB, and 2.5 N PMB. 92
Table 1. Absorbency values of biochar prepared from oil cakes 93
S. No Biochars Abbreviation Absorbency
1 1.0 N H3PO4 treated almond oil cake biochar 1.0 N PAB 1.20
2 2.5 N H3PO4 treated almond oil cake biochar 2.5 N PAB 1.15
3 1.0 N H3PO4 treated coconut oil cake biochar 1.0 N PCB 1.27
4 2.5 N H3PO4 treated coconut oil cake biochar 2.5 N PCB 1.32
5 1.0 N H3PO4 treated mustard oil cake biochar 1.0 N PMB 1.22
6 2.5 N H3PO4 treated mustard oil cake biochar 2.5 N PMB 1.10
94
2.3. Characterization of biochars 95
The particle size of biochar was analyzed using the Malvern Mastersizer (model – 3000) particle size 96
analyzer. FTIR analysis was performed for the identification of functional groups present in the bare oil cakes and 97
the synthesized biochar using the Brucker double beam spectrophotometer (model - Alpha). The spectra were 98
measured from 4000-500 cm-1. Dispersion (0.1 %) of biochar in water was sonicated before feeding to the particle 99
size analyzer to deter agglomeration. The morphology of the biochar was analyzed by SEM analysis using Nova 100
Nano FESEM-450 (Netherland) with suitable magnification. X-ray diffraction analysis was conducted using a 101
Panalytical X’pert powder diffractometer. The surface area analysis of the biochars was performed using Nova Touc 102
LX2 b Quantachromme instrument to obtain the adsorption isotherm and the surface area was calculated by 103
Brunauer-Emmett Teller (BET) method. 104
2.4 Analysis of physical and adsorption properties of biochars 105
About 0.1 g of the biochars was added to 30 ml distilled water and boiled for 10 minutes. The solution was 106
brought to room temperature and filtered. The pH of the solution was measured with a pH meter (Hanna- HI98130). 107
Page 6
5
For the analysis of bulk density, 3.0 g of adsorbent was taken in a 10 ml measuring cylinder and tightly packed 108
without voids. The density was determined from the ratio of mass to volume. Adsorbent (0.5 g) was kept at 105 ºC 109
for 6 h. The moisture content of the adsorbent was analyzed from the difference in the weights before and after 110
drying. For porosity measurement, 2.5 ml distilled water was added to 1.5 g adsorbent in a 10 ml measuring 111
cylinder. The volume of the cylinder was recorded (V1) initially and after one hour (V2)(Pongener et. al., 2015).The 112
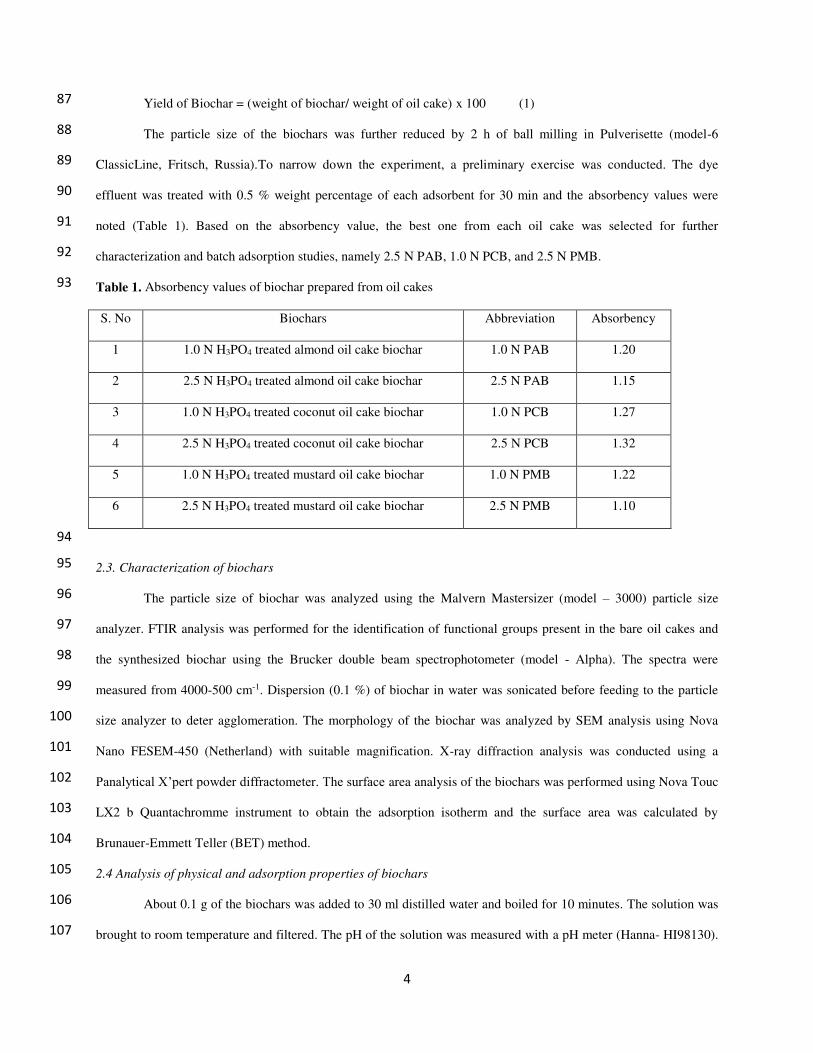
methylene blue value was determined by dissolving 1.2 g methylene dye in a1000 ml standard measuring flask with 113
the aid of 0.25 % (v/v) acetic acid. The absorbance of the solution was then adjusted to 0.84 at 620 nm by dilution. 114
Added 0.1 g of the biochar sample with 25 ml of the methylene blue test solution in a volumetric flask and shaken 115
until decolorization has occurred. The addition of methylene blue in the step of 5 ml was continued till the saturation 116
point, i.e., the color persists. The amount of methylene blue added was noted (Nunes and Guerreiro, 2011). 117
2.5 Batch adsorption experiments 118
The Optilan Turquiose acid dye effluent was treated with the selected biochars in a mechanical shaker with 119
200 rpm. The color removal efficiencies were recorded in terms of absorbance value. The experiments were 120
conducted at 27 °C keeping the actual pH (6.9) of the acid dye effluent. The weight percentage of the adsorbents 121
(0.5, 1.0, 1.5, and 2.0 %) and the duration of treatment (30, 60, and 90 min) were kept as variables. After each 122
experiment, the solution was centrifuged, filtered and the absorbency was measured using UV- Visible 123
spectrophotometer (make- Systronics). 124
2.6 Kinetic studies 125
Upon performing the batch adsorption studies, it was observed that 2.5 N PAB is giving the maximum 126
color removal. Thus, the kinetic study of 2.5 N PAB was carried out at different adsorbent dosages. The pseudo-first 127
order rate equation (2) was used to calculate the adsorption capacity of the synthesized biochar given by the 128
equation, 129
ln(qe-qt) = lnqe – k1t (2) 130
where qe is the amount of dye adsorbed on adsorbent at equilibrium (mg/g), qtis the amount of dye adsorbed at any 131
time (mg/g), and k1 (min-1) is the rate constant of the pseudo-first order adsorption which can be calculated from the 132
slope of the linear plot of ln(qe-qt) against time. The pseudo-second order expression used to describe the rate of 133
adsorption is presented by the equation (3), 134
Page 7
6
(3) 135
Where k2(g/mg/min) is the rate constant of the pseudo-second order adsorption. k2 and qe can be calculated from the 136
slope and intercept of the plot of t/qtvs time 137
138
3. Results and Discussion 139
3.1 Properties of biochars 140
The physical properties of the selected biochars are shown in Table 2. The yield of the biochar was found 141
to be a maximum for 2.5 N PMB (9.6 %), followed by 1.0 N PCB (9.4 %), and 2.5 N PAB (8.1 %). During the 142
charring process, the oil cakes undergo shrinkage and the weight loss may due to the loss of moisture content 143
followed by decomposition of cellulosic material and removal of inorganic impurities as ash (Ding et al., 2014).The 144
bulk density of the prepared 2.5 N PAB (0.652 g/cc) was found to be slightly higher than the others. The value of the 145
bulk density of the prepared bio chars is in between 0.50 g/cm3 and 0.75 g/cm3, which indicate that the prepared 146
biochars are suitable for decolorization applications (Downie et al., 2009). The pH values of all synthesized biochars 147
were found to be near neutral because of thorough washing with distilled water. 148
Table 2. Physical and adsorption properties of biochars 149
Biochar
Yield
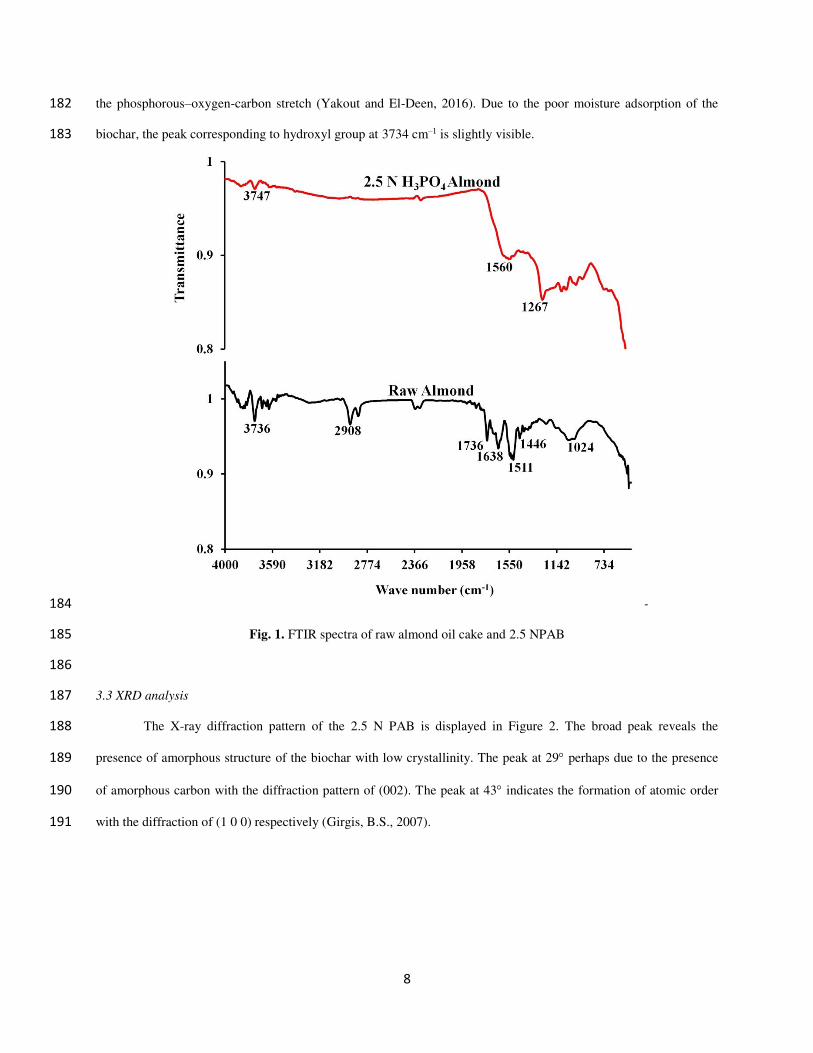
(%)
Bulk
density
(g/cm3)
Moisture
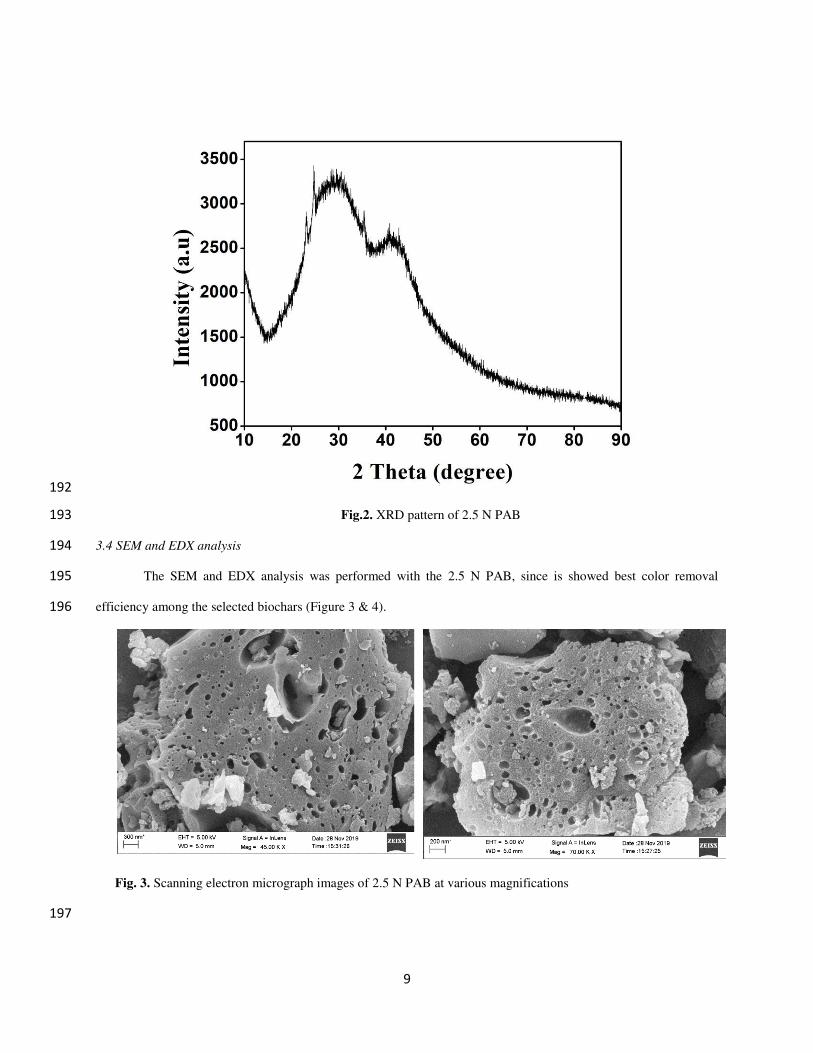
content %)
pH
Methylene
blue value
(mg/g)
Porosity
(%)
Mean
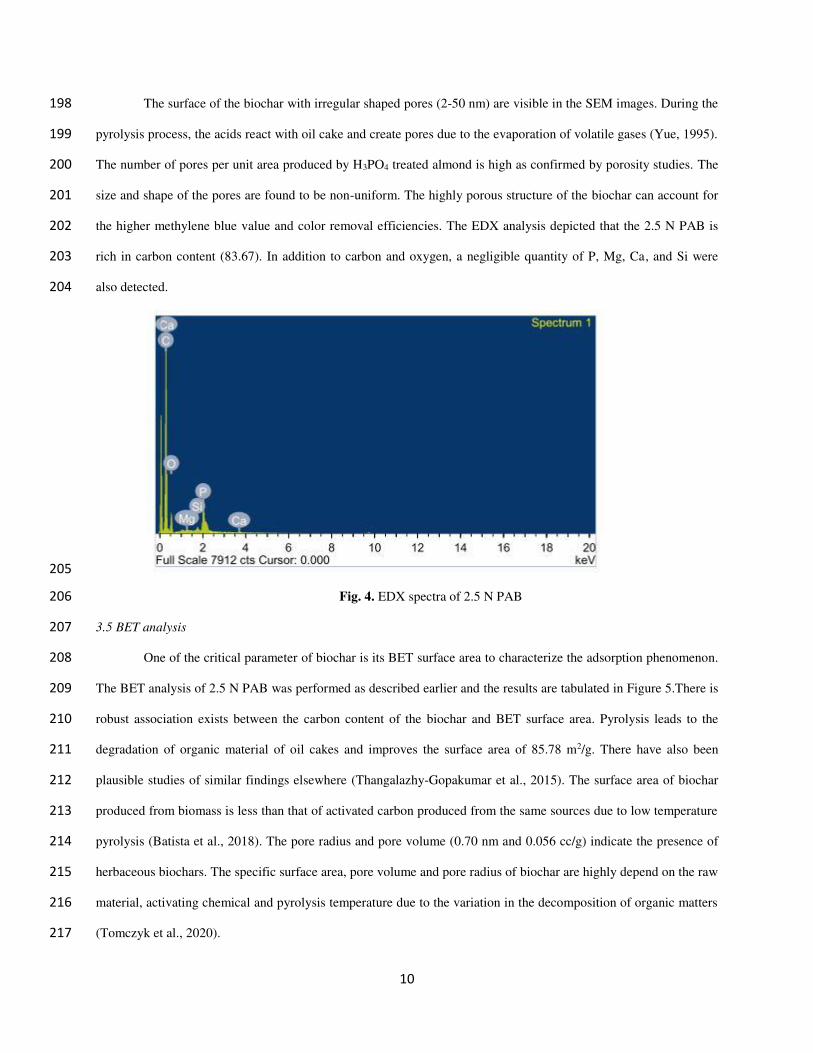
Particle
size (nm)
2.5 N PAB 8.1 0.652 21.34 6.6 130 0.346 310 (100)*
1.0 N PCB 9.4 0.625 12.13 6.7 105 0.323 113 (100)*
2.5 N PMB 9.6 0.625 14.21 6.5 120 0.369 140 (92)*
Note : *Figures in the parenthesis indicates the percentage of intensity of particle 150
151
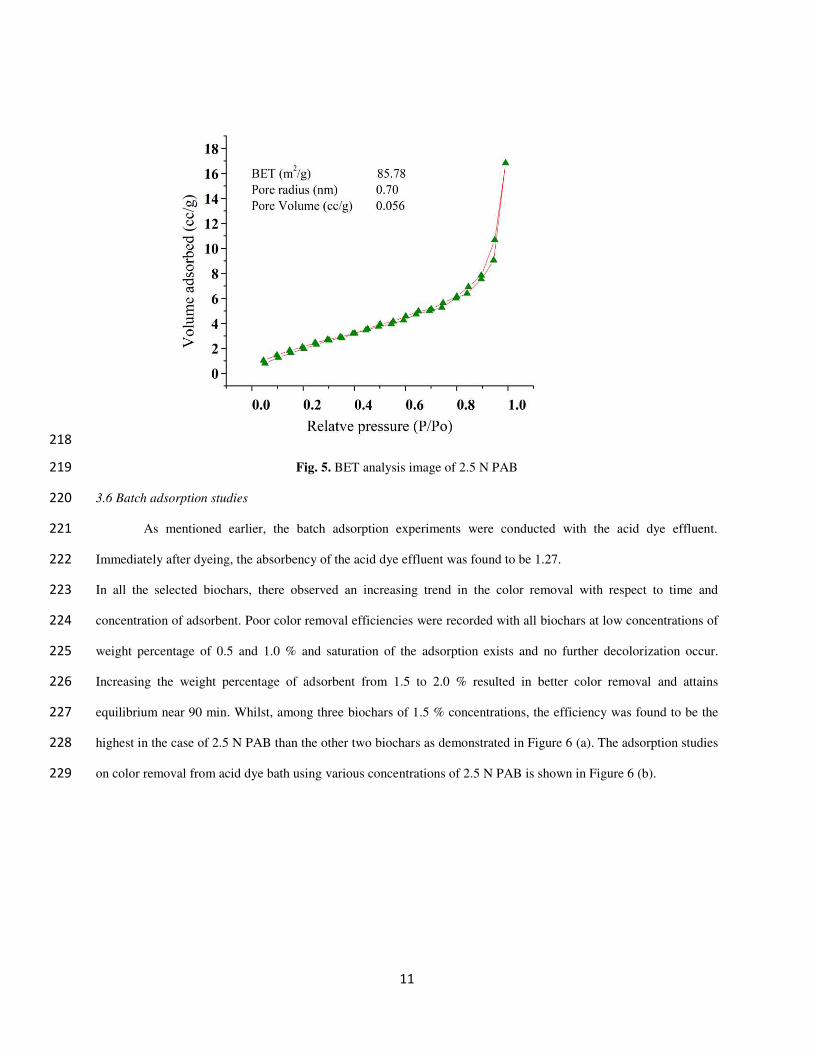
The dye adsorption capacity of biochars can be well expressed in terms of methylene blue value. Among 152
the three biochars, the highest methylene dye adsorption capacity (130 mg/g) was registered with 2.5 NPAB. One of 153
Page 8
7
the governing factors that determine the adsorption capacity of biochar is its porosity. The pores are formed in the 154
biochar is due to the release of volatile organic matters. The highest porosity (0.369 %) was observed with 2.5 N 155
PMB followed by 2.5 N PAB (0.349 %). The least porosity (0.323 %) was observed with biochar prepared from 1.0 156
N PCB. Ball milling is the common method adopting for the reduction of size of particles through grinding. Even 157
after the same chemical treatment followed by the same period of ball milling, it is observed that the size of the 158
biochar varies significantly depending on the source. The lowest particle size (113 nm) was observed in the case of 159
1.0 N PCB and the maximum was observed in the case of 2.5 N PAB (310 nm). From the particle size analysis of 160
various biochars, it is observed that, among the three biochars, 2.5 N PAB and 1.0 N PCB showed 100 % 161
distribution intensity and the 2.5 N PMB showed more than 90 %.This indicates that the ball milling process was 162
done perfectly and as a result, all the particles in a single biochars showed almost the same particle size (Partlan et 163
al., 2016). Thus, the physical and adsorption studies reveal that the properties of biochar greatly depend on the type 164
of oil cake and concentration of activating acid. 165
3.2 FTIR analysis 166
Since in the batch adsorption studies of acid dyes, the biochar prepared from 2.5 N PAB gave the best 167
performance, the FTIR study is being reported for the same in comparison with its source oil cake (Figure 1). The 168
chemical activation of biochar might promote the surface functional groups and hence influence the adsorption 169
property. In the case of pristine almond oil cake, the sharp peak at 3742 cm–1 corresponds to the –OH hydroxyl 170
stretching, probably due to the presence of moisture in the oil cake. The band near 1743 cm–1 is assigned to 171
stretching vibrations of the C=O of the ester and aldehydic groups present in hemicelluloses and lignin (Basu et al., 172
2015). The bands around 2916 cm–1 are attributed to aliphatic C-H asymmetric stretching present mainly in 173
cellulose, which is the major component of the lignocellulosic biomass (Adel et al., 2011). The broad peak at 1024 174
cm–1 region ascribed to C=O, C-H, C-O-C, and C-O deformation or stretching vibrations of different groups in 175
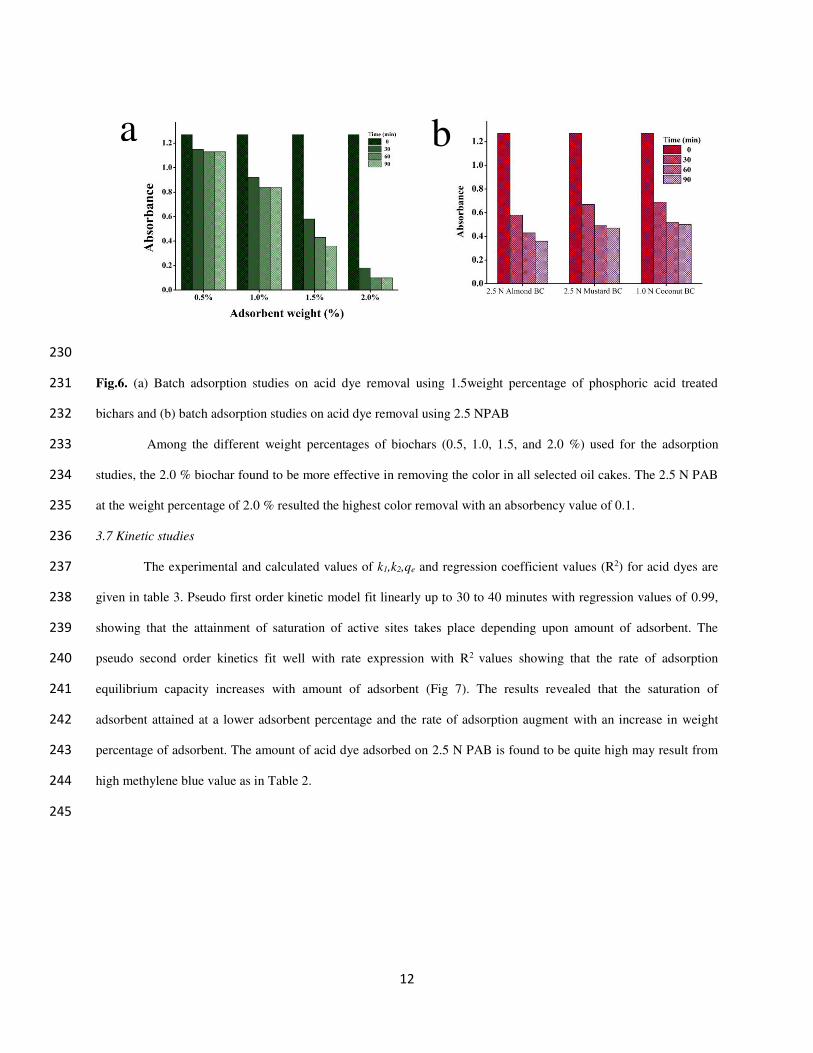
cellulose, hemicellulose, and lignin (Pandey et al., 2019). The sharp, but slightly broad peak at 1515 cm–1 indicates 176
the C=C vibrations of the aromatic rings of lignin (Jose et al., 2017). The C=O stretching vibration in conjugated 177
carbonyl of lignin is shown at 1639 cm–1 and the aliphatic part of lignin at 1446 cm–1 (Shi and li, 2012). In the case 178
of biochar, after chemical treatment followed by pyrolysis, most of the peaks were disappeared in comparison with 179
pristine oil cake. The peak at 1639 cm-1attribute to the removal of oxygen functional groups and the peak at 2916 180
cm-1 shows the decomposition of cellulosic structure and the appearance of a new peak at 1268 cm-1 may be due to 181
Page 9
8
the phosphorous–oxygen-carbon stretch (Yakout and El-Deen, 2016). Due to the poor moisture adsorption of the 182
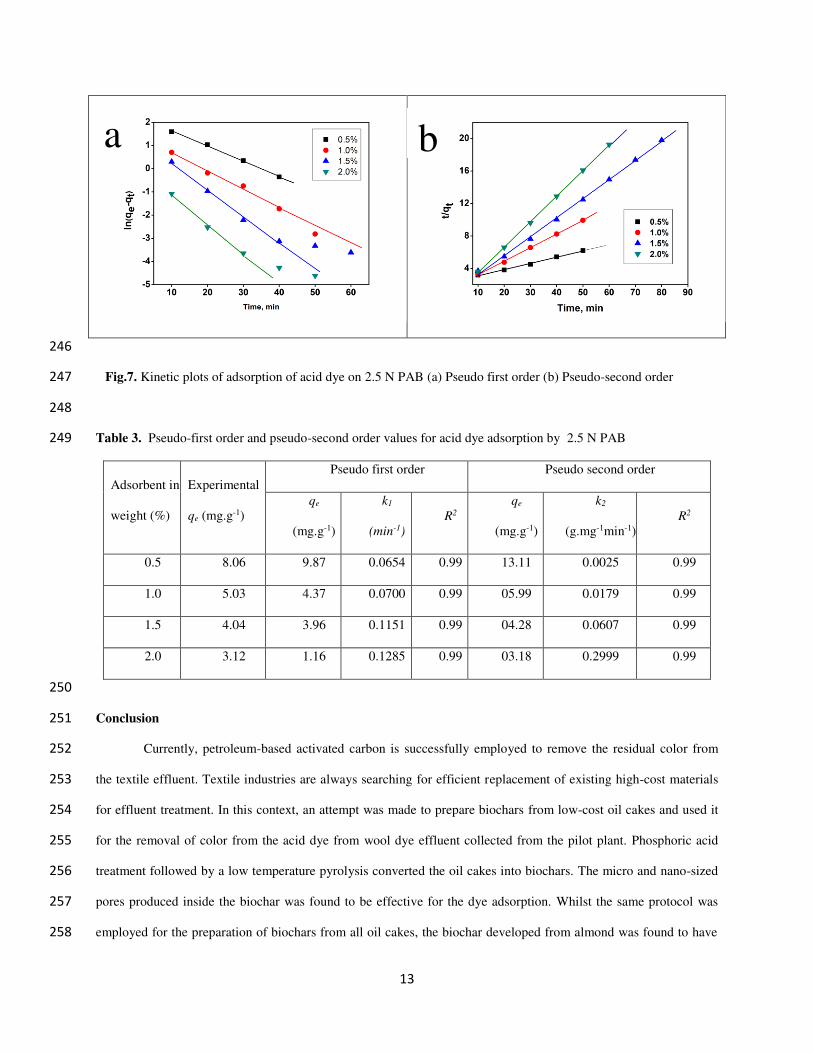
biochar, the peak corresponding to hydroxyl group at 3734 cm–1 is slightly visible. 183
- 184
Fig. 1. FTIR spectra of raw almond oil cake and 2.5 NPAB 185
186
3.3 XRD analysis 187
The X-ray diffraction pattern of the 2.5 N PAB is displayed in Figure 2. The broad peak reveals the 188
presence of amorphous structure of the biochar with low crystallinity. The peak at 29 perhaps due to the presence 189
of amorphous carbon with the diffraction pattern of (002). The peak at 43 indicates the formation of atomic order 190
with the diffraction of (1 0 0) respectively (Girgis, B.S., 2007). 191
Page 10
9
192
Fig.2. XRD pattern of 2.5 N PAB 193
3.4 SEM and EDX analysis 194
The SEM and EDX analysis was performed with the 2.5 N PAB, since is showed best color removal 195
efficiency among the selected biochars (Figure 3 & 4). 196
Fig. 3. Scanning electron micrograph images of 2.5 N PAB at various magnifications
197
Page 11
10
The surface of the biochar with irregular shaped pores (2-50 nm) are visible in the SEM images. During the 198
pyrolysis process, the acids react with oil cake and create pores due to the evaporation of volatile gases (Yue, 1995). 199
The number of pores per unit area produced by H3PO4 treated almond is high as confirmed by porosity studies. The 200
size and shape of the pores are found to be non-uniform. The highly porous structure of the biochar can account for 201
the higher methylene blue value and color removal efficiencies. The EDX analysis depicted that the 2.5 N PAB is 202
rich in carbon content (83.67). In addition to carbon and oxygen, a negligible quantity of P, Mg, Ca, and Si were 203
also detected. 204
205
Fig. 4. EDX spectra of 2.5 N PAB 206
3.5 BET analysis 207
One of the critical parameter of biochar is its BET surface area to characterize the adsorption phenomenon. 208
The BET analysis of 2.5 N PAB was performed as described earlier and the results are tabulated in Figure 5.There is 209
robust association exists between the carbon content of the biochar and BET surface area. Pyrolysis leads to the 210
degradation of organic material of oil cakes and improves the surface area of 85.78 m2/g. There have also been 211
plausible studies of similar findings elsewhere (Thangalazhy-Gopakumar et al., 2015). The surface area of biochar 212
produced from biomass is less than that of activated carbon produced from the same sources due to low temperature 213
pyrolysis (Batista et al., 2018). The pore radius and pore volume (0.70 nm and 0.056 cc/g) indicate the presence of 214
herbaceous biochars. The specific surface area, pore volume and pore radius of biochar are highly depend on the raw 215
material, activating chemical and pyrolysis temperature due to the variation in the decomposition of organic matters 216
(Tomczyk et al., 2020). 217
Page 12
11
218
Fig. 5. BET analysis image of 2.5 N PAB 219
3.6 Batch adsorption studies 220
As mentioned earlier, the batch adsorption experiments were conducted with the acid dye effluent. 221
Immediately after dyeing, the absorbency of the acid dye effluent was found to be 1.27. 222
In all the selected biochars, there observed an increasing trend in the color removal with respect to time and 223
concentration of adsorbent. Poor color removal efficiencies were recorded with all biochars at low concentrations of 224
weight percentage of 0.5 and 1.0 % and saturation of the adsorption exists and no further decolorization occur. 225
Increasing the weight percentage of adsorbent from 1.5 to 2.0 % resulted in better color removal and attains 226
equilibrium near 90 min. Whilst, among three biochars of 1.5 % concentrations, the efficiency was found to be the 227
highest in the case of 2.5 N PAB than the other two biochars as demonstrated in Figure 6 (a). The adsorption studies 228
on color removal from acid dye bath using various concentrations of 2.5 N PAB is shown in Figure 6 (b). 229
Page 13
12
230
Fig.6. (a) Batch adsorption studies on acid dye removal using 1.5weight percentage of phosphoric acid treated 231
bichars and (b) batch adsorption studies on acid dye removal using 2.5 NPAB 232
Among the different weight percentages of biochars (0.5, 1.0, 1.5, and 2.0 %) used for the adsorption 233
studies, the 2.0 % biochar found to be more effective in removing the color in all selected oil cakes. The 2.5 N PAB 234
at the weight percentage of 2.0 % resulted the highest color removal with an absorbency value of 0.1. 235
3.7 Kinetic studies 236
The experimental and calculated values of k1,k2,qe and regression coefficient values (R2) for acid dyes are 237
given in table 3. Pseudo first order kinetic model fit linearly up to 30 to 40 minutes with regression values of 0.99, 238
showing that the attainment of saturation of active sites takes place depending upon amount of adsorbent. The 239
pseudo second order kinetics fit well with rate expression with R2 values showing that the rate of adsorption 240
equilibrium capacity increases with amount of adsorbent (Fig 7). The results revealed that the saturation of 241
adsorbent attained at a lower adsorbent percentage and the rate of adsorption augment with an increase in weight 242
percentage of adsorbent. The amount of acid dye adsorbed on 2.5 N PAB is found to be quite high may result from 243
high methylene blue value as in Table 2. 244
245
a b
Page 14
13
246
Fig.7. Kinetic plots of adsorption of acid dye on 2.5 N PAB (a) Pseudo first order (b) Pseudo-second order 247
248
Table 3. Pseudo-first order and pseudo-second order values for acid dye adsorption by 2.5 N PAB 249
Adsorbent in
weight (%)
Experimental
qe (mg.g-1)
Pseudo first order Pseudo second order
qe
(mg.g-1)
k1
(min-1)
R2
qe
(mg.g-1)
k2
(g.mg-1min-1)
R2
0.5 8.06 9.87 0.0654 0.99 13.11 0.0025 0.99
1.0 5.03 4.37 0.0700 0.99 05.99 0.0179 0.99
1.5 4.04 3.96 0.1151 0.99 04.28 0.0607 0.99
2.0 3.12 1.16 0.1285 0.99 03.18 0.2999 0.99
250
Conclusion 251
Currently, petroleum-based activated carbon is successfully employed to remove the residual color from 252
the textile effluent. Textile industries are always searching for efficient replacement of existing high-cost materials 253
for effluent treatment. In this context, an attempt was made to prepare biochars from low-cost oil cakes and used it 254
for the removal of color from the acid dye from wool dye effluent collected from the pilot plant. Phosphoric acid 255
treatment followed by a low temperature pyrolysis converted the oil cakes into biochars. The micro and nano-sized 256
pores produced inside the biochar was found to be effective for the dye adsorption. Whilst the same protocol was 257
employed for the preparation of biochars from all oil cakes, the biochar developed from almond was found to have 258
a b
Page 15
14
better efficiency than others with 92 % color removal efficiency. Due to the low temperature pyrolysis, though the 259
performance of the synthesized biochars is expected to be slightly lesser than the commercial activated carbon 260
produced from petroleum products, the cost may be justified with low cost precursor. Acid dyes are commonly 261
employed for the dyeing of wool fabric. In comparison with reactive dyeing of cotton, due to the high affinity of 262
acid dyes on wool, they produce very few remnant dyes in the dye bath. Here, the high-cost activated carbon may be 263
partially or fully replaced with low-cost biochars produced from agro residues. The study concluded that the 264
biochars produced from low cost agro processing residue - oil cakes can effectively transform into high-value 265
biochars and the said biochars can be used for the removal of color from acid dye effluent from wool dye house. 266
References 267
Adel AM, Abd El-Wahab ZH, Ibrahim AA, Al-Shemy MT (2011) Characterization of microcrystalline cellulose 268
prepared from lignocellulosic materials. Part II: Physicochemical properties. Carbohydr. Polym 83(2):676-687 269
Basu G, Mishra L, Jose S, Samanta AK (2015) Accelerated retting cum softening of coconut fibre. Ind Crop Pro 270
77:66-73 271
Batista EM, Shultz J, Matos TT, Fornari MR, Ferreira TM, Szpoganicz B, de Freitas RA, Mangrich AS (2018) 272
Effect of surface and porosity of biochar on water holding capacity aiming indirectly at preservation of the 273
Amazon biome. Sci. Rep 8(1):1-9 274
Crini G (2006) Non-conventional low-cost adsorbents for dye removal: a review. Bioresour. Technol 97(9):1061-275
1085 276
Copaciu F, Opriş O, Niinemets Ü, Copolovici L (2016) Toxic influence of key organic soil pollutants on the total 277
flavonoid content in wheat leaves. Water Air Soil Pollut 227(6):1-10 278
Dawood S, Sen TK, Phan C (2017) Synthesis and characterization of slow pyrolysis pine cone bio-char in the 279
removal of organic and inorganic pollutants from aqueous solution by adsorption: kinetic, equilibrium, 280
mechanism and thermodynamic. Bioresour. Technol 246:76-81 281
Ding W, Dong X, Ime IM, Gao B, Ma LQ (2014) Pyrolytic temperatures impact lead sorption mechanisms by 282
bagasse biochars. Chemosphere 105:68-74 283
Downie A, Crosky A, Munroe P (2012) Physical properties of biochar. In Biochar for environmental management, 284
Routledge pp 45-64 285
Page 16
15
Girgis BS, Temerk YM, Gadelrab MM, Abdullah ID (2007) X-ray diffraction patterns of activated carbons prepared 286
under various conditions. Carbon lett 8(2):95-100 287
Jose S, Mishra L, Basu G, Kumar Samanta A (2017) Study on Reuse of Coconut Fiber Chemical Retting Bath. Part 288
II---Recovery and Characterization of Lignin. J. Nat. Fibers 14(4):510-518 289
Jose S, Samant L, Bahuguna A, Pandit P (2020) Opportunities of Agro and Biowaste in the Fashion Industry. 290
Recycling from Waste in Fashion and Textiles: A Sustainable and Circular Economic Approach pp73-100 291
Jose S, Shanmugam N, Kumar A, Das S (2020) Removal of Basic Violet from Wool Dyeing Effluent Using 292
Nanoparticles. J. Nat. Fibers 19:1-11 293
Mohan SV, Karthikeyan J (2004) Adsorptive removal of reactive azo dye from an aqueous phase onto charfines and 294
activated carbon. Clean Technol Environ Policy 6(3):196-200 295
Norouzi S, Heidari M, Alipour V, Rahmanian O, Fazlzadeh M, Mohammadi-Moghadam F, Nourmoradi H, 296
Goudarzi B, Dindarloo K (2018) Preparation, characterization and Cr (VI) adsorption evaluation of NaOH-297
activated carbon produced from Date Press Cake; an agro-industrial waste. Bioresour. Technol 258:48-56 298
Nunes CA, Guerreiro MC (2011) Estimation of surface area and pore volume of activated carbons by methylene 299
blue and iodine numbers. Quim. Nova 34:472-476 300
Panahi HK, Dehhaghi M, Ok YS, Nizami AS, Khoshnevisan B, Mussatto SI, Aghbashlo M, Tabatabaei M, Lam SS 301
(2020) A comprehensive review of engineered biochar: production, characteristics, and environmental 302
applications. J. Clean. Prod. 270:122462 303
Pandey R, Patel S, Pandit P, Nachimuthu S, Jose S (2018) Colouration of textiles using roasted peanut skin-an agro 304
processing residue. J. Clean. Prod. 172:1319-1326 305
Partlan E, Davis K, Ren Y, Apul OG, Mefford OT, Karanfil T, Ladner DA (2016) Effect of bead milling on 306
chemical and physical characteristics of activated carbons pulverized to superfine sizes. Water res 89:161-170 307
Pongener CH, Kibami DA, Rao KS, Goswamee RL, Sinha D (2015) Synthesis and Characterization of Activated 308
Carbon from the Biowaste of the Plant Manihot esculenta. Chem. Sci. Trans 4(1):59-68 309
Ramachandran S, Singh SK, Larroche C, Soccol CR, Pandey A (2007) Oil cakes and their biotechnological 310
applications–A review. Bioresour. Technol 98(10):2000-2009 311
Samant L, Jose S, Rose NM, Shakyawar DB (2020) Antimicrobial and UV protection properties of cotton fabric 312
using enzymatic pretreatment and dyeing with Acacia catechu. J. Nat. Fibers 26:1-11 313
Page 17
16
Shi J, Li J (2012) Metabolites and chemical group changes in the wood-forming tissue of Pinus koraiensis under 314
inclined conditions. Bio Resources 7(3):3463-3475 315
Liu C, Shi W, Li H, Lei Z, He L, Zhang Z (2014) Improvement of methane production from waste activated sludge 316
by on-site photocatalytic pretreatment in a photocatalytic anaerobic fermenter. Bioresour. Technol 155:198-203 317
Tomczyk A, Sokołowska Z, Boguta P (2020) Biochar physicochemical properties: pyrolysis temperature and 318
feedstock kind effects. Rev. Env. Sci. Biotechnol 19(1):191-215 319
Vaughn SF, Dinelli FD, Jackson MA, Vaughan MM, Peterson SC (2018) Biochar-organic amendment mixtures 320
added to simulated golf greens under reduced chemical fertilization increase creeping bentgrass growth. Ind 321
Crop Pro 111:667-672 322
Wang J, Wang S (2019) Preparation, modification and environmental application of biochar: a review. J. Clean. 323
Prod. 227:1002-1022 324
Yuan T, He W, Yin G, Xu S (2020) Comparison of bio-chars formation derived from fast and slow pyrolysis of 325
walnut shell. Fuel 261:116450 326
Yakout SM, El-Deen GS (2016) Characterization of activated carbon prepared by phosphoric acid activation of 327
olive stones. Arab.J.Chem. 9:S1155-S1162 328
Yue, Z.R (1995) Preparation of activated carbon fibers and adsorption mechanism of Ag+ .Ph.D. dissertation. 329
Zhongshan University, Guangzhou. 330
331
Page 18
Supplementary Files
This is a list of supplementary �les associated with this preprint. Click to download.
Graphicalabstract.jpg