Because of their biodegradability and biocom-patibility, polylactic acid and its copolymers withglycolic acid (PLGA) are widely employed for thepreparation of sustained release preparations (An-derson and Shive, 1997). They are used for theproduction of implants, inserts and particulate
systems. Especially micro- and nano-particlesmade of PLGA copolymers are widely investi-gated for the controlled release of classical drugmolecules as well as peptides and proteins. Theadministration routes vary from parenteral (Daset al., 2000), oral (Coombes et al., 1997), derma-tological (De Galon et al., 2001) pulmonary(O’Hara and Hickney, 2000) and nasal (Tobio etal., 1998) to ocular (Veloso et al., 1997; Moriteraet al., 1992, 1991).
Several methods were proposed for the prepara-tion of PLGA microspheres, such as extrusion(Zhang et al., 1994), spray drying (O’Hara and
J. Vander�oort, A. Ludwig / International Journal of Pharmaceutics 238 (2002) 77–9278
Hickney, 2000) and supercritical fluid extraction(Kompella and Koushik, 2001). The techniquemostly used, however, is the emulsification solventevaporation method (O’Donnell and McGinity,1997). It involves the solution of the PLGA poly-mer in an organic solvent, emulsifying the PLGAsolution in a non solvent (mostly water) andprecipitating the PLGA polymer as particles byevaporating the organic solvent. Lipophilic drugsare incorporated by dissolving them in the organicsolvent along with PLGA. For hydrophilic drugsthe w/o/w emulsification solvent evaporation isused, dissolving the drug into the inner waterphase of the double emulsion.
In most cases, a stabilizer is added to theformulation in order to stabilize the emulsionformed during particle preparation. These stabi-lizers, however, can also influence the propertiesof the particles formed. The type and concentra-tion of the stabilizer selected may affect the parti-cle size. Being present at the boundary layerbetween the water phase and the organic phaseduring particle formation, the stabilizer can alsobe incorporated on the particle surface, modifyingparticle properties such as particle zeta potentialand mucoadhesion (Scholes et al., 1999; Feng andHuang, 2001). Both size and zeta potential valueare important physicochemical particle properties,as they determine the physical stability as well asthe biopharmaceutical properties of the prepara-tion. Drug release rate, biodistribution, mucoad-hesion and cellular uptake can all be influenced bythe type and concentration of the stabilizer used.
In the literature, poly(vinyl alcohol) (PVA) isthe most popular stabilizer for the production ofPLGA nanoparticles. In the present study otherpolymers were tested as stabilizers. These poly-mers were incorporated as such and in combina-tion with PVA. The aim was to study how the useof other polymers in the preparation of nanopar-ticles would affect particle size and zeta potentialvalue. The effect of the presence or absence ofPVA during preparation as well as the effect ofthe concentration of the alternative stabilizers wasevaluated. Considering the stability of PLGA par-ticles, the effect of the freeze-drying process onthe particle size and zeta potential was alsostudied.
The polymers evaluated as stabilizers in thisstudy are cellulosic derivatives methylcellulose(MC), hydroxyethylcellulose (HEC), hydrox-ypropylcellulose (HPC) and hydroxypropyl-methylcellulose (HPMC), as well as gelatin type Aand B, carbomer and poloxamer. Some of thesepolymers have been reported as adjuvants in thepreparation of PLGA particles, such as polox-amer (Scholes et al., 1999; De Rosa et al., 2000;O’Hara and Hickney, 2000; Couvreur et al.,1997), gelatin (Tobio et al., 1998; Arshady, 1991),HPMC (Gabor et al., 1999; Sansdrap and Moes,1993), MC (Arshady, 1991) and carbopol (Wanget al., 1991). Moreover, HPMC, poloxamer andcarbomer are interesting compounds because oftheir mucoadhesive properties (Takeuchi et al.,2001). Gelatin type A and B were both selectedbecause of their difference in isoelectric point,resulting in different electrical charges. A differ-ence in zeta potential of the particles producedwith gelatin type A and B was thus expected.
Each polymer was compared to PVA using a 22
full factorial design. This rational methodologyallows for the determination of the influence ofthe factors investigated and their interactions re-quiring a minimum of experiments. Moreover, thedesign was expanded to a central composite de-sign, enabling the modelling of the responses as afunction of the parameters investigated. This al-lows an estimation of the particle properties for acertain combination of polymer and PVA withinthe experimental region.
2. Materials and methods
2.1. Materials
The PLGA polymer used was Resomer® 503 Hwith a molecular weight of 34000 (BoehringerIngelheim, Germany). Poly(vinyl alcohol) (PVA)MW 30000–70000 was supplied by Sigma, USA.As alternatives for PVA, the following polymerswere employed: methylcellulose (MC): Methocel®
J. Vander�oort, A. Ludwig / International Journal of Pharmaceutics 238 (2002) 77–92 79
(HPMC): Benecel® MP 943 R (Aqualon); gelatintype A: from porcine skin, bloom 175 (Sigma);gelatin type B: from bovine skin, bloom 225(Sigma); carbomer: Carbopol® 980 NF (BFGoodrich, USA) and poloxamer: Lutrol® F68(BASF, Germany). Dichloromethane was pur-chased from Sigma-Aldrich (Germany).
2.2. Experimental design
2.2.1. 22 full factorial design with centerpoint
2.2.1.1. Design of the experiments. Various poly-mers were evaluated as stabilizers in the produc-tion of PLGA nanoparticles using a two level fullfactorial design with centerpoint. The two factorsinvestigated were the concentration of PVA andthe concentration of the polymer tested in theouter water phase. For the concentration of PVA,the upper (+ ), centerpoint (0), and lower (− )level values are 1% w/v, 0.5% w/v and 0% w/v,respectively, as was described in an earlier study(Vandervoort and Ludwig, 2000). The concentra-tions of the polymers tested were chosen as fol-lows. At the centerpoint, an aqueous solutionhaving the same viscosity as a 1% w/v PVAaqueous solution was set. These concentrationswere derived from capillary viscosimetric mea-surements. For the upper level this concentrationwas multiplied by two, for the lower level it wasdivided by two.
Points 1 and 2 are preparations in which thepolymer tested is used simultaneously with PVA.In experiments 3 and 4 no PVA is present duringPLGA particle preparation.
The same design was applied for all polymersinvestigated. At the centerpoint preparations weremade in triplicate in order to estimate the experi-mental error. After obtaining preparations 1–5,the particles’ physical properties were measured.Effects of and interactions between parameterswere calculated.
2.2.1.2. Calculation of effects and interactions. Tocalculate the effect Ex of a factor x all measure-ments where the factor is at its lower (− ) levelwere subtracted from all those where the factorwas at its upper (+ ) level and subsequently di-
vided through half of the number of measure-ments used in the calculation. This results in thefollowing formula (Box et al., 1978):
Ex=�x(+ )−�x(− )
4/2(1)
The effect of PVA on the particle size, forexample, was estimated by subtracting the sum ofthe particle sizes measured at points 3 and 4 fromthe sum of those measured at points 1 and 2 anddividing the result by 2.
Interactions between components were also cal-culated. An interaction between PVA and a poly-mer tested is present when the effect of thepolymer is not the same at the two levels of PVA.To estimate an interaction between two factorsone has to calculate the effect of the first factor atthe lowest level of the second factor and subtractit from the effect of the first factor at the highestlevel of the second factor. An interaction betweentwo factors is symbolized as factor 1× factor 2.
To estimate the significance of the effects at-test is performed. The test statistic t equals:
t=Ex
(SE)e
(2)
Ex is the effect of a factor and (SE)e is thestandard error on the effect. The replicates of thecenterpoint were used to estimate (SE)e. In thiscase, (SE)e equals s, the standard deviation on theresults measured at the centerpoint.
The calculated test statistic t is compared to atabulated t-value at a significance level of 95%(�=0.05). If the calculated t-value is higher thanthe tabulated t-value the effect is considered to besignificant.
2.2.2. Central composite designFor the two most promising polymers, the 22
full factorial design was expanded to a centralcomposite. The advantage of this method is thatby adding just three extra ‘star’ points to theinitial factorial design, extra levels for both fac-tors are created resulting in four levels for PVAand five levels for the polymers tested. This allowsfor the fitting of the experimental data to aquadratic model. Once the model is calculated it
J. Vander�oort, A. Ludwig / International Journal of Pharmaceutics 238 (2002) 77–9280
Fig. 1. Central composite design (�) 22 full factorial design; � centerpoint; (�) star points.
can be used to predict a certain response, in thiscase zeta potential value and particle size, for aknown composition of stabilizers in the prepara-tion. The 22 full factorial design and its expansionto a central composite design is presented in Fig.1.
The following quadratic model was used to fitthe data:Response=a+b×PVA+c×PVA2+d
×Polymer+e×Polymer2+ f×PVA
×Polymer (3)To perform the statistical analysis of the data,
the Statistica® software was employed (Statsoft,Tulsa, OK).
2.3. Preparation of polymer solutions
The concentrations of the polymer solutionsused in the present study are presented in Table 1.PVA, MC and HEC solution were prepared bydispersing the polymer in distilled water at 70 °Cunder magnetic stirring. In the case of HPC thewater was brought to a temperature of 50 °C,while HPMC, poloxamer and carbopol were dis-persed in distilled water at room temperature. Thecarbopol dispersion was afterwards neutralized byadding a NaOH solution to a pH value of 7. Thegelatin solutions were prepared by dispersing thegelatin in cold distilled water, allowing the gelatinparticles to swell, and afterwards heating the dis-persion to 50 °C under magnetic stirring (Ther-molyne HP46820-26, Dubuque, IO).
2.4. Particle preparation
The PLGA particles were prepared using aw/o/w emulsification solvent evaporation method(Vandervoort and Ludwig, 2000). Two microlitersof distilled water (w1) were emulsified with asolution of PLGA (10% w/v) in 10 ml ofdichloromethane using an ultrasonic probe (Bran-son Sonic Power S.A., Danbury, CT) for 1 min.This primary w1/o emulsion was poured into 50ml of a stabilizer solution (w2) and sonication wascontinued for 30 s. Finally, the w1/o/w2 emulsionwas poured into a larger volume (400 ml) of astabilizer solution (w3) in order to increase thedistance between emulsion droplets and to mini-mize coalescence and aggregation of the particlesbeing formed. The preparation was stirred with a
Table 1Concentrations (% w/v) of polymers used in the experimentaldesign
Gelatin A 0.234 0.467 0.9340.305Gelatin B 1.2180.609
0.6405.3254.3982.1991.100Poloxamer
J. Vander�oort, A. Ludwig / International Journal of Pharmaceutics 238 (2002) 77–92 81
propeller (IKA Eurostar digi-visc, IKA labortech-nik, Staufen, Germany) for 2 h at 700 rpm toallow the dichloromethane to evaporate and thePLGA to precipitate as particles. The particlesuspension was then stored in a refrigerator. Partof the suspension was kept as such for direct sizeand zeta potential measurements. Another part ofthe preparation was freeze-dried immediately afterpreparation (GT-2a, Leybold-Heraeus, Germany).
The concentrations of the polymers in the firstouter water phase w2 are mentioned in Table 1.The concentrations in the second outer waterphase w3 are those used in w2 but divided bythree.
2.5. Physical measurements
2.5.1. Particle sizeParticle size was determined by photon correla-
tion spectroscopy (PCS) with a Zetasizer 3000(Malvern Instruments, Malvern, UK). Nonfreeze-dried samples were diluted ten times withdistilled water. The lyophilized product was resus-pended in distilled water using mild magneticstirring before measuring. The Z ave of eachsample was measured at least five times and themean value was calculated and used for the facto-rial design and response surface calculations.
doppler anemometry (LDA) was used. Beforemeasuring, each sample was diluted ten times withdistilled water. Freeze-dried samples were resus-pended in distilled water under magnetic stirring.About 10 ml of dispersion was injected into thecapillary of the Zetasizer 3000 (Malvern Instru-ments). Each sample was measured at least tentimes. The average values were employed for thecalculations of the factorial design and the re-sponse surfaces.
3. Results and discussion3.1. 22 Full factorial design with centerpoint
3.1.1. Particle sizeA graphical representation of the particle size
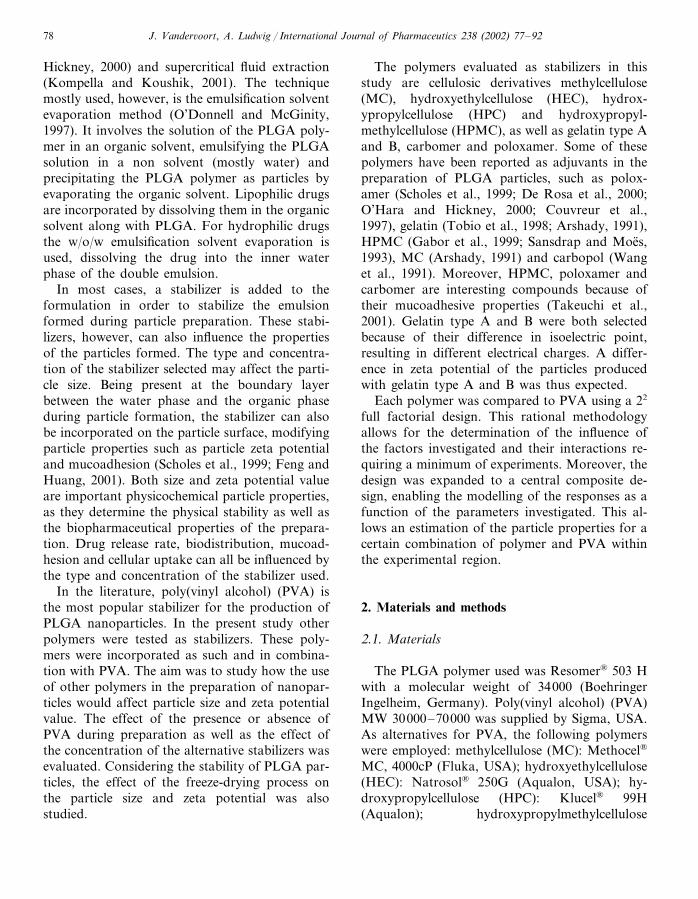
of PLGA nanoparticles obtained is given in Fig.2. Particle sizes ranging from 300 to 3000 nm weremeasured. For most polymers, the sizes measuredin points 3 and 4 of the design are larger thanthose measured in points 1 and 2. This means thatwhen PVA is left out of the formulation, particlesize increases. This can be explained by the factthat most polymers tested are not such goodstabilizers, resulting in the formation of largerdroplets during emulsion preparation and subse-quently larger precipitated particles. The size ofthe effects is presented in Table 2.
For most preparations, the addition of PVA tothe formulation has a negative effect on the parti-cle size, meaning that particle size decreases as thePVA concentration increases. Two exceptions arecarbopol and poloxamer. In the case of carbopolthe effect of the concentration of PVA is slightlypositive, both before and after freeze-drying. Thiscan be explained by the fact that carbopol itself isa good stabilizer. Adding PVA to the formulationcauses an increase in the viscosity of the outerwater phase, resulting in larger emulsion dropletsand larger particles. In the case of poloxamer theeffect of PVA is almost zero before freeze-dryingand +107 nm after freeze-drying.
The effect of the concentration of the polymerstested is negative or positive. A positive effectwould imply that increasing the concentrationcauses the emulsion to have larger droplets, henceleading to larger particles. A negative effect meansthat increasing the concentration causes the emul-sion to be more stable, hence leading to smallerparticles. The stabilizing properties of the poly-mers can be explained by either their viscosity,their ability to lower surface tension or their threedimensional structure at the interface (Couvreuret al., 1997).
Freeze-drying has either a significant positiveeffect, or a non-significant smaller effect. It couldbe expected that particle size would increase afterlyophilization, because nanoparticles tend to ag-gregate during this process. If the aggregated par-ticles do not separate during redispersion, thenlarger particle sizes will be measured. Polymerswith cryoprotecting properties such as poloxamerand carbopol should, when present at thenanoparticle surface, protect the particles from
J. Vander�oort, A. Ludwig / International Journal of Pharmaceutics 238 (2002) 77–9282
Tab
le2
Eff
ects
ofth
eco
ncen
trat
ion
ofP
VA
,th
epo
lym
ers
test
edan
dfr
eeze
-dry
ing
onth
epa
rtic
lesi
zeof
the
PL
GA
nano
part
icle
s
Fac
tor
Stab
ilize
rs
Gel
atin
AG
elat
inB
Pol
oxam
erH
PC
MC
HP
MC
Car
bopo
lH
EC
Eff
ect
ofth
est
abili
zer
conc
entr
atio
nson
the
part
icle
size
befo
refr
eeze
dryi
ng(n
m)
−37
5−
1234
0−
1249
+79
−35
6C
onc.
PV
A−
729
−59
6−
177
−86
1−
38C
onc.
poly
mer
+60
8+
72−
21+
1076
+88
+31
+81
2+
184
+1
−95
7P
VA
×po
lym
er+
31−
41−
602
Eff
ect
ofth
est
abili
zer
conc
entr
atio
nson
the
part
icle
size
afte
rfr
eeze
dryi
ng(n
m)
+68
9−
2062
+10
7C
onc.
PV
A−
553
−95
3+
44−
1055
−95
1+
468
−57
7+
194
+44
4+
1004
Con
c.po
lym
er+
107
+40
7+
923
PV
A×
poly
mer
+58
0−
471
+69
6+
138
−35
1+
64−
1137
−33
5
Eff
ect
ofth
efr
eeze
-dry
ing
proc
ess
onth
epa
rtic
lesi
ze(n
m)
Fre
eze-
dryi
ng+
716
+20
6−
10+
81+
152
+22
+73
+26
6
The
effe
cts
and
inte
ract
ions
that
wer
est
atis
tica
llysi
gnifi
cant
are
prin
ted
bold
(P=
0.05
);‘×
’sy
mbo
lizes
anin
tera
ctio
nbe
twee
nfa
ctor
s.
J. Vander�oort, A. Ludwig / International Journal of Pharmaceutics 238 (2002) 77–92 83
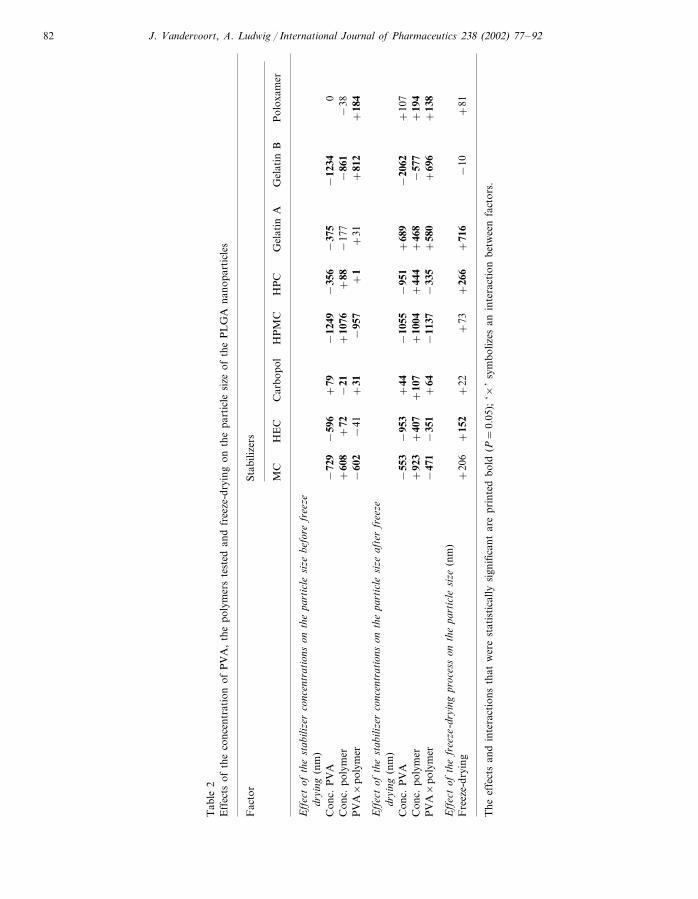
Fig. 2. Graphical representation of the particle size of PLGA nanoparticles before and after freeze-drying.
Fig. 3. Interaction effect between MC and PVA and Carbopol and PVA on PLGA nanoparticle size (nm).
aggregation and make sure the redispersion re-quires a minimum of energy, being attributed tothe formation of a steric barrier between theparticles during lyophilization or to a stabilizationof the particle dispersion due to electrostatic re-pulsions, which will be discussed in Section 3.1.2(Quintanar-Guerrero et al., 1998).
Some of the interactions are also significant andtheir effect is sometimes quite large, indicatingthat the effect of the polymer tested without thepresence of PVA in the preparation is differentfrom the effect when PVA is present. The interac-tion effect is illustrated with the plots presented inFig. 3. In the first plot the size data obtained from
J. Vander�oort, A. Ludwig / International Journal of Pharmaceutics 238 (2002) 77–9284
the experiments with MC and PVA are printed atthe points representing the experiments (the cen-terpoint was left out of the drawing). At thelowest (− ) level of PVA the particle size obtainedat a low concentration of MC is 641 nm, while atthe higher concentration 2035 nm was measured.Consequently, the effect of the concentration ofMC is +1394 nm. Making the same calculationsat the high (+ ) level of PVA results in an effectof +451 nm. Thus going from the low to thehigh level of PVA concentration, the effect of MCchanges from +1394 to +451 nm. The interac-tion is calculated as 451−1394 nm= −943 nm.This kind of effect is called a negative interaction.
In the second plot an example of a positiveinteraction is presented. At the low PVA level theeffect of the concentration of carbopol is only+42 nm, compared to +171 nm at the highPVA level. In this case the effect of the first factor(carbopol) increases as the level of the secondfactor (PVA) changes from − to + . This posi-tive interaction can be calculated as 171−42nm= +129 nm. The data for the interactionsfound in Table 2 are equal to the ones calculatedhere, but divided by two, on the analogy of Eq.(1).
In conclusion, for most polymers tested thepresence of PVA is needed in order to producenanoparticles. Two polymers seem to be able toyield nanoparticles without the addition of PVAas stabilizer: carbopol and poloxamer. The parti-cle size is an important particle property, as it can
influence the biopharmaceutical properties of theparticle preparations. Smaller particles have alarger free surface, which can lead to a fasterrelease of a drug incorporated (Gabor et al.,1999). The biodistribution of the particles mayalso depend on the particle size. A possible endo-cytosis of the particles, for example, is size depen-dent (Zimmer et al., 1991; Calvo et al., 1994).Interaction with the mucous membranes is alsopartly determined by particle size (Takeuchi et al.,2001). From the results presented above, it can beconcluded that particle size can be controlled byeither altering the concentration of PVA or theconcentration of the other stabilizer in the formu-lation. However, in order to establish the relation-ship between the combination of concentrationsof stabilizers and the particle size, more experi-mental points are needed, as will be discussed inSection 3.2.
3.1.2. Zeta potentialThe results of the zeta potential measurements
are presented in Table 3. Zeta potential values ofthe prepared PLGA particles vary between 0 and−50 mV. Most particles have slightly negativezeta potential values. Particles produced withpoloxamer and carbopol, however, have morepronounced negative zeta potential values. Theonly stabilizer yielding nanoparticles with a posi-tive zeta potential value is gelatin type A.
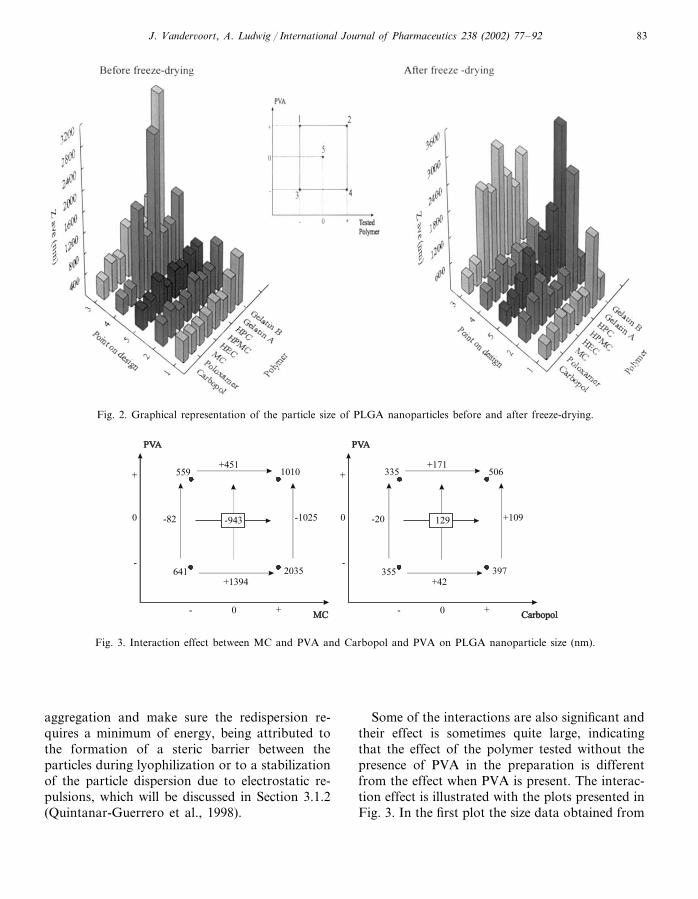
The size of the effects and interactions areshown in Table 4. The effect of the concentration
Table 3Zeta potential values (mV) of the various PLGA nanoparticle preparations
Before freeze-drying After freeze-drying
Point on design 31 2 5 1 2 3 4 54−−+ 0−Level of PVA −+ ++0
The effects and interactions that were statistically significant are printed bold (P=0.05).
of PVA seems to be not significant or negativefor most polymers, indicating that the zeta po-tential value will be more negative when PVA isadded to the formulation. However, the effect ofPVA is +23.9 mV before and +33.6 mV afterfreeze-drying in the case of poloxamer, and +32.0 mV before and +19.6 mV after lyophiliza-tion in the case of carbopol. This means thatfor these polymers the most negative zeta poten-tial values are measured when PVA is left outof the formulation. The effect of the concentra-tion of the polymers tested is less pronouncedthan that of PVA. In fact, before freeze-drying,the only polymer where the concentration wasfound to have a significant influence on the zetapotential value of the PLGA nanoparticles waspoloxamer. This can probably be explained bythe fact that the differences between the upperand lower levels of the polymers tested are lessextreme than those of PVA. Indeed, when onecompares the upper and lower level of PVA,one compares preparations with (1% w/v) andwithout (0% w/v) PVA. The polymers tested,however, are present in all preparations of thedesign, the only difference between their levelsbeing their concentration.
The zeta potential value is an important parti-cle characteristic as it can influence both particlestability as well as particle mucoadhesion. Intheory, more pronounced zeta potential values,being positive or negative, tend to stabilize par-ticle suspensions. The electrostatic repulsion be-tween particles with the same electrical charge
prevents the aggregation of the spheres (Fengand Huang, 2001). The stabilization of the par-ticle suspension during freeze-drying of thepreparations with poloxamer and carbopol,which was demonstrated in Section 2.5.1, canthus be explained by the fact that these prepara-tions also show the largest zeta potential values.Mucoadhesion, on the other hand, can be pro-moted by a positive zeta potential value. Themucus layer itself is at a neutral pH value ananionic polyelectrolyte (Bayens and Gurny,1997). Consequently, the presence of positivelycharged groups on the particles could lead toelectrical charge interactions between the mucusand the particles. In this study, the only posi-tively charged particles obtained were those pre-pared with gelatin type A as stabilizer.Unfortunately, the size of these particles wasquite large. But the particles prepared with car-bopol or poloxamer also offer interesting possi-bilities, as their anionic surfaces could be coatedwith cationic polymers, thus improving theirmucoadhesive properties (Takeuchi et al., 2001).
As was noted for the particle size, zeta poten-tial values can be controlled by either alteringthe concentration of PVA or the concentrationof the alternative stabilizer in the formulation.To establish the relationship between the combi-nation of concentrations of stabilizers and theparticles zeta potential value, the experimentaldesign was expanded to a central composite de-sign for the two most promising stabilizers.
J. Vander�oort, A. Ludwig / International Journal of Pharmaceutics 238 (2002) 77–9286
3.2. Central composite design
3.2.1. IntroductionThe 22 full factorial design was expanded to a
central composite design in the case of poloxamerand carbopol because both polymers induced apronounced zeta potential value, do not requirethe presence of PVA to form PLGA nanoparticlesand possess good cryoprotecting properties.
The following quadratic model was used to fitthe data:
Response=a+b×PVA+c×PVA2+d
×Polymer+e×Polymer2+ f×PVA
×Polymer (4)
The response (zeta potential value or particlesize) is described as the sum of a basic value (a)and four other terms of which the value dependson the concentration of PVA and the polymerinvestigated. The influence of the concentration ofPVA is split in a linear term (b) and a quadraticterm (c). Parameters d and e are the linear andquadratic terms for the tested polymer, while f isa measure for the interaction between PVA andthe polymer tested.
After preparing the particles and measuringtheir zeta potential values and particle sizes, thedata is fit into the model and parameters a to f arecalculated. This creates the possibility to predictthe zeta potential value and the particle size ofany combination of PVA and polymer concentra-tion within the experimental region. The modelscan also be used to optimize a certain response or
even particle size and zeta potential value at thesame time. One could, for example, calculate thecombination of PVA and polymer tested thatresults in the smallest particles, or the most nega-tive zeta potential value and in doing so changethe particle properties depending on the particlesize and zeta potential, required in relation to bio-or mucoadhesion, distribution and release raterequired for a certain drug or route ofadministration.
3.2.2. PoloxamerThe concentrations of poloxamer used for the
preparation of the nanoparticles were presented inTable 1. After performing zeta potential and sizemeasurements the data was fit to a quadraticmodel of which the parameters are summarized inTable 5. A graphical representation of the mea-sured points and the response surfaces is given inFig. 4 and Fig. 5.
The parameter values for the zeta potentialvalues indicate that the zeta potential rises whenPVA is added to the formulation. The effect ofthe concentration of poloxamer (parameter d) isalso positive, but to a much smaller extent. Con-sequently, the most negative zeta potential valuescan be obtained by leaving PVA out of the formu-lation and using low concentrations of poloxamer.The interaction term f is also quite small. Theseobservations are consistent with the observationsof the 22 full factorial design. The terms c and ewhich represent the curvature of the responsesurfaces reveal that most of the curvature is foundalong the axis of the concentration of PVA, ascan be seen in Fig. 4.
Table 5Parameters of fitted model in the case of poloxamer used as stabilizer in the preparation of PLGA nanoparticles
3.2.3. CarbopolThe concentrations of carbopol used for the
preparation of the PLGA nanoparticles were pre-sented in Table 1. The size of the parameters a tof is given in Table 6. A graphical representation ofthe measured points and the response surfaces isillustrated in Fig. 6 and Fig. 7.
As with poloxamer, the influence of the addi-tion of PVA on the zeta potential value of thePLGA nanoparticles is clear. Parameters c and ebecome smaller after freeze-drying of the prepara-tion, resulting is a less curved surface, as can beseen in Fig. 6. Some parameters have very highvalues, such as parameters d and e before freeze-
The response surfaces for the particle size showthe strong interaction effect between PVA andpoloxamer. In the plot of data measured beforefreeze-drying of the preparation one can see thatthe effect of PVA on the particle size is negative atlow levels of poloxamer (the curve is going down),while at higher poloxamer concentrations the par-ticle size of the nanoparticles increases when theconcentration of PVA increases. This gives theresponse surface a twisted view. Parameter f is ameasure for this interaction effect. Factors c and ehave quite small values, resulting in a small curva-ture of the surfaces.
J. Vander�oort, A. Ludwig / International Journal of Pharmaceutics 238 (2002) 77–9288
Fig
.5.
Res
pons
esu
rfac
esfo
rpa
rtic
lesi
zebe
fore
and
afte
rfr
eeze
-dry
ing
ofP
LG
Ana
nopa
rtic
les
prep
ared
wit
hpo
loxa
mer
and/
orP
VA
asst
abili
zers
.
J. Vander�oort, A. Ludwig / International Journal of Pharmaceutics 238 (2002) 77–92 89
Fig
.6.
Res
pons
esu
rfac
esfo
rze
tapo
tent
ial
befo
rean
daf
ter
free
ze-d
ryin
gof
PL
GA
nano
part
icle
spr
epar
edw
ith
carb
opol
and/
orP
VA
asst
abili
zers
.
J. Vander�oort, A. Ludwig / International Journal of Pharmaceutics 238 (2002) 77–9290
drying and e and f after freeze-drying. Theseparameters, however, do have opposite signs,thereby decreasing their influence on the zeta po-tential of the nanoparticles. Parameters d and e,for example determine the influence of the con-centration of carbopol on the zeta potential.When the concentration of carbopol in the prepa-ration increases, the zeta potential value shouldincrease dramatically according to factor d. Thenegative value of factor e, however, compensatesfor this effect. Consequently, although someparameters have very high values, the responsesurfaces do not look so different from the onesdrawn in Fig. 4.
The most striking effect observed in Fig. 7 isthe much more twisted look of the response sur-face after freeze-drying PLGA particles preparedusing PVA and carbopol. This is confirmed by themuch higher value of the parameter f after freeze-drying the preparation. This positive interactioneffect on the particle size was also discussed inSection 3.1.1. The smallest particles are obtainedat either high levels of carbopol and low levels ofPVA or at low levels of carbopol and high levelsof PVA. This can be explained by the fact that
both carbopol and PVA are good stabilizers forthe emulsion formed during the preparation of theparticles. A high concentration of carbopol orPVA alone is enough to stabilize the emulsionresulting in small nanoparticles. At the lowestlevel of both carbopol and PVA, the concentra-tion of stabilizer is below optimal, resulting in apoorer stabilization of the emulsion, and conse-quently in larger emulsion droplets and largerPLGA nanoparticles. At the highest concentra-tion of PVA and carbopol, however, there is morethan enough stabilizer present, but the viscosity ofthe stabilizer solution is higher. Consequently, ata constant energy input of the ultrasonic probe,when the w/o emulsion is added to the w2 waterphase, larger emulsion droplets are formed in thew/o/w emulsion. Although these droplets are thenstabilized by carbopol and PVA, larger particlesare obtained.
4. Conclusions
After testing various polymers as alternativesfor PVA as stabilizers in the production of PLGA
Fig. 7. Response surfaces for particle size before and after freeze-drying of PLGA nanoparticles prepared with carbopol and/or PVAas stabilizers.
J. Vander�oort, A. Ludwig / International Journal of Pharmaceutics 238 (2002) 77–92 91
nanoparticles using the w/o/w emulsification sol-vent evaporation technique the following conclu-sions can be drawn.
Nanoparticles were obtained with most poly-mers when they were used in combination withPVA. Leaving PVA out of the formulation inmost cases increases the size of the particles over1 �m. This indicates that most polymers tested arenot able to stabilize the emulsion as well as PVAdoes. Two exceptions are poloxamer and carbo-pol, which can be considered as valuable alterna-tives for PVA. A further study of these twopolymers using a central composite lead to thefitting of the responses to a quadratic model. Thiscreates the possibility of calculating a formulationfor PLGA nanoparticles with a desired particlesize and zeta potential value, depending on thebiopharmaceutical properties required.
References
Anderson, J.M., Shive, M.S., 1997. Biodegradation and bio-compatibility of PLA and PLGA microspheres. Adv.Drug Delivery Rev. 28, 5–24.
Arshady, R., 1991. Preparation of biodegradable micro-spheres and microcapsules: 2. Polylactides and relatedpolyesters. J. Controlled Release 17, 1–22.
Bayens, V., Gurny, R., 1997. Chemical and physical parame-ters of tears relevant for the design of ocular drug deliv-ery formulations. Pharm. Acta Helv. 72, 191–202.
Box, G., Hunter, W., Hunter, J., 1978. Statistics for Experi-menters: An Introduction to Design, Data Analysis andModel Building. Wiley, NewYork.
Calvo, P., Thomas, C., Alonso, M.J., Vila-Jato, J.L.,Robinson, J.R., 1994. Study of the mechanism of interac-tion of poly(�-caprolactone) nanocapsules with the corneaby confocal laser scanning microscopy. Int. J. Pharm.103, 283–291.
Coombes, A.G.A., Rafati, H., Adler, J., Holland, J., Davis,S.S., 1997. Protein-loaded poly(D,L-lactide-co-glycolide)microparticles for oral administration: formulation, struc-tural and release characteristics. J. Controlled Release 43,89–102.
Couvreur, P., Blanco-Prieto, M.J., Puisieux, F., Roques, B.,Fattal, E., 1997. Multiple emulsion technology for thedesign of microspheres containing peptides and oligopep-tides. Adv. Drug Delivery Rev. 28, 85–96.
S., 2001. Topical application of acyclovir-loaded mi-croparticles: quantification of the drug in porcine skinlayers. J. Control. Release 75, 191–197.
De Rosa, G., Iomelli, R., La Rotonda, M.I., Miro, A.,Quaglia, F., 2000. Influence of the co-encapsulation ofdifferent non-ionic surfactants on the properties of PLGAinsulin-loaded microspheres. J. Control. Release 69, 283–295.
Feng, S., Huang, G., 2001. Effects of emulsifiers on thecontrolled release of paclitaxel (Taxol) from nanospheresof biodegradable polymers. J. Control. Release 71, 53–69.
Gabor, F., Ertl, B., Wirth, M., Mallinger, R., 1999. Ketopro-fen-poly(D,L-lactic-co-glycolic acid) microspheres: influ-ence of manufacturing parameters and type of polymeron the release characteristics. J. Microencaps. 16 (1), 1–12.
Kompella, U.B., Koushik, K., 2001. Preparation of drugdelivery systems using supercritical fluid technology. Crit.Rev. Ther. Drug. Carrier. Syst. 18, 2173–2199.
Moritera, T., Ogura, Y., Yoshimura, N., Honda, Y., Wada,R., Hyon, S., Ikada, Y., 1992. Biodegradable micro-spheres containing adriamicyn in the treatment of prolif-erative vitreoretinopathy. Invest. Ophthalmol. Vis. Sci. 33(11), 3125–3130.
Moritera, T., Ogura, Y., Honda, Y., Wada, R., Hyon, S.,Ikada, Y., 1991. Microspheres of biodegradable polymersas a drug-delivery system in the vitreous. Invest. Ophthal-mol. Vis. Sci. 32 (6), 1785–1790.
O’Donnell, P.B., McGinity, J.W., 1997. Preparation of micro-spheres by the solvent evaporation technique. Adv. DrugDelivery Rev. 28, 25–42.
O’Hara, P., Hickney, A.J., 2000. Respirable PLGA micro-spheres containing rifampicin for the treatment of tuber-culosis: Manufacture and characterization. Pharm. Res.17 (8), 955–961.
Quintanar-Guerrero, D., Ganem-Quintanar, A., Alleman, E.,Fessi, H., Doelker, E., 1998. Influence of the stabilizercoating layer on the purification and freeze-drying ofpoly(D,L-lactic acid) nanoparticles prepared by an emul-sion diffusion technique. J. Microencaps. 15 (1), 107–109.
Sansdrap, P., Moes, A.J., 1993. Influence of manufacturingparameters on the size characteristics and release profilesof nifedipine from poly(D,L-lactide-co-glycolide) micro-spheres. Int. J. Pharm. 98, 157–164.
Scholes, P.D., Coombes, A.G.A., Illum, L., Davis, S.S.,Watts, J.F., Ustariz, C., Vert, M., Davis, M.C., 1999.Detection and determination of surface levels of polox-amer and PVA surfactant on biodegradable nanospheresusing SSIMS and XPS. Int. J. Pharm. 59, 261–278.
Takeuchi, H., Yamamoto, H., Kawashima, Y., 2001. Mu-coadhesive nanoparticulate systems for peptide drug deliv-ery. Adv. Drug Delivery Rev. 47, 39–45.
Tobio, M., Gref, R., Sanchez, A., Langer, R., Alonso, M.J.,1998. Stealth PLA-PEG nanoparticles as protein carriersfor nasal administration. Pharm. Res. 15 (2), 270–275.
J. Vander�oort, A. Ludwig / International Journal of Pharmaceutics 238 (2002) 77–9292
Vandervoort, J., Ludwig, A., 2000. Preparation factors affect-ing the properties of polylactide nanoparticles: a factorialdesign study. Pharmazie 56, 484–488.
Veloso, A., Zhu, Q., Herrero-Vanrell, R., Refojo, M., 1997.Ganciclovir loaded polymer microspheres in rabbit eyesinoculated with human cytomegalovirus. Invest. Ophthal-mol. Vis. Sci. 38 (3), 665–675.
Wang, H.T., Schmitt, E., Flanagan, D.R., Linhardt, R.J.,1991. Influence of formulation methods on the in vitro
controlled release of protein from poly(ester) microspheres.J. Controlled Release 17, 23–32.
Zhang, X., Wiss, U.P., Pichora, D., Goossen, M.F., 1994. Amechanistic study of antibiotic release from biodegradablepoly(D,L-lactide) cylinders. J. Controlled Release 31, 128–144.
Zimmer, A., Kreuter, J., Robinson, J., 1991. Studies on thetransport pathway of PBCA nanoparticles in ocular tis-sues. J. Microencaps. 8 (4), 497–504.