Biodegradation, Hydrolysis and Photolysis Testing of Nitrosamines in Aquatic Systems Prepared by CSIRO Advanced Coal Technology Portfolio for the CO 2 Technology Centre Mongstad, TCM Project Team Mike Williams Jun Du Rai Kookana Merched Azzi September, 2011 Biodegradation, hydrolysis and photolysis of nitrosamines in fresh water
Transcript
Biodegradation, Hydrolysis and Photolysis
Testing of Nitrosamines in Aquatic Systems
Prepared by
CSIRO Advanced Coal Technology Portfolio
for the
CO2 Technology Centre Mongstad, TCM
Project Team
Mike Williams
Jun Du
Rai Kookana
Merched Azzi
September, 2011
Biodegradation, hydrolysis and photolysis of nitrosamines in fresh water
Enquiries should be addressed to: Dr Merched Azzi CSIRO Energy Technology Riverside Life Sciences Centre 11 Julius Avenue, North Ryde, NSW, 2113
Distribution list Berit F. Fostas Technology Centre Mongstad TCM
Important Disclaimer CSIRO advises that the information contained in this publication comprises general statements based on scientific research. The reader is advised and needs to be aware that such information may be incomplete or unable to be used in any specific situation. No reliance or actions must therefore be made on that information without seeking prior expert professional, scientific and technical advice. To the extent permitted by law, CSIRO (including its employees and consultants) excludes all liability to any person for any consequences, including but not limited to all losses, damages, costs, expenses and any other compensation, arising directly or indirectly from using this publication (in part or in whole) and any information or material contained in it.
Biodegradation, hydrolysis and photolysis of nitrosamines in fresh water
Page i
Biodegradation, hydrolysis and photolysis of nitrosamines in fresh water
CSIRO was invited by the Technology Centre Mongstad (TCM), Norway to study the biodegradation, hydrolysis and photolysis of nitrosamines in fresh water, under the Technology Centre Mongstad Research Program.
The CO2 Technology Center Mongstad (TCM) is developing technologies for CO2 capture for extensive national and international use. Their aim is to reduce the cost and technical, environmental and financial risks for large scale CO2 capture, to test, verify and demonstrate technology for CO2 capture owned and marketed by suppliers, and to promote development of technology and suppliers.
One concern with the CO2 capture project is for potential exposure risks associated with the amine compounds used and their degradation products. Based on preliminary studies, a further investigation was recommended of certain critical elements such as the lifetime or persistence of nitrosamines in fresh water. Important parameters included:
These processes are crucial for the persistence of nitrosamines in the environment and for the potential exposure period to man through direct and indirect uptake.
The objectives of this study were to:
1. Perform biodegradation testing of nitrosamines to determine the degree of biodegradability of these compounds in aquatic systems;
2. Carry out testing of hydrolysis (abiotic degradation) of nitrosamines in fresh water; and
3. Measure photolysis rates of nitrosamines in fresh water (day and night).
2. BRIEF BACKGROUND OF THE STUDY
New regulations and regulatory methods have been introduced to control and measure selected nitrosamines with low detection limits in water (www.epa.gov/nerlcwww/m_521.pdf). Non-volatile nitrosamines that may be produced in an amine-based CO2 post-combustion capture plant, can reach water bodies through atmospheric deposition or through direct releases to selected water streams. Nitrosamines are known to be carcinogenic compounds, and selected N-nitroso compounds such as N-nitrosodimethylamine (NDMA), hav been detected in water streams (see review by Richardson et al. 2007). Furthermore, the N-nitrosamine class of compounds are well-known environmental toxins that can be metabolized into potent genotoxic agents (Richardson et al. 2007). These contaminants could result in human exposure more widespread if its concentration were to exceed water guidelines.
Currently, UV irradiation is the most commonly used treatment method to remove nitrosamines from waters. Information relating to kinetics, quantum yields and photolysis products of major nitrosamines under environmental conditions have not been reported. In
Biodegradation, hydrolysis and photolysis of nitrosamines in fresh water
this study, the rates of direct photolysis reactions and quantum yields for selected nitrosamines have been determined under conditions that simulate natural sunlight
Both biotic (biodegradability) and abiotic (photolysis and hydrolysis) pathways of dissipation of the following ten nitrosamine compounds have been investigated:
1. Dinitrosopiperazine (DNPZ)
2. Nitrosodiethylamine (NDEA)
3. Nitrosodiethanolamine (NDELA)
4. Nitrosodimethylamine (NDMA)
5. Nitrosopropylamine (NDPA)
6. Nitrosomethylethylamine (NMEA)
7. Nitrosomorpholine (NMOR)
8. Nitrosopiperidine (NPIP)
9. Nitrosopyrrolidine (NPYR)
10. Nitrosopiperazine (NPZ)
The experimental conditions associated with the assessment of these pathways and the key findings are described below. In all experiments, the nitrosamines were prepared as mixtures, with respective initial concentrations of 100 ng/L or 10 g/L.
3. PHOTOLYSIS
3.1. Experimental
The stability of the 10 nitrosamines to exposure to solar radiation was assessed using a Suntest Solar Simulator (Atlas Material Testing Technology, USA). The exposure intensity was set to 520 W/m2, which is equivalent to the maximal mid-summer solar irradiance at 60 latitude, to represent conditions in Mongstad, Norway (NASA Atmospheric Science Data Centre), i.e. the conditions represented a scenario where potential photolysis rates of the nitrosamines were maximal.
A 10 mg/L working stock solution mixture of the 10 nitrosamines was prepared from respective 1 g/L stock solutions (in 100% methanol) of the respective nitrosamines by adding 100 L to a 10 mL volumetric flask and making up to volume with high purity water (resistivity=18.2 M/cm). A 1 mL aliquot of 3.5 mg/L and 35 g/L filter-sterilised spiking solutions were added to 350 mL of high purity water to give final concentrations of 10 g/L and 100 ng/L, respectively. This gave a maximum methanol concentration in solution of 0.01%. Samples were collected at time intervals of 1, 2, 3, 5, 10, 15, 20, 30, 40 and 60 minutes. Solutions were maintained at 23.8±1.7C. A preliminary range finding experiment was undertaken with an initial concentration of 10 g/L of nitrosamine mixture, with sample collection at 10, 20, 40 and 90 minutes. Control samples, wrapped in aluminium foil to exclude light, were also included to ensure no other concurrent degradation was occurring.
Sample preparation consisted of aliquots being removed for chemical analysis, stable isotopes (Appendix A) were spiked into the solutions to account for recovery efficiency and the solutions were passed through coconut char solid-phase extraction (SPE) cartridges and
Biodegradation, hydrolysis and photolysis of nitrosamines in fresh water
Page 5
pre-concentrated in dichloromethane and toluene prior to gas chromatography combined with tandem mass spectrometry (GC-MS/MS) analysis. (Appendix A)
Based on previous studies (Plumlee and Reinhard 2007), it is apparent that nitrosamines are labile to photolysis and, therefore, a preliminary assessment to estimate maximum degradation rates was not undertaken (OECD 2008).
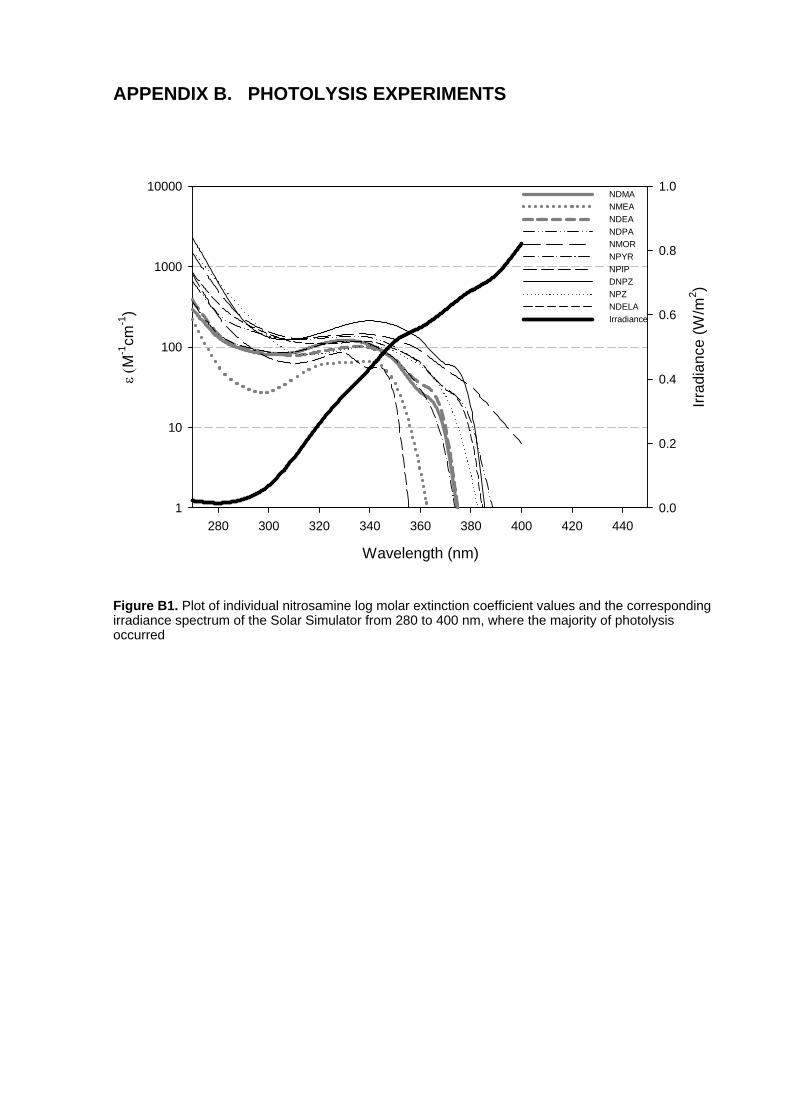
Quantum yields for the nitrosamines were determined by measuring their respective absorbance values between 290 and 800 nm, in conjunction with their experimental rate constants. The irradiance spectrum of the Solar Simulator was also measured using a spectroradiometer (StellarNet Inc., USA). The quantum yield was determined in the wavelength region where there was overlap between the absorbance and the irradiance spectrum of the Solar Simulator (Appendix B). At each wavelength of irradiance (W; mEicm2s-1), the rate of light absorption (ka; s
-1) was determined using the molar extinction coefficient (; M-1) from the following relationship (Schwarzenbach et al. 2003):
(1)
The quantum yield () for each nitrosamine was then determined from ka and the photolysis rate constant (kp; s
-1):
(2)
3.2. Results
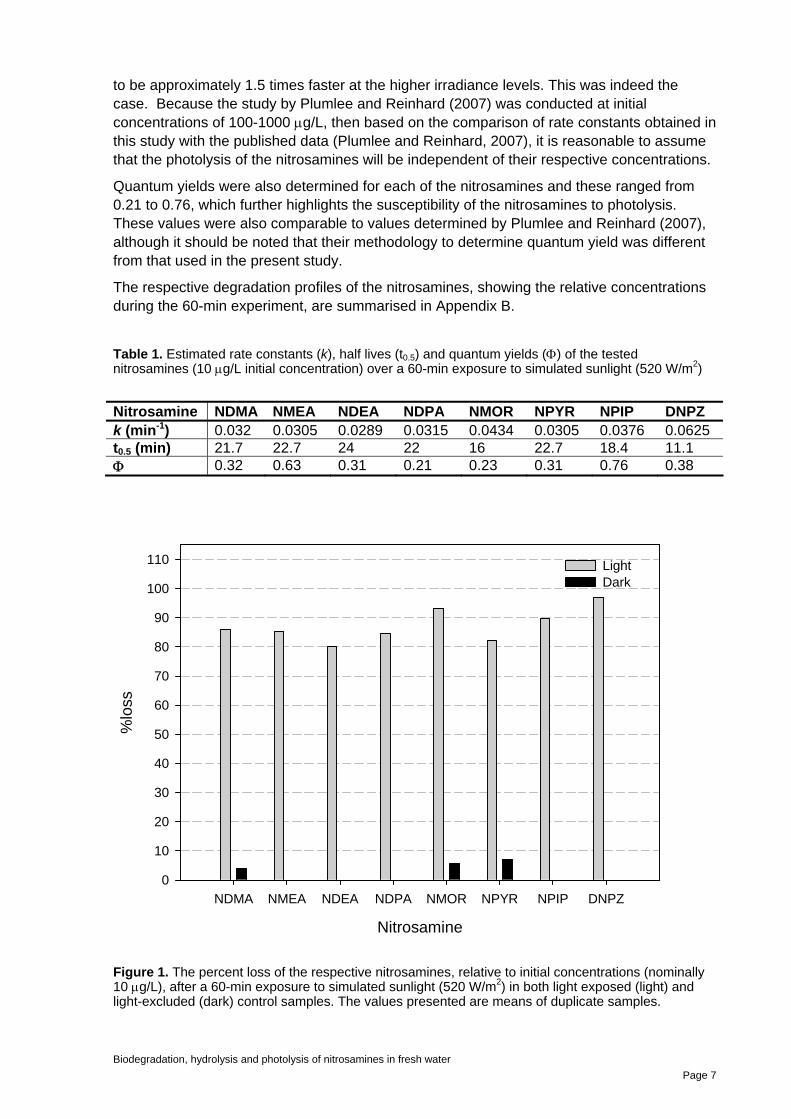
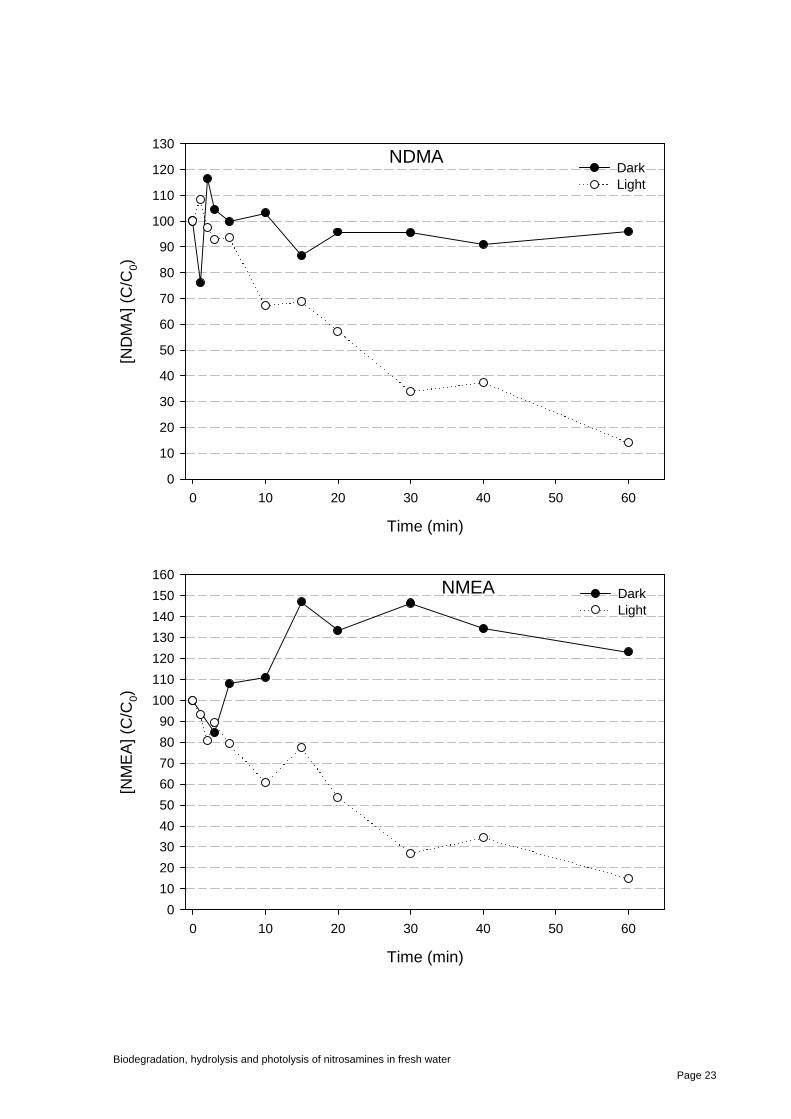
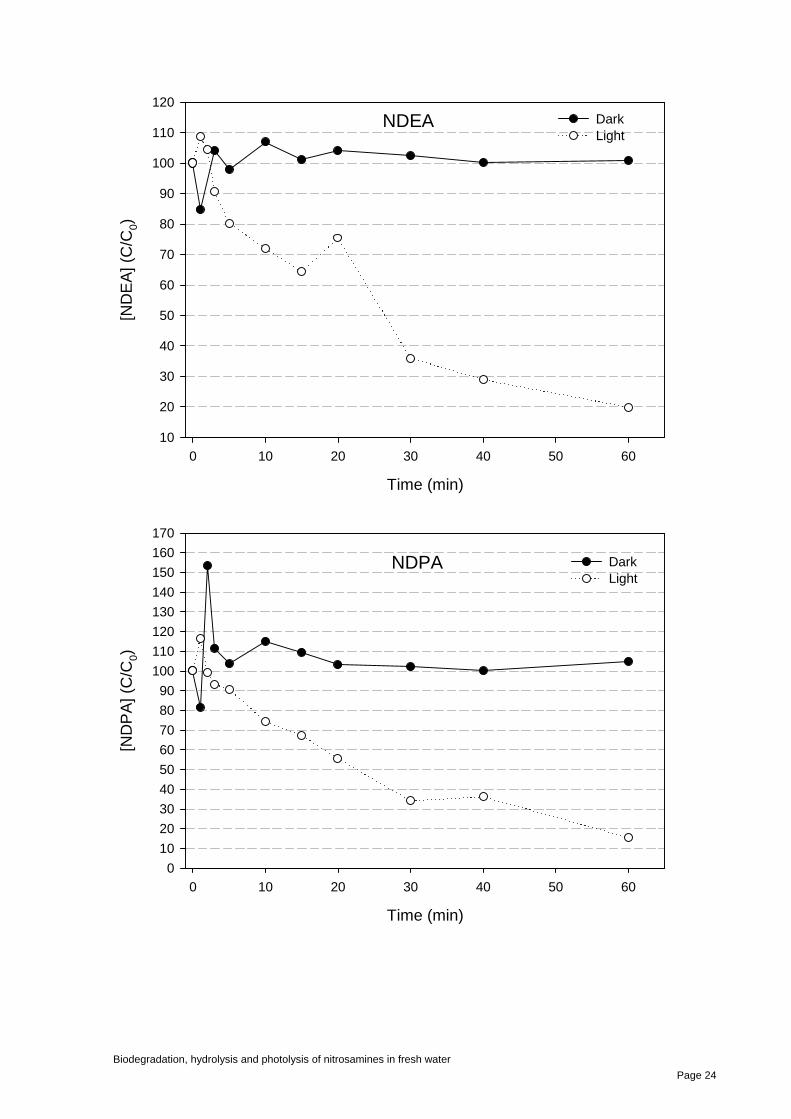
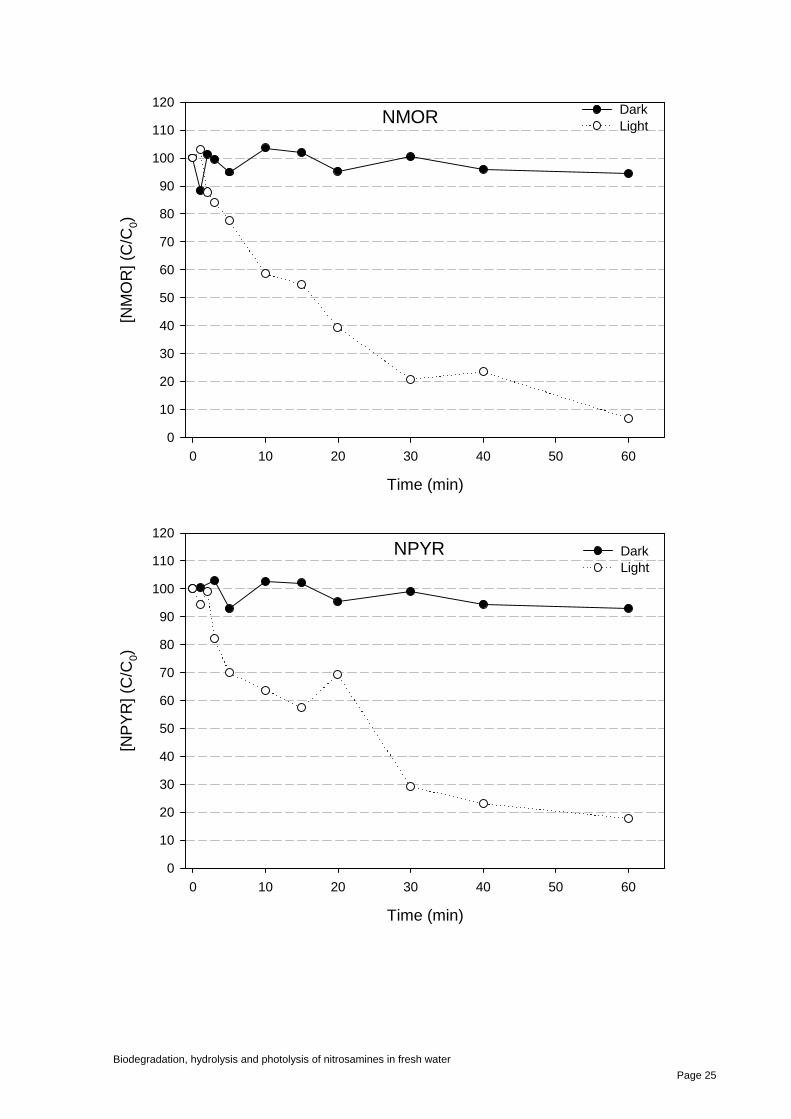
The tested nitrosamines showed a high degree of instability following exposure to simulated sunlight (Figure 1). From a preliminary range-finding experiment using the 10 g/L mixture, the estimated half lives of the nitrosamines were found to be no more than 22 min. Based on this preliminary experiment, a 10 g/L mixture of the nitrosamines was then exposed to light in a solar simulator for 60 min. A concurrent experiment was also conducted at initial concentrations of 100 ng/L but the data obtained were not considered reliable enough for quantification due to the significant variability in recovery obtained, especially as degradation was proceeding during the exposure.
DNPZ had the highest rate of photolytic degradation, with an estimated half life of 11.1 min (k=0.0625) (Table 1) based on a first-order rate of degradation, which was approximately half that for the other nitrosamines. The rate constants (k values) that were determined for the remaining seven nitrosamines ranged from 0.0434 (t0.5=16 min) for NMOR to 0.0289 (t0.5=24 min) for NDEA. In general, no loss of the nitrosamines was observed in the dark treatments or, where degradation was noted, the extent was relatively minimal (Figure 1).
As photolysis is expected to be a first-order process (i.e. no dependence on concentration) in dilute solutions (<10-4 M) (OECD 2008), similar results would also be expected at a lower concentration, such as 100 ng/L. A study by Plumlee and Reinhard (2007) assessed the photolysis rates of NDMA, NMEA, NDEA, NDPA, NPYR and NPIP and determined rate constants for degradation at 765 W/m2. Based on the relative difference between 765 W/m2 and the irradiance levels in this study (520 W/m2), the rate constants would also be expected
Biodegradation, hydrolysis and photolysis of nitrosamines in fresh water
Page 6
to be approximately 1.5 times faster at the higher irradiance levels. This was indeed the case. Because the study by Plumlee and Reinhard (2007) was conducted at initial concentrations of 100-1000 g/L, then based on the comparison of rate constants obtained in this study with the published data (Plumlee and Reinhard, 2007), it is reasonable to assume that the photolysis of the nitrosamines will be independent of their respective concentrations.
Quantum yields were also determined for each of the nitrosamines and these ranged from 0.21 to 0.76, which further highlights the susceptibility of the nitrosamines to photolysis. These values were also comparable to values determined by Plumlee and Reinhard (2007), although it should be noted that their methodology to determine quantum yield was different from that used in the present study.
The respective degradation profiles of the nitrosamines, showing the relative concentrations during the 60-min experiment, are summarised in Appendix B.
Table 1. Estimated rate constants (k), half lives (t0.5) and quantum yields () of the tested nitrosamines (10 g/L initial concentration) over a 60-min exposure to simulated sunlight (520 W/m2)
Figure 1. The percent loss of the respective nitrosamines, relative to initial concentrations (nominally 10 g/L), after a 60-min exposure to simulated sunlight (520 W/m2) in both light exposed (light) and light-excluded (dark) control samples. The values presented are means of duplicate samples.
Biodegradation, hydrolysis and photolysis of nitrosamines in fresh water
Page 7
3.3. Photolysis Summary
The tested nitrosamine mixture was highly susceptible to photolysis during a 60-min exposure to simulated sunlight at an initial mixture concentration of 10 g/L.
The calculated half-lives of the individual nitrosamines in the mixture ranged from 11 and 24 minutes.
The estimated quantum yields ranged from 0.21 to 0.76.
The results were comparable to those found in literature conducted at different initial concentrations, suggesting that photolysis rates of nitrosamines in water are independent of their initial concentrations.
4. HYDROLYSIS
4.1. Experimental
The stability of the 10 nitrosamines at pH 4, 7 and 9 was investigated at two different concentrations (100 ng/L and 10 g/L). A preliminary screen of hydrolytic stability was undertaken at 50C for five days to assess whether degradation was likely to occur within 1 year at 25C (OECD 2004). Three replicates were used for each pH value for initial (t=0 h) and final (t=120 h) sampling periods for this preliminary assessment. The difference in concentrations between the t=0 h and t=120 h replicates were then used to assess the stability of the 10 nitrosamines and whether further assessment was required.
Potassium biphthalate (pH 4), monopotassium phosphate (pH 7) and boric acid (pH 9) buffers were used to respectively attain desired solution pH values (OECD 2004). A volume of 500 mL of the respective buffer solutions was added to 1 L amber glass bottles which were sealed with lids. Solutions were purged with N2 for five minutes and then sterilised by autoclaving at 121C and 100 kPa for 30 min. Bottles were pre-equilibrated in incubators at 50C before spiking.
A 1 mL aliquot of 5 mg/L and 50 g/L (prepared from 1g/L respective nitrosamine stock solutions in methanol) filter-sterilised spiking solutions were added to separate 500 mL buffer solutions to give final concentrations of 10 g/L and 100 ng/L, respectively. This gave a maximum methanol concentration in solution of 0.01%. Initial samples (t=0 d) were immediately prepared for extraction and analysis. Experimental solutions for the five-day exposure (t=5) were maintained in the dark under static conditions.
Sample preparation consisted of aliquots being removed for chemical analysis. Stable isotopes were spiked into the solutions to account for recovery efficiency and the solutions were passed through coconut char solid-phase extraction (SPE) cartridges and pre-concentrated in dichloromethane and toluene prior to GC-MS/MS analysis.
4.2. Results
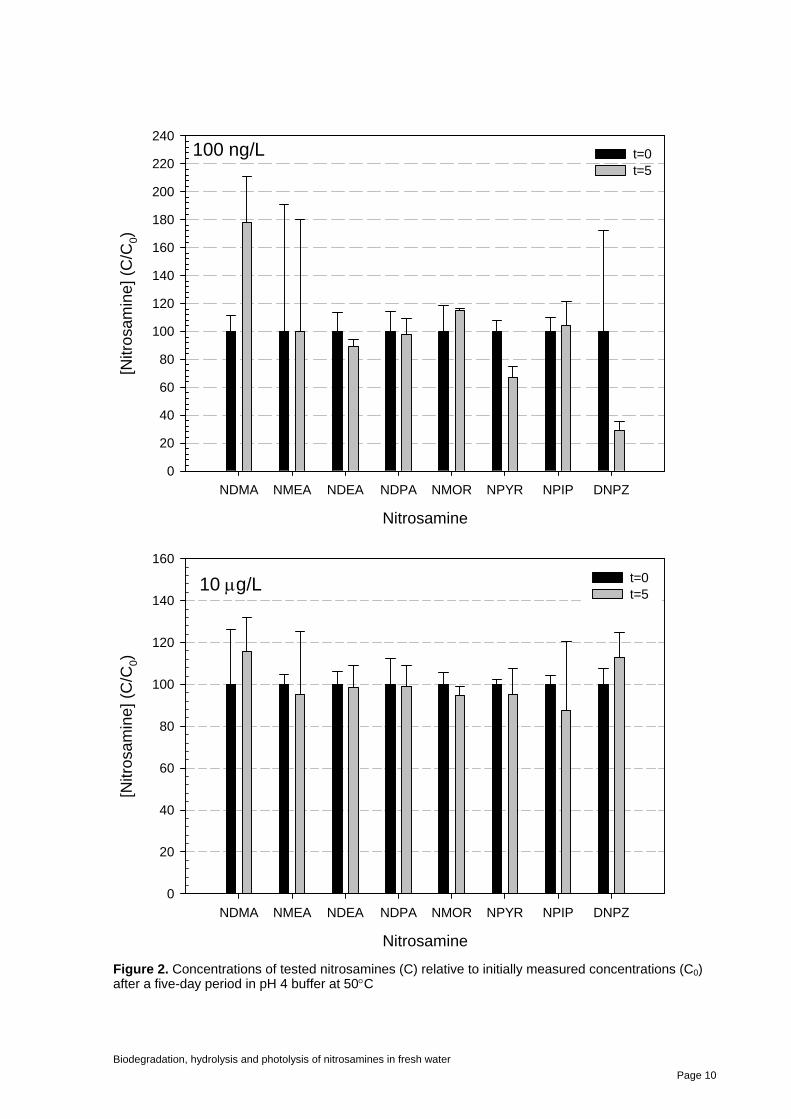
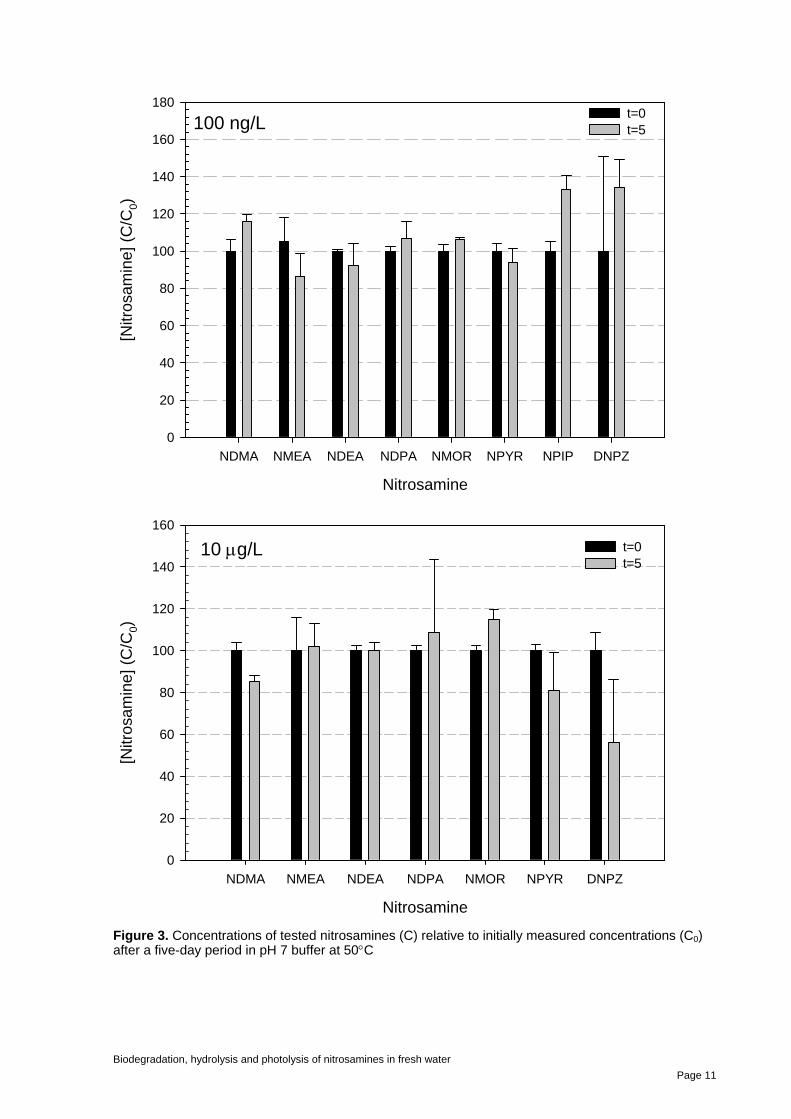
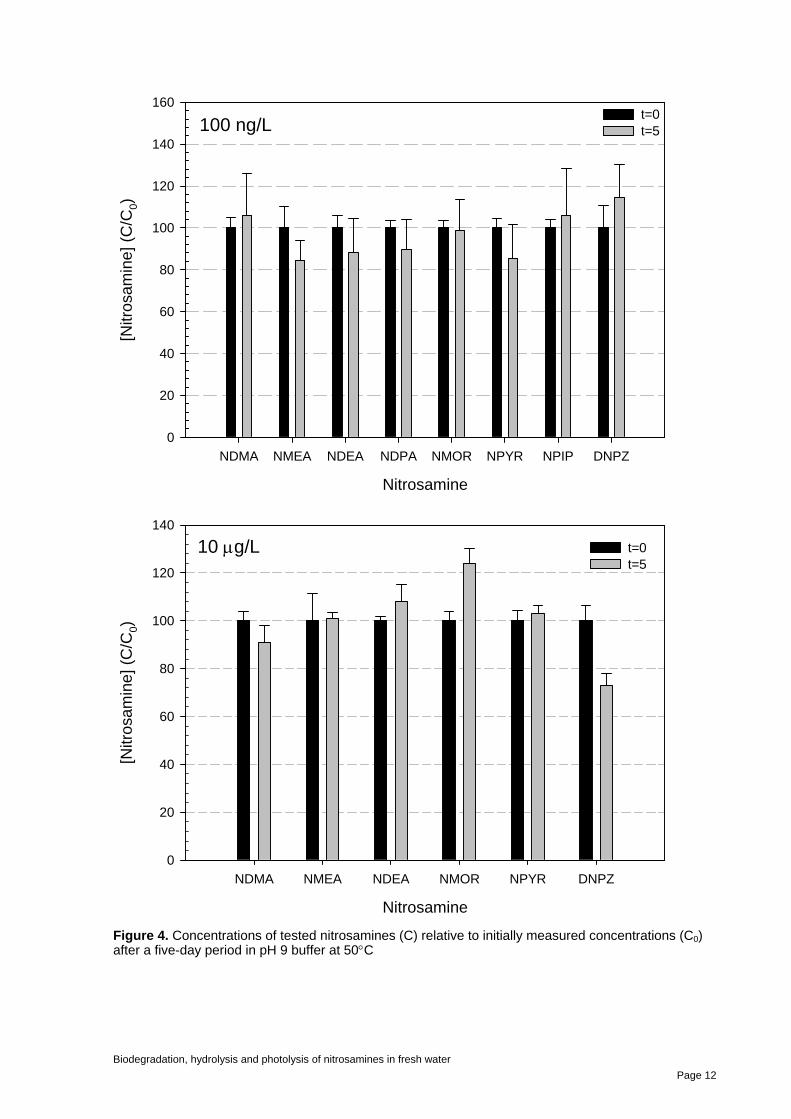
In general, the tested nitrosamines were found to be stable to hydrolysis during the five day exposure at 50C at all pH values at concentrations of 100 ng/L and 10 g/L (Figures 3-5), i.e. the loss of the nitrosamines during the test period was not statistically significant (especially at pH 7 and 9) and was generally less than 10%. Only eight of the ten
Biodegradation, hydrolysis and photolysis of nitrosamines in fresh water
Page 8
nitrosamines were quantifiable, with NDELA and NPZ not able to be reliably quantified for assessment at all pH values.
A high variability in a number of samples was noted, particularly in the pH 4 samples (100 ng/L) and pH 9 (10 g/L). For example, NMEA and DNPZ in the 100 ng/L (pH 4) treatment had high variability in the initial samples (t=0). Therefore, while the relative mean concentration of DNPZ after five days (t=5) was considerably lower than its initial concentration (t=0), the high variability in the t=0 triplicate samples meant there was no significant difference between the treatments. Final concentrations of NMEA and NDMA (pH 4, 100 ng/L) exhibited high variability, consequently an assessment of their stability at this pH value was not possible. This was also the case for NPIP and DNPZ at pH 7 (100 ng/L). The concentration of NPYR was found to be less than 90% (67±8%) of its initial concentration at pH 4 (100 ng/L), suggesting some degree of instability to hydrolysis at this pH could be evident over a one-year period at ambient environmental temperatures (OECD 2004). However, this was not the case for NPYR at 10 g/L (pH 4), where no degradation was noted after five days. Conversely, the loss of NDMA at pH 7 for the 10 g/L treatment was found to be marginally greater than 10%, while no loss was evident in the 100 ng/L treatment (Figure 4).
NPIP was not able to be assessed at pH 7 and pH 9 for the 10 g/L treatment, since the t=5 samples could not be quantified. For this reason it was also not possible to assess the stability of NDPA at pH 9 for the 10 g/L treatment (Figures 4 and 5). The high variability between replicates which made it difficult to quantify the nitrosamines, was likely to be due to the differences in the extraction efficiencies of the nitrosamines from water. Where stable isotopes were available, the variability was apparent based on the recovery of the stable isotope, while the uncertainty was higher for NMEA, NPIP and DNPZ, where a stable isotope was not available.
4.3. Hydrolysis Summary
The tested nitrosamines were, in general, stable to hydrolysis after five days at 50C in buffers of pH 4, 7 and 9, respectively.
At this elevated temperature it is considered to be equivalent to hydrolytic stability over a one year period at 25C
The high variability in measured concentrations of the nitrosamines suggests that further refinement of the analytical methodology is required, although this is not likely to alter the conclusion that the nitrosamines are stable to hydrolysis over a wide range of pH values
Biodegradation, hydrolysis and photolysis of nitrosamines in fresh water
Page 9
100 ng/L
Nitrosamine
NDMA NMEA NDEA NDPA NMOR NPYR NPIP DNPZ
[Nitr
osa
min
e]
(C/C
0)
0
20
40
60
80
100
120
140
160
180
200
220
240t=0 t=5
10 g/L
Nitrosamine
NDMA NMEA NDEA NDPA NMOR NPYR NPIP DNPZ
[Nitr
osa
min
e]
(C/C
0)
0
20
40
60
80
100
120
140
160
t=0 t=5
Figure 2. Concentrations of tested nitrosamines (C) relative to initially measured concentrations (C0) after a five-day period in pH 4 buffer at 50C
Biodegradation, hydrolysis and photolysis of nitrosamines in fresh water
Page 10
100 ng/L
Nitrosamine
NDMA NMEA NDEA NDPA NMOR NPYR NPIP DNPZ
[Nitr
osa
min
e]
(C/C
0)
0
20
40
60
80
100
120
140
160
180t=0 t=5
10 g/L
Nitrosamine
NDMA NMEA NDEA NDPA NMOR NPYR DNPZ
[Nitr
osa
min
e]
(C/C
0)
0
20
40
60
80
100
120
140
160
t=0 t=5
Figure 3. Concentrations of tested nitrosamines (C) relative to initially measured concentrations (C0) after a five-day period in pH 7 buffer at 50C
Biodegradation, hydrolysis and photolysis of nitrosamines in fresh water
Page 11
100 ng/L
Nitrosamine
NDMA NMEA NDEA NDPA NMOR NPYR NPIP DNPZ
[Nitr
osa
min
e]
(C/C
0)
0
20
40
60
80
100
120
140
160t=0 t=5
10 g/L
Nitrosamine
NDMA NMEA NDEA NMOR NPYR DNPZ
[Nitr
osa
min
e]
(C/C
0)
0
20
40
60
80
100
120
140
t=0 t=5
Figure 4. Concentrations of tested nitrosamines (C) relative to initially measured concentrations (C0) after a five-day period in pH 9 buffer at 50C
Biodegradation, hydrolysis and photolysis of nitrosamines in fresh water
Page 12
5. BIODEGRADATION
5.1. Experimental
The stability of the 10 nitrosamines to biodegradation was investigated using inoculum obtained from an activated wastewater treatment plant added with the nitrosamine mixture to 0.5 L microcosms of freshwater and incubated over a period of 28 days. The microcosm water was a standardised synthetic fresh water based on the OECD ready biodegradability protocol (OECD 1992) containing nutrients to sustain a microbial population.
The 500 mL microcosms were contained within amber glass bottles to ensure no photolytic degradation occurred. Sterilised controls (autoclaved at 121C and 100 kPa for 30 min) were also used to account for potential degradation through hydrolysis. The aerated inoculum was added to mineral media solutions five days before spiking with nitrosamines to ensure stabilisation of the added microbes. Aliquots (1 mL) of filter-sterilised mixture spiking solutions (5 mg/L and 50 g/L, respectively) were added to 500 mL of mineral media solutions to give final concentrations of 10 g/L and 100 ng/L. Solutions were continually shaken on a horizontally rotating shaker (100 rpm) to maintain a suspension of microbes and aerobic conditions during the exposure period. Microcosms were maintained at 22±0.8C.
Positive controls containing aniline, a compound highly susceptible to microbial degradation, were also used in conjunction with the microcosms to ensure biodegradation was occurring due to the added inoculum.
5.2. Results
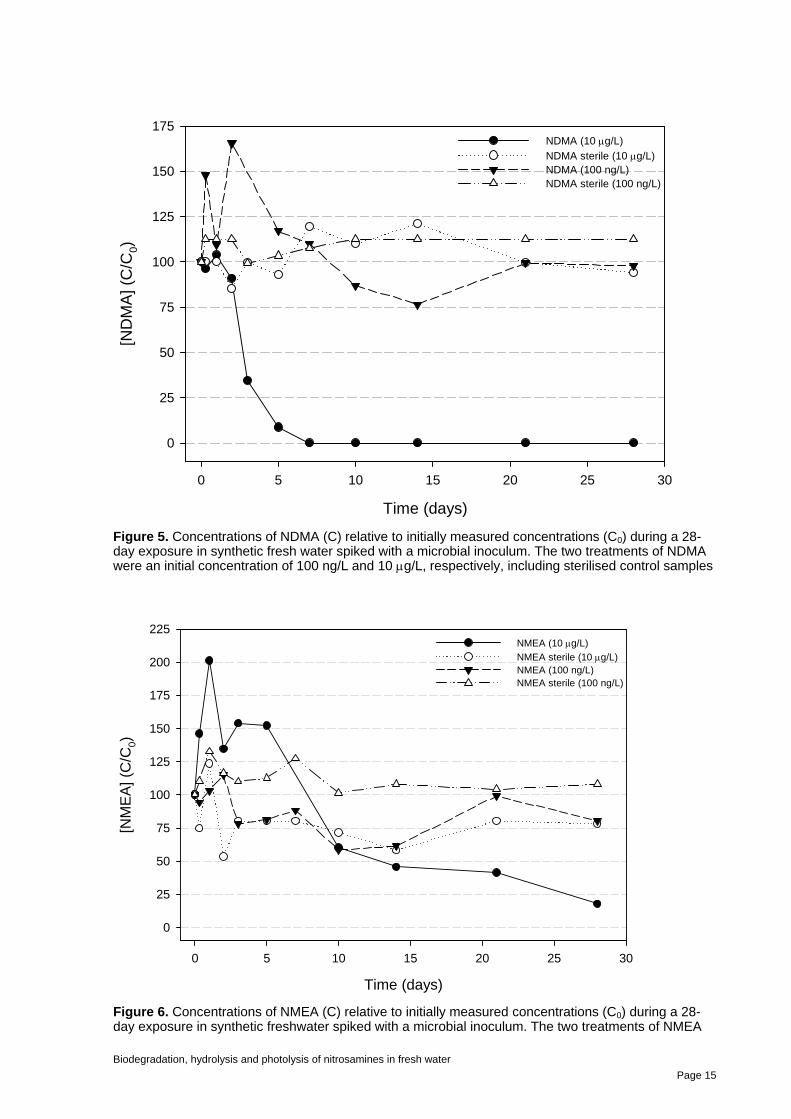
The tested nitrosamines were generally stable during the 28-day biodegradation study at both concentrations (100 ng/L and 10 g/L). However, there was a rapid loss of NDMA in the 10 g/L treatment with a calculated half-life of 1.1 days (k=0.65 d-1) (Figure 6). Degradation was also likely to have occurred in the 10 g/L treatment for NMEA, although there was a high degree of variability noted in the sterile controls at this concentration (Figure 7). Despite this variability, a half-life of 9.2 days (k=0.075 d-1) was calculated for NMEA. Biodegradation in the 100 ng/L treatment was less than 25% after the 28-day exposure. In the case of NDMA and NMEA, it is therefore likely that the degradation noted within this system was concentration-dependent since relatively little to no loss was observed in the respective 100 ng/L treatments.
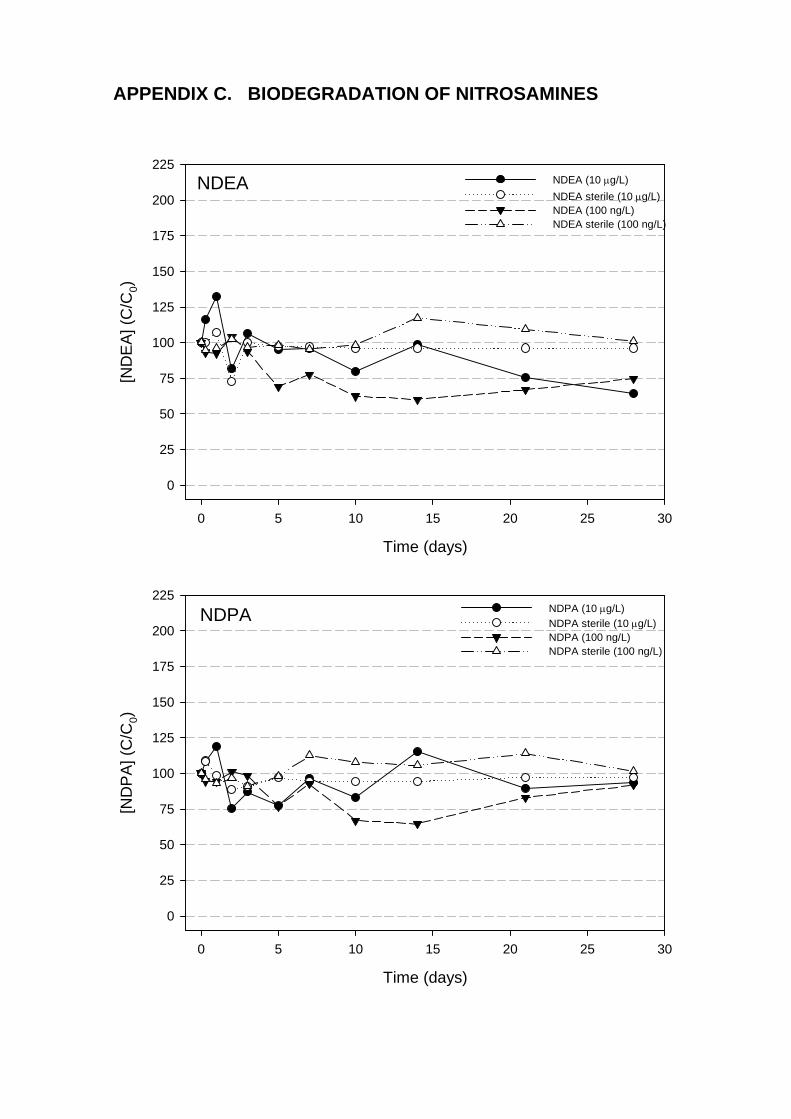
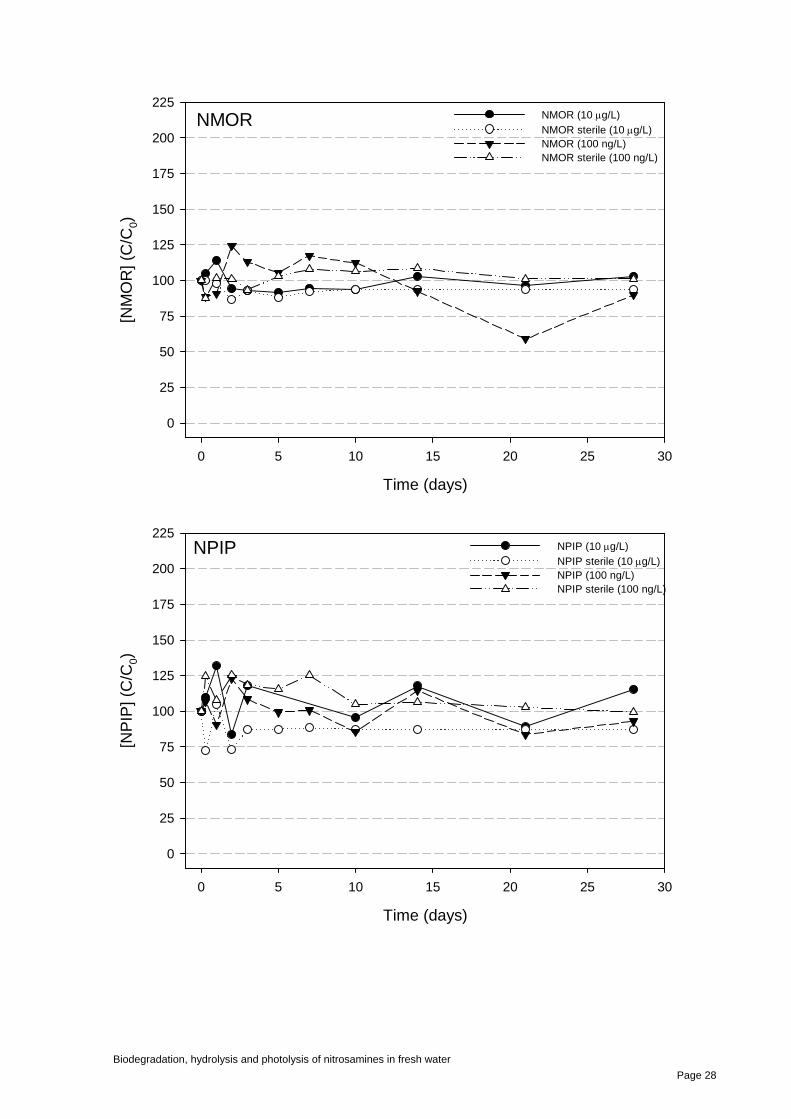
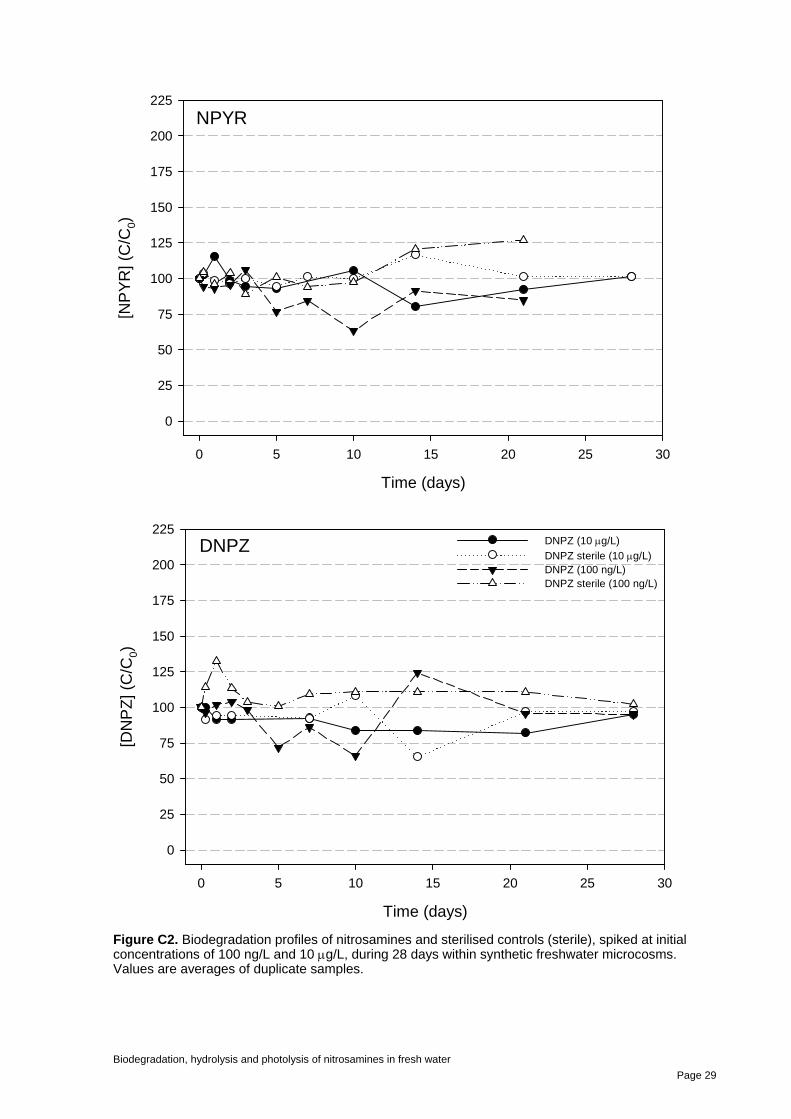
A similar amount of biodegradation was noted for both the 100 ng/L and 10 g/L treatments for NDEA, although this degradation was only approximately 25% (Appendix C). An extended timeframe would therefore be necessary to determine whether any divergence may exist between the treatments when the time for 50% degradation was reached. The biodegradation profiles of the remaining nitrosamines is summarised in Appendix C. Only eight of the ten nitrosamines were quantifiable, with NDELA and NPZ unable to be quantified for assessment at both concentrations.
There was a high degree of variability associated particularly with the unsterilised samples, where a microbial growth was visible within a few days of inoculating the mineral media. It is therefore desirable to repeat these experiments over a longer period to ensure half-lives can be reconfirmed, where estimated, or can be calculated, where degradation may have commenced but was not sufficient to calculate half-lives. However, the selected period should also consider the potential consequences of changes in the water quality and degrading microbial community as the exposure period increases.
Biodegradation, hydrolysis and photolysis of nitrosamines in fresh water
Page 13
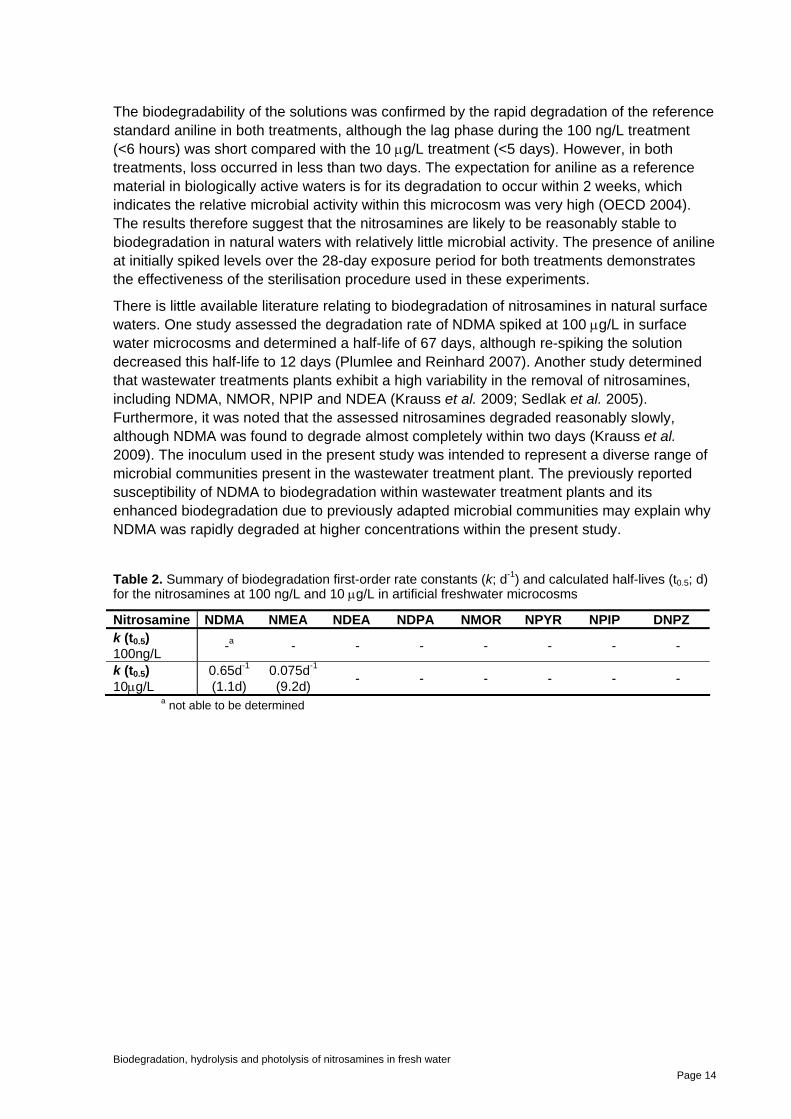
The biodegradability of the solutions was confirmed by the rapid degradation of the reference standard aniline in both treatments, although the lag phase during the 100 ng/L treatment (<6 hours) was short compared with the 10 g/L treatment (<5 days). However, in both treatments, loss occurred in less than two days. The expectation for aniline as a reference material in biologically active waters is for its degradation to occur within 2 weeks, which indicates the relative microbial activity within this microcosm was very high (OECD 2004). The results therefore suggest that the nitrosamines are likely to be reasonably stable to biodegradation in natural waters with relatively little microbial activity. The presence of aniline at initially spiked levels over the 28-day exposure period for both treatments demonstrates the effectiveness of the sterilisation procedure used in these experiments.
There is little available literature relating to biodegradation of nitrosamines in natural surface waters. One study assessed the degradation rate of NDMA spiked at 100 g/L in surface water microcosms and determined a half-life of 67 days, although re-spiking the solution decreased this half-life to 12 days (Plumlee and Reinhard 2007). Another study determined that wastewater treatments plants exhibit a high variability in the removal of nitrosamines, including NDMA, NMOR, NPIP and NDEA (Krauss et al. 2009; Sedlak et al. 2005). Furthermore, it was noted that the assessed nitrosamines degraded reasonably slowly, although NDMA was found to degrade almost completely within two days (Krauss et al. 2009). The inoculum used in the present study was intended to represent a diverse range of microbial communities present in the wastewater treatment plant. The previously reported susceptibility of NDMA to biodegradation within wastewater treatment plants and its enhanced biodegradation due to previously adapted microbial communities may explain why NDMA was rapidly degraded at higher concentrations within the present study.
Table 2. Summary of biodegradation first-order rate constants (k; d-1) and calculated half-lives (t0.5; d) for the nitrosamines at 100 ng/L and 10 g/L in artificial freshwater microcosms
Figure 5. Concentrations of NDMA (C) relative to initially measured concentrations (C0) during a 28-day exposure in synthetic fresh water spiked with a microbial inoculum. The two treatments of NDMA were an initial concentration of 100 ng/L and 10 g/L, respectively, including sterilised control samples
Figure 6. Concentrations of NMEA (C) relative to initially measured concentrations (C0) during a 28-day exposure in synthetic freshwater spiked with a microbial inoculum. The two treatments of NMEA
Biodegradation, hydrolysis and photolysis of nitrosamines in fresh water
Page 15
were an initial concentration of 100 ng/L and 10 g/L, respectively, including sterilised control samples.
5.3 Biodegradation Summary
The nitrosamines were generally stable over the exposure period, apart from NDMA (t0.5=1.1 d) and NMEA (t0.5=9.2 d) at a concentration of 10 g/L, where greater than 50% degradation was noted.
Where biodegradation occurred for NDMA and NMEA, it was likely to be concentration dependent since comparatively little to no degradation was observed for either nitrosamine at a concentration of 100 ng/L.
Some biodegradation may have commenced for NDEA in both treatments, although this was no more than 25% of initial levels in both treatments.
There was a reasonably high degree of variability noted in both control and biotic samples, which was most likely to be related to analytical variability.
It is therefore desirable to improve the analytical methods and repeat the experiment for a longer exposure period to confirm that biodegradation was occurring.
6. POTENTIAL IMPLICATIONS FOR NITROSAMINES IN SURFACE WATER
The fate of nitrosamines in the aquatic environments is expected to be dependent not only on their inherent susceptibility to environmental fate processes (such as photolysis, hydrolysis, volatilisation and biodegradation) but also the ambient conditions (e.g. hydrodynamic mixing, water quality, pH, latitude, temperature) associated with the receiving environments.
This study has shown that photolysis is a significant pathway of destruction of nitrosamines, in agreement with studies on selected nitrosamines (Nawrocki and Andrzejewski 2011). NDMA photolysis half-lives in the order of 10 – 40 h have been reported previously (Plumlee and Reinhard 2007, Pehlivanoglu-Mantas and Sedlak 2006). For relatively low solar irradiation conditions (1 m depth) at London’s latitude, Plumlee and Reinhard (2007) calculated NDMA half-lives of about 8–38 h. Our study showed half-lives for nitrosamines at the latitude of Mongstad (simulating the midday summer solar irradiation) in clean water ranging from 11 -24 minutes. It is noteworthy that this represents the maximum rate of photon absorption of nitrosamines in ultrapure water through simulated peak irradiance at the latitude of Mongstad. These experiments are therefore likely to also represent the maximum photolysis rate for the nitrosamines, since other factors such as the seasonal decrease in irradiance intensity and the presence of natural particulate or dissolved materials would be expected to reduce the rates of photolysis (Schwarzenbach et al. 2003). Furthermore, the photolysis of nitrosamines is pH dependent, with the rate of photolytic loss being generally faster under acidic conditions with alkaline conditions not being favourable for photolysis, although influence on rates are dependent on the particular nitrosamine of interest (Nawrocki and Andrzejewski 2011). Indirect photolysis due to photosensitisation of reactive species present in natural waters (e.g. dissolved organic matter), which can in turn react with the nitrosamines and increase apparent photolysis rates, are not likely to be important for nitrosamines (Nawrocki and Andrzejewski 2011, Plumlee and Reinhard 2007).
Biodegradation, hydrolysis and photolysis of nitrosamines in fresh water
Page 16
In comparison, the other attenuation pathways of nitrosamines are considerably slower. Hydrolysis can be ruled out as a significant pathway, as shown by the results from this study and previous published work (Nawrocki and Andrzejewski 2011). Biodegradation of nitrosamines (e.g. NDMA) has been previously observed, especially for biologically active systems such as soils, surface water or groundwater, although the rate of biodegradation is generally very slow (Nawrocki and Andrzejewski 2011). Co-metabolism, or biodegradation of nitrosamines where it is not used as a primary energy source, is the most likely biodegradation process due to the low levels of nitrosamines present in the environment (Nawrocki and Andrzejewski 2011). It is dependent on degree of microbial activity and there are contradictory reports in the literature on biodegradation for aqueous systems.
In the current study, while biodegradation of NDMA was noted at one concentration, this was in a microcosm in which a microbial consortium from a wastewater treatment plant (presumably previously exposed to NDMA) was used. These results may not be directly applicable to running surface waters, devoid of significant microbial activity and not offering a long residence time to the nitrosamines in a static environment. Furthermore, since the nitrosamines at environmentally relevant concentrations are not expected to serve as a significant source of carbon for microorganisms, biodegradation in surface water is not expected to be a significant pathway for degradation. Another pathway that may be relevant to surface water is volatilisation, especially in a turbulent stream. However, the Henry constants for respective nitrosamines are generally small, meaning that the volatilisation pathway for nitrosamine losses should be of minor importance. Sorption on sediments of nitrosamines is not expected to be significant due to their highly polar nature and high solubility.
Based on the estimated worst-case exposure scenarios presented in a NILU report, maximum drinking water concentrations of 4 g/L are expected for unity emissions and 28 ng/L for expected emissions (Berglen et al. 2010). The concentrations used for experimental exposures in the present study were 100 ng/L and 10 g/L for respective nitrosamines (or 1 g/L and 100 g/L total nitrosamine concentrations for the mixture of 10 nitrosamines), which are comparable with these predicted values. Where nitrosamines are exposed to irradiance, degradation rates of nitrosamines would be rapid with almost complete removal within 1 h under ideal conditions (i.e. mid-summer, clear water). Even during winter in Mongstad, Norway, where theoretical midday insolation levels are up to 13 times less than those found in summer (NASA Atmospheric Science Data Centre) there is sufficient irradiance for nitrosamines to have half-lives of hours. In comparison with biodegradation rates determined for NDMA and NMEA, this would still make photolysis the most important degradation processes in freshwater. The slowest rate of photolysis determined for the nitrosamines (k=0.0289 min-1 for NDEA) was still more than 400 times faster than the rate applied (k=0.0976 d-1) for a biodegradation scenario (Berglen et al. 2010). This would accordingly give maximum drinking water concentrations more than 400 times less than those estimated where biodegradation gives a lifetime for nitrosamines of 10.2 days (Berglen et al. 2010).
Where photolysis is not possible, such as night time or where variables relating to the water system (e.g. high levels of DOM, increased water depth, ice coverage in winter) greatly reduce photolysis, then biodegradation may play a role in reducing nitrosamine concentrations. However, this only seems to be important for NDMA and NMEA at concentrations representing those that would be expected from a unity emissions scenario
Biodegradation, hydrolysis and photolysis of nitrosamines in fresh water
Page 17
(4 g/L) under the conditions presented in this study (i.e. 22C water temperature). In this case, the slowest biodegradation rate, which was determined for NMEA (k=0.075 d-1), would give similar maximal drinking water concentrations as those in the NILU report, where a k for biodegradation was given as 0.0976 d-1 (Berglen et al. 2010), when biodegradation is the dominant degradation process. If NDMA were considered in the scenario where biodegradation is the dominant degradation process, estimated maximal drinking water equilibrium concentrations would be more than 10 times less than those given by NILU (Berglen et al. 2010). However, since biodegradation is likely to be concentration-dependent and no degradation was noted at concentrations closer to realistic exposure scenarios maximum drinking water concentrations would be expected to be similar to those presented where nitrosamines are persistent when photolysis does not occur (Berglen et al. 2010).
7. CONCLUSIONS
1. Mixtures of 10 nitrosamines in a 10 g/L treatment were found to be highly susceptible to loss through photolysis under simulated mid-summer sunlight conditions expected at Mongstad. Although this was not quantified in 100 ng/L treatments, comparison of our data with literature values demonstrated that the rate of photolysis is independent of concentration
2. The nitrosamines were found to be stable to hydrolysis after 5 days even at a high temperature (50C) in buffers of pH 4, 7 and 9, respectively. This is assumed to be equivalent to hydrolytic stability over a 1-year period at 25C.
3. In general, the nitrosamines were found to be resistant to biodegradation over the exposure period (28 days) in both 100 ng/L and 10 g/L treatments. However, reasonably rapid biodegradation was noted in the case of NDMA and NMEA only at a concentration of 10 g/L, suggested the biotic loss of NDMA and NMEA is concentration dependent. The rapid biodegradation of NDMA observed in this study was from a system inoculated with a microbial consortium from a sewage treatment plant and therefore may not be directly applicable to surface water devoid of significant microbial activity.
8. ACKNOWLEDGEMENTS
The authors thank Debra Gonzago, Ali Shareef and Elodie Randrema (CSIRO) for technical assistance.
Biodegradation, hydrolysis and photolysis of nitrosamines in fresh water
Page 18
Biodegradation, hydrolysis and photolysis of nitrosamines in fresh water
Page 19
9. REFERENCES
Berglen, T.F., Tønnesen, D., Dye, C., Karl, M., Knudsen, S. and Tarrasón (2010) CO2 Technology Centre Mongstad – updated air dispersion calculations. Update of OR 12/2008. NILU, OR 41/2010
Krauss, M., Longree, P., Dorusch, F., Ort, C. and Hollender, J. (2009). Occurrence and removal of N-nitrosamines in wastewater treatment plants. Water Research 43: 4381-4391.
Nawrocki, J. and Andrzejewski, P. (2011) Nitrosamines and water. Journal of Hazardous Materials 189: 1-18.
NASA Atmospheric Science Data Center (http://eosweb.larc.nasa.gov/cgi-bin/sse/sse.cgi?+s01#s01)
OECD (2004). OECD Guideline 111: Hydrolysis as a function of pH. OECD guidelines for testing of chemicals. OECD. Paris.
OECD (2004). OECD Guideline 309: Aerobic mineralisation in surface water - simulation biodegradation test. OECD guidelines for the testing of chemicals. OECD. Paris.
OECD (2008). OECD Guideline 316: Phototransformation of chemicals in water – direct photolysis. OECD guidelines for the testing of chemicals. OECD. Paris.
Pehlivanoglu-Mantas, E. and Sedlak, D. (2006) The fate of the wastewater-derived NDMA precursors in the aquatic environment. Water Research 40: 1287-1293
Plumlee, M. H. and Reinhard, M. (2007). Photochemical attenuation of N-nitrosodimethylamine (NDMA) and other Nitrosamines in surface water. Environmental Science & Technology 41: 6170-6176.
Richardson S.D., Plewa, M.J., Wagner, E.D.,Schoeny, R., DeMarini, D.M. (2007). Occurrence, genotoxicity, and carcinogenicity of regulated and emerging disinfection by-products in drinking water: A review and roadmap for research. Mutution Research 636: 178-242.
Schwarzenbach, R.P., Gschwend, P.M. and Imboden, D.M. (2003). Environmental Organic Chemistry, 2nd ed. John Wiley & Sons Inc. Hoboken, NJ.
Sedlak, D.L., Deeb, R.A., Hawley, E.L., Mitch, W.A., Durbin, T.D., Mowbray, S. and Carr, S. (2005). Sources and fate of nitrosodimethylamine and its precursors in municipal wastewater treatment plants. Water Environment Research 77: 32-39
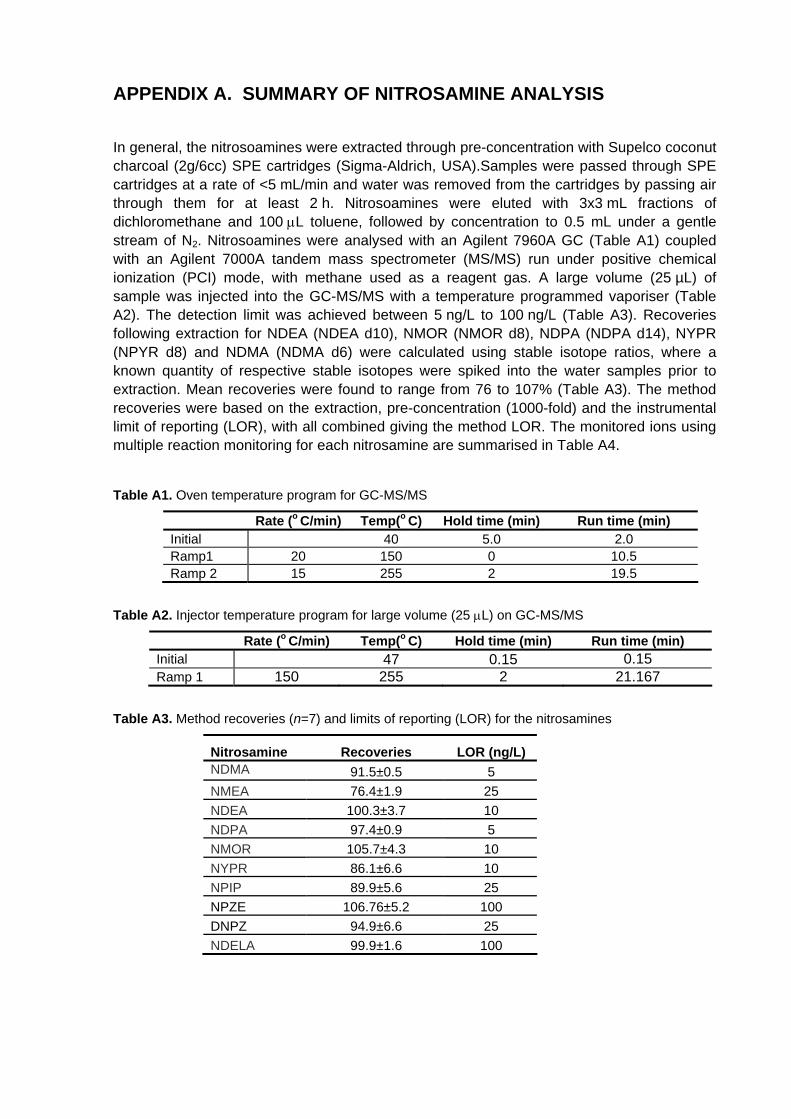
In general, the nitrosoamines were extracted through pre-concentration with Supelco coconut charcoal (2g/6cc) SPE cartridges (Sigma-Aldrich, USA).Samples were passed through SPE cartridges at a rate of <5 mL/min and water was removed from the cartridges by passing air through them for at least 2 h. Nitrosoamines were eluted with 3x3 mL fractions of dichloromethane and 100 L toluene, followed by concentration to 0.5 mL under a gentle stream of N2. Nitrosoamines were analysed with an Agilent 7960A GC (Table A1) coupled with an Agilent 7000A tandem mass spectrometer (MS/MS) run under positive chemical ionization (PCI) mode, with methane used as a reagent gas. A large volume (25 µL) of sample was injected into the GC-MS/MS with a temperature programmed vaporiser (Table A2). The detection limit was achieved between 5 ng/L to 100 ng/L (Table A3). Recoveries following extraction for NDEA (NDEA d10), NMOR (NMOR d8), NDPA (NDPA d14), NYPR (NPYR d8) and NDMA (NDMA d6) were calculated using stable isotope ratios, where a known quantity of respective stable isotopes were spiked into the water samples prior to extraction. Mean recoveries were found to range from 76 to 107% (Table A3). The method recoveries were based on the extraction, pre-concentration (1000-fold) and the instrumental limit of reporting (LOR), with all combined giving the method LOR. The monitored ions using multiple reaction monitoring for each nitrosamine are summarised in Table A4.
Table A1. Oven temperature program for GC-MS/MS
Rate (o C/min) Temp(o C) Hold time (min) Run time (min) Initial 40 5.0 2.0 Ramp1 20 150 0 10.5 Ramp 2 15 255 2 19.5
Table A2. Injector temperature program for large volume (25 L) on GC-MS/MS
Rate (o C/min) Temp(o C) Hold time (min) Run time (min) Initial 47 0.15 0.15 Ramp 1 150 255 2 21.167
Table A3. Method recoveries (n=7) and limits of reporting (LOR) for the nitrosamines
Nitrosamine Recoveries LOR (ng/L) NDMA 91.5±0.5 5
NMEA 76.4±1.9 25
NDEA 100.3±3.7 10
NDPA 97.4±0.9 5
NMOR 105.7±4.3 10
NYPR 86.1±6.6 10
NPIP 89.9±5.6 25
NPZE 106.76±5.2 100
DNPZ 94.9±6.6 25
NDELA 99.9±1.6 100
Biodegradation, hydrolysis and photolysis of nitrosamines in fresh water
Page 21
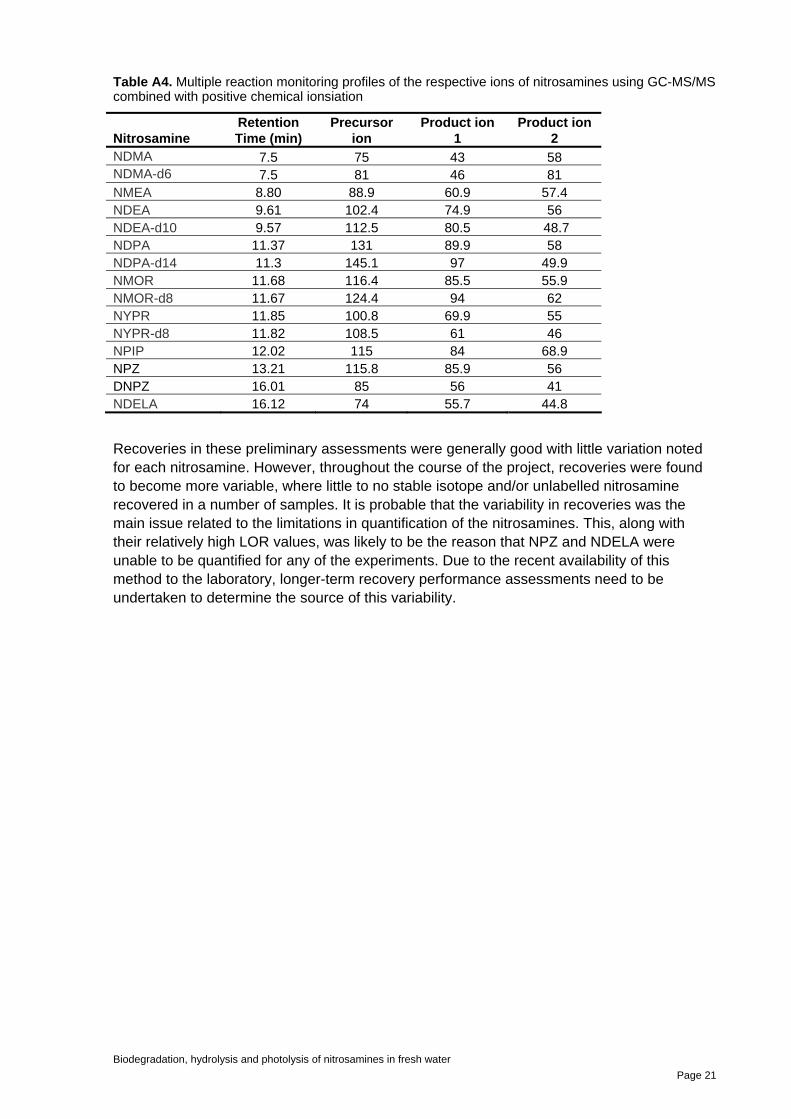
Table A4. Multiple reaction monitoring profiles of the respective ions of nitrosamines using GC-MS/MS combined with positive chemical ionsiation
Recoveries in these preliminary assessments were generally good with little variation noted for each nitrosamine. However, throughout the course of the project, recoveries were found to become more variable, where little to no stable isotope and/or unlabelled nitrosamine recovered in a number of samples. It is probable that the variability in recoveries was the main issue related to the limitations in quantification of the nitrosamines. This, along with their relatively high LOR values, was likely to be the reason that NPZ and NDELA were unable to be quantified for any of the experiments. Due to the recent availability of this method to the laboratory, longer-term recovery performance assessments need to be undertaken to determine the source of this variability.
APPENDIX B. PHOTOLYSIS EXPERIMENTS
Wavelength (nm)
280 300 320 340 360 380 400 420 440
M
-1cm
-1)
1
10
100
1000
10000
Irra
dian
ce (
W/m
2 )
0.0
0.2
0.4
0.6
0.8
1.0NDMA
NMEA
NDEA
NDPA
NMOR
NPYR
NPIP
DNPZ
NPZ
NDELA
Irradiance
Figure B1. Plot of individual nitrosamine log molar extinction coefficient values and the corresponding irradiance spectrum of the Solar Simulator from 280 to 400 nm, where the majority of photolysis occurred
NDMA
Time (min)
0 10 20 30 40 50 60
[ND
MA
] (C
/C0)
0
10
20
30
40
50
60
70
80
90
100
110
120
130
Dark Light
NMEA
Time (min)
0 10 20 30 40 50 60
[NM
EA
] (C
/C0)
0
10
20
30
40
50
60
70
80
90
100
110
120
130
140
150
160
Dark Light
Biodegradation, hydrolysis and photolysis of nitrosamines in fresh water
Page 23
NDEA
Time (min)
0 10 20 30 40 50 60
[ND
EA
] (C
/C0)
10
20
30
40
50
60
70
80
90
100
110
120Dark Light
NDPA
Time (min)
0 10 20 30 40 50 60
[ND
PA
] (C
/C0)
0
10
20
30
40
50
60
70
80
90
100
110
120
130
140
150
160
170
Dark Light
Biodegradation, hydrolysis and photolysis of nitrosamines in fresh water
Page 24
NMOR
Time (min)
0 10 20 30 40 50 60
[NM
OR
] (C
/C0)
0
10
20
30
40
50
60
70
80
90
100
110
120 Dark Light
NPYR
Time (min)
0 10 20 30 40 50 60
[NP
YR
] (C
/C0)
0
10
20
30
40
50
60
70
80
90
100
110
120Dark Light
Biodegradation, hydrolysis and photolysis of nitrosamines in fresh water
Page 25
Biodegradation, hydrolysis and photolysis of nitrosamines in fresh water
Page 26
NPIP
Time (min)
0 10 20 30 40 50 60
[NP
IP]
(C/C
0)
0
10
20
30
40
50
60
70
80
90
100
110
120
130
140
150Dark Light
DNPZ
Time (min)
0 10 20 30 40 50 60
[DN
PZ
] (C
/C0)
0
10
20
30
40
50
60
70
80
90
100
110
120
130
140
150
160Dark Light
Figure B2. Plots of nitrosamine concentrations, relative to initial concentrations (nominally 10 g/L), after a 60-min exposure to simulated sunlight (520 W/m2) in both light exposed (light) and light-excluded (dark) control samples. The values represented are mean values of duplicate samples.
Figure C2. Biodegradation profiles of nitrosamines and sterilised controls (sterile), spiked at initial concentrations of 100 ng/L and 10 g/L, during 28 days within synthetic freshwater microcosms. Values are averages of duplicate samples.
Biodegradation, hydrolysis and photolysis of nitrosamines in fresh water
Page 29
Biodegradation, hydrolysis and photolysis of nitrosamines in fresh water


![Advancement in Technology through Graft Copolymerization · through 1,4-β-glucosidic bonds. It undergoes photo-degradation, acid hydrolysis, oxidation and biodegradation [1]. The](https://static.documents.pub/doc/80x56/5e54a8301581a0259f63490f/advancement-in-technology-through-graft-copolymerization-through-14-glucosidic.jpg)


![e d i ation B Journal of Bioremediation & Biodegradation · 2018-02-07 · hydrolysis, and squashed in aceto-carmine [23]. For observation was used optical microscope Olympus-BX 41,](https://static.documents.pub/doc/80x56/5e7b0ea334f36f37e45c3da3/e-d-i-ation-b-journal-of-bioremediation-biodegradation-2018-02-07-hydrolysis.jpg)
![Impacts of aerosols and clouds on photolysis frequencies and ... of aerosols and cloud… · [2] Photolysis reactions play a very important role in atmospheric chemistry. Ozone photolysis](https://static.documents.pub/doc/80x56/5f07e35b7e708231d41f41d6/impacts-of-aerosols-and-clouds-on-photolysis-frequencies-and-of-aerosols-and.jpg)
