Page 1
CHAPTER THREE
BIODIVERSITY
3.1 Introduction
3.1.1 Biodiversity of any given area being a function of precipitation, temperature, soils, altitude etc, itsdistribution across the globe is quite uneven. For instance, terrestrial biodiversity is as much as 25 times higherthan marine biodiversity. Within the terrestrial habitats, tropics are found to support much richer biodiversity
than alpine or polar regions. India is considered very rich in biodiversity. It is estimated that about 1/6th plantspecies of entire world belong to India. An area with a high concentration of endemic species is called a“hotspot”. Out of the twelve hotspots of the world, two (North East and Western Ghat areas) are in India.
3.1.2. Biodiversity conservation efforts have many facets – scientific surveys, policy reforms, legislativeinitiatives, international co-operation, public participation etc. National agencies like the Forest Survey of India,Botanical Survey of India, Zoological Survey of India carry out extensive studies continuously to assess theextent of diversity and the change trends across habitats, flora and fauna. The country has enacted a number oflegislations which have direct impact on biodiversity conservation efforts like the Indian Forest Act 1927, theWildlife Protection Act 1972, the Forest (Conservation) Act 1980, the Environmental Protection Act 1988 andThe Biological Diversity Act 2002 being the most important among them. By amending the Constitution,protection of forests and wildlife has been made one of the Fundamental Duties. Because of being incorporatedin the Concurrent List, Forests and Wildlife has been accorded a national perspective in policy making andlegislation. India is signatory and zres and climatic situations have formed ecological habitats like forests,grasslands, wetlands, coastal and marine ecosystems and desert ecosystems, which harbour and sustainimmense biodiversity and contribute to human well-being.
3.1.3. The enormity and intensity of these efforts notwithstanding, there is hardly any room for complacency.Increase in population, urbanization, industrialization etc are often at the cost of destruction of habitats. Theforces of development and that of conservation apparently bear adversarial relationships although this true onlyin the short term and both have commonalities in the long term. Rapid development at the cost of environmentaldegradation is doomed to be unsustainable. The country is endeavoring to balance the two.
3.1.4 Preventing a loss of biodiversity is important for mankind, given that humans depend on the naturalrichness of the planet for the food, energy, raw materials, clean air and clean water that make life possible anddrive economies and societies. As such, a reduction or loss of biodiversity may not only undermine the naturalenvironment but also economic and social goals. The challenges associated with preserving biodiversity havemade this topic an international issue.
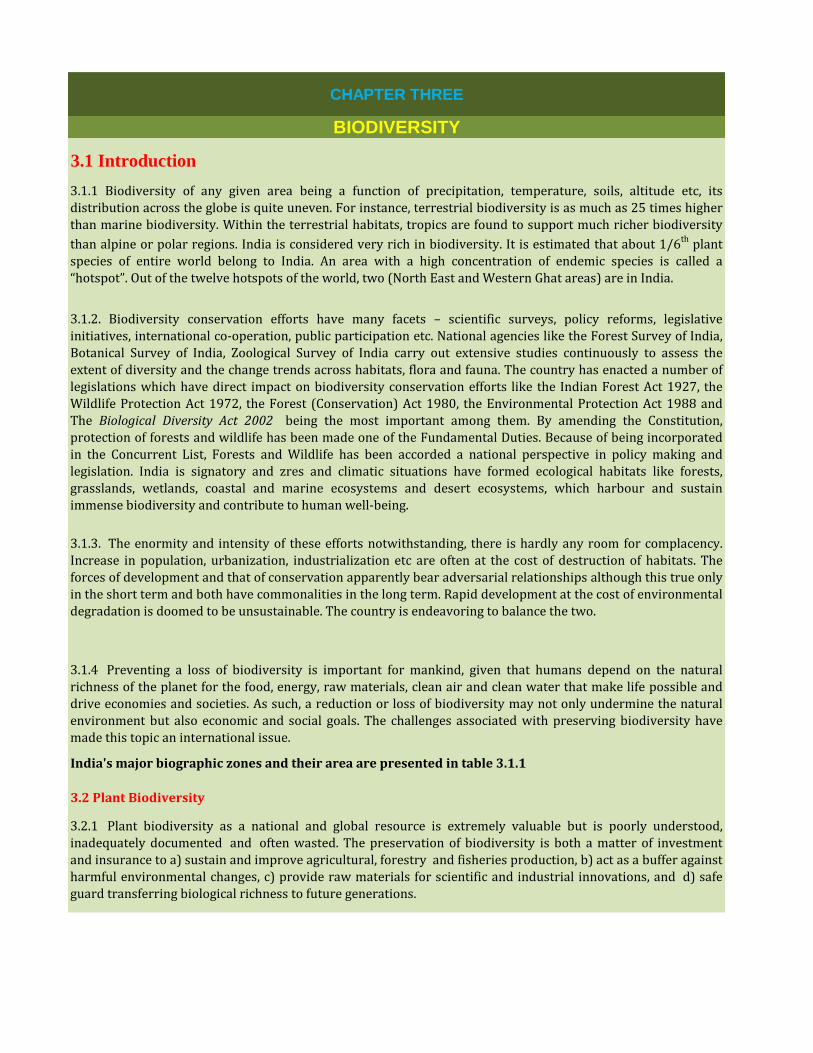
India's major biographic zones and their area are presented in table 3.1.1
3.2 Plant Biodiversity
3.2.1 Plant biodiversity as a national and global resource is extremely valuable but is poorly understood,inadequately documented and often wasted. The preservation of biodiversity is both a matter of investmentand insurance to a) sustain and improve agricultural, forestry and fisheries production, b) act as a buffer againstharmful environmental changes, c) provide raw materials for scientific and industrial innovations, and d) safeguard transferring biological richness to future generations.
Page 2
No. Name Biotic Province Total Area (sq.km) %
1 Trans Himalaya 174225
Ladakh 98618 3.3
Tibetan Plateau 75607 2.3
2 Himalaya 210385
North-Western 69033 2.1
Western 52596 1.6
Central 6575 0.2
Eastern 82182 2.5
3 Desert 213672
Kachchh 36160 1.1
Thar 177512 5.4
4 Semi-Arid 545686
Central India 121629 3.7
Gujarat-Rajputana 424057 12.9
5 Western Ghats 131491
Malabar coast 65745 2.0
Western Ghat Mountains 65745 2.0
6 Deccan Peninsula 1377363
Deccan South Plateau 341875 10.4
Deccan Central Plateau 410908 12.5
Eastern Plateau 207098 6.3
Chhota Nagpur 177512 5.4
Central Highlands 239970 7.3
7 Gangetic Plain 355024
Upper Gangetic 207098 6.3
Lower Gangetic 147927 4.5
Coasts 82182
8 East Coast 62458 1.9
West Coast 19724 0.6
9 North East 170938
Brahmaputra Valley 65745 2.0
North-Eastern Hills 105192 3.2
10 Island 12971
Andaman Islands 6575 0.2
Nicobar Islands 3287 0.1
Lakshadweep Islands 3110 0.1
Marine Influenced Area: 10440 0.3
Grand Total 3287263
Table 3.1.1. India's major biogeogrphic zones
Source: Wildlife Institute of India (Rodgers et al. 2002)/Zoological Survey of India
Page 3
2010 2013 2010 2013 2010 2013 2010 2013 2010 2013
1 2 3 4 5 6 7 8 9 10 11 12
I Flowering Plants
1 Gymnosperms 1021 1021 69 74 7 7.25 8.00 8 7 7
2 Angiosperms 281821 268600 17643 17926 6 6.67 ca. 5725 ca. 4045 1700 1700
II Non-flowering Plants
1 Bryophytes 16236 16236 2852 2504 17.56 15.42 ca. 629 629 ca.80 ca.80
2 Pteridophytes 12000 12000 1236 1265 10.3 10.54 ca.47 47 ca. 414 414
III Others
1 Virus & Bacteria 11813 11813 903 986 7.64 8.35 Not Known Not Known Not Known Not Known
2 Algae 40000 40000 7182 7244 17.95 18.11 ca.1924 1924 Not Known Not Known
3 Fungi 98998 98998 14588 14756 14.73 14.91 ca4100 ca.4100 ca. 580 ca.580
4 Lichens 17000 17000 2303 2390 13.55 14.06 ca.520 ca.520 Not Known Not Known
Source : Botanical Survey of India, Kolkata.
Sl.
No.
Table 3.2.1 : Number and status of plant species in India
Source : World figures are based on the Second edition of the "Numbers of Living Species in Australia and the World" (Chapman, 2009); data
on the number of species in India are taken from 'Plant Discoveries 2012- New Genera, Species and New Tecords' compiled and edited by
Paramjit Singh, D.K. Singh and S.S. Dash, published by Botanical Survey of India in 2013.
3.2.2 Biodiversity the world over is in peril because the habitats are threatened due to development programmes such as creation of
reservoirs, mining, forest clearing, laying of transport and communication networks, etc. It is estimated that in the world wide perspective,
slightly over 1000 animal species and sub-species are threatened with an extinction rate of one per year, while 20,000 flowering plants are
thought to be at risk.
No. of Known
Species in the World
No. of Known
Species in
India
Percentage of
Occurrence in India
No. of Endemic Species No. of
ThreatenedSpecies
Type
Page 4
Sl. No. Category Approximate Number
1 2 3
1 Rare 287
2 Vulnerable 167
3 Endangered 1366
4 Possibly Extinct 40
5 Extinct 28
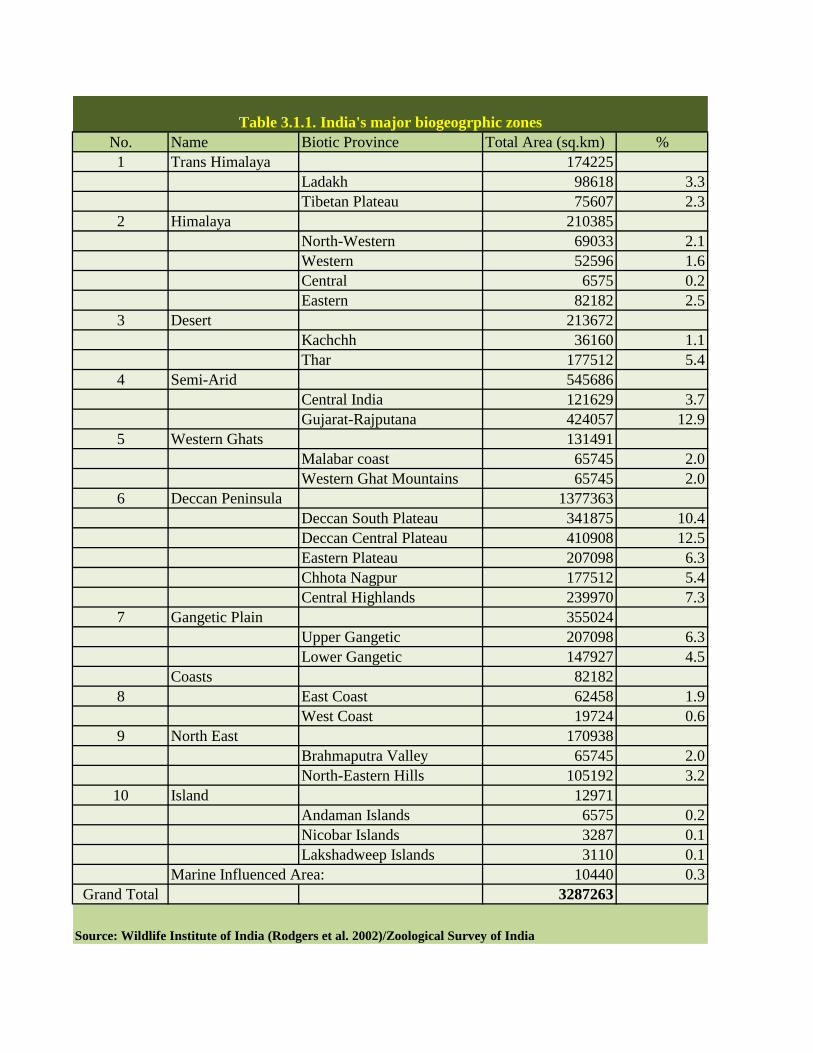
The table 3.2.2 and chart 3.2.1depicts the enormous situation of plant species at risk. 73% of
the total rare and threatened species are in the endangered category.
Table 3.2.2 : Rare and threatened species
(Vascular plants)
Source : Botanical Survey of India, Kolkata.
CHART 3.2.1: RARE AND THREATENED SPECIES-
Vascular Plants in India
15%
9%
73%
2% 1%
Rare Vulnerable Endangered Possibly Extinct Extinct
Page 5
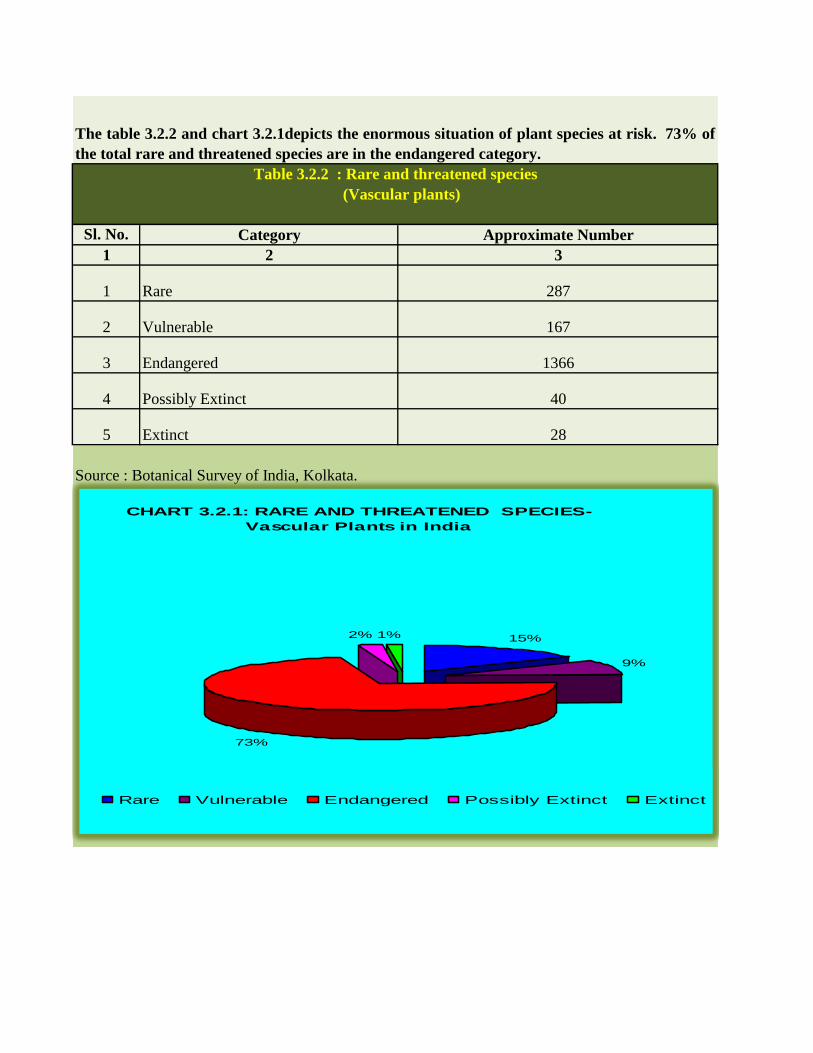
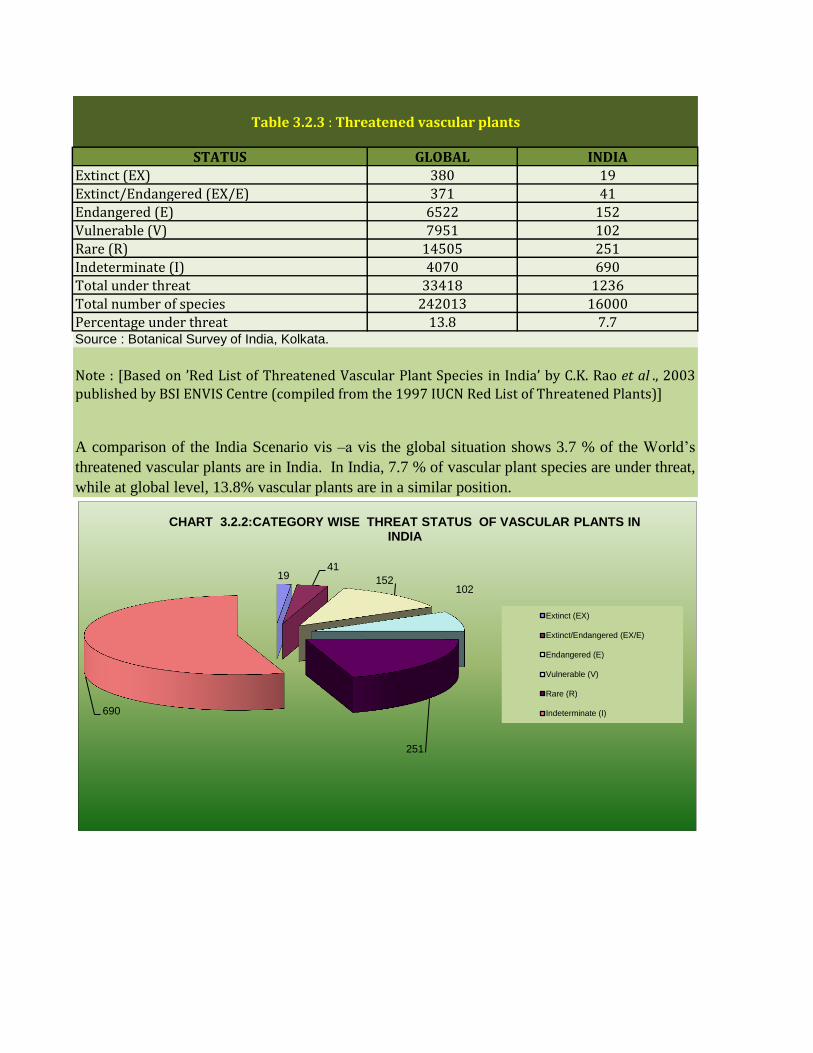
STATUS GLOBAL INDIAExtinct (EX) 380 19
Extinct/Endangered (EX/E) 371 41
Endangered (E) 6522 152Vulnerable (V) 7951 102Rare (R) 14505 251Indeterminate (I) 4070 690Total under threat 33418 1236
Total number of species 242013 16000Percentage under threat 13.8 7.7Source : Botanical Survey of India, Kolkata.
Table 3.2.3 : Threatened vascular plants
Note : [Based on ’Red List of Threatened Vascular Plant Species in India’ by C.K. Rao et al ., 2003published by BSI ENVIS Centre (compiled from the 1997 IUCN Red List of Threatened Plants)]
A comparison of the India Scenario vis –a vis the global situation shows 3.7 % of the World’s
threatened vascular plants are in India. In India, 7.7 % of vascular plant species are under threat,
while at global level, 13.8% vascular plants are in a similar position.
19 41
152 102
251
690
CHART 3.2.2:CATEGORY WISE THREAT STATUS OF VASCULAR PLANTS IN INDIA
Extinct (EX)
Extinct/Endangered (EX/E)
Endangered (E)
Vulnerable (V)
Rare (R)
Indeterminate (I)
Page 6
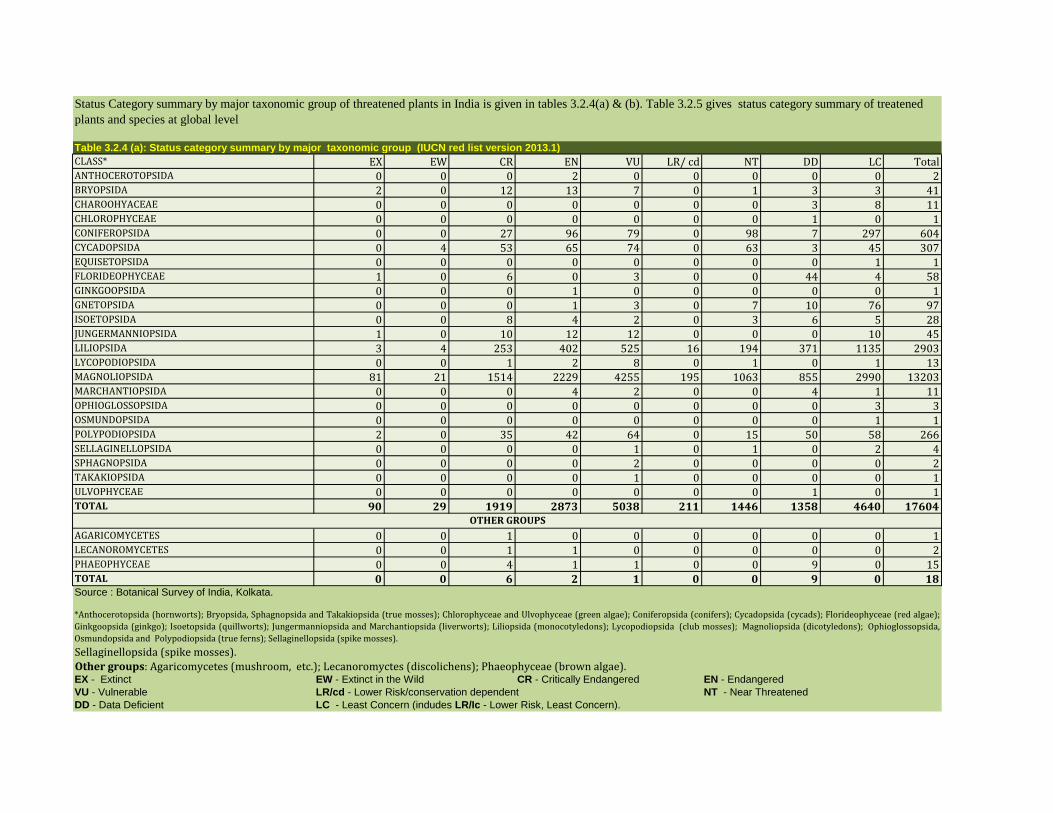
Table 3.2.4 (a): Status category summary by major taxonomic group (IUCN red list version 2013.1)
CLASS* EX EW CR EN VU LR/ cd NT DD LC TotalANTHOCEROTOPSIDA 0 0 0 2 0 0 0 0 0 2BRYOPSIDA 2 0 12 13 7 0 1 3 3 41CHAROOHYACEAE 0 0 0 0 0 0 0 3 8 11CHLOROPHYCEAE 0 0 0 0 0 0 0 1 0 1CONIFEROPSIDA 0 0 27 96 79 0 98 7 297 604CYCADOPSIDA 0 4 53 65 74 0 63 3 45 307EQUISETOPSIDA 0 0 0 0 0 0 0 0 1 1FLORIDEOPHYCEAE 1 0 6 0 3 0 0 44 4 58GINKGOOPSIDA 0 0 0 1 0 0 0 0 0 1GNETOPSIDA 0 0 0 1 3 0 7 10 76 97ISOETOPSIDA 0 0 8 4 2 0 3 6 5 28JUNGERMANNIOPSIDA 1 0 10 12 12 0 0 0 10 45LILIOPSIDA 3 4 253 402 525 16 194 371 1135 2903LYCOPODIOPSIDA 0 0 1 2 8 0 1 0 1 13MAGNOLIOPSIDA 81 21 1514 2229 4255 195 1063 855 2990 13203MARCHANTIOPSIDA 0 0 0 4 2 0 0 4 1 11OPHIOGLOSSOPSIDA 0 0 0 0 0 0 0 0 3 3OSMUNDOPSIDA 0 0 0 0 0 0 0 0 1 1POLYPODIOPSIDA 2 0 35 42 64 0 15 50 58 266SELLAGINELLOPSIDA 0 0 0 0 1 0 1 0 2 4SPHAGNOPSIDA 0 0 0 0 2 0 0 0 0 2TAKAKIOPSIDA 0 0 0 0 1 0 0 0 0 1ULVOPHYCEAE 0 0 0 0 0 0 0 1 0 1TOTAL 90 29 1919 2873 5038 211 1446 1358 4640 17604
AGARICOMYCETES 0 0 1 0 0 0 0 0 0 1LECANOROMYCETES 0 0 1 1 0 0 0 0 0 2PHAEOPHYCEAE 0 0 4 1 1 0 0 9 0 15TOTAL 0 0 6 2 1 0 0 9 0 18Source : Botanical Survey of India, Kolkata.
EX - Extinct EW - Extinct in the Wild CR - Critically Endangered EN - Endangered
VU - Vulnerable LR/cd - Lower Risk/conservation dependent NT - Near Threatened
DD - Data Deficient LC - Least Concern (indudes LR/Ic - Lower Risk, Least Concern).
OTHER GROUPS
*Anthocerotopsida (hornworts); Bryopsida, Sphagnopsida and Takakiopsida (true mosses); Chlorophyceae and Ulvophyceae (green algae); Coniferopsida (conifers); Cycadopsida (cycads); Florideophyceae (red algae);
Ginkgoopsida (ginkgo); Isoetopsida (quillworts); Jungermanniopsida and Marchantiopsida (liverworts); Liliopsida (monocotyledons); Lycopodiopsida (club mosses); Magnoliopsida (dicotyledons); Ophioglossopsida,
Osmundopsida and Polypodiopsida (true ferns); Sellaginellopsida (spike mosses).
Sellaginellopsida (spike mosses).
Other groups: Agaricomycetes (mushroom, etc.); Lecanoromyctes (discolichens); Phaeophyceae (brown algae).
Status Category summary by major taxonomic group of threatened plants in India is given in tables 3.2.4(a) & (b). Table 3.2.5 gives status category summary of treatened
plants and species at global level
Page 7
Table 3.2.4 (b): Status category summary by major taxonomic group (IUCN red list version 2013.2)
CLASS* EX EW CR EN VU LR/ cd NT DD LC TotalANTHOCEROTOPSIDA 0 0 0 2 0 0 0 0 0 2BRYOPSIDA 2 0 12 13 7 0 1 3 3 41CHAROOHYACEAE 0 0 0 0 0 0 0 3 8 11CHLOROPHYCEAE 0 0 53 0 0 0 0 1 0 54CYCADOPSIDA 0 4 0 65 74 0 63 3 45 254EQUISETOPSIDA 0 0 6 0 0 0 0 0 1 7FLORIDEOPHYCEAE 1 0 0 0 3 0 0 44 4 52GINKGOOPSIDA 0 0 0 1 0 0 0 0 76 77GNETOPSIDA 0 0 8 1 3 0 7 10 5 34ISOETOPSIDA 0 0 10 4 2 0 3 6 10 35JUNGERMANNIOPSIDA 1 0 273 11 12 0 1 0 1428 1726LILIOPSIDA 3 4 1 468 551 16 215 396 4 1658LYCOPODIOPSIDA 0 0 1527 2 9 0 3 0 3062 4603MAGNOLIOPSIDA 81 21 1 2285 4290 195 1077 874 0 8824MARCHANTIOPSIDA 0 0 1 0 0 0 0 0 1 2OPHIOGLOSSOPSIDA 0 0 27 3 2 0 0 4 298 334OSMUNDOPSIDA 0 0 38 96 79 0 98 7 63 381POLYPODIOPSIDA 2 0 0 55 67 0 15 50 3 192SELLAGINELLOPSIDA 0 0 0 0 0 0 0 0 0 0SPHAGNOPSIDA 0 0 0 0 2 0 0 0 0 2TAKAKIOPSIDA 0 0 0 0 1 0 0 0 0 1ULVOPHYCEAE 0 0 0 0 0 0 0 1 0 1TOTAL 90 29 1957 3006 5102 211 1483 1402 5011 18291
AGARICOMYCETES 0 0 1 0 0 0 0 0 0 1LECANOROMYCETES 0 0 1 1 0 0 0 0 0 2PHAEOPHYCEAE 0 0 4 1 1 0 0 9 0 15TOTAL 0 0 6 2 1 0 0 9 0 18Source : Botanical Survey of India, Kolkata.
EX - Extinct EW - Extinct in the Wild CR - Critically Endangered EN - Endangered
VU - Vulnerable LR/cd - Lower Risk/conservation dependent NT - Near Threatened
DD - Data Deficient LC - Least Concern (indudes LR/Ic - Lower Risk, Least Concern).
OTHER GROUPS
Sellaginellopsida (spike mosses). Other groups: Agaricomycetes (mushroom, etc.); Lecanoromyctes (discolichens); Phaeophyceae (brown algae).
*Plants: Anthocerotopsida (hornworts); Bryopsida, Sphagnopsida and Takakiopsida (true mosses); Charophyaceae, Chlorophyceae and Ulvophyceae (green algae);Cycadopsida (cycads); Equisetopsida (horsetails); Florideophyceae (red algae); Ginkgoopsida (ginkgo); Gnetopsida (gnetums); Isoetopsida (quillworts);
Jungermanniopsida and Marchantiopsida (liverworts); Liliopsida (monocotyledons); Lycopodiopsida (club mosses and spike mosses); Magnoliopsida (dicotyledons);Marattiopsida, Polypodiopsida and (ferns); Pinopsida (conifers).
Page 8
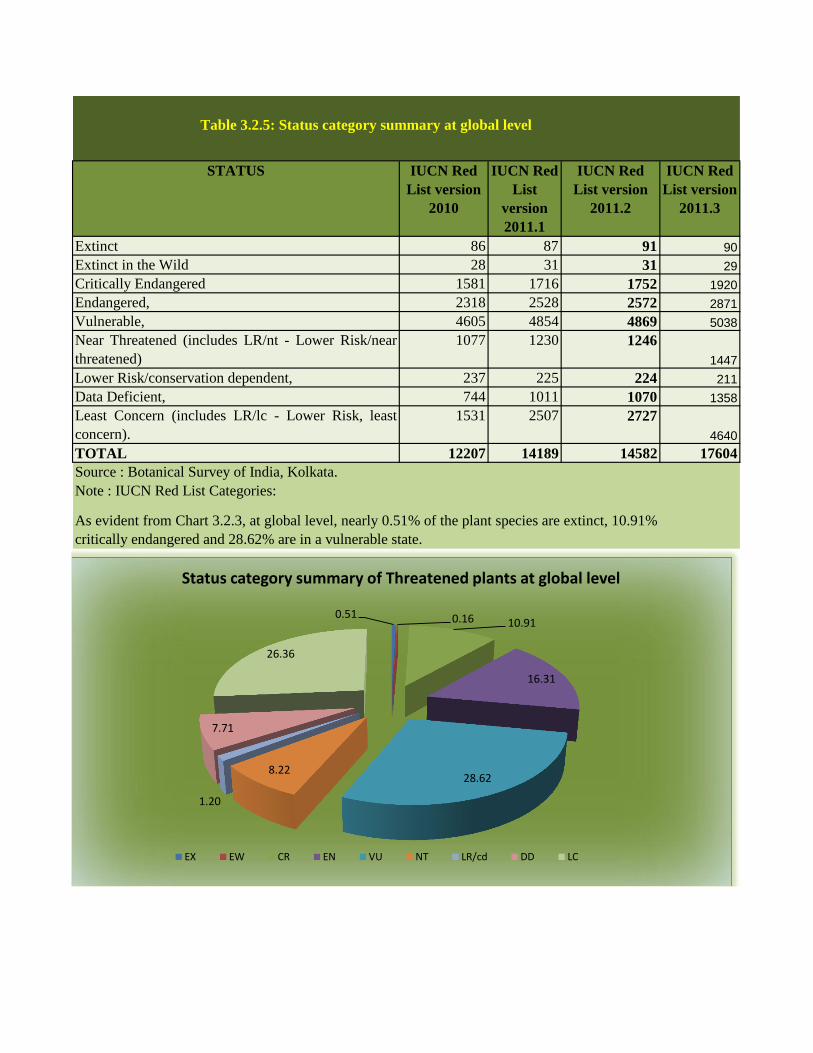
STATUS IUCN Red
List version
2010
IUCN Red
List
version
2011.1
IUCN Red
List version
2011.2
IUCN Red
List version
2011.3
Extinct 86 87 91 90
Extinct in the Wild 28 31 31 29
Critically Endangered 1581 1716 1752 1920
Endangered, 2318 2528 2572 2871
Vulnerable, 4605 4854 4869 5038
Near Threatened (includes LR/nt - Lower Risk/near
threatened)
1077 1230 1246
1447
Lower Risk/conservation dependent, 237 225 224 211
Data Deficient, 744 1011 1070 1358
Least Concern (includes LR/lc - Lower Risk, least
concern).
1531 2507 2727
4640
TOTAL 12207 14189 14582 17604
Table 3.2.5: Status category summary at global level
Note : IUCN Red List Categories:
As evident from Chart 3.2.3, at global level, nearly 0.51% of the plant species are extinct, 10.91%
critically endangered and 28.62% are in a vulnerable state.
Source : Botanical Survey of India, Kolkata.
0.51 0.16 10.91
16.31
28.62 8.22
1.20
7.71
26.36
Status category summary of Threatened plants at global level
EX EW CR EN VU NT LR/cd DD LC
Page 9
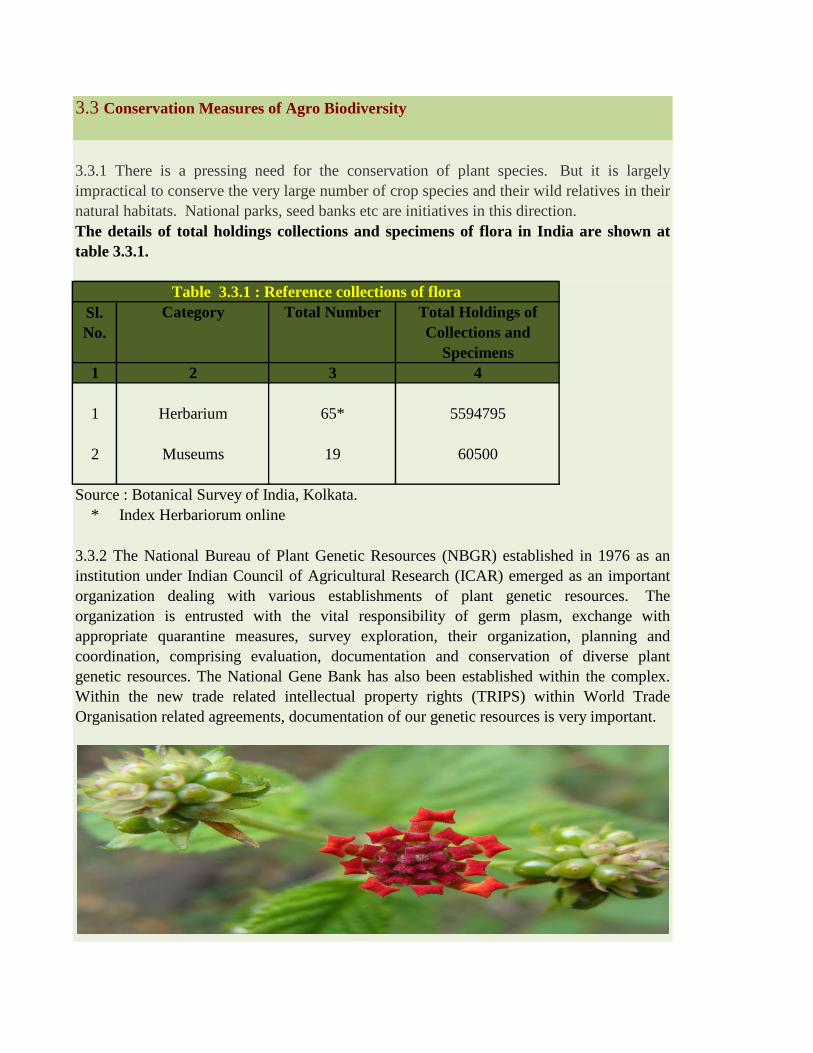
3.3 Conservation Measures of Agro Biodiversity
Category Total Number Total Holdings of
Collections and
Specimens
1 2 3 4
1 Herbarium 65* 5594795
2 Museums 19 60500
*
Source : Botanical Survey of India, Kolkata.
Index Herbariorum online
3.3.2 The National Bureau of Plant Genetic Resources (NBGR) established in 1976 as an
institution under Indian Council of Agricultural Research (ICAR) emerged as an important
organization dealing with various establishments of plant genetic resources. The
organization is entrusted with the vital responsibility of germ plasm, exchange with
appropriate quarantine measures, survey exploration, their organization, planning and
coordination, comprising evaluation, documentation and conservation of diverse plant
genetic resources. The National Gene Bank has also been established within the complex.
Within the new trade related intellectual property rights (TRIPS) within World Trade
Organisation related agreements, documentation of our genetic resources is very important.
3.3.1 There is a pressing need for the conservation of plant species. But it is largely
impractical to conserve the very large number of crop species and their wild relatives in their
natural habitats. National parks, seed banks etc are initiatives in this direction.
The details of total holdings collections and specimens of flora in India are shown at
table 3.3.1.
Table 3.3.1 : Reference collections of flora
Sl.
No.
Page 10
(as on
31st March 2012)
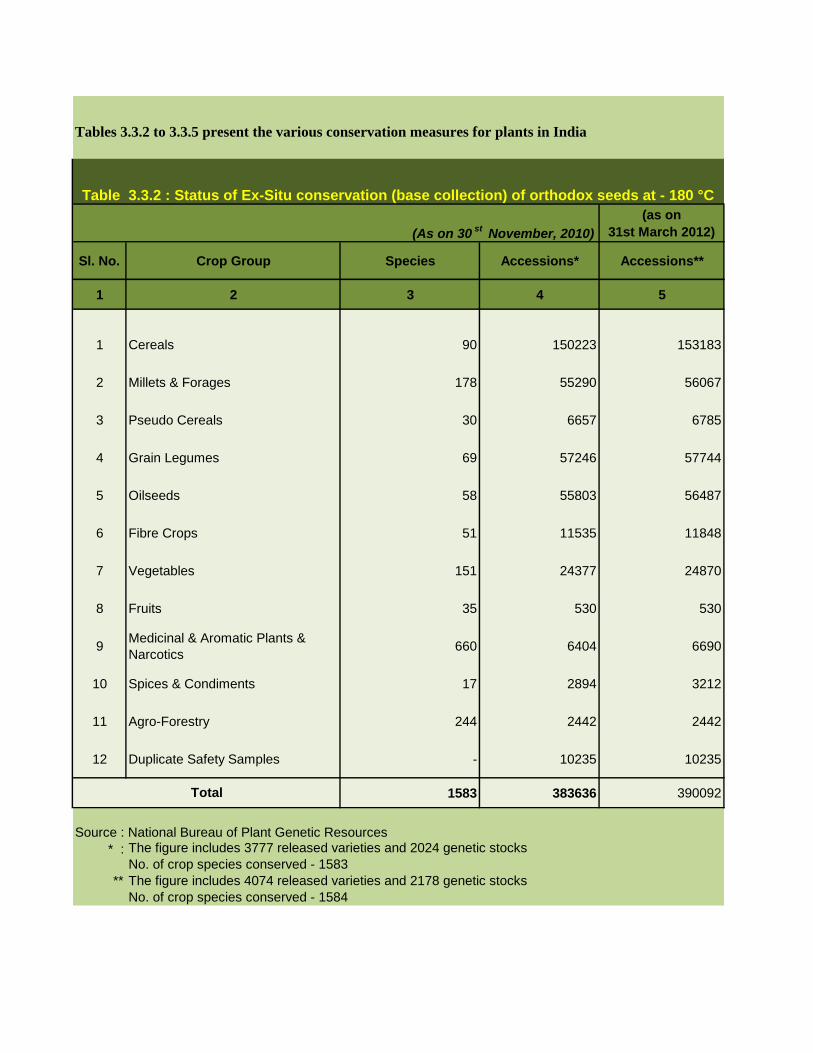
Sl. No. Crop Group Species Accessions* Accessions**
1 2 3 4 5
1 Cereals 90 150223 153183
2 Millets & Forages 178 55290 56067
3 Pseudo Cereals 30 6657 6785
4 Grain Legumes 69 57246 57744
5 Oilseeds 58 55803 56487
6 Fibre Crops 51 11535 11848
7 Vegetables 151 24377 24870
8 Fruits 35 530 530
9Medicinal & Aromatic Plants &
Narcotics660 6404 6690
10 Spices & Condiments 17 2894 3212
11 Agro-Forestry 244 2442 2442
12 Duplicate Safety Samples - 10235 10235
1583 383636 390092
Source : National Bureau of Plant Genetic Resources
* :No. of crop species conserved - 1583
** The figure includes 4074 released varieties and 2178 genetic stocks
No. of crop species conserved - 1584
The figure includes 3777 released varieties and 2024 genetic stocks
(As on 30st
November, 2010)
Total
Table 3.3.2 : Status of Ex-Situ conservation (base collection) of orthodox seeds at - 180 °C
Tables 3.3.2 to 3.3.5 present the various conservation measures for plants in India
Page 11
Genera Species Cultures*
(no.) (no.) (no.)
2 3 4 5
Tropical Fruits (banana, grape) 2 14 7600 416
9 41 6140 327
5 12 9200 611
4 12 3300 171
21 28 4980 170
7 27 5880 380
Total 48 134 37100 2075
Source : National Bureau of Plant Genetic Resources, New Delhi
* data is for 2010
Table 3.3.3 : Status of in-vitro conservation
(As on 31st
March 2012)
Crop group Accessions (no.)
Bulbous and other crops (garlic, gladiolus)
Medicinal and Aromatic Plants (species of bacopa, mentha,
rauvolfia, tylophora)
Spices and Industrial crops (ginger, turmeric, pepper,
cardamom, hops, jojoba)
1
Temperate and Minor Fruits (mulberry, strawberry,
apple,pear,blackberry)
Tuber crops (sweet potato, yam, taro)
Page 12
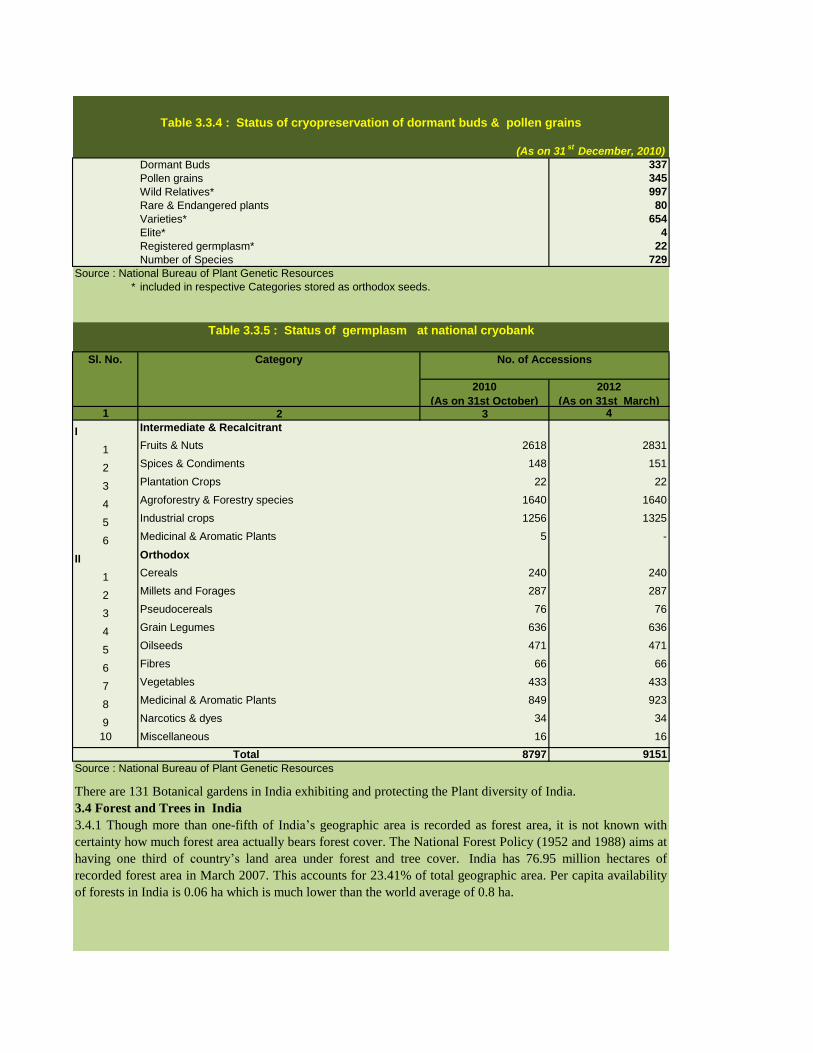
Dormant Buds 337
Pollen grains 345
Wild Relatives* 997
Rare & Endangered plants 80
Varieties* 654
Elite* 4
Registered germplasm* 22
Number of Species 729
Source : National Bureau of Plant Genetic Resources
* included in respective Categories stored as orthodox seeds.
2010
(As on 31st October)
2012
(As on 31st March) 1 2 3 4
I Intermediate & Recalcitrant
1 Fruits & Nuts 2618 2831
2 Spices & Condiments 148 151
3 Plantation Crops 22 22
4 Agroforestry & Forestry species 1640 1640
5 Industrial crops 1256 1325
6 Medicinal & Aromatic Plants 5 -
II Orthodox
1 Cereals 240 240
2 Millets and Forages 287 287
3 Pseudocereals 76 76
4 Grain Legumes 636 636
5 Oilseeds 471 471
6 Fibres 66 66
7 Vegetables 433 433
8 Medicinal & Aromatic Plants 849 923
9 Narcotics & dyes 34 34
10 Miscellaneous 16 16
8797 9151
Source : National Bureau of Plant Genetic Resources
Table 3.3.4 : Status of cryopreservation of dormant buds & pollen grains
(As on 31st
December, 2010)
Table 3.3.5 : Status of germplasm at national cryobank
Total
No. of AccessionsSl. No. Category
3.4.1 Though more than one-fifth of India’s geographic area is recorded as forest area, it is not known with
certainty how much forest area actually bears forest cover. The National Forest Policy (1952 and 1988) aims at
having one third of country’s land area under forest and tree cover. India has 76.95 million hectares of
recorded forest area in March 2007. This accounts for 23.41% of total geographic area. Per capita availability
of forests in India is 0.06 ha which is much lower than the world average of 0.8 ha.
There are 131 Botanical gardens in India exhibiting and protecting the Plant diversity of India.
3.4 Forest and Trees in India
Page 13
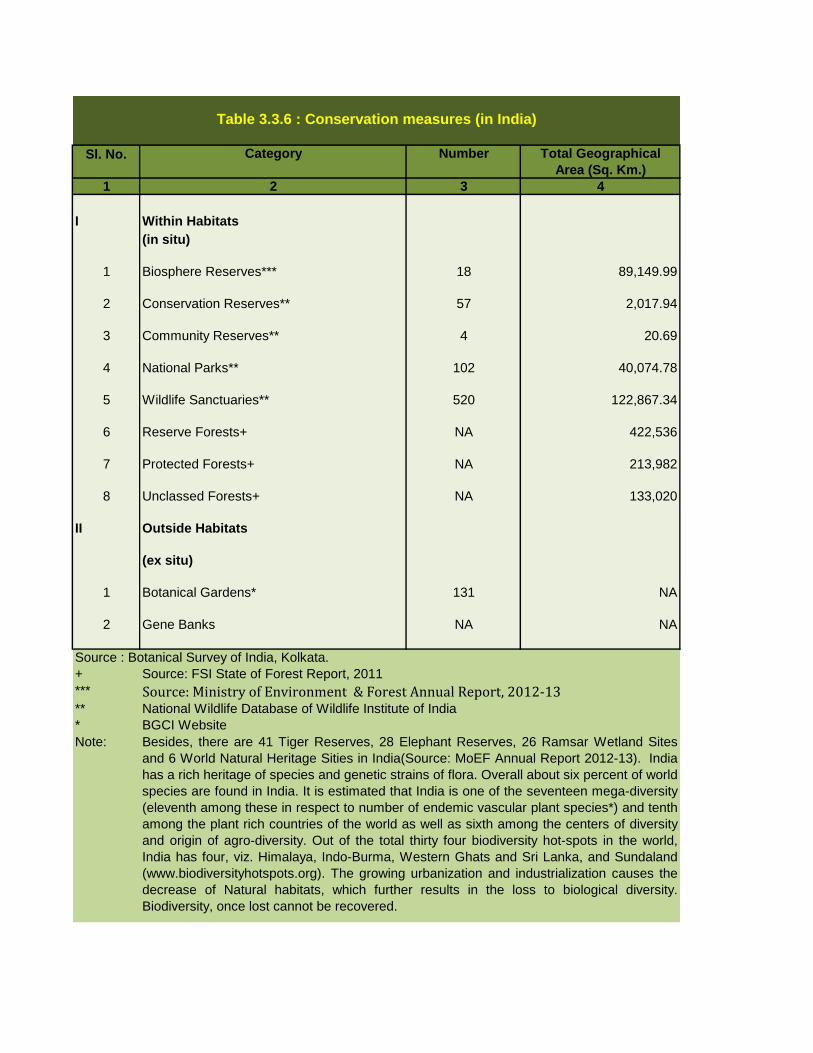
Category Number Total Geographical
Area (Sq. Km.)
1 2 3 4
I Within Habitats
(in situ)
1 Biosphere Reserves*** 18 89,149.99
2 Conservation Reserves** 57 2,017.94
3 Community Reserves** 4 20.69
4 National Parks** 102 40,074.78
5 Wildlife Sanctuaries** 520 122,867.34
6 Reserve Forests+ NA 422,536
7 Protected Forests+ NA 213,982
8 Unclassed Forests+ NA 133,020
II Outside Habitats
(ex situ)
1 Botanical Gardens* 131 NA
2 Gene Banks NA NA
Source : Botanical Survey of India, Kolkata.
+ Source: FSI State of Forest Report, 2011
***
** National Wildlife Database of Wildlife Institute of India
* BGCI Website
Note:
Table 3.3.6 : Conservation measures (in India)
Sl. No.
Source: Ministry of Environment & Forest Annual Report, 2012-13
Besides, there are 41 Tiger Reserves, 28 Elephant Reserves, 26 Ramsar Wetland Sites
and 6 World Natural Heritage Sities in India(Source: MoEF Annual Report 2012-13). India
has a rich heritage of species and genetic strains of flora. Overall about six percent of world
species are found in India. It is estimated that India is one of the seventeen mega-diversity
(eleventh among these in respect to number of endemic vascular plant species*) and tenth
among the plant rich countries of the world as well as sixth among the centers of diversity
and origin of agro-diversity. Out of the total thirty four biodiversity hot-spots in the world,
India has four, viz. Himalaya, Indo-Burma, Western Ghats and Sri Lanka, and Sundaland
(www.biodiversityhotspots.org). The growing urbanization and industrialization causes the
decrease of Natural habitats, which further results in the loss to biological diversity.
Biodiversity, once lost cannot be recovered.
Page 14
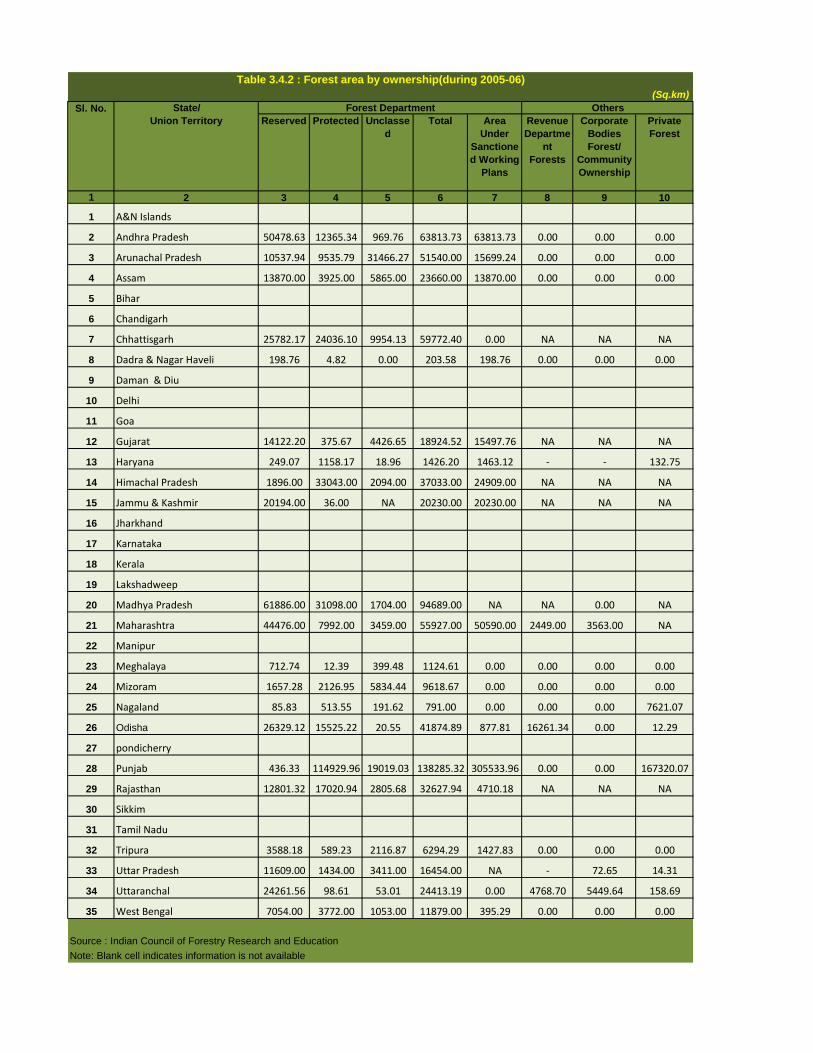
(Sq.km)
Reserved
Forests
Protected
Forests
Unclassed
Forests
Total
Forest
Area 1 2 3 4 5 6 7 8
1 Andhra Pradesh 275069 50479 12365 970 63814 23.20
2 Arunachal Pradesh 83743 10546 9528 31466 51540 61.55
3 Assam 78438 17864 0 8968 26832 34.21
4 Bihar 94163 693 5779 1 6473 6.87
5 Chhattisgarh 135191 25782 24036 9954 59772 44.21
6 Delhi 1483 78 7 - 85 5.73
7 Goa 3702 253 845 126 1224 33.06
8 Gujarat 196022 14122 479 4326 18927 9.66
9 Haryana 44212 249 1158 152 1559 3.53
10 Himachal Pradesh 55673 1898 33130 2005 37033 66.52
11 Jammu & Kashmir 222236 17643 2551 36 20230 9.10
12 Jharkhand 79714 4387 19185 33 23605 29.61
13 Karnataka 191791 28690 3931 5663 38284 19.96
14 Kerala 38863 11123 142 - 11265 28.99
15 Madhya Pradesh 308245 61886 31098 1705 94689 30.72
16 Maharashtra 307713 49226 8195 4518 61939 20.13
17 Manipur 22327 1467 4171 11780 17418 78.01
18 Meghalaya 22429 1113 12 8371 9496 42.34
19 Mizoram 21081 7909 3568 5240 16717 79.30
20 Nagaland 16579 86 508 8628 9222 55.62
21 Odisha 155707 26329 15525 16282 58136 37.34
22 Punjab 50362 44 1137 1903 3084 6.12
23 Rajasthan 342239 12454 17416 2769 32639 9.54
24 Sikkim 7096 5452 389 - 5841 82.31
25 Tamil Nadu 130058 19388 2183 1306 22877 17.59
26 Tripura 10486 4175 2 2117 6294 60.02
27 Uttar Pradesh 240928 11660 1420 3503 16583 6.88
28 Uttarakhand 53483 24643 9885 123 34651 64.79
29 West Bengal 88752 7054 3772 1053 11879 13.38
30 Union Territories 9478 5843 1565 22 7430 78.39
3287263 422536 213982 133020 769538 23.41
Source : India State of Forest Report 2011
Recorded Forest Area Percentage
of Forest to
Geo. Area
Table 3.4.1 : Recorded forest area in States and UT's
Total
Sl. No. State/UT Geographic
Area
Very Dense Forest, 2.54%
Moderately Dense Forest, 9.76%
Open Forest, 8.75%
Scrub, 1.28%
Non-forest, 77.67%
Forest Cover of India-2011
Page 15
State/
Union Territory Reserved Protected Unclasse
d
Total Area
Under
Sanctione
d Working
Plans
Revenue
Departme
nt
Forests
Corporate
Bodies
Forest/
Community
Ownership
Private
Forest
1 2 3 4 5 6 7 8 9 10
1 A&N Islands
2 Andhra Pradesh 50478.63 12365.34 969.76 63813.73 63813.73 0.00 0.00 0.00
3 Arunachal Pradesh 10537.94 9535.79 31466.27 51540.00 15699.24 0.00 0.00 0.00
4 Assam 13870.00 3925.00 5865.00 23660.00 13870.00 0.00 0.00 0.00
5 Bihar
6 Chandigarh
7 Chhattisgarh 25782.17 24036.10 9954.13 59772.40 0.00 NA NA NA
8 Dadra & Nagar Haveli 198.76 4.82 0.00 203.58 198.76 0.00 0.00 0.00
9 Daman & Diu
10 Delhi
11 Goa
12 Gujarat 14122.20 375.67 4426.65 18924.52 15497.76 NA NA NA
13 Haryana 249.07 1158.17 18.96 1426.20 1463.12 - - 132.75
14 Himachal Pradesh 1896.00 33043.00 2094.00 37033.00 24909.00 NA NA NA
15 Jammu & Kashmir 20194.00 36.00 NA 20230.00 20230.00 NA NA NA
16 Jharkhand
17 Karnataka
18 Kerala
19 Lakshadweep
20 Madhya Pradesh 61886.00 31098.00 1704.00 94689.00 NA NA 0.00 NA
21 Maharashtra 44476.00 7992.00 3459.00 55927.00 50590.00 2449.00 3563.00 NA
22 Manipur
23 Meghalaya 712.74 12.39 399.48 1124.61 0.00 0.00 0.00 0.00
24 Mizoram 1657.28 2126.95 5834.44 9618.67 0.00 0.00 0.00 0.00
25 Nagaland 85.83 513.55 191.62 791.00 0.00 0.00 0.00 7621.07
26 Odisha 26329.12 15525.22 20.55 41874.89 877.81 16261.34 0.00 12.29
27 pondicherry
28 Punjab 436.33 114929.96 19019.03 138285.32 305533.96 0.00 0.00 167320.07
29 Rajasthan 12801.32 17020.94 2805.68 32627.94 4710.18 NA NA NA
30 Sikkim
31 Tamil Nadu
32 Tripura 3588.18 589.23 2116.87 6294.29 1427.83 0.00 0.00 0.00
33 Uttar Pradesh 11609.00 1434.00 3411.00 16454.00 NA - 72.65 14.31
34 Uttaranchal 24261.56 98.61 53.01 24413.19 0.00 4768.70 5449.64 158.69
35 West Bengal 7054.00 3772.00 1053.00 11879.00 395.29 0.00 0.00 0.00
Source : Indian Council of Forestry Research and Education
Note: Blank cell indicates information is not available
Table 3.4.2 : Forest area by ownership(during 2005-06)
(Sq.km)
Sl. No. Forest Department Others
Page 16
(sq.km)State/
Union Territory Chir Deodar Others
Conifers
Sal Teak Mangrov
e
Others
1 2 3 4 5 6 7 8 9 10 11
1A & N Islands
2 Andhra Pradesh 0.00 0.00 0.00 47.16 9145.00 0.00 54621.57 0.0063813.73
3 Arunachal Pradesh 243.00 NA 35.30 0.00 0.00 0.00 47767.00 0.00
51540.00
4 Assam 0.00 0.00 0.00 529.00 0.00 NA NA NA529.00
5 Bihar
6 Chandigarh
7 Chhattisgarh 0.00 0.00 0.00 24244.88 5633.13 0.00 29894.39 0.0059772.40
8
Dadra & Nagar
Haveli 0.00 0.00 0.00 0.00 0.00 0.00 203.58 0.00
203.58
9 Daman & Diu
10 Delhi
11 Goa
12 Gujarat 0.00 0.00 0.00 0.00 0.00 0.00 0.00 0.000.00
13 Haryana
14 Himachal Pradesh 1364.00 1310.00 6328.00 190.00 0.00 0.00 7178.00 20663.00
37033.00
15 Jammu & Kashmir 1825.00 1075.00 5368.00 0.00 0.00 0.00 1885.00 10075.00
20230.00
16 Jharkhand
17 Karnataka
18 Kerala
19 Lakshadweep
20 Madhya Pradesh 0.00 0.00 0.00 NA NA NA NA 0.0094689.00
21 Maharashtra 0.00 0.00 0.00 0.00 10002.00 116.00 45809.00 0.0055927.00
22 Manipur
23 Meghalaya 0.00 0.00 0.00 0.00 0.00 0.00 0.00 0.00
24 Mizoram 0.00 0.00 0.00 0.00 150.00 0.00 3036.75 21.303208.05
25 Nagaland 0.00 0.00 0.00 0.00
26 Odisha 0.00 0.00 0.00 16938.25 2030.64 203.00 38974.72 0.0058146.61
27 Pondicherry
28 Punjab 0.00 0.00 1090.25 0.00 0.00 0.00 3045150.14 305605.00305605.39
29 Rajasthan - - - - 942.24 - 31685.70 -32627.94
30 Sikkim
31 Tamil Nadu
32 Tripura 0.00 0.00 0.00 271.90 1567.51 0.00 4454.80 0.006294.29
33 Uttar Pradesh - - - 173764.00 25967.00 - 1116698.00 -1645406.00
34 Uttaranchal 3993.30 192.65 1205.87 3151.13 200.93 0.00 3420.24 12249.0724413.19
35 West Bengal - - 89.00 - - 1909.00 - 9881.0011879.00
Table 3.4.3 presents the State/ UT wise details of forest area by composition (Coniferous forest, non- coniferous forest, mixed).
Source : Indian Council of Forestry Research and Education
Note: Blank cell indicates information is not available
Nonresponding States A & N Island, Assam, Bihar, Delhi, Manipur, Mizoram and Nagaland.
Table 3.4.2 : Forest area by ownership (during 2005-06)
Coniferous
& Non-
coniferus
TotalSl. No. Coniferous forest Non-coniferous Forest
Page 17
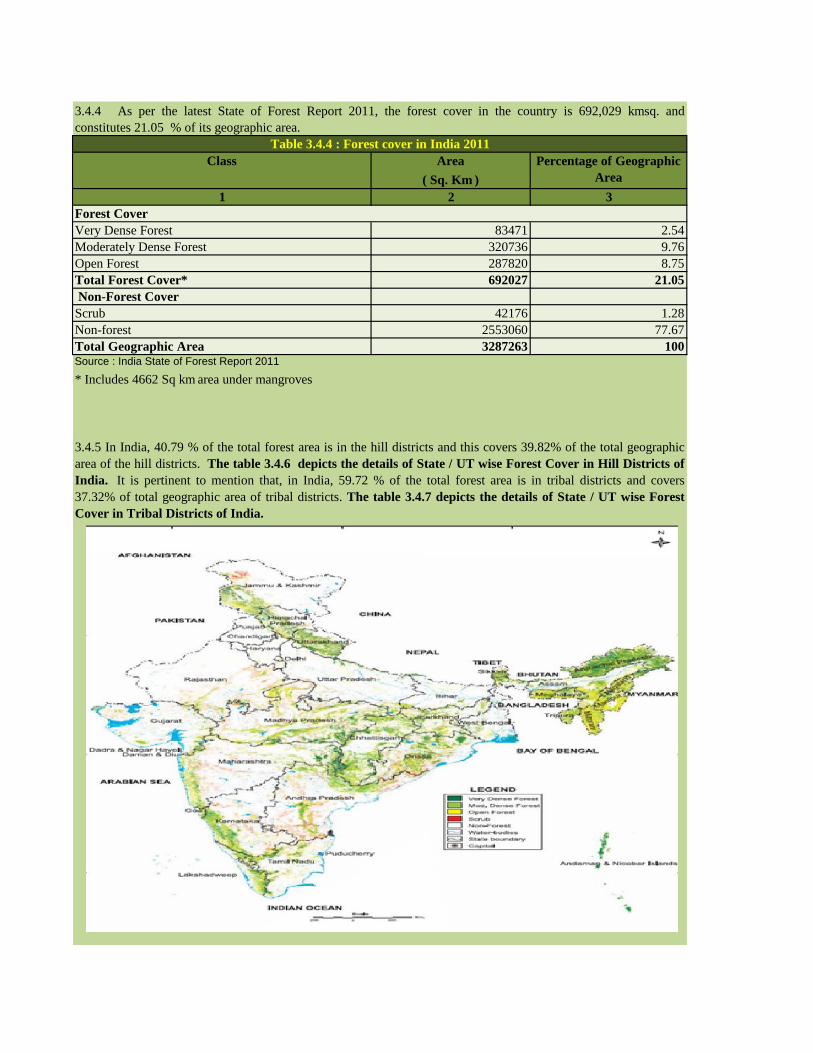
Class Area
( Sq. Km )
Percentage of Geographic
Area
1 2 3
Very Dense Forest 83471 2.54
Moderately Dense Forest 320736 9.76
Open Forest 287820 8.75
Total Forest Cover* 692027 21.05
Non-Forest Cover
Scrub 42176 1.28
Non-forest 2553060 77.67
Total Geographic Area 3287263 100Source : India State of Forest Report 2011
* Includes 4662 Sq km area under mangroves
3.4.4 As per the latest State of Forest Report 2011, the forest cover in the country is 692,029 kmsq. and
constitutes 21.05 % of its geographic area.
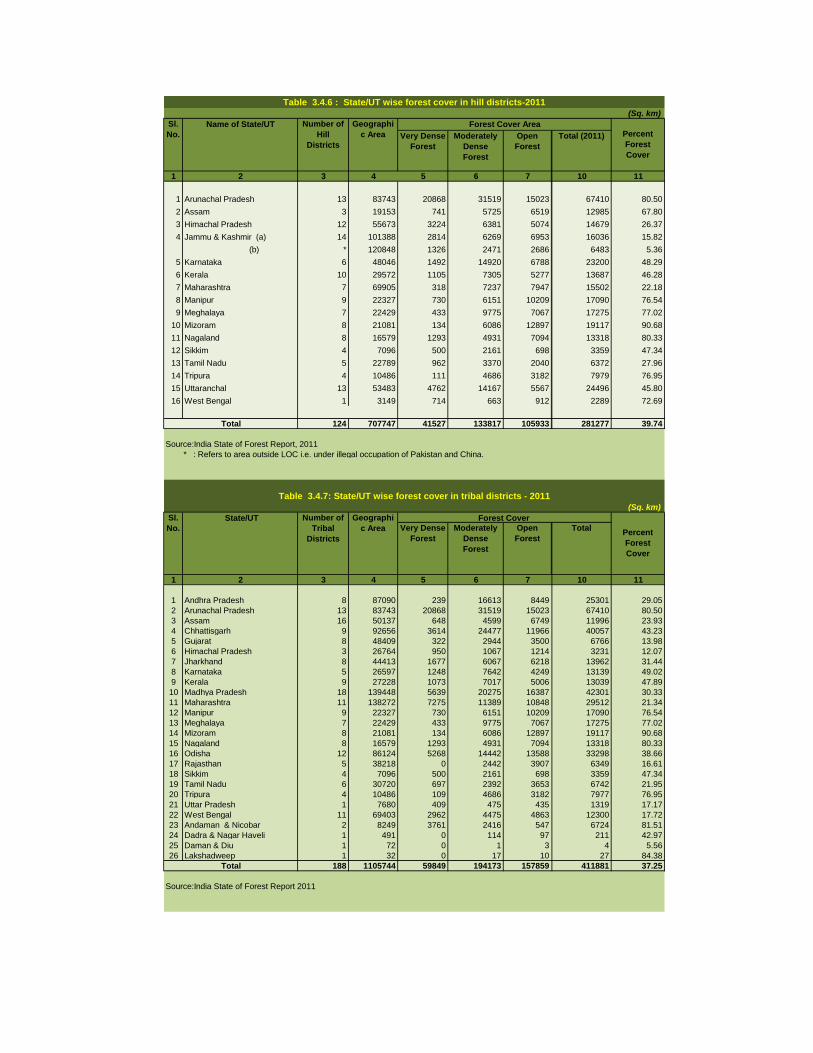
3.4.5 In India, 40.79 % of the total forest area is in the hill districts and this covers 39.82% of the total geographic
area of the hill districts. The table 3.4.6 depicts the details of State / UT wise Forest Cover in Hill Districts of
India. It is pertinent to mention that, in India, 59.72 % of the total forest area is in tribal districts and covers
37.32% of total geographic area of tribal districts. The table 3.4.7 depicts the details of State / UT wise Forest
Cover in Tribal Districts of India.
Table 3.4.4 : Forest cover in India 2011
Forest Cover
Page 18
Very
Dense
Forest
Moderate
Dense
Forest
Open
Forest
Total
Forest
1 2 3 4 5 6 7 8
1 Andhra Pradesh 275069 850 26242 19297 46389 16.86 10372
2 Arunachal Pradesh 83743 20868 31519 15023 67410 80.50 111
3 Assam 78438 1444 11404 14825 27673 35.28 179
4 Bihar 94163 231 3280 3334 6845 7.27 134
5 Chhattisgarh 135191 4163 34911 16600 55674 41.18 107
6 Delhi 1483 7 50 120 177 11.94 1
7 Goa 3702 543 585 1091 2219 59.94 1
8 Gujarat 196022 376 5231 9012 14619 7.46 1463
9 Haryana 44212 27 457 1124 1608 3.64 145
10 Himachal Pradesh 55673 3224 6381 5074 14679 26.37 327
11 Jammu & Kashmir 222236 4140 8760 9639 22539 10.14 2036
12 Jharkhand 79714 2590 9917 10470 22977 28.82 683
13 Karnataka 191791 1777 20179 14238 36194 18.87 3176
14 Kerala 38863 1442 9394 6464 17300 44.52 58
15 Madhya Pradesh 308245 6640 34986 36074 77700 25.21 6401
16 Maharashtra 307713 8736 20815 21095 50646 16.46 4157
17 Manipur 22327 730 6151 10209 17090 76.54 1
18 Meghalaya 22429 433 9775 7067 17275 77.02 211
19 Mizoram 21081 134 6086 12897 19117 90.68 1
20 Nagaland 16579 1293 4931 7094 13318 80.33 2
21 Odisha 155707 7060 21366 20477 48903 31.41 4852
22 Punjab 50362 0 736 1028 1764 3.50 20
23 Rajasthan 342239 72 4448 11567 16087 4.70 4347
24 Sikkim 7096 500 2161 698 3359 47.34 356
25 Tamil Nadu 130058 2948 10321 10356 23625 18.16 1206
26 Tripura 10486 109 4686 3182 7977 76.07 75
27 Uttar Pradesh 240928 1626 4559 8153 14338 5.95 745
28 Uttarakhand 53483 4762 14167 5567 24496 45.80 271
29 West Bengal 88752 2984 4646 5365 12995 14.64 29
30 A. & N. Islands 8249 3761 2416 547 6724 81.51 53
31 Chandigarh 114 1 10 6 17 14.91 1
32 Dadra & Nagar Haveli 491 0 114 97 211 42.97 1
33 Daman & Diu 112 0 1 6 7 6.25 3
34 Lakshadweep 32 0 17 10 27 84.38 0
35 Puducherry 480 0 35 15 50 10.42 0
3287263 83471 320737 287821 692029 21.05 41525
Source:India State of Forest Report 2011
State/UTSl.
No.
Geographic
Area
Forest Cover Area Percent
of G.A.
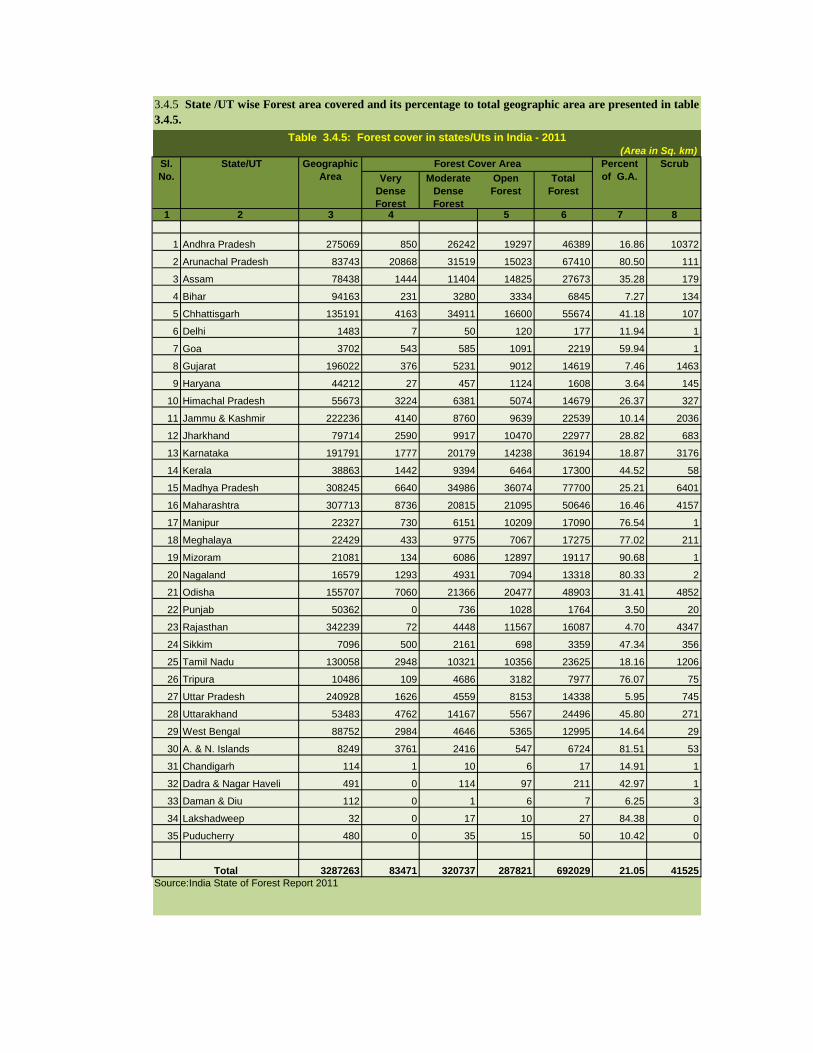
3.4.5 State /UT wise Forest area covered and its percentage to total geographic area are presented in table
3.4.5.
Scrub
Total
(Area in Sq. km)
Table 3.4.5: Forest cover in states/Uts in India - 2011
Page 19
(Sq. km)
Very Dense
Forest
Moderately
Dense
Forest
Open
Forest
P
e
r
c
Total (2011)
1 2 3 4 5 6 7 10 11
1 Arunachal Pradesh 13 83743 20868 31519 15023 67410 80.50
2 Assam 3 19153 741 5725 6519 12985 67.80
3 Himachal Pradesh 12 55673 3224 6381 5074 14679 26.37
4 Jammu & Kashmir (a) 14 101388 2814 6269 6953 16036 15.82
(b) * 120848 1326 2471 2686 6483 5.36
5 Karnataka 6 48046 1492 14920 6788 23200 48.29
6 Kerala 10 29572 1105 7305 5277 13687 46.28
7 Maharashtra 7 69905 318 7237 7947 15502 22.18
8 Manipur 9 22327 730 6151 10209 17090 76.54
9 Meghalaya 7 22429 433 9775 7067 17275 77.02
10 Mizoram 8 21081 134 6086 12897 19117 90.68
11 Nagaland 8 16579 1293 4931 7094 13318 80.33
12 Sikkim 4 7096 500 2161 698 3359 47.34
13 Tamil Nadu 5 22789 962 3370 2040 6372 27.96
14 Tripura 4 10486 111 4686 3182 7979 76.95
15 Uttaranchal 13 53483 4762 14167 5567 24496 45.80
16 West Bengal 1 3149 714 663 912 2289 72.69
124 707747 41527 133817 105933 281277 39.74
Source:India State of Forest Report, 2011
* : Refers to area outside LOC i.e. under illegal occupation of Pakistan and China.
Very Dense
Forest
Moderately
Dense
Forest
Open
Forest
P
e
r
c
e
Total
1 2 3 4 5 6 7 10 11
1 Andhra Pradesh 8 87090 239 16613 8449 25301 29.05
2 Arunachal Pradesh 13 83743 20868 31519 15023 67410 80.50
3 Assam 16 50137 648 4599 6749 11996 23.93
4 Chhattisgarh 9 92656 3614 24477 11966 40057 43.23
5 Gujarat 8 48409 322 2944 3500 6766 13.98
6 Himachal Pradesh 3 26764 950 1067 1214 3231 12.07
7 Jharkhand 8 44413 1677 6067 6218 13962 31.44
8 Karnataka 5 26597 1248 7642 4249 13139 49.02
9 Kerala 9 27228 1073 7017 5006 13039 47.89
10 Madhya Pradesh 18 139448 5639 20275 16387 42301 30.33
11 Maharashtra 11 138272 7275 11389 10848 29512 21.34
12 Manipur 9 22327 730 6151 10209 17090 76.54
13 Meghalaya 7 22429 433 9775 7067 17275 77.02
14 Mizoram 8 21081 134 6086 12897 19117 90.68
15 Nagaland 8 16579 1293 4931 7094 13318 80.33
16 Odisha 12 86124 5268 14442 13588 33298 38.66
17 Rajasthan 5 38218 0 2442 3907 6349 16.61
18 Sikkim 4 7096 500 2161 698 3359 47.34
19 Tamil Nadu 6 30720 697 2392 3653 6742 21.95
20 Tripura 4 10486 109 4686 3182 7977 76.95
21 Uttar Pradesh 1 7680 409 475 435 1319 17.17
22 West Bengal 11 69403 2962 4475 4863 12300 17.72
23 Andaman & Nicobar 2 8249 3761 2416 547 6724 81.51
24 Dadra & Nagar Haveli 1 491 0 114 97 211 42.97
25 Daman & Diu 1 72 0 1 3 4 5.56
26 Lakshadweep 1 32 0 17 10 27 84.38
188 1105744 59849 194173 157859 411881 37.25
Table 3.4.6 : State/UT wise forest cover in hill districts-2011
Total
Source:India State of Forest Report 2011
(Sq. km)
Sl.
No.
State/UT Number of
Tribal
Districts
Geographi
c Area
Forest Cover
Percent
Forest
Cover
Table 3.4.7: State/UT wise forest cover in tribal districts - 2011
Percent
Forest
Cover
Total
Geographi
c Area
Sl.
No.
Name of State/UT Number of
Hill
Districts
Forest Cover Area
Page 20
1987 1988 1989 1991 1995 1997 1999 2001 2003 2005 2007 2009 2011
1 2 3 4 5 6 7 8 9 10 11 12 13 14 15
1 Andhra Pradesh 63771 63771 63771 63726 63814 63814 63814 63814 63821 63821 63814 63814 63814
2 Arunachal Pradesh 51540 51540 51540 51540 51540 51540 51540 51540 51540 51540 51540 51540 51540
3 Assam 30708 30708 30708 30708 30708 30708 30708 27018 27018 26832 26832 26832 26832
4 Bihar 29230 29230 29230 29226 29226 29226 29226 6078 6473 6473 6473 6473 6473
5 Chhattisgarh 59285 59772 59772 59772 59772 59772
6 Delhi 42 42 42 42 42 85 85 85 85 85 85 85
7 Goa 1053 1053 1053 1256 1424 1424 1424 1224 1224 1224 1224 1224 1224
8 Gujarat 18777 18777 18777 19388 19393 19393 19393 18999 19113 18962 18927 18927 18927
9 Haryana 1685 1685 1685 1687 1673 1673 1673 1551 1558 1559 1559 1559 1559
10 Himachal Pradesh 21325 21325 21325 37591 35407 35407 35407 37033 37033 37033 37033 37033 37033
11 Jammu & Kashmir 20892 20892 20892 20174 20182 20182 20182 20230 20230 20230 20230 20230 20230
12 Jharkhand 23605 23605 23605 23605 23605 23605
13 Karnataka 38644 38644 38644 38646 38724 38724 38724 38724 43084 38284 38284 38284 38284
14 Kerala 11222 11222 11222 11222 11221 11221 11221 11221 11268 11265 11265 11265 11265
15 Madhya Pradesh 155414 155414 155414 155414 154497 154497 154497 95221 95221 94689 94689 94689 94689
16 Maharashtra 64055 64055 64055 63861 63842 63842 63842 61939 61939 61939 61939 61939 61939
17 Manipur 15155 15155 15155 15154 15154 15154 15154 17418 17418 17418 17418 17418 17418
18 Meghalaya 8514 8514 8514 9496 9496 9496 9496 9496 9496 9496 9496 9496 9496
19 Mizoram 15935 15935 15935 15935 15935 15935 15935 15935 16717 16717 16717 16717 16717
20 Nagaland 8625 8625 8625 8625 8629 8629 8629 8629 8629 9222 9222 9222 9222
21 Odisha 59555 59555 59555 59555 57184 57184 57184 58135 58136 58136 58136 58136 58136
22 Punjab 2803 2803 2803 2842 2901 2901 2901 3059 3084 3084 3084 3058 3084
23 Rajasthan 31151 31151 31151 31559 31700 31700 31700 32494 32488 32488 32639 32639 32639
24 Sikkim 2650 2650 2650 2650 2650 2650 2650 5765 5841 5841 5841 5841 5841
25 Tamil Nadu 22319 22319 22319 22699 22628 22628 22628 22871 22877 22877 22877 22877 22877
26 Tripura 6280 6280 6280 6292 6293 6293 6293 6293 6293 6294 6294 6294 6294
27 Uttar Pradesh 51269 51269 51269 51502 51663 51663 51663 16826 16826 16796 16583 16583 16583
28 Uttarakhand 34662 34662 34651 34651 34651 34651
29 West Bengal 11879 11879 11879 11879 11879 11879 11879 11879 11879 11879 11879 11879 11879
30 A & N Islands 7144 7144 7144 7171 7171 7171 7171 7171 7171 7171 7171 7171 7171
31 Chandigarh 6 6 6 31 31 31 31 32 34 33 34 34 34
32 Dadra and Nagar Haveli 203 203 203 207 203 203 203 203 204 204 204 204 204
33 Daman & Diu * * * * * NA 0.7 1 1 6 8 8 8
34 Lakshadweep nil nil nil nil nil NA 0 0 0 0 0 0 0
35 Puducherry nil nil nil nil nil NA 0 0 0 0 13 13 13
751846 751346 751846 770078 765210 765210 765253 768436 774740 769626 769538 769512 769538
* Included in Goa
Sl.
No.
State/UT Total Forest Area in Sq.Km
Total
Source: Ministry of Environment & Forests
Table 3.4.8 : State/UT wise forest area (1987-2011)
Page 21
Very
Dense
Forest
Mod.
Dense
Forest
Open
Forest
Total
Forest
Very
Dense
Forest
Mod.
Dense
Forest
Open
Forest
Total
ForestVDF MDF Open Total
1 2 3 4 5 6 7 8 9 10 11 12 13 14
Andhra Pradesh 275069 850 26377 19443 46670 850 26242 19297 46389 0 -135 -146 -281
Arunachal Pradesh 83743 20873 31574 15037 67484 20868 31519 15023 67410 -5 -55 -14 -74
Assam 78438 1461 11558 14673 27692 1444 11404 14825 27673 -17 -154 152 -19
Bihar 94163 231 3248 3325 6804 231 3280 3334 6845 0 32 9 41
Chattisgarh 135191 4163 34911 16604 55678 4163 34911 16600 55674 0 0 -4 -4
Delhi 1483 6.76 49.84 119.98 176.58 6.76 49.48 119.96 176.2 0 -0.4 0 0
Goa 3702 543 578 1091 2212 543 585 1091 2219 0 7 0 7
Gujarat 196022 376 5249 8995 14620 376 5231 9012 14619 0 -18 17 -1
Haryana 44212 27 463 1104 1594 27 457 1124 1608 0 -6 20 14
Himachal Pradesh 55673 3224 6383 5061 14668 3224 6381 5074 14679 0 -2 13 11
Jammu & Kashmir 222236 4140 8760 9637 22537 4140 8760 9639 22539 0 0 2 2
Jharkhand 79714 2590 9899 10405 22894 2590 9917 10470 22977 0 18 65 83
Karnataka 191791 1777 20181 14232 36190 1777 20179 14238 36194 0 -2 6 4
Kerala 38863 1443 9410 6471 17324 1442 9394 6464 17300 -1 -16 -7 -24
Madhya Pradesh 308245 6647 35007 36046 77700 6640 34986 36074 77700 -7 -21 28 0
Maharashtra 307713 8739 20834 21077 50650 8736 20815 21095 50646 -3 -19 18 -4
Manipur 22327 701 5474 11105 17280 730 6151 10209 17090 29 677 -896 -190
Meghalaya 22429 410 9501 7410 17321 433 9775 7067 17275 23 274 -343 -46
Mizoram 21081 134 6149 12900 19183 134 6086 12897 19117 0 -63 -3 -66
Nagaland 16579 1274 4897 7293 13464 1293 4931 7094 13318 19 34 -199 -146
Orissa 155707 7073 21394 20388 48855 7060 21366 20477 48903 -13 -28 89 48
Punjab 50362 0 733 931 1664 0 736 1028 1764 0 3 97 100
Rajasthan 342239 72 4450 11514 16036 72 4448 11567 16087 0 -2 53 51
Sikkim 7096 500 2161 698 3359 500 2161 698 3359 0 0 0 0
Tamil Nadu 130058 2926 10343 10282 23551 2948 10321 10356 23625 22 -22 74 74
Tripura 10486 109 4702 3174 7985 109 4686 3182 7977 0 -16 8 -8
Uttar Pradesh 240928 1626 4563 8152 12341 1626 4559 8153 14338 0 -4 1 -3
Uttarakhand 53483 4762 14165 5568 24495 4762 14167 5567 24496 0 2 -1 1
West Bengal 88752 2987 4644 5363 12994 2984 4686 5365 12995 -3 2 2 1
A & N Islands 8249 3762 2405 495 6662 3761 2416 547 6724 -1 11 52 62
Chandigarh 114 1 10 6 17 1.35 9.55 5.88 16.78 0.35 -0.4 -0.1 -0.22
Dadra and Nagar Haveli 491 0 114 97 211 0 114 97 211 0 0 0 0
Daman and DIU 112 0 0.62 5.03 5.65 0 0.62 5.53 6.15 0 0 0.5 0.5
Lakshwadeep 32 0 16.71 9.77 26.48 0 17.18 9.88 27.06 0 0.47 0.11 0.58
Puducharry 480 0 34.1 15.87 49.77 0 35.37 14.69 50.06 0 1.27 -1.2 0.09
India 3287263 83428 320238 288728 692394 83471 320736 287820 692027 43 498 -908 -367
Source: India State of Forest Report 2011
3.5.1 Multi-pronged pressures on forests come from population, cattle grazing, fuel and fodder collection, industry and forest fires, etc.
The changes forest cover between 2009-2011 state wise is given in table 3.5.1.
3.5 Changes in coverage of Forests, Trees and Mangroves
State/UT
Table3.5.1 : Change in forest cover of states/UTs between 2009 and 2011
20112009Geographi
cal Area
Change
Page 22
2011 2007 1995-97 2001 2003 2005 2007 2011
1 2 3 4 5 6 7 8 9 10 11
1 Arunachal Pradesh 67410 67353 - 19 245 913 -2068 -220 -119 -74
2 Assam 27673 27692 - 237 - 136 1602 2445 23 -66 -19
3 Manipur 17090 17280 - 140 - 34 505 -630 -307 328 -190
4 Meghalaya 17275 17321 - 57 - 24 902 390 280 116 -46
5 Mizoram 19117 19240 199 - 437 -1941 2186 17 640 -66
6 Nagaland 13318 13464 - 70 - 57 -184 35 -350 -201 -146
7 Sikkim 3359 0
8 Tripura 7977 8073 8 199 3124 -746 50 -100 -8
173219 170423 - 316 - 244 4921 1612 -507 598 -549
Source :India State of Forest Report, 2011
Note: Column 6 to 10 indicates change in the forest cover with respect to previous assesment year
(eg. Year X1 - X2 means Area in Year X2 - Area in Year X1)
States/Uts Change in Forest Cover over assessment years
Total
Sl.
No.
Forest Cover Assessment
3.5.2 A significant decrease in the forest cover is reported from Andhra Pradesh, Arunachal Pradesh, Assam, Chhatisgarh, Nagaland and
Tripura whereas the states of Jharkhand, Manipur, Meghalaya, Mizoram and Orissa have shown a significant increase in forest cover.
Table 3.5.2: Changes in forest cover of the north-eastern region
1997-99
The table 3.5.2 exhibits the Changes in forest cover of the north-eastern region
Page 23
Area (Km2) % of Geog. Area
1 2 3 5 6
1 Andhra Pradesh 275069 7152 2.60
2 Arunachal Pradesh 83743 549 0.66
3 Assam 78438 1564 1.99
4 Bihar 94163 2369 2.52
5 Chhattisgarh 135191 3866 2.86
6 Delhi 1483 120 8.09
7 Goa 3702 286 7.73
8 Gujarat 196022 7837 4.00
9 Haryana 44212 1395 3.16
10 Himachal Pradesh 55673 623 1.12
11 Jammu & Kashmir 222236 6550 2.95
12 Jharkhand 79714 2914 3.66
13 Karnataka 191791 5733 2.99
14 Kerala 38863 2755 7.09
15 Madhya Pradesh 308245 7090 2.30
16 Maharashtra 307713 9079 2.95
17 Manipur 22327 193 0.86
18 Meghalaya 22429 578 2.58
19 Mizoram 21081 190 0.90
20 Nagaland 16579 322 1.94
21 Odisha 155707 4301 2.76
22 Punjab 50362 1699 3.37
23 Rajasthan 342239 8272 2.42
24 Sikkim 7096 25 0.35
25 Tamil Nadu 130058 4718 3.63
26 Tripura 10486 184 1.75
27 Uttar Pradesh 240928 7382 3.06
28 Uttarakhand 53483 642 1.20
29 West Bengal 88752 2335 2.63
30 A. & N. Islands 8249 39 0.47
31 Chandigarh 114 10 8.77
32 Dadra & Nagar Haveli 491 29 5.91
33 Daman & Diu 112 9 8.04
34 Lakshadweep 32 5 15.63
35 Puducherry 480 31 6.46
3287263 90844 2.76Total
Tree Cover
3.5.3 It is very important to examine the details of changes in forest cover of the north eastern region
of forest cover to total forest cover of the Country. The share of north-eastern region is only 7.98% of
the geographical area of the country, but, it accounts for nearly one- fourth of its forest cover. The
region has been identified as one of the 18 biodiversity hot-spots of the world.
Table 3.5.3: State/UT wise tree cover estimates
Sl. No. State/UT Geographic
Area (Km2)
Source :India State of Forest Report, 2011
Page 24
Area (Sq Km) % of Geog. Area Area (Sq Km) % of Geog. Area
1 2 3 4 5 6 7
1 Western Himalayas 329255 8091 2.46 7859 2.39
2 Eastern Himalayas 74618 324 0.43 356 0.48
3 North East 133990 2243 1.67 2275 1.70
4 Northern Plains 295780 9473 3.20 9366 3.17
5 Eastern Plains 223339 5444 2.44 5168 2.31
6 Western Plains 319098 7497 2.35 7038 2.21
7 Central Highlands 373675 9150 2.45 9886 2.65
8 North Deccan 355988 7559 2.12 7007 1.97
9 East Deccan 336289 11157 3.32 10718 3.19
10 South Deccan 292416 8002 2.74 8012 2.74
11 Western Ghats 72381 3847 5.31 4083 5.64
12 Eastern Ghats 191698 4051 2.11 4420 2.31
13 West Coast 121242 9427 7.78 8863 7.31
14 East Coast 167494 6504 3.88 5791 3.46
3287263 92769 2.82 90844 2.76
Source : India State of Forest Report-2011
Sl.
No.
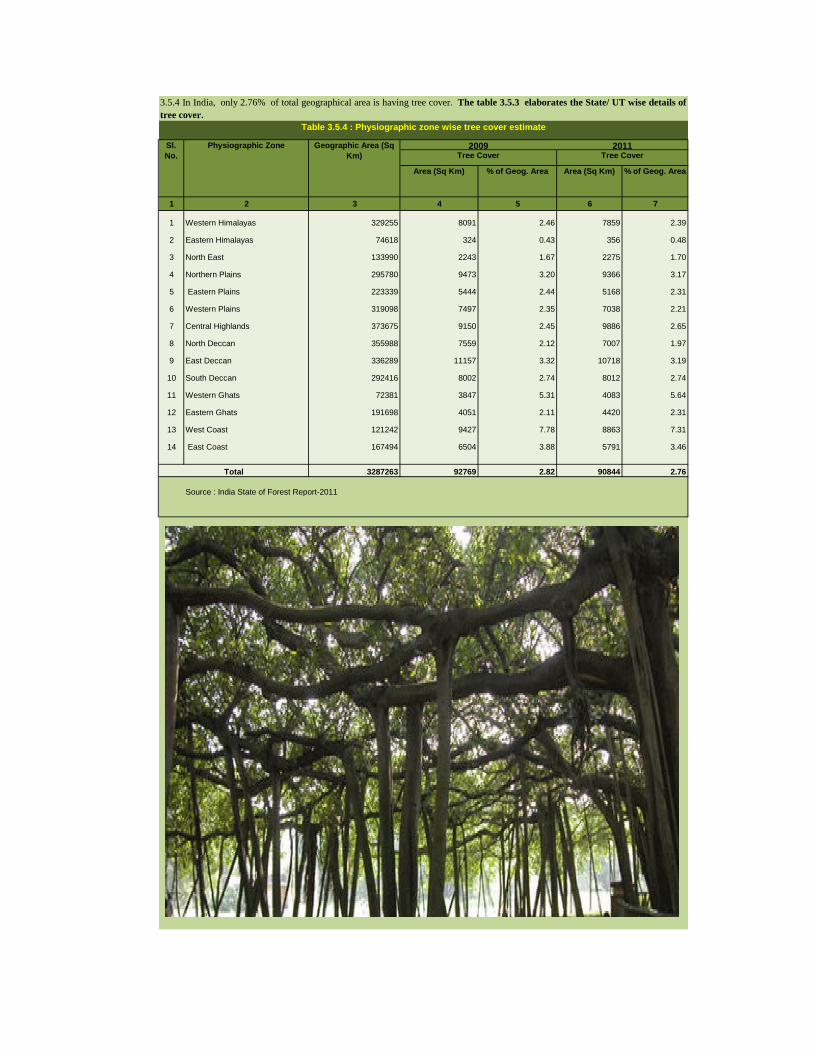
3.5.4 In India, only 2.76% of total geographical area is having tree cover. The table 3.5.3 elaborates the State/ UT wise details of
tree cover.
Table 3.5.4 : Physiographic zone wise tree cover estimate
Total
Tree CoverTree Cover20112009Geographic Area (Sq
Km)
Physiographic Zone
Page 25
In Forest In Tree
Outside
Forest*
Total
1 2 3 4 5 6 7
1 W. Himalayas 329255 91073 1021.94 191.23 1213.03
2 E. Himalayas 74618 47965 473.2 67.11 542.55
3 North East Ranges 133990 79431 341.14 93.67 443.99
4 Northern Plains 295780 13992 142.6 101.96 246.87
5 Eastern Plains 223339 31709 240.53 102.36 337.96
6 Western Plains 319098 13694 7.93 66.10 82.29
7 Central Highlands 373675 80788 109.37 108.52 220.23
8 North Deccan 355988 87260 281.07 83.00 364.54
9 East Deccan 336289 128757 622.18 191.49 820.92
10 South Deccan 292416 49451 224.42 127.59 358.70
11 Western Ghats 72381 32399 461.78 117.47 580.46
12 Eastern Ghats 191698 74418 360.65 67.73 435.91
13 West Coast 121242 20736 106.21 141.98 254.08
14 East Coast 167494 17839 105.63 88.21 196.69
3287263 769512 4498.65 1548.42 6098.22
Source :India State of Forest Report, 2009
3.5.5 The Country has been stratified into 14 physiographic zones. Among them, the zones with
highest tree cover to its total geographic area are West Coast (7.31%) followed by Western
Ghats (5.64%). The zone wise details are shown in the table 3.5.4.
The table 3.5.5 presents the details of growing stock according to physiographic zones.
Table 3.5.5: Physiographic zone wise growing stock
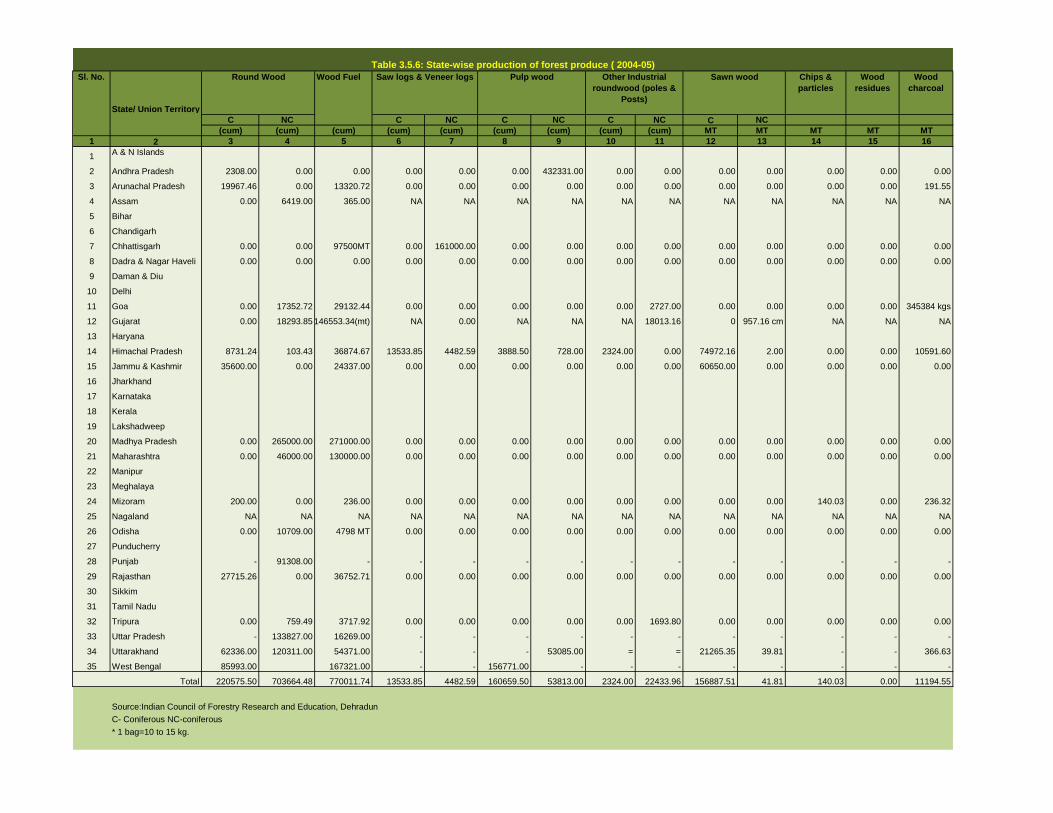
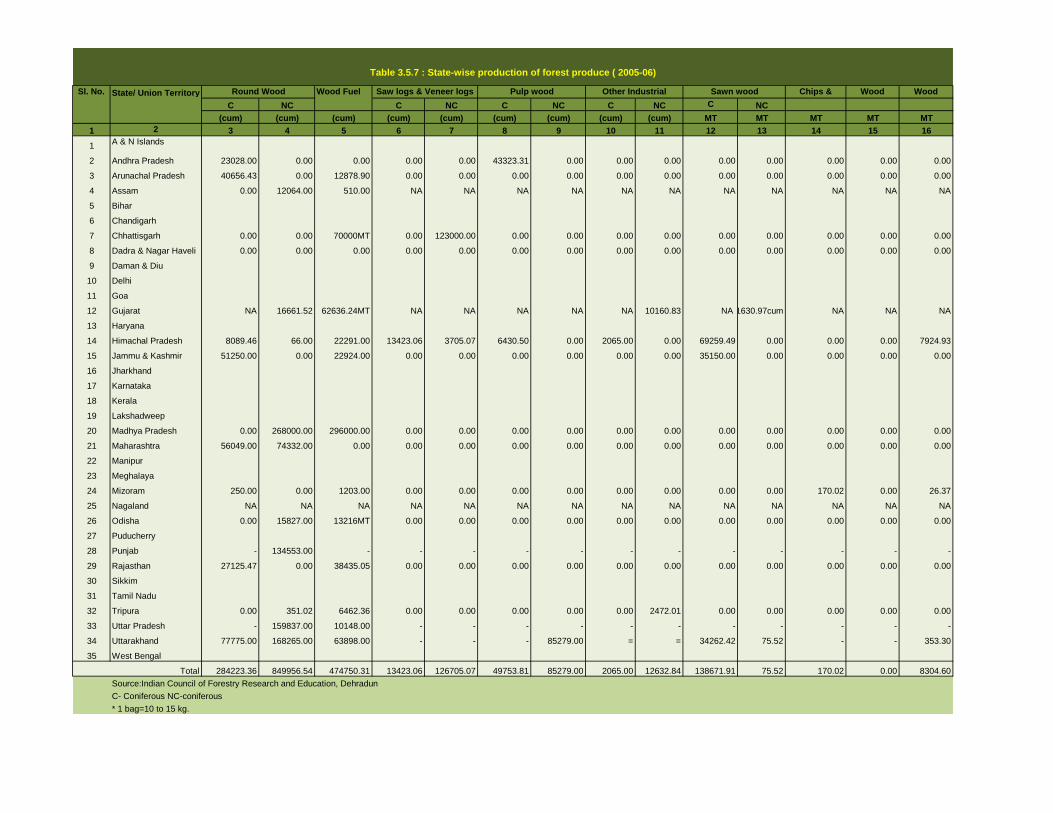
3.5.6 The Forest Produce also has some role in the degradation of forests. Forest produce is defined
under section 2(4) of the Indian Forest Act, 1927. Its legal definition includes timber, charcoal, wood-
oil, resin, natural varnish, bark, lac, myrobalans, mahua flowers (whether found inside or brought from
a forest or not), trees and leaves, flowers and fruit, plants (including grass, creepers, reeds and moss),
wild animals, skins, tusks, horns, bones, cocoons, silk, honey, wax, other parts or produce of animals,
and also includes peat, surface soil, rocks and minerals etc. when found inside or brought from a forest,
among other things. Forest produce can be divided into several categories. From the point of view of
usage, forest produce can be categorized into three types: Timber, Non Timber and Minor Minerals.
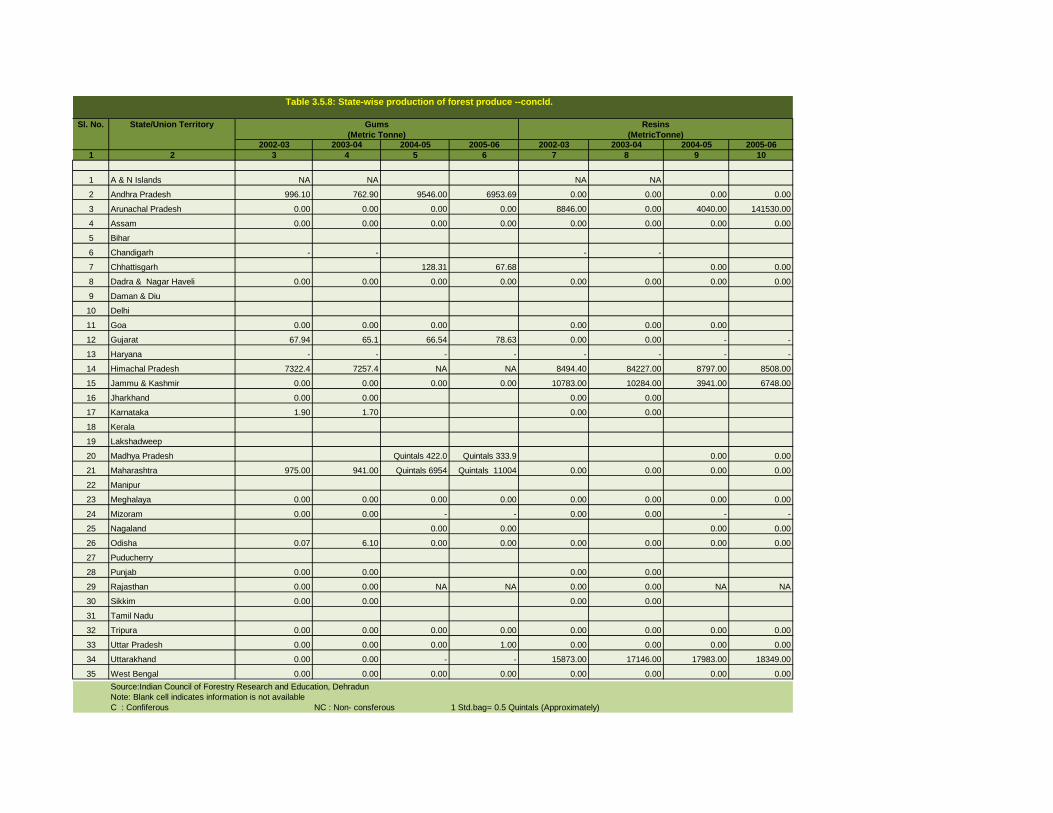
The tables 3.5.6 to 3.5.8 at presents the details of State wise Production of forest produce.
Total
Sl.
No.
Physiographic Zone Area of
Phy.Zone
(Km2)
Recorded
Forest Area
(Km2)
Growing Stock (volume in million Cum)
Page 26
State/ Union Territory
Chips &
particles
Wood
residues
Wood
charcoal
C NC C NC C NC C NC C NC
(cum) (cum) (cum) (cum) (cum) (cum) (cum) (cum) (cum) MT MT MT MT MT
1 2 3 4 5 6 7 8 9 10 11 12 13 14 15 16
1A & N Islands
2 Andhra Pradesh 2308.00 0.00 0.00 0.00 0.00 0.00 432331.00 0.00 0.00 0.00 0.00 0.00 0.00 0.00
3 Arunachal Pradesh 19967.46 0.00 13320.72 0.00 0.00 0.00 0.00 0.00 0.00 0.00 0.00 0.00 0.00 191.55
4 Assam 0.00 6419.00 365.00 NA NA NA NA NA NA NA NA NA NA NA
5 Bihar
6 Chandigarh
7 Chhattisgarh 0.00 0.00 97500MT 0.00 161000.00 0.00 0.00 0.00 0.00 0.00 0.00 0.00 0.00 0.00
8 Dadra & Nagar Haveli 0.00 0.00 0.00 0.00 0.00 0.00 0.00 0.00 0.00 0.00 0.00 0.00 0.00 0.00
9 Daman & Diu
10 Delhi
11 Goa 0.00 17352.72 29132.44 0.00 0.00 0.00 0.00 0.00 2727.00 0.00 0.00 0.00 0.00 345384 kgs
12 Gujarat 0.00 18293.85 146553.34(mt) NA 0.00 NA NA NA 18013.16 0 957.16 cm NA NA NA
13 Haryana
14 Himachal Pradesh 8731.24 103.43 36874.67 13533.85 4482.59 3888.50 728.00 2324.00 0.00 74972.16 2.00 0.00 0.00 10591.60
15 Jammu & Kashmir 35600.00 0.00 24337.00 0.00 0.00 0.00 0.00 0.00 0.00 60650.00 0.00 0.00 0.00 0.00
16 Jharkhand
17 Karnataka
18 Kerala
19 Lakshadweep
20 Madhya Pradesh 0.00 265000.00 271000.00 0.00 0.00 0.00 0.00 0.00 0.00 0.00 0.00 0.00 0.00 0.00
21 Maharashtra 0.00 46000.00 130000.00 0.00 0.00 0.00 0.00 0.00 0.00 0.00 0.00 0.00 0.00 0.00
22 Manipur
23 Meghalaya
24 Mizoram 200.00 0.00 236.00 0.00 0.00 0.00 0.00 0.00 0.00 0.00 0.00 140.03 0.00 236.32
25 Nagaland NA NA NA NA NA NA NA NA NA NA NA NA NA NA
26 Odisha 0.00 10709.00 4798 MT 0.00 0.00 0.00 0.00 0.00 0.00 0.00 0.00 0.00 0.00 0.00
27 Punducherry
28 Punjab - 91308.00 - - - - - - - - - - - -
29 Rajasthan 27715.26 0.00 36752.71 0.00 0.00 0.00 0.00 0.00 0.00 0.00 0.00 0.00 0.00 0.00
30 Sikkim
31 Tamil Nadu
32 Tripura 0.00 759.49 3717.92 0.00 0.00 0.00 0.00 0.00 1693.80 0.00 0.00 0.00 0.00 0.00
33 Uttar Pradesh - 133827.00 16269.00 - - - - - - - - - - -
34 Uttarakhand 62336.00 120311.00 54371.00 - - - 53085.00 = = 21265.35 39.81 - - 366.63
35 West Bengal 85993.00 167321.00 - - 156771.00 - - - - - - - -
Total 220575.50 703664.48 770011.74 13533.85 4482.59 160659.50 53813.00 2324.00 22433.96 156887.51 41.81 140.03 0.00 11194.55
Source:Indian Council of Forestry Research and Education, Dehradun
C- Coniferous NC-coniferous
* 1 bag=10 to 15 kg.
Round Wood Wood Fuel
Table 3.5.6: State-wise production of forest produce ( 2004-05)
Saw logs & Veneer logs Pulp wood Other Industrial
roundwood (poles &
Posts)
Sawn woodSl. No.
Page 27
State/ Union Territory Chips &
particles
Wood
residues
Wood
charcoalC NC C NC C NC C NC C NC
(cum) (cum) (cum) (cum) (cum) (cum) (cum) (cum) (cum) MT MT MT MT MT
1 2 3 4 5 6 7 8 9 10 11 12 13 14 15 16
1A & N Islands
2 Andhra Pradesh 23028.00 0.00 0.00 0.00 0.00 43323.31 0.00 0.00 0.00 0.00 0.00 0.00 0.00 0.00
3 Arunachal Pradesh 40656.43 0.00 12878.90 0.00 0.00 0.00 0.00 0.00 0.00 0.00 0.00 0.00 0.00 0.00
4 Assam 0.00 12064.00 510.00 NA NA NA NA NA NA NA NA NA NA NA
5 Bihar
6 Chandigarh
7 Chhattisgarh 0.00 0.00 70000MT 0.00 123000.00 0.00 0.00 0.00 0.00 0.00 0.00 0.00 0.00 0.00
8 Dadra & Nagar Haveli 0.00 0.00 0.00 0.00 0.00 0.00 0.00 0.00 0.00 0.00 0.00 0.00 0.00 0.00
9 Daman & Diu
10 Delhi
11 Goa
12 Gujarat NA 16661.52 62636.24MT NA NA NA NA NA 10160.83 NA 1630.97cum NA NA NA
13 Haryana
14 Himachal Pradesh 8089.46 66.00 22291.00 13423.06 3705.07 6430.50 0.00 2065.00 0.00 69259.49 0.00 0.00 0.00 7924.93
15 Jammu & Kashmir 51250.00 0.00 22924.00 0.00 0.00 0.00 0.00 0.00 0.00 35150.00 0.00 0.00 0.00 0.00
16 Jharkhand
17 Karnataka
18 Kerala
19 Lakshadweep
20 Madhya Pradesh 0.00 268000.00 296000.00 0.00 0.00 0.00 0.00 0.00 0.00 0.00 0.00 0.00 0.00 0.00
21 Maharashtra 56049.00 74332.00 0.00 0.00 0.00 0.00 0.00 0.00 0.00 0.00 0.00 0.00 0.00 0.00
22 Manipur
23 Meghalaya
24 Mizoram 250.00 0.00 1203.00 0.00 0.00 0.00 0.00 0.00 0.00 0.00 0.00 170.02 0.00 26.37
25 Nagaland NA NA NA NA NA NA NA NA NA NA NA NA NA NA
26 Odisha 0.00 15827.00 13216MT 0.00 0.00 0.00 0.00 0.00 0.00 0.00 0.00 0.00 0.00 0.00
27 Puducherry
28 Punjab - 134553.00 - - - - - - - - - - - -
29 Rajasthan 27125.47 0.00 38435.05 0.00 0.00 0.00 0.00 0.00 0.00 0.00 0.00 0.00 0.00 0.00
30 Sikkim
31 Tamil Nadu
32 Tripura 0.00 351.02 6462.36 0.00 0.00 0.00 0.00 0.00 2472.01 0.00 0.00 0.00 0.00 0.00
33 Uttar Pradesh - 159837.00 10148.00 - - - - - - - - - - -
34 Uttarakhand 77775.00 168265.00 63898.00 - - - 85279.00 = = 34262.42 75.52 - - 353.30
35 West Bengal
Total 284223.36 849956.54 474750.31 13423.06 126705.07 49753.81 85279.00 2065.00 12632.84 138671.91 75.52 170.02 0.00 8304.60
Source:Indian Council of Forestry Research and Education, Dehradun
C- Coniferous NC-coniferous
* 1 bag=10 to 15 kg.
Sl. No. Round Wood Wood Fuel
Table 3.5.7 : State-wise production of forest produce ( 2005-06)
Sawn woodSaw logs & Veneer logs Pulp wood Other Industrial
roundwood (poles &
Page 28
2002-03 2003-04 2004-05 2005-06 2002-03 2003-04 2004-05 2005-06
1 2 3 4 5 6 7 8 9 10
1 A & N Islands NA NA NA NA
2 Andhra Pradesh 996.10 762.90 9546.00 6953.69 0.00 0.00 0.00 0.00
3 Arunachal Pradesh 0.00 0.00 0.00 0.00 8846.00 0.00 4040.00 141530.00
4 Assam 0.00 0.00 0.00 0.00 0.00 0.00 0.00 0.00
5 Bihar
6 Chandigarh - - - -
7 Chhattisgarh 128.31 67.68 0.00 0.00
8 Dadra & Nagar Haveli 0.00 0.00 0.00 0.00 0.00 0.00 0.00 0.00
9 Daman & Diu
10 Delhi
11 Goa 0.00 0.00 0.00 0.00 0.00 0.00
12 Gujarat 67.94 65.1 66.54 78.63 0.00 0.00 - -
13 Haryana - - - - - - - -
14 Himachal Pradesh 7322.4 7257.4 NA NA 8494.40 84227.00 8797.00 8508.00
15 Jammu & Kashmir 0.00 0.00 0.00 0.00 10783.00 10284.00 3941.00 6748.00
16 Jharkhand 0.00 0.00 0.00 0.00
17 Karnataka 1.90 1.70 0.00 0.00
18 Kerala
19 Lakshadweep
20 Madhya Pradesh Quintals 422.0 Quintals 333.9 0.00 0.00
21 Maharashtra 975.00 941.00 Quintals 6954 Quintals 11004 0.00 0.00 0.00 0.00
22 Manipur
23 Meghalaya 0.00 0.00 0.00 0.00 0.00 0.00 0.00 0.00
24 Mizoram 0.00 0.00 - - 0.00 0.00 - -
25 Nagaland 0.00 0.00 0.00 0.00
26 Odisha 0.07 6.10 0.00 0.00 0.00 0.00 0.00 0.00
27 Puducherry
28 Punjab 0.00 0.00 0.00 0.00
29 Rajasthan 0.00 0.00 NA NA 0.00 0.00 NA NA
30 Sikkim 0.00 0.00 0.00 0.00
31 Tamil Nadu
32 Tripura 0.00 0.00 0.00 0.00 0.00 0.00 0.00 0.00
33 Uttar Pradesh 0.00 0.00 0.00 1.00 0.00 0.00 0.00 0.00
34 Uttarakhand 0.00 0.00 - - 15873.00 17146.00 17983.00 18349.00
35 West Bengal 0.00 0.00 0.00 0.00 0.00 0.00 0.00 0.00
Source:Indian Council of Forestry Research and Education, Dehradun
Note: Blank cell indicates information is not available
C : Confiferous NC : Non- consferous 1 Std.bag= 0.5 Quintals (Approximately)
(Metric Tonne)
Table 3.5.8: State-wise production of forest produce --concld.
Gums Resins
(MetricTonne)
Sl. No. State/Union Territory
Page 29
Sl No. State/UT
1 2
1 West Bengal Sunderbans.
2 Odisha Bhaitarkanika, Mahandi, Subernarekha, Devi, Dharma,
Mangrove Genetic Resource Centre, Chilka
3 Andhra Pradesh Coringa, East Godavari, Krishna
4 Tamil Nadu Pichavaram, Muthupet, Ramnad, Pulicat, Kazhuveli
5 Andman & Nicobar North Andamans, Nicobar
6 Kerala Vembanad, Kannur
7 Karnataka Coondapur, Dakshin Kannada/Honnavar,
Mangalore Forest Division, Karwar
8 Goa Goa
9 Maharashtra
Malvan
10 Gujarat Gulf of Kutch, Gulf of Khambat, Dumas-Ubhrat
3.5.7 Mangrove cover assessment: Mangroves are various kinds of trees up to medium height and shrubs that
grow in saline coastal sediment habitats. At the intersection of land and sea, mangrove forests support a wealth
of life, from fish to people, and may be more important to the health of the planet than we ever realized.
3.5.8 In India, the major mangrove areas are mainly in 10 State/ UTs of India and their details are given
at table 3.5.9.
Source : Annual Report 2012-13, Ministry of Environment & Forests
Mumbra-Diva, Vikroli, Shreevardhan, Vaitarna, Vasasi-Manori,
Mangrove Areas
3
Table 3.5.9: State-wise list of mangrove areas
Achra-Ratnagiri, Devgarh-Vijay Durg, Veldur, Kundalika-
Revdanda,
Page 30
(Sq. km)
State/UT
1987 1989 1991 1993 1995 1997 1999 2001 2003 2005 2009 2011
1 2 3 4 5 6 7 8 9 10 11 12 13 14
1 Andhra Pradesh 495 405 399 378 383 383 397 333 329 354 353 352
2 Goa0
3 3 3 3 5 5 5 16 16 17 22
3 Gujarat427
412 397 419 689 901 1031 911 916 991 1046 1058
4 Karnataka0
0 0 0 2 3 3 2 3 3 3 3
5 Maharashtra140
114 113 155 155 124 108 118 158 186 186 186
6 Odisha199
192 195 195 195 211 215 219 203 217 221 222
7 Tamil Nadu23
47 47 21 21 21 21 23 35 36 39 39
8 West Bengal*2076
2109 2119 2119 2119 2123 2125 2081 2120 2136 2152 2155
9 Andaman & Nicobar686
973 971 966 966 966 966 789 658 635 615 617
10 Puducherry0
0 0 0 0 0 0 1 1 1 1 1
11 Kerala0
0 0 0 0 0 0 0 8 5 5 6
12 Daman & Diu0
0 0 0 0 0 0 0 1 1 1 1.56
4046 4255 4244 4256 4533 4737 4871 4482 4448 4581 4639 4663
which is almost double of the area estimated by FSI.
Source: India State of Forest Report 2009 and 2011
*: As per the West bengal Forest Department, mangrove area in Sundarban is 4200 sq. km.
Sl No.
Total
Year
Table 3.5.10: State/UT wise mangrove cover assessment- Time Series
Page 31
Sl No. State/UT Very Dense
Mangrove
Moderately
Dense
Mangrove
Open
Mangrove
Total Change w.r.t.
2009
assessment
1 2 3 4 5 6 7
1 Andhra Pradesh 0 126 226 352 -1
2 Goa 0 20 2 22 5
3 Gujarat 0 182 876 1058 12
4 Karnataka 0 3 0 3 0
5 Kerela 0 3 3 6 1
6 Maharashtra 0 69 117 186 0
7 Odisha 82 97 43 222 1
8 Tamil Nadu 0 16 23 39 0
9 West Bengal 1038 881 236 2155 3
10 Andaman & Nicobar 283 261 73 617 2
11 Daman & Diu 0 0.12 1.44 1.56 0.56
12 Pudicherry 0 0 1 1 0
1403 1658.12 1601.44 4662.56 23.56Total
Source:India State of Forest Report 2011
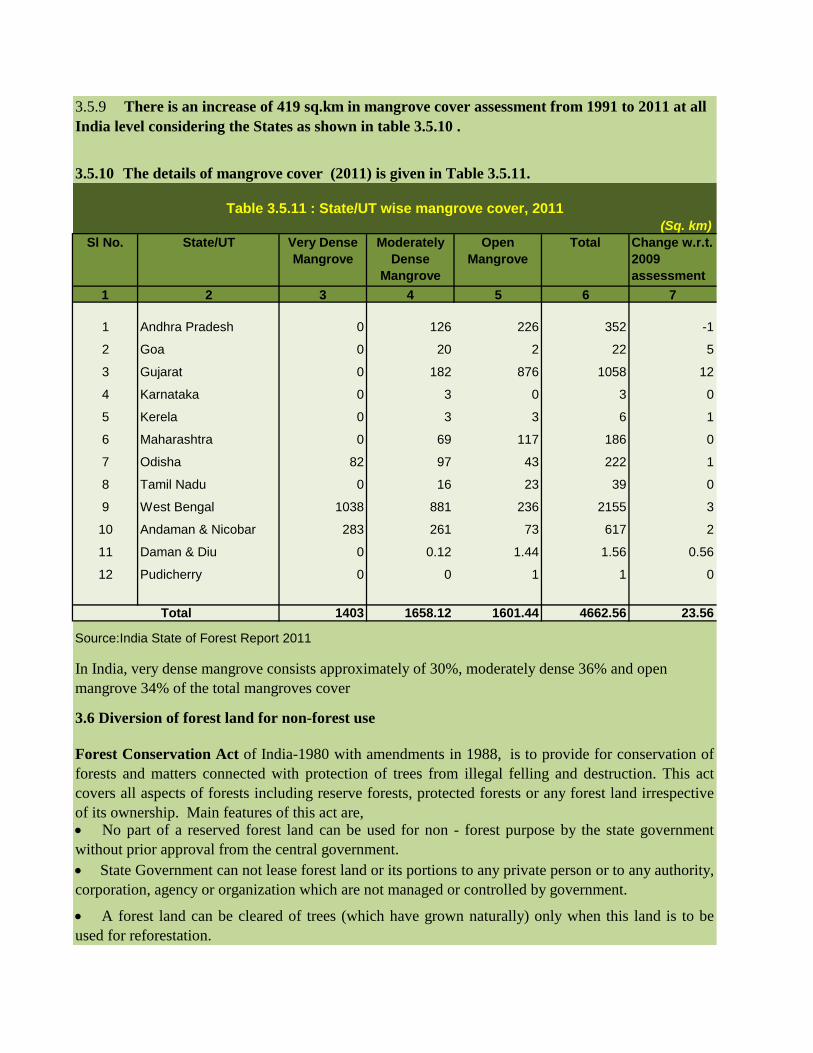
3.5.9 There is an increase of 419 sq.km in mangrove cover assessment from 1991 to 2011 at all
India level considering the States as shown in table 3.5.10 .
3.5.10 The details of mangrove cover (2011) is given in Table 3.5.11.
Table 3.5.11 : State/UT wise mangrove cover, 2011
(Sq. km)
State Government can not lease forest land or its portions to any private person or to any authority,
corporation, agency or organization which are not managed or controlled by government.
A forest land can be cleared of trees (which have grown naturally) only when this land is to be
used for reforestation.
In India, very dense mangrove consists approximately of 30%, moderately dense 36% and open
mangrove 34% of the total mangroves cover
3.6 Diversion of forest land for non-forest use
Forest Conservation Act of India-1980 with amendments in 1988, is to provide for conservation of
forests and matters connected with protection of trees from illegal felling and destruction. This act
covers all aspects of forests including reserve forests, protected forests or any forest land irrespective
of its ownership. Main features of this act are, No part of a reserved forest land can be used for non - forest purpose by the state government
without prior approval from the central government.
Page 32
Sl.
No.Year Forest Area Diverted Cumulative Area Diverted
1 1981 1331.70 1331.70
2 1982 3674.32 5006.02
3 1983 5100.51 10106.53
4 1984 9348.90 19455.43
5 1985 7676.83 27132.26
6 1986 9310.45 36442.71
7 1987 25925.97 62368.68
8 1988 4868.71 67237.39
9 1989 66768.09 134005.48
10 1990 127361.79 261367.27
11 1991 5065.35 266432.62
12 1992 21756.77 288189.39
13 1993 16182.51 304371.90
14 1994 59962.02 364333.92
15 1995 51428.98 415762.90
16 1996 32862.55 448625.45
17 1997 24738.43 473363.88
18 1998 18425.21 491789.09
19 1999 45784.41 537573.50
20 2000 22386.43 559959.93
21 2001 267897.61 827857.54
22 2002 51172.31 879029.85
23 2003 42729.68 921759.53
24 2004 33079.50 954839.03
Source : Forests & Wildlife Statistics, India, 2004,MOEF
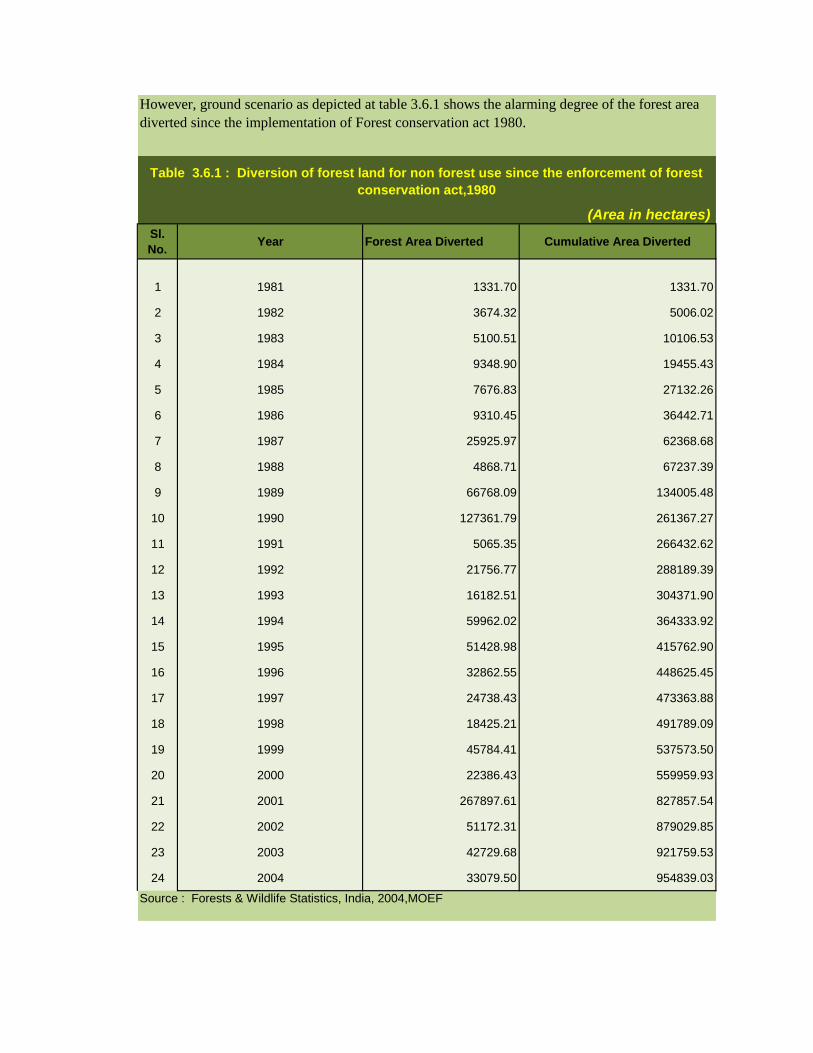
Table 3.6.1 : Diversion of forest land for non forest use since the enforcement of forest
conservation act,1980
(Area in hectares)
However, ground scenario as depicted at table 3.6.1 shows the alarming degree of the forest area
diverted since the implementation of Forest conservation act 1980.
Page 33
The trend in forest area converted in various years is depicted below at chart 3.6.1.
3.7 Conservation measures to increase forest cover
*
*
3.7.3 People’s participation in the protection of forests: Participation of people in the protection and
management of forests has been emphasised in the National Forest Policy, 1988. Pursuant to this policy,
Government of India through its resolution dated 1st June '90 formalised the Joint Forest Management
(JFM) Programme. The JFM is being practiced through constitution of forest protection committees.
3.7.2 Realising the role of forests in controlling soil erosion, moderation of floods, recharging of ground
aquifers, as habitat for wildlife, conservation of bio-diversity and gene pool, etc., programmes were launched
as early as the Second Five Year Plan for extensive Watershed Management followed later by establishment
of a Protected Areas Network, under the Wildlife (Protection) Act, 1972.
(i) Improving canopy cover in the forest land; and
(ii) Undertaking afforestation in non-forest and degraded lands, preferably contiguous to forest
blocks.
3.7.1 A two pronged strategy to increase forest cover essentially comprises
Page 34
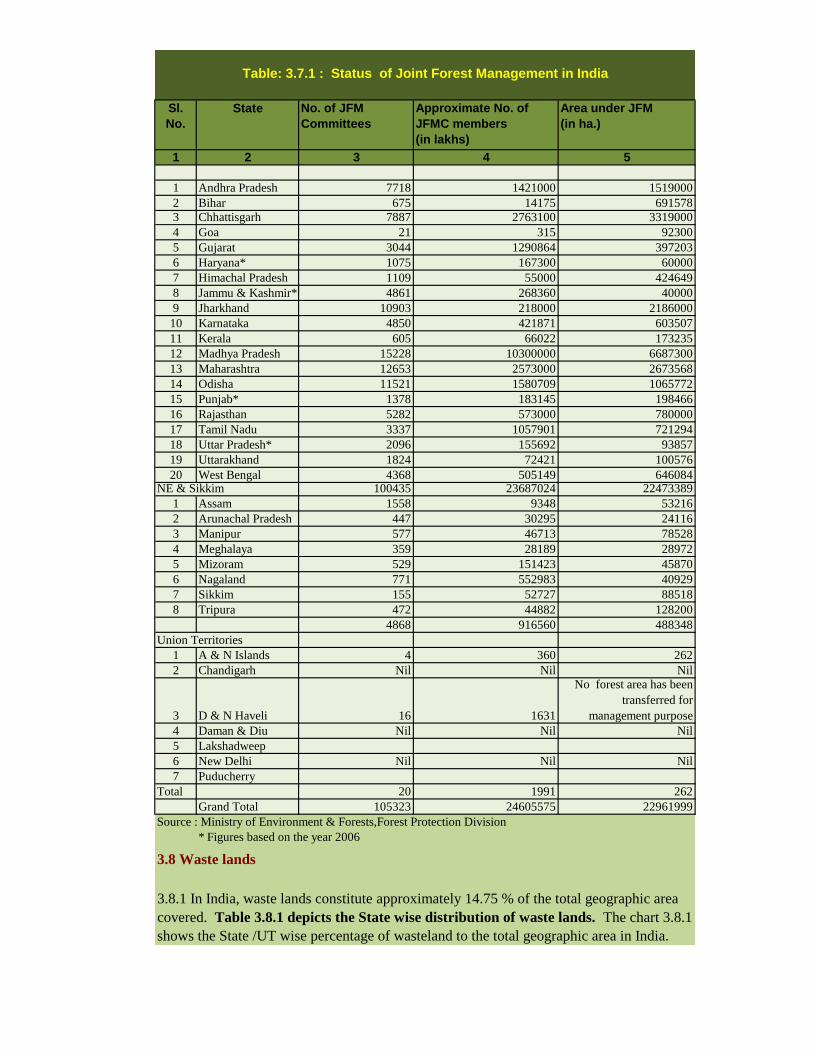
Sl.
No.
State No. of JFM
Committees
Approximate No. of
JFMC members
(in lakhs)
Area under JFM
(in ha.)
1 2 3 4 5
1 Andhra Pradesh 7718 1421000 1519000
2 Bihar 675 14175 691578
3 Chhattisgarh 7887 2763100 3319000
4 Goa 21 315 92300
5 Gujarat 3044 1290864 397203
6 Haryana* 1075 167300 60000
7 Himachal Pradesh 1109 55000 424649
8 Jammu & Kashmir* 4861 268360 40000
9 Jharkhand 10903 218000 2186000
10 Karnataka 4850 421871 603507
11 Kerala 605 66022 173235
12 Madhya Pradesh 15228 10300000 6687300
13 Maharashtra 12653 2573000 2673568
14 Odisha 11521 1580709 1065772
15 Punjab* 1378 183145 198466
16 Rajasthan 5282 573000 780000
17 Tamil Nadu 3337 1057901 721294
18 Uttar Pradesh* 2096 155692 93857
19 Uttarakhand 1824 72421 100576
20 West Bengal 4368 505149 646084100435 23687024 22473389
1 Assam 1558 9348 53216
2 Arunachal Pradesh 447 30295 24116
3 Manipur 577 46713 78528
4 Meghalaya 359 28189 28972
5 Mizoram 529 151423 45870
6 Nagaland 771 552983 40929
7 Sikkim 155 52727 88518
8 Tripura 472 44882 128200
4868 916560 488348
1 A & N Islands 4 360 262
2 Chandigarh Nil Nil Nil
3 D & N Haveli 16 1631
No forest area has been
transferred for
management purpose
4 Daman & Diu Nil Nil Nil
5 Lakshadweep
6 New Delhi Nil Nil Nil
7 Puducherry
Total 20 1991 262
Grand Total 105323 24605575 22961999
Source : Ministry of Environment & Forests,Forest Protection Division
* Figures based on the year 2006
3.8 Waste lands
3.8.1 In India, waste lands constitute approximately 14.75 % of the total geographic area
covered. Table 3.8.1 depicts the State wise distribution of waste lands. The chart 3.8.1
shows the State /UT wise percentage of wasteland to the total geographic area in India.
Table: 3.7.1 : Status of Joint Forest Management in India
NE & Sikkim
Union Territories
Page 35
2005-06 2008-09 2005-06 2008-09
Andhra Pradesh 23 275068 38788.22 37296.62 -1491.60 1682.10 190.46 14.10 13.56 -0.54
Arunachal Pradesh 16 83743 5743.83 14895.24 9151.41 108.48 9259.89 6.86 17.79 10.93
Assam 23 78438 8778.02 8453.86 -324.16 862.56 538.04 11.19 10.78 -0.41
Bihar 37 94171 6841.09 9601.01 2759.92 1895.09 4654.41 7.26 10.20 2.93
Chhattisgarh 16 135194 11817.82 11482.18 -335.64 379.06 43.15 8.74 8.49 -0.25
Delhi 1 1483 83.34 90.21 6.87 3.62 10.27 5.62 6.08 0.46
Goa 2 3702 496.27 489.08 -7.19 11.48 3.99 13.41 13.21 -0.19
Gujarat 25 196024 21350.38 20108.06 -1242.32 2858.99 1616.67 10.89 10.26 -0.63
Haryana 21 44212 2347.05 2145.98 -201.07 232.20 31.92 5.31 4.85 -0.45
Himachal Pradesh 12 55673 22470.05 22347.88 -122.17 197.25 75.57 40.36 40.14 -0.22
Jammu & Kashmir * 14 101387 73754.38 75435.77 1681.39 1191.48 2872.78 72.75 74.40 1.66
Jharkhand 24 79706 11670.14 11017.38 -652.76 1183.50 531.16 14.64 13.82 -0.82
Karnataka 27 191791 14438.12 13030.62 -1407.50 1477.98 70.82 7.53 6.79 -0.73
Kerala 14 38863 2458.69 2445.62 -13.07 247.55 234.44 6.33 6.29 -0.03
Madhya Pradesh 48 308252 40042.98 40113.27 70.29 258.95 329.25 12.99 13.01 0.02
Maharashtra 35 307690 38262.81 37830.82 -431.99 469.93 38.22 12.44 12.30 -0.14
Manipur 9 22327 7027.47 5648.53 -1378.94 2391.10 1012.14 31.48 25.30 -6.18
Meghalaya 7 22429 3865.76 4127.43 261.67 93.86 355.13 17.24 18.40 1.17
Mizoram 8 21081 6021.14 4958.64 -1062.50 2669.27 1606.71 28.56 23.52 -5.04
Nagaland 7 16579 4815.18 5266.72 451.54 721.75 1172.60 29.04 31.77 2.72
Odisha 30 155707 16648.27 16425.76 -222.51 271.75 48.69 10.69 10.55 -0.14
Punjab 20 50362 1019.50 936.83 -82.67 112.70 30.56 2.02 1.86 -0.16
Rajasthan 32 342239 93689.47 84929.10 -8760.37 10264.60 1503.37 27.38 24.82 -2.56
Sikkim 4 7096 3280.88 3273.15 -7.73 11.83 4.29 46.24 46.13 -0.11
Tamil Nadu 30 130058 9125.56 8721.79 -403.77 426.78 22.74 7.02 6.71 -0.31
Tripura 4 10486 1315.17 964.64 -350.53 486.15 135.07 12.54 9.20 -3.34
Uttarakhand 13 53483 12790.06 12859.53 69.47 440.35 509.86 23.91 24.04 0.13
Uttar Pradesh 70 240928 10988.59 9881.24 -1107.35 1269.71 163.08 4.56 4.10 -0.46
West Bengal 19 88752 1994.41 1929.20 -65.21 92.98 28.46 2.25 2.17 -0.07
Union Territory 8 9490 337.30 315.00 -22.30 27.33 4.68 3.55 3.32 -0.23
Total 599 3166414 472261.95 467021.16 -5240.79 32340.4 27098.4 14.91 14.75 -0.17
India, a megadiverse country with only 2.4 percent of the land area, accounts for 7-8% of the recorded species of the world,
including over 45,000 species of plants and 91,000 species of animals. It is situated at the tri-junction of the Afro-tropical, the
Indo-Malayan and the Paleo-Arctic realms, which display significantly rich biodiversity. Being one of the 17 identified
megadiverse countries, with 10 biogeographic regions, it is home to 8.58% of the mammalian, 13.66% of avian, 7.91% of
reptilian, 4.66% of the amphibian, 11.72% of fish and 11.60% of plant species documented so far. India also harbours four fo the
34 globally indentified biodiversity hotspots viz. Himalaya, Indo-Burma, Western Ghats-Sri Lanka and Sundaland. A crucial
characteristic of Indian agrobiodiversity is its species richness, with more than 300 wild ancestors and close relatives of cultivated
plants. India is also recognised as one of the nine Vavilovian centres of origin and diversity of crop plants. The diverse physical
features and climatic situations have formed ecological habitats like forests, grasslands, wetlands, coastal and marine ecosystems
and desert ecosystems, which harbour and sustain immense biodiversity and contribute to human well-being.
Table 3.8.1: State Category wise total area under wastelands (sq.km) during 2008-09 vis-a-vis 2005-06 and change in
Wasteland during the period
State No of
Districts
Total
Geograph
ic Area
(TGA)
Total Waste Land(WL)
3.9 Animal Species in India
Change Total
Reductio
n
Total
Increase
%
of WL to TGA
% Change
over
2005-06
Source: Wastelands Atlas of India 2011, Ministry of Rural Development Department of Land resources
* Unmapped areas (J&K) 120849.00
Page 36
Sl.
No.
1 2 3 4 5
1 Protozoa
I Free living 1247 90 7.22
II Parasitic 1330 550 41.35
2 Mesozoa 10 10 100.00
3 Porifera 500
I Freshwater 31 13 41.94
4 Cnidaria 842 10 1.19
5 Platyhelminthes 1650 1160 70.30
6 Rotifera 330 23 6.97
7 Gastrotica 100 64 64.00
8 Kinorhyncha 10 7 70.00
9 Nematoda 2902 400 13.78
10 Acanthocephala 229 203 88.65
11 Mollusca 5169
I Terrestrial 1487 498 33.49
II Freshwater 183 77 42.08
12 Echiura 43 12 27.91
13 Annelida
I Oligochaeta 473 368 77.80
II Hirudinea 59 25 42.37
14 Arthropoda
I Crustacea 2944 501 17.02
II Insecta 61461 20765 33.79
III Arachnida 5829 2623 45.00
15 Phoronida 11 1 9.09
16 Bryozoa 200 12 6.00
17 Entoprocta 10 1 10.00
18 Chaetognatha 30 3 10.00
19 Chordata
I Pisces 2662 341 12.81
II Amphibia 314 233 74.20
III Reptilia 464 197 42.46
IV Aves 1300 81 6.23
V Mammalia 397 45 11.34
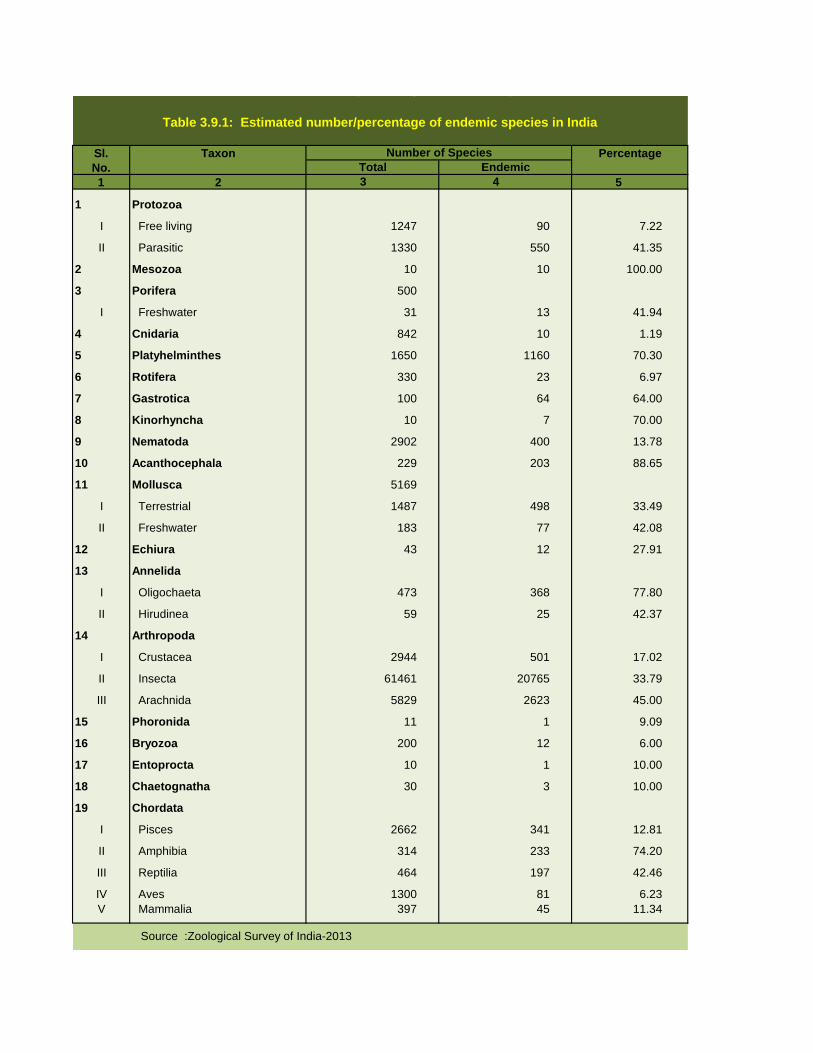
Table 3.9.1: Estimated number/percentage of endemic species in India
Table 3.9.1: Estimated number/percentage of endemic species in India
Taxon Number of Species Percentage
Total Endemic
Source :Zoological Survey of India-2013
Page 37
Taxonomic group % in India
World India
PROTISTA (Protozoa) 31250 2577 8.24
ANIMALIAMesozoa 71 10 14.08
Porifera 4562 500 10.96
Cnidaria 9924 1042 10.50
Ctenophora 100 12 12.00
Platyhelminthes 17500 1650 9.43
Nemertinea -
Rotifera 2500 330 13.20
Gastrotricha 3000 100 3.33
Kinorhyncha 100 10 10.00
Nematoda 30040 2902 9.66
Nematomorpha -
Acanthocephala 800 229 28.63
Sipuncula 145 35 24.14
Mollusca 66537 5169 7.77
Echiura 127 43 33.86
Annelida 12701 842 6.63
Onychophora 100 1 1.00
Arthropoda 999059 71480 7.15
Crustacea 35538 2944 8.28
Insecta 867582 61461 7.08
Arachnida 73451 5829 7.94
Pycnogonida 600 17 2.83
Chilopoda 3001 101 3.37
Diplopoda 7500 162 2.16
Symphyla 120 4 3.33
Merostomata 4 2 50.00
Phoronida 11 3 27.27
Bryozoa (Ectoprocta) 4000 200 5.00
Entoprocta 60 10 16.67
Brachiopoda 300 3 1.00
Chaetognatha 111 30 27.03
Tardigrada 514 30 5.84
Echinodermata 6225 779 12.51
Hemichordata 120 12 10.00
Chordata 46499 5163 11.10
Protochordata 2106 119 5.65
Pisces 21753 2662 12.24
Amphibia 5187 314 6.05
Reptilia 5821 464 7.97
Aves 9027 1233 13.66
Mammalia 4629 397 8.58
Total (Animalia) 1195887 89697 7.50
Grand (Protista+ Animalia) 1227137 92279 7.52
Source: Zoological Survey of India.
Animal Discovery 2012, Compiled by ZSI, June,2013.
No. of species
Table 3.9.2 : Estimated number of described fauna from India
Page 38
1 Schedule 1
MAMMALS
PART IIA
**FISHES
(i) Anoxypristis cuspidata
(ii) Carcharhinus hemiodon
(iii) Glyphius gangetics
(iv) Glyphius glyphius
(v) Himantura fluviatilis
(vi) Pristis microdon
(vii) Pristis zijsron
(viii) Rhychobatus djiddensis
(ix) Urogymnus asperrimus
BIRDS
1 Cassis cornuta
2 Charonia tritonis
3 Conus milneedwardsi
4 Cypraecssis rufa
5 Hippopus hippopus
6 Nautilus Pompilius
7 Tridacna maxima
8 Tridacna squamosa
9 Tudicla Spirillus
Schedule II
PART II
*16. Mangooses (All species of genus Herpestes)
2
* 6- A. Small Game - Omitted
i. Cypraea lamanica
ii. Cypraea mappa
iii. Cypraea talpa
iv. Fasciolaria trapezium
v. Harpulina arausiaca
vi. Lambis chiragra
vii. Lambis chiragra arthitica
viii. Lambis crocea
ix. Lambis millepeda
x. Lambis scorpius
xi. Lambis truncata
xii. Placenta placenta
xiii. Strombus plicatus sibbaldii
xiv. Turbomarmoratus
xv. Turbo marmoratus Linnaeus
20 Horseshoe Crab (Tachypleus gigas and Carcinoscorpius rotundicauda)
(Ins. By S.O. 2293 (E), dated 4th September,2009 (w.e.f. 9-9-2009)
Source :Ministry of Environment & Forests, Government of India/ Zoological Survey of India 2011.
Table 3.9.3 : Recent addition in the list of threatened/ endangered species
As per the Gazette Notification in the Central Government ( Ministry of Environment and Forests) has made following amendments in the
Schedule of the Wild Life (Protection ) Act, 1972 and included the following species in the Schedules of Threatened and endangered species
(amended upto 2011).
PART I
42*. Wroughton's free tailed bat (Otomops wroughtoni)
Schedule IV
19. **Mollusca
* (Vide Notification No. S.O. 1085 (E), dated 30th September 2002, published in the Gazetted of
India, Extra., Pt. II, Sec. 3 (ii), dated 11th October, 2002)
** (Subs. By/Added by S.O. 1197 (E), dated 5th December, 2001 (w.e.f. 6-12-2001) and corrected by
S.O. 233 (E), dated 19th February 2002).
2. Shark and Ray
PART III
*19. Swiftlets (Collocalia unicolor and Collacalia fusiphaga)
Part lV B- **Mollusca
Page 39
Category
Mammalian Aves Reptilia Amphibia Pisces
1 2 3 4 5 6 7
1 Extinct 1 0 0 0 0
2 Critically Endangered 10 13 5 13 5
3 Endangered 39 10 9 31 6
4 Vulnerable 47 54 11 21 29
5 Near Threatened 26 59 10 9 25
123 136 35 74 65
Source : Zoological Survey of India-2013
3.9.2 The details of endemic animal species in India is presented in table 3.9.1. The Indian
Scenario vis –a –vis the global in respect of the species wise existence of animal kingdom is
elaborated in table 3.9.2 . The share of various animal species in India is 7.52%.
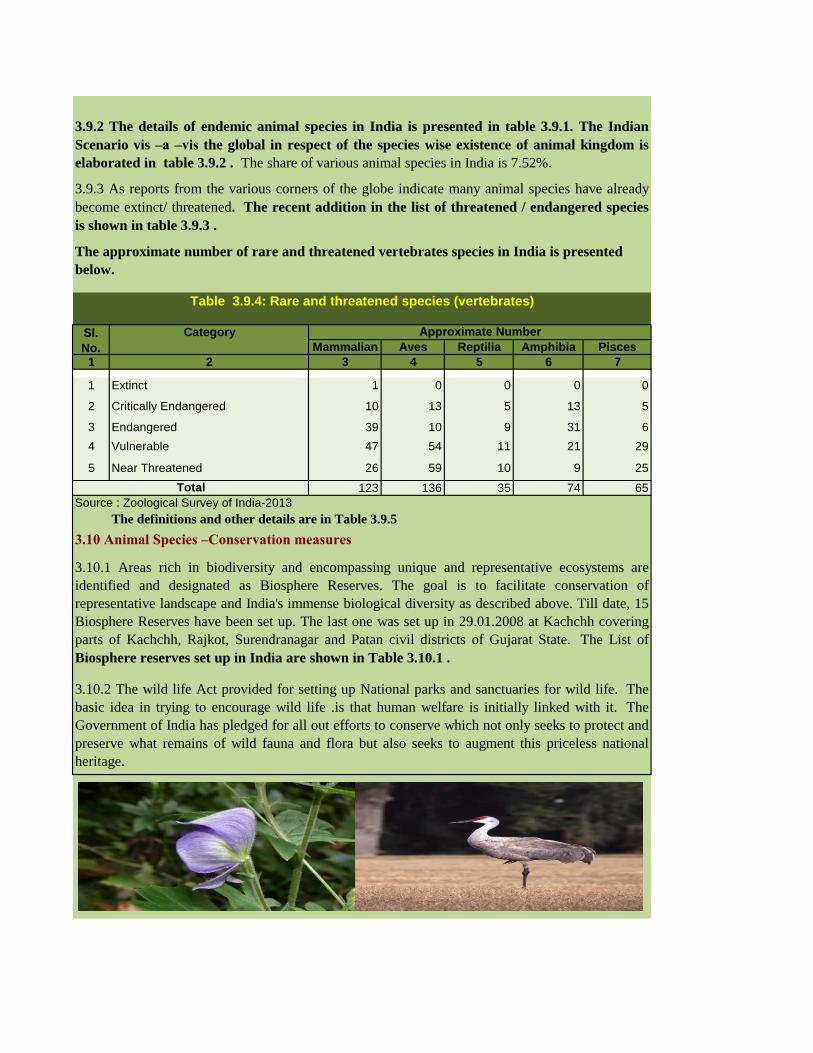
3.9.3 As reports from the various corners of the globe indicate many animal species have already
become extinct/ threatened. The recent addition in the list of threatened / endangered species
is shown in table 3.9.3 .
The approximate number of rare and threatened vertebrates species in India is presented
below.
Table 3.9.4: Rare and threatened species (vertebrates)
3.10 Animal Species –Conservation measures
3.10.1 Areas rich in biodiversity and encompassing unique and representative ecosystems are
identified and designated as Biosphere Reserves. The goal is to facilitate conservation of
representative landscape and India's immense biological diversity as described above. Till date, 15
Biosphere Reserves have been set up. The last one was set up in 29.01.2008 at Kachchh covering
parts of Kachchh, Rajkot, Surendranagar and Patan civil districts of Gujarat State. The List of
Biosphere reserves set up in India are shown in Table 3.10.1 .
3.10.2 The wild life Act provided for setting up National parks and sanctuaries for wild life. The
basic idea in trying to encourage wild life .is that human welfare is initially linked with it. The
Government of India has pledged for all out efforts to conserve which not only seeks to protect and
preserve what remains of wild fauna and flora but also seeks to augment this priceless national
heritage.
Sl.
No.
Approximate Number
Total
The definitions and other details are in Table 3.9.5
Page 40
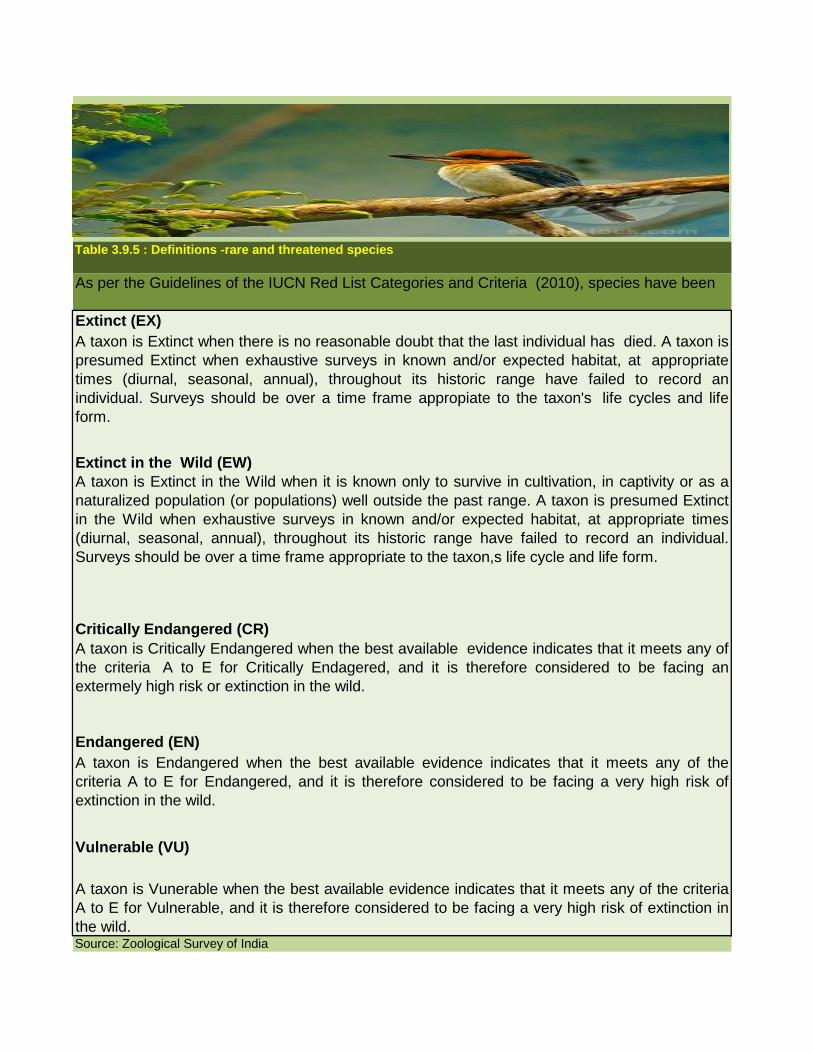
Table 3.9.5 : Definitions -rare and threatened species
Extinct (EX)
Critically Endangered (CR)
As per the Guidelines of the IUCN Red List Categories and Criteria (2010), species have been
A taxon is Extinct when there is no reasonable doubt that the last individual has died. A taxon is
presumed Extinct when exhaustive surveys in known and/or expected habitat, at appropriate
times (diurnal, seasonal, annual), throughout its historic range have failed to record an
individual. Surveys should be over a time frame appropiate to the taxon's life cycles and life
form.
Extinct in the Wild (EW)
A taxon is Extinct in the Wild when it is known only to survive in cultivation, in captivity or as a
naturalized population (or populations) well outside the past range. A taxon is presumed Extinct
in the Wild when exhaustive surveys in known and/or expected habitat, at appropriate times
(diurnal, seasonal, annual), throughout its historic range have failed to record an individual.
Surveys should be over a time frame appropriate to the taxon,s life cycle and life form.
A taxon is Vunerable when the best available evidence indicates that it meets any of the criteria
A to E for Vulnerable, and it is therefore considered to be facing a very high risk of extinction in
the wild.Source: Zoological Survey of India
A taxon is Critically Endangered when the best available evidence indicates that it meets any of
the criteria A to E for Critically Endagered, and it is therefore considered to be facing an
extermely high risk or extinction in the wild.
Endangered (EN)
A taxon is Endangered when the best available evidence indicates that it meets any of the
criteria A to E for Endangered, and it is therefore considered to be facing a very high risk of
extinction in the wild.
Vulnerable (VU)
Page 41
Sl.
No.
Name of
Biosphere
Reserve
Area (in
sq.km.)
Date of
Notification
Location in the States/UT
1 2 3 4 5
1 Nilgiri 5520.00 01.08.1986 Part of Wynad, Nagarhole, Bandipur and Mudumalai, Nilambur,
Silent Valley and Siruvani hills (Tamil Nadu, Kerala and
Karnataka)-Western Ghats
2 Nanda Devi 5860.69 18.01.1988 Part of Chamoli, Pithoragarh & Almora Districts and valley of
flowers (Uttarakhand)-West Himalayas
3 Nokrek 820.00 01.09.1988 Part of Garo Hills (Meghalaya)-East Himalayas
4 Manas 2837.00 14.03.1989 Part of Kokrajhar, Bongaigaon, Barpeta, Nalbari, Kamrup and
Darang districts (Assam)-East Himalayas
5 Sunderbans 9630.00 29.03.1989 Part of Delta of Ganges & Barahamaputra river system (West
Bengal)-Gigantic Delta
6 Gulf of Mannar 10500.00 18.02.1989 Indian part of Gulf of Mannar between India and Sri Lanka (Tamil
Nadu)-Coasts
7 Great Nicobar 885.00 06.01.1989 Southern Most Islands of Andaman and Nicobar (A&N Islands)-
Islands
8 Similipal 4374.00 21.06.1994 Part of Mayurbhanj district (Orissa)-Deccan Peninsula
9 Dibru-Saikhowa 765.00 28.07.1997 Part of Dibrugarh and Tinsukhia districts (Assam)-East Himalayas
10 Dehang Debang 5111.50 02.09.1998 Part of Siang and Debang Valley in Arunachal Pradesh-East
Himalayas
11 Pachmarhi 4981.72 03.03.1999 Part of Betul, Hoshangabad and Chindwara Districts of Madhya
Pradesh-Semi-Arid-Gujarat Rajputana
12 Kanchanjunga 2619.92 07.02.2000 Parts of North and West Sikkim
13 Agasthyamalai 3500.36 12.11.2001 Part of Thirunelvedi and Kanya Kumari Districts in Tamil Nadu
and Thiruvananthapuram, Kollam and Pathanmthita of Kerala
(Tamil Nadu & Kerala)
14 Achankmar-
Amarkantak
3835.31 30.3.2005 Part of Anuppur and Dindori Distt.,of MP, part of Bilaspur distts.,
of Chhattisgarh State (Madhya Pradesh & Chattisgarh)
15 Kachchh 12454.00 29.01.2008 Parts of Kachchh, Rajkot, Surendranagar and Patan Civil Districts
of Gujarat State
16 Cold Desert 7770.00 28.08.09 Pin Valley National Park and surroundings; Chandratal and
Sarchu & Kibber Wildlife Sanctuary in Himachal Pradesh.
17 Seshachalam 4756.00 20.09.2010 Seshachalam hill range in Eastern Ghats encompsssing part of
Chitoor and Kadapa district in Andhra Pradesh
18 Panna 2998.98 25.08.2011 Part of Panna and Chhattarpur district in Madhya Pradesh
Source: Ministry of Environment and Forests, Annual Report-2012-13
Table 3.10.1 : Biosphere reserves setup in India
Page 42
States/Uts No. of NPS Area Sq Km No. of WLS Area Sq Km No. of PAs Area Sq Km
Andhra Pradesh 6 1388.39 21 11618.12 27 13006.51
Arunchal Pradesh 2 2290.82 11 7487.75 13 9778.57
Assam 5 1977.79 18 1932.01 23 3909.80
Bihar 1 335.65 12 2851.67 13 3187.32
Chattisgarh 3 2899.08 11 3583.19 14 6482.27
Goa 1 107.00 6 647.91 7 754.91
Gujarat 4 479.67 23 16619.81 28 17326.48
Haryana 2 48.25 8 233.21 12 330.18
Himachal Pradesh 5 2271.38 32 7745.48 37 10016.86
Jammu and Kashmir 4 3925.00 15 10243.11 53 14997.86
Jharkhand 1 226.33 11 1955.82 12 2182.15
Karnataka 5 2472.18 22 4003.42 30 6482.52
Kerala 6 558.16 16 1822.86 23 2382.52
Madhya Pradesh 9 3656.36 25 7158.41 34 10814.77
Maharashtra 6 1273.60 35 14152.70 42 15429.79
Manipur 1 40.00 1 184.40 2 224.40
Meghalaya 2 267.48 3 34.20 5 301.68
Mizoram 2 150.00 8 1090.75 10 1240.75
Nagaland 1 202.00 3 20.34 4 222.36
Odisha 2 990.67 18 6969.15 20 7959.85
Punjab 0 0.00 12 323.70 15 344.72
Rajasthan 5 3947.07 25 5379.26 33 9548.60
Sikkim 1 1784.00 7 399.10 8 2183.10
Tamil Nadu 5 307.85 21 3521.95 27 3829.83
Tripura 2 36.71 4 566.93 6 603.64
Uttar Pradesh 1 490.00 23 5221.88 24 5711.88
Uttarakhand 6 4915.44 6 2418.61 14 7376.32
West Bengal 5 1693.25 15 1203.28 20 2896.53
Andaman & Nicobar 9 1153.94 96 389.39 105 1543.33
Chandigarh 0 0.00 2 26.01 2 26.01
Dadra and Nagar Haveli 0 0.00 1 92.16 1 92.16
Daman and Diu 0 0.00 1 2.19 1 2.19
Delhi 0 0.00 1 27.82 1 27.82
Lakshadweep 0 0.00 1 0.01 1 0.01
Puducherry 0 0.00 1 3.90 1 3.90
India 102 39888.07 515 119930.50 668 161221.59
Table 3.10.2 - Summary of Protected Area Statistics in India(as on 05/09/2011)
NPs- National Parks : WLS- Wild Life Sanctury: PAs- Protected Areas.
Source: India- State of the Forest Report , 2011.
Page 43
1972 1979 1984 1989 1993 1995 1997 2001-02 *
1 2 3 4 5 6 7 8 9 10
1 Bandipur (Karnataka) 10 39 53 50 66 74 75 82
2 Corbett(Uttaranchal) 44 84 90 91 123 128 138 137
3 Kanha(Madhya Pradesh) 43 71 109 97 100 97 114 127
4 Manas(Assam) 31 69 123 92 81 94 125 65*
5 Melghat (Maharashtra) 27 63 80 77 72 71 73 73
6 Palamu (Jharkhand) 22 37 62 55 44 47 44 32
7 Ranthombore (Rajasthan) 14 25 38 44 36 38 32 35
8 Similipal(Orissa) 17 65 71 93 95 97 98 99
9 Sunderbans (West Bengal) 60 205 264 269 251 242 263 245
10 Periyar (Kerala) - 34 44 45 30 39 40 36
11 Sariska (Rajasthan) - 19 26 19 24 25 24 22
12 Buxa (West Bengal) - - 15 33 29 31 32 31
13 Indravati (Madhya Pradesh) - - 38 28 18 15 15 29
14 Nagarkimasagar (Andhra Pradesh) - - 65 94 44 34 39 67
15 Namdhapa (Arunachal Pradesh) - - 43 47 47 52 57 61
16 Dudhwa (Uttar Pradesh) - - - 90 94 98 104 76*
17 Kalalad (Tamil Nadu) - - - 22 17 16 28 27
18 Valmiki (Bihar) - - - 81 49 N.R 53 53
19 Pench (Madhya Pradesh) - - - - 39 27 29 40
20 Tadoba (Maharashtra) - - - - 34 36 42 38
21 Bandhavgarh (Madhya Pradesh) - - - - 41 46 46 56
22 Panna (Madhya Pradesh) - - - - 25 22 22 31
23 Dampha(Mizoram) - - - - 7 4 5 4
24 Pench (Maharashtra) - - - - -
10
(1994) - 14
25 Bhadra (Karnataka) - - - - - - - 35
26 Pakhui- Nameri (Arunachal Pradesh) - - - - - - -
26
Nameri
27 Bori-Satpura (Madhya Pradesh) - - - - 30 35
268 711 1121 1327 1366 1333 1498 1576
Source: Project Tiger, Ministry of Environment & Forests
* : under compilation/vetting
Total
The area of tiger reserves in Tiger range States are depicted in table 3.10.4 .
Table 3.10.3 : All India tiger population in tiger reserves
Sl.
No.Name of Reserve
Years
Page 44
(As on 26th September,2011
Sl.
No.
Year of
Creation
Name of Tiger
Reserve
State Area of
core/critical
tigher habitat
Area of the
buffer/periph
eral Total area
(In sq. Kms.) (In Sq.Kms)
1 2 3 4 5
1 1973-74 Bandipur Karnataka 872.24 584.061456.3
2 1973-74 Corbett Uttarakhand 821.99466.32 1288.31
3 1973-74 Kanha Madhya pradesh 917.43 1134.36 2051.79
4 1973-74 Manas Assam 840.042310.88 3150.92
5 1973-74 Melghat Maharashtra 1500.49 1268.03 2768.52
6 1973-74 Palamau Jharkhand 414.08 Notification
awaited
414.08
7 1973-74 Ranthambore Rajasthan 1113.36 Notification
awaited
1113.36
8 1973-74 Similipal Odisha 1194.751555.25 2750
9 1973-74 Sunderbans West Bengal 1699.62885.27 2584.89
10 1978-79 Periyar Kerala 881 44 925
11 1978-79 Sariska Rajasthan 881.11 Notification
awaited
881.11
12 1982-83 Buxa West Bengal 390.58367.32 757.9
13 1982-83 Indravati Chhattisgarh 1258.371540.7 2799.07
14 1982-83 Nagarjunsagar Andhra Pradesh 2527 Notification
awaited 2527
15 1982-83 Namdapha Arunachal Pradesh 1807.82 do 1807.82
16 1987-88 Dudhwa Uttar Pradesh 693.7 do 693.7
1999-2000 Katerniaghat (extension) 400.09 do 400.09
17 1988-89 Kalakad- Mundanthurai Tamil Nadu 895 do 895
18 1989-90 Valmiki (not received) Bihar 840* do 840*
19 1992-93 Pench Madhya Pradesh 411.33 768.3 1179.63
20 1993-94 Tadoba-Andheri Maharashtra 625.82 1101.77 1727.59
21 1993-94 Bandhavgarh Madhya Pradesh 716.9 820.03 1536.94
22 1994-95 Panna Madhya Pradesh 576.13 Notification
awaited576.13
23 1994-95 Dampa Mizoram 500 488 988
24 1998-99 Bhadra Karnataka 492.46 571.83 1064.29
25 1998-99 Pench Maharashtra 257.26 483.96 741.22
26 1999-2000 Pakke Arunachal Pradesh 683.45 Notification
awaited
683.45
27 1999-2000 Nameri Assam 200 144 344
28 1999-2000 Satpura0 Madhya pradesh 1339.26 794.04 2133.31
continued..
* Not yet notified
Table 3.10.4 : Area of tiger reserves in tiger range states
Total
Source : National Tiger Conservation Authority, Ministry of Environment and Forests
Page 45
29 2008-09 Annamalai Tamil Nadu 958
Notification
awaited 958
30 2008-09 Udanti-Sita Nadi Chattisgarh 851.09 991.45 1842.54
31 2008-09 Satkosia Odisha 523.61 453.25* 976.86
32 2008-09 Kaziranga Assam 625.58 548 1173.58
33 2008-09 Achanakmar Chattisgarh 626.2 287.82 914.02
34 2008-09 Dandeli-Anshi Karnataka 814.88 282.63 1097.51
35 2008-09 Sanjay-Dubri Madhya Pradesh 812.57 861.93 1674.5
36 2008-09 Mudumalai Tamil Nadu 321
Notification
awaited321
37 2008-09 Nagarahole Karnataka 643.35
Notification
awaited643.35
38 2008-09 Parambikulam Kerala 390.89 252.77 643.66
39 2008-09 Sahyadri(including
Chandoli NP:317.67 and
Koyna
WLS:423.55)=741.22
Total Area
Maharashtra 741.22 Notification
awaited
741.22
40 2011-2012Biligiri Ranganatha
Temple Tiger Reserve
Karnataka 359.1 215.72 574.82
41 2011-2012 Kawal** Andhra Pradesh - - -
Total 33418.78 19221.71 52640.5
concluded
* Not yet notified
** Approval has been accorded by the NTCA for final notification, which has to be issued by the State Government.
Total core are notified 32578.78 sq.km
Total core are notified 18768.46 sq.km
Source : National Tiger Conservation Authority, Ministry of Environment and Forests
Table 3.10.4 : Area of tiger reserves in tiger range states
Page 46
2006 2010 2006 2010
Uttarakhand 178 227 1901 3476
Uttar Pradesh 109 118 2766 2511
Bihar 10 8 510 750
Shivalik Gangetic 297 353 5177 6712
Andhra Pradesh 95 72 14126 4495
Chhattisgarh 26 26 3609 3514Madhya Pradesh 300 257 15614 13833
Maharashtra 103 168 4273 11960
Odisha 45 32 9144 3398
Rajasthan 32 36 356 637
Jharkhand - 10 1488 1180
Central Indian 601 601 48610 39017
Karnataka 290 300 18715 14414
Kerala 46 71 6168 6804
Tamil Nadu 76 163 9211 8389
Western Ghats 412 534 34094 29607
Assam 70 143 1164 2381
Arunachal Pradesh 14 - 1685 1304
Mizoram 6 5 785 416
Northern West Bengal 10 - 596 799
North East Hills, and Brahmaputra 100 148 4230 4900
Sunderbans - 70 1586 1645
Total Tiger Population 1411 1706 93697 81881
India is famous for the majestic elephants of the Country. The protective measures adopted to save the elephant population
of the country are very important. The designated elephant reserves in India, the area, the number of elephants found
are available in table 3.10.6
Population of tigers –estimates by refined methodology is presented in the table 3.10.5. As per this data, the tiger
population in India is approximately 1706 only.
Table 3.10.5 : Forest occupancy and population estimates of tiger
State Tiger Population Tiger Km2
Shivalik-Gangetic Plain Landscape Complex
Central Indian Landscape Complex and Eastern Ghats Landscape Complex
Western Ghats Landscape Complex
North East Hills and Brahmaputra Flood Plains
Source: National Tiger Conservation Authority, Project Tiger, 'Status of Tigers, Co- Predators, and Prey in India 2010', Ministry of
Environment & Forests
Page 47
1993 1997 2002 2007-08
Arunachal 2102 1800 1607 1690
Assam 5524 5312 5246 5281
Meghalaya 2872 1840 1868 1811
Nagaland 178 158 145 152
Mizoram 15 22 33 12
Manipur 50 30 12 Nil
Tripura 100 70 40 59
West Bengal (North) 186 250 292 300-350
11027 9482 9243 9305-9355
West Bengal (South) 14 26 36 25
Jharkhand 550* 618* 772 624
Odisha 1750 1800 1841 1862
Chhattisgarh - - - 122
Total for East 2314 2444 2649 2633
Uttarakhand 828* 1130* 1582 1346
U.P. 47 70 85 380
Total for North 875 1200 1667 1726
Tamil Nadu 2307 2971 3052 3867
Karnataka 5500 6088 5838 4035
Kerala 3500 3600 3850 6068
Andhra Pradesh 46 57 74 28
Maharashtra - - - 7
Total for South 11353 12716 12814 14005
Islands Andaman & Nicobar 35 35 40 NA
Grand Total 25604 25877 26413
27669-27719
Mid value- Source: Project Elephant Division, Ministry of Environment and Forest.
* As part of Bihar, Madhya Pradesh and Uttar Pradesh respectively
East
South
North
Table 3.10.6 : Estimated population of wild elephants -2007-08
REGION STATE
ELEPHANT POPULATION
North-East
Total for North-East
Page 48
Sl.
No
State Name of Zoo Location
1 2 3 4
1 Andaman & Nicobar IslandsBilogical Park, Chidyatapu Port Blair
2 Andhra Pradesh Indira Gandhi Zoological Park visakhapatnam
3 Andhra Pradesh Nehru Zoological Park Hyderabad
4 Andhra Pradesh Sri Venkateswara Zoological Park Tirupati
5 Arunachal Pradesh Biological Park Itanagar Itanagar
6 Assam Assam State Zoo Cum Botanical Garden Guwahati
7 Bihar Sanjay Gandhi Biological Park Patna
8 Chattisgarh Kanan Pandari Zoo Bilaspur
9 Chattisgarh Maitri Baagh Zoo Bhilai
10 Delhi National Zoological Park Delhi
11 Goa Bondla Zoo Usgao
12 Gujarat Dr. Shyamaprasad Mukharjee Zoological GardenSurat
13 Gujarat Indoda Nature Park Gandhi Nagar
14 Gujarat Kamla Nehru Zoological Garden Ahemdabad
15 Gujarat Sakkarbaug Zoo Junagarh
16 Gujarat Sayaji Baug Zoo Vadodara
17 Haryana Rohtak Zoo Rohtak
18 Himachal Pradesh Himalayan Nature Park (Kufri) Kufri
19 J&K Jammu Zoo Ram Nagar,(Jammu)
20 J & K Kashmir Zoo Srinagar
21 Jharkhand Bhagwan Birsa Biological Park Ranchi
22 Jharkhand Jawaharlal Nehru Biological Park Bokaro
23 Jharkhand Tata Steel Zoological Park Jamshedpur
24 Karnataka Bellary Childrens Park-Cum-Zoo (Bellary Zoo) Bellary
25 Karnataka Children Park & Zoo (Gadag Zoo) Gadag
26 Karnataka Dr. K.Shivarma Karanth Pilikula Biological
Park
Mangalore
27 Karnataka National Park, Bannerghatta Zoological
Garden
Bangalore
28 Karnataka Sri Chamarajendra Zoological Gardens Mysore
29 Karnataka Tiger & Lion Safari, Thyyarekoppa Shimoga
30 Kerala State Museum & Zoo Thrissur
31 Kerala Thiruvananthapuram Zoo Thiruvananthapuram
32 Madhya Pradesh Gandhi Zoological Park Gwalior
33 Madhya Pradesh Kamla Nehru Prani Sanghrahalay Zoo Indore
34 Madhya Pradesh Van Vihar National Park Bhopal
35 Maharashtra Aurangabad Municipal Zoo Aurangabad
36 Maharashtra Mahatma Gandhi Rashtriya Udyan Zoo Solapur
37 Maharashtra Nisargakavl Bahlnabai Choudhary
Pranisansangahralay
Pune
Table 3.10.7: State wise location of major zoos
Page 49
Sl.
No
State Name of Zoo Location
1 2 3 4
38 Maharashtra Rajiv Gandhi Zoological Park And Wildlife
Research Centre
Pune
39 Maharashtra Veermata Jijabai Bhosale Udyan & Zoo Mumbai
40 Manipur Manipur Zoological Garden Imphal
41 Meghalaya Lady Hydari Park Animal Shillong
42 Mizoram Aizawl Zoo (Mizoram Zoo) Aizwal
43 Orissa Indira Gandhi Park Zoo & Deer Park Rourkela
44 Orissa Nandankanan Biological Park Bhubaneswar
45 Orissa Wild Animal Conservation Centre Mothijharan Sambalpur
46 Punjab Deer Park, Bir Moti Bagh (patiala Zoo) Patiala
47 Punjab Ludhiana Zoo Ludhiana
48 Punjab Mahendra Chaudhury Zoological Park Chhatbir
49 Rajasthan Bikaner Zoo Bikaner
50 Rajasthan Jaipur Zoo Jaipur
51 Rajasthan Jodhpur Zoo Jodhpur
52 Rajasthan Udaipur Zoo Udaipur
53 Tamil Nadu Amirdhi Zoo Vellore
54 Tamil Nadu Arignar Anna Zoological Park Vandalur Chennai
55 Tamil Nadu Chennai Snake Park Trust Guindy
56 Tamil Nadu Children's Corner Guindy
57 Tamil Nadu Madras Crocodile Bank Trust/Centre For
Herpetology
Mahabalipuram
58 Tamil Nadu V.O.C. Park Mini Zoo Coimbatore
59 Tripura Sepahijala Zoological Park Sepahijala
60 Uttar Pradesh Kanpur Zoological Park Kanpur
61 Uttar Pradesh Lucknow Prani Udyan Lucknow
62 Uttaranchal Pt Govind Ballabh Pant High Altitude Zoo Nainital
63 West Bengal Alipore Zoological Garden Kolkata
64 West Bengal Calcutta Snake Park Badu
65 West Bengal Jhargram Zoo Jhargram
66 West Bengal Marble Palace Zoo Kolkata
67 West Bengal Padmaja Naidu Himalayan Zoological Park Darjeeling
Table 3.10.7: State wise location of major zoos Concld.
Source : Central Zoo Authority, Ministry of Environment & Forests
Page 50
Year Number Area Number Area
1995 80 34684.53 441 114164.58 148849.11
1999 87 34021.15 485 113163.03 147184.18
2004 90 36881.53 502 120051.88 156933.41
2006 100 38024.11 514 117913.77 155980.15
2010 102 39888.00 515 119930 159818.00
National Parks Wildlife Sanctuaries
Source: M/o Environment & Forests
The following table gives the progress achieved in setting up National Parks and Wildlife
Sancturies in India.
Table 3.10.8 : National parks and wildlife sanctuaries of India
Total Area
Page 51
1977 1982 1987 1992 1997 2003 2007
1 2 3 4 5 6 7 7 8
1 Cattle 180.0 192.5 199.7 204.6 198.9 185.2 199.1
2 Buffaloes 62.0 69.8 76.0 84.2 89.9 97.9 105.3
3 Sheep 41 48.8 45.7 50.8 57.5 61.5 71.6
4 Goats 75.6 95.3 110.2 115.3 122.7 124.4 140.5
5 Horses & Ponnies 0.9 0.9 0.8 0.8 0.8 0.8 0.6
6 Pigs 7.6 10.1 10.6 12.8 13.3 13.5 11.1
7 Mules 0.1 0.1 0.2 0.2 0.2 0.2 0.1
8 Donkeys 1.1 1.0 1.0 1.0 0.9 0.7 0.4
9 Camels 1.068 1.1 1.0 1.0 0.9 0.6 0.5
II Other Livestock
.
1 Yaks 0.1 0.1 0.0 0.1 0.1 0.1 0.1
2 Mithuns 0.1 0.2 0.1 0.2 0.2 0.3 -
369.0 419.6 445.3 470.9 485.4 485.0 529.7
Source : Live Stock Census, Ministry of Agriculture
The trend and extent in growth of livestock population from 1977 to 2007 at all India level are evident from the
above table.
Sl.
No.Livestock
Number of Animals
Total
3.11 Livestock Population
3.11.1 The livestock population in the country increased from 369 million in 1977 to the current estimate of 529
million (2007). Grazing by Livestock puts pressure on grasslands and forests. Because of excessive grazing,
natural regeneration is either absent or inadequate in a significant portion of the forests in the country.(The nexet
Livestock Census was conducted in 2012. The results are yet to be published.)
Table 3.11.1: India's livestock population
( Thousand)
3.11.2 An analysis of forests vis-a-vis livestock indicates continued free access to the forest area which has
resulted in high rates of growth of livestock population causing land degradation and arresting the development of
markets for forage crops. Overgrazing impedes regeneration, retards growth of vegetation, and leads to extinction
of good palatable grasses which are replaced by less palatable and inferior grasses. Extensive areas have been
invaded by bushes which are not browsed, excessive trampling makes the soil compact and impervious and
prevents circulation of air, water, thus exposing the soil to erosion by wind and water.
The State / UT wise livestock population details as per 2007 census are in table 3.11.2
0
50000
100000
150000
200000
250000
1977 1982 1987 1992 1997 2003 2007
PO
PU
LA
TIO
N I
N T
HO
US
AN
DS
CHART 3. 11.1 : INDIA'S LIVESTOCK POPULATION
Cattle Buffaloes Sheep
Goats Pigs
Year
Page 52
Provisional
Sr. No. States/UTs Mules Donkeys Camel Yaks Mithun
Cross
bred
Indigenous Total
1 Andhra Pradesh 1898 9325 11223 13272 25539 9626 439 26 0 50 0 0 60175
2 Arunachal Pradesh 29 474 503 3 20 292 356 6 0 0 0 14 219 1413
3 Assam 410 9631 10041 500 354 4320 2000 11 0 0 0 0 0 17227
4 Bihar 1976 10583 12559 6690 218 10167 632 51 0 24 0 0 0 30342
5 Chhatisgarh 186 9305 9491 1604 140 2768 413 1 0 0 0 0 0 14418
6 Goa 16 55 71 37 0 11 58 0 0 0 0 0 0 177
7 Gujarat 1142 6834 7976 8774 2002 4640 22 14 0 50 38 0 0 23515
8 Haryana 566 986 1552 5953 601 538 134 26 11 5 39 0 0 8859
9 Himachal Pradesh 793 1476 2269 762 901 1241 2 13 19 7 0 2 0 5217
10 Jammu & Kashmir 1677 1766 3443 1050 4127 2068 1 167 42 24 2 62 0 10987
11 Jharkhand 191 8590 8781 1506 483 6592 732 5 0 1 0 0 0 18100
12 Karnataka 2193 8309 10503 4327 9558 6153 281 11 0 26 0 0 0 30859
13 Kerala 1621 119 1740 58 1 1729 59 0 0 0 0 0 0 3587
14 Madhya Pradesh 475 21441 21915 9129 390 9014 193 27 3 20 4 0 0 40696
15 Maharashtra 3122 13061 16184 6073 2909 10391 327 38 0 32 0 0 0 35954
16 Manipur 66 276 342 62 9 51 314 1 0 0 0 0 10 789
17 Meghalaya 27 860 887 23 21 365 524 2 0 0 0 0 0 1823
18 Mizoram 11 24 35 6 1 16 267 1 0 0 0 0 2 328
19 Nagaland 254 216 470 35 4 178 698 1 0 0 0 0 33 1419
20 Odisha 1703 10607 12310 1190 1818 7127 612 0 0 0 0 0 0 23057
21 Punjab 1278 498 1777 5062 208 290 26 33 6 5 2 0 0 7408
22 Rajasthan 816 11304 12120 11092 11190 21503 209 25 1 102 422 0 0 56663
23 Sikkim 73 62 135 0 3 92 35 0 0 0 0 5 0 270
24 Tamilnadu 7383 3806 11189 2009 7991 9275 284 7 0 5 0 0 0 30759
25 Tripura 79 875 954 14 4 633 264 0 0 0 0 0 0 1869
26 Uttar Pradesh 1945 16938 18883 23812 1188 14793 1350 122 31 84 9 0 0 60272
27 Uttarakhand 339 1896 2235 1220 290 1335 20 15 24 1 0 0 0 5141
28 West Bengal 2642 16546 19188 764 1577 15069 815 6 0 0 0 0 0 37419
29 A& Nicobar 14 36 49 10 0 67 48 0 0 0 0 0 174
30 Chandigarh 5 1 7 20 0 1 0 0 0 0 0 0 0 28
31 D & Nagar Haveli 1 55 57 4 0 25 0 0 0 0 0 0 87
32 Daman & Diu 0 3 3 1 0 3 0 0 0 0 0 0 7
33 Delhi 44 47 92 278 6 21 20 1 0 0 0 0 0 418
34 Lakshadweep 4 3 7 0 0 76 0 0 0 0 0 0 82
35 Pondicherry 78 6 84 3 4 69 1 0 0 0 0 0 162
All India 33060 166015 199075 105343 71558 140537 11134 611 137 438 517 83 264 529698
Provisional results derived from village level total.
Source: Department of Animal Husbandry and Dairying & Fisheries, M/O Agriculture (18th Livestock Census)
Total Live-stock
Table 3.11.2: Livestock population as per 2007 census
Cattle Buffalos Sheep Goats Pigs Horses
and
ponies
Page 53
Sl. No. Approx
length of
coast line
(Kms)
Continental
Shelf (‘000
Sq Kms.)
Number of
Landing
Centres
Number of
Fishing Villages
1 974 33 353 555
2 104 10 33 39
3 1600 184 121 247
4 300 27 96 144
5 590 40 187 222
6 720 112 152 456
7 480 26 73 813
8 1076 41 407 573
9 158 17 59 188
10 1912 35 16 134
11 27 - 5 11
12 132 4 10 10
13 45 1 25 40
8118 530 1537 3432
Source: Annual report 2012-13, Department of Animal Husbandry and Dairying, Ministry of
Agriculture (Marine Fisheries Census,2005)
West Bengal
Andaman &
Nicobar Islands
Daman & Diu
Lakshadweep
Puducherry
TOTAL
Gujarat
Karnataka
Kerala
Maharashtra
Odisha
Tamil Nadu
3.12.1 India with a large number of inland water resources and had a long sea cost line is a rich source of
fishery. Table 3.12.1depicts the marine fishery resources in India.
Table 3.12.1 : Marine fishery resources of India
State/Union
Territory
Andhra Pradesh
Goa
3.12 FISHERY
Page 54
Sl
No.
Year Marine Total
1 2 3 5
1 1950-51 5.34 7.52
2 1960-61 8.80 11.60
3 1970-71 10.86 17.56
4 1980-81 15.55 24.42
5 1981-82 14.45 24.44
6 1982-83 14.27 23.67
7 1983-84 15.19 25.06
8 1984-85 16.98 28.01
9 1985-86 17.16 28.76
10 1986-87 17.13 29.42
11 1987-88 16.58 29.59
12 1988-89 18.17 31.52
13 1989-90 22.75 36.77
14 1990-91 23.00 38.36
15 1991-92 24.47 41.57
16 1992-93 25.76 43.65
17 1993-94 26.49 46.44
18 1994-95 26.92 47.89
19 1995-96 27.07 49.49
20 1996-97 29.67 53.48
21 1997-98 29.50 53.88
22 1998-99 26.96 52.98
23 1999-00 28.52 56.75
24 2000-01 28.11 56.56
25 2001-02 28.30 59.56
26 2002-03 29.90 62.00
27 2003-04 29.41 63.99
28 2004-05* 27.79 63.05
29 2005-06 28.16 65.72
30 2006-07 30.24 68.69
31 2007-08 29.20 71.27
32 2008-09 29.78 76.16
33 2009-10 31.03 79.13
34 2010-11(P) 32.20 82.90
32.10
34.58
48.10
Source : Annual Report-2012-13, Department of Animal Husbandry and Dairying, Ministry of Agriculture*: Revised (P ) : Provisional
35.25
37.56
38.45
46.38
50.70
42.07
23.81
24.38
26.02
28.23
28.45
31.26
15.36
17.10
17.89
19.95
20.97
22.42
11.03
11.60
12.29
13.01
13.35
14.02
2.80
6.70
8.87
9.99
9.40
9.87
3.12.2 The fish production (marine & inland) at all India level over the years, is presented at Table 3.12.2. It is pertinent to mention
that, though the marine and inland fish production are showing an overall increasing trend, the marine fish production is lower than the
inland production in recent years.
Table 3.12.2 : Fish production
(Lakh tonne)
Inland
4
2.18
Page 55
Marine Inland Total Marine Inland Total
1 2 3 4 5 3 4 5
1 Andhra Pradesh 146545 226314 372859 204940 471165 676105
2 Arunachal Pradesh 0 2130 2130 0 2600 2600
3 Assam 0 155132 155132 0 161450 161450
4 Bihar 0 208540 208540 0 240400 240400
5 Goa 88809 3240 92049 66550 3368 69918
6 Gujarat 745706 70798 816504 650829 50774 701603
7 Haryana 0 32050 32050 0 34568 34568
8 Himachal Pradesh 0 6685 6685 0 7215 7215
9 Jammu & Kashmir 0 18530 18530 0 18850 18850
10 Karnataka 189859 95275 285134 128415 121196 249611
11 Kerala 526342 57514 583856 593783 78039 671822
12 Madhya Pradesh 0 115161 115161 0 47457 47457
13 Maharashtra 453000 127000 580000 414268 122785 537053
14 Manipur 0 13700 13700 0 16450 16450
15 Meghalaya 0 3085 3085 0 4968 4968
16 Mizoram 0 2700 2700 0 3147 3147
17 Nagaland 0 3700 3700 0 5200 5200
18 Odisha 156081 153428 309509 113893 168056 281949
19 Punjab 0 36000 36000 0 58000 58000
20 Rajasthan 0 15100 15100 0 14269 14269
21 Sikkim 0 140 140 0 140 140
22 Tamil Nadu 355100 109500 464600 370998 114000 484998
23 Tripura 0 27906 27906 0 29450 29450
24 Uttar Pradesh 0 160017 160017 0 225371 225371
25 West Bengal 164000 786020 950020 184300 915800 1100100
26 A & N Islands 27225 40 27265 27021 61 27082
27 Chandigarh 0 4 4 0 44 44
28 Dadar & Nagar Haveli 0 15 15 0 55 55
29 Daman & Diu 18807 0 18807 21524 0 21524
30 Delhi 0 4200 4200 0 3200 3200
31 Lakshadweep 10550 0 10550 13650 0 13650
32 Pondicherry 38420 4104 42524 39600 4900 44500
33 Chattisgarh 0 95763 95763
34 Uttranchal 0 6422 6422
35 Jharkhand 0 101000 101000
2920444 2438028 5358472 2829771 3126163 5955934
Continued..
Source : Department of Animal Husbandry and Dairying, Ministry of Agriculture
Total
Table 3.12.3 : State-wise fish production
Sl. No.States/UT's
1997-98 2001-2002
Page 56
Marine Inland Total Marine Inland Total
1 2 6 7 8 9 10 11
1 Andhra Pradesh 263930 680710 944640 210733 642321 853054
2 Arunachal Pradesh 0 2650 2650 0 2704 2704
3 Assam 0 181000 181000 0 186314 186314
4 Bihar 0 266490 266490 0 267510 267510
5 Goa 83760 3600 87360 94813 4231 99044
6 Gujarat 609140 45480 654620 584779 50426 635205
7 Haryana 0 39130 39130 0 42050 42050
8 Himachal Pradesh 0 6530 6530 0 6901 6901
9 Jammu & Kashmir 0 19750 19750 0 19100 19100
10 Karnataka 187000 70000 257000 171227 80000 251227
11 Kerala 608520 76180 684700 601863 76451 678314
12 Madhya Pradesh 0 50820 50820 0 62060 62060
13 Maharashtra 420010 125120 545130 417769 130250 548019
14 Manipur 0 17600 17600 0 17800 17800
15 Meghalaya 0 5150 5150 0 5638 5638
16 Mizoram 0 3380 3380 0 3680 3680
17 Nagaland 0 5560 5560 0 4900 4900
18 Odisha 116880 190020 306900 121928 193657 315585
19 Punjab 0 83650 83650 0 77700 77700
20 Rajasthan 0 14300 14300 0 16391 16391
21 Sikkim 0 140 140 0 140 140
22 Tamil Nadu 373000 101140 474140 307693 151734 459427
23 Tripura 0 17980 17980 0 19838 19838
24 Uttar Pradesh 0 267000 267000 0 277074 277074
25 West Bengal 181600 988000 1169600 179500 1035500 1215000
26 A & N Islands 31060 90 31150 32600 83 32683
27 Chandigarh 0 80 80 0 84 84
28 Dadar & Nagar Haveli 0 50 50 0 48 48
29 Daman & Diu 13770 0 13770 12506 0 12506
30 Delhi 2100 2100 0 1410 1410
31 Lakshadweep 10030 0 10030 11964 0 11964
32 Pondicherry 42800 5200 48000 31500 5250 36750
33 Chattisgarh 0 111050 111050 0 120072 120072
34 Uttranchal 0 2560 2560 0 2566 2566
35 Jharkhand 0 75380 75380 0 22000 22000
2941500 3457890 6399390 2778875 3525883 6304758
Continued..
Source : Department of Animal Husbandry and Dairying, Ministry of Agriculture
Total
States/UT's2003-2004 2004-2005
Table 3.12.3 : State-wise fish production
Sl. No.
Page 57
(Tonnes)
Marine Inland Total Marine Inland Total
1 2 12 13 14 15 16 17
1 Andhra Pradesh 21884 67225 89109 240.20 616.73 856.93
2 Arunachal Pradesh 0 275 275 0.00 2.77 2.77
3 Assam 0 18801 18801 0.00 181.48 181.48
4 Bihar 0 27953 27953 0.00 267.04 267.04
5 Goa 10091 404 10495 98.96 3.43 102.39
6 Gujarat 66388 6993 73381 670.51 76.82 747.33
7 Haryana 0 4820 4820 0.00 60.08 60.08
8 Himachal Pradesh 0 730 730 0.00 6.89 6.89
9 Jammu & Kashmir 0 1915 1915 0.00 19.20 19.20
10 Karnataka 17697 12060 29757 168.54 123.92 292.46
11 Kerala 55891 7798 63689 598.06 79.57 677.63
12 Madhya Pradesh 0 6108 6108 0.00 65.04 65.04
13 Maharashtra 44534 13520 58054 464.09 131.85 595.94
14 Manipur 0 1822 1822 0.00 18.61 18.61
15 Meghalaya 0 412 412 0.00 5.49 5.49
16 Mizoram 0 375 375 0.00 3.76 3.76
17 Nagaland 0 550 550 0.00 5.80 5.80
18 Odisha 12221 20324 32545 128.14 213.90 342.04
19 Punjab 0 8564 8564 0.00 86.70 86.70
20 Rajasthan 0 1850 1850 0.00 22.20 22.20
21 Sikkim 0 15 15 0.00 0.15 0.15
22 Tamil Nadu 30799 15504 46303 387.25 155.03 542.28
23 Tripura 0 2387 2387 0.00 28.63 28.63
24 Uttar Pradesh 0 28958 28958 0.00 306.73 306.73
25 West Bengal 16000 109000 125000 178.10 1181.00 1359.10
26 A & N Islands 1205 5 1210 28.60 0.08 28.68
27 Chandigarh 0 9 9 0.00 0.17 0.17
28 Dadar & Nagar Haveli 0 5 5 0.00 0.05 0.05
29 Daman & Diu 1772 7 1779 16.35 0.06 16.41
30 Delhi 0 70 70 0.00 0.61 0.61
31 Lakshadweep 1196 0 1196 11.75 0.00 11.75
32 Pondicherry 1927 218 2145 33.61 6.05 39.66
33 Chattisgarh 0 13175 13175 0.00 137.75 137.75
34 Uttranchal 0 279 279 0.00 3.03 3.03
35 Jharkhand 0 3427 3427 0.00 34.27 34.27
281605 375558 657163 3024.16 3844.89 6869.05
Continued..
Source : Department of Animal Husbandry and Dairying, Ministry of Agriculture
Total
Sl. No.States/UT's
2005-2006 2006-2007
Table 3.12.3 : State-wise fish production
Page 58
Marine Inland Total Marine Inland Total
1 2 18 19 20 21 22 23
1 Andhra Pradesh 254892 755195 1010087 291159 961618 1252777
2 Arunachal Pradesh 0 2830 2830 0 2880 2880
3 Assam 0 190320 190320 0 206150 206150
4 Bihar 0 319100 319100 0 300650 300650
5 Goa 32262 1166 33428 83136 3078 86214
6 Gujarat 644531 77376 721907 623055 142847 765902
7 Haryana 0 67236 67236 0 76285 76285
8 Himachal Pradesh 0 7851 7851 0 7793 7793
9 Jammu & Kashmir 0 17330 17330 0 19270 19270
10 Karnataka 175566 122124 297690 218137 143717 361854
11 Kerala 586286 81041 667327 583150 102842 685992
12 Madhya Pradesh 0 63893 63893 0 68466 68466
13 Maharashtra 419815 136632 556447 395963 127138 523101
14 Manipur 0 18600 18600 0 18800 18800
15 Meghalaya 0 4000 4000 0 3959 3959
16 Mizoram 0 3760 3760 0 2891 2891
17 Nagaland 0 5800 5800 0 6175 6175
18 Odisha 130767 218716 349483 135487 239335 374822
19 Punjab 0 78730 78730 0 86207 86207
20 Rajasthan 0 25700 25700 0 24100 24100
21 Sikkim 0 175 175 0 168 168
22 Tamil Nadu 393266 166090 559356 365280 168885 534165
23 Tripura 0 36245 36245 0 36000 36000
24 Uttar Pradesh 0 325950 325950 0 349274 349274
25 West Bengal 182735 1264527 1447262 189290 1294710 1484000
26 A & N Islands 28600 85 28685 32335 157 32492
27 Chandigarh 0 214 214 0 244 244
28 Dadar & Nagar Haveli 0 48 48 0 50 50
29 Daman & Diu 26280 78 26358 14060 81 14141
30 Delhi 0 610 610 0 715 715
31 Lakshadweep 11042 0 11042 12592 0 12592
32 Pondicherry 33444 5569 39013 34550 5750 40300
33 Chattisgarh 0 139373 139373 0 158698 158698
34 Uttranchal 0 3092 3092 0 3163 3163
35 Jharkhand 0 67890 67890 0 75800 75800
2919486 4207346 7126832 2978194 4637896 7616090
Continued..
Source : Department of Animal Husbandary and Dairying, Ministry of Agriculture
Total
States/UT's2007-2008 2008-2009Sl. No.
Table 3.12.3 : State-wise fish production
Page 59
concluded
Marine Inland Total
1 2 24 25 26
1 Andhra Pradesh 293151 1000704 1293855
2 Arunachal Pradesh 0 2650 2650
3 Assam 0 218822 218822
4 Bihar 0 297400 297400
5 Goa 81927 3437 85364
6 Gujarat 687445 84071 771516
7 Haryana 0 100464 100464
8 Himachal Pradesh 0 7847 7847
9 Jammu & Kashmir 0 19300 19300
10 Karnataka 170992 237061 408053
11 Kerala 570013 93108 663121
12 Madhya Pradesh 0 66119 66119
13 Maharashtra 415767 122587 538354
14 Manipur 0 19200 19200
15 Meghalaya 0 4210 4210
16 Mizoram 0 3042 3042
17 Nagaland 0 6360 6360
18 Odisha 129332 241208 370540
19 Punjab 0 122860 122860
20 Rajasthan 0 26908 26908
21 Sikkim 0 168 168
22 Tamil Nadu 365280 168885 534165
23 Tripura 0 42268 42268
24 Uttar Pradesh 0 392926 392926
25 West Bengal 179004 1325996 1505000
26 A & N Islands 33000 159 33159
27 Chandigarh 0 236 236
28 Dadar & Nagar Haveli 0 50 50
29 Daman & Diu 15880 15880
30 Delhi 0 715 715
31 Lakshadweep 12372 0 12372
32 Pondicherry 36100 5849 41949
33 Chattisgarh 0 174245 174245
34 Uttranchal 0 3488 3488
35 Jharkhand 0 70500 70500
2990263 4862843 7853106
concluded
Source : Department of Animal Husbandary and Dairying, Ministry of Agriculture
States/UT's2009-2010
Total
Sl. No.
Table 3.12.3 : State-wise fish production
Page 60
1 2 3 4 5 6 7
1 Andhra Pradesh 11,514 2.34 5.17 - 0.60
2 Arunachal Pradesh 2,000 - 2.76 0.42 -
3 Assam 4,820 0.02 0.23 1.10 -
4 Bihar 3,200 0.60 0.95 0.50 -
5 Chhattisgarh 3,573 0.84 0.63 - 1.47
6 Goa 250 0.03 0.03 - Neg
7 Gujarat 3,865 2.43 0.71 0.12 1.00
8 Haryana 5,000 0.09 0.10 0.10 -
9 Himachal Pradesh 3,000 0.42 0.01 - -
10 Jammu & Kashmir 27,781 0.07 0.17 0.06 -
11 Jharkhand 4,200 0.94 0.29 - -
12 Karnataka 9,000 4.40 2.90 - 0.10
13 Kerala 3,092 0.30 0.30 2.43 2.40
14 Madhya Pradesh 17,088 2.27 0.60 - -
15 Maharashtra 16,000 2.79 0.59 - 0.10
16 Manipur 3,360 0.01 0.05 0.04 -
17 Meghalaya 5,600 0.08 0.02 Neg -
18 Mizoram 1,395 - 0.02 - -
19 Nagaland 1,600 0.17 0.50 Neg -
20 Odisha 4,500 2.56 1.14 1.80 4.30
21 Punjab 15,270 Neg 0.07 - -
22 Rajasthan 5,290 1.20 1.80 - -
23 Sikkim 900 - - 0.03 -
24 Tamil Nadu 7,420 5.70 0.56 0.07 0.60
25 Tripura 1,200 0.05 0.13 - -
26 Uttar Pradesh 28,500 1.38 1.61 1.33 -
27 Uttarakhand 2,686 0.20 0.01 0.00 -
28 West Bengal 2,526 0.17 2.76 0.42 2.10
29 Andaman & Nicobar Islands 115 0.01 0.03 - 1.20
30 Chandigarh 2 - Neg Neg -
31 Dadra & Nagar Haveli 54 0.05 - - -
32 Daman & Diu 12 - Neg - Neg
33 Delhi 150 0.04 - - -
34 Lakshadweep - - - - -
35 Puducherry 247 - Neg 0.01 Neg
195,210 29.07 24.14 7.98 12.40
Source: Annual Report 2011-12, Department of Animal Husbandry and Dairying, Ministry of Agriculture
Neg - Negligible
Total
Sl.
No.
State/UTs Rivers &
Canals (Kms.)
Reservoirs (Lakh
Ha)
The State wise fish production data is available in table 3.12.3
3.12.3 The inland fishery water resources contributes to the Country’s fish production in a significant manner. The table
3.12.4. presents the details of Inland water resources of water.
Table 3.12.4 : Inland fishery water resources of India
Tanks & Ponds
(Lakh Ha)
Floodplain Lakes
& Derelict Water
(Lakh Ha)
Brackish
Water (Lakh
Ha)
Page 61
Outbreak Attack Death
1 Foot and mouth disease Bovine 653 10959 207
Buffalo 8 1358 11
Ovine/Caprine 31 485 0
Swine 9 45 0
Canine 0 0 0
Total 701 12847 218
2 Hamorrhagic septicaemia Bovine 172 1807 466
Ovine/Caprine 14 265 100
Buffalo 129 846 246
Swine 0 0 0
Total 315 2918 812
3 Black quarter Bovine 412 2605 875
Ovine/Caprine 4 25 1
Buffalo 1 46 24
Total 417 2676 900
4 Anthrax Bovine 33 165 165
Ovine/Caprine 15 197 158
Buffalo 0 0 0
Total 48 362 323
5 Fascioliasis Bovine 195 509195 31
Ovine/Caprine 5 51 7
Cannine 2 10 0
Swine 0 1 0
Buffalo 32 1755 10
Equine 0 4 0
Total 234 511016 48
6 Enterotoxaemia Ovine/Caprine 67 866 242
Bovine 4 250 0
Total 71 1116 242
7 Sheep pox and goat pox Ovine/Caprine 197 3861 698
8 Blue Tongue Ovi/Cap 38 2212 136
9 CCPP Ovi/Cap 1 22 5
10 Amphistomiasis Bovine 132 14996 29
11 Swine Fever Swine 284 4018 1371
12 Salmonellosis Avian 123 113451 4439
Bovine 1 3002 207
Swine 0 0 0
Canine 0 0 0
Total 124 116453 4646
13 Coccidiosis Bovine 81 15194 739
Ovi/Cap 7 18 0
Avian 635 168693 25262
Swine 14 70 0
Buffalo 0 3 0
Cannine 1 1 0
Total 738 183979 26001
3.12.4 Though, the livestock population in the country is increasing over the years, the incidence of livestock and poultry diseases are
also increasing which has causes in environmental changes and serious impacts on environmental balance. Table 3.12.5 at gives a
summary of the incidence of various livestock and poultry diseases in 2010
Table 3.12.5: Incidence of livestock and poultry diseases in India
(Jan-Dec.,2011)
Sl.
No.
Disease Name SpeciesNumber of
Page 62
Outbreak Attack Death
14 Ranikhet (New Castle) Disease Avian 886 240438 24016
15 Fowl Pox Avian 235 19122 1682
16 Fowl cholera Avian 143 7999 2276
17 Marks Disease Avian 1 100 50
18 I.B.D. Avian 338 86381 24199
19 Duck Plague Avian 87 2232 497
20 Chronic respiratory disease Avian 291 133808 59642
21 Canine Disetmper Canine 100 1509 123
22 Rabies Bovine 56 168 168
Canine 23 163 163
Buffalo 9 75 75
Ovi/Caprine 3 8 8
Avian 1 3 3
Total 92 417 417
23 Babesiosis Bovine 120 3177 22
Buffalo 6 282 3
Equine 2 6 0
Canine 3 13 0
Total 131 3478 25
24 Mastitis Bovine 186 9072 2
Ovi/Caprine 1 17 0
Total 187 9089 2
25 Trypanismiasis Bovine 84 1334 16
Canine 1 1 0
Equine 1 171 7
Buffalo 91 1922 23
Total 177 3428 46
26 Mange Bovine 43 541 0
Ovi/Caprine 40 1739 0
Swine 14 321 0
Canine 7 246 0
Total 104 2847 0
27 Peste Des Petits Ruminants(PPR) Ovine/Caprine 197 6976 1707
28 Anaplasmosis Bovine 27 90 9
29 Brucellosis Bovine 1 1 0
Buffalo 1 16 0
Total 2 17 0
30 Coryza Avian 8 37505 37
31 Avian Influenza (HPAI) Avian 4 6299 4863
Fau 1 1143 1143
Total
5 7442 6006
32 Glanders Equine 3 3 2
*
# 1702 samples tested out of which 23 found postive and destroyed
+ Figure pertains to number of animals destroyed
$ Total does not include animals attacked by Glander disease
**
Source: Annual Report-2011-12,Department of Animal Husbandry and Dairying, Ministry of Agriculture
Figure pertains to number of poulty destroyed.
The total does not include poultry destroyed due to HPAI and equine destroyed due to Glander disease.
Table 3.12.5: Incidence of livestock and poultry diseases in India
(Jan-Dec.,2011)
Sl.
No.
Disease Name Species Number of