51
Biodiversity data for decision making Jörn P. W. Scharlemann

Biodiversity data for decision making Jörn P. W. Scharlemann

UNEP-WCMC is UNEP’s Biodiversity Assessment
Centre
Founded in 1981
Mission To provide authoritative
information about biodiversity and ecosystem services in a manner that is useful to decision-makers who are driving change in
environment and development policy

3 Databases for biodiversity assessment

4 Databases for biodiversity assessment

5 Databases for biodiversity assessment
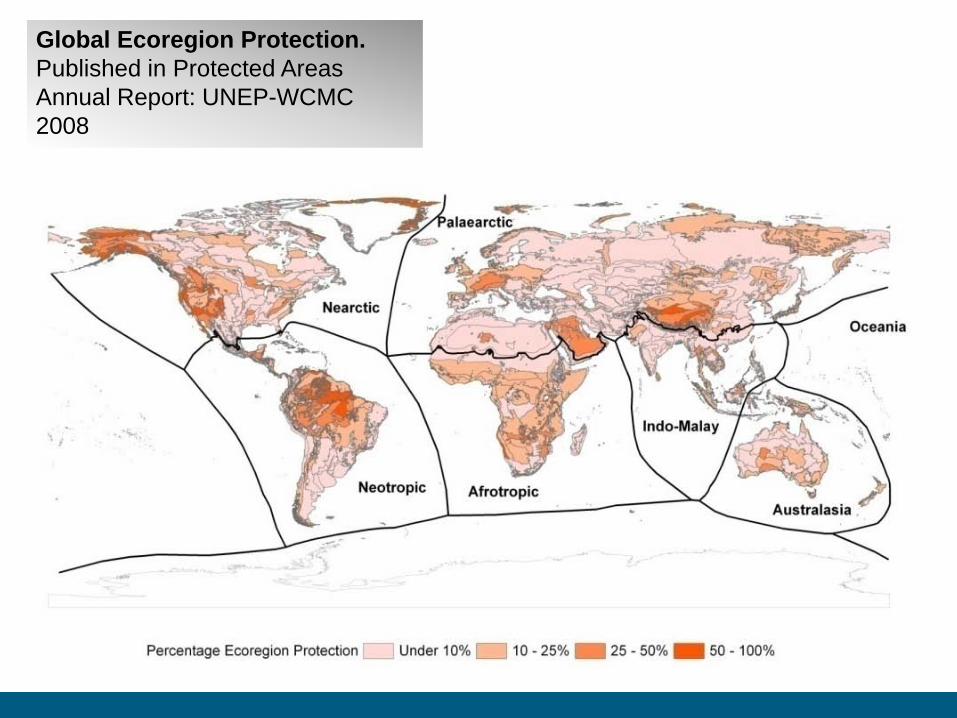
Global Ecoregion Protection. Published in Protected Areas Annual Report: UNEP-WCMC 2008

Global analysis of the protection status of the world’s forests. Biological Conservation 2009

Toward representative protection of the world’s coasts and oceans—progress, gaps, and opportunities. Conservation Letters 2008

Aichi Target 11 By 2020, at least 17 per cent of terrestrial and inland water areas, and 10 per cent of coastal and marine areas, especially areas of particular importance for biodiversity and ecosystem services, are conserved through effectively and equitably managed, ecologically representative and well connected systems of protected areas and other effective area-based conservation measures, and integrated into the wider landscapes and seascapes.

10

Improvements in WDPA 2006-2011
41% 59%
11 Databases for biodiversity assessment


13

“New wiki-style, web-interface for learning about and contributing to WDPA”

Interact with Data • Download / Upload Data • Reconcile Data • Edit data on-line • Cut out the middle man • View users (stakeholder) opinions


Global Biodiversity Information Facility (GBIF) Species & Protected Areas Widget
…..more like this to come...

18 Databases for biodiversity assessment

Existing global data for mangroves
Two recent global studies:
World Atlas of Mangroves 2010, published by UNEP, ISME, ITTO, FAO, UNU, UNESCO & TNC
Giri et al, 2010: Global Ecology and Biogeography 20(1), 154-159 UNEP, USGS, NASA

Global Spatial similarity: 0.4
Fitzgerald, C, Giri, C., Kainuma, M., Latham, J., Wilkie, M., Singh, A., Spalding, M., Wood, L. 2011.

Some National Examples Kenya
Australia Indonesia
Work is ongoing to do more in-depth comparison of all countries to try to estimate uncertainties more comprehensively – this is indicative only.


23

HarmBio COST Action Harmonizing Global Biodiversity Modelling
Aim The harmonization of current models and datasets of terrestrial, freshwater and marine biodiversity to improve the reliability of future projections of biodiversity change under various policy options enabling better environmental decision making.

Modelling climate change
+2 °C EU target

Biodiversity data
GEO-BON

Biodiversity metrics

Biodiversity scenarios
Pereira et al. 2010 Science 330:1496-1501

Modelling
Models are simplified mathematical representations of complex systems

Modelling
Models are simplified mathematical representations of complex systems.
Epidemiological models inform responses to disease pandemics Atmospheric models project future climate Economic models guide financial decisions

Modelling biodiversity change
Statistical niche models
Integrated assessment models

Policy Metrics Models
Scenarios
Metrics Data
Overview
HarmBio

HarmBio COST Action Harmonizing Global Biodiversity Modelling
Aim The harmonization of current models and datasets of terrestrial, freshwater and marine biodiversity to improve the reliability of future projections of biodiversity change under various policy options enabling better environmental decision making.

HarmBio COST Action Harmonizing Global Biodiversity Modelling
Better models • transparent • scientifically robust • intercomparable • common data and scenarios
Better decisions • based on state-of-the-art • approved projections • feed into assessments, eg. IPBES, post 2010
EU Biodiversity Strategy

HarmBio COST Action Harmonizing Global Biodiversity Modelling
Biodiversity and Climate Research Centre, Senckenberg
University of Copenhagen National Museum of Natural Sciences, Madrid Universite Paris-Sud Sapienzia Universita di Roma Alterra Wageningen PBL – NL Environmental Assessment Agency UNEP GRID Arendal Universidade de Lisboa Imperial College London University of East Anglia University of York UNEP-WCMC
University of British Columbia, Canada Yale University, USA
22 participants from 15 COST countries, 1 COST reciprocal country & 2 other countries
CSIRO, Australia

HarmBio COST Action Harmonizing Global Biodiversity Modelling

HarmBio COST Action Harmonizing Global Biodiversity Modelling
Year 1 Year 2 Year 3 Year 4 WG1: Consensus on metrics WG2: Harmonized datasets WG3: Agree standards for models WG4: Intercomparison of models
Ope
ning
sy
mpo
sium
2nd s
ympo
sium
Fina
l sym
posi
um
Inau
gura
tion
, ele
ctio
n M
C &
WG
cha
irs
Mee
ting
s of
WG
& M
C
Mee
ting
s of
WG
& M
C
Mee
ting
s of
WG
& M
C
Mee
ting
s of
WG
& M
C
Mee
ting
s of
WG
& M
C
Mee
ting
s of
WG
& M
C
Mee
ting
s of
WG
& M
C
STSM STSM
STSM
STSM STSM

HarmBio COST Action Harmonizing Global Biodiversity Modelling
WG1: Consensus on biodiversity metrics
currently every model produces different output metric (species richness, extinction risk, abundance, habitats, ...) multitude of national, regional & global indicators consensus required for comparison, integration into Earth system models and to guide policy ⇒ agree on scientifically robust and policy relevant metrics of biodiversity & processes

HarmBio COST Action Harmonizing Global Biodiversity Modelling
WG2: Harmonized datasets
currently every model uses different input data and different data on environmental conditions and human activities consensus required for model comparison long-term access to data and metadata ⇒ agree and compile datasets incl. full description & long-term storage of key datasets; collaborate with GEO-BON, GBIF, etc.

HarmBio COST Action Harmonizing Global Biodiversity Modelling
WG3: Standards for biodiversity models
currently every model addresses different components of biodiversity and different processes documentation variable explicit about components and feedbacks consensus required for model comparison and link to global climate models
⇒ build consensus on processes and components essential for model development; standards for documentation and transparency
HarmBio COST Action Harmonizing Global Biodiversity Modelling
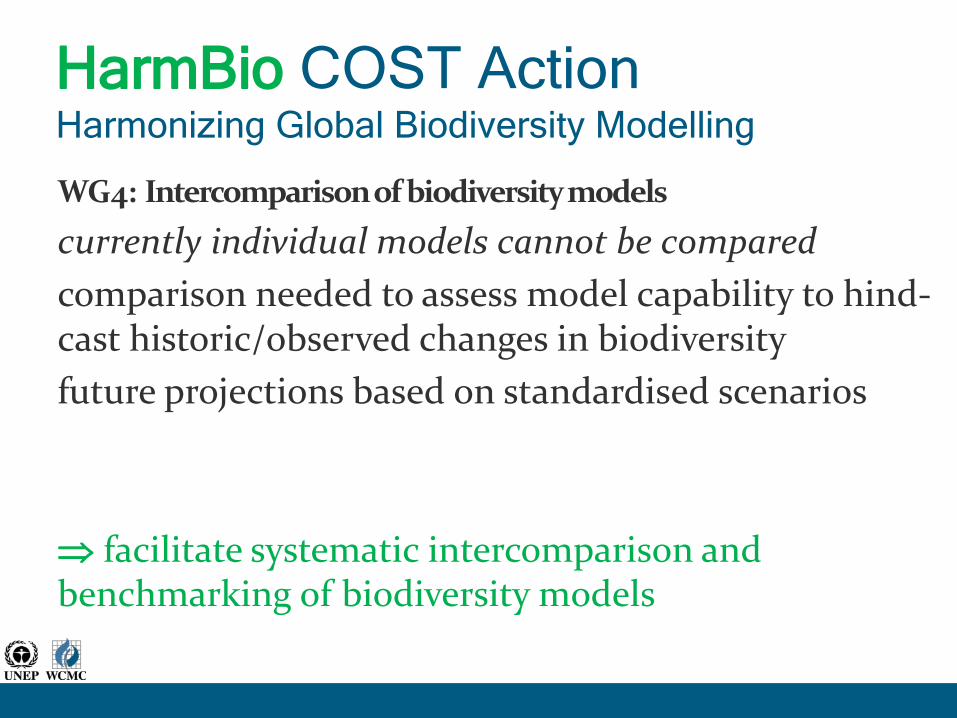
WG4: Intercomparison of biodiversity models
currently individual models cannot be compared comparison needed to assess model capability to hind-cast historic/observed changes in biodiversity future projections based on standardised scenarios ⇒ facilitate systematic intercomparison and benchmarking of biodiversity models

HarmBio COST Action Harmonizing Global Biodiversity Modelling
Year 1 Year 2 Year 3 Year 4 WG1: Consensus on metrics WG2: Harmonized datasets WG3: Agree standards for models WG4: Intercomparison of models
Ope
ning
sy
mpo
sium
2nd s
ympo
sium
Fina
l sym
posi
um
Inau
gura
tion
, ele
ctio
n M
C &
WG
cha
irs
Mee
ting
s of
WG
& M
C
Mee
ting
s of
WG
& M
C
Mee
ting
s of
WG
& M
C
Mee
ting
s of
WG
& M
C
Mee
ting
s of
WG
& M
C
Mee
ting
s of
WG
& M
C
Mee
ting
s of
WG
& M
C
STSM STSM
STSM
STSM STSM
www.unep-wcmc.org
45
46

47
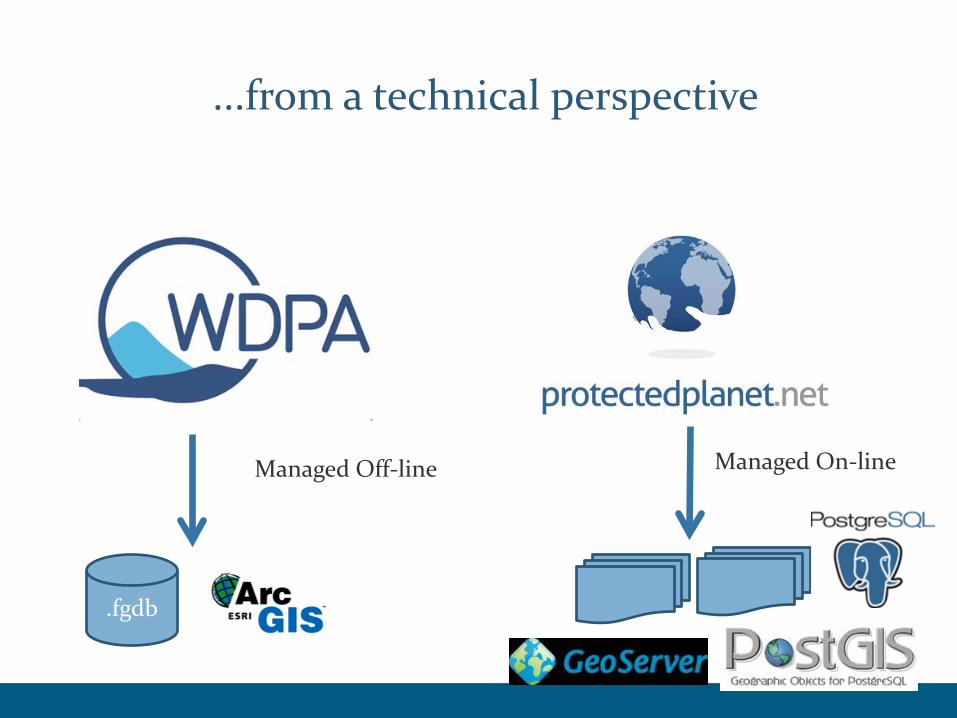
...from a technical perspective
.fgdb
Managed Off-line Managed On-line

Global Data Partnership
Strengthen the business case for better data Transform the volume & rate of improvement of coastal ecosystem data Beneficiaries clearer:
• Governments • Citizens • Private Sector

Outcomes Transformed methodologies for data collection
• Citizen Science communities of contributors • Core standards and protocols • Freely available, reliable data • Transparency of contributions • Consistency of monitoring in local initiatives
Enable better decision-making across sectors
• Blue C & Ecosystem Service assessments • Robust basis of market-based instruments • Strengthened local capacity to integrate coastal
issues in national management strategies, EIA, etc

Outputs
Consolidated Partnership networks Consistent global baselines Validated and enriched datasets Improved transparency, accessibility, visualisation of data