51
BIODIVERSITY FINANCIAL NEED ASSESSMENT FOR THE IMPLEMENTATION OF INDIA’S NATIONAL BIODIVERSITYACTION PLAN [AT CENTRAL GOVERNMENT LEVEL] REVISED FINAL REPORT

BIODIVERSITY FINANCIAL NEED ASSESSMENT
FOR THE IMPLEMENTATION OF
INDIA’S NATIONAL BIODIVERSITYACTION PLAN [AT CENTRAL GOVERNMENT LEVEL]
REVISED FINAL REPORT

This revised report was prepared by Dr. J.Soundrapandi, under the Biodiversity
Finance Initiative-India with the guidance of Mr.T.Rabikumar IFS, Secretary,
National Biodiversity Authority, Chennai and Dr. V.Rajagopalan, IAS (retd.), Senior
Technical Adviser to the BIOFIN Initiative-India. The encouragement and support
received from Dr. B. Meenakumari, Chairperson, National Biodiversity Authority,
Chennai is acknowledged.
1For the early full report please refer:
Soundrapandi, J. (2017). Biodiversity Financial Needs Assessment for the
Implementation of India’s National Biodiversity Action Plan. National
Biodiversity Authority, Chennai. India. December, 2017.

Contents
I Introduction to refinements in the biodiversity financial needs assessment
1
1.1 Conservation Imperatives for India - a Mega Diversity Country 2
1.2 Biodiversity Governance and Financing in India 3
1.3 India’s National Biodiversity Action Plan (NBAP) and the Financing Needs for its implementation
4
1.4 Biodiversity Finance Initiative (BIOFIN) 6
2 Biodiversity financial needs assessment under the BIOFIN initiative 8
2.1 Approaches to Biodiversity Financial Need Assessment and
Methodology 8
2.2 Process of Biodiversity Financial Needs Assessment 10
2.3 Enumeration of steps followed in the FNA process in India 10
3 Assessment of financial needs for the implementation of India’s NBAP at the Central Government level
14
3.1 Ministry-wise Schemes/Programmes identified as Biodiversity Relevant during the 12 FYP
14
3.2 Ministry- wise Biodiversity Financial Need Assessment 16
3.3 Key Learning Financial Needs Assessment Process 18
3.4 Limitations of the Study 18
4 Financial Needs Assessment based on quantitative targets 20
4.1 River Rejuvenation and Conservation 20
4.2 Forest and Tree Cover (FTC) 21
4.3 Relocation of people from core areas of tiger reserves 24
4.4 Cleaning/Restoration of wetlands and lakes 24
4.5 Sanitation 25
4.6 Invasive Alien Species (IAS) 25
5 Estimate of total funds needed including for quantitative targets (INR in crores) per annum for the implementation of national biodiversity action plan
27
Annexures: (i) Financial attributions and the associated schemes and programmes during the
12 FYP (2012-17). (ii) Ministry/Department wise Working Groups/ Steering Committees of 12 FYP (2012-2107) along with the schemes and programmes proposed them on Biodiversity.


1
BIODIVERSITY FINANCIAL NEEDS ASSESSMENT FOR THE IMPLEMENTATION OFINDIA’S NATIONAL BIODIVERSITYACTION PLAN
[AT CENTRAL GOVERNMENT LEVEL]
REVISED FINAL REPORT
___________________________________________________________________ I. INTRODUCTION TO REFINEMENTS IN THE BIODIVERSITY FINANCIAL NEEDS
ASSESSMENT
This revised report1 of Biodiversity Financial Needs Assessment is the outcome of the
reconciliation and uniform application/attribution of modified Rio-markers2adopted in the
country for both Biodiversity Expenditure Review (BER) and the Financial Needs
Assessment (FNA) across national and state levels so as to maintain uniformity and to arrive
at the realistic biodiversity finance gap. The BER exercise at the national and sub-national
levels had made use of Demand for Grants (DFG), the form in which estimates of
expenditure from the consolidated fund, included in the annual financial statement and
required to be voted upon in the Lok Sabha, are submitted in pursuance of Article 113 of the
Constitution.
Biodiversity Financial Needs Assessment (FNA) adopted the Working Group/Steering
Committee documents of the Planning Commission of the 12thFive Year Plan (FYP, 2012-
17) as baseline, since the Planning Commission (now NITI Aayog) prepared Plan Schemes
and Programmes till the 12th FYP period and projected budgetary requirements for various
Ministries and Departments as part of Five Year Plan Process in India. These plan
documents deal in a comprehensive manner, assumptions, objectives and aggregate
calculations of plan schemes and programmes and theseare readily deducible. During the
12thFYP, a total of 178 schemes and programmes of 24 Ministries and 2 Departments
having relevance for biodiversity were enumerated from 64 such working group documents
out of the total 146 studied.
Plan process in India invariably followed the incremental budgeting model, wherein a budget
for plan scheme/programmes is prepared using a previous period's budget or actual
performance as a basis with incremental amounts being added for the new budget period.
The allocation of resources is based upon allocations from the previous period to achieve
additional results of an existing scheme/programme or the results of new strategy.Under the
BIOFIN, this process is termed as ‘business as usual finance scenario’. This is different from
the ‘biodiversity investment scenario’ that the BIOFIN advocates incorporating low, medium
1For the early full report please refer: Soundrapandi, J. (2017). Biodiversity Financial Needs Assessment for the Implementation of India’s National Biodiversity Action Plan. National Biodiversity Authority, Chennai. India. December, 2017. 2 Biodiversity-related expenditure is tracked using the biodiversity “Rio marker”. It identifies activities and expenditure targeting biodiversity as a principal objective, a significant objective, or not at all and allows for an approximate quantification of biodiversity expenditures and flows. Under BIOFIN Initiative in India, these Rio markers were extensively modified and applied for BER and FNA. Please see Table 2.

2
and high-investment scenarios, that articulate the outcomes of these scenarios in terms of
national development goals.
In due course of BIOFIN implementation in India, particularly in projecting financial needs for
the implementation of the National Biodiversity Action Plan (NBAP, 2008) and the 12
National Biodiversity Targets (Addendum 2014 to NBAP 2008), there was a clear felt need
to introduce quantitative targets and baselines in respect of specific biodiversity actions, so
that the financial needs assessments under the BIOFIN could be on the sound footing.
These quantitative biodiversity targets were developed and refined by Dr. V.Rajagopalan,
Former Secretary, Ministry of Environment, Forest and Climate Change, Government of
India in consultation with Dr.David Meyers, Senior Technical Adviser, the Global BIOFIN
team.
This revised report includes ‘Needs Assessment based on Quantitative Targets’ in areas
such as afforestation, river rejuvenation, restoration of wetlands, sanitation and relocation of
people from core and critical tiger habitats by incorporating baselines and targets contained
in biodiversity relevant national policies/national missions/national action plans/national
commitments such as India’s Nationally Determined Contribution under UNFCCC, etc., as
these policies have been approved at the highest levels in government and therefore a
holistic approach by way of considering the NBAP along with these policies, is necessary to
arrive at specific actions to close the gap between present status (baseline) and the
target/goal. Financial projections for the quantitative targets were made by using the
government approved costs and cost norms.
Accordingly, this revised report includes two financial projections; one is the budgetary
projection of financial needs based on the 12 FYP which is the ‘business as usual finance
scenario’ and the other is the ‘financial needs assessment based on quantitative targets’ to
comprehensively achieve the National Biodiversity Action Plan and the 12 National
Biodiversity Targets.
1.1. Conservation Imperatives for India - a Mega Diversity Country
India is a one of the 17 mega-diversity3 countries of the world. It is ranked 8thin terms of
species richness and as such forms part of a select group of nations that possess the
greatest number and diversity of animals and plants. In only 2.4% of the world's land area,
India harbours 7-8% of all recorded species, including over 48,000 species of plants and
over 1,00,000 species of animals. Living in harmony in the same land area is the 17% of
human and 18% of cattle populations. India is also home to 4 of the 35 globally identified
biodiversity hotspots i.e., Himalaya, Indo-Burma, Western Ghats and Sri Lanka, and
Sundaland (Fig-1).
3The word ‘mega-diversity’ is used to refer to the world’s top biodiversity-rich countries

3
For India, conservation of biodiversity is crucial not only because it provides several goods
and services necessary for human survival, but also because it is directly linked with
providing livelihoods and improving socio-economic conditions for millions of local people,
thereby contributing to sustainable development and poverty alleviation. As a mega diversity
country, India has special need for the preparation of a comprehensive biodiversity financing
plan (BFP) and a long term resource mobilization strategy to ensure that natural assets are
maintained so that they may continue to provide the resources and environmental services
to the people who directly depend on it.
Fig-1. Global Biodiversity Hotspots
Source: https://conservationbytes.com/2008/08/25/classics-biodiversity-hotspots
1.2. Biodiversity Governance and Financing in India
Protection of the environment is ingrained in Indian ethos and enshrined in the Constitution
of India under Article 48-A and under Article 51-A(g) and to meet the requirement of the
Fundamental Rights (under Article 21-‘Right to life’) and the concept of “Public Trust
Doctrine” in which certain common properties such as rivers, seashores, forests, and air are
held by the government in trusteeship for the free and unimpeded use by the general public.
Biodiversity management in India and the associated financing is truly an inter-sectoral
subject with sectoral initiatives on biodiversity conservation being undertaken by several
Ministries and Departments of Government of India (GoI) through the budget support of
Central and State governments supplemented by civil society, official development
assistance (ODA) and others. The magnitude of biodiversity financing challenge in India far
exceeds the capacity of any one Ministry/Department and demands a strong a partnership
with relevant stakeholders.
Financial resource flows to the biodiversity sector include core funding administered through
Ministry of Environment, Forest and Climate Change (MoEFCC) and the non-core and
peripheral funding that are allocated by as many as 23 other scientific and development

4
Ministries/Departments4of the GoI towards schemes and programmes that have a bearing
on biodiversity conservation; as well as the funding by the State Governments on
biodiversity and environment. The special responsibility held by MoEFCC as a nodal ministry
for the environment/biodiversity is mainly operating at the policy development level as is the
case with the preparation and implementation of India’s National Biodiversity Action Plan.
1.3. India’s National Biodiversity Action Plan (NBAP) and the Financing Needs for its implementation
National Biodiversity Strategies and Action Plans, more commonly referred to as NBSAPs,
are the main vehicles of national implementation of the Convention on Biological Diversity
(CBD). Article 6 (a) and 6 (b) of the CBD, enjoins upon the Parties to prepare NBSAP and
ensure its implementation through mainstreaming of the strategy into relevant sectoral or
cross-sectoral plans and programmes respectively. India’s Biological Diversity Act, 2002
under Sections 36 (1) and (2) reflects the spirit of the said CBD Articles and provide the legal
basis for the preparation of the NBSAPs as well as for the mainstreaming of biodiversity
concerns into sectoral and cross-sectoral plan, programmes and policies.
India developed a ‘National Policy and Macrolevel Action Strategy on Biodiversity’ in the
year 1999. Subsequent to the adoption of the National Environment Policy (NEP) in 2006, a
National Biodiversity Action Plan (NBAP) was prepared through a comprehensive inter-
ministerial process in 2008. The NBAP 2008 was updated in 2014 to prepare an Addendum,
2014 to NBAP 2008 by incorporating the 12 National Biodiversity Targets (NBTs), developed
in line with the 20 Aichi Global Biodiversity Targets of the Strategic Plan (SP) for Biodiversity
2011-2020.
Fig-2. National Biodiversity Strategy and Action Plan - India’s Journey
(1999) (2008) (2014)
The principle part of India’s NBAP 2008 consists of 175 Action Points spread across 11
thematic areas (Tab.1). The action points under India’s NBAP 2008 bear close
harmonization with the 12 NBTs developed as part of Addendum 2014 to NBAP 2008, which
have been further cross linked to the 175 action points from the NBAP 2008, which in
4 India’s National Biodiversity Action Plan; Addendum 2014 to NBAP 2008. p56

5
principle, allows monitoring and reporting of both the NBT at the national level and the
contribution to the Aichi targets at the global level.
The adoption of India’s NBAP (NBAP, 2008 & Addendum 2014 to NBAP, 2008) have not
lead to allocation of funds for its implementation as the NBAP is essentially a strategic policy
document. Rather, it was envisaged to implement the objectives of NBAP through schemes
and programmes of relevant ministries; with the NBAP providing the sectoral ministries with
a flexibility to integrate biodiversity concerns in their respective schemes. Hence, a
reasonable estimate of financial needs for the effective implementation of NBAP proved to
be a methodological challenge.
Tab-1. Action Points of India’s National Biodiversity Action Plan, 2008
No. of Thematic
Area
NBAP Thematic Area No. of Action Points5
% of NBAP
Actions
1a. Strengthening and Integration of in-situ conservation 22 12.5%
1b. Strengthening and Integration of on-farm conservation 4 2.2%
1a. Strengthening and Integration of ex-situ conservation 12 6.8%
2. Augmentation of natural resource base and its sustainable utilization: Ensuring inter- and intra-generational equity
20 11.4%
3. Regulation of introduction of invasive alien species and their management
9 5.1%
4. Assessment of vulnerability and adaptation to climate change, and desertification
16 9.1%
5. Integration of biodiversity concerns in economic and social development
21 12.0%
6. Pollution impacts 10 5.7%
7. Development and integration of biodiversity databases 10 5.7%
8. Strengthening implementation of policy, legislative and administrative measures for biodiversity conservation and management
16 9.1%
9. Building of national capacities for biodiversity conservation and appropriate use of new technologies
24 13.7%
10. Valuation of goods and services provided by biodiversity, and use of economic instruments in decision making processes
7 4.0%
11. International cooperation 4 2.2%
Total Actionable Points 175 100 %
India’s NBAP makes it clear that the 175 action points of the NBAP spread across 11
thematic areas areas to be the basis for seeking funds from domestic and external sources
and in order to sharpen the inter-linkages between the Aichi Biodiversity Targets and India's
NBAP, the plan schemes and programmes of the MOEFCC and those of other
Ministries/Departments of the GOI have to be further aligned for their outcomes in terms of
indicators provided by the Aichi Biodiversity Targets.
5For the purpose of financial needs assessment, NBAP Thematic Area 1 consisting of 38 actionable points were segregated into three viz., in situ (22), on farm (4) and ex situ conservation (12)

6
The implementation of India’s NBAP and the associated NBTs needs an explicit alignment
with plan schemes and programmes of the government resulting in the preparation of a
comprehensive biodiversity finance plan to identify periodic and continuous funding needs
for its effective implementation. This is the context for biodiversity financial needs
assessment under the BIOFIN Initiative that endeavours to estimate the finances required to
implement the NBAP and to achieve the NBTs.
Fig-3. Distribution of Actionable Points of NBAP, 2008 (175 Action Points; 11/13 Thematic
Areas)
1.4. Biodiversity Finance Initiative (BIOFIN)
Biodiversity Finance Initiative (BIOFIN), currently being implemented in 31 countries,
supports countries with a methodology that provides innovative steps to measure current
biodiversity expenditures, assess financial needs, identify the most suitable finance solutions
and provide guidance on how to implement these solutions to achieve their national
biodiversity target through the implementation of National Biodiversity Action Plan (NBAP).
The BIOFIN methodology takes shape through three assessments (PIR, BER & FNA)
that culminate in a Biodiversity Finance Plan (BFP) as listed below;
I. Biodiversity Finance Programme and Institutional Review (PIR) looks into the
programme and institutional context for biodiversity finance in the country and
establishes which are the key stakeholders to involve.
0
5
10
15
20
2522
4
12
20
9
16
21
10 10
16
24
7
4

7
II. Biodiversity Expenditure Review (BER) is an analysis of public and private
expenditures in the country that benefit biodiversity. The assessment establishes
past, present and projected expenditures on biodiversity.
III. Biodiversity Financial Needs Assessment (FNA) estimates the finance required to
deliver national biodiversity targets and plans, usually described in the NBSAPs.
IV. Biodiversity Finance Plan (BFP) identify and prioritizes a mix of suitable
biodiversity finance solutions to reduce the biodiversity finance gap.

8
2. BIODIVERSITY FINANCIAL NEEDS ASSESSMENT UNDER THE BIOFIN INITIATIVE
Biodiversity Financial Needs Assessment (FNA) is the third step in the BIOFIN process
{preceded by early BIOFIN steps; Programme and Institutional Review (PIR) and the
Biodiversity Expenditure Review (BER)} that aims to make a comprehensive estimate of the
financial resources needed to achieve national biodiversity action plans and the associated
biodiversity targets.
Financing for biodiversity conservation in India is a complex policy issue with implications on
Country level Planning and Budgeting process. Until the 12th Five Year Plan (2012-17), the
Planning Commission of India (1951-2014) and the NITI Aayog (2015-2017) were
responsible for assessing the financial resources and decisions on the design and size of
sectoral schemes and programmes at the country level and allocated funding for their
implementation. During the Plan process, based on the overall objectives set for the Five
Year Plan (FYP), the Planning Commission set up various working groups and steering
committees by taking into consideration various inter-sectoral and sector specific issues. The
working groups projected realistic and realizable financial and physical targets for plan
schemes and programmes under its purview
2.1. Approaches to Biodiversity Financial Need Assessment and Methodology
Biodiversity Financial Needs Assessment in India has taken the approach of looking at
trends in National Planning and Budgetary Process to derive estimates of financial needs/
requirements to achieve activities listed in India’s NBAP. National Planning process in India
is organized through formulation of Five-Year Plans (FYPs) by the Planning Commission
that was set up in March, 1950. The principal task of the Planning Commission is to
formulate the Five Year and Annual Plans for the most effective and balanced utilization of
the country's material, capital and human resources, appraise from time to time the progress
in their implementation and recommend adjustments of policy and measures that are
considered to be necessary in the light of such appraisal. The 12 th FYP ran from 2012-2017.
Beginning 1st January, 2015, the Planning Commission is now replaced by NITI Aayog
(National Institution for Transforming India). Since 1stApril, 2017, a three-year action plan
(2017-2020), prepared by the think-tank NITI Aayog is currently being implemented in the
country6.
The Planning Commission was set up by a resolution of the Government of India in March
1950.The Planning Commission decides the design and size of all sectoral schemes (central
sector scheme and centrally sponsored scheme) and allocates finances for their
implementation. A key aspect of Planning in India, as practiced by the Planning Commission
is its rigorous academic probity and transparency. Allocation of public finances between the
Centre and States and between different ministries is done through a detailed, iterative and
inclusive process in which the Planning Commission (now NITI Aayog) plays the pivotal role.
6 http://niti.gov.in/writereaddata/files/coop/India_ActionAgenda.pdf

9
The resolution creating the Planning Commission of India7 enjoined to the following
functions:
i. Make an assessment of the material capital and human resources of the country and
to suggest ways of augmenting them;
ii. Formulate a plan for the most effective and balanced utilization of the country’s
resources;
iii. Determine priorities of the plan and to allocate resources to different sectors of the
plan;
iv. Remove factors retarding economic growth in the current socio-political scenario of
the country;
v. Build up machinery for the successful implementation of the plan ;
vi. Appraise progress achieved in the execution of plan from time to time and to bring
about necessary adjustment in policy and thrusts of the plan;
vii. Make necessary changes in both policy and implementation of the plan
in accordance with the advice or recommendation received from the central or the
State Governments.
The Planning Commission is responsible for assessing the financial resources and decides
on the design and size of sectoral schemes and allocates funding for their implementation.
Within the overall objectives set for the Five Year Plan (FYP), the Planning Commission sets
up various working groups by taking into consideration various inter-sectoral and sector
specific issues. The Working Groups project realistic and realizable financial and physical
targets giving due emphasis to socio-economic and developmental efforts. The Planning
Commission then finalizes the Plan allocation for different Ministries in which the budget
support component is clearly specified. Budget estimates thus prepared by different
Ministries are discussed with Ministry of Finance (MoF). The MoF, in turn depending upon
availability of financial resources fixes a ceiling of funds available and the budget estimates
are revised. Through a process of iterations between the revenue receipts and expenditure,
the Planning Commission budget for different ministries is fixed. Economic, social, regional,
sectoral and political trade-offs are the considerations involved in allocation of financial
resources.
The formulation of each FYP is preceded by considerable amount of technical work involving
stakeholder participation including consultations with Central Ministries and State
Governments, sector experts, economists, sociologists, political scientists and civil society
organizations and prolonged consultations to arrive at consensus in order to ensure effective
and balanced utilization of the material, capital, and human resources. Assumptions and
aggregate calculations of these Plan/Scheme/Service/Project are explicitly stated and readily
deducible through the FYP Plan documents of various Ministries and Departments of
Government of India.
7http://planningcommission.gov.in/aboutus/history/PCresolution1950.pdf
10
2.2. Process of Biodiversity Financial Needs Assessment:
It is recognized that the detailed, budget based financial outlay of schemes and programmes
that India undertook as part of its Planning process8 cannot be replicated under the National
BIOFIN Initiative. Thus, the imperative is to look into BIOFIN’s unique contribution to the
National Planning and Budgeting process and how it can complement Government’s
financing for biodiversity.
The process of biodiversity Financial Needs Assessment began with the compilation of all
the working group/steering committee documents of the 12 th Five Year Plan (FYP; 2012-17).
These Working Group documents of 12 FYP were adopted as baselines as these plan
documents deal in a comprehensive manner, assumption, objectives and aggregate
calculations of plan schemes and programmes and are readily deducible for their mission
objectives and projected financial requirements for the given Plan period.
The rationale for analysing the Plan documents is underlined by the following assumptions;
i. First, Government of India is the dominant stakeholder with more than 50 percent of
public expenditure in India being provided through outlays in Union Budget.
ii. Second, the Constitutional obligation with regard to environmental protection has
been laid down under Article 48-A and under Article 51-A(g) of our Constitution and
to meet the requirement of the Fundamental Rights (Under Article 21) of ‘Right to life’
and the concept of “Public Trust Doctrine” in which certain common properties such
as rivers, seashores, forests, and air are held by the government in trusteeship for
the free and unimpeded use of the general public.
iii. Thirdly, the study of the Plan document is specifically important as it
comprehensively shows as a signpost the adaptation policy priorities that the
Government.
2.3. Enumeration of steps followed in the FNA process in India
The process of Biodiversity Financial Needs Assessment begins with the compilation of all
the Working group/Steering Committee documents of the 12th Five Year Plan. In order to
identify the biodiversity relevant schemes, all the sectoral working group (WG) documents of
the 12FYP numbering about 146 were studied. It was identified that as many as 64 WG
proposed Plan Schemes and Programmes that had relevance for biodiversity. The
enumeration process is schematically represented in Fig.4.
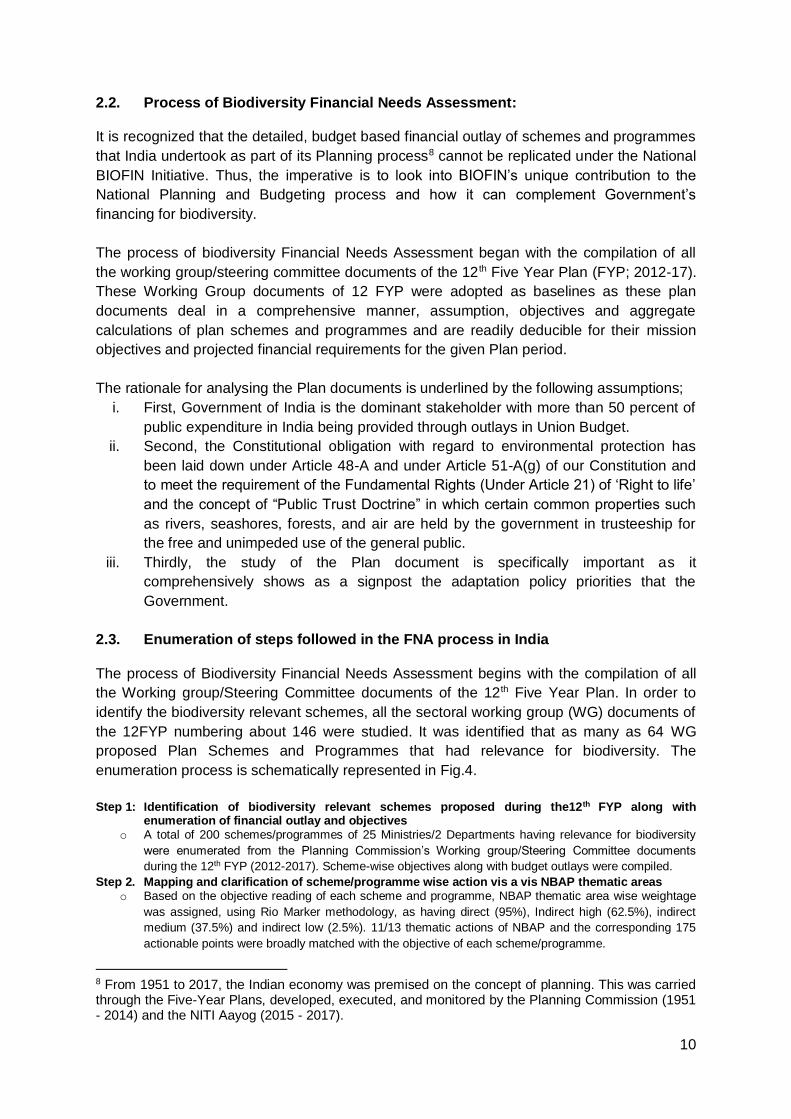
Step 1: Identification of biodiversity relevant schemes proposed during the12th FYP along with
enumeration of financial outlay and objectives o A total of 200 schemes/programmes of 25 Ministries/2 Departments having relevance for biodiversity
were enumerated from the Planning Commission’s Working group/Steering Committee documents
during the 12th FYP (2012-2017). Scheme-wise objectives along with budget outlays were compiled.
Step 2. Mapping and clarification of scheme/programme wise action vis a vis NBAP thematic areas o Based on the objective reading of each scheme and programme, NBAP thematic area wise weightage
was assigned, using Rio Marker methodology, as having direct (95%), Indirect high (62.5%), indirect
medium (37.5%) and indirect low (2.5%). 11/13 thematic actions of NBAP and the corresponding 175
actionable points were broadly matched with the objective of each scheme/programme.
8 From 1951 to 2017, the Indian economy was premised on the concept of planning. This was carried through the Five-Year Plans, developed, executed, and monitored by the Planning Commission (1951 - 2014) and the NITI Aayog (2015 - 2017).

11
Step 3. Preparation of scheme/programme wise initial budget table to corresponding NBAP thematic areas based on attribution methodology
o Depending on the ability of the scheme/programme to contribute to thematic actions of NBAP and to the
corresponding action points, financial estimates were defrayed from the scheme outlay using pivot table.
Step 4. Refining of the budget tables the with expert/stakeholder input
o The budget estimates were further refined using expert/stakeholder inputs. NBAP thematic
area/actionable point wise financial needs assessments were prepared. Efforts were made to compile
Ministry/Department wise financial needs assessment for the 12FYP and annual attributable financial
needs were carried out.
Step 5. Analysis of budget tables to identify priority NBAP actions for Financing o Analysis of financial need assessment of NBAP thematic areas to identify those actions that were
inadequately funded as well as those actionable points/thematic areas that are never proposed for
funding support were carried out.
Step 6. Estimating the finance gap for priority NBAP actions o The financial gap is given as the difference between the appropriations required for actions included in
the NBAP and the funds allocated in the fiscal plan for given year. Using biodiversity expenditure review
(BER) as a baseline, NBAP actionable points/thematic area wise estimation finance gap may be arrived
at, this in turn may be used as a basis for developing a viable biodiversity finance plan as well as a
resource mobilization strategy.
Fig.4. Biodiversity Financial Needs Assessment: Process followed in India and Flow of
Methodologies
Step 1: Identification of biodiversity relevant schemes proposed during the 12 th FYP along
with enumeration of financial outlay and objectives
Step 2: Mapping and clarification of scheme/programme wise action vis a vis NBAP
thematic areas
Step 3: Preparation of scheme/programme wise initial budget table to corresponding NBAP
thematic areas based on attribution methodology
Step 4: Refining of the budget tables the with expert/stakeholder input
Step 5: Analysis of budget tables to identify priority NBAP actions for financing
Step 6: Estimating the finance gap for priority NBAP actions

12
The methodology of determining the FNA attributable to biodiversity conservation in India is
guided by existing and widely accepted ‘Rio marker’ methodologies. The ‘Rio Markers’
classification is an Internationally accepted methodology of attribution by CBD (see Table.2.)
Tab. 2. Modified RIO Markers attribution adapted in Indian context
Names rename
Direct Indirect Very High
Indirect High
Indirect Medium
Indirect Low
Indirect Marginal
Range 100-90% 90-75% 75-50% 50-25% 25-5% 5-0%
Target 95% 82.5% 62.5 37.5 15% 2.5%
Definitions
Principal Intent of Organisation / Activity is to accomplish one of three CBD objectives
Main intent to accomplish at least one of the CBD objectives coupled to a greater degree with other related / supportive intents
Main intent to accomplish at least one of the CBD objectives coupled to a lesser degree with other related / supportive intents
One at least one of the CBD Objectives or NBTs coupled with other - non biodiversity related intents / actions in balanced proportion
Intent primarily for non-biodiversity related activities but have a stated intent for positive BD impacts
Small BD impacts expected from much larger non-BD programs with at least safeguards in place.
Examples
Core MOEFCC schemes e.g. Tiger conservation, afforestation, protection of PA and sanctuaries
Promotion of organic farming, river conservation
Groundwater management and regulation
Integrated watershed management, Climate change adaptation, general awareness and training, activities
Public welfare initiative such as development of WRIS of MoWR, RD & GR.
Renewable energy, Climate change mitigation
RIO Markers
RIO Marker 2 RIO Marker 1 RIO Marker 0
Scheme/Programme wise financial attribution for the all the 200 schemes enumerated during
the 12th FYP Plan was arrived at based on the ability of each of these schemes/programmes
to contribute to the implementation of thematic areas of NBAP as tabulated above. This
budgetary study and attribution methodology closely follows the FNA steps described in the
BIOFIN Workbook (2016) and extrapolates the readily available budgetary projections to
arrive at both ministry/thematic area wise financial needs assessment related to
implementation of NBAP by keeping the plan schemes and programmes as a basis. The
framework adopted for FNA not only allow for the gross initial estimation of financial needs
but also allows for prioritization of programmes/schemes for NBAP implementation.

13
Tab.3. Classification of schemes/programmes under the modified Rio-marker
categories adopted to the Indian context under the BIOFIN Initiative
S.No. Rio Marker classification of BD relevance
Range No. of Schemes %
1 Direct 100-90(95%) 12 6.74
2 Indirect Very High 90-75(82.5%) 23 12.92
3 Indirect High 75-50(62.5%) 8 4.49
4 Indirect Medium 50-25(37.5%) 54 30.34
5 Indirect Low 25-5(15%) 15 8.43
6 Indirect Marginal 5-0(2.5%) 43 24.16
7 Major Scheme 8 4.49
8 Multi-purpose scheme 15 8.43
Total 178 100
Fig.5. Representation of schemes/programmes under the modified Rio-marker
categories
The under lying assumption of FNA process and rationale for adaptation of such as process in India are as follows;
I. Quantifying financial needs for a wide range of activities as outlined in the NBAP is complex, since estimates are dependent on a host of assumptions
II. FNA is foundational exercise in the financial need assessment and estimates provided are conservative and minimalist. Nevertheless, these initial attempts are expected to shed light on the magnitude of the financing requirements
III. India’s approach to FNA is to look at trends in projected budgets to derive estimates of finance requirements to achieve activities listed in India’s NBAP.
Direct (95%), 12
Indirect Very High (82.5%), 23
Indirect High (62.5%), 8
Indirect Medium (37.5%), 54
Indirect Low (15%), 15
Indirect Marginal (2.5%), 43
Major Scheme , 8Multi Purpose, 15

14
3. ASSESSMENT OF FINANCIAL NEEDS FOR THE IMPLEMENATION OF INDIA’S
NBAP AT THE CENTRAL LEVEL
3.1. Ministry-wise Schemes/Programmes identified as Biodiversity Relevant during the 12
FYP
A total of 178 schemes and programmes of 24 Ministries and 2 Departments having
relevance for biodiversity were enumerated from the Working Group/Steering Committee
documents of the 12th FYP (2012-17). Ministry of Agriculture (now renamed as Ministry of
Agriculture and Farmers Welfare) has proposed nearly 35% (62 schemes) of the BD relevant
schemes followed by Ministry of Environment and Forest and Climate Change (23 schemes)
and Ministry of Science and Technology (15 schemes) respectively.
Tab.4. Ministries/Departments identified to have proposed schemes relevant for Biodiversity Conservation in the 12th Five Year Plan (2012-2017)
Sl.No. Ministries/Departments of Government of India & Planning Commission
No. of biodiversity relevant schemes
proposed by WG/SC in the 12th FYP Plan
1 Ministry of Agriculture 62
2 Ministry of Environment & Forests 23
3 Ministry of Earth Sciences 16
4 Ministry of Science & Technology 15
5 Ministry of Water Resources 10
6 Ministry of AYUSH 8
7 Ministry of Commerce and Industry 7
8 Ministry of Shipping 5
9 Ministry of Tourism 4
10 Department of Space 3
11 Ministry of Coal 3
12 Ministry of Rural Development 3
13 Ministry of Drinking Water and Sanitation 3
14 Ministry of Tribal Affairs 2
15 Ministry of Development of North Eastern Region 2
16 Department of Atomic Energy 2
17 Ministry of Information and Broadcasting 1
18 Ministry of Statistics and Programme implementation 1
19 Ministry of New and Renewable Energy 1
20 Ministry of Petroleum and Natural Gas 1
21 Ministry of Panchayati Raj 1
22 Ministry of Communication and Technology 1
23 Ministry of Urban Development 1
24 Ministry of Culture 1
25 Ministry of Chemicals and Fertilizers 1
26 Ministry of Human Resources Development 1
Total 178
15
The study in the process of scheme identification has categorically selected schemes, which
are biodiversity relevant based on the careful reading of the scheme/programme wise
objective of the plan document. Ministry of AYUSH and Ministry of Development of North
Eastern Region are a few of the new Ministries that came into existence after the formulation
of the 12 FYP. The list of ministries/departments identified to have proposed biodiversity
relevant schemes during the 12th FYP are as tabulated above (Tab.)
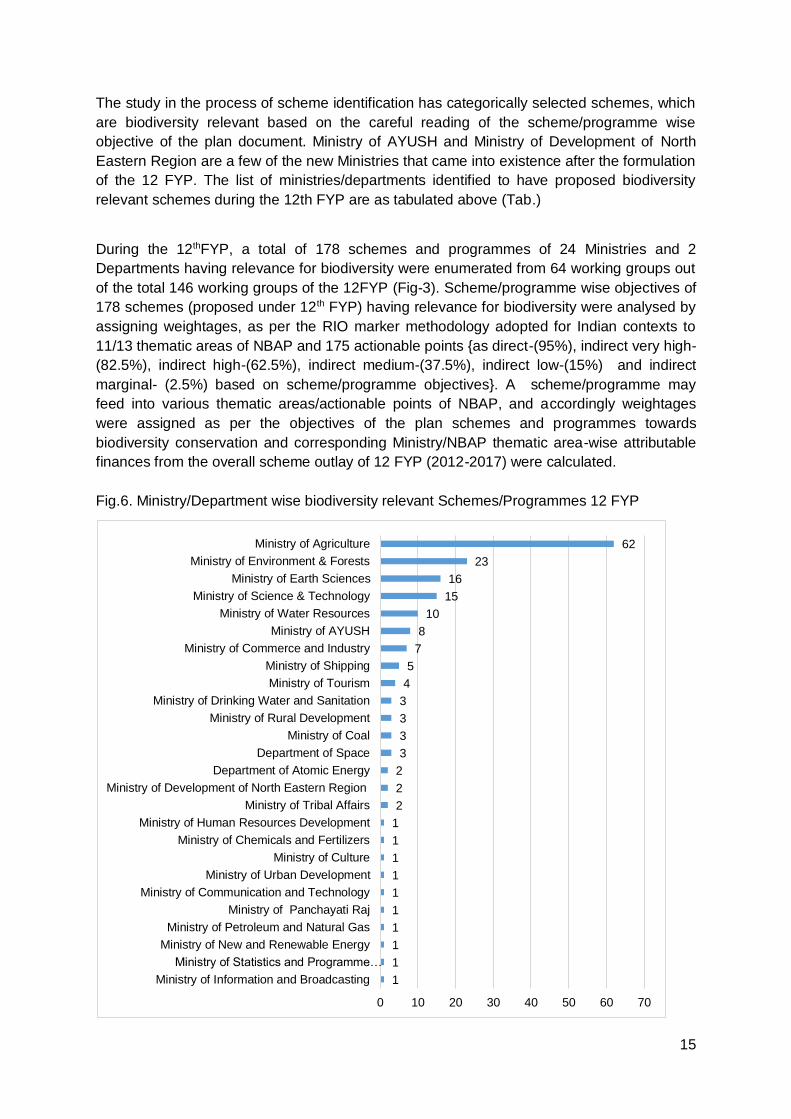
During the 12thFYP, a total of 178 schemes and programmes of 24 Ministries and 2
Departments having relevance for biodiversity were enumerated from 64 working groups out
of the total 146 working groups of the 12FYP (Fig-3). Scheme/programme wise objectives of
178 schemes (proposed under 12th FYP) having relevance for biodiversity were analysed by
assigning weightages, as per the RIO marker methodology adopted for Indian contexts to
11/13 thematic areas of NBAP and 175 actionable points {as direct-(95%), indirect very high-
(82.5%), indirect high-(62.5%), indirect medium-(37.5%), indirect low-(15%) and indirect
marginal- (2.5%) based on scheme/programme objectives}. A scheme/programme may
feed into various thematic areas/actionable points of NBAP, and accordingly weightages
were assigned as per the objectives of the plan schemes and programmes towards
biodiversity conservation and corresponding Ministry/NBAP thematic area-wise attributable
finances from the overall scheme outlay of 12 FYP (2012-2017) were calculated.
Fig.6. Ministry/Department wise biodiversity relevant Schemes/Programmes 12 FYP
1
1
1
1
1
1
1
1
1
1
2
2
2
3
3
3
3
4
5
7
8
10
15
16
23
62
0 10 20 30 40 50 60 70
Ministry of Information and Broadcasting
Ministry of Statistics and Programme…
Ministry of New and Renewable Energy
Ministry of Petroleum and Natural Gas
Ministry of Panchayati Raj
Ministry of Communication and Technology
Ministry of Urban Development
Ministry of Culture
Ministry of Chemicals and Fertilizers
Ministry of Human Resources Development
Ministry of Tribal Affairs
Ministry of Development of North Eastern Region
Department of Atomic Energy
Department of Space
Ministry of Coal
Ministry of Rural Development
Ministry of Drinking Water and Sanitation
Ministry of Tourism
Ministry of Shipping
Ministry of Commerce and Industry
Ministry of AYUSH
Ministry of Water Resources
Ministry of Science & Technology
Ministry of Earth Sciences
Ministry of Environment & Forests
Ministry of Agriculture

16
3.2. Ministry- wise Biodiversity Financial Need Assessment
This section presents an estimate of attributable biodiversity financial as per the schemes
and programmes proposed during the 12th FYP from the overall enumeration of the schemes
and programmes along with the budgetary projections(See Annexure).The FNA has used 12
FYP budgetary projections as baseline. Plan documents prepared by the Planning
Commission readily incorporate assumptions, objectives and aggregate financial
calculations of schemes and programme proposed for that period. The biodiversity financial
estimates presented here are derived from the scheme/programme-wise budgetary/financial
requirements projected in the 12 FYP Plan documents. These estimates use the
implementation of the NBAP as underlying assumption and as such can be translated in to
resource requirements.
Tab.5. Ministry-wise Annual Attributable Financial Needs (Rs. In Crores)
S.No. Ministry No. of Schemes
Annual Attributable needs (Rs. In crores)
% of Needs Assessment
1 Ministry of Drinking Water and Sanitation 3 14084.14 19.74
2 Ministry of Rural Development 3 13834.00 19.39
3 Ministry of Environment & Forests 23 13528.68 18.96
4 Ministry of Urban Development 1 10537.77 14.77
5 Ministry of Agriculture 62 9046.02 12.68
6 Ministry of Water Resources 10 4561.19 6.39
7 Ministry of AYUSH 8 4323.17 6.06
8 Ministry of Panchayati Raj 1 462.50 0.65
9 Ministry of Science & Technology 15 264.79 0.37
10 Ministry of Earth Sciences 16 200.48 0.28
11 Ministry of Commerce and Industry 7 159.21 0.22
12 Ministry of Coal 3 59.02 0.08
13 Ministry of Shipping 5 54.95 0.08
14 Ministry of New and Renewable Energy 1 52.50 0.07
15 Ministry of Human Resources Development 1 45.00 0.06
16 Ministry of Tribal Affairs 2 40.63 0.06
17 Ministry of Statistics and Programme implementation 1 20.54 0.03
18 Department of Space 3 19.44 0.03
19 Ministry of Chemicals and Fertilizers 1 16.50 0.02
20 Ministry of Communication and Technology 1 14.98 0.02
21 Ministry of Culture 1 7.78 0.01
22 Ministry of Development of North Eastern Region 2 5.64 0.01
23 Ministry of Petroleum and Natural Gas 1 5.12 0.01
24 Department of Atomic Energy 2 2.93 0.00
25 Ministry of Information and Broadcasting 1 0.50 0.00
26 Ministry of Tourism 4 0.35 0.00 Grand Total 178 71347.80 100.00

17
The biodiversity financial needs assessment process is underpinned by the primary
assumption that sectoral budgetary projections, having relevance for biodiversity, readily
incorporate the NBAP aspirations. The applicability of this assumption however is only
limited by the selection of schemes and programmes actually implemented by Union
Government along with the associated funding and do not in any way reflect on the
requirement of additional resources. It is imperative that the overall budgetary projection of a
particular scheme/programme cannot be attributed wholly for biodiversity; rather its
objectives have to be aligned to the thematic areas of NBAP and assigned weightages
accordingly. This is especially applicable to those schemes and programmes of the
Ministries and Departments other than the MOEFCC.
Fig-7. Ministry wise % share of attributed biodiversity financesl needed for NBAP
implementation
Under the BIOFIN, it is clearly understood that the notion of finance needs is broader than
the investment requirement, as the FNA encompasses various dimensions of finances
required and the associated instruments and the conduits. This back-of-the-envelope
approach (complex needs assessment process approximated within an order of magnitude
using simple calculations) is a simple and transparent way to select funding needs as well
as to prioritize activities. This preliminary assessment of the budget estimates/finances
needed to implement the NBAP are essentially a back of the envelope calculations that
provides initial estimation of finances needed and may serve as a basis for securing
budgetary allocations for NBAP action.
3 3
23
1
62
10 8
1
15 16
73 5
1 1 2 1 3 1 1 1 2 1 2 14
19.7419.3918.96
14.7712.68
6.396.060.650.370.280.220.080.080.070.06
0.060.030.030.020.020.010.010.010.000.000.000
10
20
30
40
50
60
70
No. of Schemes Percentage of Needs

18
3.3. Key Learning Financial Needs Assessment Process
A key learning emerged during financial needs assessment process is that, it brought to
fore the acute lack of initiatives, in the form of scheme and programmes, as well as the
associated financial projections in several of the thematic areas of NBAP (Tab-3). These
include; (i). Strengthening and Integration of in-situ conservation; (ii). Regulation of
introduction of invasive alien species and their management; (iii). Development and
integration of biodiversity databases; (iv). Valuation of goods and services provided by
biodiversity, and use of economic instruments in decision making processes and (v).
International cooperation (Fig-4).
This budgetary analysis has provided an approximation of the direction of the NBAP
implementation process in India, in addition to segregating schemes and programmes that
directly influence the biodiversity status and trends in the country without attempting to
comment on additional financial needs for the selected sectors to deal with the effective
implementation of NBAP. The study is also aware of several midcourse interventions made
during the intervening plan period, which were not considered in the FNA process to
maintain consistency. Another limitation of the study is that the data reported and analysed
are essentially the sectoral wish list of the Sectoral ministries and departments.
An important motivation for this exercise is the lack of baseline information about the funding
needs for biodiversity sector as whole and this lack of information is an obstacle for
mobilizing sustainable long term funding. Therefore, this study aimed at looking through the
trends in the planning and budgetary process with a view to quantify the biodiversity
financial needs as projected. It is envisaged that this study would serve as a signpost and
would lead to more detailed and complex analysis of actual cost of implementing the NBAP.
3.4. Limitations of the Study
The selection of biodiversity relevant schemes/programmes reliesmainly on the stated
objectives and guidelines of the schemes and programmes proposed during the 12FYP. The
study is also aware of several midcourse interventions made during the intervening plan
period, which were considered in the FNA process to maintain consistency. Financial Needs
Assessments are carried out on the budgetary projections of the schemes and programmes
in order to quantify magnitude of the biodiversity financial the financial needs. Therefore,
thestudy has not attempted to comment on additional financial needs for the selectedsectors
to deal with the effective implementation of NBAP. Another limitation of the study is that the
data reported and analysed are essentially the sectoral wish list of the Sectoral ministries
and departments.
The study captures only the projected budgetary requirements under the Plan Documents at
the Central Government level while a large chunk of public expenditure is also incurred by
the state government and the local bodies out of their own resources. However, since the
Union Budget is the source of more than 50 percent of public spending in India, analysis of
the Union Budget can serve as a signpost on the overall policy stance of the government on
funding for biodiversity.

19
The rationale for analysing the Plan documents is underlined by the following assumptions;
First, Government of India is the dominant stakeholder with more than 50percent of public
expenditure in India being provided through outlays in Union Budget. Second, the
Constitutional obligation with regard to environmental protection has been laid down under
Article 48-A and under Article 51-A(g) of our Constitution and to meet the requirement of the
Fundamental Rights (Under Article 21) of ‘Right to life’ and the concept of “Public Trust
Doctrine” in which certain common properties such as rivers, seashores, forests, and air are
held by the government in trusteeship for the free and unimpeded use of the general
public.Thirdly, the study of the Plan document is specifically important as it comprehensively
shows as a signpost the adaptation policy priorities that the Government.
An important motivation for this exercise is also the lack of baseline information about the
funding needs for biodiversity sector as whole and this lack of information is an obstacle for
mobilizing sustainable long term funding. Therefore this study aims at looking the trends in
the planning and budgetary process with a view to quantify the financial needs. It is
envisaged that this study would serve as a signpost and would lead to more detailed and
complex analysis of actual cost of implementing the NBAP.

20
4. FINANCIAL NEEDS ASSESSMENT BASED ON QUANTITATIVE TARGETS9
Role of quantitative targets in finance solutions for Biodiversity Finance Plan
For purposes of Biodiversity Financing Plan (BFP), an overall resources gap (essentially
FNA – BER) is not of much help in identifying priorities for planning activities. Gap in
resources would need to be assessed against specific activities that need to be taken up in
respect of different thematic areas and NBTs contained in NBAP. The action points of
NBAP 2008 as well as NBTs introduced in 2014, however, do not contain quantitative
targets. Hence, there is a need to consider NBAP along with targets contained in biodiversity
relevant national policies/national missions/national action plans/national commitments such
as India’s Nationally Determined Contribution under UNFCCC, etc. It may be noted that,
these policies, etc have also been approved at the highest levels in government and
therefore a holistic approach by way of considering the NBAP along with these policies, etc
is necessary to arrive at specific actions to close the gap between present status (baseline)
and the target/goal.
In fact, specific action-wise gap in resources would help identify the finance solutions
including new and innovative solutions necessary in addition to the financing mechanisms
presently in place. In turn, this would help in drafting BFP with specific action-wise
timeframes, additional resources needed and the appropriate finance solutions to be put in
place.
A case in point is that of river conservation. The national Environmental Policy, 2006
identifies degradation of water resources as a key environmental challenge. Water borne
diseases attributable to poor bacterial quality of drinking water account for a large proportion
of disease burden amongst children1. Given that discharge of untreated/partially treated
sewage is the major source of bacterial and organic pollution load discharged in to rivers, the
government has identified river cleaning with focus on sewage collection and treatment as a
priority area. The national action plans such as the Ganga Action Plan launched in 1986,
National River Conservation Plan and the National Mission Clean Ganga launched in 2015
are in pursuance of this national commitment to clean up rivers.
It may be noted that ecosystem restoration in terms of river rejuvenation by arresting
pollution discharge in to rivers is fully aligned with Aichi Biodiversity target 8 which deals with
reduction in pollution load and target 15 which involves restoration of ecosystems. Also, the
expected outcome in terms of reduction in water borne diseases burden amongst children is
aligned with SDG 3, in particular, Sustainable Development Target 3.9 which seeks to
reduce by 2030 illnesses and deaths on account of factors including water pollution.
1 http://www.downtoearth.org.in/news/dirty-air-and-water-increase-cradle-deaths-in-
india-57305
Baselines and Targets available
4.1. River Rejuvenation and Conservation
As per assessment carried out by the Central Pollution Control Board, as of March, 2015, for
Class I cities, sewage generated = 61,948 MLD. As against this, total treatment capacity
available = 23,277 MLD leaving a gap of 38, 671 MLD. Considering Class II cities also, the
9 Adopted from the Primary Work done by Dr. V.Rajagopalan, Senior Technical Advised, UNDP-BIOFIN India Project.

21
gap can be approximately taken as 40,000 MLD. Assuming a cost of INR 5 Crs. per MLD to
collect and treat sewage (cost of sewerage plus cost of setting up sewage treatment plants),
the amount to be invested works out to INR 200,000 Crs.
Ensuring 100% treatment of waste water is necessary given inadequate flow and poor
assimulative capacity in a large number of river stretches, particularly, in the lean season,
abstraction for drinking water purposes and extensive bathing during religious occasions.
This would help rejuvenate and restore polluted rivers as ecological entities supporting
aquatic biodiversity which requires a certain minimum level of dissolved oxygen not available
at present in several polluted rivers due to high organic pollution load discharged by way of
untreated/partially treated domestic wastewater. The importance of river rejuvenation in
terms of human health has already been mentioned earlier.
Assuming that 100% domestic wastewater treatment would be achieved for the entire
country in 30 years, proportionate targets, requirement of resources, availability of resources
under government schemes (Central govt. share as well as the share of States in centrally
sponsored schemes such as NRCP, NMCG and sewerage and sewage treatment
components of JNNURM, AMRUT) will need to be taken in to account to arrive at funding
gap over the next 5 years and 15years. Needs assessment is shown below.
Table 1 Needs assessment for rejuvenation of rivers
Capacity gap to ensure 100% treatment of sewage (in MLD)
Per year sewerage and treatment capacity to be created to close the gap in 30 years (in MLD)
Annual investment needed @ INR 5 Crs. per MLD
Investment needed during next 5 years
Investment needed during next 15 years
Investment needed to close the gap and ensure 100% treatment
40,000 1333.33 6667 33,333 100,000 200,000
Industrial pollution abatement is the responsibility of individual industrial units and tightening
of regulatory regime and strict enforcement would take care of this except in the case of
SMEs for which CETPs have already been installed at most of the locations with a cluster of
polluting SMEs.
4.2. Forest and Tree Cover (FTC):
The India State of Forest Report (ISFR), 2017 brought out by Forest Survey Of India (FSI)
reveals that forest and tree cover has gone up by 8021 sq.km. (6778 sq.km. of forest cover
and 1243 sq.km. of tree cover) as compared to the 2015. Forest and tree cover consists of
forest cover and trees outside forests (TOF). The break-up as per the 2017 report is as
follows:

22
Table 2 Forest and Tree Cover as per ISFR, 2017
Total Forest cover2 Tree cover(Trees outside forest)3
Total forest and tree cover
Area in sq.km
Percent of country’s geographical area
Area in sq.km
Percent of country’s geographical area
Area in sq.km
Percent of country’s geographical area
7,08,273 21.54 93,815 2.85 8,02,088 24.39
2 Includes all areas more than 1 ha in extent and having tree canopy density of 10% and
above irrespective of land use and legal status. 3 Includes small patches of trees less than 1 ha in extent, such as trees in small scale
plantations, compact blocks, woodlots or trees along linear features such as road, canals,
bunds, etc and scattered trees not captured in forest cover mapping.
Break-up of total forest cover4 in terms of different density categories is as follows:
Table 3 Density-wise Break-up of forest cover
Very Dense Forest5 (VDF)
Moderate Dense6
Forest (MDF) Open Forest7 (OF)
Area in sq.km.
Percent of geographical area
Area in sq.km.
Percent of geographical area
Area in sq.km.
Percent of geographical area
98,158 2.99 3,08,318 9.38 3,01,797 9.18
4 The total forest cover of 7,08,273 sq.km. amounting to 21.54% of the country’s
geographical area includes mangroves (4921 sq.km) but does not include area under
scrubs8 of 45,979 sq.km. amounting to 1.4% of the geographical area. 5 Tree canopy density of 70% and above 6 Tree canopy density of at least 40% and below 70% 7 Tree canopy density of at least 10 and below 40% 8 Degraded forest land with canopy density less than 10%
Further, MoEF&CC has released a draft national forest policy 2018. In this, the goal of
achieving a minimum one third of the total land area under forest and tree cover for country
as a whole has been retained. This would involve afforestation/reforestation to cover the gap
in terms of forest and tree cover in addition to reversing the degradation of forest by taking
up rehabilitation. In fact, afforestation/reforestation to substantially increase the forest and
tree cover as well as rehabilitation of degraded forests form part of the objectives of the
policy. In addition, the draft policy also reiterates India’s commitment relating to forestry by
way of Intended Nationally determined Contribution (INDC) under UNFCCC.
http://envfor.nic.in/content/inviting-comments-all-concerned-stakeholders-draft-national-
forest-policy-2018

23
India submitted its INDC under UNFCCC in 2015 and committed to creating an additional
carbon sink of 2.5 to 3 billion tons of CO2 equivalent through additional forest and tree cover
by 2030. It may also be noted that, addressing the drivers of degradation and deforestation
as well as afforestation of degraded areas forms part of the objectives of India’s draft REDD
+ Policy and Strategy released in 2016.
Of course, to ensure maximum biodiversity benefits and also restoration of degraded
ecosystems, care has to be taken to ensure planting endemic tree species rather than be
guided by commercial considerations which could prove to be counter- productive.
Keeping in view the foregoing and considering the intrinsic link between biodiversity and
forests, the following targets need to be considered to implement NBAP.
(a) Creating additional forest and tree cover (FTC) to the extent of 2,94,000 sq.km. to bridge
the gap (8.94%) between the present level of 24.39% and the national goal of 33.33% of
the country’s geographical area.
(b) Improving quality of forest cover in ‘open forest’ area of 3,01,797 sq.km.
Assuming INR 120,000 per hectare as cost of creating additional FTC and INR 60,000 per
hectare9 as cost of improving quality of ‘open forest’ land, the total investment needed works
out to INR 533,878 Crs. Between the 2015 ISFR and 2017 ISFR of FSI, FTC has gone up
by about 1%10 . However, given the enormous gap between the goal of one third forest
cover and the present FTC and also taking in to account India’s commitment in the form of
INDC under UNFCCC, it would be in order to assume that the gap in terms of FTC as well
as improving quality of open category degraded forest land would be achieved over the next
30 years.
9 Based on cost norms adopted by MoEF&CC in providing assistance to states under the
Green India Mission (GIM). However, as unskilled labour wage rates in the States are more
than double the rate assumed by MoEF&CC (Rs.100 per day), the rates assumed are 100%
more than corresponding GIM rates. In the case of restoration of degraded forest, INR
60,000 per hectare assumed is twice the Type B norm of INR 30,000 per hectare and for
creating additional FTC, the cost assumed of INR 120,000 is twice the the average cost
norm for agro and social forestry under GIM of INR 60,000 (approx..).
10http://pibphoto.nic.in/documents/rlink/2018/feb/p201821201.pdf
This would require adding FTC at an annual rate of 9800 sq.km and improving degraded
open category forest land at an annual rate of 10060 sq.km. Accordingly, for the next five
and 15 years, the fund requirement would be as follows:
Table 4 Cost of creating additional FTC and improving degraded open forest
Creating additional FTC Improving quality of degraded open forest
Per year FTC to be created (sq.km)
Cost per year @120,000,00 per sq.km.
Cost for 5 years
Cost for 15 years
Per year afforestation of open forest (sq.km)
Cost per year @60,000,00 per sq.km.
Cost for 5 years
Cost for 15 years
9800 11,760 Crs.
58,800 Crs.
176,400Crs.
10060 6,036 Crs.
30,180 Crs.
90,540 Crs.

24
The gap in funding over these timeframes would need to be worked out considering
resources available under National Afforestation Programme, scheme of National
Afforestation and Eco-development Board of MoEF&CC, Green India Mission, CAMPA, etc.
4.3. Relocation of people from core areas of tiger reserves
As of 2016, the number of families still residing in core areas of tiger reserves has been
estimated as 44,506. The protected area-wise data is given below. The National Tiger
Conservation Authority (NTCA) has declared a package of INR 1 million per family in lieu of
physical rehabilitation. At this rate, the cost of relocating and rehabilitating all the families
would be INR 4451 Crs. The cash compensation package of INR 1 million is all inclusive and
subsumes all costs associated with physical rehabilitation including provision of cultivable
land, homestead, etc.
However, it is well recognized that usually families relocate voluntarily only after at least one
son becomes a major when he separately becomes entitled for INR 1 million rehabilitation
package. Hence, the total cost of rehabilitating people from core and critical tiger habitats
could be assumed to be 2 X INR 4451 Crs. = INR 8902 Crs.
The resources available for this purpose with NTCA could be considered to evaluate the
resources gap.
9 Source: NTCA
4.4. Cleaning/Restoration of wetlands and lakes
(a) . The National Wetlands Atlas, 2011 of published by MoEF&CC covers all water bodies
including rivers/streams (34.46%), reservoirs and barrages (16.26%), inter-tidal mud-flats
(15.82%), lakes and ponds (4.78%), tanks and ponds (8.59%), etc. In all, wetlands
(inclusive of all water bodies as above) occupy a total area of 15.26 Million hectares and
account for 4.63% of the total geographical area of the country. Thus, lakes, ponds and
tanks account for 13.37% of the total wetlands area and cover an area of 2.04 Million
hectares.
The cost of restoration of lakes varies from INR 0.3 Cr. To 0.43 Cr10 under the MoEF&CC
scheme of National Program for Conservation of Aquatic Ecosystems (NPCA) which covers
lakes and wetlands. Distinction between lakes and wetlands has been made on the basis of
water spread area with lakes being larger than wetlands. Under NPCA, while wastewater
treatment is a significant component (about 30%) in restoration of lakes, this activity is
normally not a component in restoration of wetlands.
Keeping the foregoing in view, it would be reasonable to presume that, on an average,
under the MoEF&CC scheme of NPCA, for lakes and wetlands put together, the cost per
hectare would be INR 0.3 Cr. and that 70% of the cost would be taken up by activities other
than wastewater treatment such as catchment area treatment, de-silting and de-weeding,
restoration of hydrological regime, etc.
Since 100% of the entire domestic waste treatment costs are accounted for under
rejuvenation/conservation of rivers, to avoid double counting, it is proposed to consider 0.21
Cr. per hectare (70% of INR o.3 Cr.) as the cost of restoration of degraded lakes, ponds and
wetlands.

25
Of the total area of 2.04 million hectares under lakes, ponds and tanks as per the National
Wetlands Atlas, 2011, if it is assumed that, at least 10% of the water body area would
require restoration, the cost of restoration would amount to INR 42,840 Crs.
In terms of available resources, budgetary support available under the following programs of
GOI and schemes of State Govts., if any, would need to be considered to arrive at the
resources gap.
1. NPCA
2. Repair, Renovation and Restoration of Water Bodies of the Ministry of Water Resources,
River Development and Ganga Rejuvenation
10 Source: MoEF&CC
4..5. Sanitation
The funding requirement as per SBM (Urban) is Rs. 62,009 Crs. Of this, Rs. 14,623 Crs.
would come from GOI and Rs. 4,874 Crs. from the State Govts. The balance is to be raised
from various sources – private sector, CSR, external assistance, user charges, market
borrowing, etc.
Like-wise, as of 2015, SBM as a whole was estimated to cost Rs. 2 lakh Crs. over the next
five years to construct 12 Cr. toilets and make India open defecation free by 201911.
SBM seeks to eliminate open defecation and manual scavenging. It includes IEC, capacity
building, individual, community and public toilets, solid and liquid waste management, etc.
Domestic wastewater treatment costs for rejuvenation of rivers and wetlands do not account
for non-point sources of pollution. However, as SBM seeks to eliminate open defecation by
2019 and thereby eliminate the principal source of non-point pollution impacting water quality
of rivers and wetlands, in making 5 and 15 year projections of fund requirements for
rejuvenation of rivers and wetlands, costs involved in eliminating non-point sources of
pollution could be ignored.
11https://economictimes.indiatimes.com/news/economy/infrastructure/swachh-bharat-
abhiyaan-government-builds-7-1-lakh-toilets-in-january/articleshow/46269612.cms
4.6. Invasive Alien Species (IAS)
The India State of Forest Report (ISFR), 2017 of FSI states that, by way of a change in
sampling design, the National Forest Inventory (NFI) which would be published in ISFR
2019 would cover many more parameters – Non-Timber Forest Produce, IAS, water
availability near the sample plot, etc. IAS outside forested areas would also be covered as
the sampling design would cover plots both inside and outside recorded forest areas.
Clearing IAS inside protected areas has to take in to consideration aspects such as carrying
capacity in respect of tiger population, etc.
The problem of IAS has been recognized as the second most important cause (after
diversion of forest land for non-forest use and habitat fragmentation)12 for biodiversity loss in
India. Hence,mainstreaming concerns surrounding IAS in the planning process at Central

26
and State levels and getting adequate resources allocated especially under large multi-
purpose programs such as MNREGA could be a priority item under BFP. However, in the
absence of reliable, country-wide data on IAS, there is no option but to wait till 2019 to get
the data and accordingly decide on targets for clearing IAS and figure out an appropriate
finance solution.
12 India’s Fifth National Report under the Convention on Biodiversity

27
5. ESTIMATE OF TOTAL FUNDS NEEDED INCLUDING FOR QUANTITATIVE
TARGETS (INR IN CRORES) PER ANNUM FOR THE IMPLEMENTATION OF
NATIONAL BIODIVERSITY ACTION PLAN
The Plan estimations projections provided ‘business as usual scenario’ for biodiversity
funding, as the Plan budgeting in India essentially followed the incremental budgeting
process and hence considered to provide an approximate idea on of the funding needs for
the given period. Hence, financial needs assessment based on quantitative targets (as
gathered from relevant national policy documents/strategies/commitments), by incorporating
baselines and unit costs wherever available, in areas such as Forest and Tree cover, River
rejuvenation and conservation, Conservation of core tiger habitats, Cleaning/restoration of
wetlands and lakes and sanitation have been undertaken to arrive at the overall funding
needs for the implementation of the NBAP and the NBTs.
The projected financial requirements during the 12th FYP, under the ‘business as usual
scenario’ spread across 178 schemes and programmes of 24 Ministries and 2 Departments
yielded an annual estimate of Rs.71,347.80 crores. Additional assessments by incorporating
on quantitative targets yielded an annual estimate of Rs. 26,785 crores. A combined
financial needs assessment, after accounting for overlap between the two assessments,
yielded an annual requirement to the tune of Rs. 91,437 crores were estimated.
Biodiversity Financial Needs Assessment for the period 2012-13 to 2016-17
(at Central Government level based on Working Group Documents)
No. of
Ministries
No. of
Departments
No. of
Schemes
12FYP (2012-17)
Needs Projection
Average Annual Biodiversity
Attributable Needs
Projection (2012-17)
24 2 178 356738.98 Crs 71347.80 Crs.
Biodiversity Financial Needs Assessment for the period 2012-13 to 2016-17 (annual needs)
Needs assessment from WG Reports of the 12FYP
Needs assessment from quantitative targets
Reassessed total financial needs after adding requirements on
quantitative targets*
Rs. 71,348 Crs.
Rs. 26,785 Crs. Rs. 91,437 Crs.
*After taking in to account overlap between the two assessments: Additional Details of projections
available in: Rajagopalan, V., (2018). Biodiversity Finance Plan, Version 1. UNDP-BIOFIN India
Project.
****************

28
Annexures
FINANCIAL ATTRIBUTIONS AND THE ASSOCIATED SCHEMES AND PROGRAMMES
DURING THE 12 FYP (2012-17)

29
No
of
Sch
eme
Ministry / Department Name of the Working Group / Streering
Committee of the 12 FYP (2012-2017)
Name of the Plan/ Scheme/Service/Project
12th
Pla
n
Req
uire
men
t
(Rs.
in
Cro
res)
BD
Rel
evan
c
e (R
io
Mar
ker)
Att
ribut
io
n
Coe
ffic
ie
nt
Fiv
e ye
ar
need
s
proj
ectio
n
(201
2-
2017
) A
nnua
l
need
s
proj
ectio
n
(Rs.
in
Cro
res)
1 Ministry of Agriculture Animal Husbandry and Dairying Cattle and buffalo Breeding (Development) 8500.00 Indirect medium 0.375 3187.50 637.50
2 Ministry of Agriculture Animal Husbandry and Dairying Mission on pigs 700.00 Indirect medium 0.375 262.50 52.50
3 Ministry of Agriculture Animal Husbandry and Dairying Small ruminants, rabbits and broiler buffalo calves 400.00 Indirect medium 0.375 150.00 30.00
4 Ministry of Agriculture Animal Husbandry and Dairying Poultry development including venture capital fund 600.00 Indirect medium 0.375 225.00 45.00
5 Ministry of Agriculture Animal Husbandry and Dairying Conservation of threatened livestock breeds 200.00 Indirect medium 0.375 75.00 15.00
6 Ministry of Agriculture Animal Husbandry and Dairying Fodder & feed development 2000.00 Indirect medium 0.375 750.00 150.00
7 Ministry of Agriculture Animal Husbandry and Dairying Livestock Insurance, census and sample survey 900.00 Indirect medium 0.375 337.50 67.50
8 Ministry of Agriculture Animal Husbandry and Dairying Livestock extension and delivery of services and women empowerment
200.00 Indirect medium 0.375 75.00 15.00
9 Ministry of Agriculture Animal Husbandry and Dairying Disease Control – Immunization for important diseases, disease surveillance, diagnostic laboratories, veterinary infrastructure, drug control authority, mobile veterinary clinics, traceability & food safety
7000.00 Indirect medium 0.375 2625.00 525.00
10 Ministry of Agriculture Animal Husbandry and Dairying Strengthening infrastructure - Veterinary Education 4000.00 Indirect medium 0.375 1500.00 300.00
11 Ministry of Agriculture Animal Husbandry and Dairying Dairy Development activities (including for Clean Milk Production)
2500.00 Indirect medium 0.375 937.50 187.50
12 Ministry of Agriculture Animal Husbandry and Dairying National Dairy Plan (NEW) 1760.00 Indirect medium 0.375 660.00 132.00
13 Ministry of Agriculture Animal Husbandry and Dairying Dairy Venture Capital Fund 2500.00 Indirect medium 0.375 937.50 187.50
14 Ministry of Agriculture Natural Resource management and Rainfed Farming
National Rainfed Areas Program (New Scheme) 10500.00 Indirect medium 0.375 3937.50 787.50
15 Ministry of Agriculture Natural Resource management and Rainfed Farming
Mainstream programs of respective departments “Rainfed Investment Windows” (in agriculture, animal husbandry, horticulture, fisheries, ground water, civil supplies) -
MoWR, RD &GR
2000.00 Indirect medium 0.825 1650.00 330.00
16 Ministry of Agriculture Natural Resource management and Rainfed Farming
National Food Security Mission (NFSM) : Create separate window with in the National Food Security Mission for “Local Food Security in rainfed areas’”– focusing on intensive area
based Agronomic Innovations (CA, SRI and LEISA/NPM) where local food security through increasing productivity of all subsistence food crops (rice, millets, pulses and edible oil seeds) of small holders be taken up.
2000.00 Major scheme 0.102 204.00 40.80
17 Ministry of Agriculture Natural Resource management and Rainfed Farming
Evolving institutional architecture for rain fed areas 500.00 Indirect medium 0.375 187.50 37.50
18 Ministry of Agriculture Natural Resource management and Rainfed Farming
Diversified crop patterns and comprehensive initiative on millets and minor pulses including integration of millets
into PDS (Crop Husbandry)
550.00 Indirect medium 0.375 206.25 41.25
19 Ministry of Agriculture Natural Resource management and Rainfed Farming
Commons pilot initiatives and facilitating policy at state levels (Mapping and characterizing common lands)
20.00 Indirect medium 0.375 7.50 1.50
20 Ministry of Agriculture Natural Resource management and Rainfed Farming
Wider extension of support irrigation to secure kharif rainfed crops and Participatory Groundwater management
300.00 Indirect medium 0.825 247.50 49.50
21 Ministry of Agriculture Outreach of Institutional Finance, Cooperatives and Risk Management
National Cooperative Development Corporation (NCDC) 3850.00 Indirect medium 0.375 1443.75 288.75
22 Ministry of Agriculture Outreach of Institutional Finance, Cooperatives and Risk Management
Modified National Agricultural Insurance Scheme (MNAIS) 14300.00 Indirect marginal 0.025 357.50 71.50

30
23 Ministry of Agriculture Horticulture and Plantation Crops (Horticulture Development Programmes of
Horticulture Division of DAC and Commodity Boards of the Ministry of Commerce)
Area Expansion Programmes in Integrated Project Mode including protected cultivation
10000.00 Indirect medium 0.375 3750.00 750.00
24 Ministry of Agriculture Horticulture and Plantation Crops Productivity Enhancement of Existing Orchards / Production Clusters in Project Mode including pollination
support
10000.00 Indirect medium 0.375 3750.00 750.00
25 Ministry of Agriculture Horticulture and Plantation Crops Additional Provision for NE region, Hilly areas and scheduled areas and small & marginal Farmers etc
3000.00 Indirect medium 0.375 1125.00 225.00
26 Ministry of Agriculture Horticulture and Plantation Crops Infrastructure development for Input production 250.00 Indirect medium 0.375 93.75 18.75
27 Ministry of Agriculture Horticulture and Plantation Crops Supply Chain Management, Post-Harvest Management 7300.00 Indirect medium 0.375 2737.50 547.50
28 Ministry of Agriculture Horticulture and Plantation Crops Marketing Infrastructure, HRD & Market information 2000.00 Indirect medium 0.375 750.00 150.00
29 Ministry of Agriculture Horticulture and Plantation Crops Enhancing Export Competitiveness 250.00 0.000 0.00 0.00
30 Ministry of Agriculture Horticulture and Plantation Crops Human Resource Development 250.00 0.000 0.00 0.00
31 Ministry of Agriculture Horticulture and Plantation Crops Horticulture Database 175.00 Indirect medium 0.375 65.63 13.13
32 Ministry of Agriculture Horticulture and Plantation Crops Crop Insurance and Setting up Weather Stations 250.00 Indirect marginal 0.025 6.25 1.25
33 Ministry of Agriculture Horticulture and Plantation Crops Schemes of Coconut Development Board 1000.00 Indirect medium 0.375 375.00 75.00
34 Ministry of Agriculture Horticulture and Plantation Crops Schemes Components of Bamboo Development 500.00 Indirect medium 0.375 187.50 37.50
35 Ministry of Agriculture Horticulture and Plantation Crops Horticulture Promotion Services‐ NCCD 25.00 Indirect medium 0.375 9.38 1.88
36 Ministry of Agriculture Horticulture and Plantation Crops Schemes of Tea Board (shifted to MoCI) 1600.00 0.000 0.00 0.00
37 Ministry of Agriculture Horticulture and Plantation Crops Schemes of Coffee Board (shifted to MoCI) 1200.00 0.000 0.00 0.00
38 Ministry of Agriculture Horticulture and Plantation Crops Schemes of Rubber Board (shifted to MoCI) 1180.00 0.000 0.00 0.00
39 Ministry of Agriculture Horticulture and Plantation Crops Schemes of Spice Board (shifed to MoCI) 900.00 0.000 0.00 0.00
40 Ministry of Agriculture Agricultural Marketing Infrastructure, Secondary Agriculture and Policy Required
for Internal and External Trade
Secondary Agriculture – Medicinal and Aromatic plants 300.00 Indirect veryhigh 0.825 247.50 49.50
41 Ministry of Agriculture Agricultural Marketing Infrastructure, Secondary Agriculture and Policy Required for Internal and External Trade
Secondary Agriculture –Organic farming 200.00 Indirect veryhigh 0.825 165.00 33.00
42 Ministry of Agriculture Agricultural Marketing Infrastructure, Secondary Agriculture and Policy Required for Internal and External Trade
Secondary Agriculture – Stevia 200.00 Indirect veryhigh 0.825 165.00 33.00
43 Ministry of Agriculture Agricultural Marketing Infrastructure, Secondary Agriculture and Policy Required for Internal and External Trade
Biomass and Residue utilization 1000.00 Indirect medium 0.375 375.00 75.00
44 Ministry of Agriculture Agricultural Research and Education Crop Science, including Plant Protection and Seed 10000.00 Major scheme 0.235 2350.00 470.00
45 Ministry of Agriculture Agricultural Research and Education Horticulture (Central Institute of Horticulture) 4000.00 Indirect medium 0.375 1500.00 300.00
46 Ministry of Agriculture Agricultural Research and Education Natural Resource Management 3500.00 Indirect medium 0.375 1312.50 262.50
47 Ministry of Agriculture Agricultural Research and Education Agricultural Engineering 1500.00 Indirect marginal 0.025 37.50 7.50
48 Ministry of Agriculture Agricultural Research and Education Animal Sciences 3500.00 Indirect marginal 0.375 1312.50 262.50
49 Ministry of Agriculture Agricultural Research and Education Fisheries 1000.00 Indirect marginal 0.375 375.00 75.00
50 Ministry of Agriculture Agricultural Research and Education Agricultural Education 10000.00 Indirect marginal 0.025 250.00 50.00
51 Ministry of Agriculture Agricultural Research and Education Agricultural Extension 9000.00 Indirect marginal 0.025 225.00 45.00
52 Ministry of Agriculture Agricultural Research and Education Agricultural Economics, Marketing and Statistics 100.00 Indirect marginal 0.025 2.50 0.50
53 Ministry of Agriculture Agricultural Research and Education ICAR/DARE Headquarters, CAU 1000.00 Indirect medium 0.375 375.00 75.00
54 Ministry of Agriculture Agricultural Research and Education Structure, Modification of ICAR, IPR etc. 300.00 Indirect medium 0.375 112.50 22.50
55 Ministry of Agriculture Agricultural Research and Education Externally Aided (NAIP, Indo-US, National Fund, NAEP) 1500.00 Indirect medium 0.375 562.50 112.50

31
56 Ministry of Agriculture Agricultural Research and Education Extra-mural funding 1000.00 0.000 0.00 0.00
57 Ministry of Agriculture Agricultural Research and Education Farmer Innovation, Agril. Entrepreneuship, National innovation,
public-private partnership, Agril.India funds
1100.00 Indirect medium 0.375 412.50 82.50
58 Ministry of Agriculture Development and Management of Fisheries and Aquaculture
Development of Marine Fisheries, Infrastructure and Post-Harvest Operations - NFDB
1000.00 Indirect medium 0.375 375.00 75.00
59 Ministry of Agriculture Development and Management of Fisheries and Aquaculture
Development of Inland Fisheries and Aquaculture - National Fishery Development Board
1200.00 Indirect medium 0.375 450.00 90.00
60 Ministry of Agriculture Development and Management of Fisheries and Aquaculture
Human Resource Development in Fisheries Sector - NFDB 300.00 Indirect medium 0.375 112.50 22.50
61 Ministry of Agriculture Development and Management of Fisheries and Aquaculture
National Scheme on Welfare of Fishermen and Women - DAHD&F
800.00 Indirect medium 0.375 300.00 60.00
62 Ministry of Agriculture Development and Management of Fisheries
and Aquaculture
Strengthening of Data base in Fisheries Sector - DAHD&F 300.00 Indirect medium 0.375 112.50 22.50
63 Ministry of Agriculture Development and Management of Fisheries and Aquaculture
Monitoring, Control & Surveillance; Strengthening of Policy and Legal Frameworks and other Need-based Interventions - DAHD&F
800.00 Indirect medium 0.375 300.00 60.00
64 Ministry of Agriculture Development and Management of Fisheries and Aquaculture
Assistance to Fisheries Institutions – NFDB & DAHD&F 600.00 Indirect medium 0.375 225.00 45.00
65 Ministry of Agriculture Development and Management of Fisheries
and Aquaculture
National Fisheries Development Board - NFDB 1000.00 Indirect medium 0.375 375.00 75.00
66 Ministry of Agriculture Agricultural Extension for Agriculture and Allied Sectors
Technology solutions and innovations (AICRP on Technology, mapping, adoption and innovations, National Technology Solutions Project, ICAR-SAU extension initiatives, National
Farm Innovation Foundation).
375.00 Indirect medium 0.375 140.63 28.13
67 Ministry of Agriculture Agricultural Extension for Agriculture and Allied Sectors
Women Empowerment, Household Food & Nutritional Security (Promoting Kitchen Gardening Group/ Association
510.00 Indirect medium 0.375 191.25 38.25
68 Ministry of Agriculture Agricultural Extension for Agriculture and Allied Sectors
Extension Strategy for Difficult Areas (Coastal Area Sustainable Agriculture Development Programme)
100.00 Indirect marginal 0.025 2.50 0.50
69 Ministry of Agriculture DAC Protection of Plan varieties and Farmer’s Rights 220.00 Major scheme 0.235 51.70 10.34
70 Ministry of AYUSH Working group on AYUSH System Strengthening - AYUSH 1409.00 Indirect veryhigh 0.825 1162.43 232.49
71 Ministry of AYUSH Working group on AYUSH Educational Institution - AYUSH 5246.55 0 0.00 0.00
72 Ministry of AYUSH Working group on AYUSH Research and Development including Medicinal Plants (including National Medicinal Plants Board) (Sub head -
Medicinal Plants)
4446.50 Indirect veryhigh 0.825 3668.36 733.67
73 Ministry of AYUSH Working group on AYUSH Development of AYUSH Industry 1010.50 Indirect veryhigh 0.825 833.66 166.73
74 Ministry of AYUSH Working group on AYUSH Funding of NGOs engaged in local health traditions, midwifery
practices etc, under NRHM
100.00 Indirect veryhigh 0.825 82.50 16.50
75 Ministry of AYUSH Working group on AYUSH Promotion of AYUSH (National Mission on AYUSH) 7425.00 Indirect veryhigh 0.825 6125.63 1225.13
76 Ministry of AYUSH Working group on AYUSH National Mission on Medicinal Plants 1710.00 Indirect veryhigh 0.825 1410.75 282.15
77 Ministry of AYUSH Working group on AYUSH Setting up of National Institute of Medicinal Plants 100.00 Indirect veryhigh 0.825 82.50 16.50
78 Ministry of AYUSH Working group on AYUSH Mainstreaming of AYUSH under NRHM 10000.00 Indirect veryhigh 0.825 8250.00 1650.00
79 Ministry of Chemicals and Fertilizers
Indian Chemical Industry Technology up-gradation fund (To promote investments in R&D and green technologies)
500.00 0 0.00 0.00
80 Ministry of Chemicals and Fertilizers
Working group on Fertilizer Industry Bio/organic fertilizers 100.00 Indirect veryhigh 0.825 82.50 16.50
81 Ministry of Coal Working group on Coal and Lignite Conservation and Safety in Coal Mines 820.00 Indirect marginal 0.025 20.50 4.10

32
82 Ministry of Coal Working group on Coal and Lignite Environmental Measures & Subsidence Control (EMSC) Schemes
9657.61 Indirect marginal 0.025 241.44 48.29
83 Ministry of Coal Working group on Coal and Lignite Clean Coal Technologies (R & D program) 1326.00 Indiect marginal 0.025 33.15 6.63
84 Ministry of Commerce and Industry
Outcome budget document – Dept. of Commerce
Agricultural Products Export Development Authority (APEDA)
1100.00 Major scheme 0.078 85.80 17.16
85 Ministry of Commerce and Industry
Outcome budget document – Dept. of Commerce
Marine Products Export Development Authority (MPEDA) 750.00 Major scheme 0.15 112.50 22.50
86 Ministry of Commerce and Industry
Outcome budget document – Dept. of Commerce
Tea Board 1425.00 Indirect low 0.15 213.75 42.75
87 Ministry of Commerce and Industry
Outcome budget document – Dept. of Commerce
Coffee Board 950.00 Indirect low 0.15 142.50 28.50
88 Ministry of Commerce and
Industry
Outcome budget document – Dept. of
Commerce
Rubber Board 910.00 Indirect low 0.15 136.50 27.30
89 Ministry of Commerce and Industry
Outcome budget document – Dept. of Commerce
Spices Board 670.00 Indirect low 0.15 100.50 20.10
90 Ministry of Commerce and
Industry
Outcome budget document – Dept. of
Commerce
Cashew EPC 30.00 Indirect low 0.15 4.50 0.90
91 Ministry of Commerce and Industry
Working group on Cement Industry National Council for Cement and Building Materials (sequestration of carbon-dioxide in algae culture)
150.00 0 0.00 0.00
92 Ministry of Communication and Technology
In March 2010, the Cabinet Committee on Infrastructure (CCI) approved the establishment of the National Knowledge Network (NKN) at an outlay of Rs 5990
Crore, to be implemented by NIC over a period of 10 years.
National Knowledge Network 2995.00 Indirect marginal 0.025 74.88 14.98
93 Ministry of Culture Working Group on Art and Culture Conservation & Development of movements & Archeological sites by State/UT, colleges & State 9 (28 World Heritage Sites
located at present in India are managed by ASI, MoEFCC Ministry of Railways, Government of Rajasthan, etc.
695.00 Multi purpose 0.056 38.92 7.78
94 Ministry of Development of
North Eastern Region
http://www.mdoner.gov.in/content/12th-plan-
projected-outlay
North Eastern Climate Change Adaption Project [assisted
by German Govt. and a German Bank-Kfw]
457.90 Indirect marginal 0.025 11.45 2.29
95 Ministry of Development of North Eastern Region
http://www.mdoner.gov.in/content/12th-plan-projected-outlay
NER Livelihoods Project (World Bank Assisted) 670.00 Indirect marginal 0.025 16.75 3.35
96 Ministry of Drinking Water
and Sanitation
Report of the Working Group on Rural
Domestic Water and Sanitation
National Rural Drinking Water Programmes –
Sustainability component
20463.00 Major scheme 0.175 3581.03 716.21
97 Ministry of Drinking Water and Sanitation
Report of the Working Group on Rural Domestic Water and Sanitation
National Rural Drinking Water Programmes – Natural calamity component
2728.00 Major scheme 0.175 477.40 95.48
98 Ministry of Drinking Water and Sanitation
Nirmal Bharat Abhiyan (NBA) in the XIIth Five Year Plan { Ministry of Drinking Water & Sanitation}
Nirmal Bharat Abhiyan /Swachh Bharat Abhiyan 322147.00 Multi purpose 0.206 66362.28 13272.46
99 Ministry of Earth Sciences Working Group on Earth System organization Atmospheric processes and Modeling and Services -
Agrometorology
265.00 Indirect marginal 0.025 6.63 1.33
100 Ministry of Earth Sciences Working Group on Earth System organization Ocean observations- Moored buoys, drifting buoys, current meters etc.
386.00 Indirect marginal 0.025 9.65 1.93
101 Ministry of Earth Sciences Working Group on Earth System organization Ocean observations - Sustained Indian Ocean Biogeochemical and Ecological Research (SIBER) and Geotraces
100.00 Multi purpose 0.146 14.60 2.92

33
102 Ministry of Earth Sciences Working Group on Earth System organization Ocean Science and Services - Ocean information and services
73.00 Multi purpose 0.412 30.08 6.02
103 Ministry of Earth Sciences Working Group on Earth System organization Ocean Science and Services - Ocean Research and Modelling
75.00 Multi purpose 0.146 10.95 2.19
104 Ministry of Earth Sciences Working Group on Earth System organization Ocean Science and Services - INCOIS -Operations and Maintenance
195.00 Multi purpose 0.412 80.34 16.07
105 Ministry of Earth Sciences Working Group on Earth System organization Ocean Science and Services - Marine Living Resources + building + Operation & Maintenance
200.00 Multi purpose 0.5 100.00 20.00
106 Ministry of Earth Sciences Working Group on Earth System organization Ocean Science and Services - Coastal Research (ICMAM
O&M other related projects, COMAPS)
185.00 Multi purpose 0.146 27.01 5.40
107 Ministry of Earth Sciences Working Group on Earth System organization Ocean Science and Services - Drugs from the Sea 200.00 Multi purpose 0.142 28.40 5.68
108 Ministry of Earth Sciences Working Group on Earth System organization Ocean Science and Services - Microbial Oceanography 100.00 Multi purpose 0.142 14.20 2.84
109 Ministry of Earth Sciences Working Group on Earth System organization Ocean Survey & Mineral Resources - Ocean Survey and Resources(EIA, Metallurgy, Hydrothermal sulfides, Cobal Crust)
373.00 Multi purpose 0.093 34.69 6.94
110 Ministry of Earth Sciences Working Group on Earth System organization Ocean Survey & Mineral Resources - Hydrothermal sulfides,
Cobal Crust in the Indian Ocean Ridge
1100.00 Multi purpose 0.093 102.30 20.46
111 Ministry of Earth Sciences Working Group on Earth System organization Ocean Technology (incl. Marine biotechnology, NIOY, Development of Island community
1547.00 Multi purpose 0.142 219.67 43.93
112 Ministry of Earth Sciences Working Group on Earth System organization Polar Science & Cryosphere 2428.00 Indirect low 0.025 60.70 12.14
113 Ministry of Earth Sciences Working Group on Earth System organization Geosciences 174.00 Indirect low 0.025 4.35 0.87
114 Ministry of Earth Sciences Working Group on Earth System organization Earth Science s - Research, Education, Training and Outreach
(incl. Centres of excellence)
1849.00 Multi purpose 0.14 258.86 51.77
115 Ministry of Environment & Forests
Sub-group on Forestry and Sustainable NRM National Afforestation Programme 13500.00 Direct 0.95 12825.00 2565.00
116 Ministry of Environment &
Forests
Sub- group on Forestry and Sustainable
NRM
Capacity Development of the JFMCs, Gram Sabha and other
Stakeholders
2500.00 Indirect high 0.625 1562.50 312.50
117 Ministry of Environment & Forests
Sub-group on Forestry and Sustainable NRM Green India Mission 23000.00 Indirect veryhigh 0.825 18975.00 3795.00
118 Ministry of Environment & Forests
Sub-group on Forestry and Sustainable NRM
Intensification of the Forest Management 2000.00 Direct 0.95 1900.00 380.00
119 Ministry of Environment & Forests
Sub-group on Forestry and Sustainable NRM Satellite based Forest Resource Assessment and Technological based M&E.
1000.00 Direct 0.95 950.00 190.00
120 Ministry of Environment & Forests
Sub-group on non-timber forest produce NTFP - Resource management, Marketing, MSP, CB, IEC, R&D.
6590.00 Indirect high 0.625 4118.75 823.75
121 Ministry of Environment &
Forests
Sub-group on Fodder and Pasture
Management
Mapping of ecologically sensitive grasslands, development of
seed/germplasm banks & nurseries of fodder species etc.
910.00 Direct 0.95 864.50 172.90
122 Ministry of Environment & Forests
Sub-group on Forestry Institutional & Technology Management
FSI, WII, ICFRE, IIFM, IPIRTI, IGNFA, DFE, capacity building, technological upgradation. (Grants in-aid to F&WL Institutions)
6499.00 Direct 0.95 6174.05 1234.81
123 Ministry of Environment & Forests
Sub-group on International Cooperation and Law
Strengthening of International Cooperation and Law 175.00 Indirect low 0.025 4.38 0.88
124 Ministry of Environment &
Forests
Working group on Wildlife Ecotourism and
Animal Welfare
Wildlife Management – Integrated Development of Wildlife
Habitats (IDWH)
3000.00 Direct 0.95 2850.00 570.00
125 Ministry of Environment & Forests
Working group on Wildlife Ecotourism and Animal Welfare
Strengthening of Wildlife Division 775.00 Direct 0.95 736.25 147.25

34
126 Ministry of Environment & Forests
Working group on Wildlife Ecotourism and Animal Welfare
Wildlife Institute of India (WII) 224.18 Direct 0.95 212.97 42.59
127 Ministry of Environment & Forests
Working group on Wildlife Ecotourism and Animal Welfare
Project Tiger 5889.00 Direct 0.95 5594.55 1118.91
128 Ministry of Environment & Forests
Working group on Wildlife Ecotourism and Animal Welfare
Project Elephant 600.00 Direct 0.95 570.00 114.00
129 Ministry of Environment & Forests
Working group on Wildlife Ecotourism and Animal Welfare
Ecotourism for Livelihoods 635.00 Indirect high 0.625 396.88 79.38
130 Ministry of Environment &
Forests
Working group on Wildlife Ecotourism and
Animal Welfare
Animal welfare 300.00 Indirect high 0.625 187.50 37.50
131 Ministry of Environment & Forests
Sub-group on Environment 1. Environment Monitoring &Governance; 2. Pollution abatement, 3. R&D for Conservation & Development.,
4. Conservation of Natural Resources & Ecosystems, 5. Environment Information, Education & Awareness; 6. Taj protection, 7. International Cooperation,
8. National Coastal Management Programme (NCMP) & 9. National River Conservation Plan (NRCP).
4543.00 Indirect veryhigh 0.825 3747.98 749.60
132 Ministry of Environment &
Forests
Sub-group on Climate Change Solar Mission 4337.00 Indirect marginal 0.025 108.43 21.69
133 Ministry of Environment & Forests
Sub-group on Climate Change Energy Efficiency Mission (Ministry of Power) 3400.00 Indirect marginal 0.025 85.00 17.00
134 Ministry of Environment &
Forests
Sub-group on Climate Change Sustainable Habitat Mission 950.00 Indirect marginal 0.025 23.75 4.75
135 Ministry of Environment & Forests
Sub-group on Climate Change Sustainable Agriculture Mission (MoA – National Mission for Sustainable Agriculture)
15000.00 Indirect medium 0.375 5625.00 1125.00
136 Ministry of Environment & Forests
Sub-group on Climate Change Water Mission 0.00 0 0.00 0.00
137 Ministry of Environment & Forests
Sub-group on Climate Change Sustainable Himalayan Eco-Systems 900.00 Indirect marginal 0.025 22.50 4.50
138 Ministry of Environment & Forests
Sub-group on Climate Change Strategic Knowledge Mission 4337.00 Indirect marginal 0.025 108.43 21.69
139 Ministry of Human
Resources Development
Social Sectors – Vol.III (12th Five Year Plan) -
Planning Commission
UGC (multiple schemes including flexi funds 9000.00 Indirect marginal 0.025 225.00 45.00
140 Ministry of Information and Broadcasting
Woking group on Information & Broadcasting sector
Media Outreach Programme and Publicity for Special Events (PIB)
100.00 Indirect marginal 0.025 2.50 0.50
141 Ministry of New and Renewable Energy
Working group on power Bio-mass based Renewable Energy 10500.00 Indirect marginal 0.025 262.50 52.50
142 Ministry of Panchayati Raj Working Group on “Panchayati Raj Institutions and Rural Governance”
Rajiv Gandhi Panchayat Sashaktikaran Abhiyan (RGPSA) – Gram Sabha - PESA
3700.00 Indirect high 0.625 2312.50 462.50
143 Ministry of Petroleum and Natural Gas
WG on Petroleum and Natural Gas ONGC- Mangrove Restoration and Conservation Education Project' at Ankleshwar, ONGC has gone for the continuation of the mangrove plantation at Ankleshwar and Hazira.
31.00 Indirect veryhigh 0.825 25.58 5.12
144 Ministry of Power Woking group on Power RGGVY - For Electrification of remaining villages &habitations (ii) Providing LED lamps for BPL households (iii) DDG.
65990.00 0 0.00 0.00
145 Ministry of Power Woking group on Power Scheme for Replacement of Inefficient Pump Sets by Energy Efficient Pump Sets in Agriculture Sector
30000.00 0 0.00 0.00

35
146 Ministry of Rural Development
Working Group on Mahatma Gandhi National Rural Employment Guarantee Act
(MGNREGA)
Mahatma Gandhi National Rural Employment Guarantee Scheme (MGNREGS)
322147.00 Multi purpose (56.14%=
180853.00)
0.375 67820.00 13564.00
147 Ministry of Rural Development
Working Group on National Rural Livelihood Mission (NRLM)
Aajeevika - National Rural Livelihoods Mission (NRLM) 52722.00 0 0.00 0.00
148 Ministry of Rural
Development
Working Group on Panchayati Raj and Rural
Governance
Panchayati Raj and Rural Governance 77684.94 0 0.00 0.00
149 Ministry of Rural Development
Area programmes Integrated Action Plan (IAP) For 60 Selected Tribal And Backward Districts
1800.00 Indirect high 0.625 1125.00 225.00
150 Ministry of Rural Development
Area programmes Hill Areas Development Programme/ Western Ghats Development Programme (HADP/WGDP)
600.00 Indirect medium 0.375 225.00 45.00
151 Ministry of Science & Technology
WG on Enrichment of knowledge base Enrichment of knowledge base (Human Resources Component, Inter-University Consortia, Centres/ Facilities,
Mega Projects and Emerging Areas)
15800.00 0 0.00 0.00
152 Ministry of Science & Technology
WG on cross flow of technology Funding for R&D in Cross-Disciplinary Areas & Training of Engineers/ Scientists/Stakeholders on Cross Flow of
Technology
220.00 0 0.00 0.00
153 Ministry of Science & Technology
WG on S & T - HRD S&T, Human Resource and Development (eg. CSIR Laboratories Biological Sciences, ICMR Institutions, DST, DBT etc)
4400.00 Indirect marginal 0.025 110.00 22.00
154 Ministry of Science & Technology
WG on PAN India S & T missions National Mission on Energy and Environment 1700.00 Indirect marginal 0.025 42.50 8.50
155 Ministry of Science &
Technology
WG on PAN India S & T missions Cheap biofuel from biomass 50.00 Indirect marginal 0.025 1.25 0.25
156 Ministry of Science & Technology
WG on PAN India S & T missions Remunerative agriculture from low land holdings 325.00 Indirect medium 0.375 121.88 24.38
157 Ministry of Science &
Technology
WG on PAN India S & T missions More Crop for Drop scheme for water productivity (PMKSY
now under MoRD)
450.00 Indirect low 0.375 168.75 33.75
158 Ministry of Science & Technology
WG on PAN India S & T missions Restoring Soil health (MoA Scheme) 375.00 Major scheme 0.275 103.13 20.63
159 Ministry of Science & Technology
WG on PAN India S & T missions Climate Change Resilient Agriculture (MoA- DARE Scheme) 400.00 Indirect marginal 0.025 10.00 2.00
160 Ministry of Science & Technology
WG on Mega Science and Global Alliances Observatory for Species Protection 500.00 Direct 0.95 475.00 95.00
161 Ministry of Science & Technology
WG on DSIR National Knowledge Depository 13.82 Indirect marginal 0.025 0.35 0.07
162 Ministry of Science &
Technology
WG on DSIR National Research Development Corporation (NRDC) 180.00 Indirect marginal 0.025 4.50 0.90
163 Ministry of Science & Technology
WG on DBT S & T Sector, R &D Institutions, New Institutions and Innovations
17887.81 0 0.00 0.00
164 Ministry of Science & Technology
WG on DST National Mission on Bamboo Applications & Mission for Geospatial Application
200.00 Direct 0.95 190.00 38.00
165 Ministry of Science & Technology
WG on DST Open Source innovation system (National Innovation Foundation Model)
175.00 Indirect marginal 0.025 4.38 0.88
166 Ministry of Science & Technology
WG on DST Modernization of Mapping Organizations (SOI & NATMO) 400.00 Indirect low 0.15 60.00 12.00

36
167 Ministry of Science & Technology
WG on DST Drugs & Pharmaceuticals Research 300.00 Indirect marginal 0.025 7.50 1.50
168 Ministry of Science & Technology
Synthetic and Systems Biology Resource Network (SSBRN)
Setting up of the CSIR Institute of Synthetic & Systems Biology (CSIR-ISSB); Establishing Network Centre for Synthetic and Systems Biology; Synthetic and Systems Biology Focal Centres in National Laboratories; ICT Connectivity,
Computational Infrastructure, Knowledge ware Development
990.00 Indiect marginal 0.025 24.75 4.95
169 Ministry of Shipping WG for the Port Sector Environmental measure for infrasturcture development of Port base industries.JNPT
18.00 Indirect veryhigh 0.825 14.85 2.97
170 Ministry of Shipping WG for the Port Sector Development of waste disposal system in JN Port area-JNPT 7.00 Indirect veryhigh 0.825 5.78 1.16
171 Ministry of Shipping WG for the Port sector Environmental upgradation Schemes - VPT 38.00 Indirsect veryhigh 0.825 31.35 6.27
172 Ministry of Shipping WG for the Port Sector Upgradation of Environmental schemes Phase-III - VPT 50.00 Indirect veryhigh 0.825 41.25 8.25
173 Ministry of Shipping WG for the Port Sector Green Port Initiatives 220.00 Indirect veryhigh 0.825 181.50 36.30
174 Ministry of Statistics and Programme implementation
WG on Strategic Plan -MoSPI Compilation of Environment and Forest statistics - Compilation of Environment and Forest statistics
684.67 Indirect low 0.15 102.70 20.54
175 Ministry of Tourism Working Group On Art and Culture Safeguaurding And Other Protective Measures In The Area Of
Intangible Heritage And Cultural Diversity (Arising Out Of Unesco Convention
25.00 Indirect marginal 0.025 0.63 0.13
176 Ministry of Tourism Working Group On Art and Culture Scheme for Sustaining the Living and Diverse Cultural
Traditions of India
10.00 Indirect marginal 0.025 0.25 0.05
177 Ministry of Tourism Working Group On Art and Culture Scheme of Financial Assistance for Publication of Magazines and Journals dedicated to Indian Culture and Heritage
13.50 Indirect marginal 0.025 0.34 0.07
178 Ministry of Tourism WG on Art and Culture Anthropological
Survey of India (AnSI) “Bio‐Cultural Diversity, Environment and Sustainable
Development”
21.00 Indirect marginal 0.025 0.53 0.11
179 Ministry of Tourism WG on Tourism Sustainable Tourism, Rural Tourism, Ecotourism And Heritage Tourism
0.00 0 0.00 0.00
180 Ministry of Tribal Affairs Tribal Affairs ((P&M) Division Market Development for Tribal Produce/ Products 175.00 Indirect high 0.625 109.38 21.88
181 Ministry of Tribal Affairs Tribal Affairs ((P&M) Division Grant-in-aid to State Tribal Devlopment Cooperative corporations for MFP operations
150.00 Indirect high 0.625 93.75 18.75
182 Ministry of Urban
Development
Steering Committee on Urbanisation JNNURM (sewarage component) 63865.26 Indirect veryhigh 0.825 52688.84 10537.77
183 Ministry of Water Resources Steering Committee on Water Resources and Sanitation
Command area development and water management 30000.00 Indirect marginal 0.025 750.00 150.00
184 Ministry of Water Resources Steering Committee on Water Resources and Sanitation
River Basin Management 2000.00 Indirect veryhigh 0.825 1650.00 330.00
185 Ministry of Water Resources Steering Committee on Water Resources and Sanitation
Ground Water Management and Regulation 4655.00 Indirect veryhigh 0.825 3840.38 768.08
186 Ministry of Water Resources Steering Committee on Water Resources and Sanitation
Watershed Development: 36460.00 Indirect medium 0.375 13672.50 2734.50
187 Ministry of Water Resources Steering Committee on Water Resources and
Sanitation
National Rain-fed Area Authority (NRAA) 423.40 Indirect medium 0.375 158.78 31.76
188 Ministry of Water Resources Steering Committee on Water Resources and Sanitation
Improvement Of Surface Water Data (CWC) - Coastal Management Information System
180.00 Indirect low 0.15 27.00 5.40
189 Ministry of Water Resources Steering Committee on Water Resources and
Sanitation
Improvement Of Agro-Met Data (IMD) 2241.10 Indirect marginal 0.025 56.03 11.21
190 Ministry of Water Resources Steering Committee on Water Resources and Sanitation
Flood Management Programme 16000.00 Indirect low 0.15 2400.00 480.00

37
191 Ministry of Water Resources Steering Committee on Water Resources and Sanitation
River Management activities and Works Related to Border Areas and UTs
1250.00 Indirect low 0.15 187.50 37.50
192 Ministry of Water Resources Steering Committee on Water Resources and Sanitation
Flood Forecasting 425.00 Indirect low 0.15 63.75 12.75
193 Ministry of Youth Affairs and Sports
Working Group on Adolescent and Youth Development
Nehru Yuva Kendra Sangathan 2182.35 0 0.00 0.00
194 Ministry of Youth Affairs and Sports
Working Group on Adolescent and Youth Development
National Service Scheme 600.00 0 0.00 0.00
195 Ministry of Youth Affairs and
Sports
Working Group on Adolescent and Youth
Development
Rajiv Gandhi National Institute For Youth Development 549.22 0 0.00 0.00
196 Department of Atomic Energy
WG on DAE RadiationTechnologies and their applications – Nuclear Agriculture for sustainability and societal benefits
25.00 Indirect medium 0.375 9.38 1.88
197 Department of Atomic Energy
WG on DAE Developing Novel applications of radiation technology for value addition to food & agro commodities
14.00 Indirect medium 0.375 5.25 1.05
198 Department of Space WG on Dept. of Space Earth Observation Systems and Atmospheric Science Program – Missions - GISAT(Agri) , Resourcesat (Water) ,
Cartosat (Biodiversity Res, Geology, Carto rural, Urban, Enviroment)), R & D Satelitte , Oceansta (Ocean Biology), RISAT (Agri. Water) SCATsat(Ocean & Atmosphere)
3238.00 Indirect marginal 0.025 80.95 16.19
199 Department of Space WG on Dept. of Space Earth Observation Systems and Atmospheric Science -
Application initiatives - National Natural Resources Manamement System (NNRMS) & Remote Sensing Applications
560.00 Indirect marginal 0.025 14.00 2.80
200 Department of Space WG on Dept. of Space Integrated Space Technology Services- Village Resource Centres
90.00 Indiect marginal 0.025 2.25 0.45
12 FYP Total (in crores) 1456683.3 356738.98
Annual Attribution (in crores) 71347.80

38
PRIMARY SOURCE OF DATA
Ministry/Department wise Working Groups/ Steering Committees of the Twelfth Five Year Plan (2012-2107) along with the schemes and programmes proposed them on biodiversity10 1. Ministry of Agriculture (MoA)
Report of the Working Group on Animal Husbandry & Dairying 12th Five Year Plan (2012-17) http://planningcommission.gov.in/aboutus/committee/wrkgrp12/agri/AHD_REPORT_Final_rev.pdf
1. Cattle and buffalo Breeding 2. Mission on pigs 3. Small ruminants, rabbits and broiler buffalo calves 4. Poultry development including venture capital fund 5. Conservation of threatened livestock breeds 6. Fodder & feed development 7. Livestock Insurance, census and sample survey 8. Livestock extension and delivery of services and women empowerment 9. Disease Control – Immunization for important diseases, disease surveillance, diagnostic
laboratories, veterinary infrastructure, drug control authority, mobile veterinary clinics, traceability & food safety
10. Strengthening infrastructure - Veterinary Education 11. Dairy Development activities (including for Clean Milk Production) 12. National Dairy Plan (NEW) 13. Dairy Venture Capital Fund
Report of the XII Plan Working Group on Natural Resource Management and Rainfed Farming http://planningcommission.gov.in/aboutus/committee/wrkgrp12/agri/wg_NRM_Farming.pdf
14. National Rainfed Areas Program (New Scheme) 15. Mainstream programs of respective departments “Rainfed Investment Windows” (in
agriculture, animal husbandry, horticulture, fisheries, ground water, civil supplies) 16. National Food Security Mission (NFSM) : Create separate window with in the National Food
Security Mission for “Local Food Security in rainfed areas”. 17. Evolving institutional architecture for rain fed areas 18. Diversified crop patterns and comprehensive initiative on millets and minor pulses including
integration of millets into PDS (Crop Husbandry) 19. Commons pilot initiatives and facilitating policy at state levels (Mapping and characterizing
common lands) 20. Wider extension of support irrigation to secure kharif rainfed crops and Participatory
Groundwater management Report of the Working Group on Outreach of Institutional Finance, Cooperatives and Risk Management for the 12th Five Year Plan (2012-17) http://planningcommission.gov.in/aboutus/committee/wrkgrp12/agri/wg_repcons.pdf
21. National Cooperative Development Corporation (NCDC) 22. Modified National Agricultural Insurance Scheme (MNAIS)
Report of the Working Group on Horticulture and Plantation Crops: XII Five Year Plan http://planningcommission.gov.in/aboutus/committee/wrkgrp12/agri/wg_horti1512.pdf
23. Area Expansion Programmes in Integrated Project Mode including protected cultivation 24. Productivity Enhancement of Existing Orchards / Production Clusters in Project Mode
including pollination support 25. Additional Provision for North Eastern region, Hilly areas and scheduled areas and small &
marginal Farmers etc 26. Infrastructure development for Input production
10http://planningcommission.gov.in/aboutus/committee/index.php?about=12strindx.htm

39
27. Supply Chain Management, Post-Harvest Management 28. Marketing Infrastructure, HRD & Market information 29. Horticulture Database 30. Crop Insurance and Setting up Weather Stations 31. Schemes of Coconut Development Board 32. Schemes Components of Bamboo Development 33. Horticulture Promotion Services‐ NCCD
Report of the Working Group on Agricultural Marketing Infrastructure, Secondary Agriculture and Policy Required for Internal and External Trade for the XII Five Year Plan (2012-17) http://planningcommission.gov.in/aboutus/committee/wrkgrp12/agri/weg_rep_market.pdf
34. Secondary Agriculture – Medicinal and Aromatic plants 35. Secondary Agriculture –Organic farming 36. Secondary Agriculture – Stevia 37. Biomass and Residue utilization
Report of the Working Agricultural Research and Education for the XII Five Year Plan: 2012-17 http://planningcommission.gov.in/aboutus/committee/wrkgrp12/agri/wgrep_research.pdf
38. Crop Science, including Plant Protection and Seed (PPV & FR Scheme) 39. Horticulture (Central Institute of Horticulture) 40. Natural Resource Management 41. Agricultural Engineering 42. Animal Sciences 43. Fisheries 44. Agricultural Education 45. Agricultural Extension 46. Agricultural Economics, Marketing and Statistics 47. ICAR/DARE Headquarters, CAU 48. Structure, Modification of ICAR, IPR etc. 49. Externally Aided (NAIP, Indo-US, National Fund, NAEP) 50. Farmer Innovation, Agricultural Entrepreneurship, National innovation, public-private
partnership, Agricultural India funds Report of the Working Group on Development and Management of Fisheries and Aquaculture for the XII Five Year Plan: 2012-17 http://planningcommission.gov.in/aboutus/committee/wrkgrp12/agri/wg_deve_management_con.pdf
51. Development of Marine Fisheries, Infrastructure and post-harvest operations-NFDB 52. Development of Inland Fisheries and Aquaculture - National Fishery Development Board 53. Human Resource Development in Fisheries Sector - NFDB 54. National Scheme on Welfare of Fishermen and Women - DAHD&F 55. Strengthening of Data base in Fisheries Sector - DAHD&F 56. Monitoring, Control & Surveillance; Strengthening of Policy and Legal Frameworks and other
Need-based Interventions - DAHD&F 57. Assistance to Fisheries Institutions – NFDB & DAHD&F 58. National Fisheries Development Board - NFDB
Report of the Working Group on Agricultural Extension For Agriculture And Allied Sectors for the Twelfth Five Year Plan (2012-17) http://planningcommission.gov.in/aboutus/committee/wrkgrp12/agri/wg_agriextn.pdf
59. Technology solutions and innovations (AICRP on Technology, mapping, adoption and innovations, National Technology Solutions Project, ICAR-SAU extension initiatives, National Farm Innovation Foundation).
60. Women Empowerment, Household Food & Nutritional Security (Promoting Kitchen Gardening Group/ Association
61. Extension Strategy for Difficult Areas (Coastal Area Sustainable Agriculture Development Programme)

40
62. Protection of Plan varieties and Farmer’s Rights 2. Ministry of Ayurveda, Yoga and Naturopathy, Unani, Siddha and Homoeopathy (MoAYUSH) Report of the Working Group on AYUSH for the 12th Five‐Year Plan (2012‐17) http://planningcommission.gov.in/aboutus/committee/wrkgrp12/health/WG_7_ayush.pdf
63. System Strengthening - AYUSH 64. Research and Development including Medicinal Plants (including National Medicinal Plants
Board) 65. Development of AYUSH Industry 66. Funding of NGOs engaged in local health traditions, midwifery practices etc, under NRHM 67. Promotion of AYUSH (National Mission on AYUSH) 68. National Mission on Medicinal Plants 69. Setting up of National Institute of Medicinal Plants 70. Mainstreaming of AYUSH under NRHM
3. Ministry of Chemicals and Fertilizers (MoCF)
Report of the Working Group on Fertilizer Industry for the Twelfth Plan (2012‐13 To 2016‐17) http://planningcommission.gov.in/aboutus/committee/wrkgrp12/wg_fert0203.pdf
71. Bio/organic fertilizers 4. Ministry of Coal (MoC) Report of the Working Group on Coal & Lignite for Formulation of Twelfth Five Year Plan (2012-2017). Outcome Budget 2013-2014. Department Of Commerce Government Of India http://planningcommission.gov.in/aboutus/committee/wrkgrp12/wg_Coal1406.pdf
72. Conservation and Safety in Coal Mines 73. Environmental Measures & Subsidence Control (EMSC) Schemes 74. Clean Coal Technologies (R & D program)
5. Ministry of Commerce and Industry (MoCI) Report of the Working Group on Cement Industry For XII Five Year Plan (2012-17) http://planningcommission.gov.in/aboutus/committee/wrkgrp12/wgrep_cement.pdf
75. Agricultural Products Export Development Authority (APEDA) 76. Marine Products Export Development Authority (MPEDA) 77. Tea Board 78. Coffee Board 79. Rubber Board 80. Spices Board 81. Cashew Export Promotion Council
6. Ministry of Communications and Information Technology (MoCIT) Cabinet Committee on Infrastructure (CCI) Approved the Establishment of the National Knowledge Network (NKN) At An Outlay Of Rs 5990 Crore, To Be Implemented by NIC over a Period of 10 Years. http://nkn.gov.in/
82. National Knowledge Network

41
7. Ministry of Culture (MoCL) Report of the Working Group on Art and Culture for XII Five-Year Plan (2012-17) http://planningcommission.gov.in/aboutus/committee/wrkgrp12/wg_tourist0202.pdf
83. Conservation & Development of movements & Archeological sites by State/UT, colleges & State (28 World Heritage Sites located at present in India are managed by ASI, MoEFCC Ministry of Railways, Government of Rajasthan, etc.
8. Ministry of Development of North Eastern Region (MoDNER) North Eastern Climate Change Adaption Project [Assisted By German Government and German Bank (Kfw). http://www.mdoner.gov.in/Content/12th-Plan-Projected-Outlay
84. North Eastern Climate Change Adaption Project [assisted by German Government & German Bank-[Kfw]
85. NER Livelihoods Project ( World Bank Assisted ) 9. Ministry of Drinking Water and Sanitation (MoDWS) Report of the Working Group on Rural Domestic Water and Sanitation. Twelfth Five Year Plan – 2012-2017 http://planningcommission.gov.in/aboutus/committee/wrkgrp12/wr/wg_indus_rural.pdf
86. National Rural Drinking Water Programmes – Sustainability component 87. National Rural Drinking Water Programmes – Natural calamity component
Report of the Working Group on Urban and Industrial Water Supply and Sanitation for the Twelfth Five-Year- Plan (2012-2017) http://planningcommission.gov.in/aboutus/committee/wrkgrp12/wr/wg_indu_sani.pdf
88. Nirmal Bharat Abhiyan {Information Education Communication (IEC)} 10. Ministry of Earth Sciences (MoES) Working Group Document. Earth System Science Organization (ESSO). Twelfth Five Year Plan (2012-17). http://planningcommission.gov.in/aboutus/committee/wrkgrp12/sandt/wg_mes2905.pdf
89. Atmospheric processes and Modeling and Services - Agrometorology 90. Ocean observations- Moored buoys, drifting buoys, current meters etc. 91. Ocean observations - Sustained Indian Ocean Biogeochemical and Ecological Research
(SIBER) and Geotraces 92. Ocean Science and Services - Ocean information and services 93. Ocean Science and Services - Ocean Research and Modelling 94. Ocean Science and Services - INCOIS -Operations and Maintenance 95. Ocean Science and Services - Marine Living Resources + building + Operation &
Maintenance 96. Ocean Science and Services - Coastal Research (ICMAM O&M other related projects,
COMAPS) 97. Ocean Science and Services - Drugs from the Sea 98. Ocean Science and Services - Microbial Oceanography 99. Ocean Survey & Mineral Resources - Ocean Survey and Resources(EIA, Metallurgy,
Hydrothermal sulfides, Cobal Crust) 100. Ocean Survey & Mineral Resources - Hydrothermal sulfides, Cobal Crust in the Indian Ocean
Ridge 101. Ocean Technology (incl. Marine biotechnology, NIOY, Development of Island community 102. Polar Science & Cryosphere 103. Geosciences

42
104. Earth Science s - Research, Education, Training and Outreach (incl. Centres of excellence) 11. Ministry of Environment and Forests (MoEF) Report of Sub- Group - I on Forestry http://planningcommission.gov.in/aboutus/committee/wrkgrp12/enf/wg_subforestry.pdf
105. National Afforestation Programme 106. Capacity Development of the JFMCs, Gram Sabha and other Stakeholders 107. Green India Mission 108. Intensification of the Forest Management 109. Satellite based Forest Resource Assessment and Technological based M&E.
Report of the Sub-Group-II on NTFP and their Sustainable Management in the 12th 5- Year Plan http://planningcommission.gov.in/aboutus/committee/wrkgrp12/enf/wg_subntfp.pdf
110. NTFP - Resource management, Marketing, MSP, CB, IEC, R&D. Report of the Sub Group III on Fodder and Pasture Management Constituted under the Working Group on Forestry and Sustainable Natural Resource Management http://planningcommission.gov.in/aboutus/committee/wrkgrp12/enf/wg_subfooder.pdf
111. Mapping of ecologically sensitive grasslands, development of seed/germplasm banks & nurseries of fodder species etc.
Summary of Report of the Sub Group IV on Forestry Institutional & Technology Management Under the Working Group onForestry and Sustainable Natural Resource Management for The Twelfth Five Year Plan (2012-2017) http://planningcommission.gov.in/aboutus/committee/wrkgrp12/enf/wg_inst.pdf
112. FSI, WII, ICFRE, IIFM, IPIRTI, IGNFA, DFE, capacity building, technological upgradation. (Grants in-aid to F&WL Institutions)
Report of Sub Group-V on “International Cooperation and Law” Under Working Group on Forestry & Natural Resources Management http://planningcommission.gov.in/aboutus/committee/wrkgrp12/enf/wg_sublaw.pdf
113. Strengthening of International Cooperation and Law Report of the Working Group on Wildlife, Ecotourism and Animal Welfare for the 12th Five Year Plan (2012-2017) http://planningcommission.gov.in/aboutus/committee/wrkgrp12/enf/wg_wild.pdf
114. Wildlife Management – Integrated Development of Wildlife Habitats (IDWH) 115. Strengthening of Wildlife Division 116. Wildlife Institute of India (WII) 117. Project Tiger 118. Project Elephant 119. Ecotourism for Livelihoods 120. Animal welfare
Report of the Sub‐Group on “Environment” for 12th Five Year Plan http://planningcommission.gov.in/aboutus/committee/wrkgrp12/enf/wg_envr.pdf
121. Environment Monitoring &Governance; a) Pollution abatement, b) R&D for Conservation & Development., c) Conservation of Natural Resources & Ecosystems, d) Environment Information, Education & Awareness; e) Taj protection,

43
f) International Cooperation, g) National Coastal Management Programme (NCMP) & 9. National River Conservation Plan
(NRCP). W” for W Report of the sub-Group on Climate Change http://planningcommission.gov.in/aboutus/committee/wrkgrp12/enf/wg_climate3001.pdf
122. Solar Mission 123. Energy Efficiency Mission 124. Sustainable Habitat Mission 125. Sustainable Agriculture Mission (MoA – National Mission for Sustainable Agriculture) 126. Sustainable Himalayan Eco-Systems 127. Strategic Knowledge Mission
12. Ministry of Human Resource Development (MoHRD) Report of the Working Group on Higher Education for the XII Five Year Plan http://planningcommission.gov.in/aboutus/committee/wrkgrp12/hrd/wg_hiedu.pdf
128. University Grants Commission (multiple schemes including flexi funds) 13. Ministry of Information & Broadcasting (MoIB) Report of the Working Group on Information & Broadcasting Sector Government. XII Five Year Plan (2012-17) http://planningcommission.gov.in/aboutus/committee/wrkgrp12/cit/vol1_IB.pdf
129. Media Outreach Programme and Publicity for Special Events (PIB) 14. Ministry of Power (MoP) Report of the Working Group on Power for Twelfth Plan (2012-17) http://planningcommission.gov.in/aboutus/committee/wrkgrp12/wg_power1904.pdf
130. Bio-mass based Renewable Energy 15. Ministry of Panchayati Raj (MoPR) Report of the Working Group on “Panchayati Raj Institutions and Rural Governance”. http://planningcommission.gov.in/aboutus/committee/wrkgrp12/wg_pri_rg.pdf
131. Rajiv Gandhi Panchayat Sashaktikaran Abhiyan (RGPSA) – Gram Sabha - PESA 16. Ministry of Petroleum and Natural Gas (MoPNG) Report of the Working Group on Petroleum & Natural Gas Sector for the 12th Five Year Plan (2012-17). http://www.indiaenvironmentportal.org.in/files/file/wgreport.pdf
132. ONGC- Mangrove Restoration and Conservation Education Project' at Ankleshwar, ONGC has gone for the continuation of the mangrove plantation at Ankleshwar and Hazira.
17. Ministry of Rural Development (MoRD) Report of the Working Group on MGNREGA Towards Formulation of the 12th Five Year Plan http://planningcommission.gov.in/aboutus/committee/wrkgrp12/rd/wgrep_mgnrega.pdf
133. Mahatma Gandhi National Rural Employment Guarantee Act (MGNREGA)

44
Working Group on Area Programmes for the Formulation of the Twelfth Five Year Plan (2012-2017) http://planningcommission.gov.in/aboutus/committee/wrkgrp12/wg_areaprog.pdf
134. Integrated Action Plan (IAP) for 60 Selected Tribal And Backward Districts 135. Hill Areas Development Programme/ Western Ghats Development Programme
(HADP/WGDP) 18. Ministry of Science and Technology (MoST) Report of the Working Group on Science & Technology Human Resource Development for 12th Five Year Plan (2012-17) http://planningcommission.gov.in/aboutus/committee/wrkgrp12/sandt/wg_hrd.pdf
136. S&T, Human Resource and Development (eg. CSIR Laboratories Biological Sciences, ICMR
Institutions, DST, DBT etc) Planning Commission Working Group - Report on Pan India S & T Missions http://planningcommission.gov.in/aboutus/committee/wrkgrp12/sandt/wg_pan.pdf
137. National Mission on Energy and Environment 138. Cheap biofuel from biomass 139. Remunerative agriculture from low land holdings 140. More Crop for Drop scheme for water productivity 141. Restoring Soil health (MoA Scheme) 142. Climate Change Resilient Agriculture (MoA- DARE Scheme)
Report of Planning Commission-Working Group on Mega Science and Global alliances http://planningcommission.gov.in/aboutus/committee/wrkgrp12/sandt/wg_mega.pdf
143. Observatory for Species Protection DSIR Twelfth Five Year Plan- Plan Document Summary Including Eleventh Plan Achievements Department of Scientific & Industrial Research. 2012-2017. Volume - I http://planningcommission.gov.in/aboutus/committee/wrkgrp12/sandt/wg_csir2905.pdf
144. National Knowledge Depository 145. National Research Development Corporation (NRDC)
Department of Science & Technology- Working Group Report for the Twelfth Five Year Plan (2012-17) http://planningcommission.gov.in/aboutus/committee/wrkgrp12/sandt/wg_dst2905.pdf
146. National Mission on Bamboo Applications & Mission for Geospatial Application 147. Open Source innovation system (National Innovation Foundation Model) 148. Modernization of Mapping Organizations (SOI & NATMO) 149. Drugs & Pharmaceuticals Research
Report of the Planning Commission constituted Task Force on Synthetic and Systems Biology Resource Network (SSBRN) http://planningcommission.gov.in/aboutus/committee/wrkgrp12/sandt/tsk_ssbrn.pdf
150. Setting up of the CSIR Institute of Synthetic & Systems Biology (CSIR-ISSB); Establishing Network Centre for Synthetic and Systems Biology; Synthetic and Systems Biology Focal Centres in National Laboratories; ICT Connectivity, Computational Infrastructure, Knowledge ware Development

45
19. Ministry of Shipping (MoS) Report of Working Group for Port Sector for the Twelfth Five Year Plan (2012-2017) http://planningcommission.gov.in/aboutus/committee/wrkgrp12/transport/report/wg_port.pdf
151. Environmental measure for infrasturcture development of Port base industries(JNPT) 152. Development of waste disposal system in JN Port area-JNPT 153. Environmental upgradation Schemes - VPT 154. Upgradation of Environmental schemes Phase-III - VPT 155. Green Port Initiatives
20. Ministry of Statistics and Programme Implementation (MoSPI) Strategic Plan 2011-16 of Ministry of Statistics and Programme Implementation http://mospi.nic.in/sites/default/files/main_menu/strategic_plans/Strategic%20Plan_MOSPI_10022011_Final.pdf
156. Compilation of Environment and Forest statistics - Compilation of Environment and Forest statistics
21. Ministry of Tourism (MoT) Report of the Working Group on Art and Culture for XII Five-Year Plan (2012-17) http://planningcommission.gov.in/aboutus/committee/wrkgrp12/wg_tourist0202.pdf
157. Safeguarding and other Protective Measures In the Area of Intangible Heritage and Cultural Diversity (arising out of UNESCO Convention)
158. Scheme for Sustaining the Living and Diverse Cultural Traditions of India 159. Scheme of Financial Assistance for Publication of Magazines and Journals dedicated to
Indian Culture and Heritage 160. “Bio‐Cultural Diversity, Environment and Sustainable Development”
22. Ministry of Tribal Affairs (MoTA) Ministry of Tribal Affairs – Programmes/Schemes proposed during the Twelfth Plan (2012-17) https://tribal.nic.in/writereaddata/AnnualReport/TwelfthFiveYearPlan2012-17.pdf
161. Market Development for Tribal Produce/ Products 162. Grant-in-aid to State Tribal Development Cooperative corporations for MFP operations
23. Ministry of Urban Development (MoUD) Report of the Steering Committee on Urbanization- Twelfth Five Year Plan (2012-2017) http://planningcommission.gov.in/aboutus/committee/strgrp12/strrep_urban0401.pdf
163. JNNURM (National Capacity Building Scheme (Including Capacity Building For Urban Transport) Estimated By The Working Group On Capacity Building & Rajiv Awas Yojana (Slum Rehabiliation)
24. Ministry of Water Resources (MoWR) Report of the Steering Committee on Water Resources and Sanitation for Twelfth Five Year Plan (2012-2017) http://planningcommission.gov.in/aboutus/committee/wrkgrp12/wr/wg_indus_rural.pdf
164. Command area development and water management 165. River Basin Management 166. Ground Water Management and Regulation 167. Watershed Development: 168. National Rain-fed Area Authority (NRAA) 169. Improvement Of Surface Water Data (CWC) - Coastal Management Information System

46
170. Improvement Of Agro-Met Data (IMD) 171. Flood Management Programme 172. River Management activities and Works Related to Border Areas and UTs 173. Flood Forecasting
25. Department of Atomic Energy (DoA) Department of Atomic Energy – XII Plan Proposals: Report of the Working Group http://planningcommission.gov.in/aboutus/committee/wrkgrp12/sandt/wg_rnd2905.pdf
174. RadiationTechnologies and their applications – Nuclear Agriculture for sustainability and societal benefits
175. Developing Novel applications of radiation technology for value addition to food & agro commodities
26. Department of Space (DoS) 12th Five Year Plan of Department of Space – Report of the Working Group (WG-14) http://planningcommission.gov.in/aboutus/committee/wrkgrp12/sandt/wg_dos2905.pdf
176. Earth Observation Systems and Atmospheric Science Program – Missions - GISAT(Agri) , Resourcesat (Water) , Cartosat (Biodiversity Res, Geology, Carto rural, Urban, Environment), R& D Satellite , Oceansat (Ocean Biology), RISAT (Agri. Water) SCAT sat (Ocean & Atmosphere)
177. Earth Observation Systems and Atmospheric Science - Application initiatives - National Natural Resources Management System (NNRMS) & Remote Sensing Applications
178. Integrated Space Technology Services- Village Resource Centres

47
Contact us:
The Secretary,
National Biodiversity Authority, 5th Floor, Ticel Bio Park, CSIR Road, Taramani, Chennai – 600 113 Ph: 044-2254 1075, 2254 1200 (F) Email: [email protected] Web: www.nbaindia.org


