Bioelectrocatalyzed acetic and butyric acid reduction via direct 1
electron transfer by a mixed culture of sulfate-reducers drives 2
electrosynthesis of alcohols and acetone 3
Mohita Sharma,a,b
Nabin Aryal,a Priyangshu M. Sarma,
b,c Karolien Vanbroekhoven,
a Banwari 4
Lal,c Xochitl Dominguez Benetton*
,a and Deepak Pant*
,a 5
6 a Separation & Conversion Technologies, VITO - Flemish Institute for Technological Research, Boeretang 200, 2400 Mol, Belgium 7 b TERI University, Plot No. 10, Institutional Area, Vasant Kunj, New Delhi 110070, India 8 cThe Energy and Resource Institute (TERI), IHC, Lodhi Road, New Delhi, 110003, India 9 10 11
The anaerobic mixed consortium used to inoculate the cathodic chamber was taken from a laboratory scale continuous reactor 4 developed by inoculating mixed SRB strains isolated from different petroleum refineries and formation sites across India. 5 The two-liter lab scale reactor was run continuously on a fed batch mode with API RP-38 medium (4 g sodium lactate, 1 g 6 yeast extract, 0.1 g ascorbic acid, 0.2 g MgSO4, 0.01 g K2HPO4, 0.1 g KH2PO4, 0.2 g NH4FeSO4 and 10 NaCl, for 1 L, pH-7 7.4) for the development of a stable SRB consortium. A 10% v/v was taken from the reactor and transferred to the minimal 8 sulfate/sulfide free synthetic feed that was used as electrolyte in the electrochemical cell. The synthetic feed composed of 572 9 mg NH4Cl, 416 mg K2HPO4, 8 mg CaCl2, 96 mg MgCl2·6H2O, 1.98 mg FeCl2·4H2O, 2.37 mg CoCl2·6H2O, 0.59 mg 10 MnCl2·4H2O, 0.034 CuCl2·2H2O, 0.062 mg H3BO3, 0.073 mg Na2MoO4·2H2O, 0.069 mg Na2SeO3, 0.095 mg NiCl2·6H2O, 11 0.055 mg ZnCl2 and 10 g NaCl per liter. Additionally the substrate concentration that was added to the reactors included 0.1 12 M each of acetic and butyric acid. 13 14 1.2 Configuration of electrochemical cell 15
16 The electrochemical cell was placed over a magnetic stirrer and sparged continuously with nitrogen gas to maintain anoxic 17 headspace and all the experiments were operated at 18-22 °C. The working volume of the reactor was 275 ml. A 80-20% 18 carbon-polytetrafluoroethylene (PTFE) mix with 316L grade stainless steel (SS) mesh embedded inside was used as a 19 working electrode. The projected surface area of the working electrode was 9 × 3 cm2 and it was pre-treated by dipping in the 20 synthetic feed for a period of 3 hours at 70 °C in order to fill up all the air spaces present in the porous carbon layers of the 21 electrode and to decrease the overpotential faced during the electrochemical cell start up. It was connected with a 22 Platinum/Iridium (Pt/Ir:- 90/10%) wire to the working electrode of the Biologic potentiostat (VMP3) and Ag/AgCl/3.5M KCl 23 (+199 mV against SHE) was used as reference electrode (Radiometer Analytical).Pt/Ir (90/10%) wire (Alfa Asear) was used 24 as a counter electrode. For the small reactor set up as described in Exp. 3, the same surface area of working electrode to 25 electrochemical cell volume ratio was maintained to scale down the cell operation to 30 ml working volume cell and to 26 monitor its performance in more controlled conditions and observe the subsequent effect on current density and product 27 formation. All the experiments were performed under sterile conditions. 28 29 1.3 Electrochemical measurements 30
31 Electrochemical analysis was conducted using a Biologic multichannel potentiostat (software Easy Lab vs. 10.23). 32 Potentiostatic control was maintained in the bioelectrochemical cell throughout its operation at -0.85 V/Ag/AgCl (3M KCl) 33 with Biologic potentiostat (VMP3) and one point every 15 minutes was recorded. CV with the vertex potentials of 0.6 V to -34 0.9 V were conducted at a scan rate of 1 mVs-1, in order to obtain mechanistic and phenomenological information of the 35 processes occurring in the system. 36 37 1.4 Sampling and analysis methods 38
39 For the analysis of VFA samples, samples were filtered and acidified with 0.5 ml of H2SO4 solution (50%), which were 40 further extracted using diethyl ether method.1 The samples were centrifuged at 1900g (5810R centrifuge, Eppendorf, 41 Hamburg, Germany) for three minutes and the supernatant was transferred to GC vial and analyzed in a gas chromatograph 42 (CE Instruments-Thermoquest) equipped with a Flame Ionization detector (FID) and a ATM,-1000 capillary column (15 m-43 0.53 mm -1.21 m). Carrier gas used was Helium with a constant flow rate of 6 ml min-1. The determination of acetone and 44 other solvents was performed by gas chromatography using AT-WAX capillary column (60 m-0.32 mm-1 m) with FID. D6 45 ethanol was used as internal standard. pH were measured using a pH meter (Knick SE204). 46 For experiments performed for the hermetically closed BES reactor, head space gas analysis was done with a gas 47 chromatograph (Agilent 7890A) equipped with a NUCON SS packed column (length 2 m, ID 2 mm) with He as the carrier 48 gas, at a flow rate of 6.0 ml/min using a thermal conductivity detector. The operating temperature of the injector, the oven 49 and the detector were 50, 100 and 150 °C respectively. The volatile fatty acid (VFA) analysis for this experiment was done 50 using a gas chromatograph (GC Agilent 7890A) using a DB-WAXetr (J&W Scientific) column (30 m X 530 µm X 1µm 51 nominal) with He as the carrier gas, at a flow rate of 1.5 ml/min. The operating temperature of the injector, the oven and the 52 FID detector were 150, 220, and 230 °C respectively. The products were analyzed using High Performance Liquid 53 Chromatography (HPLC, Agilent 1100 series, USA) equipped with Aminex® HPX-87H column (1300 X 7.8 mm, Bio-rad ) 54 with Refractive index detector. (RID) The mobile phase used here was 0.005M H2SO4 at a flow rate of 0.6-0.9 ml/min at 80 55 °C. 56 57 1.5 FISH analysis 58 FISH samples were prepared using the protocol by Daims.2 Freshly inoculated active culture was fixed by using 4% 59 paraformaldehyde solution in PBS. This was followed by immobilization of cells on a microscopic slide and hybridization 60
with 16S rDNA probes at 48 ºC, 0-65% formamide, followed by washing of specimens by wash buffer (48 ºC). Acquisition 1 system (Coolsnap, Roper Scientific Photometrics) connected to Axioskop2 epifluorescence microscope (Zeiss, Germany) 2 was used to record fluorescence signals. 3
References 4 5
1. W. V. Hecke, P. Vandezande, S. Claes, S. Vangeel, H. Beckers, L. Diels and H. D. Wever, Bioresour. Technol., 6 2012, 111, 368-377. 7
2. H. Daims, Cold Spring Harb. Protoc., 2009.4, 8 pp. 8 3. D. Pant, G. V. Bogaert, M. D. Smet, L. Diels and K. Vanbroekhoven, Electrochimica Acta, 2010, 55, 7709-7715. 9 4. F. Zhang, D. Pant, B. Logan, 2011, Biosensors and Bioeelectronics, 30, 49-55. 10 5. Y. Alvarez-Gallego, X. Dominguez-Benetton, D. Pant, L. Diels, K. Vanbroekhoven, I. Genné, P. Vermeiren, 2012, 11
Maximized FISH micrographies of inoculum source as presented in Figure 2. Probe combinations: (a-d) ARC915/red/cy3 3 (Archea) and EUB 338mix/green/fluos (Bacteria domain); (e-h) BET42a/red/cy3 (Betaproteobacteria) and 4 AQS997/green/6fam (Curvibacter); (i-l) EUB338I red/cy3 (Bacteria domain) and DELTA 495a/green/6fam 5 (Deltaproteobacteria); (m-p) SRB385/red/cy3 (Desulfovibrionales) and DSBAC357/green/6-fam (Desulfobacteraceae and 6 Syntrophobacteraceae). Column1 and 2 indicates all green and red probes individually over DAPI stained DNA in the 7 background, respectively. Columns 3 and 4 show superimposed probes, in the absence and presence of DAPI stain for DNA 8 in the background, respectively. Acquisition system (Coolsnap, Roper Scientific Photometrics) connected to Axioskop2 9 epifluorescence microscope (Zeiss, Germany) was used to record Fluorescence signals. 10
S3: Schematic of the reactor showing the number of products formed from the initial substrates added into the reactor. In the 1 order of number of carbon, the products synthesized in the reactor include methanol, ethanol, acetone, propionic acid, lactic 2 acid, propanol, glycerol, butanol and caproic acid 3
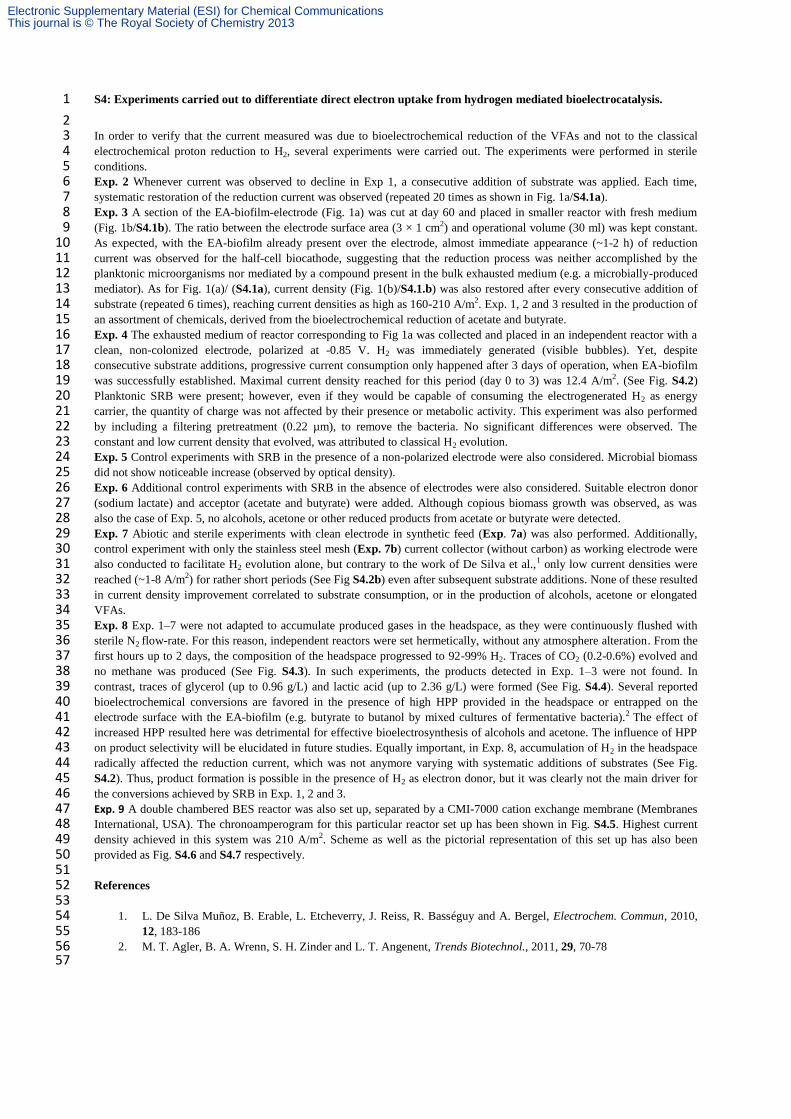
S4: Experiments carried out to differentiate direct electron uptake from hydrogen mediated bioelectrocatalysis. 1
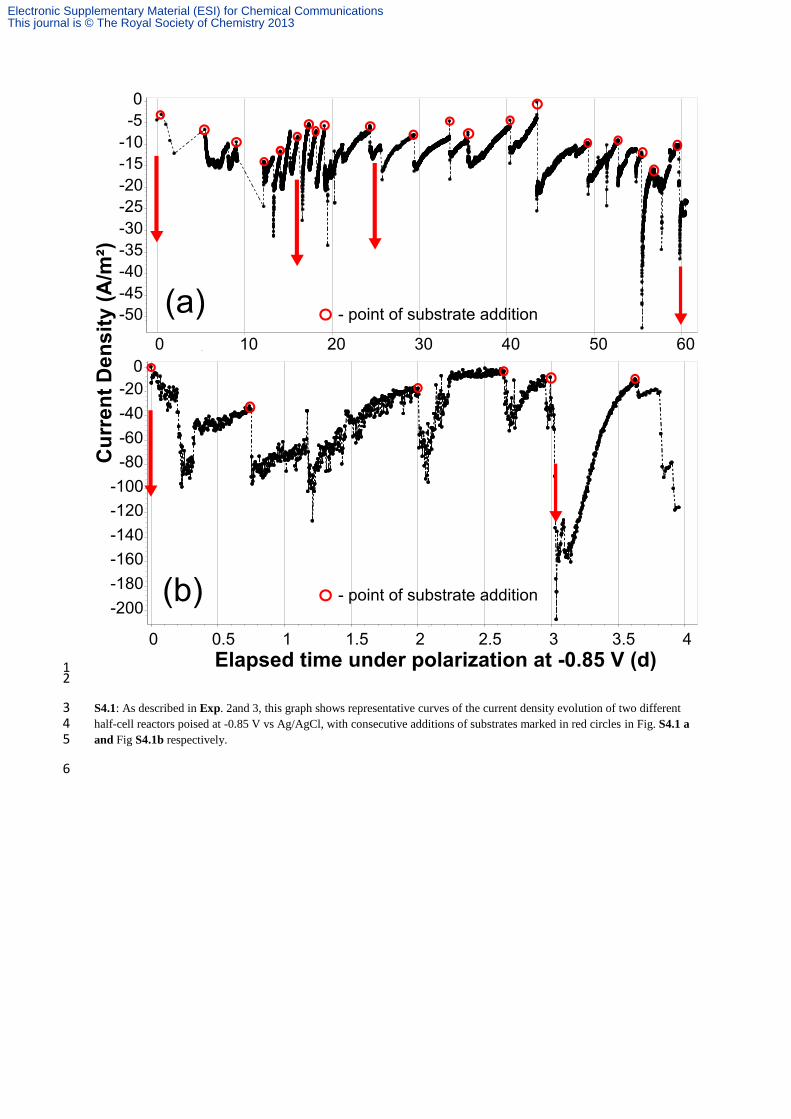
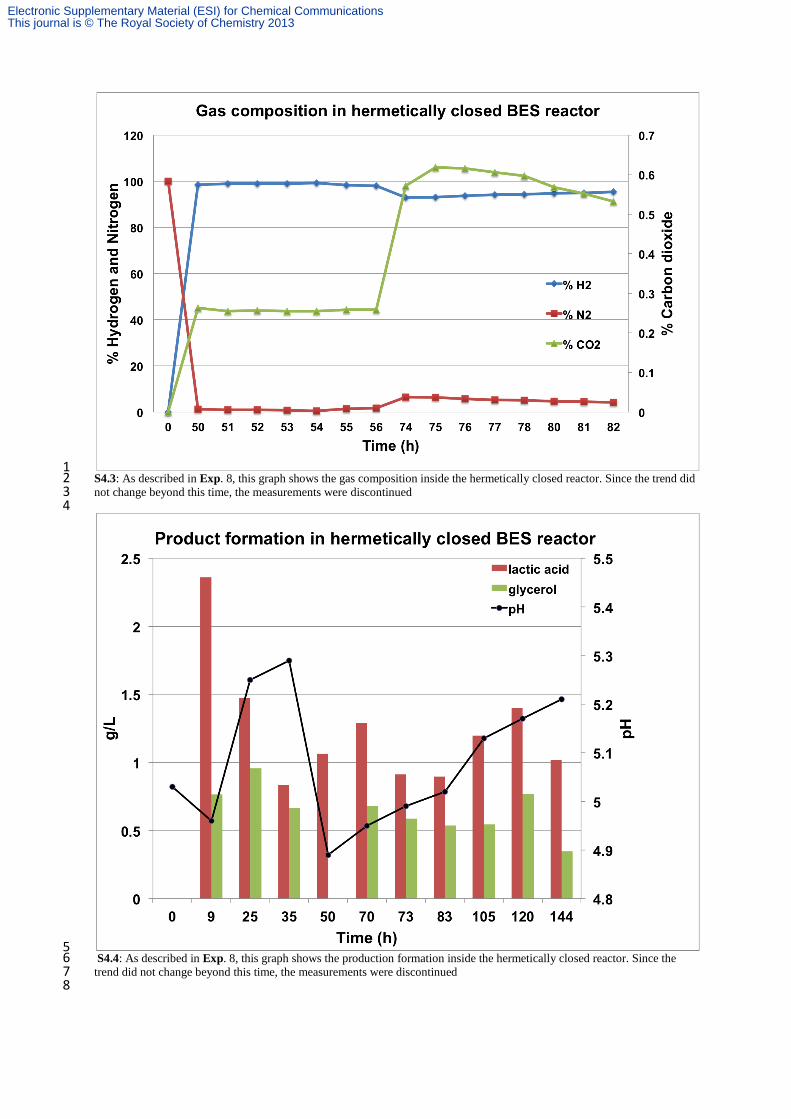
2 In order to verify that the current measured was due to bioelectrochemical reduction of the VFAs and not to the classical 3 electrochemical proton reduction to H2, several experiments were carried out. The experiments were performed in sterile 4 conditions. 5 Exp. 2 Whenever current was observed to decline in Exp 1, a consecutive addition of substrate was applied. Each time, 6 systematic restoration of the reduction current was observed (repeated 20 times as shown in Fig. 1a/S4.1a). 7 Exp. 3 A section of the EA-biofilm-electrode (Fig. 1a) was cut at day 60 and placed in smaller reactor with fresh medium 8 (Fig. 1b/S4.1b). The ratio between the electrode surface area (3 × 1 cm2) and operational volume (30 ml) was kept constant. 9 As expected, with the EA-biofilm already present over the electrode, almost immediate appearance (~1-2 h) of reduction 10 current was observed for the half-cell biocathode, suggesting that the reduction process was neither accomplished by the 11 planktonic microorganisms nor mediated by a compound present in the bulk exhausted medium (e.g. a microbially-produced 12 mediator). As for Fig. 1(a)/ (S4.1a), current density (Fig. 1(b)/S4.1.b) was also restored after every consecutive addition of 13 substrate (repeated 6 times), reaching current densities as high as 160-210 A/m2. Exp. 1, 2 and 3 resulted in the production of 14 an assortment of chemicals, derived from the bioelectrochemical reduction of acetate and butyrate. 15 Exp. 4 The exhausted medium of reactor corresponding to Fig 1a was collected and placed in an independent reactor with a 16 clean, non-colonized electrode, polarized at -0.85 V. H2 was immediately generated (visible bubbles). Yet, despite 17 consecutive substrate additions, progressive current consumption only happened after 3 days of operation, when EA-biofilm 18 was successfully established. Maximal current density reached for this period (day 0 to 3) was 12.4 A/m2. (See Fig. S4.2) 19 Planktonic SRB were present; however, even if they would be capable of consuming the electrogenerated H2 as energy 20 carrier, the quantity of charge was not affected by their presence or metabolic activity. This experiment was also performed 21 by including a filtering pretreatment (0.22 µm), to remove the bacteria. No significant differences were observed. The 22 constant and low current density that evolved, was attributed to classical H2 evolution. 23 Exp. 5 Control experiments with SRB in the presence of a non-polarized electrode were also considered. Microbial biomass 24 did not show noticeable increase (observed by optical density). 25 Exp. 6 Additional control experiments with SRB in the absence of electrodes were also considered. Suitable electron donor 26 (sodium lactate) and acceptor (acetate and butyrate) were added. Although copious biomass growth was observed, as was 27 also the case of Exp. 5, no alcohols, acetone or other reduced products from acetate or butyrate were detected. 28 Exp. 7 Abiotic and sterile experiments with clean electrode in synthetic feed (Exp. 7a) was also performed. Additionally, 29 control experiment with only the stainless steel mesh (Exp. 7b) current collector (without carbon) as working electrode were 30 also conducted to facilitate H2 evolution alone, but contrary to the work of De Silva et al.,1 only low current densities were 31 reached (~1-8 A/m2) for rather short periods (See Fig S4.2b) even after subsequent substrate additions. None of these resulted 32 in current density improvement correlated to substrate consumption, or in the production of alcohols, acetone or elongated 33 VFAs. 34 Exp. 8 Exp. 1–7 were not adapted to accumulate produced gases in the headspace, as they were continuously flushed with 35 sterile N2 flow-rate. For this reason, independent reactors were set hermetically, without any atmosphere alteration. From the 36 first hours up to 2 days, the composition of the headspace progressed to 92-99% H2. Traces of CO2 (0.2-0.6%) evolved and 37 no methane was produced (See Fig. S4.3). In such experiments, the products detected in Exp. 1–3 were not found. In 38 contrast, traces of glycerol (up to 0.96 g/L) and lactic acid (up to 2.36 g/L) were formed (See Fig. S4.4). Several reported 39 bioelectrochemical conversions are favored in the presence of high HPP provided in the headspace or entrapped on the 40 electrode surface with the EA-biofilm (e.g. butyrate to butanol by mixed cultures of fermentative bacteria).2 The effect of 41 increased HPP resulted here was detrimental for effective bioelectrosynthesis of alcohols and acetone. The influence of HPP 42 on product selectivity will be elucidated in future studies. Equally important, in Exp. 8, accumulation of H2 in the headspace 43 radically affected the reduction current, which was not anymore varying with systematic additions of substrates (See Fig. 44 S4.2). Thus, product formation is possible in the presence of H2 as electron donor, but it was clearly not the main driver for 45 the conversions achieved by SRB in Exp. 1, 2 and 3. 46 Exp. 9 A double chambered BES reactor was also set up, separated by a CMI-7000 cation exchange membrane (Membranes 47 International, USA). The chronoamperogram for this particular reactor set up has been shown in Fig. S4.5. Highest current 48 density achieved in this system was 210 A/m2. Scheme as well as the pictorial representation of this set up has also been 49 provided as Fig. S4.6 and S4.7 respectively. 50 51 References 52 53
1. L. De Silva Muñoz, B. Erable, L. Etcheverry, J. Reiss, R. Basséguy and A. Bergel, Electrochem. Commun, 2010, 54 12, 183-186 55
2. M. T. Agler, B. A. Wrenn, S. H. Zinder and L. T. Angenent, Trends Biotechnol., 2011, 29, 70-78 56 57
S4.1: As described in Exp. 2and 3, this graph shows representative curves of the current density evolution of two different 3 half-cell reactors poised at -0.85 V vs Ag/AgCl, with consecutive additions of substrates marked in red circles in Fig. S4.1 a 4 and Fig S4.1b respectively. 5
2 3 S4.2: As described in Exp. 4,7 and 8, this graph shows representative curves of the current density evolution of four different 4 half-cell reactors poised at -0.85 V vs Ag/AgCl, with consecutive additions of substrates marked in red circles. Black, blue 5 and green color represents chronoamperograms that correspond to Exp. 4, 7 and 8 respectively. Exp 4 describes the 6 independent new reactor in which clean non-colonized fresh electrode was place in the exhausted medium of the reactor 7 corresponding to Fig 1(a). For the first three days of operation, the reactor showed maximum current density of 12.4 A/m2 8 but later it started to increase after successful establishment of the biofilm on the electrode surface. Exp.7 discusses the 9 abiotic and sterile control experiments in which clean electrode in synthetic feed (Exp. 7a) and ss mesh (Exp. 7b) were used 10 as working electrode. As seen in the case of Exp.7b current density not more than 8 A/m2 was observed even after 11 subsequent substrate additions. Exp. 8 describes the effect of accumulation of gases inside a hermetically closed BES reactor. 12 As seen in the chronoamperogram, the current density remained stable around 5.7 A/m2 throughout the reactor operation even 13 after subsequent substrate addition. 14 15
1 S4.3: As described in Exp. 8, this graph shows the gas composition inside the hermetically closed reactor. Since the trend did 2 not change beyond this time, the measurements were discontinued 3 4
5 S4.4: As described in Exp. 8, this graph shows the production formation inside the hermetically closed reactor. Since the 6 trend did not change beyond this time, the measurements were discontinued 7 8
2 S4.5: The chronoamperogram represents the current density evolution of a double-chambered BES reactor separated by a 3 CMI-7000 cation exchange membrane (Membranes International, USA) as described in Exp.9. Highest current density 4 achieved in this system was 210 A/m2. 5 6
S4.7 Pictorial representation of one of the electrochemical double chambered cell configuration separated by a CMI-7000 1 cation exchange membrane (Membranes International, USA). The performance of this system has been described in Exp. 9. 2 3
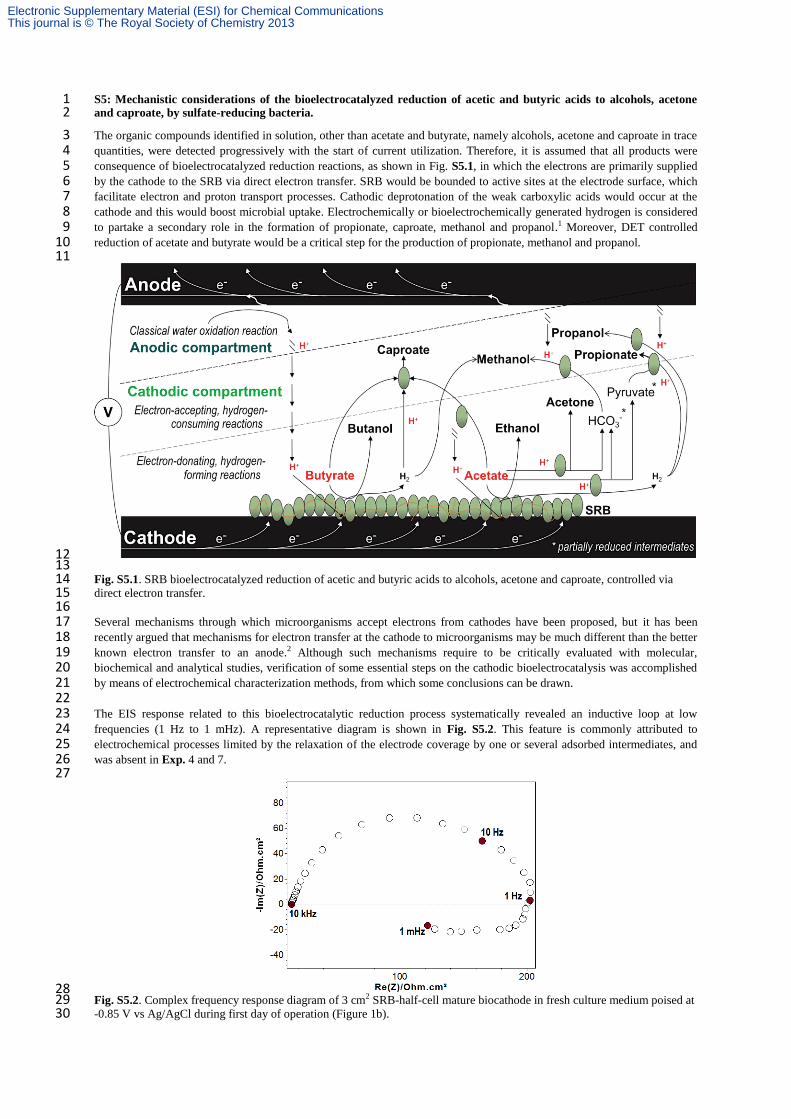
S5: Mechanistic considerations of the bioelectrocatalyzed reduction of acetic and butyric acids to alcohols, acetone 1 and caproate, by sulfate-reducing bacteria. 2
The organic compounds identified in solution, other than acetate and butyrate, namely alcohols, acetone and caproate in trace 3 quantities, were detected progressively with the start of current utilization. Therefore, it is assumed that all products were 4 consequence of bioelectrocatalyzed reduction reactions, as shown in Fig. S5.1, in which the electrons are primarily supplied 5 by the cathode to the SRB via direct electron transfer. SRB would be bounded to active sites at the electrode surface, which 6 facilitate electron and proton transport processes. Cathodic deprotonation of the weak carboxylic acids would occur at the 7 cathode and this would boost microbial uptake. Electrochemically or bioelectrochemically generated hydrogen is considered 8 to partake a secondary role in the formation of propionate, caproate, methanol and propanol.1 Moreover, DET controlled 9 reduction of acetate and butyrate would be a critical step for the production of propionate, methanol and propanol. 10 11
12 13 Fig. S5.1. SRB bioelectrocatalyzed reduction of acetic and butyric acids to alcohols, acetone and caproate, controlled via 14 direct electron transfer. 15 16 Several mechanisms through which microorganisms accept electrons from cathodes have been proposed, but it has been 17 recently argued that mechanisms for electron transfer at the cathode to microorganisms may be much different than the better 18 known electron transfer to an anode.2 Although such mechanisms require to be critically evaluated with molecular, 19 biochemical and analytical studies, verification of some essential steps on the cathodic bioelectrocatalysis was accomplished 20 by means of electrochemical characterization methods, from which some conclusions can be drawn. 21 22 The EIS response related to this bioelectrocatalytic reduction process systematically revealed an inductive loop at low 23 frequencies (1 Hz to 1 mHz). A representative diagram is shown in Fig. S5.2. This feature is commonly attributed to 24 electrochemical processes limited by the relaxation of the electrode coverage by one or several adsorbed intermediates, and 25 was absent in Exp. 4 and 7. 26 27
28 Fig. S5.2. Complex frequency response diagram of 3 cm2 SRB-half-cell mature biocathode in fresh culture medium poised at 29 -0.85 V vs Ag/AgCl during first day of operation (Figure 1b). 30
On the other hand, the presence of multiple peaks in the voltamperometric response indicates possible presence of multiple 1 redox couples/cofactors across a range of formal potentials.3 The derivative of current with respect to potential as a function 2 of potential at different scan rates (Fig. S5.3), calculated from the experimental voltammograms (e.g. Fig. 1c, day 60 and day 3 0), exhibited three consistent peaks, with a response characteristic of adsorption intermediates thus confirming the 4 observations made via EIS. When a reactant or product is weakly adsorbed onto the surface, voltammograms generally 5 exhibit an enhancement of peak currents. For instance, the peak current of the forward or backward scans scale up or down, 6 accordingly, as a function of the scan rate in the case of weak adsorption of a reactant or a product, respectively. Strong 7 adsorption is characterized by the appearance of such peaks as compared to a case with no adsorption.4 8 The small peak 1 (Fig. S5.3) recorded at 1, 5 and 50 mV/s, exhibits visible increase in magnitude as a function of the scan 9 rate, for both forward and backward cycles; in fact, at the lower scan rate, such peak is even negligible. This indicates a 10 strong adsorption of the electrochemically-active molecule implicated in both the oxidized and reduced forms, performing at 11 a formal potential of -0.418 V vs Ag/AgCl (-0.213 V vs SHE). Membrane-integral b-type cytochromes are known to have a 12 role as electron carriers at about this potential (-0.215 V vs SHE), during energy conservation processes in H+ dependent 13 acetogens.5. Microorganisms containing such type of enzyme (i.e. Moorella thermoacetica) have been previously reported to 14 be implicated in cathodic bioelectrosynthesis, from carbon dioxide.2 SRB may utilize metabolic schemes that also involve 15 them in electron transfer processes.6; yet, the exact nature of the electron donor an acceptor systems for b-type cytochromes is 16 not entirely clear.5 Whether their presence would be confirmed, the electrode would be potentially acting as electron donor 17 for cytochrome-b enzymes strongly adsorbed to the electrode. 18 19
20 Fig. S5.3. First derivative of the catalytic current associated to cyclic voltammograms of the cathodic SRB biofilm. Scan rates 21 were 1, 5 and 50 mV/s, respectively. Inset figure shows a magnification of the voltammogram at applied potentials from 0.65 22 V to -0.05 V, that are associated to peak 1. 23 24
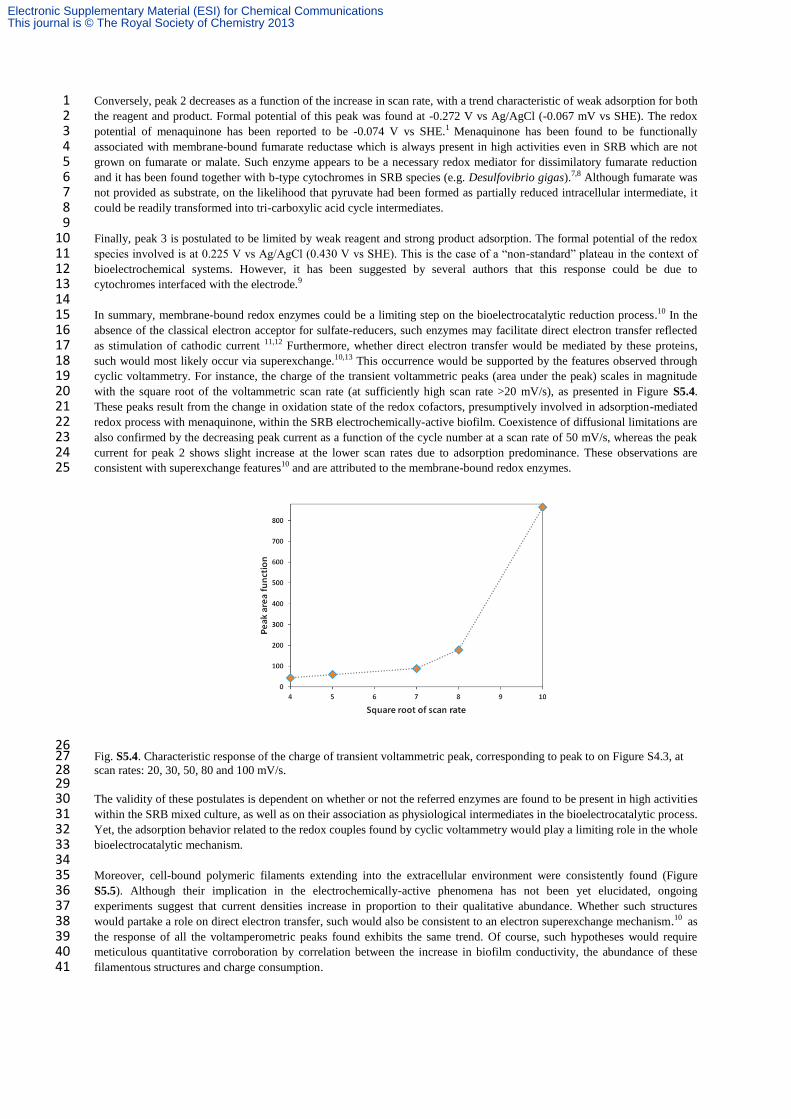
Conversely, peak 2 decreases as a function of the increase in scan rate, with a trend characteristic of weak adsorption for both 1 the reagent and product. Formal potential of this peak was found at -0.272 V vs Ag/AgCl (-0.067 mV vs SHE). The redox 2 potential of menaquinone has been reported to be -0.074 V vs SHE.1 Menaquinone has been found to be functionally 3 associated with membrane-bound fumarate reductase which is always present in high activities even in SRB which are not 4 grown on fumarate or malate. Such enzyme appears to be a necessary redox mediator for dissimilatory fumarate reduction 5 and it has been found together with b-type cytochromes in SRB species (e.g. Desulfovibrio gigas).7,8 Although fumarate was 6 not provided as substrate, on the likelihood that pyruvate had been formed as partially reduced intracellular intermediate, it 7 could be readily transformed into tri-carboxylic acid cycle intermediates. 8 9 Finally, peak 3 is postulated to be limited by weak reagent and strong product adsorption. The formal potential of the redox 10 species involved is at 0.225 V vs Ag/AgCl (0.430 V vs SHE). This is the case of a “non-standard” plateau in the context of 11 bioelectrochemical systems. However, it has been suggested by several authors that this response could be due to 12 cytochromes interfaced with the electrode.9 13 14 In summary, membrane-bound redox enzymes could be a limiting step on the bioelectrocatalytic reduction process.10 In the 15 absence of the classical electron acceptor for sulfate-reducers, such enzymes may facilitate direct electron transfer reflected 16 as stimulation of cathodic current 11,12 Furthermore, whether direct electron transfer would be mediated by these proteins, 17 such would most likely occur via superexchange.10,13 This occurrence would be supported by the features observed through 18 cyclic voltammetry. For instance, the charge of the transient voltammetric peaks (area under the peak) scales in magnitude 19 with the square root of the voltammetric scan rate (at sufficiently high scan rate >20 mV/s), as presented in Figure S5.4. 20 These peaks result from the change in oxidation state of the redox cofactors, presumptively involved in adsorption-mediated 21 redox process with menaquinone, within the SRB electrochemically-active biofilm. Coexistence of diffusional limitations are 22 also confirmed by the decreasing peak current as a function of the cycle number at a scan rate of 50 mV/s, whereas the peak 23 current for peak 2 shows slight increase at the lower scan rates due to adsorption predominance. These observations are 24 consistent with superexchange features10 and are attributed to the membrane-bound redox enzymes. 25
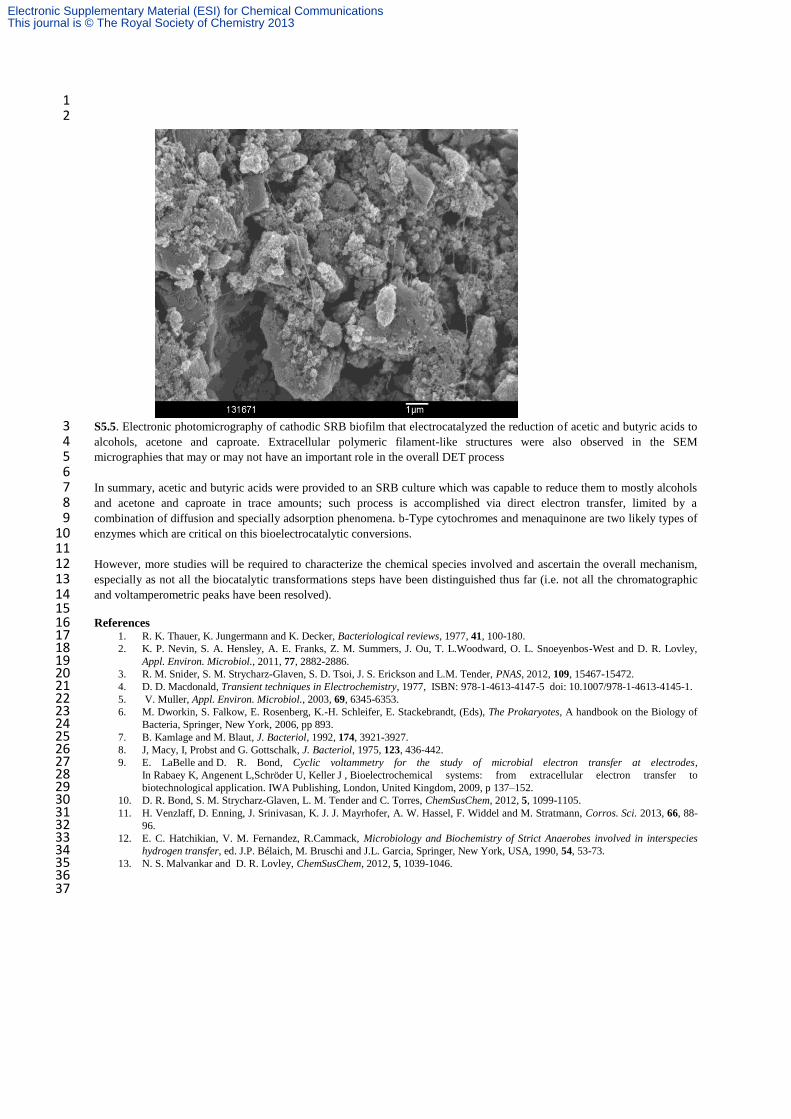
26 Fig. S5.4. Characteristic response of the charge of transient voltammetric peak, corresponding to peak to on Figure S4.3, at 27 scan rates: 20, 30, 50, 80 and 100 mV/s. 28 29 The validity of these postulates is dependent on whether or not the referred enzymes are found to be present in high activities 30 within the SRB mixed culture, as well as on their association as physiological intermediates in the bioelectrocatalytic process. 31 Yet, the adsorption behavior related to the redox couples found by cyclic voltammetry would play a limiting role in the whole 32 bioelectrocatalytic mechanism. 33 34 Moreover, cell-bound polymeric filaments extending into the extracellular environment were consistently found (Figure 35 S5.5). Although their implication in the electrochemically-active phenomena has not been yet elucidated, ongoing 36 experiments suggest that current densities increase in proportion to their qualitative abundance. Whether such structures 37 would partake a role on direct electron transfer, such would also be consistent to an electron superexchange mechanism.10 as 38 the response of all the voltamperometric peaks found exhibits the same trend. Of course, such hypotheses would require 39 meticulous quantitative corroboration by correlation between the increase in biofilm conductivity, the abundance of these 40 filamentous structures and charge consumption. 41
S5.5. Electronic photomicrography of cathodic SRB biofilm that electrocatalyzed the reduction of acetic and butyric acids to 3 alcohols, acetone and caproate. Extracellular polymeric filament-like structures were also observed in the SEM 4 micrographies that may or may not have an important role in the overall DET process 5 6 In summary, acetic and butyric acids were provided to an SRB culture which was capable to reduce them to mostly alcohols 7 and acetone and caproate in trace amounts; such process is accomplished via direct electron transfer, limited by a 8 combination of diffusion and specially adsorption phenomena. b-Type cytochromes and menaquinone are two likely types of 9 enzymes which are critical on this bioelectrocatalytic conversions. 10 11 However, more studies will be required to characterize the chemical species involved and ascertain the overall mechanism, 12 especially as not all the biocatalytic transformations steps have been distinguished thus far (i.e. not all the chromatographic 13 and voltamperometric peaks have been resolved). 14 15 References 16
1. R. K. Thauer, K. Jungermann and K. Decker, Bacteriological reviews, 1977, 41, 100-180. 17 2. K. P. Nevin, S. A. Hensley, A. E. Franks, Z. M. Summers, J. Ou, T. L.Woodward, O. L. Snoeyenbos-West and D. R. Lovley, 18
Appl. Environ. Microbiol., 2011, 77, 2882-2886. 19 3. R. M. Snider, S. M. Strycharz-Glaven, S. D. Tsoi, J. S. Erickson and L.M. Tender, PNAS, 2012, 109, 15467-15472. 20 4. D. D. Macdonald, Transient techniques in Electrochemistry, 1977, ISBN: 978-1-4613-4147-5 doi: 10.1007/978-1-4613-4145-1. 21 5. V. Muller, Appl. Environ. Microbiol., 2003, 69, 6345-6353. 22 6. M. Dworkin, S. Falkow, E. Rosenberg, K.-H. Schleifer, E. Stackebrandt, (Eds), The Prokaryotes, A handbook on the Biology of 23
Bacteria, Springer, New York, 2006, pp 893. 24 7. B. Kamlage and M. Blaut, J. Bacteriol, 1992, 174, 3921-3927. 25 8. J, Macy, I, Probst and G. Gottschalk, J. Bacteriol, 1975, 123, 436-442. 26 9. E. LaBelle and D. R. Bond, Cyclic voltammetry for the study of microbial electron transfer at electrodes, 27
In Rabaey K, Angenent L,Schröder U, Keller J , Bioelectrochemical systems: from extracellular electron transfer to 28 biotechnological application. IWA Publishing, London, United Kingdom, 2009, p 137–152. 29
10. D. R. Bond, S. M. Strycharz-Glaven, L. M. Tender and C. Torres, ChemSusChem, 2012, 5, 1099-1105. 30 11. H. Venzlaff, D. Enning, J. Srinivasan, K. J. J. Mayrhofer, A. W. Hassel, F. Widdel and M. Stratmann, Corros. Sci. 2013, 66, 88-31
96. 32 12. E. C. Hatchikian, V. M. Fernandez, R.Cammack, Microbiology and Biochemistry of Strict Anaerobes involved in interspecies 33
hydrogen transfer, ed. J.P. Bélaich, M. Bruschi and J.L. Garcia, Springer, New York, USA, 1990, 54, 53-73. 34 13. N. S. Malvankar and D. R. Lovley, ChemSusChem, 2012, 5, 1039-1046. 35
S6: Representative GC chromatogram of day 19 of the Exp. 2. The extra peaks in the chromatogram represent products 1 which are still not determined with the present calibration method used for GC analysis. 2


![Conventional and Inverted Photovoltaic Cells Fabricated ...koreascience.or.kr/article/JAKO201416760764766.pdf61–butyric acid methyl ester or [6,6]-phenyl-C 71-butyric acid methyl](https://static.documents.pub/doc/80x56/6095158a83c7e40411746c95/conventional-and-inverted-photovoltaic-cells-fabricated-61abutyric-acid-methyl.jpg)


