BioEnergy and BioEnergy and BioChemicals BioChemicals Development and the Development and the Potential Role of Potential Role of Forests Forests An Opportunity for An Opportunity for Minnesota Minnesota
Transcript
BioEnergy and BioEnergy and BioChemicals Development BioChemicals Development
and the and the Potential Role of ForestsPotential Role of Forests
An Opportunity for An Opportunity for MinnesotaMinnesota
BioEnergy and BioChemicals BioEnergy and BioChemicals Development and the Development and the
Potential Role of ForestsPotential Role of Forests
• Current energy trends.
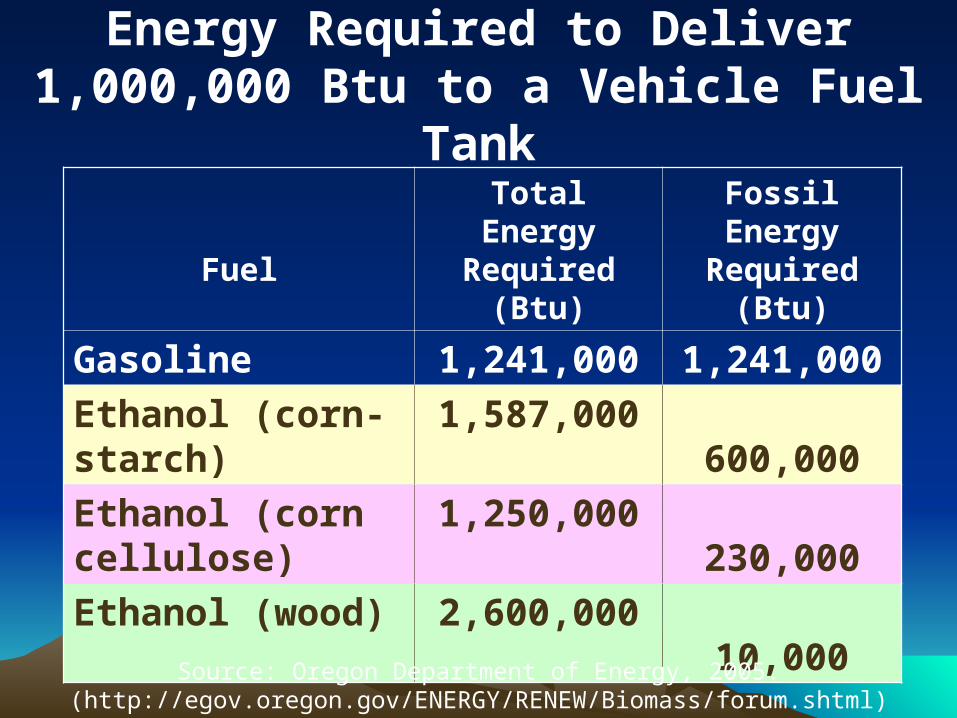
• Bio-energy as an alternative to fossil fuels.
• Minnesota’s bio-energy potential.• Bio-energy in an integrated bio-economy.• Public policy considerations in bio-energy/ bio-chemicals development.
Current Energy Current Energy TrendsTrends
U.S. energy U.S. energy consumption and consumption and
imports are rising.imports are rising.
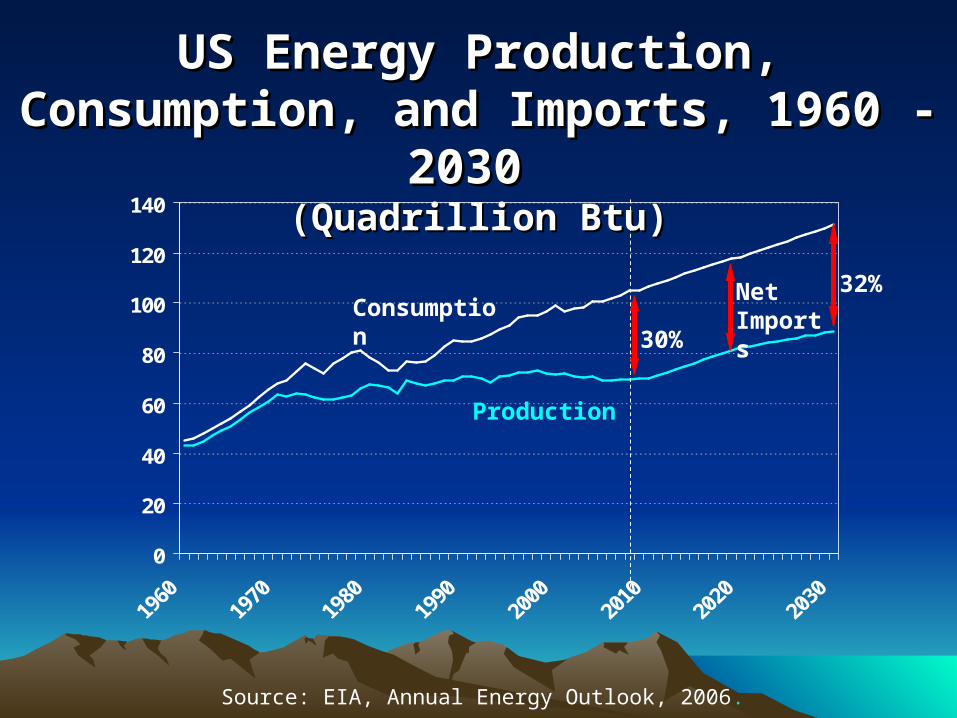
US Energy Production, Consumption, US Energy Production, Consumption, and Imports, 1960 - 2030 and Imports, 1960 - 2030
(Quadrillion Btu)(Quadrillion Btu)
0
20
40
60
80
100
120
140
Source: EIA, Annual Energy Outlook, 2006.
Consumption
Production
Net Imports
30%
32%
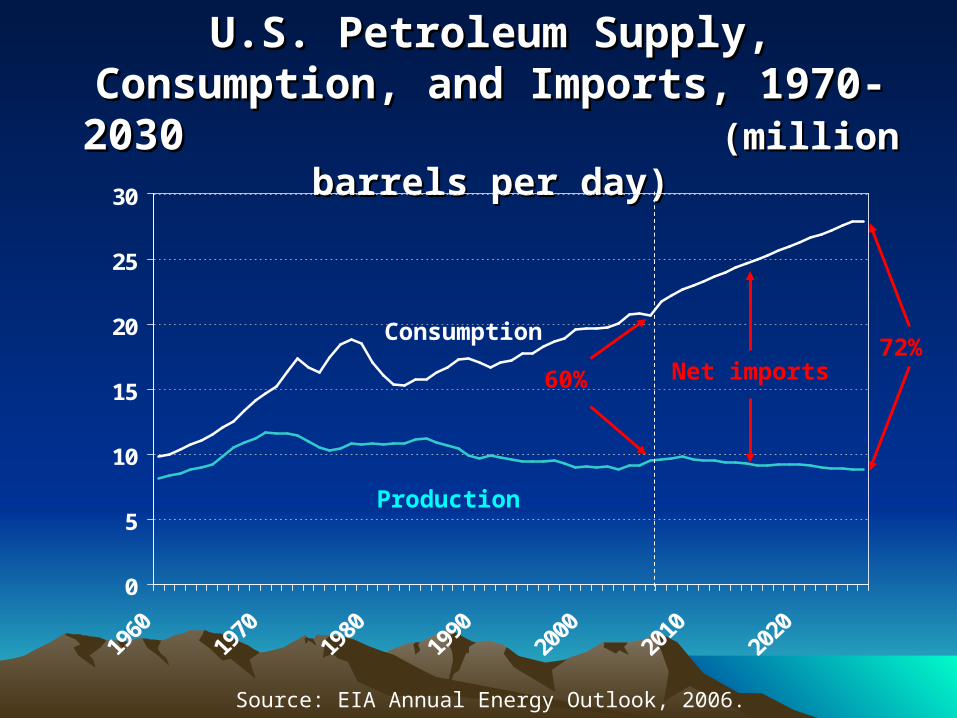
U.S. Petroleum Supply, Consumption, U.S. Petroleum Supply, Consumption, and Imports, 1970-2030and Imports, 1970-2030
(million barrels per day)(million barrels per day)
0
5
10
15
20
25
30
Source: EIA Annual Energy Outlook, 2006.
Production
Consumption
Net imports60%72%
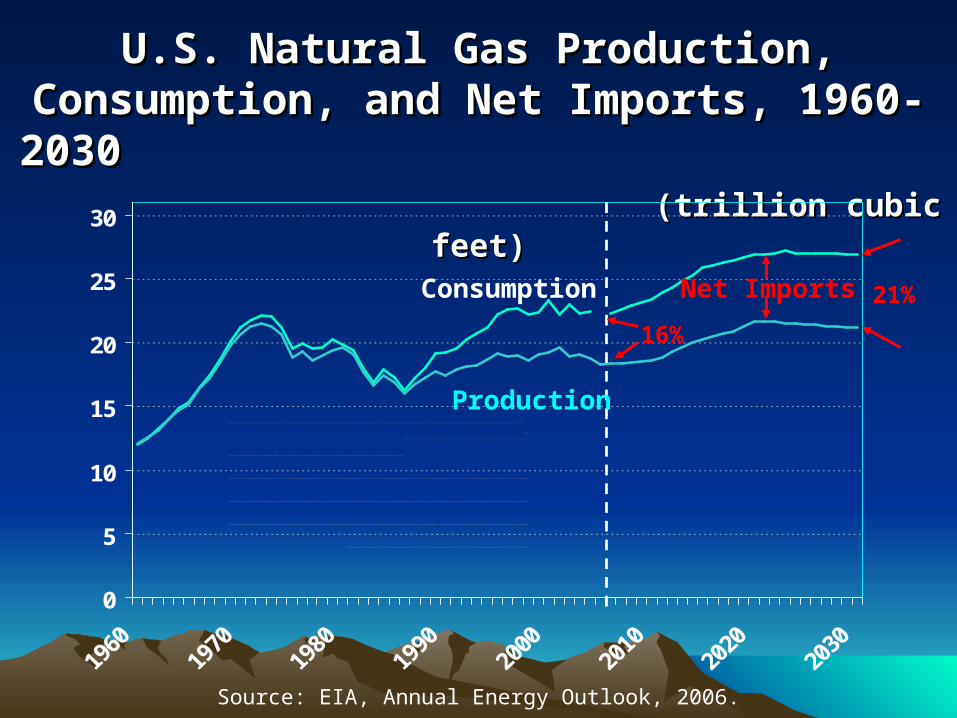
U.S. Natural Gas Production, Consumption, U.S. Natural Gas Production, Consumption, and Net Imports, 1960-2030and Net Imports, 1960-2030
(trillion cubic feet)(trillion cubic feet)
0
5
10
15
20
25
30
16%
21%Net ImportsConsumption
Production
Source: EIA, Annual Energy Outlook, 2006.
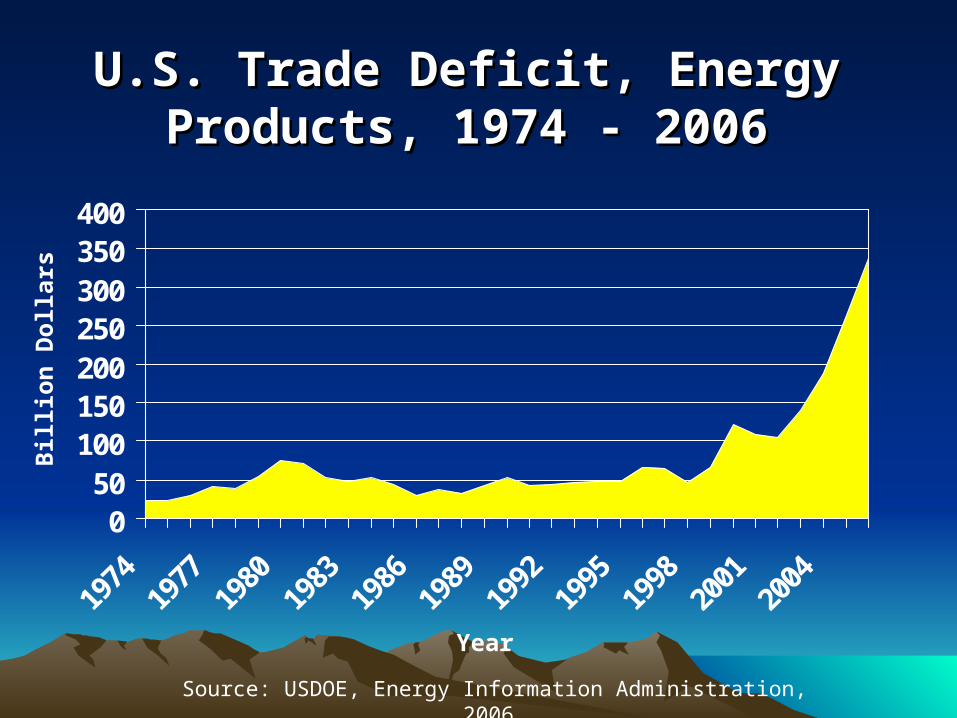
U.S. Trade Deficit, Energy Products, U.S. Trade Deficit, Energy Products, 1974 - 20061974 - 2006
050
100150200250300350400
Billion
Dollars
Year
Source: USDOE, Energy Information Administration, 2006.
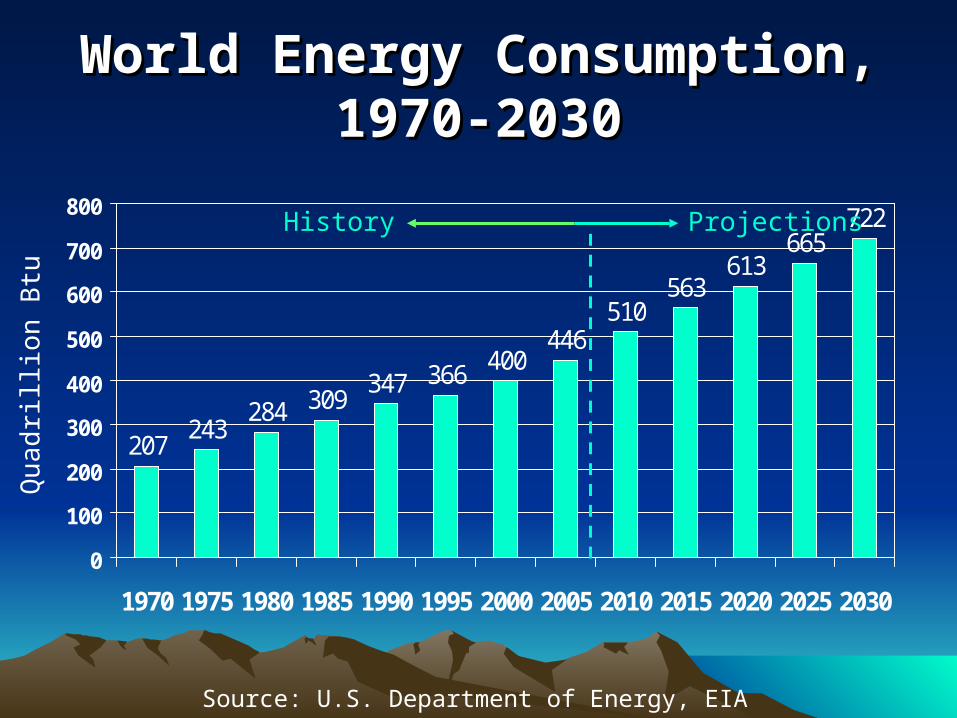
Global energy Global energy consumption is consumption is
increasing rapidly.increasing rapidly.
World Energy Consumption, World Energy Consumption, 1970-20301970-2030
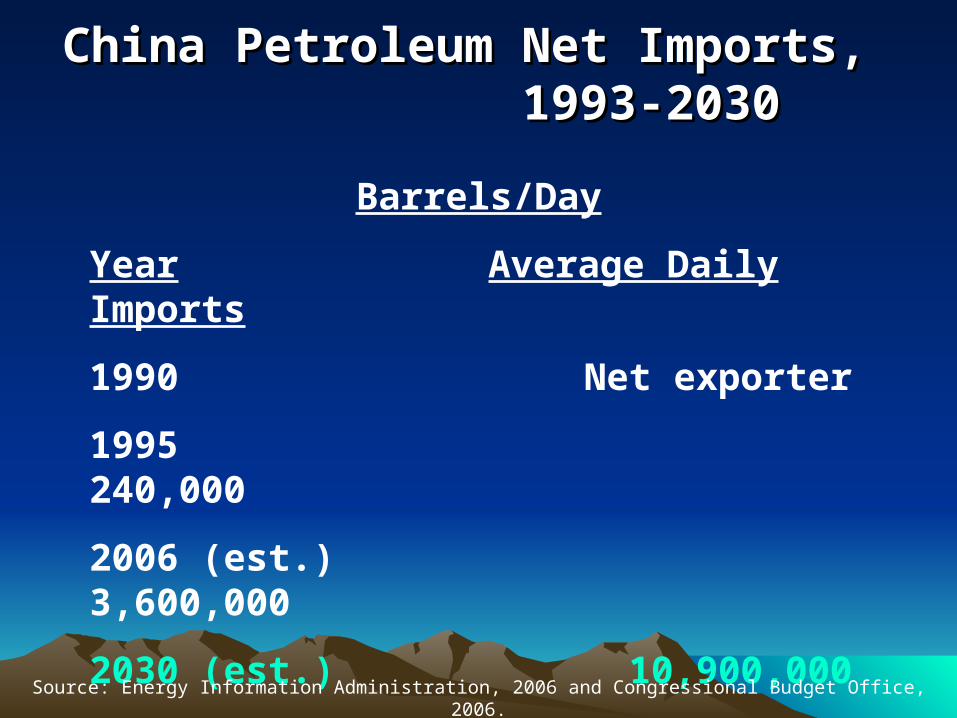
China Petroleum Net Imports, China Petroleum Net Imports, 1993-20301993-2030
Barrels/Day
Year Average Daily Imports
1990 Net exporter
1995 240,000
2006 (est.) 3,600,000
2030 (est.) 10,900,000Source: Energy Information Administration, 2006 and Congressional Budget Office, 2006.
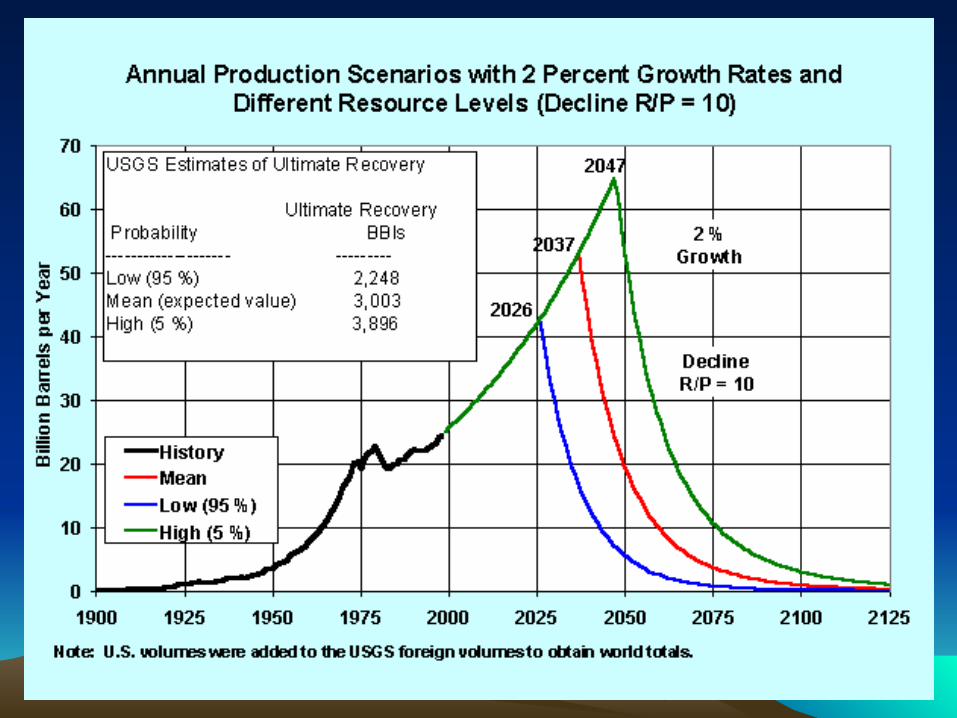
Peak production of Peak production of petroleum globally is petroleum globally is
within sight.within sight.
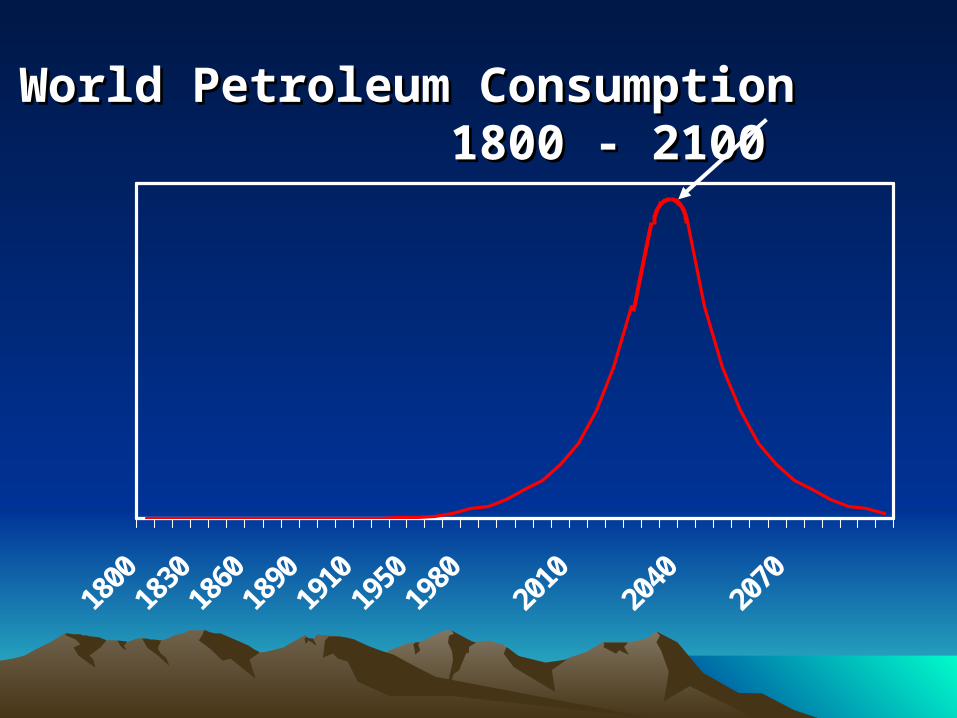
World Petroleum Consumption World Petroleum Consumption 1800 - 21001800 - 2100
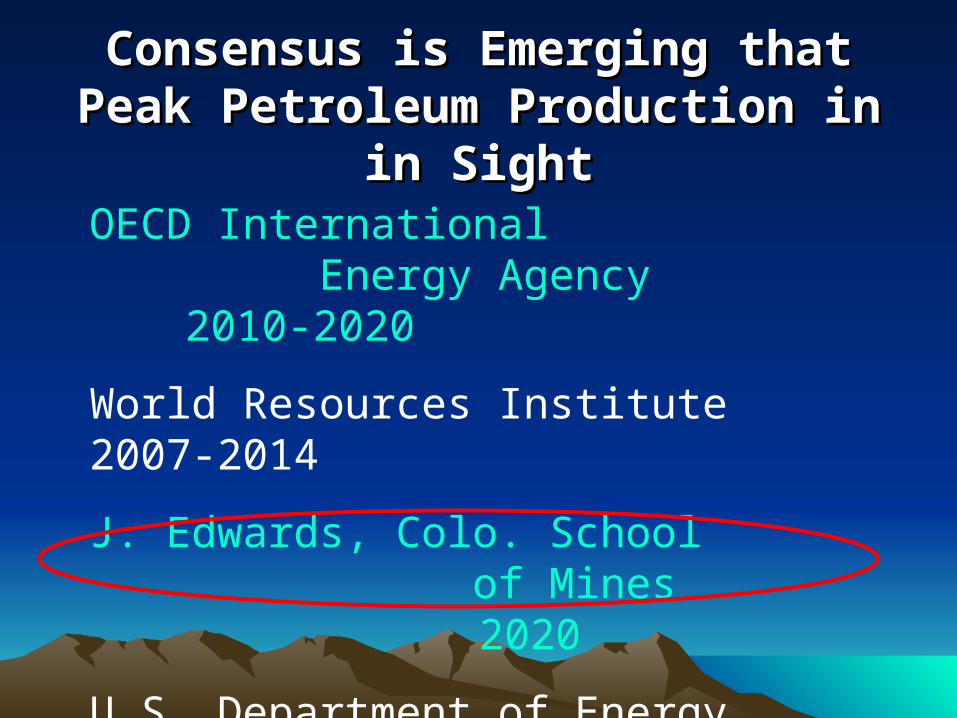
Consensus is Emerging that Peak Consensus is Emerging that Peak Petroleum Production in in SightPetroleum Production in in Sight
OECD International Energy Agency2010-2020
World Resources Institute 2007-2014
J. Edwards, Colo. School of Mines 2020
U.S. Department of Energy 2037
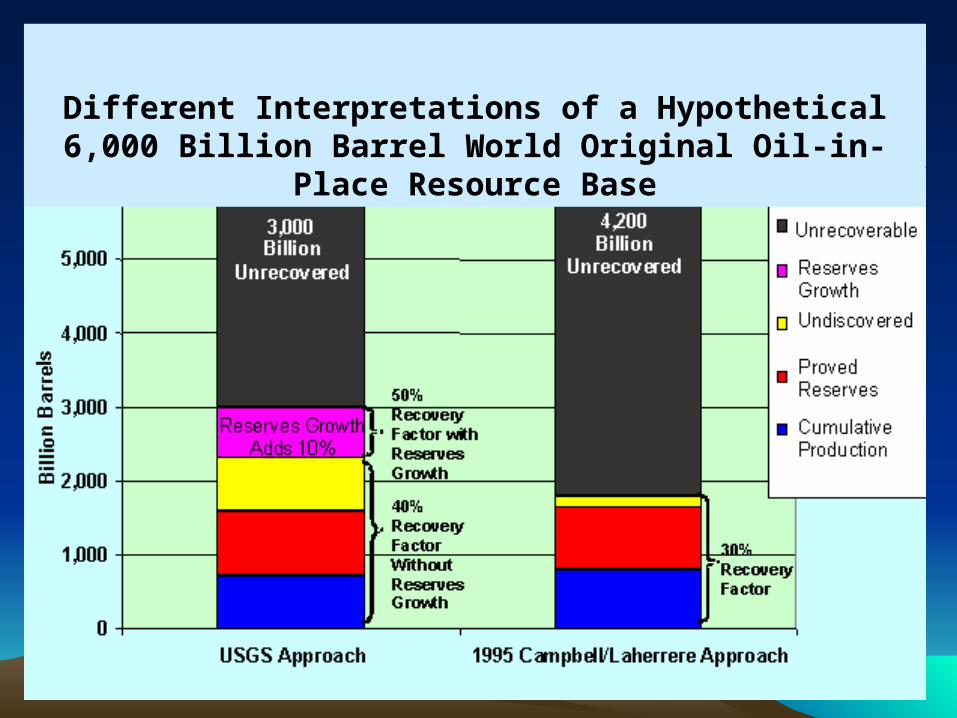
Different Interpretations of a Hypothetical 6,000 Billion Barrel World Original Oil-in-Place Resource Base
Bio-Energy as an Bio-Energy as an Alternative to Fossil Alternative to Fossil
FuelsFuels
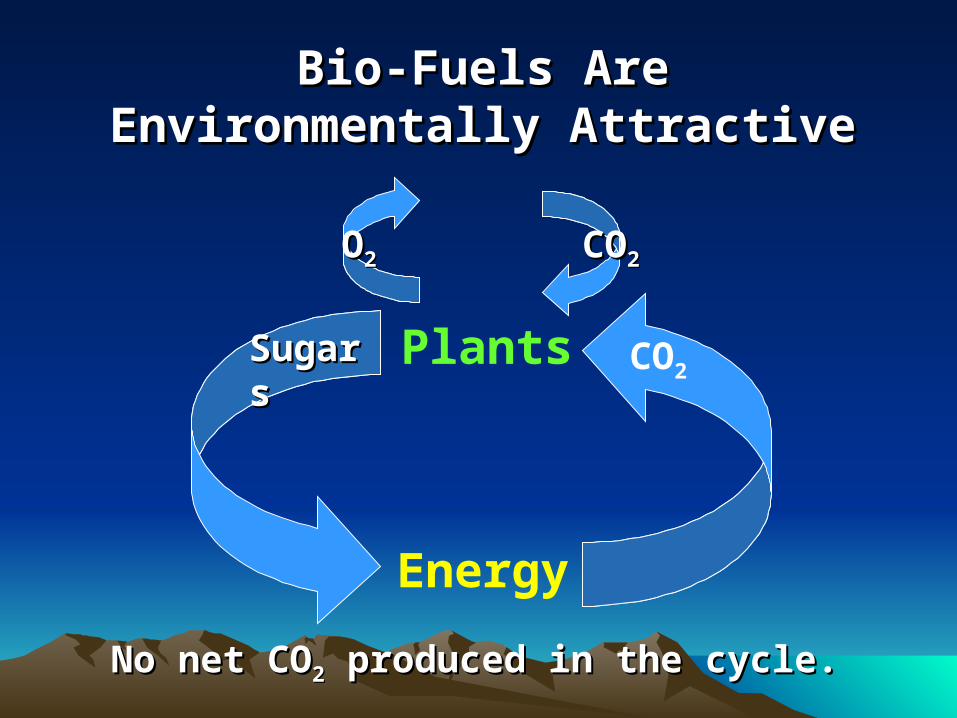
Plants
Energy
CO2
COCO22OO22
SugarSugarss
No net CONo net CO22 produced in the cycle. produced in the cycle.
Bio-Fuels Are Environmentally Bio-Fuels Are Environmentally AttractiveAttractive
There are also a number of There are also a number of potential sources of bio-potential sources of bio-
energy.energy.
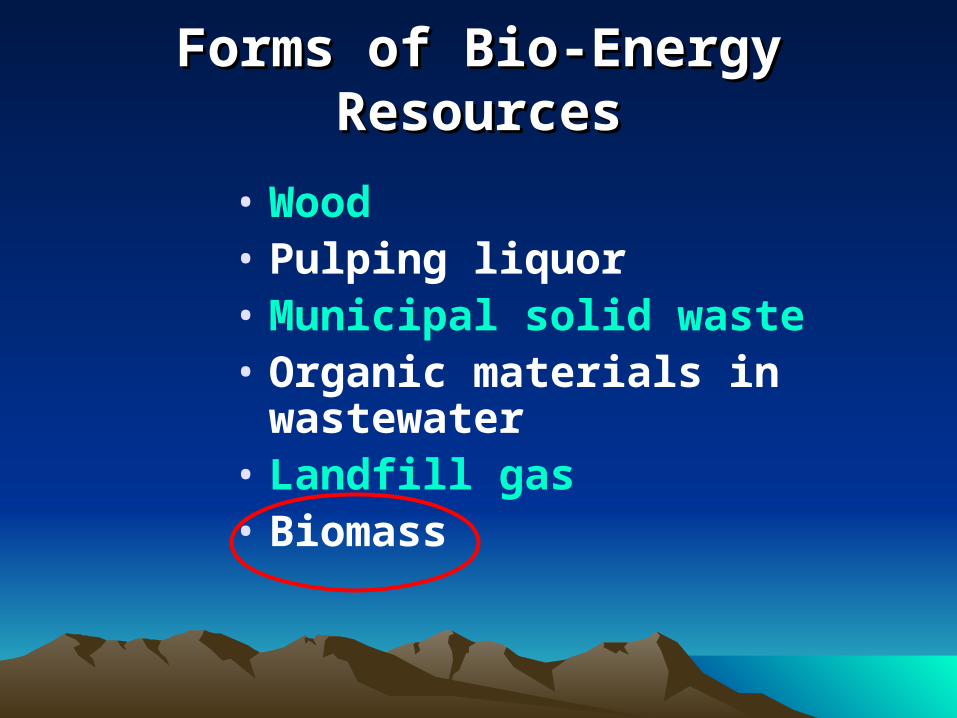
Forms of Bio-Energy ResourcesForms of Bio-Energy Resources
• Wood• Pulping liquor• Municipal solid waste• Organic materials in
wastewater• Landfill gas• Biomass
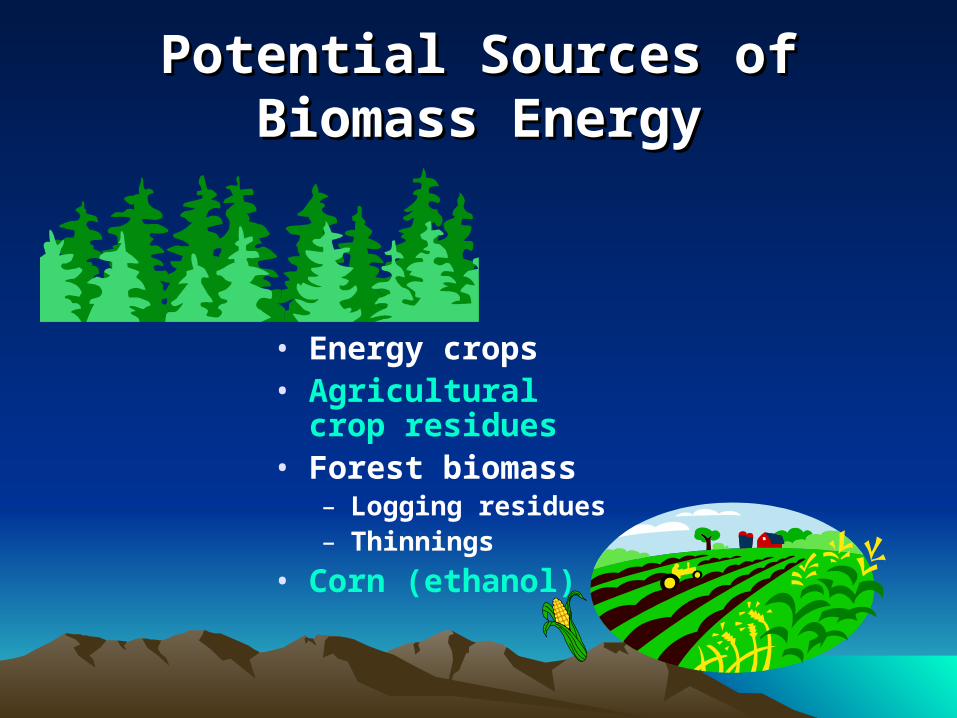
Potential Sources of Biomass Potential Sources of Biomass EnergyEnergy
• Energy crops• Agricultural crop
residues• Forest biomass
– Logging residues– Thinnings
• Corn (ethanol)
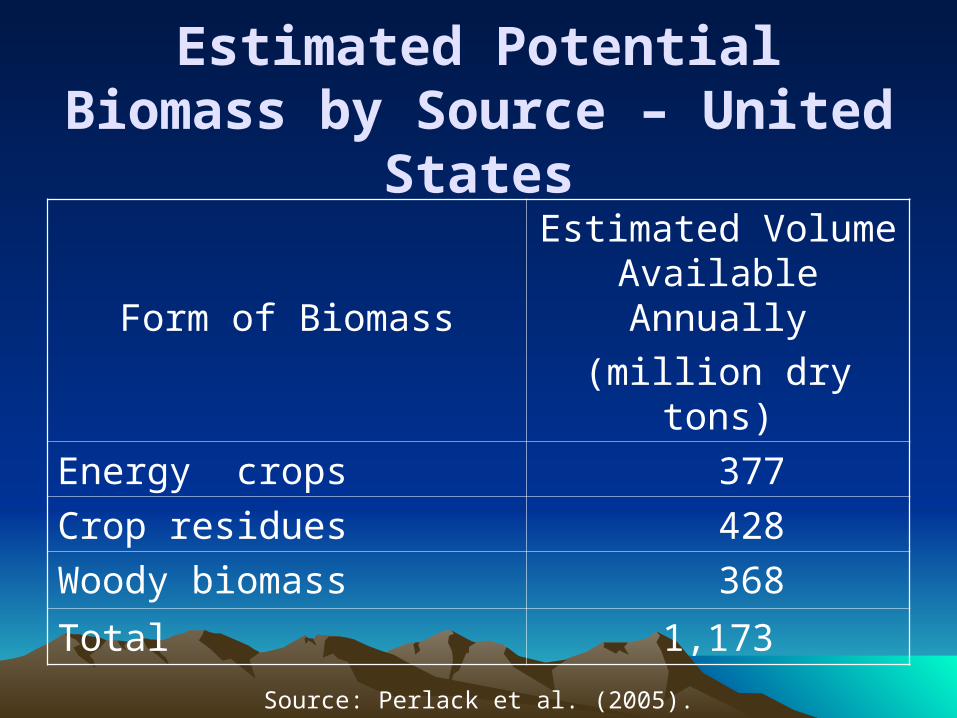
Potential supplies of biomass Potential supplies of biomass are much greater than those are much greater than those
now used for energy now used for energy generation.generation.
A recent report from the U.S. A recent report from the U.S. Departments of Agriculture and Departments of Agriculture and
Energy suggests the annual Energy suggests the annual availability of over 1.3 billion dry availability of over 1.3 billion dry
tons of biomass in the United tons of biomass in the United States.States.
Source: Perlack et al. (2005).
Estimated Potential Biomass by Source – United States
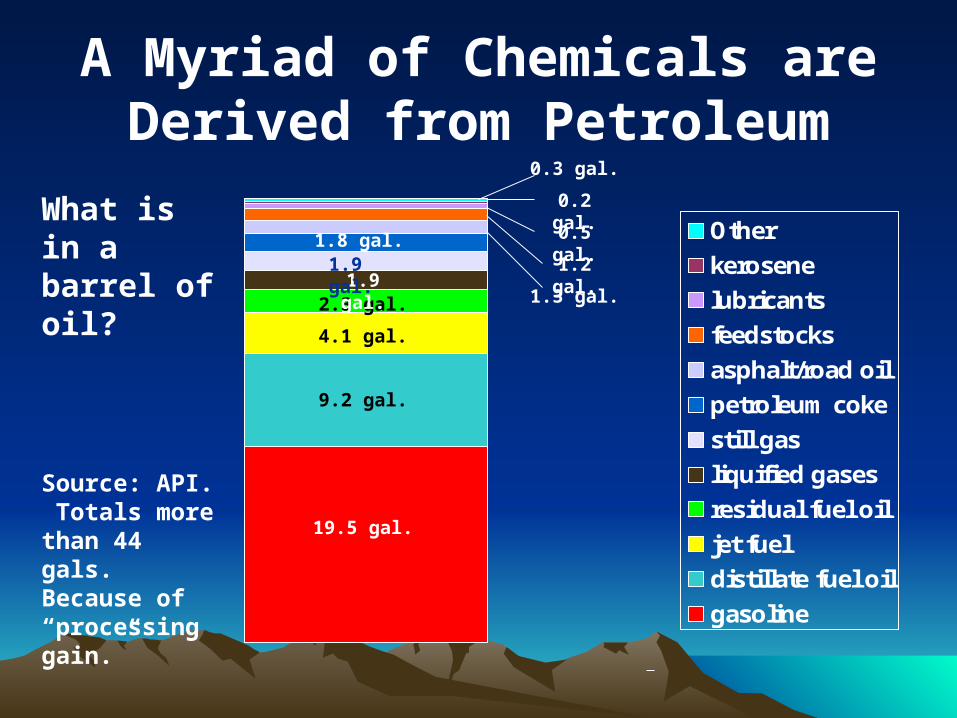
Form of Biomass
Estimated Volume Available Annually
(million dry tons)
Energy crops 377
Crop residues 428
Woody biomass 368
Total 1,173
Source: Perlack et al. (2005).
There are a number of There are a number of options for utilizing options for utilizing
biomass as an energy biomass as an energy source.source.
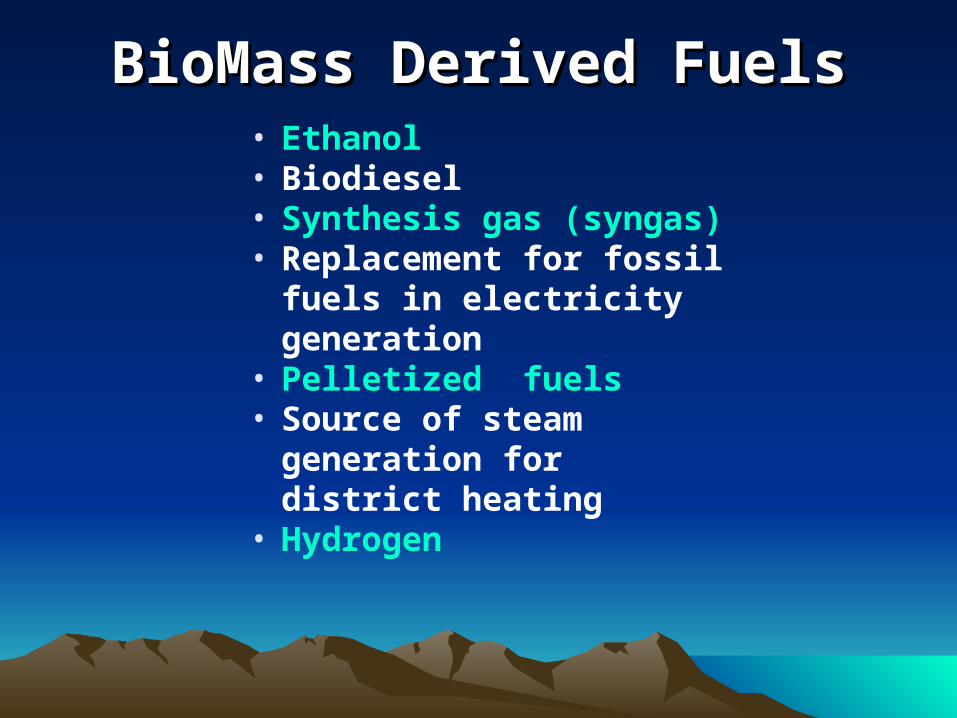
BioMass Derived FuelsBioMass Derived Fuels• Ethanol• Biodiesel• Synthesis gas (syngas)• Replacement for fossil
fuels in electricity generation
• Pelletized fuels• Source of steam
generation for district heating
• Hydrogen
Minnesota’s Minnesota’s Bio-Energy Bio-Energy
PotentialPotential
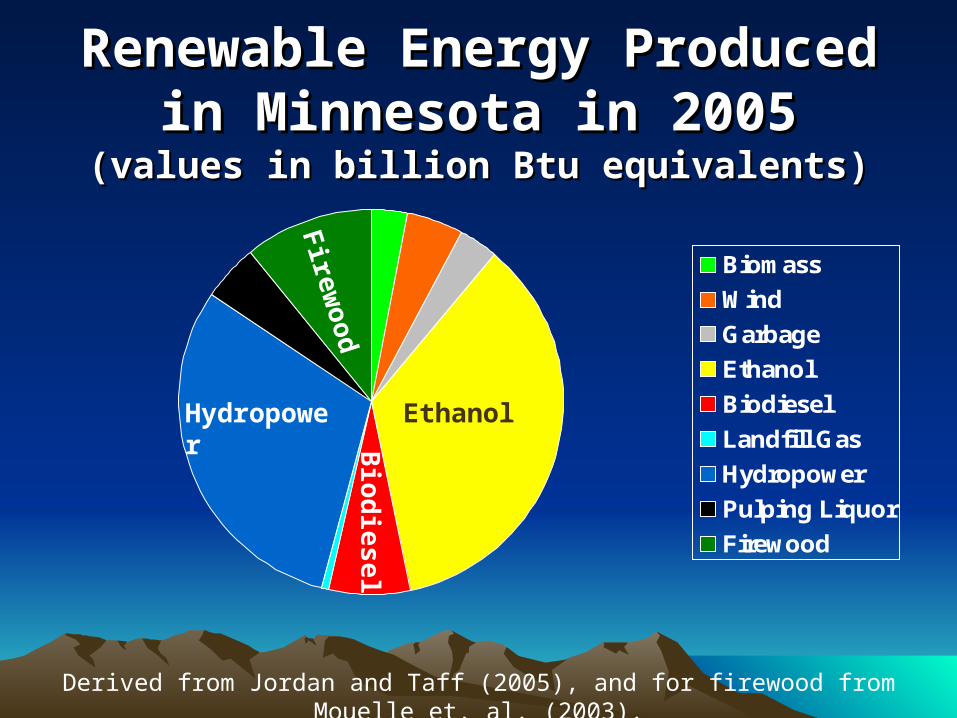
Renewable Energy Produced in Renewable Energy Produced in Minnesota in 2005Minnesota in 2005
(values in billion Btu equivalents)(values in billion Btu equivalents)
Biomass
Wind
Garbage
Ethanol
Biodiesel
Landfill Gas
Hydropower
Pulping Liquor
Firewood
EthanolHydropower
Firew
oo
dB
iod
ies
el
Derived from Jordan and Taff (2005), and for firewood from Mouelle et. al. (2003).
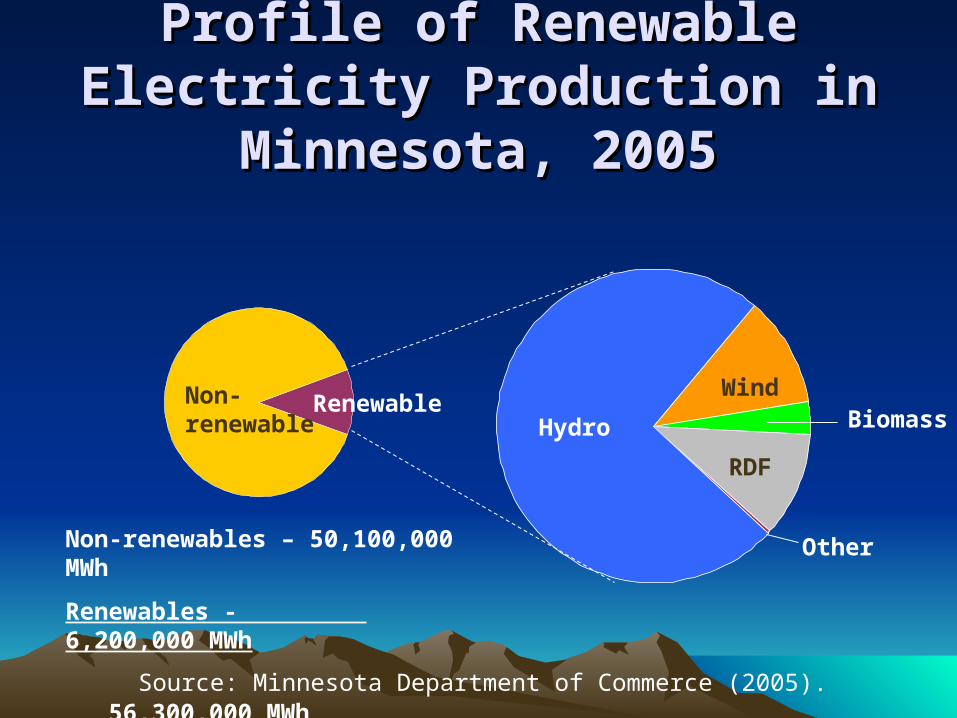
Profile of Renewable Electricity Profile of Renewable Electricity Production in Minnesota, 2005Production in Minnesota, 2005
Hydro
Wind
RDF
Biomass
Other
Non-renewable
Renewable
Source: Minnesota Department of Commerce (2005).
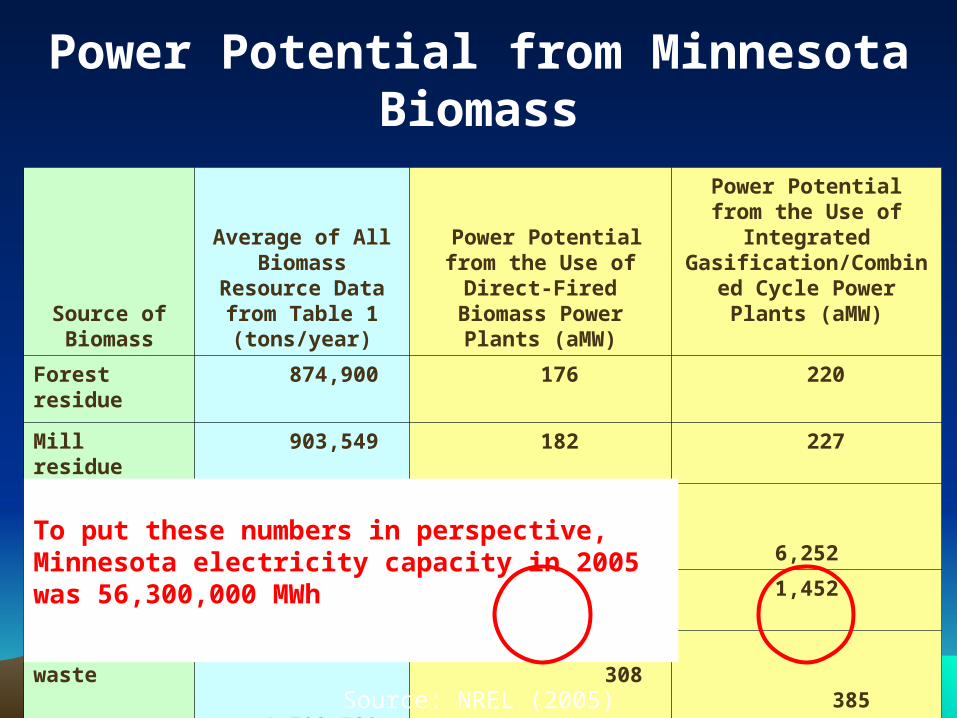
Non-renewables – 50,100,000 MWh
Renewables - 6,200,000 MWh
56,300,000 MWh
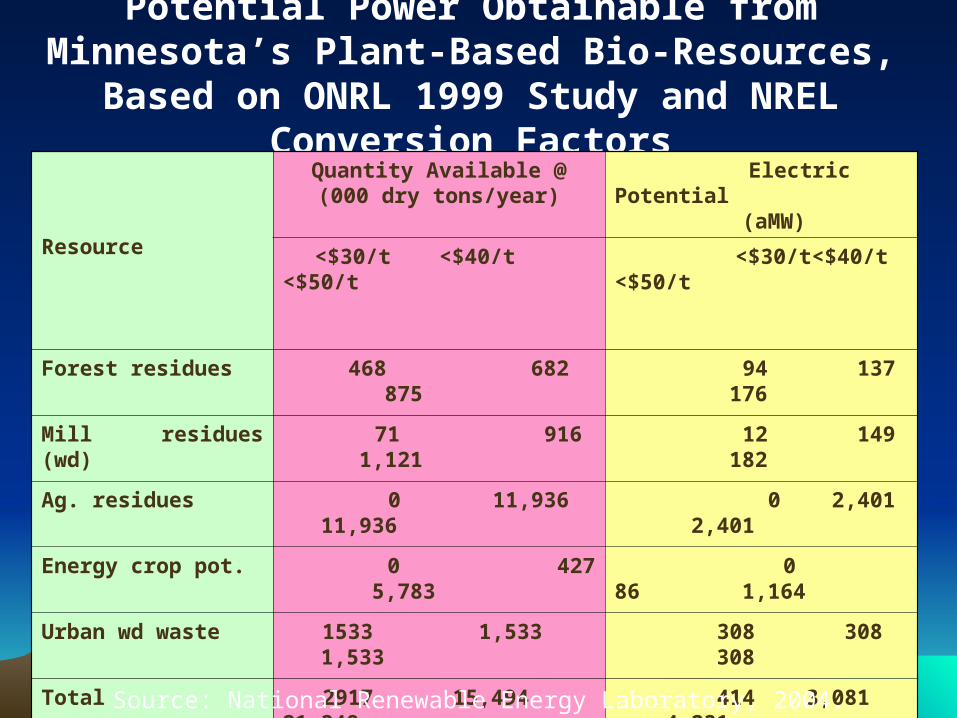
Minnesota has significant opportunity for further
development of bio-energy.
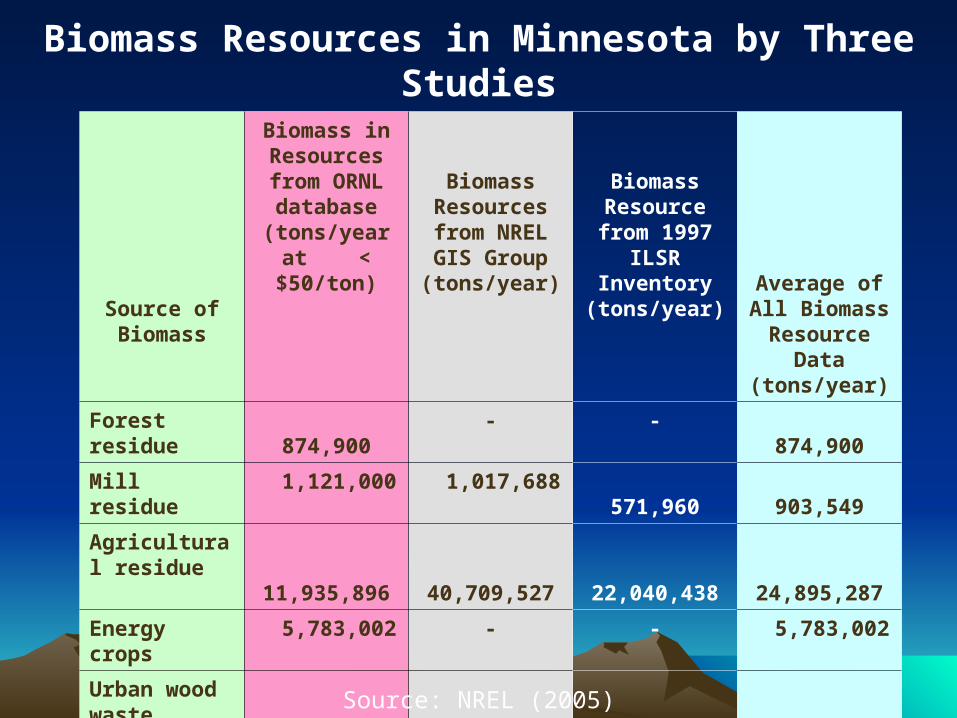
Biomass Resources in Minnesota by Three Studies
Source of Biomass
Biomass in Resources from ORNL database (tons/year
at < $50/ton)
Biomass
Resources from NREL GIS Group (tons/year)
Biomass Resource from 1997
ILSR Inventory
(tons/year)
Average of All Biomass Resource
Data (tons/year)
Forest residue
874,900 - - 874,900
Mill residue 1,121,000 1,017,688 571,960 903,549
Agricultural residue
11,935,896
40,709,527
22,040,438
24,895,287
Energy crops
5,783,002 - - 5,783,002
Urban wood waste
1,532,529
-
-
1,532,529
Total 21,247,327 41,727,215 22,612,398 33,989,267
Source: NREL (2005)
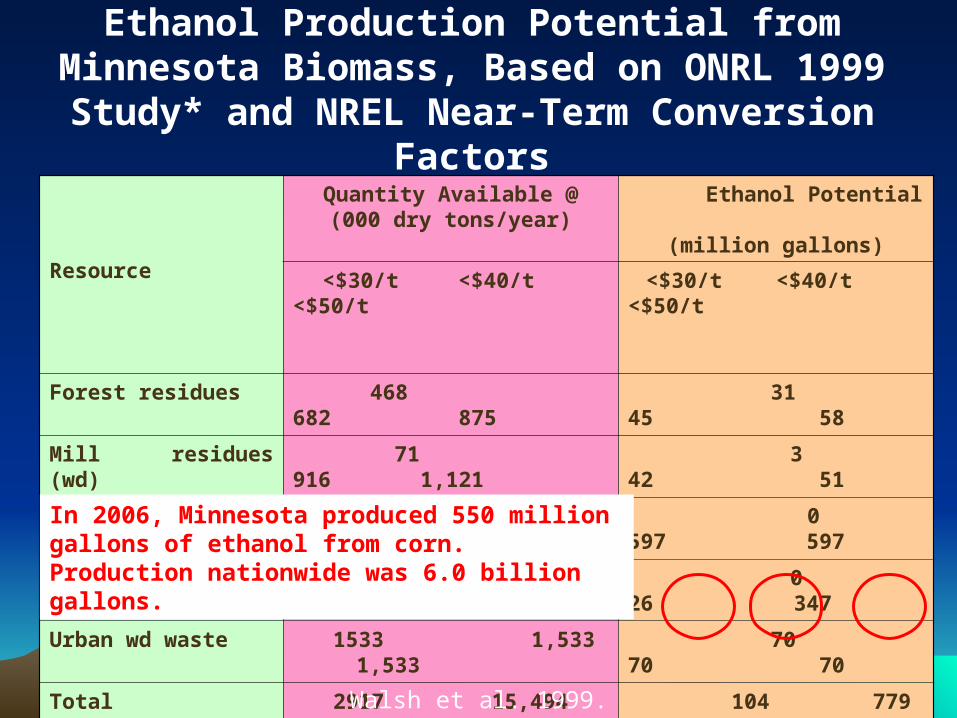
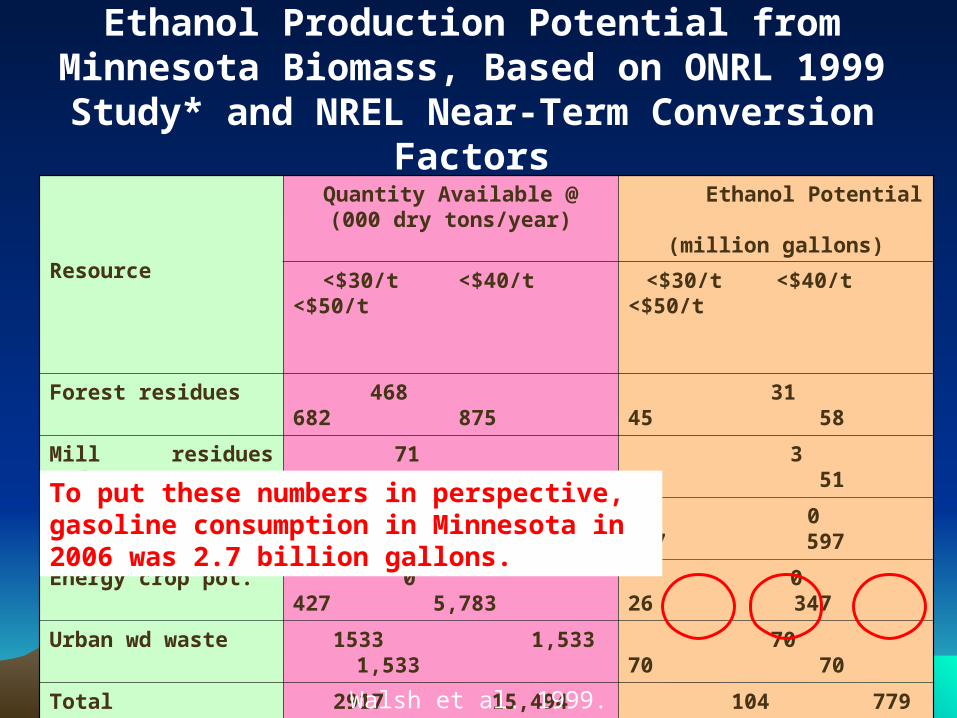
Ethanol Production Ethanol Production PotentialPotential
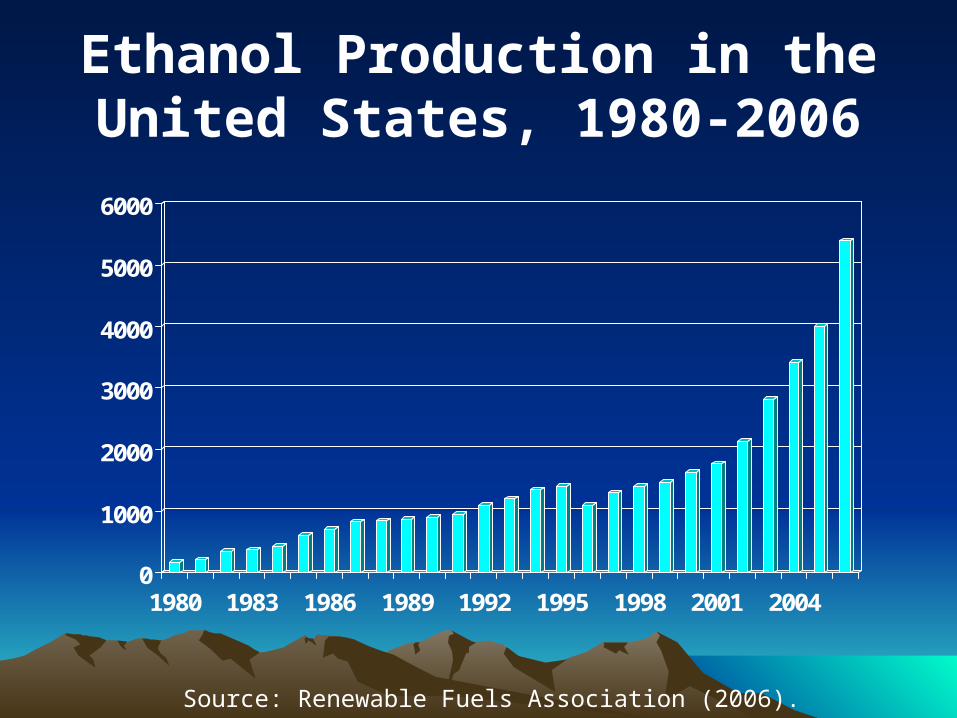
Ethanol Production in the United States, 1980-2006
0
1000
2000
3000
4000
5000
6000
1980 1983 1986 1989 1992 1995 1998 2001 2004
Source: Renewable Fuels Association (2006). (2006 est.)
The corn ethanol industry in the U.S. reached a
production capacity of over 6 billion gallons annually in
2006.
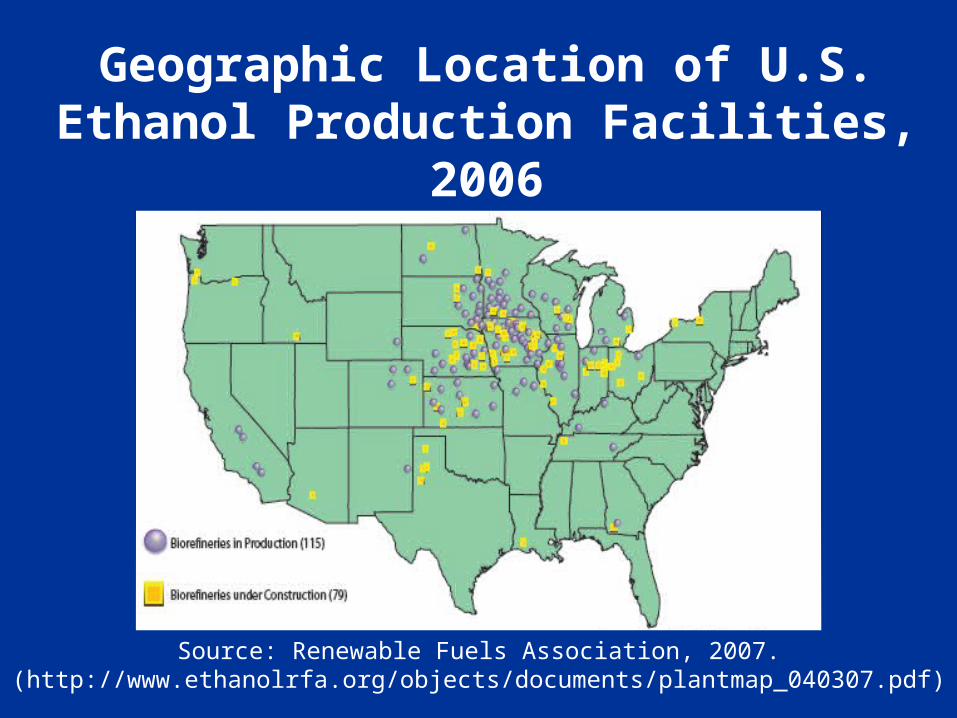
Potential annual production Potential annual production of ethanol in the U.S. is of ethanol in the U.S. is estimated at 50 billion estimated at 50 billion gallons.gallons. To put this in perspective, gasoline consumption in the U.S. in 2006 was 140 billion gallons.
Geographic Location of U.S. Ethanol Production Facilities, 2006


![Forests, bioenergy and climate change mitigationtask38.ieabioenergy.com/wp-content/uploads/2017/01/... · century through large-scale changes in energy systems … [and that] bioenergy](https://static.documents.pub/doc/80x56/5f0c94947e708231d4361cc8/forests-bioenergy-and-climate-change-century-through-large-scale-changes-in-energy.jpg)

