PLEASE SCROLL DOWN FOR ARTICLE This article was downloaded by: [United States Naval Academy] On: 9 May 2011 Access details: Access Details: [subscription number 936074567] Publisher Taylor & Francis Informa Ltd Registered in England and Wales Registered Number: 1072954 Registered office: Mortimer House, 37- 41 Mortimer Street, London W1T 3JH, UK Biofouling Publication details, including instructions for authors and subscription information: http://www.informaworld.com/smpp/title~content=t713454511 Economic impact of biofouling on a naval surface ship M. P. Schultz a ; J. A. Bendick b ; E. R. Holm b ; W. M. Hertel b a Department of Naval Architecture and Ocean Engineering, United States Naval Academy, Annapolis, MD, USA b Naval Sea Systems Command, Naval Surface Warfare Center Carderock, West Bethesda, MD, USA First published on: 14 December 2010 To cite this Article Schultz, M. P. , Bendick, J. A. , Holm, E. R. and Hertel, W. M.(2011) 'Economic impact of biofouling on a naval surface ship', Biofouling, 27: 1, 87 — 98, First published on: 14 December 2010 (iFirst) To link to this Article: DOI: 10.1080/08927014.2010.542809 URL: http://dx.doi.org/10.1080/08927014.2010.542809 Full terms and conditions of use: http://www.informaworld.com/terms-and-conditions-of-access.pdf This article may be used for research, teaching and private study purposes. Any substantial or systematic reproduction, re-distribution, re-selling, loan or sub-licensing, systematic supply or distribution in any form to anyone is expressly forbidden. The publisher does not give any warranty express or implied or make any representation that the contents will be complete or accurate or up to date. The accuracy of any instructions, formulae and drug doses should be independently verified with primary sources. The publisher shall not be liable for any loss, actions, claims, proceedings, demand or costs or damages whatsoever or howsoever caused arising directly or indirectly in connection with or arising out of the use of this material.
Transcript
PLEASE SCROLL DOWN FOR ARTICLE
This article was downloaded by: [United States Naval Academy]On: 9 May 2011Access details: Access Details: [subscription number 936074567]Publisher Taylor & FrancisInforma Ltd Registered in England and Wales Registered Number: 1072954 Registered office: Mortimer House, 37-41 Mortimer Street, London W1T 3JH, UK
BiofoulingPublication details, including instructions for authors and subscription information:http://www.informaworld.com/smpp/title~content=t713454511
Economic impact of biofouling on a naval surface shipM. P. Schultza; J. A. Bendickb; E. R. Holmb; W. M. Hertelb
a Department of Naval Architecture and Ocean Engineering, United States Naval Academy, Annapolis,MD, USA b Naval Sea Systems Command, Naval Surface Warfare Center Carderock, West Bethesda,MD, USA
First published on: 14 December 2010
To cite this Article Schultz, M. P. , Bendick, J. A. , Holm, E. R. and Hertel, W. M.(2011) 'Economic impact of biofouling ona naval surface ship', Biofouling, 27: 1, 87 — 98, First published on: 14 December 2010 (iFirst)To link to this Article: DOI: 10.1080/08927014.2010.542809URL: http://dx.doi.org/10.1080/08927014.2010.542809
Full terms and conditions of use: http://www.informaworld.com/terms-and-conditions-of-access.pdf
This article may be used for research, teaching and private study purposes. Any substantial orsystematic reproduction, re-distribution, re-selling, loan or sub-licensing, systematic supply ordistribution in any form to anyone is expressly forbidden.
The publisher does not give any warranty express or implied or make any representation that the contentswill be complete or accurate or up to date. The accuracy of any instructions, formulae and drug dosesshould be independently verified with primary sources. The publisher shall not be liable for any loss,actions, claims, proceedings, demand or costs or damages whatsoever or howsoever caused arising directlyor indirectly in connection with or arising out of the use of this material.
Economic impact of biofouling on a naval surface ship
M.P. Schultza*, J.A. Bendickb, E.R. Holmb and W.M. Hertelb
aDepartment of Naval Architecture and Ocean Engineering, United States Naval Academy, Annapolis, MD 21402, USA;bNaval Sea Systems Command, Naval Surface Warfare Center Carderock, West Bethesda, MD 20817, USA
(Received 7 October 2010; final version received 22 November 2010)
In the present study, the overall economic impact of hull fouling on a mid-sized naval surface ship (Arleigh Burke-class destroyer DDG-51) has been analyzed. A range of costs associated with hull fouling was examined, includingexpenditures for fuel, hull coatings, hull coating application and removal, and hull cleaning. The results indicate thatthe primary cost associated with fouling is due to increased fuel consumption attributable to increased frictionaldrag. The costs related to hull cleaning and painting are much lower than the fuel costs. The overall cost associatedwith hull fouling for the Navy’s present coating, cleaning, and fouling level is estimated to be $56M per year for theentire DDG-51 class or $1B over 15 years. The results of this study provide guidance as to the amount of money thatcan be reasonably spent for research, development, acquisition, and implementation of new technologies ormanagement strategies to combat hull fouling.
It is well established that biofouling on ships increasesthe surface roughness of the hull which, in turn, causesincreased frictional resistance and fuel consumptionand decreased top speed and range (eg Kempf 1937;Benson et al. 1938; Denny 1951; Watanabe et al. 1969;Lewthwaite et al. 1985; Leer-Andersen and Larsson2003; Schultz 2007). In order to control the problem offouling, antifouling (AF) coatings are used. Most ofthese coatings incorporate biocides which are toxic tomarine organisms and may impact non-target species.The impact of biocides on the environment has led tolegislation regulating their use (Champ 2003). Forexample, the environmental impact of tributyl tin(TBT) biocides in AF coatings first led to their banon vessels 525 m in length in most industrializedcountries (Swain 1998) and has subsequently spurred aworldwide ban on these coatings by the InternationalMaritime Organization (IMO) for all vessels in 2008(Champ 2003). Alternative AF coatings employingcopper and/or co-biocides (eg Irgarol 1051, zincpyrithione and Sea Nine 211), are the principalreplacement for TBT coatings. The present under-standing of the environmental fate and effects of thesebiocides is addressed in the recent review by Thomasand Brooks (2010). Because of the increased environ-mental scrutiny to which copper and co-biocides havebeen subjected, there is a renewed interest regarding
the economic impacts of fouling on ships and anincreased effort to develop effective non-toxic coatings(eg Swain and Schultz 1996; Genzer and Efimenko2006; Beigbeder et al. 2008; Aldred et al. 2010; Istaet al. 2010; Long et al. 2010; Magin et al. 2010). Anexcellent review of historical and present-day AFcoating technologies as well as non-toxic alternativesis given by Finnie and Williams (2010).
The surface condition of the hull is of primaryimportance in the performance of marine vehicles.Frictional drag on some hull types can account for asmuch as 90% of the total drag even when the hull isfree of fouling (Kempf 1937). For this reason, under-standing and predicting frictional drag has been anactive area of research for many years. Several studieshave investigated the effect of surface roughness on thefrictional drag of unfouled AF coatings, including thework of Musker (1980–1981), Townsin et al. (1981),Granville (1987), Medhurst (1989), and Grigson(1992). This research focused mainly on characterizingthe change in roughness and drag of self-polishingcopolymer (SPC) TBT systems and no effort to addressthe effect of fouling was made. This was due to the factthat the TBT systems provided long-term fouling con-trol with minimal fouling settlement.
A large body of research has also been devoted tothe effects of hull fouling on drag and powering.Townsin (2003) reviewed much of the research in this
*Corresponding author. Email: [email protected] online 13 December 2010
Biofouling
Vol. 27, No. 1, January 2011, 87–98
ISSN 0892-7014 print/ISSN 1029-2454 online
This work was authored as part of the Contributor’s official duties as an Employee of the United States Government and is therefore a work of the United States
Government. In accordance with 17 U.S.C. 105, no copyright protection is available for such works under U.S. Law.
DOI: 10.1080/08927014.2010.542809
http://www.informaworld.com
Downloaded By: [United States Naval Academy] At: 19:22 9 May 2011
area and pointed out possible avenues for betterunderstanding and prediction of the ship hull foulingpenalty. Townsin (2003) asserted that the penalty dueto calcareous macrofouling (eg barnacles and oysters)is much better understood than for soft fouling (egbacterial and diatomaceous slime and algae). Forexample, Kempf (1937) conducted a particularlythorough investigation of the frictional drag increaseresulting from barnacle fouling. Through this research,he was able to develop simple predictions of thefrictional drag penalty based on barnacle height andcoverage. According to Kempf’s work, a maximumdrag penalty occurred when the barnacle coverage was75%. However, when the coverage was reduced to 5%,the drag penalty was only reduced by one third fromthe maximum penalty. Schultz (2004) noted that theheight of the largest barnacles has the dominantinfluence on drag. And, in accordance with the findingsof Kempf (1937), Schultz (2004) observed that theeffect of increased coverage of barnacles on frictionaldrag was largest for low values of coverage andsmallest for high values of coverage.
Research into the effect of low-form plant foulingand biofilms, often referred to as slime, dates back toMcEntee (1915). Further work to better quantify theeffect that slime films have on drag was carried out byBenson et al. (1938), Denny (1951), Watanabe et al.(1969), Picologlou et al. (1980), and Andrewartha et al.(2010). Full-scale ship trials were also carried out tomeasure the effect of biofilm fouling on the drag ofcopper-based coatings by Hundley and Tate (1980),Lewthwaite et al. (1985), and Haslbeck and Bohlander(1992). Schultz and Swain (1999, 2000) and Schultz(2000) made velocity measurements via laser Dopplervelocimetry to study the turbulent boundary layersdeveloping over biofilms and filamentous algae,respectively. Schultz (2004) compared the frictionaldrag of fouling-release coatings with biocide-based AFcoatings in the unfouled, fouled, and cleaned condi-tions. The results of this study, as well as the results ofprevious research, indicate that even low-form algalfouling leads to a significant increase in frictional drag,although the magnitude of the increase dependsstrongly on the fouling type and coverage.
An entire chapter in the book ‘Marine Fouling andits Prevention’ (Woods Hole Oceanographic Institu-tion [WHOI] 1952) is devoted to a review of the effectof fouling on ship resistance. Based on the dataavailable at the time, the British Navy made anallowance of a 0.25% per day increase in frictionaldrag for ships operating in temperate waters and0.50% per day for ships operating in tropical waters(WHOI 1952). This led to a prediction of a 35–50%increase in fuel consumption for a naval ship afteroperating for 6 months in temperate waters (WHOI
1952). While it should be noted that AF painttechnologies have advanced considerably since 1952,naval vessels still pose a unique challenge to paintformulators because of their tendency to remainpierside for long periods of time compared to com-mercial ships. For example, Schultz (2004) predicted africtional drag penalty, similar to that predicted by theBritish Navy allowance, for modern copper-based AFpaints exposed in the static condition. This was based onthe results of towing tank tests of coatings staticallyexposed in temperate waters for 287 days (Schultz 2004).A more recent investigation by Swain et al. (2007),utilizing field measurements of frictional drag, noted thatthere is a significant difference in the performance ofboth AF and fouling-release coatings when they areexposed dynamically vs statically. In particular, thefouling release surfaces showed much lower frictionaldrag under dynamic exposure than when exposedstatically, and, in some cases, these surfaces had lowerfrictional drag than copper-based AF coatings.
It should be noted, as has been shown by Svensonand Medhurst (1984) and Townsin et al. (1985), thatthe effects of propeller roughness on ship powering canalso be very significant. However, the influence ofpropeller fouling on powering is not as well establishedas for generic roughness. For this reason, the effect ofpropeller fouling is not considered in the present work.However, it is clear that this is an area worthy of futurestudy. For example, the study by Atlar (2003) indicatesthat coating the propeller may lead to significantperformance increases as a result of a reduction infouling and roughness.
The economics of hull roughness have also been thefocus of previous research. For example, Townsin et al.(1981) conducted an economic analysis of ship bottommaintenance based on an extensive study of 47 in-service ships. This research focused on the effect ofpaint roughness changes rather than fouling because ofthe efficacy of the TBT SPC paints in controlling thefouling on the hulls that were investigated. Abbottet al. (2000) carried out a cost-benefit analysis withregards to TBT AF paints. They pointed out that anyserious environmental study of these paints must takeinto account the increase in fossil fuel consumption,greenhouse gas emissions, and disposal costs andimpacts when considering a shift from TBT tocopper-based coatings (Abbott et al. 2000).
Despite the large volume of research into the dragpenalties resulting from fouling, there are few, if any,rigorous studies of the resulting economic conse-quences of this added drag, particularly in the post-TBT era. Alberte et al. (1992) stated, for example, thatincreased drag resulting from hull fouling cost the USNavy $75–100 million in fuel penalties. However, nosubstantiation of this figure was offered. In the present
88 M.P. Schultz et al.
Downloaded By: [United States Naval Academy] At: 19:22 9 May 2011
paper an economic analysis of the hull fouling penaltyfor a naval ship is presented. The analysis focuses onthe US Navy’s conventionally-powered, mid-sizedsurface combatant; the Arleigh Burke-class destroyer(DDG-51), the largest class of conventionally-poweredships in the fleet. This study is unique not only in thefact that it is guided by actual hull fouling conditionsgleaned from a vast database of ship hull inspections,but also because it utilizes data collected for shipoperational tempo and in-water hull cleaning. Shipresistance and powering penalties are calculated basedon the similarity-law scaling procedure presented inSchultz (2007), which is linked with the Navy’s foulingrating (FR) system (Naval Ships’ Technical Manual2006). The resulting penalties are then used to assessthe overall economic impact of hull fouling using theaforementioned ship operational and cleaning data.Finally, the economic model is employed to examinehow changes in hull maintenance strategies affectoperating costs.
Materials and methods
The present economic analysis focuses on costsassociated with ship performance that are affected byfouling. The total cost for ship operations arises fromvarious types of component costs, associated withmanning, supply, and maintenance and modernization(Figure 1; Guimond et al. 2006). Only a subset of thesecosts is affected by the condition (in terms of fouling)of the hull and corresponding fuel usage. Costsassociated with or resulting from hull fouling includeexpenditures for fuel, hull coatings, hull coatingapplication and removal, and hull cleaning (Figure 2).These components are in turn affected by additionalvariables, including the region in which the ship isoperating, the age or condition of the hull coating, and
labor and production rates. Only costs and modifyingfactors associated with hull condition and fuel use aremodeled in the present analysis.
Selection of ship class for analysis
Since the US Navy fleet is comprised of a range ofvessels of various sizes, with different poweringsystems, operational profiles, and regions of opera-tions, it is difficult to model the economics of particularhull coatings or maintenance strategies across theentire fleet. For example, the performance of nuclear-powered aircraft carriers (CVN) is not relevant tounderstanding the impact of alternative protectionstrategies or technologies on fuel usage. Furthercomplicating this effort is the fact that the intensityof fouling varies spatially on a global scale (for an earlyreview, see WHOI 1952). So models based on a singleoperational region, or on ship class(es) that are notbroadly distributed across operational regions, mayfail to account for the naturally occurring variance infouling. In order to simplify the modeling task, a singleship class was identified whose distribution acrossoperational areas matched that of the fleet as a whole(thus taking into account global variation in theintensity of fouling), and that made up a significantportion of the fleet in terms of hull count and wettedsurface area. Data were obtained from US Navy factsheets (downloaded from www.navy.mil on 24 March2009) and from the Uniform National DischargeStandards program Nature of Discharge report onhull coating leachate (Uniform National DischargeStandards 1999). Based on these data, the ArleighBurke-class destroyers (DDG-51) appeared to berepresentative of the wider fleet. For example, theirdistribution across operational areas closely mirrors
Figure 1. Categories of operating and support costs for aUS Navy ship (modified from Guimond et al. 2006).
Figure 2. Components of operating and support costs thatare directly related to condition of the hull.
Biofouling 89
Downloaded By: [United States Naval Academy] At: 19:22 9 May 2011
that of the fleet as a whole. Also, the DDG-51 classrepresents a significant portion of the fleet in terms ofboth number of hulls and total wetted hull area.Excluding submarines, the DDG-51 class currentlymakes up 30% of the fleet by count and 22% by wettedhull area, and this makes it the largest surface shipclass in terms of both number of hulls and total wettedhull area. Based on its aforementioned distributionacross home ports in differing geographical regionsand abundance in terms of both number of hulls andwetted hull area, the present modeling effort focusedon the DDG-51 class as representative of the wider USNavy fleet. Further discussion of fleet distribution andhull demographic data is available in Bendick et al.(2010).
Fouling of underwater hulls
Significant costs to ship operations are associated withthe occurrence of fouling on the underwater hull, as aresult of increases in hull roughness, drag, andcorresponding fuel use. Clearly, any model of thepotential costs and benefits of particular foulingcontrol strategies must account for the occurrenceand dynamics of hull fouling. The Naval Ships’Technical Manual (NSTM) (2006) provides instruc-tions for the regular conduct of underwater hullinspections for fouling and coating damage. Diversnote the Fouling Rating (FR, Table 1) and coverage offouling on multiple sections of the hull, propellers,struts and rudders, and seachests. The results of theseinspections are recorded in a database. In order todevelop model parameters for the fouling level on theships’ hulls, this database was examined in detail. Inthe present work, the occurrence of fouling onDDG-51 class hulls was investigated by means of 320individual inspection reports spanning a 3-year periodfrom 1 January 2004 to 31 December 2006.
Initial analyses of these data (not shown) indicatedthat the distribution of FR values, and level of
coverage, was skewed with most ships being relativelylightly fouled. Median tests suggested fouling intensityvaried across home ports; however, the temporalcomponents of variation associated with, for example,paint age or time since last hull cleaning, were small.Given that important temporal variation in foulingwas absent, and that DDG-51 class vessels were dis-tributed broadly across geographical regions (thusspanning geographical variation in fouling intensity), itwas decided to represent hull fouling in the model as asingle value characteristic of the hull class as a whole.
Detailed analyses of the inspection reports (Bend-ick et al. 2010) suggest that the majority of DDG-51hulls support some macrofouling capable of generatingsignificant roughness and thus increasing drag and fueluse. Maximum values of the fouling rating rangedfrom 10 to 100 with distributions (by section of thehull) typically featuring a broad peak from FR-30 toFR-70. The most frequent value of the second highestfouling rating was FR-30 in all cases. The spatialextent of the maximum fouling rating was low (usually10% or less of the hull) and did not differ greatlyamong sections of the hull. The relationship betweendrag and the spatial distribution of roughness elementsfor these low coverage levels is highly nonlinear andextremely complex (Kempf 1937; Schultz, personalobservation). Consequently, the fouling condition ofthe typical DDG-51 hull was characterized as FR-30,with an upper bound of FR-60.
Waterborne underwater hull cleaning
Waterborne underwater hull cleaning allows for theremoval of fouling accumulations on hulls andpropellers without drydocking. Appropriate use ofthese cleanings increases the availability of the ship tothe fleet and extends the life of the hull coating systemwhile minimizing maintenance costs associated withdrydocking. Waterborne hull cleaning also recoversperformance or operating efficiency (in terms of fuelexpenditures) lost due to fouling accumulation, to acondition similar to that of a clean hull.
Since the effects of fouling on performance varyamong ship classes, and the intensity of fouling differswith type of hull coating, operational profile and areaof operations of the vessel, the Navy does not specifyintervals for the conduct of hull cleanings (NavalShips’ Technical Manual 2006). Instead, the decisionon whether to clean is based on the results of regularinspections. A full hull cleaning is called for whenfouling occurs at a rating of FR-40 4 20% of the hull(for ablative AF paints) or FR-50 4 10% of the hull(for fouling-release coatings) (Naval Ships’ TechnicalManual 2006). Performance criteria can also be used toindicate the need for a hull cleaning, including a 1 knot
Table 1. A range of representative coating and foulingconditions as given by Schultz (2007). The NSTM rating is afouling index used by the US Navy based on Naval Ships’Technical Manual Chapter 081 (NSTM 2006).
Description of condition NSTM (FR ratinga)
Hydraulically smooth surface 0Typical as applied AF coating 0Deteriorated coating or light slime 10–20Heavy slime 30Small calcareous fouling or weed 40–60Medium calcareous fouling 70–80Heavy calcareous fouling 90–100
aNSTM (2006).
90 M.P. Schultz et al.
Downloaded By: [United States Naval Academy] At: 19:22 9 May 2011
reduction in speed at constant shaft revolutions, anincrease in fuel use of 5% to maintain a specified rateof revolution of the shaft, and an increase in shaftrevolution rate of 5% to maintain a particular speed(Naval Ships’ Technical Manual 2006).
Several types of waterborne cleaning are availableto restore performance (Naval Ships’ Technical Man-ual 2006). In a Full Cleaning, fouling is removed fromthe entire underwater hull, propellers, shafts, strutsand rudders, and all openings. Interim Cleaning refersto removal of fouling from propellers, shafts, strutsand rudders. Partial Cleaning covers removal offouling from particular sections of the ship hull, andcan be performed in combination with an InterimCleaning.
In order to estimate costs associated with water-borne hull cleaning, the frequency of full, partial, andinterim cleanings carried out on the Arleigh Burke-class destroyers was quantified over a 3-year periodfrom 1 January 2004 to 31 December 2006. Data wereobtained from the database of ships’ hull inspections.Due to their very low frequency, partial cleanings werepooled with full hull cleanings before analysis. Overthe reporting period, 46 DDG-51 class vessels under-went 28 full/partial hull cleanings and 282 interimcleanings. The average frequency of full hull cleaningsover the study period was 0.21 year71, whilethe average frequency of interim cleanings was2.4 year71.
Costs for full/partial and interim hull cleaningsvary across ports. Costs used in the model wereunweighted averages across the ports based on aNAVSEA contract awarded in 2001 to SeawardMarine Services, Inc. for providing waterborne hullcleaning services. The model estimated current costs bycorrecting the 2001 contract cost for 8 years ofinflation at a rate of 3%. The estimated 2009 cost fora full hull cleaning was $26,808, and for an interimcleaning $18,735. Due to variation in actual annualprices, the actual costs in 2009 and moving into thefuture may be slightly different. For example, underthe current (2010) contract, costs range from $26,200to $34,200 for a full cleaning and $15,000 to $21,500for an interim cleaning. It should be noted that asignificant portion of these costs is associated withefforts to inspect and document condition of the hull,hull openings, appendages, and running gear.
Prediction of the hydrodynamic impact of hull fouling
In order to predict the impact of hull fouling on thetotal resistance and powering of the DDG-51, theprocedure detailed in Schultz (2007) was employed. Inthe present work, towing tank test results for a 1:36scale model of a mid-sized naval surface combatant
taken at the US Naval Academy HydromechanicsLaboratory were used to obtain the baseline resistanceand powering requirements for the hydrodynamicallysmooth condition (White, unpublished). The modeltested was similar to the DDG-51, the dimensions ofwhich are shown in Table 2.
Estimates of the change in total resistance (DRTs)for an Arleigh Burke class destroyer (DDG-51) asresult of hull condition at speeds of 7.7 m s71 and15.4 m s71 (15 knots and 30 knots) are shown in Tables3 and 4, respectively. The resulting change in requiredshaft power (DSP) as result of hull condition at speeds
Table 2. Dimensions of the Arleigh Burke-class destroyer(DDG-51).
Waterline length, Ls 142.0 mBeam, Bs 18.0 mDraft, Ts 6.4 mWetted hull area, Ss 3001 m2
Displacement, Ds 8768 metric tons
Table 4. Predictions of the change in total resistance (DRTs)and required shaft power (DSP) for an Arleigh Burke-classdestroyer (DDG-51) with a range of coating and foulingconditions at a speed of 15.4 m s71 (30 knots).
Description of conditionDRTs
(kN) DRTs
DSP(kW) DSP
Hydraulically smooth surface – – – –Typical as applied AF coating 66 3% 1533 3%Deteriorated coating or lightslime
182 7% 4300 7%
Heavy slime 303 12% 7202 12%Small calcareous fouling orweed
Table 3. Predictions of the change in total resistance (DRTs)and required shaft power (DSP) for an Arleigh Burke-classdestroyer (DDG-51) with a range of coating and foulingconditions at a speed of 7.7 m s71 (15 knots).
Description of conditionDRTs
(kN) DRTs
DSP(kW) DSP
Hydraulically smooth surface – – – –Typical as applied AF coating 5.2 1% 61 1%Deteriorated coating or lightslime
34 9% 405 9%
Heavy slime 64 17% 766 18%Small calcareous fouling orweed
Downloaded By: [United States Naval Academy] At: 19:22 9 May 2011
of 7.7 m s71 and 15.4 m s71 (15 knots and 30 knots)are also shown in Tables 3 and 4, respectively.
Calculation of fuel consumption and fuel costs
In order to relate the required shaft power predictionsto ship fuel consumption, further discussion of theArleigh Burke-class destroyer (DDG-51) and itsoperation is required. The DDG-51 is a twin-screwship powered by four General Electric LM2500 gas-turbine engines. Together these engines produce inexcess of 80,000 kW in shaft power. When the ship isunderway, there are three common plant operationmodes (Brown et al. 2007). The first is the trail-shaftmode in which only one of the gas turbines isoperational. In this mode, a single engine powers asingle shaft while the other shaft remains idle. This isthe most fuel efficient operation mode at cruisingspeed. The second mode of operation is termed thesplit-plant mode. In this mode, two engines are onlinewith each powering a separate shaft. The last opera-tional mode is the full-power mode. In this case, allfour engines are used with two powering each shaft.This mode is used for high speed operations. For theanalysis presented here, it was assumed that the shipoperated in trail-shaft mode while cruising at7.7 m s71 (15 knots) and in full-power mode whilesteaming at 15.4 m s71 (30 knots). In the full-powermode, it was also assumed that the power supplied bythe four engines was equal.
The relationship between the output shaft power ofthe engine and its fuel consumption can be obtainedfrom the engine’s specific fuel consumption (SFC)curve. Figure 3, adapted from Guimond et al. (2006),gives the SFC curve for the General Electric LM2500
gas-turbine engines. By entering Figure 3 with therequired shaft power for an engine, the specific fuelconsumption (SFC) can be obtained. The SFC is massof fuel consumed per kW-h. This along with shipoperational data can then be used to calculate the massof fuel consumed.
In order to translate results into annual rates of fuelconsumption and fuel costs, data on steaming time,proportion of steaming time spent in various poweringmodes, and fuel costs (per barrel) are required.Analysis of the Navy VAMOSC (Visibility andManagement of Operating and Support Costs) data-base of steaming hours showed that the averagesteaming time for an Arleigh Burke class-destroyer(DDG-51) was 2835 h per year. Guimond et al. (2006)reported a typical operational tempo for DDG-51 classvessels as *90% of steaming time at cruising speed(15 knots or 7.7 m s71) and approximately 10% ofsteaming time at high speed (30 knots or 15.4 m s71).For the purposes of the economic model, the directcost of fuel (distillate fuel marine – DFM) wasassumed to be $104.16 per barrel based on guidancefrom the Naval Sea Systems Command (NAVSEA)released in December 2008. The indirect cost, orburden, for DFM was taken to be $59.93 per barrel,based on similar NAVSEA guidance. Note that thedirect cost of fuel can vary greatly over time. Forexample, the NAVSEA guidance for July 2008 was$170.52 per barrel and for February 2009 was $69.30per barrel. Significant changes in fuel prices outside ofthose due to inflation will affect the performance of themodel.
Hull coatings
The underwater hulls of Arleigh Burke class destroyersare painted according to specifications described inNaval Ships’ Technical Manual Chapter 631. Ship hullanticorrosive and AF paints are qualified underperformance specification MIL-PRF-24647D. TheType II, Class 1, Grade A, Application 3 designationof the performance specification corresponds to twocoats (125 mm dry film thickness each) of anticorrosivepaint and three coats (125 mm dry film thickness each)of copper ablative AF paint. Shipyard experience withthese paints indicates that, depending on the type ofpaint, approximately 760-910 l is required for a singlecoat for DDG-51 class vessels. Assuming the wettedarea of the DDG-51 class hull is 2951 m2 (UniformNational Discharge Standards program Nature ofDischarge report on hull coating leachate; UniformNational Discharge Standards 1999), this resulted inmodel entries for paint usage rate of 0.28 l m72 foreach coat of anticorrosive paint, and 0.31 l m72 foreach coat of AF paint. Characteristic roughness for
Figure 3. Specific fuel consumption (SFC) curve for theGeneral Electric LM2500 gas-turbine engine adapted fromGuimond et al. (2006).
92 M.P. Schultz et al.
Downloaded By: [United States Naval Academy] At: 19:22 9 May 2011
this coating system as typically applied is Rt50¼150 mm (Schultz 2004). Rt50 is the average hullroughness based on hull surveys using the BMT HullRoughness Analyzer (Medhurst 1990). Repainting wasassumed to occur every 7.5 years. Painting costsincluded only the price of the paint required and laborfor surface preparation and application. Although thecomplete hull coating system is applied in drydock, themodel assumed that other maintenance in addition to(re)painting was carried out during the drydockinterval, and that all drydocking costs were absorbedby these other maintenance activities.
Other variables
The economic model projected costs over 15 years.This time period was selected so that the costsassociated with repainting (assumed to occur every7.5 years) could be factored into the analysis while notprojecting unduly far into the future in which costsbecome more uncertain. Calculations assumed anannual inflation rate of 3%. Costs associated withenvironmental compliance and regulatory issues, mis-sion readiness, acoustic signature, mechanical wear,and other technical risks were not incorporated intothe economic model. The economic model allowedprojection of costs over the whole DDG-51 class(currently 56 ships). All costs are in the fiscal year 2009US dollars.
Results
Economic impact of hull roughness and fouling
Hull roughness due either to the presence of a coatingor to hull fouling incurs an operational cost to thevessel due to increases in shaft power to reach a givenspeed and associated increases in fuel consumption.The cumulative costs per ship over 15 years for fourhull roughness conditions were calculated (Table 5).These include an ideal hydraulically-smooth paint(Case 1), a newly applied Navy-qualified ablative AFcoating with no fouling (Case 2), a typical hullroughness given the Navy’s present practices includingqualified ablative AF coatings and regular interim and
full hull cleanings (Case 3), and a scenario featuring anupper bound for hull fouling (Case 4). See the section‘Fouling of underwater hulls’ above for details of howthe ‘typical’ and ‘upper bound’ fouling scenarios weredetermined.
The hydraulically-smooth hull scenario (Case 1,Table 5) served as the baseline for all other cases andthe scenarios described in the Results section. In thisscenario, the baseline cost for propulsive fuel isapproximately $11.1M per ship per year, but there isno additional fuel cost resulting from hull paintroughness or fouling. The cumulative costs over 15years (Figure 4), over and above the baseline cost, areentirely due to surface preparation and painting andamount to approximately $0.45M per ship. TheNavy’s qualified ablative AF hull coatings generateadditional hull roughness (Rt50¼ 150 mm) even whenunfouled (Case 2, Table 5). In this case, the 15 yearcumulative cost (over the baseline cost) is approxi-mately $3.33M per ship (Figure 4). Despite the vesselremaining free of fouling, the typical paint roughnessof as-applied AF coatings leads to an increase in fuelconsumption of 1.4% per year, or about $0.15M pership per year.
Cases 3 and 4 (Table 5) demonstrate the enormouseffect of fouling on fuel consumption and subsequentoperating costs. The 15 year cumulative cost (overbaseline) for operations under current Navy hullmaintenance practices is approximately $22.7M pership (Figure 4). The largest source of this cost isincreased fuel consumption due to hull fouling (seebelow for analysis of painting and hull cleaning costs).The NSTM fouling rating for this case, FR-30, isindicative of heavy slime and no hard fouling. Basedon the present analysis, this level of fouling generatesan increase of 10.3% in fuel consumption relative tothe hydraulically-smooth condition of Case 1. Thisincrease equates to a present-day cost of approxi-mately $1.2M per ship per year. For the worst-casescenario (Case 4), representing a ship operating with amixed community of relatively small hard foulingorganisms (FR-60), the cumulative cost over 15 yearsfrom coating roughness and fouling is approximately$43.8M per ship (Figure 4). As with the previous case,this cost is overwhelmingly due to increased fuel
Table 5. Four hull roughness and fouling scenarios for the Arleigh Burke class-destroyer (DDG-51).
Scenario Coating descriptionFoulinglevel
Interim cleaningfrequency (year71)
Full cleaningfrequency (year71)
Case 1 Hypothetical hydraulically-smooth ablative copper AF FR-0 0 0Case 2 Ablative copper AF, as typically applied (Rt50¼150 mm) FR-0 0 0Case 3 Ablative copper AF, as typically applied (Rt50¼150 mm) FR-30 2.4 0.21Case 4 Ablative copper AF, as typically applied (Rt50¼150 mm) FR-60 2.4 0.21
Biofouling 93
Downloaded By: [United States Naval Academy] At: 19:22 9 May 2011
consumption resulting from hull fouling. Hull foulingof FR-60 causes an increase of 20.4% in fuel con-sumption compared to the hydraulically-smoothcondition. This equates to a present-day cost ofapproximately $2.3M per ship per year.
Economic impact of changes in maintenance practices
The previous section focused on costs associated withcoating roughness and varying levels of fouling on theunderwater hull. While accumulation of fouling (andcorresponding increases in hull roughness, drag, andfuel use) can be mitigated through proper maintenance(for example, application of AF or fouling-release hullcoatings, hull cleaning), maintenance practices havetheir own associated costs. The sensitivity of theeconomic model to changes in two maintenancevariables was examined. These variables are the priceof the fouling-control coating and the frequency ofwaterborne underwater hull cleanings.
The present economic analysis models hull coatingsas a two layer system; one layer of anticorrosivecoating and one layer of a fouling-control topcoat.Both layers can consist of several coats, the number ofwhich is allowed to vary in the model. The effect ofprice of the fouling-control coating on operating andsupport costs was examined by projecting cumulativecosts over 15 years, for topcoats costing approximately2, 4, and 8 times that of the current US Navy AF paint.No other variables were altered; the complete protec-tive system consisted of the same number of coats, thecost of the anticorrosive coating was held constant, thealternative topcoats had the same inherent roughness
as the current paints and had no differential effect onaccumulation of fouling. Under these conditions,change in the cost of the fouling-control coating hadonly a small effect on cumulative operational costs(Figure 5). For example, increasing the topcoat priceby a factor of approximately 8.5 increased thecumulative operational costs over 15 years by only3.9%. If more expensive coatings result in a significantlong-term reduction in hull fouling, then substantialcost savings may be realized despite increased coatingcost.
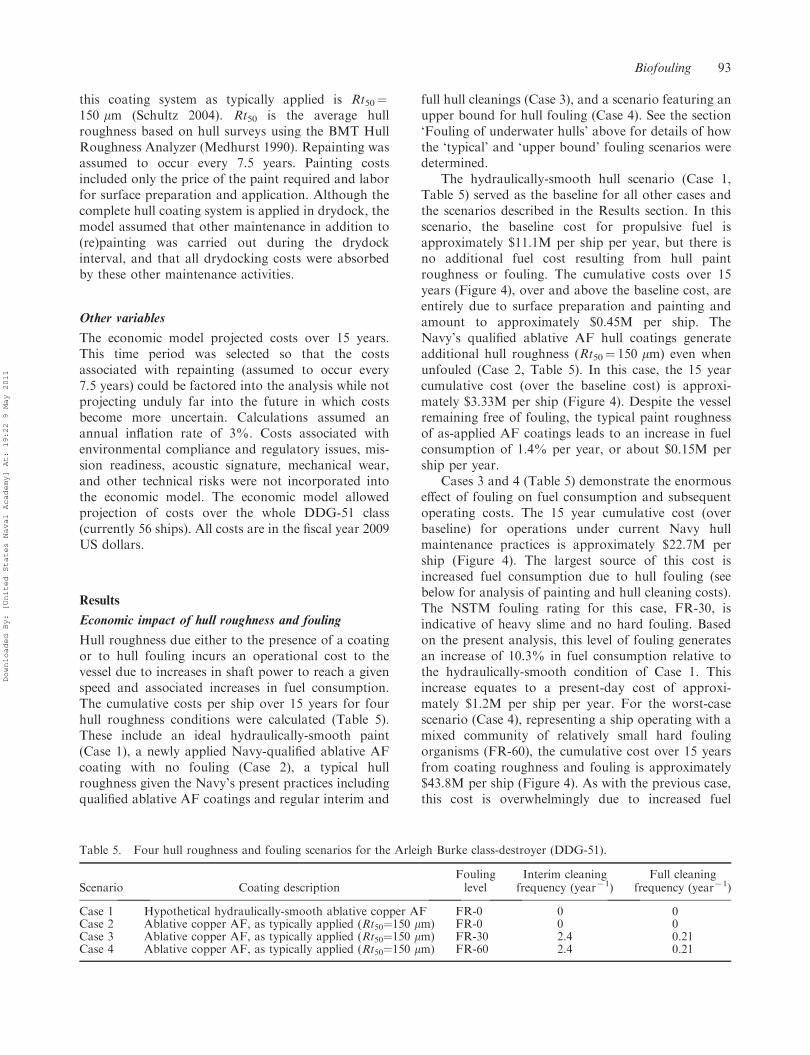
The economic analysis also includes costs andfrequencies for two types of waterborne underwaterhull cleanings, full and interim, with average frequen-cies of 0.21 year71 and 2.4 year71, respectively. Thesensitivity of operating and support costs to variationin the frequency of full hull cleanings was explored.This was carried out both with the frequency of interimcleanings held constant, and with the frequency ofinterim cleanings adjusted on a 1:1 basis to account forchanges in frequency of the full hull cleanings.Cumulative costs were again projected over 15 years,while multiplying the frequency of full hull cleaningsby approximately 0.5, 1 (ie actual values), 2 and 4. Noother variables, including fouling rating of the hull,were altered. As with paint cost, change in thefrequency of underwater hull cleanings, with no changein the accumulation of fouling, had little effect oncumulative operational costs (Figure 6). Cutting thefrequency of full hull cleanings in half resulted in a0.24% savings when the frequency of interim cleanings
Figure 4. Cumulative costs (per ship) over 15 yearsresulting from coating roughness and fouling. See Table 5for descriptions of the cases.
Figure 5. Effect of paint price on cumulative operatingcosts over 15 years. Variation in paint price is expressed as amultiple of the standard price of the fouling-control topcoat[Paint price(O)]. Change in cumulative operating costs isexpressed as a percentage of the cumulative costs assumingthe standard topcoat price.
94 M.P. Schultz et al.
Downloaded By: [United States Naval Academy] At: 19:22 9 May 2011
was unchanged and a 0.07% savings when frequencyof interim cleanings was adjusted to account for thedecrease in frequency of full hull cleanings. A four-foldincrease in frequency of full hull cleanings resulted in a1.4% increase in cumulative costs when interimcleaning frequency was held constant, and a 0.4%increase when frequency of interim cleanings wasdecreased on a 1:1 basis with increase in full hullcleanings (Figure 6). Given that full hull cleaningsresult in vessels initially operating with less fouled (andthus smoother) hulls, it seems likely that changes in thefrequency of hull cleaning may yield significantincreases in operational cost if cleaning frequencydecreases, or decreases in operational cost if cleaningfrequency increases. However, increases in cleaningfrequency must be balanced against the effects of thecleaning tools on coating physical condition andservice life.
Economic impact of a novel maintenance approach(proactive hull cleaning)
Waterborne hull cleaning is typically a response toincreased hull fouling with hulls being cleaned oncethey reach a condition where efficient ship operation iscompromised. Tribou and Swain (2010) proposed aproactive approach to waterborne hull cleaning where-in the hull is cleaned at high frequency (for example,once every few days) using less aggressive tools thanthose usually employed, with the goal of maintaining
the hull at a very low fouling rating. Results of initialtrials suggested that light cleaning of the Navy’squalified ablative AF coatings every 3 to 24 daysallowed only a light biofilm (FR-10 to FR-20) to formon the painted surface (Tribou and Swain 2010). Themethod of proactive cleaning or ‘grooming’ of the hullby small autonomous underwater vehicles (‘HullBUG’, hull bio-inspired underwater grooming vehicle,under development by SeaRobotics Corporation, PalmBeach Gardens, Florida, USA) may generate costsavings if ships can be maintained at lower than typicalfouling ratings without greatly increasing cleaningexpenses or decreasing the coating lifespan.
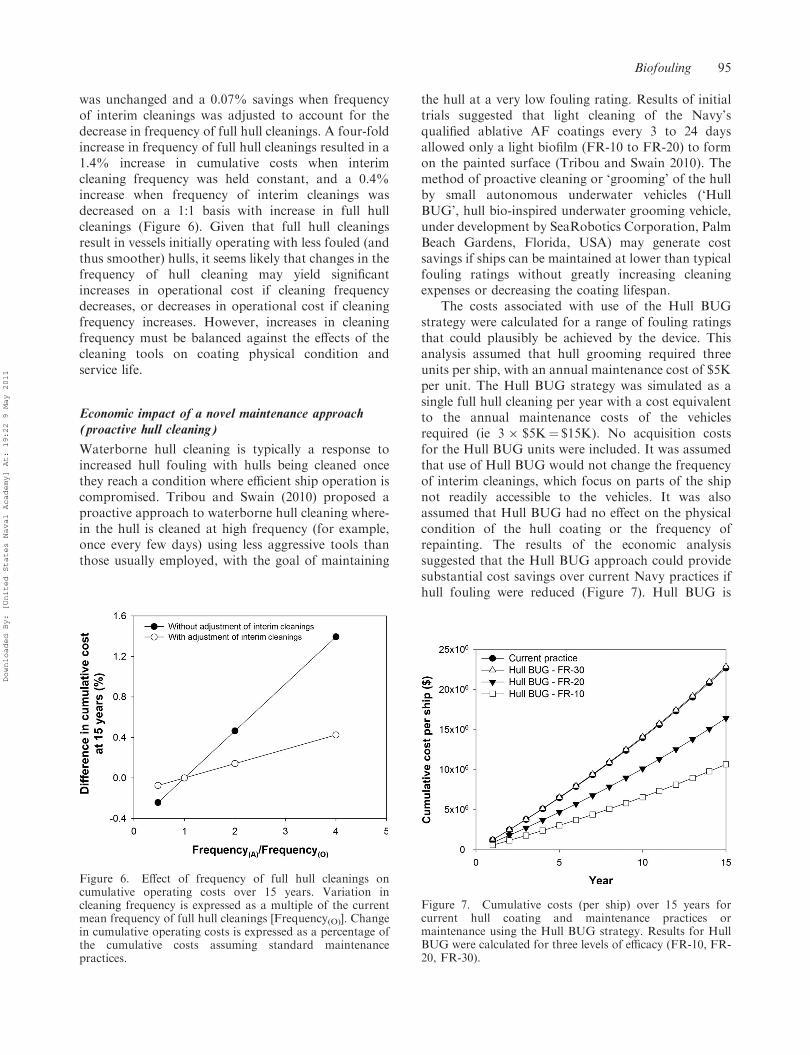
The costs associated with use of the Hull BUGstrategy were calculated for a range of fouling ratingsthat could plausibly be achieved by the device. Thisanalysis assumed that hull grooming required threeunits per ship, with an annual maintenance cost of $5Kper unit. The Hull BUG strategy was simulated as asingle full hull cleaning per year with a cost equivalentto the annual maintenance costs of the vehiclesrequired (ie 36 $5K¼ $15K). No acquisition costsfor the Hull BUG units were included. It was assumedthat use of Hull BUG would not change the frequencyof interim cleanings, which focus on parts of the shipnot readily accessible to the vehicles. It was alsoassumed that Hull BUG had no effect on the physicalcondition of the hull coating or the frequency ofrepainting. The results of the economic analysissuggested that the Hull BUG approach could providesubstantial cost savings over current Navy practices ifhull fouling were reduced (Figure 7). Hull BUG is
Figure 6. Effect of frequency of full hull cleanings oncumulative operating costs over 15 years. Variation incleaning frequency is expressed as a multiple of the currentmean frequency of full hull cleanings [Frequency(O)]. Changein cumulative operating costs is expressed as a percentage ofthe cumulative costs assuming standard maintenancepractices.
Figure 7. Cumulative costs (per ship) over 15 years forcurrent hull coating and maintenance practices ormaintenance using the Hull BUG strategy. Results for HullBUG were calculated for three levels of efficacy (FR-10, FR-20, FR-30).
Biofouling 95
Downloaded By: [United States Naval Academy] At: 19:22 9 May 2011
expected to maintain hulls at lower fouling ratings(FR-10 to FR-20) than appear achievable using thecombination of ablative AF coatings and reactive hullcleaning (which maintains DDG hulls at FR-30).Savings ranged from approximately $6.2M per shipover 15 years if Hull BUG achieved FR-20, to $12Mper ship over 15 years for FR-10 (Figure 7). If,however, use of the Hull BUG strategy resulted in nochange in average fouling ratings (FR-30), cumulativecosts (per ship) were comparable to those for currentpractices (*$174K more expensive over 15 years,Figure 7). This is because the annual maintenance costfor three Hull BUG vehicles is greater than thefractional cost of a full hull cleaning.
Discussion
The analyses presented above indicate that the primarycost associated with hull fouling is due to increased fuelconsumption attributable to increased frictional drag.The cost of propulsive fuel for the baseline, hydrau-lically-smooth DDG-51 class hull is $11.1M per shipper year. Increasing fouling to FR-30, a level typical ofthe DDG-51 class as a whole, increases fuel consump-tion by 10.3% and fuel costs by approximately $1.15Mper ship per year. Costs associated with hull foulingincrease in a nearly linear fashion for fouling ratingsless than or equal to FR-70 (Figure 8). The effect ofincreasing fouling to the next highest FR (for example,from FR-20 to FR-30), with no corresponding changein expenses due to paint, hull cleaning, or othermanagement practices, amounts to approximately$300K–$400K per ship per year. In contrast, increas-ing the cost of the AF paint by a factor of 8.5, without
realizing any improvement in hull condition from FR-30, only increases annual costs by roughly $47K pership when painting costs are spread evenly across the7.5 year repaint interval. Increasing the frequency ofhull cleanings has an even smaller effect on cost(Figure 6). The present economic analysis predicts acost associated with hull fouling for the Navy’s presenthull husbandry practices (Case 3, Table 5) ofapproximately $56M per year or $1.0B over 15 yearsfor the entire DDG-51 class. If the entire DDG-51class were to operate at the upper bound for foulingidentified previously (Case 4, Table 5), these costs jumpto $119M per year or $2.2B over 15 years.
The economic model and resulting cost estimatescan also be used to project costs due to hull fouling forthe fleet as a whole. Due to the fact that the US Navyfleet is composed of a diverse array of vesselsrepresenting a range of hull types, powering character-istics (conventional and nuclear), and operationaltempos, all fleet-wide projections reported below areladen with a number of important assumptions theeffect of which is not clearly understood. In particular,fleet-wide cost estimates from the economic analysisassume that operational patterns or tempos, and therelationship between operational tempo and powerdemand, is the same across all ship classes. Thisassumption fails for the Navy’s nuclear aircraftcarriers, at a minimum. A second important assump-tion relates to the contribution of fouling to total drag.Hull fouling primarily influences frictional drag, acomponent of the total drag. The proportion of totaldrag due to frictional drag will vary with ship class orhull form, but is assumed to be constant in the fleet-wide economic analysis. The fleet-wide economicanalysis does, however, accurately account for differ-ences among vessel classes in costs due to painting andcleaning. In addition, very crude estimates of cost canbe derived by simply scaling the costs for the DDG-51class to the fleet as a whole, on the basis of eithernumber of ships, where the Arleigh Burke-classrepresents 30% of the fleet (see above), or wettedhull area, where the class represents 22% of the fleet(see above). A range of annual costs due to hull foulingfor the entire US Navy surface fleet was calculatedusing these three methods. If the entire fleet operatedwith hulls in a condition typically seen for currentNavy husbandry practices (Case 3, Table 5), the fleet-wide annual cost due to hull fouling would probablyfall within the range of $180M–$260M. If the typicalcondition of all hulls is the upper band for foulingidentified previously (Case 4, Table 5), the projectedcosts increase to between $400M–$540M annually.However, because of the aforementioned assumptions,the fleet-wide fouling penalty costs given here shouldbe used with considerable caution. Similarly, it seems
Figure 8. The annual costs (per ship) for a range of hullfouling levels (FR). The cleaning and coating costs areassumed to be the same as present practice (Case 3).
96 M.P. Schultz et al.
Downloaded By: [United States Naval Academy] At: 19:22 9 May 2011
likely that the US Navy’s ship hull fouling penaltywould be dwarfed by that of the total world fleet, giventhat the US Naval fleet represents less than one-half of1% of the world fleet in terms of number of ships(ie ships 4400 metric tons), although some types ofcommercial vessels appear to operate with less foulingon their hulls than would be expected for a naval vessel(eg Davidson et al. 2009).
The present results imply that even modestimprovements in the fouling condition of a hull,when considered across just the DDG-51 class, couldsave enough money to cover the costs of develop-ment, acquisition, and implementation of evenrelatively expensive technical or management solu-tions. As demonstrated above, a decrease in foulingfrom FR-30 to FR-20 results in an annual costsavings to the Navy of *$340K per DDG-51, orapproximately $19M over the entire DDG-51 class.Therefore, a $19M investment in research, develop-ment, and acquisition for a technology (eg novel hulltreatment, cleaning device, or combination ofapproaches) or management practice (eg change infrequency or timing of hull cleanings) that reducedthe typical fouling throughout the DDG-51 classfrom FR-30 to FR-20 would be paid back in 1 year.Costs savings if the technology or practice wereimplemented throughout the entire fleet wouldpresumably offset even larger expenditures. Theeconomic analysis presented here can thus be usedto provide a guide to the amount of money that canreasonably be spent to combat hull fouling, and canaid in identifying areas of research in fouling controlthat would result in the greatest benefit, in terms ofcost savings, to fuel use during ship operations.
Acknowledgements
The authors gratefully acknowledge the financialsupport of this research by the Office of NavalResearch (ONR). Particularly, they thank Dr StephenMcElvany, ONR 332, for his vision, support, andguidance throughout the various phases of the project.Completion of this work required the participation of alarge number of collaborators. The authors recognizethese collaborators for their assistance in the develop-ment of initial approaches to the analysis and sub-sequently for the information and data necessary topopulate the models and generate the outputs detailedin this paper. Contributors include representatives ofthe Naval Sea Systems Command (NAVSEA) and theNaval Surface Warfare Center (NSWC) Carderockand Philadelphia divisions including codes 20, 61, and90 and their contractors. Mr Thomas McCue, NAV-SEA 00C5, and Seaward Marine Services providedaccess to, and validated, databases of Navy
underwater hull fouling and cleaning information.The authors thank Mrs Elizabeth Haslbeck(NSWCCD Code 613) for her insights into hull foulingand collection and evaluation of information from theNavy Energy Utilization Reporting System (NEURS)database at the Naval Sea Logistics Center (NAV-SEALOGCEN). Mr Kevin Burns (SAIC) carried outstatistical analysis of historical hull biofouling and hullcleaning data. Finally, the authors acknowledge theefforts of many others who, though not specificallymentioned, provided valuable advice or information inareas including ship powering, operations and main-tenance, that was essential to clarifying or guiding theeconomic analyses reported herein. To all, the authorsare grateful.
References
Abbott A, Abel PD, Arnold DW, Milne A. 2000. Cost-benefit analysis of the use of TBT: the case for a treat-ment approach. Sci Tot Environ 5–19.
Alberte RS, Snyder S, Zahuranec BJ, Whetston M. 1992.Biofouling research needs for the United States Navy:program history and goals. Biofouling 6:91–95.
Aldred N, Li G, Gao Y, Clare AS, Jiang S. 2010. Modulationof barnacle (Balanus amphitrite Darwin) cyprid settle-ment by sulfobetaine and carboxybetaine methacrylatepolymer coatings. Biofouling 26:673–683.
Andrewartha J, Perkins K, Sargison J, Osborn J, Walker G,Henderson A, Hallegraeff G. 2010. Drag force andsurface roughness measurements on freshwater biofouledsurfaces. Biofouling 26:487–496.
Atlar M. 2003. More than anti fouling. Mar Eng Rev.March:31–33.
Beigbeder A, Degee P, Conlan SL, Mutton RJ, Clare AS,Pettitt ME, Callow ME, Callow JA, Dubois P. 2008.Preparation and characterisation of silicone-based coat-ings filled with carbon nanotubes and natural sepioliteand their application as marine fouling-release coatings.Biofouling 24:291–302.
Bendick JA, Schultz MP, Holm ER, Hertel WM. 2010.Economic analysis of underwater hull coatingsand maintenance. NSWCCD-63-TR-2010/17. Bethesda(MD): Naval Surface Warfare Center Carderock Divi-sion. p. 49.
Benson JM, Ebert JW, Beery TD. 1938. Investigation in theNACA tank of the effect of immersion in salt water onthe resistance of plates coated with different shipbottompaints. NACA Memorandum Report C&R C-S19-1(3).Washington (DC): National Advisory Committee onAeronautics.
Brown GG, Kline JE, Rosenthal RE, Washburn AR. 2007.Steaming on convex hulls. Interfaces 37:342–352.
Champ MA. 2003. Economic and environmental impactson port and harbors from the convention to banharmful marine anti-fouling systems. Mar Pollut Bull46:935–940.
Davidson IC, Brown CW, Sytsma MD, Ruiz GM. 2009. Therole of containerships as transfer mechanisms of marinebiofouling species. Biofouling 25:645–655.
Denny ME. 1951. B.S.R.A. resistance experiments on theLucy Ashton: part I – full-scale measurements. TransINA 93:40–57.
Biofouling 97
Downloaded By: [United States Naval Academy] At: 19:22 9 May 2011
Finnie AA, Williams DN. 2010. Paint and coatingstechnology for the control of marine fouling. In: DurrS, Thomason JC, editors. Biofouling. Oxford, UK:Wiley-Blackwell. p. 185–206.
Genzer J, Efimenko K. 2006. Recent developments insuperhydrophobic surfaces and their relevance to marinefouling: a review. Biofouling 22:339–360.
Granville PS. 1987. Three indirect methods for the dragcharacterization of arbitrarily rough surfaces on flatplates. J Ship Res 31:70–77.
Grigson CWB. 1992. Drag losses of new ships caused by hullfinish. J Ship Res 36:182–196.
Guimond D, Marra J, Pavkov M, Wallace J. 2006. Fuelconservation concepts to achieve life cycle cost reduc-tions for surface ships. Publication NSWCCD-INCEN-TR-2006/01. West Bethesda (MD): Naval Sea SystemsCommand. p. 74.
Haslbeck EG, Bohlander G. 1992. Microbial biofilm effectson drag – lab and field. Proceedings SNAME ShipProduction Symposium. Paper No. 3A-1. p. 7. JerseyCity (NJ): Society of Naval Architects and MarineEngineers.
Hundley LL, Tate CW. 1980. Hull-fouling studies and shippowering trial results on seven FF 1052 class ships.Report # DTNSRDC-80/027. West Bethesda (MD): DWTaylor Naval Ship Research and Development Center.
Ista LK, Mendez S, Lopez GP. 2010. Attachment anddetachment of bacteria on surfaces with tunable andswitchable wettability. Biofouling 26:111–118.
Kempf G. 1937. On the effect of roughness on the resistanceof ships. Trans INA 79:109–119.
Leer-Andersen M, Larsson L. 2003. An experimental/numerical approach for evaluating skin friction on full-scale ships with surface roughness. J Mar Sci Technol8:26–36.
Lewthwaite JC, Molland AF, Thomas KW. 1985. An inves-tigation into the variation of ship skin frictionalresistance with fouling. Trans RINA 127:269–284.
Long CJ, Schumacher JF, Robinson PAC, Finlay JA, CallowME, Callow JA, Brennan AB. 2010. A model thatpredicts the attachment behavior of Ulva linza zoosporeson surface topography. Biofouling 26:411–419.
Magin CM, Long CJ, Cooper SP, Ista LK, Lopez GP,Brennan AB. 2010. Engineered antifouling microtopo-graphies: the role of Reynolds number in a model thatpredicts attachment of zoospores of Ulva and cells ofCobetia marina. Biofouling 26:719–727.
McEntee W. 1915. Variation of frictional resistance of shipswith condition of wetted surface. Trans SNAME 24:37–42.
Medhurst JS. 1989. The systematic measurement andcorrelation of the frictional resistance and topographyof ship hull coatings, with particular reference to ablativeantifoulings [PhD thesis]. UK: University of Newcastle-upon-Tyne.
Medhurst JS. 1990. Outline of a draft international standardfor the measurement and characterisation of roughnesstopography in fluid flow. London: Royal Institute ofNaval Architects. March 1990. p. 9.
Musker AJ. 1980–1981. Universal roughness functions fornaturally-occurring surfaces. Trans Can Soc Mech Eng1:1–6.
Naval Ships’ Technical Manual. 2006. Chapter 081 – water-borne underwater hull cleaning of Navy ships. Publica-tion # S9086-CQ-STM-010/CH-081 Revision 5.Washington (DC): Naval Sea Systems Command.
Picologlou BF, Zelver N, Characklis WG. 1980. Biofilmgrowth and hydraulic performance. ASCE J HydraulicsDiv 106:733–746.
Schultz MP. 2000. Turbulent boundary layers on surfacescovered with filamentous algae. ASME J Fluids Eng122:357–363.
Schultz MP. 2004. Frictional resistance of antifouling coatingsystems. ASME J Fluids Eng 126:1039–1047.
Schultz MP. 2007. Effects of coating roughness andbiofouling on ship resistance and powering. Biofouling23:331–341.
Schultz MP, Swain GW. 1999. The effect of biofilms onturbulent boundary layers. ASME J Fluids Eng 121:733–746.
Schultz MP, Swain GW. 2000. The influence of biofilms onskin friction drag. Biofouling 15:129–139.
Swain G. 1998. Biofouling control: a critical component ofdrag reduction. Proceedings of the International Sympo-sium on Seawater Drag Reduction. Newport (RI). p.155–161.
Swain GW, Schultz MP. 1996. The testing and evalua-tion of non-toxic antifouling coatings. Biofouling 10:187–197.
Swain GW, Kovach B, Touzot A, Casse F, Kavanagh CJ.2007. Measuring the performance of today’s antifoulingcoatings. J Ship Prod 23:164–170.
Svenson TE, Medhurst JS. 1984. A simplified method for theassessment of propeller roughness penalties. Mar Tech-nol 21:41–48.
Thomas KV, Brooks S. 2010. The environmental fate andeffects of antifouling paint biocides. Biofouling 26:73–88.
Townsin RL. 2003. The ship hull fouling penalty. Biofouling19(Suppl):9–16.
Townsin RL, Byrne D, Svensen TE, Milne A. 1981.Estimating the technical and economic penalties of hulland propeller roughness. Trans SNAME 89:295–318.
Townsin RL, Spencer DS, Mosaad M, Patience G. 1985.Rough propeller penalties. Trans SNAME 93:165–187.
Tribou M, Swain G. 2010. The use of proactive in-watergrooming to improve the performance of ship hullantifouling coatings. Biofouling 26:47–56.
Uniform National Discharge Standards. 1999. Nature ofdischarge report: hull coating leachate; [cited 2009 Mar25]. Available from: http://unds.bah.com/Nod/Hullcoat.pdf.
Watanabe S, Nagamatsu N, Yokoo K, Kawakami Y. 1969.The augmentation in frictional resistance due to slime.J Kansai Soc Naval Architects 131:45–51.
Woods Hole Oceanographic Institution [WHOI]. 1952.Marine fouling and its prevention. Annapolis, MD:United States Naval Institute.
98 M.P. Schultz et al.
Downloaded By: [United States Naval Academy] At: 19:22 9 May 2011