Institute of Transportation Studies ◦ University of California, Davis 1605 Tilia Street ◦ Davis, California 95616 PHONE (530) 752-6548 ◦ FAX (530) 752-6572 www.its.ucdavis.edu Research Report – UCD-ITS-RR-18-01 Biofuel Tracker: Capacity for Low Carbon Fuel Policies – Assessment through 2018 January 2018 Julie Witcover Robert B. Williams
Transcript
Institute of Transportation Studies ◦ University of California, Davis
1605 Tilia Street ◦ Davis, California 95616
PHONE (530) 752-6548 ◦ FAX (530) 752-6572
www.its.ucdavis.edu
Research Report – UCD-ITS-RR-18-01
Biofuel Tracker: Capacity for Low Carbon Fuel Policies –
Assessment through 2018
January 2018
Julie Witcover Robert B. Williams
Biofuel Tracker: Capacity for Low Carbon Fuel Policies – Assessment through 2018 Julie Witcover and Rob Williams* Research Report – Institute of Transportation Studies (ITS-Davis) UC Davis
January 2018
* Authors are Assistant Project Scientist and Development Engineer, respectively. Correspondence [email protected].
i
Acknowledgments The authors are grateful to the research team led by (then graduate student) Jeff Kessler, who conducted the initial survey and follow-up contacts and phone calls, to E2 (Environmental Entrepreneurs) and especially Mary Solecki for generous sharing of resources on company status and contacts built through several iterations of its Advanced Biofuel Market reports, as well as CleanTech for providing its impressive private investment database for our use. We are indebted to colleagues in and outside UC Davis who reviewed tracking results and major findings. This project received funding support from the David and Lucile Packard Foundation, Energy Foundation, National Resources Defense Council, and National Biodiesel Board. The content remains the authors’ responsibility alone.
ii
Executive Summary Background This Biofuel Tracker: Capacity for Low Carbon Fuel Policies – Assessment through 2018 report follows the discontinued annual Advanced Biofuel Market Report produced by E2. This new report updates information on transportation biofuel production capacity since E2’s final publication in 2015. Like its predecessors, the criteria for this report are biofuels assessed by the California Air Resources Board with a carbon intensity rating at least 50% below that of petroleum-based reference fuels, and producers in the United States and Canada. Virgin oil biodiesel falls within the study criteria and is included in the report due to a carbon intensity rating revision due to changed modeling; it was out of scope in the earlier modeling and excluded from the E2 reports. The focus is liquid biofuels, including dimethyl ether (DME), a liquid at moderate pressure, and excludes biogas. The report provides information on market plans for near-term production capacity through 2018. It is neither a prediction nor a forecast of either capacity or actual production levels. Rather, it is one indication of potential North American production of fuel volume that meets the California carbon intensity rating cut-off in the next couple of years, given favorable market conditions and the current policy environment. For commercially emerging technologies and fuels, production capacity ranges are assessed based on company and media reports, and are filtered through a subjective evaluation of the likelihood of announced capacity coming online in the 2018 timeframe. The low end of the production capacity range reflects capacity in which we have higher confidence: existing capacity plus companies that have shown signs of plans to move forward on the ground. The high end of the production capacity range includes capacity from companies that is assessed as less likely: from companies that still face some significant hurdle (e.g., financing) to meet targets or have not pinned down target dates due to unfavorable market conditions. Well-established technologies and fuels like biodiesel are treated separately. In the case of biodiesel, production is determined by policy more than it is constrained by capacity. Therefore, the focus of this report is on describing the policies and other industry trends. The report includes information on private and public financing levels for biofuels, drawing, like the E2 series, on Clean Tech Group’s industry financial data plus government data, through 2015. There are some important caveats to the scope of this report. First, carbon intensity ratings are used with caution. They provide some indicator of a fuel’s eligibility in low carbon regulatory policies, but carbon impact is not precisely measured and cannot be (as it depends on factors outside the policy). Furthermore, carbon impact and carbon ratings differ from one program to another and remains highly uncertain for many feedstock/fuel combinations. Second, although biofuel innovation and commercialization is occurring beyond North America in ways that are relevant to the policies, this report focuses on North America for practical reasons and to
iii
enhance comparison with the earlier reports. Third, any threshold on carbon intensity reductions may rule out technologies and fuels that can make significant contributions to carbon reductions, especially if applied to large volumes of fuel.
Highlights Key Tracking Results
• For commercially emerging fuels o 2016 capacity is assessed at about 366 million gasoline gallon equivalents
(MMgge) per year. o The range for 2018 is assessed at about 500 – 1,000 MMgge (the actual tracked
range is 481 – 972 MMgge). o Most of the growth, and the 2018 gap between low-end capacity and high-end
capacity, is due to recently announced expansion of drop-in hydrocarbon fuel capacity.
o Tracked volumes are within a range of assessments in other recent studies. • For the better established fuel, biodiesel
o U.S. capacity exceeds by a considerable margin the 2-billion gallon U.S. fuel biodiesel/renewable diesel RFS mandate for 2017; in 2016, domestic production surpassed 1.5 billion gallons of biodiesel a year for the first time.
o Imports can play (and have played) a key role in filling RFS mandates. • Financing to companies in the industry
o Totaled about $1 billion in 2015 from public and private sources, compared to $1.3 billion in 2014 (public and private).
o Private financing dominated, and declined by about a quarter over the period (~$930 million to $775 million).
o Public monies decreased from ~$313 million in 2014 to $234 million in 2015. The ratio of grants to loan guarantees switched: in 2014, grants constituted about two-thirds of public funds, while in 2015 loan guarantees amounted to two-thirds of public funding.
• Compared to findings in the E2 report based on a 2014 assessment, this report found less planned near-term growth in capacity for cellulosic ethanol and more for drop-in hydrocarbon fuels. Capacity plans for 2017 totaled 400 – 600 MMgge in our results, slightly lower than E2 results of 485 – 650 MMgge for the same year.2
2 The starting point for the research was the E2 company list; the UC Davis team independently researched the volumes and timing, and the tracking resulted in some companies being added and others being dropped.
iv
• Overall, the tracking exercise suggests o Of in-scope fuels, biodiesel will continue to be the high-volume fuel through
2018. U.S. biodiesel production is dominated by soy; the share from corn oil has grown over time.
o Drop-in hydrocarbon fuel capacity looks to grow substantially if announced plans for renewable diesel facilities pan out. The fuel can also be processed for use as an aviation fuel, and a number of government and airline initiatives support such activity, albeit still on a small scale.
o For cellulosic ethanol, announced capacity expansion is less from new stand-alone facilities, and more from adoption of technology that “bolts on” to existing corn ethanol plants to produce corn fiber ethanol at smaller volumes per facility. The diffusion and penetration of this this technology is an important factor for future cellulosic ethanol capacity expansion.
Key Trends Other than more plans for corn fiber ethanol bolt-ons and renewable diesel, the tracking found the continuation of some patterns noted by E2 in its report and in similar tracking efforts. These include industry consolidation, use of existing capital stock (retrofits or add-ons, or repurposed or co-located facilities), and companies branching out or switching over to other bio-based products like biochemicals and nutraceuticals. The companies that fell out of scope had a mix of reasons: pushing production plans beyond the current time horizon for this study (2018), moving primary efforts overseas, or putting plans on hold due to market conditions. For the commercially emerging technologies and fuels, several respondents who altered plans cited an unfavorable financing environment. Among the reasons were lower oil prices, policy uncertainty, and the slow or difficult commissioning process for several pioneer facilities, especially for cellulosic ethanol. The U.S. government continues to support biofuels with an aim of cost-competitive low carbon fuels produced domestically at volume. Biorefinery support programs have broadened in line with marketplace shifts to include other bio-based products as potential bridges to biofuels. Policies like the Renewable Fuel Standard, California’s Low Carbon Fuel Standard, and other carbon intensity standards continue to provide financial incentives and market pull for biofuels that meet GHG reduction criteria. The value to fuels from program credit prices remains uncertain as it is affected by changing market and policy conditions, as well as legal and implementation issues. Some sources of policy uncertainty may become less salient as the programs are in place for longer. For example, in 2016 the RFS was on track to issue final mandates on a more regular timetable, California re-adopted an LCFS that resumed increased carbon reduction targets after a court-mandated freeze (three years at 1% carbon intensity reduction), Oregon began implementation of a similar Clean Fuels Program, and Canada announced a nationwide Clean Fuel Standard to cover transportation fuels and other sectors. However, in 2017 the approach to setting RFS mandates may shift under the new U.S.
v
administration, and California’s LCFS received another court ruling that freezes its diesel standard (at the current 2%) until an environmental impact analysis issue is remedied. The tracking uncovered a need for a more explicit definition of “effective capacity” at the facility level, to refer to technically feasible production levels that can be tapped in a very short time period if conditions were right. Effective capacity may differ from nameplate capacity under several circumstances, including: during commissioning, when a plant is idle or repurposed to focus on other products, or even through normal operations due to maintenance or profitable conditions. Plants sitting idle due to different reasons (unfavorable market situation, change in ownership, or bankruptcy) may have different “start-up” times to access the production implied by the facility capacity. Additional capital required for a plant start-up is important for attaining realistic, near-term per gallon cost assessments – a critical metric for both private investors and public entities seeking to structure policy incentives to support commercially viable biofuels. These concepts are not implemented in this report except to the extent that stated announcements incorporated information like expected ramp-up rates (as began to occur during the course of the tracking exercise). The topic is important to near-term tracking, and the effective capacity aspect emerged in recent EPA analysis for annual RFS mandates – assessing not only capacity but a range of potential production levels. Key Research Topics The following topics emerged as important for future research:
• The conditions under which market diversification into bioproducts other than biofuels should develop critical areas like biomass collection and supply and pretreatment, shared by biofuels, will hasten biofuel innovation
• The role in emissions reduction of smaller, less expensive innovations that result in more modest emissions improvements (for current and emerging technologies)
• The importance and design of adequate sustainability safeguards for market-based biofuel policies, especially as volumes of biofuels or other bio-based products scale in a way that increases competition for carbon-emitting resources (like land), amid uncertainty and disagreements over carbon accounting methods and results.
vi
Table of Contents Acknowledgments ............................................................................................................................ i Executive Summary ..........................................................................................................................ii List of Figures ................................................................................................................................. vii List of Tables .................................................................................................................................. vii Introduction .................................................................................................................................... 1
Scope and Methods .................................................................................................................... 1
Key Findings and Key Issues ........................................................................................................ 3
Layout of Report ......................................................................................................................... 5
Industry Overview ........................................................................................................................... 5 Biofuels through a Climate Policy Lens ....................................................................................... 5
Other Tracking Efforts ................................................................................................................. 5
Assessment through 2018 .......................................................................................................... 8
Active Facilities ...................................................................................................................... 10
Commercially Nascent Fuels and Technologies (facility-level research) .............................. 10
Biodiesel – a commercially established fuel/technology (industry-level research) ............. 19
US Biomass-based Diesel and the Role of Imports ............................................................... 22
Investment and Costs ................................................................................................................... 23 Capital Costs of Production Facilities ........................................................................................ 24
Fuel Production Cost Estimates ................................................................................................ 26
Policy ............................................................................................................................................. 27 Policies Using Carbon Intensity Ratings .................................................................................... 28
U.S. Renewable Fuel Standard (RFS) ..................................................................................... 29
List of Figures Figure 1. Facility Counts by type. “Other” refers to DME. ........................................................... 10 Figure 2. Reasons companies were “out-of-scope” ..................................................................... 11 Figure 3. Fuel production capacity tracking results, compared to E2 (2014) ............................... 12 Figure 4. Tracked fuel capacity results, compared to E2 (2014) report ....................................... 14 Figure 5. Near-term Installed Capacities – Report Comparison ................................................... 18 Figure 6. Near-term Number of Facilities– Report Comparison ................................................... 18 Figure 7. Annual biodiesel production, capacity (EPA registered and installed), and RFS2 volume mandates ...................................................................................................................................... 20 Figure 8. Feedstock contribution in U.S. biodiesel production, 2009, 2015, 2016. .................... 21 Figure 9. Biomass-based Diesel - Production and Imports (to California and rest of U.S.). ......... 22 Figure 10. Investment Trends and Investments by Type for Biofuel Production Facilities. ......... 24 Figure 11. Biorefinery capital costs; company data and literature values ................................... 25 Figure 12. Biorefinery capital costs and nameplate capacity ....................................................... 25 Figure 13. Biofuel production cost estimates from literature ...................................................... 27 Figure 14. RFS Volume Standards: implemented (columns) and statutory levels (lines) ............ 30 Figure 15. CA LCFS alternative fuel transport energy, 2011-2016 .............................................. 31 Figure 16. BC RLCFRR alternative fuel transport energy, 2010-2015 ........................................... 32 Figure 17. OR CFP alternative fuel transport energy, 2016 .......................................................... 32 Figure 18. Energy covered under existing and proposed lifecycle CI standards, recent years ... 33 Figure 19. CI standards in Pacific Coast Collaborative jurisdictions ............................................ 34 Figure 20. State Tax Incentives and Policies ................................................................................. 36
List of Tables Table 1. Report and Database Comparison, North American Commercially Emerging Biofuels ... 7 Table 2. In-Scope Biofuels – Technology Descriptions ................................................................... 9 Table 3. Key Industry Trends and Questions From Moves to ‘Out-of-Scope’ .............................. 16 Table 4. Installed Capacity Assessment Comparison for North America ..................................... 17 Table 5. CA LCFS and RFS Policy Incentives -- Examples ............................................................... 35
1
Introduction
Purpose This report highlights developments in the emerging biofuel industry to aid in the assessment of near-term biofuel availability. We view the industry and its development through the lens of climate policy: regulations that set targets for lower carbon-emitting transport fuels compared to currently dominant petroleum-based fuels. These include the U.S. Renewable Fuel Standard (RFS) and state-level policies such as California’s Low Carbon Fuel Standard (LCFS) and Oregon’s Clean Fuels Program (CFP). Such policies drive domestic demand for biofuels and other alternative fuels. This is follow-on work to the E2 Advanced Biofuel Market Report (discontinued in 2014), and adopts its method of surveys supplemented by secondary data. Efforts to track production activity in emerging biofuel markets have increased. They include reports from the National Renewable Energy Laboratory’s Survey of Non-Starch Ethanol and Renewable Hydrocarbon Biofuels Producers, Biofuels Digest’s Advanced Bioeconomy Deployment Report, a report by the International Renewable Energy Agency, and a Lux report on cellulosic ethanol production costs (Schwab et al. 2015, Schwab et al. 2016, Lane 2016, IRENA 2016, LUX 2016).3 Several organizations maintain online biofuel facility directories, including the International Energy Agency, market analysts Genscape, and various trade media and trade groups (IEA 2016, Genscape 2016, EtOH_Mag 2016, Biodiesel_Mag 2016, National_Biodiesel_Board 2015). This study summarizes the categories of information and methods in many of these sources, and brings together information from these and other sources to shed light on biofuel supply developments, financing, and key policy drivers in a publicly available resource. We highlight issues that biofuel tracking efforts must grapple with, that are key to interpreting findings, ours and others’.
Scope and Methods Like its E2 predecessor, this report covers activity by almost 200 liquid biofuel producers and tracks companies with: a) plans for production facilities in North America, and b) fuel pathways assessed at the time as achieving at least a 50% reduction in lifecycle fuel carbon intensity compared to conventional fuel (gasoline and diesel) by the California Air Resources Board (CARB) for its Low Carbon Fuel Standard (LCFS) program.4 It covers production activity for
3 The most recent report from NREL surveys 2016 but was not reviewed for this study (Warner et al. 2017). 4 CARB ratings provide a general indicator of fuels’ eligibility in low carbon fuel programs. They are not an absolute reflection of all low carbon policy approaches, as policies use different methods for rating fuel carbon intensities
2
biodiesel, cellulosic ethanol, drop-in biofuels or intermediates (e.g., renewable diesel and biocrude, respectively), and other emerging technologies (e.g., algae, dimethyl ester).5 We provide information relevant for assessing potential North American production volumes for fuels rated as low carbon in the near term, given favorable market conditions and current policy environment. This means a focus on production capacity for commercially emerging fuels and technologies. Surveys were used to gather information, and were supplemented using public information such as media reports, academic reports, and SEC filings. Because biodiesel, is well established in the marketplace and has large production capacity relative to current production, the report focuses on key policy drivers of production levels, from publicly available information, principally government sources. The report includes an update on financing using data from the Clean Tech Group and online government sources,6 public and private investment totals for in-scope companies, and catalogues the number of state tax incentives and policies. Regarding costs, the tracking activity gathered capital cost information for some facilities through the survey or public announcements, and this information is summarized. Fuel production cost estimates for six operational ethanol plants and from recent techno-economic literature are compared. Several caveats on the study are important to keep in mind. First, fuel pathways that achieve less than 50% emissions reductions, and/or that make extensive use of existing processes and capital stock, when employed at large volumes may play a substantial role in greenhouse gas (GHG) emission reductions; second, assessments of GHG impact from fuel pathways are very tied to particular production contexts and methods; the field is still evolving methodologically -- ratings may change or conditions needed to safeguard against unintended consequences of scaling up production may become better understood. Therefore, uncertainties involved in current assessments should be weighed in discussions about biofuel use and scale-up of production and feedstock use.7 Third, although in-jurisdiction production is often a stated policy goal, innovations in biofuel technology and production anywhere in the world can drive biofuel industry development, and help meet U.S. GHG transport policies. Regarding the study data, information on individual facilities is subject to considerable uncertainty for several
and get different results. Academic estimates on actual greenhouse gas impacts vary and have wide uncertainty ranges. 5 We do not use the term “advanced” to describe covered biofuels due to lack of agreement on what fuels would qualify. For example, the US EPA includes sugarcane ethanol and virgin oil as well as the fuels within our scope as “advanced” fuels for its Renewable Fuel Standard (RFS), fuels excluded from the E2 Advanced Biofuels Market 2014 report because they did not meet the carbon intensity criterion. The ARB carbon intensity modeling and associated ratings have since changed, and virgin oil biodiesel, which was not in E2’s scope, falls within ours. 6 Trade media recently highlighted errors at USASpending.gov, but pertaining to allocation of funds rather than total amounts (Lane 2016c). 7 In general, assessments of GHG intensity of transport fuels for policy purposes have been the subject of considerable academic debate and methods and results vary considerably (see e.g., (Plevin et al. 2014), (Hertwich 2014), (Brandão et al. 2014), (Dale and Kim 2014)). Because biofuel production uses land and only under certain circumstances results in new carbon sequestration, it has come under intense scrutiny.
3
reasons. First, it is primarily self-reported (either through the survey or as announced to the public and reported in the media), and that we could not always reach the company for direct confirmation. This is particularly pertinent as regards capital costs, which are necessarily estimates and projections for facilities that are not yet fully operational or operating. Second, the market situation is fluid and information about companies should be interpreted accordingly and not as static or given. This is especially true for fuels with emerging technologies or markets.
Key Findings and Key Issues The marketplace for emerging biofuels has continued to change since the 2014 E2 Advanced Biofuel Market Report. A number of previously tracked companies have moved out of low-carbon fuels and into other market-viable chemicals that share a similar production platform (e.g., cosmetics, nutraceuticals, or industrial grade products), been acquired, gone bankrupt, or put construction plans on hold. Other companies kept fuels in a multiproduct portfolio when they transitioned toward a focus on chemicals and/or food. Company assessments of North American biofuel production prospects in 2015 and 2016 were generally unfavorable for new dedicated stand-alone pioneering facilities. Several companies with Department of Energy loan guarantees mentioned trouble finding additional private investment to finish production facility construction. Other companies suspended North American plant construction or operations to wait for more favorable market conditions or began looking outside North America for suitable sites for biofuel production due to lower permitting, construction, and operational costs. Drop-in renewable diesel and jet fuel dominated additional planned capacity. Stand-alone cellulosic ethanol facilities have still not fully commissioned. Added cellulosic ethanol capacity was planned mostly for smaller volumes from corn kernel fiber using bolt-on technologies at corn ethanol plants. The U.S. Renewable Fuel Standard (RFS) continued to be a major driver for biodiesel. Higher blend mandates in two categories – the biomass-based diesels mandate, which sets levels for combined use of biodiesel and renewable diesel, and the advanced fuel mandate, for which biomass-based diesel fuels are eligible – contributed to increased domestic production and imports. Domestic biodiesel production grew by more than the increase in the biomass-based diesel mandate, and combined imports of biodiesel and renewable diesel continued notable year-on-year growth (61% in 2015, and 45% in 2016). Uncertainty over returns to North American biofuel investment is considerable due to several factors. The oil price decrease in 2014 and energy price volatility in general creates an unfavorable investment climate for new-technology biofuels. Technologies untested at scale are also still a concern, for cellulosic ethanol especially, where pioneering facilities have faced commissioning difficulties and delays. Finally, the policy support that emerging biofuels rely on to expand has also been uncertain. RFS mandates have been revised from legislated levels and are finalized annually, undermining firm expectations about future use needs. There is additional uncertainty about how the EPA will implement the rule: there was a significant delay
4
in finalizing RFS mandate levels for 2014 (not finalized until late 2015), and while mandate levels for 2017 were issued in late 2016, there is uncertainty about future implementation under the new U.S. administration. In addition, a biomass-based diesel blender’s credit expired at the end of 2015, and it is unclear whether it will be retroactively renewed as has happened in the past. Balancing uncertainties at the federal level are initiatives elsewhere that promote biofuels. They include California’s Low Carbon Fuel Standard and similar policies in Oregon and British Columbia; Canada has announced an intention to develop a national version there that includes transportation fuels but extends beyond it. The provinces of Ontario and Alberta both have renewable fuel blending regulations that include criteria on lifecycle GHG intensity reductions. The number of U.S. states with multiple biofuel policies is also on the rise. Public and private investment in biofuel production capacity continued a downward trend in this market environment. Uncertainty has led to more investments that leverage existing capital stock and multiple product markets to improve the business case. Corn fiber cellulosic capacity “bolted on” to corn ethanol plants is one example. Corn oil biodiesel facilities collocated with corn ethanol plants is another. Renewable jet fuel has seen more and different types of investment. Production and technology companies, airlines, and the government led by the military have all invested in various aspects critical to the business case: technology development and scaling, construction of pioneer plants with secured feedstock, and offtake guarantees. The interest in diversified fuel supply from the military and marketing to those concerned with climate change for airlines have spurred activity in this mode. The renewable aerojet industry has also actively engaged with environmentalists to assess and potentially improve sustainability of fuels, including feedstock sourcing. Small-scale efforts may provide a conducive environment for honing technologies and sustainability protocols that perhaps could provide lessons for other fuels or apply at larger scales. While most of the effort to reducing GHG emissions from aviation is focused on aircraft efficiency, renewable jet fuel currently holds a small role, is eligible to earn incentives under RFS mandates, and is currently being considered for inclusion in the CA-LCFS. The research identified several key issues facing biofuel tracking. First, “effective” production capacity, distinct from nameplate capacity, must be defined and tracked to understand actual costs for commercial roll-out of new technologies. Second, techniques must be developed to properly account for new technologies that build on existing capital stock (e.g., retrofits, bolt-ons, and co-locations). Third, it is becoming more important for those interested in commercialization of new biofuel technologies to track and characterize a broader bioindustry structure, paying attention to associated sectors (e.g., feedstock suppliers enzyme/chemical producers, technology suppliers) and companies undertaking multiple bioproduct portfolios with technologies relevant to biofuel production, whether or not the portfolios include transportation fuels. Finally, it is increasingly clear that the biofuel industry is global in nature,
5
and tracking overseas activity in biofuel technology and industry development is critical also to fulfillment of domestic GHG reduction policies.8
Layout of Report The Industry Overview presented next reports tracking results, summarizes other tracking efforts, and discussed key trends learned from the tracking exercise. Subsequent sections are on Investment and Costs, Policy, Future Directions, and Conclusions.
Industry Overview
Biofuels through a Climate Policy Lens This report tracks trends in North American production capacity for biofuels that meet regulatory requirements for low carbon fuel programs within the region. The U.S. Renewable Fuel Standard (RFS) and state-level policies such as California’s Low Carbon Fuel Standard (LCFS) and Oregon’s Clean Fuels Program (CFP) have set ambitious targets during the next decade to expand the use of fuels rated as low in carbon compared to currently dominant petroleum-based fuels, and have announced intentions to continue the commitment to low carbon fuels as part of broader climate policies. Canada recently announced an intention to implement a nationwide low carbon fuel standard to include transportation fuels, targeting a mid-2019 start. The policies have generated increased interest in the commercial development of new fuels rated low enough in carbon and available in sufficient quantity to satisfy the targets. Of particular interest are biofuels produced using novel processes that hold significant promise for meeting long-term GHG emission goals. While other fuels are eligible under the GHG programs, the study focuses on liquid biofuels for two reasons: 1) their importance to near-term policy compliance because of their relative compatibility with existing fuel delivery infrastructure and vehicle technologies compared to other alternative fuels; and 2) their perceived importance for long-run decarbonization of heavy-duty transportation modes.
Other Tracking Efforts This report is one of a growing number of sources providing information on biofuel market developments for technologies not yet widely commercially available. Recent tracking of emerging fuel installed capacity in U.S. or North America includes reports, trade literature, and 8 The tracking methods in this report do not incorporate these issues. Other tracking efforts have touched on some of them. For example, the E2 report listed companies in related sectors (feedstock producers, enzyme/chemical producers, related technology companies, and international companies). International activity is also tracked in databases from the IEA, a recent IRENA report (IRENA 2016), and NREL (2017).
6
biofuels databases that sometimes have a broader scope. The U.S. EPA also makes short-run projections for RFS mandate categories as part of its annual rulemaking process. Some results are behind a paywall (efforts by BNEF, Lux, Biofuels Digest). Others are in the public domain, notably NREL’s annual survey report of non-starch alcohol and renewable hydrocarbon biofuels, and online databases supported by IEA Task 39 and Genscape. We reviewed a number of these. Table 1 summarizes and compares information categories and features of the reviewed reports and databases.9 This UC Davis (UCD) project most closely resembles the NREL effort in terms of methods and coverage. They differ in terms of focus: ours is on fuel availability for policy and includes commercially established fuel (biodiesel), financing, and a summary of tracking issues. NREL’s stated focus is on conversion technologies (including feedstock) and commercial roll-out. NREL (2017) also includes information on international facilities and where multiproduct output markets are targeted. A comparison of tracking results for the emerging technology fuels is presented later in the report.
9 The list is not comprehensive.
7
Table 1. Report and Database Comparison, North American Commercially Emerging Biofuels
Source
Installed Commercial Scale Capacity
Differentiates by Scale (e.g.,
Commercial, pilot, demo)
Facility Status (Operational, Idle, Under Construction, Planning,
etc.)
Fuel Type Technologies Described? Method Feedstock Categories
UNCTAD (2016) Idle facilities not indicated Capacity listed for
EtOH only var
sources only lignocellulosic
Ethanol Producer Magazine
Existing, Proposed, Under
construction EtOH only - industry dbase
lignocellulosic (residues & energy crops), MSW
The documents may cover other fuels but not capacity data. Shaded rows indicate heavy reliance on announcements for projected capacity. *EPA “Current” is a 6 month to 1 year projection. For 2017 standards, the EPA also presents ranges for cellulosic fuel production. “survey+” indicates facility survey plus other sources. “Dbase” is an online database.
8
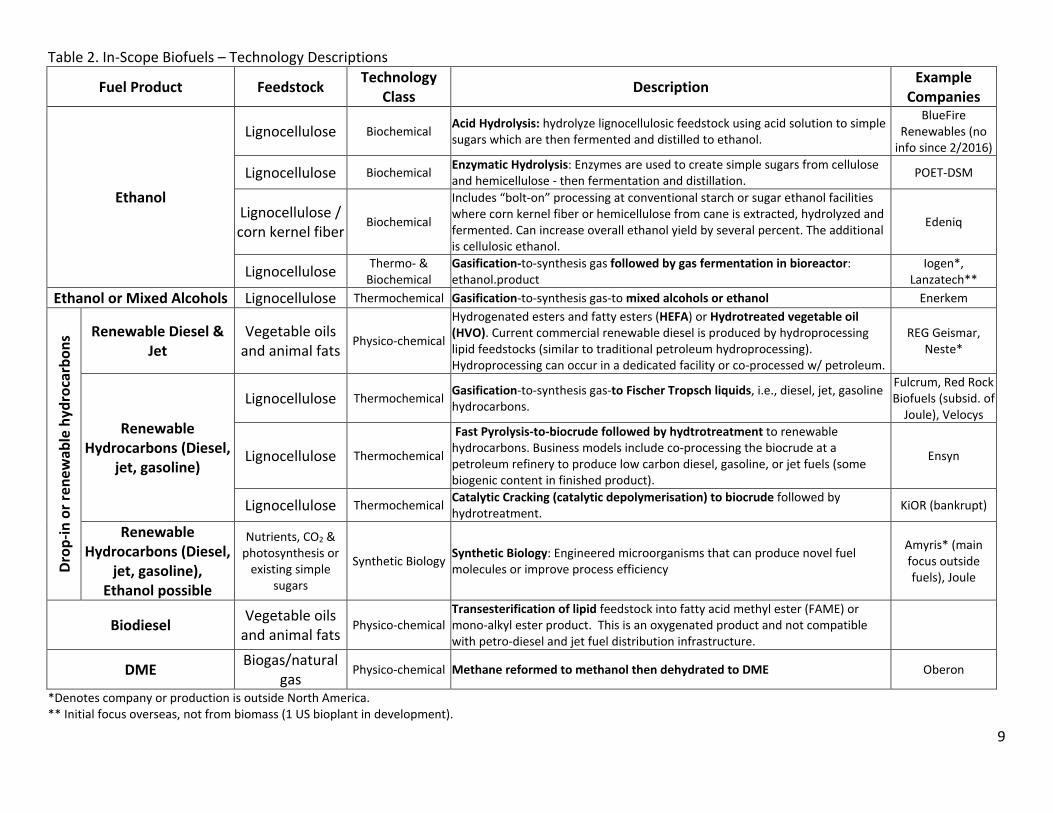
Assessment through 2018 The study built on the list of U.S. and Canadian companies profiled in the E2 Advanced Biofuel Market Report 2014 for in-scope fuel technology pathways (Table 2). We revised the tracking list on survey responses and information from news reports and company websites. We identified facilities associated with active companies, meaning those already able to produce fuels or with credible plans for capacity by 2018. For fuels that are not yet available at high commercial volumes, we examined developments in production capacity at facility level to provide an indicator of market response to existing policies and of near-term domestic production potential. HEFA renewable diesel is included while relatively technologically developed and in commercial production, as trends in its commercial expansion are of interest for policy. For each company previously profiled, we researched updates on assessed capacity using publicly available sources (principally company websites, trade media, and other tracking reports), then contacted the companies for updates and insights into the biofuel market to incorporate as possible. Like E2, we assessed company-projected capacity as “low-end” (likely) or “high-end” (optimistic). Low-end assessments were assigned to facilities with demonstrated progress towards completion, including some combination of financing, permitting, location, or other details. Where reported production capacity seemed ambitious given the current market and the timeframe for operation (e.g., lacked a site or financing), we classified capacity as high-end. When the company was credibly active and within our scope but we were unable to make direct contact, we classified capacity based on secondary information, and indicate “no-response.” Biodiesel capacity was not tracked through facility level surveys because the U.S. biodiesel industry is commercially well established. Moreover, biodiesel capacity does not currently constrain meeting the principal alternative fuel climate policies, and capacity well exceeds production. Rather, we drew on secondary data to overview key indicators of the sector such as trends in domestic biodiesel production, capacity, and imports, as well as relevant RFS mandates through 2018, which act as a primary driver for levels of U.S. biodiesel use.10 Carbon-lowering innovations at facility level would be worth tracking, but lay outside the scope for this report (see Future Directions, below). One reason we followed the methods and criteria in the E2 Advanced Biofuel Market Report 2014 closely was to enable more direct comparison of results, since time trends are important especially for the commercially emerging fuels. Results below include that direct comparison where possible.
10 Biodiesel data were from the U.S. Energy Information Administration (EIA), the U.S. Environmental Protection Agency (EPA), the Genscape Biofuels online database, and the National Biodiesel Board company list.
Lignocellulose Biochemical Acid Hydrolysis: hydrolyze lignocellulosic feedstock using acid solution to simple sugars which are then fermented and distilled to ethanol.
BlueFire Renewables (no
info since 2/2016)
Lignocellulose Biochemical Enzymatic Hydrolysis: Enzymes are used to create simple sugars from cellulose and hemicellulose - then fermentation and distillation. POET-DSM
Lignocellulose / corn kernel fiber
Biochemical
Includes “bolt-on” processing at conventional starch or sugar ethanol facilities where corn kernel fiber or hemicellulose from cane is extracted, hydrolyzed and fermented. Can increase overall ethanol yield by several percent. The additional is cellulosic ethanol.
Edeniq
Lignocellulose Thermo- & Biochemical
Gasification-to-synthesis gas followed by gas fermentation in bioreactor: ethanol.product
Iogen*, Lanzatech**
Ethanol or Mixed Alcohols Lignocellulose Thermochemical Gasification-to-synthesis gas-to mixed alcohols or ethanol Enerkem
Drop
-in o
r ren
ewab
le h
ydro
carb
ons
Renewable Diesel & Jet
Vegetable oils and animal fats
Physico-chemical
Hydrogenated esters and fatty esters (HEFA) or Hydrotreated vegetable oil (HVO). Current commercial renewable diesel is produced by hydroprocessing lipid feedstocks (similar to traditional petroleum hydroprocessing). Hydroprocessing can occur in a dedicated facility or co-processed w/ petroleum.
Fast Pyrolysis-to-biocrude followed by hydtrotreatment to renewable hydrocarbons. Business models include co-processing the biocrude at a petroleum refinery to produce low carbon diesel, gasoline, or jet fuels (some biogenic content in finished product).
Ensyn
Lignocellulose Thermochemical Catalytic Cracking (catalytic depolymerisation) to biocrude followed by hydrotreatment. KiOR (bankrupt)
Renewable Hydrocarbons (Diesel,
jet, gasoline), Ethanol possible
Nutrients, CO2 & photosynthesis or
existing simple sugars
Synthetic Biology Synthetic Biology: Engineered microorganisms that can produce novel fuel molecules or improve process efficiency
Amyris* (main focus outside fuels), Joule
Biodiesel Vegetable oils and animal fats
Physico-chemical Transesterification of lipid feedstock into fatty acid methyl ester (FAME) or mono-alkyl ester product. This is an oxygenated product and not compatible with petro-diesel and jet fuel distribution infrastructure.
DME Biogas/natural gas
Physico-chemical Methane reformed to methanol then dehydrated to DME Oberon
*Denotes company or production is outside North America. ** Initial focus overseas, not from biomass (1 US bioplant in development).
10
Active Facilities The research identified 231 active biofuel facilities within our scope identified: 180 biodiesel, and 51 for ethanol, drop-in, and DME combined. The numbers are similar to those in the E2 Advanced Biofuel Market Report 2014 (123 biodiesel, 57 other), except for biodiesel (Figure 1). E2 excluded 27 facilities dedicated solely to virgin oil biodiesel because they did not meet the 50% GHG emissions cut-off. UCD included this category of fuels because a modeling update in the California LCFS program shifted the rating to below the 50% cut-off.
Figure 1. Facility Counts by type. “Other” refers to DME. The discussion first covers individually tracked facilities, principally ethanol and drop-in fuels, then proceeds to biodiesel.
Commercially Nascent Fuels and Technologies (facility-level research) There were 98 emerging fuel (non-biodiesel) facilities on the initial tracking list. The list was comprehensive and included those that had fallen out of scope in the last assessment (E2 2014) to give a broader view of industry trends. The direct response rate to the email survey and follow-up emails and phone calls was 31%, similar to other efforts. For companies that did not respond directly, we relied on trade reports and other tracking efforts to compile available information. Forty-five companies (each associated with one facility) were determined to be out-of-scope, for various reasons (Figure 2). We return to a discussion of out-of-scope companies later in the section.
Results This section presents results for the 51 facilities tracked that use commercially emerging technologies or fuels.11 Facility production capacity was classed as “high end” (less certain) or “low end” (more likely)(darker color = low end in Figure 3). In the current uncertain investment climate and due to trends in companies suspending activity, UCD adopted a conservative classification. Capacity already in existence or near completion was classed as “low end”; most future projects were classified as “high end.” Figure 3 indicates results, differentiating between information confirmed through direct contact with companies (blue section of columns) and obtained from secondary sources (tan section of columns, and asterisked in legend). In-scope ethanol capacity was assessed as increasing from 47 MMg/y in 2016 to 113 – 183 MMg/y (low-to-high-end range) by 2018 (Figure 3).12 Drop-in fuel capacity was assessed as going from 294 MMg/y to between 354-745 MMg/y in the same period.
11 The company count was 45. Some companies owned multiple facilities, i.e., a demonstration and planned commercial plant(s) or additional plants gained through acquiring other companies. 12 Dates in the figure refer to the assessed year for this project (UCD) and from E2 (2014).
0
5
10
15
20
Post-2018 Acquired No infoavailable
Otherproduct
Democlosed
On holdindefinitely
# of
com
pani
es
12
*Data unconfirmed by company
Figure 3. Fuel production capacity tracking results, compared to E2 (2014) Compared to the E2 report, cellulosic ethanol capacity is assessed as expanding more slowly, while planned expansion of drop-in fuels capacity is greater. The cellulosic ethanol result reflects two trends: slow or stalled commissioning in larger facilities,13 and an uptick in near-term growth from plans to rollout relatively small volumes of cellulosic ethanol using corn fiber as a feedstock, and produced at existing corn ethanol plants.14 The technology “bolts on” to a corn ethanol plant and shares much of its infrastructure, thereby lowering cost and reducing the novel processes introduced. The extent to which bolt-on technologies can supply increased volumes of cellulosic fuels in the near term depends on several still-unsettled issues: length and timing installation and production ramp-up at individual facilities, average yields at scale, diffusion rates, and ultimate penetration bolt-on technologies at corn ethanol facilities. For mid-term availability, key issues include the potential for learning-by-doing to decrease costs and/or increase production. 13 Abengoa’s 25 MMg/y corn stover ethanol facility in Hugoton, KS was idled due to the company’s bankruptcy. The asset recently sold in late 2016 Synata Bio. INEOS Bio’s 8 MMg/y green waste ethanol facility in Vero Beach, FL is up for sale, following technical difficulties at the plant and the company turning away from the ethanol market. Dupont’s 30 MMg/y corn Iowa stover facility was slated to begin production in 2016, according to an August company letter to the EPA, and has had issues with feedstock fires. POET’s 25 MMg/y Iowa corn stover facility is in ramp-up phase, but reportedly not yet hitting a required pace of feedstock processing (Lane 2017). 14 There are several different facilities and licensed technologies involved. Quad County Corn Processors in Iowa has reportedly generated over 5 MMg of cellulosic ethanol since 2014 using its bolt-on Cellerate technology. EdeniQ bolt-on technology involves one step that improves corn starch extraction (Cellunator) and a second for the grinding and processing (Pathway). Corn ethanol producers using the EdeniQ process include: Pacific Ethanol (producing at its Stockton, CA facility starting in late 2015, and planning installation at a second plant in Madera, CA); Siouxland Energy started production in early 2017 at its Sioux City, IA facility; Flint Hills Resources has an RFS-eligible pathway at its Shell Rock, IA plant and has announced an intention to employ EdeniQ technology in other plants. ACE Ethanol in WI is installing a pilot of the D3MAX bolt-on technology in February 2017, with testing in March.
The increased activity for drop-in fuels vis-à-vis the E2 report resulted from plans for a combination of renewable diesel, jet fuel, and biocrudes. Current commercial renewable diesel, HEFA (hydrogenated esters and fatty acids) fuel, also called HVO (hydrotreated vegetable oil), is produced by hydroprocessing lipid feedstocks using a method similar to traditional petroleum hydroprocessing. Production can occur in dedicated facilities using various proprietary methods, or in a traditional refinery through co-processing with petroleum feedstock.15 There were also several projects to co-locate a renewable diesel facility beside a corn ethanol plant to use extracted corn oil as a feedstock, more commonly used to produce FAME biodiesel. The result would be ~3 MMg/yr of production, perhaps supplemented with local waste oils as feedstock. The technology provider and company behind one of the projects went bankrupt; a second project was far enough along on construction to expect to begin commissioning within a few months as of fall 2016. Renewable diesel can be produced using other technologies as well. Commercial development is proceeding for thermochemical processes that produce renewable diesel or renewable gasoline make use of lignocellulosic feedstocks. Pyrolysis produces a crude oil-like intermediate sometimes called “bio-oil” that can then be refined to a hydrocarbon fuel.16 Feedstock gasification followed by Fischer Tropsch reaction produces a hydrocarbon fuel sometimes called biomass to liquid, or BTL. Companies using these technologies – Ensyn and Fulcrum for pyrolysis and gasification, respectively – have active production plans targeting transportation fuel markets.17 A refinery in Martinez (formerly Tesoro, now Andeavor) is considering co-processing “bio-crude” (pyrolysis liquid) and petroleum into a diesel product for the California LCFS market (Lane 2016b). Conversion technologies used to produce renewable diesel, can, with additional adaptations, produce jet fuel. Altair Fuels has adapted an idle petroleum refinery in Paramount, CA to a 40 million gallon capacity HEFA renewable fuels plant optimized for jet fuel production. Feedstocks are inedible vegetable oils and waste fats and oils (Sherbacow 2015). Fulcrum is also primarily targeting jet fuel as a product. Behind the activity in renewable jet fuel has been partnerships involving technology providers, U.S. government entities, and airlines for financing, technology
15 The U.S. currently has six dedicated renewable diesel facilities with a combined annual capacity of about 235 million gallons. The largest are Diamond Green Diesel, Norco, LA [~150 MM gpy, from 1.3 billion pounds of fat] and the REG facility in Geismar, LA [75 MM gpy] (Lane 2016) Diamond Green Diesel is a partnership between a subsidiary of Valero Energy Corporation and Darling Ingredients. Kern Oil, with a refinery in California, has co-processed renewable diesel and petroleum diesel in some years, but does not have a dedicated renewable diesel facility. 16 Bio-oils – pyrolysis oils from biomass feedstock – contain 40-50% oxygen (by weight) and 10-20% water, and are acidic and unstable (do not store well). 17 Ensyn, building on a process at a 3 MMg/y facility in Ontario that supplies heating oil, has several projects to supply heating and refinery markets, including a 10 MMg/y facility under construction in Quebec to use a forest slash feedstock slated for late-2017 commissioning, and a 20 MMg/y retrofit project in Georgia for construction in mid-2017 and commissioning late 2018. Fulcrum is developing an 11 MMg/y facility using municipal solid waste (MSW) in Reno, NV, for production by late 2018, plus seven additional plants by 2022.
14
development at scale, and off-take agreements. Another hallmark of renewable jet fuel development has been more active partnerships between airlines and NGOs interested in developing sustainability protocols, especially for feedstocks, in line with an industry commitment to reduce GHG emissions substantially this century, under some policy pressure to do so, especially in Europe. For example, the National Resource Defense Council issues a periodic Aviation Biofuel Scorecard, and in 2016 received responses from 19 or 29 airlines surveyed (Hammel 2016). Although the fuel mix shifted in the UCD assessment from the prior E2 report, overall energy from emerging fuel capacity in 2017 remained roughly constant, with the important caveat that in the new assessment more capacity is assessed as “high end.” (Figure 4, which shows capacities in gallons of gasoline-equivalent [gge], depicts more definite supply as “low end” and additional capacity added if “high end” volumes come through). The fuel-shifting reflects market response to key alternative fuel policies that use market-based mechanisms to encourage lowest-cost compliance with some fuel flexibilities built in (more on this below, in the Policy section).
*Data unconfirmed by company Units are million gallons gasoline-equivalent Figure 4. Tracked fuel capacity results, compared to E2 (2014) report Observed Trends for Emerging Fuels and Technologies The tracking activity illuminated some industry trends worth noting. First, already described, was the co-location of new facilities alongside existing ones to share infrastructure and processes as possible. Examples for cellulosic ethanol include corn kernel fiber bolt-on technology at corn ethanol plants and corn stover ethanol facilities adjacent to corn ethanol plants. While outside our scope, sugarcane bagasse ethanol facilities co-located with sugarcane ethanol plants provide another example and produce fuels eligible for the RFS and state carbon intensity standard policies. That approach could diffuse through Brazilian ethanol plants more
readily than corn stover ethanol might in the U.S. because bagasse, the fibrous biomass left after the cane is crushed to extract the sugary juice, is already brought to the plant and available for use, often for electricity generation. There was also a renewable diesel example in the effort by one technology provider (now bankrupt) to co-locate renewable diesel plants adjacent to corn ethanol facilities to use the corn oil coproduct as a feedstock. Commissioning is reportedly underway in the first facility and a second one put plans on hold with the bankruptcy but may resume depending on the experience of the first facility. In a similar vein, there were examples of companies retrofitting or revamping existing facilities or using their sites, or otherwise making use of existing capital stock. Examples include Ensyn’s retrofit of a particle board manufacturing facility in Georgia for woody biomass drop-in fuel and AltAir Fuels’ retrofit of an idled petroleum refinery to produce renewable jet fuel. The sale of the Hugoton, KS, cellulosic ethanol facility, idled due to Abengoa’s bankruptcy, to Synata Bio was recently announced. Lanzatech also has a project for a woody biomass gas fermentation facility at a prior paper mill in Georgia (although the company’s priority project moved overseas). Use of existing plant facilities lowers costs by recycling existing physical capital, but potentially also by shortening or streamlining permitting processes by using a property location previously vetted for industrial use. Other capital stock is more mobile: REG purchased physical assets from the defunct KiOR plant for use at its Geismar renewable diesel facility. In short, the turnover in the biofuels industry and other industries can also free up some capital stock for future, lower cost use. Difficult to quantify but also important is that the human capital that accumulates in the emerging fuels industry also circulates across companies, so that whatever learning may occur in failure or success is brought to bear in the new venture. Synata Bio, the purchaser of the Hugoton plant, for example, reportedly includes much of the scientific staff of the prior Coskata, which focused on multi-feedstock conversion to hydrocarbons (Lane 2016d). Another observed trend also alluded to above is the delayed and unexplained start or ramp-up of production at new facilities towards nameplate capacity. Expected ramp-up rates would provide important information beyond usual tracking information – nameplate capacity and expected opening year – to reflect real constraints on near-term production of emerging fuels and technologies. The EPA has taken a step in this direction in its analysis of available fuels for setting annual mandates for cellulosic fuels. A study out of Europe suggests ramp-up rates for pioneer plants (de Jong et al. 2015).18 Potential production ranges per facility should reflect start-up and ramp-up issues. The UCD tracking exercise incorporated information on timing of ramp-up when it was available. Data
18 In the analysis, pioneer plants are assumed to reach 20-32% of nameplate capacity in the first year (varies by technology in the study), and increase production by about 20% of nameplate capacity each year, taking ~ 4.5 to 5 years to reach full capacity. The first year assumptions come from analysis of energy process pioneer plants by the Rand Corporation for the Department of Energy in the 1980s; the ramp-up rate is taken from technoeconomic studies that build on the Rand analysis and focus on biofuels.
16
on how the use of technologies ramp up in commercial scale production and changes in expected ramp-up rates over time would be useful for improving near-term capacity tracking. Finally, for facilities we determined to be out-of-scope (see Figure 2, above), the reasons illuminated key industry trends and questions, listed in Table 3. Table 3. Key Industry Trends and Questions From Moves to ‘Out-of-Scope’
Key Industry Trend
Issue or Question
Shifting target markets
For bioproducts. Trend for companies to move from fuels to chemicals, and more recently to food/nutraceuticals. Part of this trend is a shift to intermediate products (e.g., cellulosic sugars, pyrolysis oil) that can feed multiple end markets and ease reliance on a single primary product market. Within the energy sector, biomass may be used to generate biogas, for electricity generation or for transportation. For technologies. Technology may be more profitable when applied in non-renewable sector (e.g., Lanzatech transforming industrial gases to fuel)
Multiple target markets
Fuels may remain in product portfolio with uncertain dedicated capacity
Uncertain how easily and quickly capacity can turn toward (or away from) fuels, due to technical or cost considerations
Projects on hold This occurs at various stages of scoping (siting, financing, construction)
“Overseas first” What are key considerations -- lower costs, available capital, attractive regulatory environment? (e.g., China)
Consolidation and drop-outs
How do observed trends compare with “normal” associated with early industry churn under challenging market conditions?
Uncertain size/value of output
market
Oil price and policy uncertainty are only part of the picture
Technical uncertainty persists at scale
for cellulosic ethanol, prolonged and failed commissionings, for various reasons – technical, financial, institutional for drop-ins other than HEFA renewable diesel, a number of facilities are still in pre-production phases
Timing of industry shifts Many trends preceded low oil prices, then pushed by them
Comparison of reports and assessments for emerging fuels/technologies To better understand the tracking landscape, recent reports, trade literature, biofuels databases and EPA analysis of fuel availability for setting RFS mandates were reviewed for information on emerging fuel installed capacity in US or North America. Table 1(above) summarized information categories. Below, Table 4 lists commercial-scale capacities for cellulosic ethanol, drop-in fuels, and biogas (renewable CNG) from those sources.
17
Table 4. Installed Capacity Assessment Comparison for North America
Meaning of 'Current' and 'Projected' for each report (in general, Projected = Current + proposed)
Current Projected Current Projected Current Projected MMg/y n MMg/y n MMg/y n MMg/y n MMg/y n MMg/y n
NREL (2015) 84.5 4 104.5 (75)
5 (1) 211 2 211 2 - - - - Current is end of 2013. Projected is 2-4 years
beyond current
NREL (2016) 81.8 (23)
4 (1) 177.5 12 167 2 799.5 10 - - - - Current is end of 2015. Projected is 2-4 years
future
NREL (2017) 59.6 (30)
5 (2) 138.7 19 296
(16) 6
(2) 867.5 14 - - - - Current is end of 2016. Projected is 2-4 years future (includes idle, under construction and planned)
IRENA (2016) 60.5 13 192 23 2 10 28 13 Current is end of 2016 (includes demos). Projected is thru 2019.
IEA Task 39 177 (25)
12 (1) 247 16 213 3 235 5 - - - - Current is 'Operational + Idle'. Projected=
Current + planned & under construction
Genscape 91 (25)
8 (1) 117 12 493 16 669 21 256 38 260 39
Current includes operational + idle capacity. Projected = Current +planned, permitting & under construction
EPA 2016 RFS 89 7 - - - - - - 250 Various - - For EPA, Current = next 6 months to 1 year. No
projected data past 1 year
EPA 2017 RFS 74
3 large, several 'bolt-on'
- - - - - - 384 Various - - "
UCD (2017) 47 (25.9)
22 (5) 183 26 294 (?) 11
(1) 745 23 - - - - Current is 2016 Low-end; Projected is 2018 high-end assessment.
UNCTAD (2016) 88.2 6 429.6 23 - - - - - - - - Projected includes current, under construction
and planned facilities. Cellulosic EtOH only.
Ethanol Producer Magazine
141 9 473 20 - - - - - - - - Current is 'existing' capacity. Projected = Current + proposed (no in-scope plants listed as ‘under construction’)
Notes: Numbers in parentheses indicate idle (capacity and number of facilities). For IRENA (2016), drop-ins do not include HEFA. For UCD study, idle facilities are pilot/demos or bankrupt/for sale. Projected timeframe varies by report but generally by 2020. Shaded rows indicate assessments more based on company announcements without independent assessment. Total capacities in this review are approximate. Biogas capacities are reported in ethanol gallon equivalents because biogas is classified as cellulosic ethanol under the RFS.
18
Figure 5 charts information from Table 4 on near-term installed capacities (North America).19 UCD tracking is within range of other assessments: 105-245 MM gpy for cellulosic ethanol and 210-800 MM gpy for drop-in fuels. Differences are due to the timing of the tracking, and their timeframe for research. Indeed, UCD assessments are closer to NREL (2017) and IRENA (2016) where tracked fuels are comparable (see Table 4) – these are the more contemporaneous studies. For cellulosic ethanol, projections based more heavily on announcements and press releases – in the UNCTAD publication and in the databased maintained by Ethanol Producer Magazine – are about two times higher than UCD.
Figure 5. Near-term Installed Capacities – Report Comparison Figure 6 shows that that the UCD study tracked more facilities than other efforts. Much of this is due differences in timing or scope of the reports. Our comprehensive approach included demo and pilot facilities, plants that we tracked but that were assessed as having zero capacity for 2018, and 2016 announcements for multiple corn fiber ethanol ‘bolt-ons’ and co-located corn oil RD that came too late for inclusion in some other reports. These facilities add little to capacity.
Figure 6. Near-term Number of Facilities– Report Comparison
19 Except NREL (2017) and IRENA (2016), which were reviewed too late to be charted.
Tracking Issues for Emerging Fuels and Technologies The study highlighted a number of issues for tracking near-term emerging fuels and technologies. In tracking production capacity, the impact of commissioning or a ramp-up phase is often overlooked but would be useful to understand better. Reasons behind forced idling of a plant are also relevant to near-term capacity. Facilities can be idled due to technical, company, or market factors that could be assessed for their impact on a realistic ramp up of production in the near term. Because facilities increasingly serve multiple output markets and sometimes maintain only a minor focus on fuels, there is a need to examine more systematically how to translate nameplate capacity into meaningful near term potential fuel production. Retrofits and co-location, which provide information about least-cost-to-commercialize and impact where new capacity arises, could be missed in a straight capacity-tracking exercise. Finally, partnerships are clearly critical for the evolving business case for new companies, but are challenging to comprehensively or systematically track. A question arising out of the study is how tracking efforts can best adjust to this changing emerging biofuel landscape, to provide useful information on commercialization trends.
Biodiesel – a commercially established fuel/technology (industry-level research)
U.S. biodiesel production and capacity20 U.S. biodiesel production has remained well under capacity this decade. From 2008 to 2016, capacity of actively producing facilities grew from 1.7 billion gallons per year (gpy) to about 2.3 billion gpy. In that period, domestic production expanded from 40% of capacity of active facilities (those reporting production and sales) to almost 70%, reaching 1.6 billion gallons in 2016 (Figure 7). In 2015, there were about 100 active facilities. Total installed capacity exceeded 3 billion gpy from close to 250 facilities,21,22 meaning roughly one-third of the built capacity (1 billion gallons) was not involved in producing commercial biodiesel in 2015 or 2016. The biodiesel industry has considerable idle capacity.
20Biodiesel refers to mono-alkyl esters of long chain fatty acids derived from vegetable oils and animal fats (ASTM D 6751). 21 Capacity varies by source due to different update timing and methods. We obtained a list of facilities from the National Biodiesel Board (NBB) that has 232 facilities with a combined capacity of 3.4 billion gallons per year (gpy) including about 370 million gpy of renewable diesel, and about 170 facilities with a combined capacity of just over 3 billion gallons registered biodiesel in the EPA Fuel Programs (40 CFR Part 80). Biodiesel Magazine lists 166 existing facilities and 2.8 billion gallon capacity (http://www.biodieselmagazine.com/plants/listplants/USA/existing/). Genscape, a commodity and energy market data company, maintains an online database that catalogs 262 existing facilities representing 3.5 billion gallons of annual capacity (https://apps.genscape.com/Biofuels/). 22 Energy Information Agency (EIA) monthly survey data of (operating) commercial biodiesel producers showed an average of 2.1 billion gallons’ capacity from an average of close to 100 reporting facilities for 2015. www.eia.gov/biofuels/biodiesel/production. EIA (2016) Monthly Biodiesel Production Report-With data for January, 2016. Energy Information Administration, US Department of Energy, Washington, DC. http://www.eia.gov/biofuels/biodiesel/production/archive/2016/2016_01/biodiesel.cfm. The Genscape database (see footnote 3) lists 127 operational facilities with 2.2 billion gallons of total annual capacity.
Policy is the most important driver for domestic biodiesel production. At the federal level, the RFS2, a set of nested volume mandates for domestic use of different categories of renewable fuels laid out in statute but adjusted annually by the EPA, includes a dedicated biomass-based diesel mandate. It requires the use of at least 1 billion gpy of all biomass-based diesel (biodiesel and renewable diesel combined) from 2012 through 2022. This can be, and has been, adjusted upward annually (and topped 2 billion gallons for 2018). Because biomass-based diesel also counts toward the RFS2 advanced mandate requirements, filling the biomass-based diesel mandate meets a substantial proportion of the advanced mandate. In addition, biodiesel can be used to meet any of the advanced mandate that has no particular fuel specified. The RFS2 regulatory framework thus places lower and upper limits on combined domestic use of biodiesel and renewable diesel that will be supported by policy. Figure 7 shows the RFS2 mandates alongside domestic biodiesel production and capacity.
Note: Volume mandates are for biomass-based diesel (BBD) and advanced fuels (the additional fuels required beyond specified amounts are the “advanced gap”). Mandates are in biodiesel-equivalent gallons, converted from ethanol-equivalent gallons for the advanced mandate (i.e.,1 BBD gallons = 1.5 ethanol equiv gallon). The 2009/2010 BBD mandates were combined, shown here as 2010. Sources: EIA production reports, EPA RFS annual rulemakings, National Biodiesel Board. Figure 7. Annual biodiesel production, capacity (EPA registered and installed), and RFS2 volume mandates The second major federal policy is a $1 per gallon blender’s credit for biomass-based diesel, typically passed for two years, allowed to expire, then reinstated retroactively. It expired at the end of 2016. Neither incentive is limited to domestically produced fuel, however. The policies also encourage imports of biodiesel and renewable diesel. We return to the topic of imports in the next section. The industry in the U.S. has a considerable number of facilities with relatively small capacities but has been undergoing some consolidation. For example, the Renewable Energy Group, in addition to its acquisition of the Geismar renewable diesel facility (see above), has eight
21
biodiesel facilities that represent about 12% of U.S. capacity reported by the EIA (257MMg out of 2,100 MMg).
Biodiesel feedstocks Feedstocks can have a big impact on carbon intensity ratings assigned to fuels by some climate policies such as California’s LCFS and Oregon’s CFP. In general, residues receive lower carbon intensity scores than crop-based products for a given fuel conversion technology when associated land conversion on- and off-site are accounted for (see Policy section). The EIA collects information on feedstocks used for U.S. production in its monthly biodiesel production survey (amount and type).23 Under the RFS, feedstock for the biodiesel industry grew from 1.8 million tons in 2009 to 4.7 million tons in 2015 and 5.5 million tons in 2016, to support higher production levels. While the feedstock base has diversified as it has grown (Figure 8), soybean oil remains dominant and constitutes over 50% of feedstock. In recent years, animal byproduct fat and recycled grease together accounted for roughly 25% of biodiesel feedstock (about half from each). Extraction of corn oil for biodiesel at corn ethanol plants diffused through much of the industry in the period, and spurred corn oil growth from 2% to 11% of feedstock. Reliance on recycled grease also increased substantially (5% in 2009 to close to 14% of feedstock use in 2015 and 2016). Trends among biodiesel feedstocks may reflect availability of supply, given the rapid growth of the sector. Feedstock and production trends constitute a possible topic for future research (see Future Directions).
Source: EIA data.
Figure 8. Feedstock contribution in U.S. biodiesel production, 2009, 2015, 2016.
23 The list includes: virgin vegetable oils (canola, castor, coconut, corn, cottonseed, palm, peanut, soybean, sunflower, tung, and other); animal fats (slaughter by-products: poultry fat, tallow, white grease and other); recycled feedstocks (yellow grease, brown grease, other); algae; and other.
22
US Biomass-based Diesel and the Role of Imports The RFS2 and biomass-based diesel blender’s credit policy incentives encouraged strong growth in imports of biodiesel and renewable diesel alongside the higher domestic production already discussed (Figure 9). The U.S. became a net importer of biodiesel in 2013. From 2013-2016, imports grew to 0.7 bg, a factor of almost five (374%); domestic production expanded 15% in the same period (EIA 2016b).
Renewable diesel imports had a larger role earlier on. They started in 2011 and reached 223 million gallons in 2016 (EIA 2016c). From 2014 to 2016, about 85% of renewable diesel imports were shipped by Neste Oil in Singapore to California ports, where the fuel earns credits under the Low Carbon Fuel Standard. The US EIA does not track domestic renewable diesel production but the USDA estimated it to be 173 million gallons in 2015 (Carter 2016), just under 60% of the UCD-tracked U.S. installed capacity. The data reflect much early growth of renewable diesel commercial-scale activity, with its fairly well understood technology, occurred outside the U.S. Global renewable diesel production capacity in 2016 was about 1.2 billion gpy, and 2020 projections are about 1.9 – 2.5 billion gpy (Thurmond 2016, GREENEA 2015). From our tracking, just under 300 million gpy of this was in the U.S. in 2016, to grow to 354 – 745 million gpy in 2018. Approximately 15 renewable diesel facilities are producing worldwide, dominated by Neste Oil (EIA 2015, Lane 2016, Hamje et al. 2014, Thurmond 2016, GREENEA 2015). Neste has two renewable diesel facilities in Finland (55 MM gpy each), one in Singapore (233 MM gpy), and the most recent in Rotterdam (240 MM gpy, completed in 2011). There are some ambiguities about renewable diesel supply: considerably more renewable diesel gallons were recorded under the RFS2 and its Renewable Identification Numbers (RINs) than imports plus estimated domestic production would imply (Figure 9) (USEPA 2016).24 We expect the picture to clarify as the renewable diesel market becomes more firmly established.
Figure 9. Biomass-based Diesel - Production and Imports (to California and rest of U.S.). Sources: EIA data and (Carter 2016) (for domestic renewable diesel production estimates), EPA RFS2 data (for renewable diesel RIN volumes).
24 We were unable to identify the source of this gap. Other than for RFS compliance, RINs can also be retired because they were invalid or because the fuel was exported.
Renewable Diesel RIN Volumes
23
Carbon intensity ratings of renewable diesel used in policies also depend considerably on the feedstock used. Renewable diesel feedstocks are not tracked by the EIA. However, RFS data suggest that palm-based renewable diesel started being imported into the U.S. in 2013, and contributed nearly a third (31.5%) of all renewable diesel RINs generated between 2013 and 2016 (Figure 9 - right graph).25 California’s LCFS tracks the feedstocks of incoming fuels because it matters for their carbon intensity ratings. Most renewable diesel (69%) in 2013 – Q3 2016 came from tallow and about 103 million gallons (18%) came from a palm-based product (CARB 2017) . The fuel does not meet the GHG reduction cut-off for credit in U.S. climate policies.
The case of biomass-based diesel highlights two easily overlooked points. First, alternative fuel policies based on greenhouse gas emissions only account for location of production except as it impacts the carbon footprint. This treatment reflects the global nature of GHG impacts. In-jurisdiction production of alternative fuels is often among local policy goals and backed by other policies, but imports can still play a large role. Because feedstock cost is a substantial component of operating cost, relatively low feedstock cost is an important element in determining where to locate production. The less well understood the technology, the more innovation climate and access to appropriate human capital contribute to where technology development in demonstration, pilot, and perhaps pioneer, first-of-a-kind plants takes place, but wane in the business location decision the more established the technology becomes.
Second, as suggested by the considerable volumes of palm-based biofuels with a high carbon intensity rating, along with larger volumes of biomass-based diesel comes a need to appropriately source feedstock to ensure a low carbon profile. This pertains not just to the feedstock itself, but to activities undertaken to backfill demand for that feedstock.
Investment and Costs This report updates information on public and private investment trends from 2007 to mid-2014 presented in the E2 2014 Market Report, using private investment data from the Clean Tech Group, and public investment data from research of secondary online sources (Figure 10). Note that many public investments involve multi-year outlays, so that value of award initiated in a given year may not reflect total annual access to publicly backed capital. Figure 10 shows considerable investment in biofuel production facilities in 2010-2012 from both private and public sectors, which declined in 2014-2015. The composition of monies shifted in the period from grant toward loan guarantees in the public sector, and from structured debt toward private funds in the private sector. The trends align with the lower
25 Some renewable diesel RINs recorded in the program are not being generated under a recognized eligible pathway, but could be from facilities grandfathered into the regulation as eligible for the renewable mandate (coded D6).
24
tracked North American production capacity compared to assessments in E2’s 2014 Market Report, and with information from biofuel producers regarding difficulties gaining access to sufficient private or public investment to proceed with planned North American production facilities. Since 2014, the federal government extended its support for biofuels beyond biofuel production facilities. Additional programs target investment in biomass feedstock supply and sustainability,26 biofuel distribution infrastructure,27 and biorefineries developing bioproducts other than biofuels.28 The expanded scope is part of strategy for “bioproducts to enable biofuels” (USDOE 2016). It aligns with trends toward alternative biobased products found in the tracking exercise (see Industry Overview).
Figure 10. Investment Trends and Investments by Type for Biofuel Production Facilities. Sources: Clean Tech group data (CTG 2016), USDA and DOE (USAspending 2016), California Energy Commission (CEC 2016).
Capital Costs of Production Facilities When possible, the tracking included information on production facility capital costs. Installed costs (capital costs as $/gallon-installed capacity) for E2 (2014), UCD (2017) (2015 data), and select techno-economic academic literature appear in Figure 11 (average and range of data)
26 Efforts include USDA support for biomass cropping for energy (both electricity and biofuels) in existing project areas (NSAC 2015, NSAC 2015b); and funding for universities researching feedstock production methods considered sustainable and “regionally appropriate” (USDA 2016). 27 In 2015, up to $100 million in funding became available for infrastructure to support higher blend ethanol distribution (USDA 2015). 28 Available funds under an expanded USDA biorefinery assistance program include up to $30 million for FY 2015 and $70 million for FY 2016, with $20 million reallocated from 2015 to 2016. Under the program change, eligible biorefineries can produce renewable cheimcals and other non-fuel products. They now need produce only some eligible biofuels, and these can be sold into non-fuel markets. (http://www.kilpatricktownsend.com/en/Knowledge_Center/Alerts_and_Podcasts/Legal_Alerts/2015/07/USDA_Section_9003_Loan_Guarantee.aspx?utm_source=Mondaq&utm_medium=syndication&utm_campaign=View-Original ). USDA grants for biobased products also have focused more on biochemicals than biofuels (USDA 2016).
$0
$500
$1,000
$1,500
$2,000
$2,500
2007 2008 2009 2010 2011 2012 2013 2014 2015
Mill
ions
Public
Private
0
200
400
600
800
1,000
1,200
1,400
1,600
2014 2015
Mill
ions
($)
Grant Loan GuaranteeUncertain Structured DebtSeed Project FinanceLoan Growth EquityFollow-on Public Offer PIPESeries B Series A
and Figure 12 (individual data points, some with company names). N is small in all data sets and the E2 and UCD data use announced or reported company reported nameplate capacity as installed capacity. Drop-in fuels data from biomass-to-liquid (BTL), pyrolysis-to-hydrotreatment and HEFA technologies exhibit some scale economies (EcoTech, Fulcrum, and Red Rock are BTL, REG Geismar is HEFA). This is not seen for the technologies producing cellulosic EtOH (hydrolysis/fermentation by Zeachem and gasification/catalysts by Enerkem), beyond the low cost, low capacity bolt- in the lower left hand quadrant of Figure 12.
Note: Tracker data from companies or secondary sources. Includes facilities not yet operational or moved to out-of-scope. Data from pilot/demo facilities not used. Literature for early commercial deployment beyond “pioneer” (cost reductions with learning could occur). Sources: (Zhao et al. 2015, Li et al. 2015, Brown et al. 2013, Pearlson et al. 2013, Anex et al. 2010). Figure 11. Biorefinery capital costs; company data and literature values
Note: Facilities not yet operational or moved to out-of-scope are ‘whited out’. Sources: UCD tracker and literature data from (Zhao et al. 2015, Li et al. 2015, Brown et al. 2013, Pearlson et al. 2013, Anex et al. 2010). Figure 12. Biorefinery capital costs and nameplate capacity Such per gallon capital costs based on self-reported nameplate capacity do not reflect costs for realized production gallons, which can be higher if full capacity is not reached or requires
0
5
10
15
20
25
Cellulosic EtOH Drop-In
$/ga
l-cap
acity
2014 Data (E2 Report) 2015 Data Literature
n=10 n=5n=3
n=4
n=5n=9
(facility average, range, and n)
0
4
8
12
16
20
0 10 20 30 40 50 60
($ /
gal
-cap
acity
)
Capacity (MM g / y)
2014 Data (E2 Report)2015 DataLiterature
Abengoa-Hugoton
Dupont
POET
ZeaChem
Dupont
BlueFire
Enerkem
Capital Cost - Cellulosic Ethanol
QuadCounty
BetaRenewables
0
10
20
30
40
50
60
70
0 20 40 60 80
($ /
gal
-cap
acity
)
Capacity (MM g /y)
Capital Cost - Drop-In Fuels
2015 DataLit. - BTLLit.- Pyrlys-hydrtLit. - HEFA
2014 Data (E2 Report)
EcoTechRed Rock
Fulcrum
REGGeismar
26
additional capital investment during a ramp-up phase. The tracking exercise pointed up a knowledge gap about total costs and effective, usable capacity and their determinants over the near term (that is, both the cost numerator and the capacity denominator in a cost-per-gallon measure) for emerging fuel industries given the technical, financial, and business challenges of start-up.
Fuel Production Cost Estimates Figure 13 shows ranges of estimates for fuel production costs for emerging fuels. For cellulosic ethanol, production cost estimates from the technoeconomic literature range from just over $3 to $5.60 per gallon ($4.60 to $8.50/ gge)(Ou et al. 2014, Anex et al. 2010, Zhao et al. 2015). A 2016 study by Lux Research estimated production costs for six operational cellulosic ethanol facilities worldwide and found them to fall within this range ($2.17 to $4.55 per gallon or $3.25 to $6.80/gge); feedstock costs comprised up to 40% of the total (LUX 2016). For drop-in fuels, literature production cost estimates range from about $2.80/gge for pyrolysis and hydrotreatment to about $8/gge for hydrocarbons via advanced fermentation (fermentation of cellulosic-derived monomer sugars direct to hydrocarbon) (Anex et al. 2010, Brown et al. 2013, Zhao et al. 2015, Li et al. 2015, Pearlson et al. 2013, Seber et al. 2014, Staples et al. 2014). Estimates refer to facilities beyond the pioneer stage but not incorporating full learning. To reiterate, how start-up activity (unexpected capital outlays and any curtailed production) impacts actual production costs for early plants especially in their ramp-up phase is not well understood, but is critical for understanding the likely impact of current policy incentives.
27
Average costs, range (high - low), and number of studies (n) from same technoeconomic literature sources as Figure 11, for plants with technology maturity level at early commercial deployment but beyond “pioneer plant” stage. Note: *Lux Report Range refers to projections for six operational cellulosic ethanol plants; high and low values were also included in the average and n for cellulosic ethanol. Sources: (Zhao et al. 2015, Li et al. 2015, Brown et al. 2013, Pearlson et al. 2013, Anex et al. 2010) (LUX 2016).
Figure 13. Biofuel production cost estimates from literature
Policy Low carbon fuels as seen through the policy rating systems, including biofuels, have generally not been competitive in the marketplace without additional incentives.29 Some policies explicitly consider and incentivize based on carbon intensity rating. Other policies promote production of particular types of biofuels, or support the distribution infrastructure required for new fuels to be used.
29Ethanol from conventional feedstocks like corn can be cost-effective in gasoline blends due to competitiveness as an octane enhancer, currently common in blends up to E10 (10% ethanol blend by volume) (Irwin and Good 2017) Cellulosic ethanols are still more expensive, with the possible exception (now being tested in the marketplace) of some corn kernel fiber ethanols.
0
1
2
3
4
5
6
7
8
9
EtOH BTL Pyrlys-hydrt HEFA AF-dropin
Dolla
r per
gal
lon
gaso
line
equi
vale
nt (
$/gg
e) Feedstock All other Costs
Key:EtOH = Cellulosic EthanolBTL=Biomass to Liquid Hydrocarbons (gasification - Fischer Tropsch)Pyrlys-hydrt = Pyrolysis-to-biocrude then hydrotreatment.HEFA = hydrogenated esters and fatty esters.
n=1
n=3n=4
n=4
n=5
LUX Report Range*
28
A few aspects of biofuels delivery infrastructure help shape impacts of policy incentives in important ways. Ethanol can be blended into gasoline up to 10% by volume (E10) using current infrastructure, often referred to as the “blendwall.” Ethanol’s corrosivity requires an appropriately designed infrastructure for distribution and use at higher blend levels. Higher ethanol blends (E15 and E85) have been approved for use under certain conditions, but are not in widespread use.30 Biodiesel faces fewer usage restrictions. Up to B5 is approved and classified as diesel, with no separate labeling needed. Up to B20 requires no engine modifications and is approved for use by most but not all engine manufacturers. It can, however, require mitigation for air quality (due to NOx emissions) as in California, depending upon fuel cetane value (which varies by feedstock), season, and the diesel engine burning the fuel. Above B20, cold weather is more likely to impact performance (gel) without additional additives, and not all engines have warranties covering higher biodiesel blends. Renewable diesel that has undergone isomerization for complete conversion to a hydrocarbon does not have usage restrictions in delivery infrastructure or engines. Several aerojet biofuels that have received ASTM certification are covered at up to 50% blends with petroleum fuels; they have commonly been used thus far at lower blend rates. The slow roll-out of low carbon fuels generally and biofuels in particular has sparked considerable discussion about the adequacy of current policy incentives for achieving stated alternative fuel targets, given challenges with both supply and delivery infrastructure. Issues concern whether the incentives are large enough and can flow where needed along the supply/distribution chain to overcome the challenges of delivering commercial volumes of biofuels to market.
Policies Using Carbon Intensity Ratings The key North American policies that incorporate carbon intensity (CI) ratings are the blending mandates like the US Renewable Fuel Standard (RFS) and carbon intensity standards like California’s Low Carbon Fuel Standard (LCFS). Both policy types assess lifecycle CI, which is GHG emissions per unit of energy (often as grams of carbon dioxide equivalent per megajoule, or gCO2e/MJ) from feedstock sourcing through combustion in the vehicle, including feedstock production and transport, and fuel conversion, processing and distribution. The RFS drives the largest volumes of in-scope fuel use by setting volume mandates for particular categories of renewable fuels, which are set at levels intended to kickstart market activity by ensuring significant demand. The RFS requires eligible fuels meet minimum lifecycle CI reductions. Alberta and Ontario both also have renewable blending mandates that include GHG emission reduction requirements. California’s Low Carbon Fuel Standard (LCFS) and similar programs, in 30EPA regulation allows the use of E15 (between 10-15% ethanol by volume blended with gasoline) in model 2001 or newer light-duty on-road vehicles. The fuel faces other restrictions: not all engine manufacturer warranties for older or newer vehicles cover the use of the fuel; E15 pumps require special labeling; and the fuel only meets volatility regulations in the winter. E85 (51-83% ethanol-by-volume blends) is approved for use in flex-fuel vehicles, which comprise roughly 5% of the light-duty market, although many owners are reportedly unaware of this vehicle characteristic. It also requires specialized pumps.
29
contrast, mandate a reduction in the aggregate CI rating for the transportation fuel pool, rather than setting target volumes for a guaranteed market. CI standards generate demand for any kind of fuel, as long as it carries a sufficiently low carbon rating. The lower the CI rating of alternative fuels used, the higher the incentive, and the less of them is required to meet overall CI targets. The programs discussed here use similar but not identical rating methods and system boundaries. Choice of system boundary for the estimation is one but not the only subjective decision in the assessment. Others include allocation of emissions to coproducts, treatment of biogenic carbon, and analysis of any market-mediated impacts (especially on land use – termed “indirect land use change”). There are disagreements and continued debate in the academic community about the methods, sources of variability and uncertainty in the estimates, and their appropriate use in policy. In short, the RFS creates a market for significant volumes of specific types of renewable fuel and incentivizes just enough fuel that meets minimum CI savings thresholds, without promoting additional carbon intensity reductions. CI standards like the LCFS reward lower CI ratings for all fuels (non-renewables as well as renewables), and do so in a more continuous manner. LCFS-like programs generate a market for fuels considered low in carbon, but no guaranteed market of a given size for particular types of fuels because: a) all low carbon alternative fuels are competing to meet the standard; and b) the lower fuels’, the less volume required to meet a given CI reduction target. Lifecycle CI ratings are a key metric in both programs, but especially in CI standards, since lowergCO2e/MJ ratings embody higher value. Both policies generate program credits when low carbon fuels enter the marketplace, which are then tradeable at a market price.31 The credit price adds value to low carbon fuels and disincentivizes higher carbon fuels. Credit trading facilitates lowest cost compliance with program targets, and the credit price should reflect the expected cost to bring the last gallon of fuel to market to meet the target. The size of the policy incentive (embodied in the credit price) is particular to each program and can vary over time, due to differences in carbon intensity ratings (and assessment methods); policy stringency; cost containment mechanisms in place, policy certainty, and other policies in place, as well as general market conditions such as the price of oil.
U.S. Renewable Fuel Standard (RFS) RFS statutory mandates target the domestic use of 36 billion gallons of renewable fuels by 2022 – over 20 billion gallons of “advanced” fuels that must meet a 50% rated lifecycle carbon intensity reduction,32 plus 15 billion gallons of conventional renewable fuel (the maximum allowed for corn starch ethanol) that must meet a 20% rated lifecycle CI reduction. The
31 Subject to a few regulatory price boundaries. Under the RFS, a waiver price for cellulosic fuels, set annually by formula based on earlier years’ gasoline prices, sets an effective cap for these fuels when availability is an issue. California’s LCFS sets up a clearinghouse for trades in years where not all deficits have been covered, and caps them at $200/credit. 32 Lifecycle carbon intensity reductions are evaluated for 2022 compared to a 2005 fossil fuel reference.
30
“advanced” mandate includes a submandate for biomass-based diesel that must meet a 50% lifecycle CI rating reduction, and another for cellulosic fuels that must meet a 60% reduction. The US EPA can adjust RFS mandates annually based on available volumes, and has dramatically lowered the cellulosic and advanced mandates from statutory levels (Figure 14).
*Gallons for biomass-based diesel; ethanol-equivalent gallons for other mandates. “Adv. (other than cell. & BBD)” and “Other Adv. (statute)” refer to residual advanced fuel after adjusting for ethanol-equivalent gallons covered through the cellulosic and biomass-based diesel mandates (with this at its statutory minimum of 1 billion gallons for the statutory line). Source: EPA RFS data. Figure 14. RFS Volume Standards: implemented (columns) and statutory levels (lines) The regulation creates obligations for use of renewable fuels up to mandated levels proportionate to the use of petroleum fossil fuels in road transport.33 Within mandate categories, eligible fuels compete to fill the mandate at lowest cost. Biogas has outcompeted the slow-developing liquid cellulosic market since 2013, when it became eligible for cellulosic credits, supplying 98% of RFS cellulosic energy in 2016 (USEPA 2016). Adjusting mandate levels in the annual rulemaking can send a ripple effect through other mandate requirements due to the mandates’ nested nature. For example, if required cellulosic volumes are adjusted downward more than required advanced fuel volumes (as in Figure 14), the unspecified advanced fuel mandate will grow. Advanced fuels such as biomass-based diesel or sugarcane ethanol compete to fill the gap at lowest cost, within other market conditions such as the biomass-based diesel blender’s credit and the ethanol blendwall. Ethanol consumption is close to or at 10% by volume in the U.S., so additional volumes would require higher gasoline consumption or greater penetration of higher ethanol blends.
33Renewable aviation fuel and heating oil are eligible to generate credits, but their petroleum-based counterparts do not carry an obligation.
31
Fuel Carbon Intensity Standards (“Low Carbon” or “Clean” Fuel Policies) LCFS-like policies provide monetary incentives for biofuel (and other fuel) producers as long as the fuels overcomply with the targeted life-cycle carbon intensity emission ratings. The funds are transferred producers of fuels with carbon intensity ratings above the targets, through a system of tradable and bankable credits. Several jurisdictions have transport fuel CI standards: California (LCFS), Oregon (Clean Fuels Program, or CFP), and British Columbia (Renewable and Low Carbon Fuel Requirement Regulation, or RLCFRR). All set a fuel pool target of a 10% CI reduction in ten years, which can be met with any alternative fuel mix.34 Canada is developing a nationwide Clean Fuel Standard (CFS) based on lifecycle carbon intensity assessments for fuels used in transportation, building and industry sectors. As programs grow more stringent, a fuel with a given CI rating at a given credit price would earn less per gallon over time (although the credit price is not expected to remain constant, unless it is at a price ceiling). The LCFS and RLCFRR programs span 2010 to 2020 but have targets for 2030: 18% CI reduction in California (proposal as part of broader climate change suite of policies) and 15% in BC (announced provincial plan). The Oregon CFP goes from 2016 to 2026. Canada’s CFS will begin in 2019 and targets an annual 30 million metric tonnes (MT) of GHG emissions reductions in 2030. Figure 15 and Figure 16 document increases in alternative fuel shares of total transport energy, and the importance of non-biofuel alternative energy under California and British Columbia programs, respectively. Figure 17 shows similar information for the first year of the nascent Oregon program. In all the programs thus far, biomass-based diesel has played a growing role in the transport energy compliance mix. The average carbon intensity of certain fuel types has also declined, due both to modeling updates and actual on-the-ground changes in feedstock or production systems (e.g., greater use of natural gas as process energy, displacing coal).
Source: CARB LCFS data, 2017. Much of the electricity increase in 2016 was due to a program scope expansion to include off-road electric forklifts and light rail. Figure 15. CA LCFS alternative fuel transport energy, 2011-2016
34Most CI standards favor alternative over conventional fuels, and do not credit carbon intensity changes in the same way or sometimes at all.
32
Note: Propane is a covered fuel in the RLCFRR and Oregon CFP, but not CA LCFS. Source: BC RLCFRR data, 2017. Figure 16. BC RLCFRR alternative fuel transport energy, 2010-2015
Note: Propane is a covered fuel in the RLCFRR and OR CFP, but not CA LCFS. Renewable diesel (RD) is not a covered fuel in the OR CFP, but is in the other programs. OR DEQ is proposing RD be covered starting in 2018. Source: OR DEQ data, 2017. Figure 17. OR CFP alternative fuel transport energy, 2016 A Canada-wide CFS for just the transportation sector would almost double the magnitude of fuels covered under a CI standard policy (Figure 18). From evidence on currently available fuels in existing programs, biofuels will likely dominate compliance with Canada’s CFS, especially in early years. Less is known about how biofuels will enter into lifecycle CI standards for fuels used in covered sectors beyond transportation. Still, the energy involved marks a substantial expansion of the potential market for low CI fuels. The role for biofuels in these other sectors, and in transportation for the entire program, will depend on key design elements still under development such as fungibility of credit generation across sectors, baselines and program
33
stringency per sector, and whether all sectors come under the policy simultaneously (or their entry is staggered).
Sources: Oregon CFP program data (ORDEQ 2016), BC Ministry of Energy and Mines RLCFRR program data (BCMEM 2017), California ARB LCFS data (CARB 2017b), Statistics Canada data (Government_of_Canada 2017). Figure 18. Energy covered under existing and proposed lifecycle CI standards, recent years
CI Policy Interaction Multiple jurisdictions with CI policies raise the demand for fuels rated low in carbon intensity, sometimes dramatically (as could happen under a Canada-wide CFS; see Figure 18). It also can create competition among jurisdictions for low-CI rated fuels, and choices for alternative fuel producers about what volume of fuels to send where. Figure 19 depicts all the existing jurisdictions’ annual standards for their 10-year/10% CI reduction targets. They vary considerably due to differences in baseline CI ratings (regarding timing, fuel blends, fuel sources and processing, and CI rating systems) and implementation issues (e.g., updates in baseline CI ratings due to new modeling or data, or, in California’s case, a freeze on the standard from 2013-2015 from a court ruling). The jurisdictions, along with Washington state, have agreed to work collaboratively to align elements of their policies toward the goal of an integrated regional market for low carbon fuels (PCC 2016). California is currently considering program amendments that will likely filter to the other jurisdictions in some form. Additional avenues for credit generation, such as aviation fuel (without conventional aviation fuel generating deficits) and refinery investments, as well as a credit monitoring and verification protocol are under development.
34
+Annual targets after the initial policy ends (after 2020 in CA and BC and after 2026 in OR) are depicted as constant or reflect current proposals (California, from 2020-2030, and in BC, a 2030 target. The calculations for CA and BC are based on current program baselines, which may shift due to modeling updates. *A court ruling froze California’s diesel standard in 2017 until the state remedies its environmental impact analysis regarding NOx emissions. The CA diesel standard will be frozen in at least the 1st quarter of 2018. Sources: OR DEQ, CA ARB, BC Bureau of Energy and Mines, op cit. Figure 19. CI standards in Pacific Coast Collaborative jurisdictions The differing annual standards, CI ratings, and implementing schedules mean fuels may only be attractive in certain jurisdictions.35 For example, different treatment of indirect land use change (iLUC) emissions can make land-based biofuels more attractive for some programs than others. British Columbia does not currently include iLUC in its lifecycle accounting, while California and Oregon do. However, land-based fuels became more attractive in California due to lowered iLUC estimates in a 2016 modeling update. Oregon may offer a more attractive venue for corn-based fuels, since it uses a lower iLUC estimate for corn than California, from using a different model and methodology. Oregon shares California’s other iLUC estimates. Program incentives can be additive for nested jurisdictions: fuels in California and Oregon are subject to both the state-level and the national level policy. The policy value-added for low carbon fuels in California, for example, is the sum of RFS and LCFS incentives. Table 5 takes the example of incentives for soy biodiesel and cellulosic ethanol. Soy biodiesel used in California was eligible for a combined CI policy value of over $1.00 per gallon in 2015-2016. The market nature of the credit prices mean the incentive will fluctuate, but other factors also contribute: the nearly 40% increase in value for 2016 for soy biodiesel was due to higher credit prices, but 35 Producers have an incentive to keep sending fuels where they make the most profit, until the marginal benefit of sending a fuel to the jurisdictions equalizes as much as it can (given physical or other constraints).
35
also a lower CI rating from iLUC modeling changes, and a higher standard due to modeling updates. Incentives for cellulosic ethanol in California were considerable that year, but did not result in any cellulosic liquid fuel used in the state. The state did see increased volumes of landfill biogas (Figure 15), which generates LCFS credits and provided nearly all (about 98%) of RFS cellulosic credits generated that year. Not included in Table 5, but also of note, is the additional financial impetus in California from the carbon cap-and-trade program to use biofuels: the carbon price effectively increases the cost of petroleum fuels relative to biofuels (which are considered carbon-free under the program). The carbon price thus far has remained low, so that this effect has not been strong. As California moves toward a more stringent cap in 2030, however, the effect would also strengthen. Table 5. CA LCFS and RFS Policy Incentives -- Examples
Year LCFS CI Rating (gCO2e/MJ)
LCFS Regulatory CI Standard (gCO2e/MJ)
CA-LCFS Credit Prices ($/MT CO2e)
CA-LCFS Value ($/gal)
RFS RIN Value ($/gal eth equiv, RIN type)
Total Policy Value ($/gal)
Soy biodiesel* (diesel pool)
2014 83.25 97.05
$31 $0.05
$0.50 ($0.78/gal, D4)
$0.83
2015 83.25 97.05 $62 $0.11 $0.70
($1.10/gal, D4) $1.21
2016 50.35 99.97 $90 $0.56 $0.71
($1.11/gal, D4) $1.67
Cellulosic ethanol (gasoline pool)
2016 30 96.5 $90 $0.69 $2.33
(cellulosic waiver+D5)+
$3.02 ($1.77/dge+)
*2016 soy biodiesel CI is approximate (it updates only the land use change number used in the new regulation), and applied only for the part of the year after the transition to the updated modeling occurred). Biodiesel CI varies considerably by feedstock. D4 RINs are compliance instruments for the biomass-based diesel mandate. +Derived as sum of cellulosic waiver credit and advanced fuel (D5) RIN values; this is the amount an obligated party would be willing to pay for a cellulosic credit (since a waiver does not count towards the advanced mandate, but a cellulosic credit does). Market prices for cellulosic RINs began being widely quoted by trade media in 2017. The cellulosic ethanol total policy value is also expressed in dge terms, for greater comparability with the soy biodiesel figures. Sources: (Lade et al. 2015, Burkholder 2015, USDOE 2014, PFL 2016, CARB 2016) The RFS and LCFS also have a more subtle relationship, in that higher credit prices in the one can lead to lower credit prices in the other. The reasons is that both are market-based mechanisms designed to cover costs just enough to meet targets. For example, the RFS incentive may be responsible for making a biofuel available for use in the U.S. If that biofuel is eligible under the LCFS, the additional cost required to bring the fuel to California (that must be covered by the LCFS credit price) is lower than the entire cost of supplying the fuel. Market-based mechanisms likewise can compensate through credit price fluctuations for changes in other policy incentives.
36
Additional Biofuel Policy Incentives Federal Programs Several key U.S. federal programs supporting biofuels have already been mentioned, such as the public support for biomass feedstocks, distribution infrastructure and biorefineries (see section Investment and Costs, above), and a biomass-based diesel blender’s tax credit (see section on Biodiesel). The blender’s credit was part of a suite of tax credits that also included a cellulosic biofuel production credit and a second generation biorefinery depreciation credit. They were repeatedly allowed to expire, and reinstated retroactively in 2010, 2012, 2013, and 2015. They expired in 2016 with no reinstatement. There have been (thus far unsuccessful) efforts to renew or revise elements of the package, including revamping the biomass-based diesel blender’s credit to apply to U.S. producers only. These tax credits provided considerable incentive especially for the delivery of biofuel-based diesel substitutes to the U.S. (including states with additional incentives from low carbon fuel standards like California and Oregon), and likely contributed to their important role in CI policy compliance.
State Programs State-level policy and financial incentives continue to encourage biofuel production and use. The number of states with biofuel related policies or financial incentives has grown since 2012 with all states plus the District of Columbia now represented (USDOE 2016b). Figure 20 shows several types of support as tracked by the Department of Energy: tax incentives, grants and loans, government fleet vehicle or fuel use requirements, fuel standards (CI standards or renewable blend requirements), and biofuel policies or plans (including studies or recommendations) at the state or local level.
‡From 2012 and 2014 E2 Advanced Biofuel Market Reports. * http://www.afdc.energy.gov/laws/ **Includes Washington DC
Figure 20. State Tax Incentives and Policies
0
10
20
30
40
50
60
Tax Incentives Grants andLoans
VehicleAcquisition
and Fuel UseRequirements
Fuel Standards MultipleIncentives**
Biofuel Policiesor Plans
[new category]
Num
ber o
f Sta
tes
2012‡ 2014‡ 2016*
37
Policy Uncertainty The policy incentives have been subject to considerable uncertainty. The on-again-off-again nature of the federal blender’s biomass-based diesel tax credit is a case in point. Under such circumstances, production decisions must be made amid uncertainty about whether the credit will be available and when. Court cases challenging carbon intensity standards, especially the LCFS but also the CFP, add policy uncertainty to the LCFS credit price incentive. One case led to California’s CI target being frozen for several years and again now for the diesel pool (unless ARB remedies its environmental analysis before 2018); other cases are not fully resolved. As yet, the rulings have not appreciably changed the structure of the regulation and have not prevented its implementation. RFS policy uncertainty stems from the annual finalizing of mandates, a process marked by adjustments from original levels, use of waiver authority, and severe delays. The EPA clarified its approach to setting mandates and moved toward the regulatory timeline with the 2017 mandates, but uncertainty was introduced under the new administration’s proposal process for the 2018 mandates. Because both the RFS and CI standard programs allow banking of credits, uncertainty about future conditions also feeds back into current credit prices (which are shaped by expectations of costs to meet the requirement). Policy uncertainty undermines the investment signal sent to the market to incentivize supply of biofuels.
Future Directions As next-generation biofuel production grows more important outside of North America, it will increasingly be important to track the international landscape and market conditions associated with biofuel production. Similarly, feedstock supply, sustainability characteristics, and innovation will also become more important in both North America and internationally as production facilities are built outside of North America, impacting local land-management practices. Tracking the development and implementation of sustainability safeguards for feedstock gathering and use, alongside the growing demand for low carbon fuels (as with the introduction of Canada’s CFS) is important for understanding actual environmental impacts. Innovations for already-existing North American production facilities are likely to come from “bolt-on” technologies. These bolt-on technologies can improve production efficiency by increasing fuel yields through use of cellulosic and non-starch components of conventional feedstocks. Technologies integrated to facilitate processing of cellulosic material and other diverse feedstocks will also impact the carbon intensity of fuels produced in North America. Existing facilities have remained and can continue to remain relevant to policy goals through incremental improvements and process innovations. Incremental improvements for existing biofuels are often overlooked in market reports that focus on breakthrough technologies.
38
Finally, additional “business case” incremental changes to the existing biofuel landscape are worth investigating for their implications for carbon footprints and technology development. These include co-location of facilities with existing biofuel infrastructure (beyond “bolt-on”), retrofits of existing capital stock for newer biofuels, re-use of idle capital stock (in place or dismantled and used elsewhere), and development of new coproducts or general repurposing of production to serve multiple product markets. Diffusion of new technologies or business approaches (e.g., rise of corn oil from corn ethanol plants as a biodiesel feedstock, or bolt-on corn fiber technology) would be important to study, especially to inform near-term biofuel availability estimates. While difficult to track, the accumulation and circulation of human capital – knowledge and labor force – needed to support a low carbon biofuel supply chain would be a fascinating research topic.
Conclusions Despite the considerable incentives that exist to deliver low-carbon biofuels to U.S. markets, substantial investment uncertainty remains due to low oil prices, the lack of a track record for new technologies operating competitively and profitably at commercial scale, and low carbon fuel policy uncertainty. Low oil prices make alternative fuels more dependent on policy support. Investing in unproven technologies supported by subsidies of uncertain magnitude and longevity is a risky endeavor. Without long-term, stable policy signals, greater technology certainty, or both, many investors are unwilling to take the risks necessary to bring substantial volumes of innovative, low-carbon biofuels to market. Compared to 2014 data summarized in the previous report by E2, the biofuel market in North America in 2015 and 2016 reflected less favorable and more uncertain conditions. Investment from both public and private sectors showed declines. Discussions with low-carbon biofuel producers revealed a significant push toward production facilities located outside of North America. A significant number of facilities included in the E2 report fell out of scope due to plans put on hold, lack of available information on the business, or acquisitions. That said, some projects moved into commercial production. For cellulosic fuels, technical difficulties unanticipated by the companies meant production did not scale up to nameplate capacity at stand-alone facilities. For cellulosic ethanol, new announced capacity was rather from smaller volume “bolt-on” corn fiber technologies that can be installed in existing corn ethanol plants. The largest increases in announced capacity through 2018 came from drop-in fuels, in particular hydrotreated renewable diesel. The source of new low-CI rated fuels thus shifted from ethanol to drop-ins compared to the prior report, within largely similar assessments of biofuel capacity in energy terms. More new capacity was categorized as “high end” label (less certain), reflecting the cautious approach of the market to new biofuel endeavors. The trend towards drop-ins echoes findings from a recent LUX report that forecast more rapid growth in drop-in biofuel technologies than bioconversion by 2022 (Green_Car_Congress 2017). Other observed market trends included re-purposing or making use of existing capital stock to expand capacity, either toward biofuels or away from them toward other biobased products; and slow and delayed (from announced plans) ramp-up rates or plant idling at ostensibly complete and
39
commissioning facilities. Biofuel development for aviation stood out in terms of visible partnerships across the supply chain. Environmental groups have been involved in developing and evaluating protocols for feedstock supply, and governments and airlines have invested in specific production facilities and committed to offtake agreements. Policy-generated demand for low CI rated fuels has come from the US RFS – a renewable blending mandate with GHG reduction requirements – and carbon intensity standards in California, British Columbia, starting in 2016 in Oregon, and planned for 2019 in Canada, this last to cover fuels in transportation and other sectors. The policies use market-based mechanisms to reward fuels with a low-CI rating and disincentivize conventional fuels. The incentives are uncertain, however: program credit prices that shape incentive levels have been volatile due to program uncertainty due to court challenges and implementation issues (in addition to market uncertainty from, e.g., fluctuating oil prices), and the programs lack a floor price that might serve as a guarantee for financing. Some of that uncertainty may dissipate over time if the programs remain in place and functioning in a predictable way that is robust to likely political shifts. The programs also differ considerably in terms of their rating systems, and are still developing robust third party monitoring and verification protocols. These factors create a more diverse and potentially confusing market for investors, even as it may open particular markets to particular fuels. The diversity of CI ratings and potential join impact of the policies highlight the importance of continued environmental evaluation of policy impacts, especially as regards their stated aim of lower GHG emissions. Robust safeguards must be in place before heightened demand from similar policies in additional jurisdictions, or breakthrough cost-lowering of technologies significantly increase pressure on potential feedstock supply. Additional government programs – such as loan guarantees – have supplemented the CI policies, and provide a way for the government to target specific companies or fuels, as desired. In the face of slow roll-out of new biofuel technologies, two policy issues have persisted. First, what size and duration of policy incentive is required for reaching low carbon fuel goals? Second, especially for fuels requiring additional distribution infrastructure or new vehicle fleets for greater penetration, does it matter where along the market chain the incentive is introduced?36 This tracking exercise answers neither question, but points up a) difficulties – technical and financial – in establishing new fuel technologies in a short time frame, and b) an apparent market response, in the current policy climate, toward drop-in fuels requiring less additional distribution infrastructure.
36 Economic theory suggests the value should flow where it is needed, if markets are functioning properly (no market failures present). Whether or not this is the case for newer fuels such as E85 has been the subject of considerable academic debate, not yet fully resolved.
40
The exercise also pointed up important related to tracking near-term emerging fuel capacity that can inform interpretation of existing results (in this report and elsewhere) and suggest future research.
• Fuel volumes. The importance of the commissioning process at new facilities, and associated production ramp-up rates is often overlooked. Increasingly, multi-product facilities may make it difficult to gauge realistic ranges of biofuel output. For these reasons, while some tracking assesses the likelihood of planned facilities, it would also be useful to assign some probability to volumes associated with facilities. An important area for research is to better understand the factors that shape the commissioning process, to move towards models that can usefully extrapolate from existing experience to new facilities.
• Capital stock and capital costs. Tracking exercises tend to rely on announced capital costs for greenfield projects, usually provided ex ante. The impact on capital cost of use of existing capital stock such as retrofits and co-locations (or recycled parts from bankrupt plants) deserves further exploration. Unexpected capital costs and added time for commissioning to bring facilities towards full production is likewise not well tracked or understood.
• “Out of scope” transitions. Tracking exercises only sometimes record transitions of biofuel companies. The transition can involve idling (due to technology, market conditions, or company conditions like a merger), permanent shut-down (e.g., bankruptcy), or shift of production focus. The reasons for moving out of scope can hold important information regarding market context that a straight capacity count overlooks through a focus on companies in active planning for biofuel production.
Stakeholders in CI-based policies, including policymakers, want realistic assessments of potential near-term capacity for emerging biofuel facilities. The challenge for research is to respond to an emerging biofuel market that has grown in complexity as it moves from theoretical to real. More accurate fuel volumes and capital costs amid market-driven shifts would feed directly into more accurate per gallon cost estimates (capital and operating) for emerging fuel facilities. This is the critical metric for investors – be they private entities or the public sector looking to structure policy incentives for specific goals. Lessons from companies that drop out of production should be sought, for potential contributions in terms of capital stock – both physical and human – to future efforts.
41
References Anex, R. P., A. Aden, F. K. Kazi, J. Fortman, R. M. Swanson, M. M. Wright, J. A. Satrio, R. C.
Brown, D. E. Daugaard, A. Platon, G. Kothandaraman, D. D. Hsu and A. Dutta (2010). "Techno-economic comparison of biomass-to-transportation fuels via pyrolysis, gasification, and biochemical pathways." Fuel 89: S29-S35.
Bacovsky, D., N. Ludwiczek, M. Ognissanto and M. Wörgetter (2013). Status of Advanced Biofuels Demonstration Facilities in 2012, A Report to IEA Bioenergy Task 39. T39-P1b. http://task39.sites.olt.ubc.ca/files/2013/12/2013_Bacovsky_Status-of-Advanced-Biofuels-Demonstration-Facilities-in-2012.pdf.
BCMEM. (2017). "Renewable and Low Carbon Fuel Requirements Regulation Summary: 2010-2015." British Columbia Ministry of Energy and Mines, from http://www2.gov.bc.ca/assets/gov/farming-natural-resources-and-industry/electricity-alternative-energy/transportation/renewable-low-carbon-fuels/rlcf-007-2015.pdf.
Brandão, M., R. Clift, A. Cowie and S. Greenhalgh (2014). "The Use of Life Cycle Assessment in the Support of Robust (Climate) Policy Making: Comment on “Using Attributional Life Cycle Assessment to Estimate Climate-Change Mitigation …”." Journal of Industrial Ecology 18(3): 461-463.
Brown, T. R., R. Thilakaratne, R. C. Brown and G. Hu (2013). "Techno-economic analysis of biomass to transportation fuels and electricity via fast pyrolysis and hydroprocessing." Fuel 106: 463-469.
Burkholder, D. (2015). A Preliminary Assessment of RIN Market Dynamics, RIN Prices, and Their Effects. Report to USEPA, Office of Transportation and Air Quality Docket EPA-HQ-OAR-2015-0111, https://www.regulations.gov/document?D=EPA-HQ-OAR-2015-0111-0062.
Burkholder, D. (2016). Cellulosic Biofuel Producer Company Descriptions. Memo to EPA Air and Radiation Docket EPA-HQ-OAR-2016-0004, https://www.regulations.gov/document?D=EPA-HQ-OAR-2016-0004-0080.
Burkholder, D. (2016b). April 2016 Assessment of Cellulosic Biofuel Production from Biogas (2017). Memo to EPA Air and Radiation Docket EPA-HQ-OAR-2016-0004, https://www.regulations.gov/document?D=EPA-HQ-OAR-2016-0004-0080.
CARB. (2016). "Monthly LCFS Credit Transfer Activity Report for December 2015." California Air Resources Board, from https://www.arb.ca.gov/fuels/lcfs/credit/20160112_deccreditreport.pdf.
CARB (2017). LCFS Program Data. http://www.arb.ca.gov/fuels/lcfs/dashboard/quarterlysummary/media_request_011717.xlsx.
CARB (2017b). California Air Resources Board. LCFS Quarterly Program Data. https://www.arb.ca.gov/fuels/lcfs/dashboard/fig2_041917.xlsx.
Carter, E. (2016). U.S. Biodiesel/Renewable Diesel Market - Factors Driving Change, USDA, Office of Glabal Analysis, Foreign Agricultural Service. Washington, D.C. https://www.usda.gov/oce/energy/files/US_Biodiesel_RD_MarketJul2016.pdf.
CEC (2016). Alternative and Renewable Fuel and Vehicle Technology Program (ARFVTP). http://www.energy.ca.gov/drive/projects/index.html.
CTG (2016). Industry Investment Data- Clean Tech Group. Dale, B. E. and S. Kim (2014). "Can the Predictions of Consequential Life Cycle Assessment Be
Tested in the Real World? Comment on “Using Attributional Life Cycle Assessment to Estimate Climate-Change Mitigation...”." Journal of Industrial Ecology 18(3): 466-467.
de Jong, S., R. Hoefnagels, A. Faaij, R. Slade, R. Mawhood and M. Junginger (2015). "The feasibility of short-term production strategies for renewable jet fuels - a comprehensive techno-economic comparison." Biofuels Bioproducts & Biorefining-Biofpr 9(6): 778-800.
E2 (2014). E2 Advanced Biofuel Market Report 2014, Environmental Entrepreneurs. EIA (2015). New biofuels eliminate need for blending with petroleum fuels. Today in Energy, 9
November. https://www.eia.gov/todayinenergy/detail.cfm?id=23692#. EIA (2016b). Monthly Energy Review –Feb. 2016; Topic 10.4 Biodiesel and other renewable
fuels overview. Energy Information Administration, US Department of Energy, Washignton, DC. http://www.eia.gov/totalenergy/data/monthly/.
EIA (2016c). Petroleum and Other Liquids – US Imports by Country of Origin. http://www.eia.gov/dnav/pet/pet_move_impcus_a2_nus_EPOORDO_im0_mbbl_a.htm.
EPA (2015). "40 CFR Part 80. Renewable Fuel Standard Program: Standards for 2014, 2015, and 2016 and Biomass-Based Diesel Volume for 2017; Final Rule. https://www.gpo.gov/fdsys/pkg/FR-2015-12-14/pdf/2015-30893.pdf." Fed. Reg. 80(239): 77420.
Energy." from http://www.statcan.gc.ca/pub/57-003-x/2017002/t010-eng.htm. Green_Car_Congress. (2017). "Lux Research forecasts global biofuels output to rise to 67B GPY
in 2022; advanced biofuels will nearly double to 9.6B GPY." from http://www.greencarcongress.com/2017/02/20170214-lux.html.
GREENEA. (2015). "Is HVO the Holy Grail of the world biodiesel market?", from http://www.greenea.com/en/articles/category/2-biofuel.html?download=83:is-hvo-the-holy-grail-of-the-world-biodiesel-market.
Hamje, H. D. C., H. Hass, L. Lonza, H. Maas, A. Reid, K. D. Rose and T. Venderbosch (2014). EU renewable energy targets in 2020: Revised analysis of scenarios for transport fuels, European Commission Joint Research Centre, JEC Biofuels Programme. Available at: https://www.concawe.eu/uploads/Modules/Publications/jec_biofuels_2013_report_final.PDF.
Hammel, D. (2016). Cleaner Skies are Friendlier Skies: NRDC's 2016 Aviation Biofuel Scorecard. R: 16-05-D. https://www.nrdc.org/sites/default/files/aviation-biofuels-sustainability-report-2016.pdf.
Hertwich, E. (2014). "Understanding the Climate Mitigation Benefits of Product Systems: Comment on “Using Attributional Life Cycle Assessment to Estimate Climate-Change Mitigation…”." Journal of Industrial Ecology 18(3): 464-465.
IEA (2016). Database on facilities for the production of advanced liquid and gaseous biofuels for transport, IEA Bioenergy Task 39. Commercializing Liquid Biofuels from Biomass. http://demoplants.bioenergy2020.eu/.
IRENA (2016). Innovation Outlook: Advanced Liquid Biofuels, In ternational Renewable Energy Agency, Abu Dhabi. http://www.irena.org/DocumentDownloads/Publications/IRENA_Innovation_Outlook_Advanced_Liquid_Biofuels_2016.pdf.
Irwin, S. and D. Good (2017). "On the Value of Ethanol in the Gasoline Blend." farmdoc daily 7(48): Department of Agricultural and Consumer Economics, University of Illinois. http://farmdocdaily.illinois.edu/2017/2003/on-the-value-of-ethanol-in-the-gasoline-blend.html.
Lade, G. E., C. Y. Cynthia-Lin and A. Smith (2015). "Ex post costs and renewable identification number (RIN) prices under the Renewable Fuel Standard." Resources for the Future Discussion Paper 15-22.
Lane, J. (2016b). Tesoro makes its move on renewable biocrude. Biofuels Digest. http://www.biofuelsdigest.com/bdigest/2016/01/21/tesoro-makes-its-move-on-renewable-biocrude/.
Lane, J. (2016c). Where is Your Money Going? The Mess at USASpending.Gov. Biofuels Digest. http://www.biofuelsdigest.com/bdigest/2016/12/31/where-is-your-money-going-the-mess-at-usaspending-gov/.
Lane, J. (2016d). Coskata’s technology re-emerges as Synata Bio. Biofuels Digest. http://www.biofuelsdigest.com/bdigest/2016/01/24/coskatas-technology-re-emerges-as-synata-bio/.
Lane, J. (2017). The Need for Speed: POET-DSM’s Project Liberty advances on yield and cost, but still seeking rate. Biofuels Digest. http://www.biofuelsdigest.com/bdigest/2017/02/19/the-need-for-speed-poet-dsms-project-liberty-advances-on-yield-and-cost-but-still-seeking-rate/.
Li, Q., Y. Zhang and G. Hu (2015). "Techno-economic analysis of advanced biofuel production based on bio-oil gasification." Bioresource Technology 191: 88-96.
LUX (2016). Uncovering the Cost of Cellulosic Ethanol Production- State of the Market Report, LUX Research - as cited in: http://www.biobasedpress.eu/2016/02/cellulosic-ethanol-feedstock-costs-predominant-sugar-cane-cheapest/.
National_Biodiesel_Board (2015). Personal Communication. NSAC (2015). "Millions Available for Production of Second-Generation Biofuels." National
Sustainable Agriculture Coalition Blog August 28, http://sustainableagriculture.net/blog/bcap-project-funding/.
NSAC (2015b). "Year-End Funding Bill a Mixed Bag." National Sustainable Agriculture Coalition Blog December 16, http://sustainableagriculture.net/blog/fy16-omnibus/.
ORDEQ. (2016). "Oregon Clean Fuels Program Quarterly Data." from http://www.oregon.gov/deq/FilterDocs/cfpQ42016data.xls.
Ou, L., T. R. Brown, R. Thilakaratne, G. Hu and R. C. Brown (2014). "Techno-economic analysis of co-located corn grain and corn stover ethanol plants." Biofuels Bioproducts & Biorefining-Biofpr 8(3): 412-422.
Pearlson, M., C. Wollersheim and J. Hileman (2013). "A techno-economic review of hydroprocessed renewable esters and fatty acids for jet fuel production." Biofuels Bioproducts & Biorefining-Biofpr 7(1): 89-96.
PFL. (2016). "PFL RIN Report." Progressive Fuels Limited, from http://www.progressivefuelslimited.com/.
Plevin, R. J., M. A. Delucchi and F. Creutzig (2014). "Using Attributional Life Cycle Assessment to Estimate Climate-Change Mitigation Benefits Misleads Policy Makers." Journal of Industrial Ecology 18(1): 73-83.
Schwab, A., J. Geiger and J. Lewis (2015). 2013 Survey of Non-Starch Ethanol and Renewable Hydrocarbon Biofuels Producers, NREL/TP- 6A10--63389. http://www.nrel.gov/docs/fy15osti/63389.pdf.
Schwab, A., E. Warner and J. Lewis (2016). 2015 Survey of Non-Starch Ethanol and Renewable Hydrocarbon Biofuels Producers, NREL/TP- 6A10-65519. www.nrel.gov/docs/fy16osti/65519.pdf.
Seber, G., R. Malina, M. N. Pearlson, H. Olcay, J. I. Hileman and S. R. H. Barrett (2014). "Environmental and economic assessment of producing hydroprocessed jet and diesel fuel from waste oils and tallow." Biomass and Bioenergy 67: 108-118.
Sherbacow, B. (2015). AltAir Fuels: Paramount, CA GreenJet Refinery. Future of Alternative Aviation Fuels Workshop, City of Santa Monica: https://www.smgov.net/uploadedFiles/Departments/Airport/Sustainability/20150126_AltAir_Presentation.pdf.
Staples, M. D., R. Malina, H. Olcay, M. N. Pearlson, J. I. Hileman, A. Boies and S. R. H. Barrett (2014). "Lifecycle greenhouse gas footprint and minimum selling price of renewable diesel and jet fuel from fermentation and advanced fermentation production technologies." Energy & Environmental Science 7(5): 1545-1554.
Thurmond, W. (2016). "Drop In Fuels 2020: A Global Market Survey." from http://www.emerging-markets.com/dropinfuels/.
UNCTAD (2016). Second Generation Biofuel Markets: State of Play, Trade and Developing Country Perspectives, United Nations Conference on Trade and Development. http://unctad.org/en/PublicationsLibrary/ditcted2015d8_en.pdf.
USAspending (2016). "Federal grant, loan, and financial assistance awards: https://www.usaspending.gov/Pages/AdvancedSearch.aspx?k=biofuels."
USDA (2015). USDA to Invest Up to $100 Million to Boost Infrastructure for Renewable Fuel Use, https://www.usda.gov/wps/portal/usda/usdahome?contentid=2015/05/0156.xml.
USDOE (2014). Fuel Properties Comparison, Alternative Fuels Data Center. https://www.afdc.energy.gov/fuels/fuel_comparison_chart.pdf.
USDOE (2016). Funding Opportunity Announcement: MEGA-BIO: Bioproducts to Enable Biofuels, Office of Energy Efficiency & Renewable Energy. FOA Number: DE-FOA-0001433. https://eere-exchange.energy.gov/FileContent.aspx?FileID=6bdf602f-a414-4360-888c-745f6c0c2d46.
USDOE (2016b). Federal and State Laws and Incentives, Alternative Fuels Data Center. http://www.afdc.energy.gov/laws/.
USEPA (2016). 2016 Renewable Fuel Standard data, from; https://www.epa.gov/fuels-registration-reporting-and-compliance-help/2016-renewable-fuel-standard-data.
Warner, E., A. Schwab and D. Bacovsky (2017). 2016 Survey of Non-Starch Alcohol and Renewable Hydrocarbon Biofuels Producers. NREL & Bioenergy 2020+ GmbH, NREL/TP- 6A10-67539. http://www.nrel.gov/docs/fy17osti/67539.pdf.
Zhao, X., T. R. Brown and W. E. Tyner (2015). "Stochastic techno-economic evaluation of cellulosic biofuel pathways." Bioresource Technology 198: 755-763.
Biofuel Production Capacity Reports and Assessments - Freely Available Sources37 The NREL reports focus on producers of non-starch ethanol and renewable hydrocarbon biofuels and exclude feedstock and conversion technology suppliers (Schwab et al. 2015, Schwab et al. 2016, Warner et al. 2017). Information on status (idle, operational, planned) and scale (pilot, demonstration or commercial), as well as feedstock and technology pathway is presented. Capacity information is shown for commercial facilities in all the reports. The most recent report also includes information on international companies and where companies are targeting multiple output markets. The International Renewable Energy Agency’s “Innovation Outlook: Advanced Liquid Biofuels” IRENA (2016) includes a project inventory annex, available online as an Excel spreadsheet.38 It includes information from a variety of sources on capacity, including project status, scale, and technological scale, as well as employment figures, where available. The report itself also includes an assessment of feedstocks, and reviews the outlook for biofuel innovations to mid-century, and explores technical as well as non-technical barriers to “advanced” biofuel penetration. The IEA Bioenergy Task 39 advanced biofuel facilities database is maintained by Bioenergy 2020+ GmbH and relies primarily on self-reported company data with some vetting by Bioenergy 2020+ (Bacovsky et al. 2013).39 It focuses on facilities that produce cellulosic ethanol, renewable or drop-in hydrocarbons, butanol and bio-oil and includes information on feedstock, technology, technology readiness level (pilot, demonstration, commercial scale demo), operational or planning/construction status, and capacity. We obtained the August 2016 version of the database from Bioenergy 2020+ GmbH and filtered for North American facilities.40 Genscape deals in market intelligence for commodities and energy and has a division that provides quality assurance and RIN verification and monitoring for biofuels. They maintain a biofuel producer industry database at the facility level and include capacity, feedstock type, EMTS registered fuel type and operational status (Genscape 2016).41
37 Not meant to be comprehensive. 38http://www.irena.org/DocumentDownloads/Publications/IRENA_project_Inventory_Advanced_Liquid_Biofuels_2016.xlsx 39 The database can be viewed but is not downloadable: http://demoplants.bioenergy2020.eu/index.html. 40 Dina Bacovsky ([email protected]) emailed the August 2016 version as an Excel file. 41 Fuel types include cellulosic ethanol, non-ester Renewable Diesel, biogas (as cellulosic biofuel), and biodiesel.
The EPA sets renewable fuel volumes every year for the RFS program and considers, among other factors, domestic and foreign production capacity. For biomass-based diesel, volume is restrained for biodiesel by limited storage and retail fueling facilities, B5 blend limits for a large portion of diesel engine inventory, and for renewable diesel by global production capacity (EPA 2015). For cellulosic biofuels, the EPA tracks the small number of cellulosic ethanol facilities in the US and estimates their commercial production capacity, as well as biogas facilities currently registered for cellulosic biofuel production (Burkholder 2016, Burkholder 2016b). The attempt to discern feasible commercial production limits rather than nameplate capacity is a laudable trend. The United Nations Conference on Trade and Development (UNCTAD) released a report in early 2016 that looked at “State of Play” of second-generation biofuels. Second-generation was defined as those fuels produced from ligno-cellulosic feedstocks (UNCTAD 2016). Cited data sources include trade publications and public databases (Ethanol Producer Magazine, Biofuels Digest, IEA Task 39 database and the European Biofuels Technology Platform) but does not include individual company survey or facility vetting for viability. Information on individual facilities includes capacity (existing and planned but not operational status), and technology readiness levels (TRL) (e.g., pilot, demo, commercial). For commercial scale, only ethanol facilities were identified (i.e., no renewable hydrocarbon facilities using ligno-cellulosic feedstocks). The Ethanol Producer Magazine has an online list of ethanol facilities in North America including those that produce cellulosic ethanol (EtOH_Mag 2016). Included are capacity, feedstock type, and whether the facility is existing, proposed or under construction.