Page 1
Environment for Development
Discussion Paper Series July 2013 EfD DP 13-08
Biofuels, Economic Growth, and the External Sector in Ethiopia
A Computable General Equilibrium Analysis
Tade le Fe rede , Zenebe Gebreegz iabher , Al em u Mekonnen,
Fan tu Gut a , Jörgen Lev in , and Gunnar Köhl i n
Page 2
Environment for Development
The Environment for Development(EfD) initiative is an environmental economics program focused
on international research collabouration, policy advice, and academic training. It supports centers in Central
America, China, Ethiopia, Kenya, South Africa, and Tanzania, in partnership with the Environmental
Economics Unit at the University of Gothenburg in Sweden and Resources for the Future in Washington, DC.
Financial support for the program is provided by the Swedish International Development Cooperation Agency
(Sida). Read more about the program at www.efdinitiative.org or contact [email protected] .
Central America Research Program in Economics and Environment for Development in Central America Tropical Agricultural Research and Higher Education Center (CATIE) Email: [email protected]
China Environmental Economics Program in China (EEPC) Peking University Email: [email protected]
Ethiopia Environmental Economics Policy Forum for Ethiopia (EEPFE) Ethiopian Development Research Institute (EDRI/AAU) Email: [email protected]
Kenya Environment for Development Kenya Kenya Institute for Public Policy Research and Analysis (KIPPRA) University of Nairobi Email: [email protected]
South Africa Environmental Economics Policy Research Unit (EPRU) University of Cape Town Email: [email protected]
Tanzania Environment for Development Tanzania University of Dar es Salaam Email: [email protected]
Page 3
Discussion papers are research materials circulated by their authors for purposes of information and discussion. They have
not necessarily undergone formal peer review.
Biofuels, Economic Growth, and the External Sector in Ethiopia:
A Computable General Equilibrium Analysis
Tadele Ferede, Zenebe Gebreegziabher, Alemu Mekonnen, Fantu Guta,
Jörgen Levin, and Gunnar Köhlin
Abstract
In this study, we assess the economy-wide effects of biofuel investment in Ethiopia, with a
focus on the external sector. The Government of Ethiopia has been revising its energy policy to switch
from imported fossil oil to domestically produced biofuels, partly in response to climate change and
partly in response to rising world oil prices, which leave oil-importing countries such as Ethiopia
vulnerable to external oil price shocks. In Ethiopia, the value of oil imports relative to export earnings
has increased over time, which has negatively impacted its balance of payments. Specifically, this paper
assesses the implications of biofuels investment for growth and the external sector in Ethiopia using a
dynamic recursive computable general equilibrium (CGE) model. The study is based on primary data
collected from biofuel firms in Ethiopia and assumes that the amount of land is fixed in a given period.
The results indicate that the macroeconomic and sectoral effects of biofuel investment in the context of
Ethiopia are mixed. Biofuel expansion can help to improve economic growth if such expansion
generates spillover effects, with jatropha and castor bean found to have the strongest positive impact on
the economy. Without spillovers, the effect of biofuel investment on economic growth is negligible,
indicating the importance of technology transfers. The impact on the external sector, especially on
exports and imports, is negative, as biofuels expansion affects both the real exchange rate and
production of export commodities. This negative effect might be mitigated by policies encouraging
biofuels investment to move in a direction that does not compete with the use of land for traditional
export crops.
Key Words: biofuels, CGE model, economic growth, external sector, Ethiopia
JEL Codes: O11, O2, O47, O55, Q42
Page 4
Environment for Development Ferede et al.
Contents
Introduction ............................................................................................................................. 1
An Overview of the External Sector in Ethiopia.................................................................. 5
Literature Review ................................................................................................................... 6
The Model ................................................................................................................................ 9
Structure and Assumptions of the Dynamic CGE Model ................................................... 9
Data ................................................................................................................................... 11
Scenarios ................................................................................................................................ 14
Discussion of Results ............................................................................................................. 16
Macroeconomic and Sectoral Impacts of Biofuels ........................................................... 16
Effects of Biofuels on the External Sector ........................................................................ 17
Conclusions and Implications .............................................................................................. 18
References .............................................................................................................................. 21
Tables and Figures ................................................................................................................ 26
Page 5
Environment for Development Ferede et al.
1
Biofuels, Economic Growth, and the External Sector in Ethiopia:
A Computable General Equilibrium Analysis
Tadele Ferede, Zenebe Gebreegziabher, Alemu Mekonnen, Fantu Guta, Jörgen Levin,
and Gunnar Köhlin
Introduction
Using primary data collected from biofuel firms, this paper uses a computable general
equilibrium (CGE) model to assess the implications of biofuels investment for growth and the
external sector in Ethiopia. The results are mixed. Biofuel expansion can improve economic
growth if such expansion generates spillover effects, with jatropha and castor bean found to have
the strongest positive impact on the economy. Without spillover effects, such as technology
transfers, the effect of biofuel investment on economic growth is negligible. The impact on the
external sector, especially on exports and imports, is negative, as biofuels expansion affects both
the real exchange rate and production of export commodities. Our model takes the amount of
land as fixed in a given period; therefore, the negative effect on exports might be mitigated by
policies encouraging biofuels investment to proceed in a way that does not compete for land with
traditional export crops.
Given the volatility and the recent all-time high of world oil prices, biofuels have
received a great deal of attention globally, and many countries have embarked on producing
biofuels. The surge in biofuel investments is driven mainly by two fundamental factors: market
Tadele Ferede, Department of Economics, Addis Ababa University.
Zenebe Gebreegziabher (corresponding author), email: [email protected] , Department of Economics,
Mekelle University, P.O. Box 451, Mekelle, Tigrai, Ethiopia and Environmental Economics Policy Forum for
Ethiopia (EEPFE), Ethiopian Development Research Institute (EDRI), P.O. Box 2479, Addis Ababa, Ethiopia.
Alemu Mekonnen, Department of Economics, Addis Ababa University.
Fantu Guta, Department of Economics, Addis Ababa University.
Jörgen Levin, Swedish Business School, Örebro University.
Gunnar Köhlin, Department of Economics, University of Gothenburg.
The authors gratefully acknowledge financial support for this work from Formas/Sida (Swedish International
Development Cooperation Agency) and Sida through the Environment for Development (EfD) Initiative,
Department of Economics, University of Gothenburg. The authors also thank the EDRI (Ethiopian Development
Research Institute) for providing us with the 2005/06 SAM of Ethiopia.
Page 6
Environment for Development Ferede et al.
2
developments and policy levers (Huang et al., 2012). Fossil fuel imports consume a huge
proportion of foreign exchange, especially for oil-importing countries, which affects their
balance of payments. Biofuels are among the options considered as substitutes for conventional
energy sources in the sense that they are renewable and relatively cleaner. Biofuels are
considered an important source of clean energy that provide employment opportunities, enhance
agricultural productivity, and increase the prospects for the agricultural sector, which has
suffered low prices for its products for several decades. In terms of food security, the main
concern is to beef up cereal production, which is the main staple for the majority of the world’s
population (MoARD, 2010).
There are both optimistic and pessimistic views surrounding the development of biofuels.
Some are even more skeptical and see it as land grabbing and as the new scramble for Africa
(ABN, 2007). There are concerns that land and labour mobilization in the biofuel sector will be
taken away from food and cash crop production, which will have a considerable impact on
domestic food production and on export crops. According to the optimistic view, allocation of
land to biofuel crops will not affect food production because biofuel crops are grown in areas not
occupied by smallholders or on land not suitable for cereal production. According to this view,
biofuel crops can be planted and grown on arable and marginal lands that are not under cultivation.
In addition, biofuel production can enhance agricultural productivity through technology
spillover effects and other inputs (van Rheenen and Olifinbiyi, 2007). In addition, biofuels are
expected to provide some new market and income opportunities for poor farmers in Africa,
particularly for those whose livelihoods depend largely on agriculture (FAO, 2008; Arndt et al.,
2010b). However, the opponents of this view argue that there is no land which simply sits idle,
since land is used for grazing, forests, or other purposes. When land is allocated to biofuel crops,
both livelihood and environmental implications should be taken into account (Barbara, 2007; Moges,
2010). According to this view, the economic and environmental impacts of biofuel farms,
especially in food insecure and fragile areas, can be quite worrisome. The debate on the
opportunities created and challenges posed by biofuel production is still ongoing (Azar, 2011;
Janda et al., 2011).
The Government of Ethiopia (GoE) considers biofuels an opportunity for enhancing food
security and energy security. In particular, development of biofuels has been considered key in
terms of meeting the growing energy demand in the country and reducing the dependence on
imported fossil fuel, which consumes close to 70% of export earnings (MoME, 2007). In
addition, it is argued that biofuels can enhance the export sector (Lakew and Shiferaw, 2008).
The government of Ethiopia has been promoting biofuel investments by inviting national and
Page 7
Environment for Development Ferede et al.
3
foreign-based companies to invest in biofuel development projects in the country (Moges, 2010;
Lakew and Shiferaw, 2008).
Ethiopia is said to have tremendous potential for biofuels (ethanol and biodiesel)
production. Some estimates put the potential area of land suitable for production of bio-diesel
feedstock at about 25 million hectares (Gebremeskel and Tesfaye, 2008). Currently, there are
biofuel investment activities in different parts of Ethiopia aimed at the production of ethanol and
bio-diesel. The government of Ethiopia has shown interest in and provided various incentives for
such investment in various parts of the country. The biofuel sector not only seems promising in
addressing the energy security issue but also creates more jobs and income that could support the
country’s goal of poverty reduction. There are reports that indicate over 500,000 hectares of land
has already been offered for biofuels investment (ABN, 2007; Lashitew, 2008). Jatropha, castor
bean and palm (oil) are the main biofuel crops that are being developed, particularly in the case
of bio-diesel, and both foreign and domestic companies are involved (Lakew and Shiferaw,
2008; Gebreegziabher et al., 2013). In the case of ethanol production, the feedstock comes
primarily from large-scale sugarcane plantations and the sugar byproduct molasses is the most
favorable feedstock for large-scale ethanol production. The country has four sugar factories,
namely Wonji-Shoa, Metahara, Fincha, and Tendaho, of which only one, i.e., Fincha, currently
has an ethanol production plant. However, the government has plans to establish a new sugar
factory with a production capacity of 106,000 tons of sugar per annum and has commissioned the
expansion of the existing factories to include ethanol production plants. Ethanol production in
recent years has almost doubled, increasing to 15,000 cubic meters. However, this is below an
earlier projection that the country’s ethanol production would increase from 8,000 cubic meters
to 80,000 cubic meters by the year 2011 (Gebremeskel and Tesfaye, 2008). This slower-than-
projected growth might be due to delays in the upcoming new sugar factories.
One of the justifications for encouraging the expansion of biofuels in Ethiopia is the
possibility of saving scarce foreign currency that is used to import fossil fuels and shifting from
high-cost fossil oil to cost-effective biofuels (MoME, 2007). The value of the country’s oil
imports has increased substantially over time. For instance, the value of oil imports relative to
export earnings of the country has increased from 52.7% percent in 2000/1 to 66.9% in 2010/11.
The high cost of oil imports has aggravated the country’s balance of payments problem, and has
serious repercussions on the macroeconomic stability of the country.
Although net food production (net output) per capita increased from Birr 310.4 in 2001/2
to Birr 534.3 in 2010/11, the portion of the population living in food poverty is still high. For
instance, about 33.6% of the total population was food poor in 2010/11, and the figure is higher
Page 8
Environment for Development Ferede et al.
4
in rural areas (34.7%) compared with urban areas (27.9%) (MoFED, 2012). Because domestic
food production is limited, the country depends on imported food items to meet the domestic
food demand. The share of food imports increased from 6.2% of the total import bill in 2000/01
to 11% in 2010/11.
The Ethiopian economy has witnessed double digit growth (i.e., 11.2% growth in real
GDP) and impressive gains both in agriculture and export crops production over the last few
years (MoFED, 2010; NBE, 2010). This growth performance is also said to effectively surpass
the 7% annual rate required for attaining the MDG of halving poverty by 2015 (ADBG, 2010).
However, despite these impressive gains, food self-sufficiency still remains a challenge and a
significant proportion of the population still depends on food aid. Food aid accounted for an
amount equal to about 10% of domestic food production over the last two to three decades
(Gebreegziabher et al., 2012).
Given the inconclusiveness of the research and debates on the benefits and costs of
biofuels investment, it is imperative to investigate the growth effects and external sector effects
of biofuels investment. This is especially important for a low-income country such as Ethiopia
that has a food deficit, imports fuel, and has a balance of payments deficit. More specifically, this
study attempts to answer the following questions: Will biofuel investment contribute toward
economic growth? What are the likely effects of biofuel investment on the country’s exports and
imports? How does biofuel investment impact the country’s balance of payments? Hence, it is of
interest to investigate these issues as well as the economy-wide implications of the country’s
involvement in large scale biofuels investments.
The main objective of this study is to investigate the implications of biofuel investment
for growth and the external sector in Ethiopia. This study is based on a survey of biofuel firms in
Ethiopia; the information so generated is used to generate some parameters and other
technological coefficients. In addition, the primary data is used to introduce key biofuel sectors
in the social accounting matrix of Ethiopia.
The rest of the paper is organized as follows. The next section presents an overview of
the external sector. The section that follows provides a review of relevant literature. After that,
the model is discussed, including the dynamic structure of the CGE model, and data and context
are outlined. Simulations are then presented, followed by a discussion of results. The last section
concludes.
Page 9
Environment for Development Ferede et al.
5
An Overview of the External Sector in Ethiopia
Both exports and imports have increased since 1991/92. The volume of exports increased
from 126.3 thousand metric tons in 1991/92 to 1.3 million metric tons in 2011/12, a rate of 9.9%
per year (Table 1). Likewise, the quantity of imports increased from 546.3 thousand tons to 8.3
million tons, growing at a rate of 8.8% per year. Similarly, while the share of exports in GDP
increased from 1.34% in 1991/92 to 8.7% in 2011/12, imports increased from 17.7% to 25.4%. A
look at the structure of imports reveals that fuel imports accounted for a significant share
(28.5%) of the total import bill between 1991/92 and 2011/12 (Table 2 and Figure 1). Fuel
imports also accounted for, on average, half of the total value of exports and 3.1% of GDP over
the same period (Table 2 and Figures 1 and 2). In addition, the evolution of the exchange rate
also matters for exports and imports. In particular, the real effective exchange rate displays
different trends, especially since 2006/07 (Figure 3). First, the real exchange rate sharply
increased between 2006/7 and 2009/10 and reached its peak in 2009/10. Second, it started to
decline between 2010/11 and 2011/12. Finally, it increased in 2012/13. The appreciation of the
real exchange rate since 2006/7 was due to rising inflation in the country. The rate of inflation
has been very high compared with that of the country’s major trade partners. This appreciation of
the real exchange rate negatively impacts the country’s exports as it erodes the competitiveness
of exports.
Taken together, this puts pressure on the country’s balance of payments. For instance,
trade balance worsened from 15% of GDP in 2001/02 to 17% in 2010/11 (Figure 4). Apart from
increasing the quantity and type of exports, the Government of Ethiopia also aims at reducing the
quantity of imports, especially fuel imports. In so doing, biofuel development has been
considered one of the key strategies for substituting imported fuel, as articulated in the country’s
Biofuels Development and Utilization Strategy (MoME, 2007).
The Government of Ethiopia considers biofuels an opportunity for enhancing food
security and meeting the growing energy demand in the country, thereby saving scarce foreign
exchange. The GoE has already started blending gasoline; the current ethanol to gasoline ratio is
10:90, i.e., 10% ethanol and 90% gasoline. As indicated in the strategy, this ratio would
gradually increase to 25% by 2015. Note that biofuel investment can also potentially improve
domestic food production, especially through technological transfer such as improved farm
inputs, training, credit, etc. (Moges, 2010; Negash, 2012). Biofuel investment also can enhance
food security through the sale of biofuels crops to buy food, i.e., through trade entitlements
(Bernstein et al., 1992).
Page 10
Environment for Development Ferede et al.
6
Literature Review
The world has witnessed a sharp increase in global production of biofuels, especially in
the new millennium. However, globally, only few countries dominate the domestic use and
export of biofuels (Slater, 2007). The United States and Brazil are the largest producers of
ethanol, accounting for over 80 percent of the world’s total production. The EU, on the other
hand, produces almost 80 percent of the world’s biodiesel (FAPRI, 2010). The future largest
increases in production volumes are expected in Brazil, the US, the EU, China, India, Indonesia
and Malaysia. By 2030, the total annual global production of biofuels is projected to increase to
92 Mtoe1 under a reference scenario and to 147 Mtoe under an alternative policy scenario (IEA,
2006). Global biofuels consumption is projected to grow four-fold over the next two to three
decades, accounting for 8% of transport fuel demand by 2035, up from 3% now (IEA, 2010).
Several countries have encouraged this growth through government policies, such as mandates,
targets and subsidies, which are justified on the grounds of energy security and climate change
considerations. Some researchers argue that these government policies are the main drivers of the
sharp increase in global biofuels production, although high oil price might have contributed to
this growth (Janda et al., 2011). In addition, there are concerns about the socio-economic impacts
of biofuel production. However, there are few studies conducted to assess these issues and
quantify the impacts of biofuels production on growth and poverty reduction. One reason for
this, according to World Watch Institute (2007), is that it is quite challenging to quantify the
benefits of biofuels compared to oil fuels because this calls for assigning prices to effects such as
climate benefits, air quality, human health, and sustainability of energy source. The limited
literature available on biofuels can be classified into three groups.
The first line of research attempts to analyse the impact of biofuel production on global
trade, growth, income distribution, and poverty (Gebreegziabher et al., 2013; Arndt et al., 2010a,
2010b; Arndt et al., 2009; Peskett et al., 2007; Ugarte et al., 2007; Dufey, 2006; Birur et al., 2008
and Bouët et al., 2010). Ugarte et al. (2007) argue that the use of agricultural feedstock to
produce bioenergy and bioproducts opens an opportunity for agriculture to increase net farm
income, reduce government payments, and be an engine for rural economic development. Arndt
et al. (2009, 2010a) appears to be the only research work that quantitatively estimated the effect
of biofuel investments on growth, external sector, food security and poverty, using a dynamic
1Mtoe stands for Metric ton of oil equivalent.
Page 11
Environment for Development Ferede et al.
7
computable general equilibrium for Mozambique and Tanzania. Arndt et al. (2009) indicate that
biofuel investment increases growth and helps poverty reduction depending on the type of
technology used in production. They find that biofuels production enhances growth and poverty
reduction, amid some displacement of food crops by biofuels. Specifically, they find that,
depending on the production technology, biofuels production increases Mozambique’s annual
economic growth by about 0.6 percentage points and reduces the incidence of poverty by about 6
percentage points, over a 12-year phase-in period. They also study the out-grower system, in
which biofuels firms contract with smallholder farmers to grow biofuel feedstock on the farmers’
land. They find that this out-growers approach to producing biofuels is more pro-poor, as
compared to the more capital-intensive plantation approach, due to the greater use of unskilled
labour and accrual of land rents to smallholders. Specifically, the effect of the out-grower
scheme on growth and poverty reduction is greater in magnitude because it increases the income
of small land holders and increases the rental value of their land. However, their results are not in
favor of unrestrained biofuels development, and suggest that a carefully designed and managed
biofuels policy holds the potential for substantial gains. Arndt et al. (2010a), for the case of
Tanzania, showed that biofuels investment contributes positively to poverty reduction. They also
argue that producing biofuels will contribute to achieving the country’s overall development
objectives.
In regard to the effects of biofuels investment on the external sector, Arndt et al. (2010a)
found expansion of biofuels crops has negative impacts on non-biofuels exports in the case of
Tanzania. Because the current account balance is fixed in foreign currency in the model,
increases in exports such as biofuels cause real exchange to appreciate relative to the baseline.
This reduces the competitiveness of traditional export crops, which results in negative impacts.
They also find that farmers reallocate land away from export crops to food production. Peskett et
al. (2007) argue that WTO negotiations might affect biofuels markets and developing countries
and that this needs to be assessed. Dufey (2006) argues that current trading conditions and the
threat of protectionism could possibly be undermining developing countries’ competitiveness in
biofuels production, leading, in turn, to inefficiency and negative environmental and social
outcomes. She emphasizes that, among others tariff barriers, the key issues to be addressed at the
international level include the tariff escalation systems in many industrialised countries, which
encourage developing countries to export the feedstocks and unprocessed crude oils while the
final biofuel conversion takes place in the importing country. Bouëtet et al. (2010) also look at
the global trade impacts of biofuel (ethanol) policies for transportation in the United States and
in the European Union with and without ethanol trade liberalization. They find that the effect of
Page 12
Environment for Development Ferede et al.
8
trade liberalization is more significant for the EU, given that a substantial share of ethanol is
already imported in the reference scenario. They also find that the main benefits from trade
liberalization accrue to Brazil, especially for exports to both the United States and the EU. Their
results also imply that, following the implementation of the new mandates, the demand for these
feedstocks increases and puts pressure on food markets. In their research, domestic production of
maize in the United States, as well as sugarcane in Brazil and in the Latin American and
Caribbean region, increases by more than 20 percent compared to the baseline scenario. When
import barriers are removed in the EU and the United States, Brazilian production of sugarcane
is particularly augmented, while US production of maize and EU production of sugar beet
increase by a lesser magnitude as compared to the more domestic-oriented scenario. Their
findings imply that trade liberalization of ethanol indeed encourages the production of feedstocks
in more efficient regions. Birur et al. (2008) investigate trade and terms of trade (ToT) impacts of
biofuels production. They find that US coarse grain export declines while the total volume of
global trade of coarse grains rises. They also find that, while the US and EU export of oilseeds to
the rest of the world declines sharply, India and Eastern Europe emerge as net oilseed exporters.
They also find that the ToT effect is negative for both the US and the EU. They attribute the
welfare effect from ToT loss to the wealth transfer from the consuming region to the producing
region.
Second, some work has been conducted on the effect of biofuel production on farm jobs
and income (Treguer and Sourie, 2006; World Watch Institute, 2007). For instance, Treguer and
Sourie (2006) estimate the effect of the massive biofuel production decision of France on the
European energy directives of 2003. Using a partial equilibrium model (the OSCAR model),
their results indicate that production of biofuel crops increases farm jobs and farm income.
However, some argue that whether this effect leads to net welfare gain or loss for poor farm
households depends on two opposite forces emanating from the expansion of biofuel production
(World Watch Institute, 2007). On one hand, farm households in poor countries will manage to
receive higher prices for their agricultural products due to increased prices in the global market
resulting from the competition for resources between agriculture-based energy production and
other agricultural production. On the other hand, poor households dependent on imported food
will face high food prices and hence become poorer.
Third, there are studies dealing with the effect of biofuel production on food prices
(McNew and Griffith, 2005; Rosegrant, 2008; Mitchell, 2008; World Watch Institute, 2007;
Sourieet al., 2006; and Banse et al., 2008). Competition imposed by biofuel production might
result in significant rises in prices of agricultural products, including food crops. For instance,
Page 13
Environment for Development Ferede et al.
9
the OECD-FAO (2006) estimates significant rises in prices of sugar, vegetable oils, and cereals
by 2015 resulting from increased use of biofuels. Banse et al. (2008) analyze the trade impacts of
an EU Biofuels Directive using a global CGE model, i.e., a modified version of the Global Trade
Analysis Project (GTAP) model. They find that cereal prices actually decline in the long-run,
though less than they would without the directive.
The Model
This paper attempts to assess the economy-wide effects of biofuel investment on
economic growth and the external sector using a dynamic computable general equilibrium (CGE)
model. CGE models have features that make them suitable for such analysis (Jandaet al., 2011).
The basic structure of the CGE used in this paper is similar to that of Gebreegziabher et al.
(2013). Due to this, for the sake of brevity, we omit the details of the model. Instead, it is quite
useful to describe new elements of the CGE model used in this study. First, the CGE model
deployed in this study is based on the revised social accounting matrix (SAM) for Ethiopia. The
2005/06 SAM for Ethiopia, initially developed by the Ethiopian Development Research Institute
(EDRI), has been modified to include two new sectors: forestry and energy. The energy sector is
further divided into modern (e.g., electricity) and traditional (e.g., fuel wood and cow dung)
energy sources. Second, the CGE model has been modified accordingly to include these new
activities. Hence, the CGE model used in this study has more sectoral breakdown compared with
that of Gebreegziabher et al. (2013).
Structure and Assumptions of the Dynamic CGE Model2
Key Assumptions of the Model
In the current account, a flexible exchange rate is assumed so that it adjusts in order to
maintain a fixed level of foreign savings (i.e., the external balance is held fixed in foreign
currency terms).
In this model, labour is assumed to be mobile across sectors and fully employed, which is
a strong assumption. For instance, if biofuels production results in higher employment, then the
2 This section is based on Gebreegziabher et al. (2013).
Page 14
Environment for Development Ferede et al.
10
tradeoffs between biofuels and food production are less pronounced because the GDP gains from
the biofuels production would be larger. Full employment closure implies that expanding
biofuels production reduces use of labour elsewhere in the economy, which is consistent with
widespread evidence that, while relatively few people in Ethiopia have formal jobs, a large
proportion of the working age population engages in productive activities such as agriculture and
other informal activities that contribute to GDP (Arndt et al., 2012). Therefore, employing this
working age population in biofuels production has an opportunity cost.
Land is assumed to be fully employed and mobile across sectors. This implies that land
use cannot be changed from one activity to another within a period because cropping decisions
are often made at the beginning of each cropping season or period. Between periods, however,
land use can shift in response to return differentials arising from changes in the economic
environment (Arndt et al., 2012).
The consumer price index is taken as the model’s numeraire. SAM-based calibration
implies making sure that the base year model solution replicates the values of the SAM.
Ethiopia’s CGE model is calibrated to a 2005 social accounting matrix (SAM), which was
constructed for this purpose using the EDRI SAM 2005/06 and survey data collected by
Environmental Economic Policy for Ethiopia. Trade elasticities are taken from GTAP
(Diamaranan, 2006). The model is calibrated in such a way that the initial equilibrium
reproduces the base-year value from the SAM.
The features of the model described so far apply to a single-period ‘static’ CGE model.
However, as investments in biofuels unfold over a dozen years or more, the model is made
capable of producing forward-looking growth trajectories. The model is dynamized by building a
set of capital accumulation and updating rules for capital stock, labour force growth by skill
category, and productivity growth. In addition, in this model a simple adaptive expectation
formation is specified whereby investment is allocated according to current relative prices, which
implies that investors expect current price ratios to prevail indefinitely. Crowding-in of private
investment in non-biofuel sectors is not explicitly modeled, though suggested by Hausmann
(2007). We opted instead to focus on the direct impact of biofuels, though we considered the
potential technology spillovers.
A set of dynamic equations update various parameter values and variables from one year
to another. Growth in total supply of each labour category and land is specified exogenously. In
addition, growth in land supply by agro-ecological zones to biofuels sectors is specified
exogenously. Sector capital stocks are adjusted each year based on investment, net of
Page 15
Environment for Development Ferede et al.
11
depreciation. Factor returns adjust in such a way that factor supply equals demand. This model
adopts a ‘putty-clay’ formulation such that new investments can be directed to any sector in
response to differential rates of return (Arndt et al., 2010). However, installed equipment remains
immobile. Sector-specific factor productivity growth is specified exogenously. Based on these
simple relationships to update key variables, we generated a series of growth trajectories for
different biofuels investment scenarios.
In the modeling, we focus on the differential impacts of various biofuels production,
including a baseline scenario that excludes investments in biofuels and various biofuels
scenarios. These scenarios consider different feedstocks, agro-ecological zones, and
technological spillover effects. Examining the differences between the biofuels scenarios and the
baseline scenario allows us to isolate the impacts of biofuels investments and obtain clear and
analytically tractable comparisons.
Data
The SAM
The main feature of the CGE model is that activities are classified according to agro-
ecological zones (AEZs) (see EDRI (2009) for details on AEZs).3 Among the factors of
production, there are three categories of labour (skilled, semiskilled and unskilled labour types).
The model also identifies agricultural capital and land, categorized in five agro-ecological zones,
as well as non-agricultural capital. The model distinguishes 14 household types. While rural
households are classified according to their poverty status (poor and non-poor) and location
(AEZs), for a total of ten rural household types, urban households are based on urban size and
poverty status, for a total of four urban household types. These details in the 2005/06 SAM
capture Ethiopia’s economic structure and influence model results. Biofuels are expected to
either be exported or to substitute for fuel imports. As a result, a substantial increase in biofuels
will have implications for trade and foreign exchange availability. Availability of foreign
exchange enables the country to import more goods and to reduce its exports of other products.
As a result, one would expect that sectors with a high trade share will be more affected compared
3 The five AEZs include: Humid lowlands moisture reliable (AEZ1), moisture sufficient highlands (cereal-based
systems) (AEZ2), moisture sufficient highlands (enset-based systems) (AEZ3), drought prone (AEZ4), and
pastoralist (AEZ5).
Page 16
Environment for Development Ferede et al.
12
to non-traded sectors. We expect a high trade share both in sectors with a large proportion of
production exported and sectors with a high degree of import competition.
Table 3 provides the basic features of the Ethiopian economy in 2005/06, which is the
base year for the dynamic CGE model. While agriculture generates a little less than half of the
national gross domestic product (GDP) and three-fourth of total employment, the contribution of
non-agricultural sectors to total output is minimal. The manufacturing sector, for example,
accounts for only 13% and 7% of total GDP and employment, respectively. The country depends
heavily on imported industrial products, accounting for 71% of total imports, while exported
industrial products accounted for a fifth of total exports. Note that fuel imports are quite
considerable, accounting for about 12% of total imports and 18% of total industrial imports in
2005/06. The country imports less agricultural products, especially cereals, which accounted for
3.5% of total imports over the same period.
When we incorporate biofuel activities into the model, we disaggregate them to capture
the variation across AEZs. For instance, while sugarcane plantation is undertaken in moisture
sufficient highlands (AEZ2), palm oil activity is mainly undertaken in humid, moisture reliable
lowlands (AEZ1) (Table 4).Note that small-scale sugar cane production is also undertaken by
smallholders in the other AEZs.4 Jatropha and castor bean activities are produced mainly in
moisture sufficient highlands (enset-based systems) and in drought prone and pastoralist zones:
AEZ 3 & 4 for jatropha and AEZ 4 & 5 for castor bean. This disaggregation captures some of the
diversity in economic structure and potential across regions.
Survey and Modification of the EDRI SAM
We conducted a survey on biofuels investment in Ethiopia. The purpose of the survey
was to generate sector/crop-specific primary data in order to derive the input-output coefficients
in relation to the biofuels sector for the CGE analysis. A list of companies with investment
permits for biofuels, over 45 companies, was obtained from the Ethiopian Investment Agency.
Then, 15 biofuels companies and 2 NGOs involved in biofuels were approached to fill out a
structured questionnaire (with 6 non-responses).
First, the EDRI SAM 2005/06 was modified to include the biofuels sector using input-
output coefficients generated from the biofuels investment survey data collected by
4 See, for instance, agriculture sample survey of CSA (Central Statistical Agency) (various issues).
Page 17
Environment for Development Ferede et al.
13
Environmental Economic Policy for Ethiopia (EEPFE) during the summer of 2010. Four
dedicated biofuel sectors are created in the economy-wide modeling, namely sugarcane for
ethanol production, jatropha for biodiesel production, castor bean for biodiesel production, and
palm oil for biodiesel production. This approach was used in the subsequent simulations
involving different biofuels scenarios.
In addition, modifications have been made in the original EDRI SAM 2005/06 to include
forestry and energy. This allows us to extend the work and to run simulations in relation to the
emissions reduction and deforestation implications of biofuels investment in Ethiopia. In
addition, we have been interested in validating the robustness of the preliminary results reported
in response to some changes in assumptions, especially in the employment and mobility of land.
The results are reported with and without land mobility across different sectors.
Besides the usefulness of the survey in calculating the input-output coefficients, it was
also helpful in characterizing the biofuels sector in Ethiopia. Table 5 provides an overview of the
biofuels sector in Ethiopia based on the survey results. The survey revealed that one company
has started exporting bio-diesel and that other companies are at the product testing stage. The
survey also showed that there are complementary local innovations going on in the biofuels
sector, including inventions and innovations in bio-diesel stoves, processors/distilleries, and
biogas-driven vehicles. All this suggests that the sector requires policy attention and could
possibly be one avenue to reducing poverty and enhancing growth. However, we also found that
the sector suffers from lack of follow-up and appropriate institutional setup, particularly at the
regional level.
As for production characteristics, while large scale sugar cane is mainly plantation-based,
jatropha and castor bean production activities are undertaken by a combination of plantation-
based and smallholder production through out-grower schemes. In addition, jatropha and castor
bean production activities are labour-intensive, as they require more labour per land compared
with sugar cane (Table 6). According to our survey, sugar cane accounted for the largest share of
the total land allocated to biofuel crops (Figure 5).5 However, it is important to note that only a
small proportion of the total land allotted to biofuels production was utilized in 2007. For
instance, while a fifth of the total land is utilized in castor bean, the figures for jatropha and palm
5 The percentage is based on the total land allocated (169,551 ha) to firms included in the survey; it is not based on
500,000 ha allotted to all biofuel firms across the country.
Page 18
Environment for Development Ferede et al.
14
oil for 2010 are very small (Figure 6). A little more than half of the total land allotted to
sugarcane has been utilized over the same period. This suggests that there is room for further
expansion of production by bringing more land into cultivation until full scale operation is
reached, without displacing smallholders, at least in the short- and medium-term.
Biofuels development in Ethiopia involves peculiarities in two important respects. Firstly,
the biofuels sector in Ethiopia is characterized by the diversity of biofuels crops involved
(jatropha, castor bean, sugarcane, and palm oil, including indigenous trees). Also, second
generation biofuels, i.e., byproducts, are used for biofuels. For instance, molasses, a byproduct of
sugarcane processing, is used in ethanol production. Other features include intercropping options
in the case of castor bean and other crops. Secondly, the business models are diverse, including
plantation, out-growers, and community development models. For example, REST in Tigrai and
ORDA in the Amhara region are involved in biofuels as a community development model.6
However difficult it might be, the modeling has done as much as possible to capture these
peculiarities.
Scenarios
First, we produce a baseline scenario (growth path) that assumes that the economy
continues to grow during 2003–2020 in line with its recent growth trajectory. For each year, we
update the model to reflect changes in population, supply of labour and land, and factor
productivity (see Table 7). Ethiopia can be considered a land-abundant country since the
proportion of land under cultivation is relatively small compared to the potential cultivable land.
As a result, we assume that, on average, land supply grows at 3.2% in all agro-ecological zones,
which is the same as the rate of cropped area expansion over the past decade. Population is
assumed to grow at 2.5%, which is the same as the average rate of population growth from 1994
to 2007 (CSA, 2008). Rising skill intensity in the labour force is captured by assuming that the
supply and productivity of the skilled and semiskilled labour force will grow faster than
unskilled labour.7 It is also assumed that there is an unbiased technological change, which shifts
6 REST is an abbreviation for ‘Relief Society of Tigrai’ and ORDA an abbreviation for ‘Organization for
Rehabilitation and Development of Amhara’ region.
7 Skilled labour is assumed to grow at a rate of 7.9% per year, which is consistent with expansion of higher
education in the country. While semi-skilled labour is assumed to grow at the rate of 5% per year, unskilled labour is
assumed to grow at 4.4% per year, a little more slowly than the rate at which semi-skilled is assumed to grow.
Page 19
Environment for Development Ferede et al.
15
the parameter on the production function (total factor productivity parameter) to grow at the rate
of 2.5% in livestock and in sectors that produce cereals and cash crops.
Similarly, total factor productivity in all other non-agricultural activities is assumed to
grow at the rate of 2.9%. These estimates of TFP are obtained from previous studies on growth
accounting in the country (e.g., Nin Pratt and Yu, 2008; World Bank, 2009). The rate of total
factor productivity growth in sugarcane activity is assumed to be 5%, which is consistent with
the expansion in the sector. While the total factor productivity in jatropha producing activity
grows at the rate of 3%, that of castor bean producing activity is assumed to grow at the rate of
3.5%. The results of these scenarios are compared with the biofuels scenarios so as to isolate the
effects of biofuels investment from the effect of other factors. Given that there exists a diversity
of biofuels options for Ethiopia, we considered seven biofuels scenarios (see Table 8), the
details of which are elaborated below.8
The sugarcane scenario, i.e., scenario 1 (S1): assumes expansion of sugarcane production
through extensive cultivation, i.e., by allocating more land to sugarcane production. Specifically,
we increase land allocated to sugarcane by 5,116.44 hectares per year over the 2020 period.9
In the jatropha scenario, scenario 2 (S2), we keep on increasing jatropha production by
bringing more land into cultivation. Land allotted to this crop increases by 2,153.62 hectares per
year. Given that a large of proportion of land allocated to this crop is not utilized, we assume that
expansion of jatropha will not affect smallholders in terms of land displacement.
In scenario 3 (S3), i.e., in the castor bean scenario, castor bean is increased through
increasing the quantity of land, which is assumed to increase by about 2,033.33 hectares per
According to data from national labour force surveys, the labour force is growing faster than the rate of population
growth. The most recent Population Census (CSA, 2007) indicates that the age composition of the population is
skewed toward young and adult populations, suggesting that the labour force grows faster than population growth
rate.
8 Note that the scenarios are based on the total land allocated to the different biofuel firms included in the survey.
Given that land allocated to different biofuel crops is significantly underutilized and total land availability is fixed,
the different scenarios are intended to capture the impact of increasing land utilization on the overall economy,
including on production of biofuel crops and biodiesel and ethanol.
9The recent biofuel investment survey indicates that, of the total land allocated to sugarcane, jatropha, castor bean
and palm oil, about 34,058.42, 31,804.33, 24,500 and 29,775 hectares of land are not utilized, in that order. In the
biofuel scenarios, we evenly distribute this unutilized land over the 15 periods, which implies no displacement of
smallholders.
Page 20
Environment for Development Ferede et al.
16
year. Notice that further expansion of land beyond this magnitude can come at the expense of
smallholders, i.e., smallholder land will be reduced by the amount of land allotted to castor bean
production.
Scenario 4 (S4), i.e., the palm oil scenario, assumes expansion in palm oil production by
increasing land, which is assumed to grow by 2,000.00 hectares per year.
Scenario 5 (S5) includes S2 with improved productivity of the smallholder crop sector.
This scenario intends to capture the spillover effect of biofuel technology on smallholder
agriculture. Such an effect can arise, for instance, through improved farming practices or access
to other agricultural inputs (e.g., chemical fertilizer, improved seeds, insecticides, etc.).
Scenario 6 (S6) is S3 with spillover effects of biofuel technology on smallholder crop
agriculture. This induces improved productivity of the smallholder crop sector.
The last scenario, scenario 7 (S7), captures the combined effect of all biofuel
interventions, including spillover effects for certain biofuels crops, on the structure of the
economy.
Discussion of Results
Macroeconomic and Sectoral Impacts of Biofuels
The macroeconomic and sectoral impacts of biofuels expansion can be assessed based on
the CGE model simulation results by contrasting respective biofuels scenarios with the baseline
scenario. A consistent outcome of all the biofuels simulation results is that the effect of biofuel
expansion on total national output (GDP) increases if such expansion generates spillover effects.
For instance, while the impact of biofuel expansion without spillover effects on total output is
negligible, GDP increases by 0.22% and 0.19% if jatropha and castor bean expansion are
accompanied by spillover effects (Figure 7).10
Regarding sectoral effects, biofuel activities with technology transfer, such as improved
farm management practices, generate positive impacts on sectoral production. Agriculture
10 Notice that we make use of Table 2 in introducing biofuel shocks. In other words, in the sugarcane scenario, we
expand land area in all zones because this crop is grown by small holders, as indicated in the EDRI SAM. In the
palm scenario, land expansion occurs in AEZ 1 only. We expand land for biofuel crops in the jatropha and castor
bean scenarios in AEZ 3 & 4 and AEZ 4 & 5, respectively.
Page 21
Environment for Development Ferede et al.
17
benefits relatively more than other sectors (Figure 8). For instance, agricultural GDP would
increase by about 0.48% and 0.41% if jatropha and castor bean activities generate positive
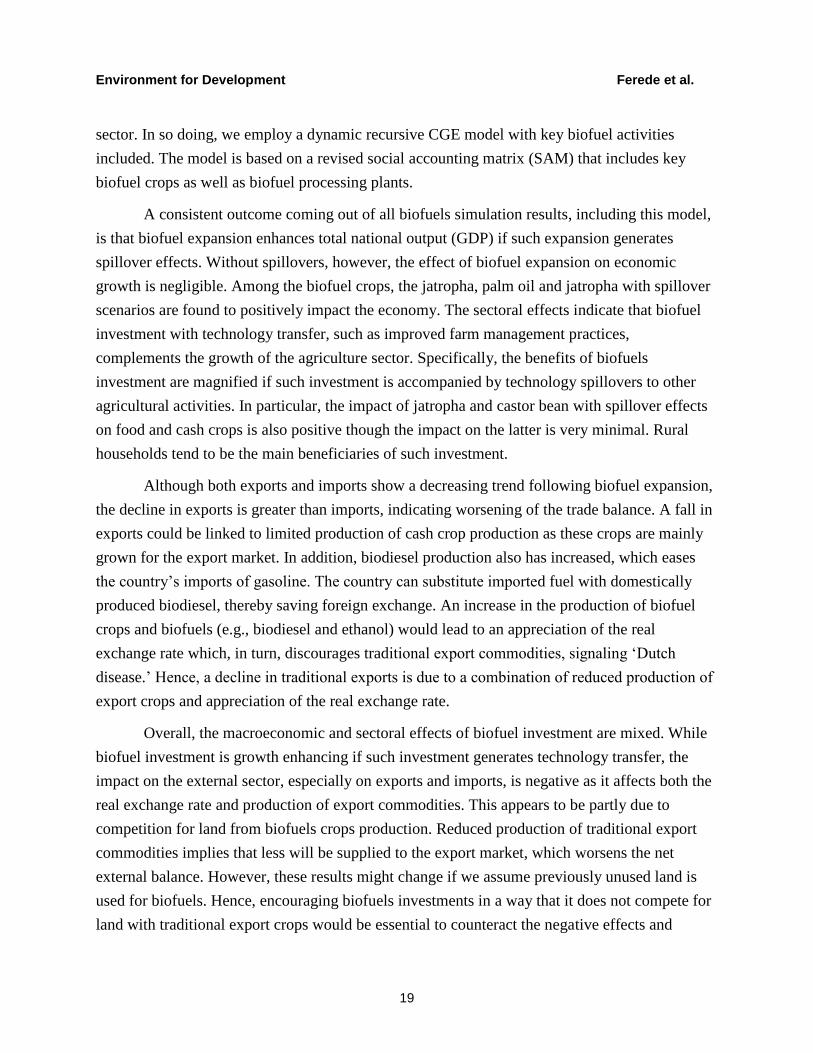
spillover effects. In particular, the impact of jatropha and castor bean with spillover effects on
food crops is positive (Figure 9). Cereals production increases with spillover effects, suggesting
no evidence of a trade-off between food production and biofuels. However, cash crops seem
adversely affected by biofuel expansion, especially in the case of castor bean, indicating that
farmers reallocate land away from traditional cash crops to food and biofuel crops.
Our findings contribute evidence to the debate on whether or not biofuel production,
especially in agriculture-dependent countries, has adverse impacts on food and cash crop
production. We do not find negative effects of biofuel on food crops production in Ethiopia,
especially when spillover effects are considered. The positive impact of biofuel on food crops is
quite strong compared with the negligible effect of biofuels on cash crops. This could be due to
the fact that farm households give priority first to food crop production and then to biofuels when
deciding land allocation. As out-growers, farm households allocate a certain fraction of their
farm land (e.g., up to a third) to growing biofuel crops. Given the small size of landholdings, the
remaining land will be used for the production of cereals. In a land constraint setting where food
security is a major issue, cash crops will be the first to be replaced by alternative and competing
crops such as biofuel crops. Even then, production of cash crops on a very small plot of land
could increase due to improved farm management practices that are acquired from biofuel crop
activities. The results in the next section do suggest a small increase in cash crop production in
some regions and scenarios. However, the impact of biofuel expansion on cash crops is limited.
Otherwise, the replacement of cash crops with biofuels crops would have a considerable impact
on the external sector of the economy.
Effects of Biofuels on the External Sector
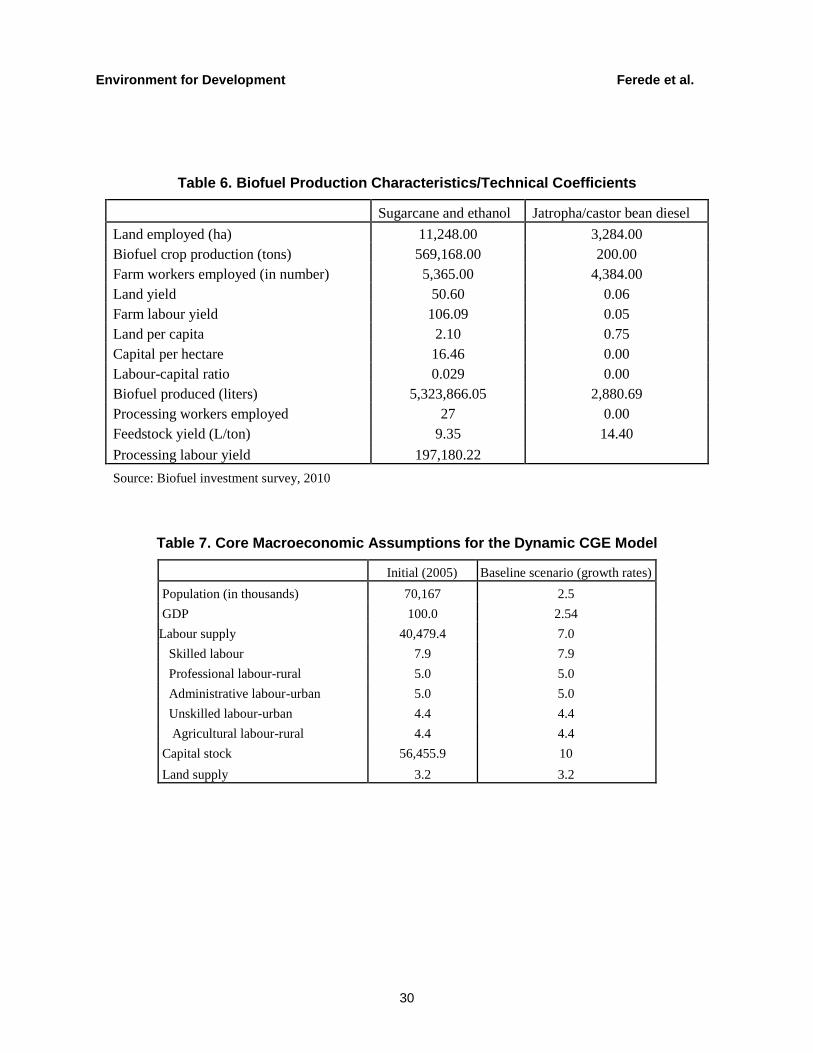
Although both exports and imports show a decreasing trend due to biofuel expansion, the
decline in exports is greater than the decline in imports, indicating worsening of the trade balance
(Figure 10). There are at least three factors at play here. Competition for land could lead to less
production of cash crops, which are mainly grown for the export market (Gebreegziabher et al.,
2013). On the other hand, there is less need to import oil, so foreign exchange is conserved.
However, the decline in exportable commodities such as cash crops means less foreign
exchange, leading to real exchange rate depreciation, which is not strong enough to stimulate
exports.
Page 22
Environment for Development Ferede et al.
18
Whereas most scenarios have no effect on cash crop production, the jatropha and castor
bean scenarios that involve spillover effects actually have a positive effect on production of cash
crops (traditional export commodities) in some regions. However, in the simulation where land is
assumed to be fully employed and mobile, biofuels strongly and negatively impacted cash crop
production in all regions, but only in the jatropha and castor bean scenarios that involve the
spillover effects. Given limited farm size, farmers reallocate land from traditional cash crops to
biofuels and food crops. This is mainly dictated by food security motives and by the tendency to
self-insure when a portion of their land is used for biofuel crops, indicating a trade-off between
biofuel crops and traditional cash crops. This may indicate a kind of ‘Dutch disease’ in which
resources are diverted to the new biofuel crop, thereby leading to contraction of traditional
export items.
However, more importantly, biodiesel production also has increased, which eases the
country’s imports of fossil fuel. The country can substitute imported fuel with domestically
produced biofuel, thereby saving foreign exchange. A reduction in total imports, though small
compared with exports, could be due to a fall in imports of gasoline. In other words, domestic
bioenergy serves as a buffer against oil-market shocks and as a way of conserving foreign
reserves, which can then be used to finance other import items (e.g., food) (FAO, 2008).
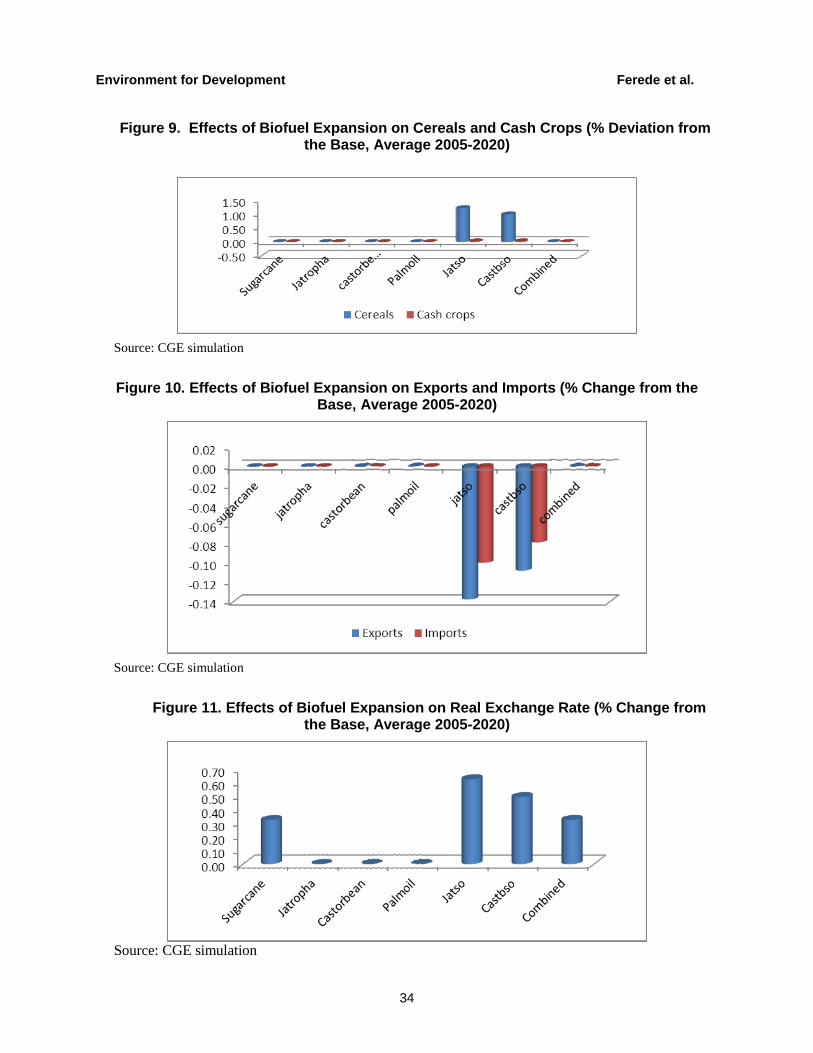
An increase in biofuel crops leads to a depreciation of the real exchange rate, which is not
strong enough to stimulate exports (Figure 11). Hence, a decline in traditional exports is due to
reduced production of export crops. In addition, reduced production of traditional exports
commodities implies that less will be supplied to the export market. This worsens the net
external balance.
Overall, the macroeconomic and sectoral effects of biofuel investment are growth
enhancing if such investment generates technology transfer. However, the impact of biofuel
expansion on the external sector, especially on exports and imports, is negative. In addition,
given government’s ongoing huge investment in road infrastructure in the country (e.g., see
MoFED, 2010), access to unused land might no longer be constrained by inadequate road
infrastructure. Hence, further biofuel investment might also be undertaken on unoccupied lands,
at least in the short- to medium-term.
Conclusions and Implications
In this study, we attempt to provide empirical evidence regarding the economy-wide
effects of biofuel investment in Ethiopia, with a focus on economic growth and the external
Page 23
Environment for Development Ferede et al.
19
sector. In so doing, we employ a dynamic recursive CGE model with key biofuel activities
included. The model is based on a revised social accounting matrix (SAM) that includes key
biofuel crops as well as biofuel processing plants.
A consistent outcome coming out of all biofuels simulation results, including this model,
is that biofuel expansion enhances total national output (GDP) if such expansion generates
spillover effects. Without spillovers, however, the effect of biofuel expansion on economic
growth is negligible. Among the biofuel crops, the jatropha, palm oil and jatropha with spillover
scenarios are found to positively impact the economy. The sectoral effects indicate that biofuel
investment with technology transfer, such as improved farm management practices,
complements the growth of the agriculture sector. Specifically, the benefits of biofuels
investment are magnified if such investment is accompanied by technology spillovers to other
agricultural activities. In particular, the impact of jatropha and castor bean with spillover effects
on food and cash crops is also positive though the impact on the latter is very minimal. Rural
households tend to be the main beneficiaries of such investment.
Although both exports and imports show a decreasing trend following biofuel expansion,
the decline in exports is greater than imports, indicating worsening of the trade balance. A fall in
exports could be linked to limited production of cash crop production as these crops are mainly
grown for the export market. In addition, biodiesel production also has increased, which eases
the country’s imports of gasoline. The country can substitute imported fuel with domestically
produced biodiesel, thereby saving foreign exchange. An increase in the production of biofuel
crops and biofuels (e.g., biodiesel and ethanol) would lead to an appreciation of the real
exchange rate which, in turn, discourages traditional export commodities, signaling ‘Dutch
disease.’ Hence, a decline in traditional exports is due to a combination of reduced production of
export crops and appreciation of the real exchange rate.
Overall, the macroeconomic and sectoral effects of biofuel investment are mixed. While
biofuel investment is growth enhancing if such investment generates technology transfer, the
impact on the external sector, especially on exports and imports, is negative as it affects both the
real exchange rate and production of export commodities. This appears to be partly due to
competition for land from biofuels crops production. Reduced production of traditional export
commodities implies that less will be supplied to the export market, which worsens the net
external balance. However, these results might change if we assume previously unused land is
used for biofuels. Hence, encouraging biofuels investments in a way that it does not compete for
land with traditional export crops would be essential to counteract the negative effects and
Page 24
Environment for Development Ferede et al.
20
realize benefits from biofuels expansion. Moreover, measures to address real exchange rate
appreciation would also be important to countervail the negative effects on the external sector.
Page 25
Environment for Development Ferede et al.
21
References
ABN (African Biodiversity Network). 2007. “AGRO Fuels in Africa: The Impacts on Land,
Food and Forests.”
http://www.africanbiodiversity.org/sites/default/files/PDFs/Agrofuels%20in%20Africa-
Impacts%20on%20land%2C%20foods%20%26%20forests.pdf (retrieved May 30, 2011).
ADB (African Development Bank). 2011. Federal Democratic Republic of Ethiopia Country
Strategy 2010-2015. ADB Group.
ADBG (African Development Bank Group). 2010. Ethiopia’s Economic Growth Performance:
Current Situation and Challenges. Economic Brief 1(5): 1-5.
Arndt, C., K. Pauw, and J. Thurlow. 2012. “Biofuels and Economic Development: A
Computable General Equilibrium Analysis for Tanzania.” Energy Economics 34: 1922–
1930.
Arndt, C., R. Benfica, F. Tarp, J.Thurlow, and R.Uaiene. 2009. “Biofuels, Poverty, and Growth:
A Computable General Equilibrium Analysis of Mozambique.” Environment and
Development Economics 15: 81-105.
Arndt, C., K. Pauw, and J. Thurlow.2010a. “Biofuels and Economic Development in
Tanzania.”IFPRI Discussion Paper 00966. Washington, DC: IFPRI.
Arndt, C., S. Msangi, and J. Thurlow. 2010b. “Are Biofuels Good for African Development? An
Analytical Framework with Evidence from Mozambique and Tanzania.” UN-WIDER
Working Paper No. 2010/110.
Azar, Christian. 2011. “Biomass for Energy: ADream Come True . . . or a Nightmare?” Wiley
Interdisciplinary Reviews: Climate Change 2(3): 309-323.
Banse, M., H. van Meijl, A. Tabeau, and G. Woltjer. 2008. “Will EU Biofuel Policies Affect
Global Agricultural Markets?” European Review of Agricultural Economics 35(2): 117-
141.
Barbara, J. S. 2007.The False Promise of Biofuels. A special report from the International forum
on globalization and the institute for policy studies, Alternative Energy Working Group
of the International Forum on Globalization. September 2007.
Bernstein, H., B. Crow and H. Johnson (eds.) 1992. Rural Livelihoods: Crises and Responses.
Oxford: Oxford University Press and the Open University.
Page 26
Environment for Development Ferede et al.
22
Birur, Dileep K., Thomas W. Hertel, and Wallace E. Tyner. 2008. “Impact of Biofuel Production
on World Agricultural Markets: A Computable General Equilibrium Analysis.” GTAP
Working Paper No. 53.
Bouët, A., B.V. Dimaranan, and H. Valin. 2010. “Modeling the Global Trade and Environmental
Impacts of Biofuel Policies.” IFPRI Discussion Paper 01018. Washington, DC: IFPRI.
CSA (Central Statistical Authority) (2008). Summary Statistical Report of the 2007 Population
and Housing Census. Addis Ababa, Ethiopia: CSA.
Dimaranan, B., ed. 2006. “Global Trade, Assistance, and Production: The GTAP 6 Data Base.”
Center for Global Trade Analysis. West Lafayette, IN, USA: Purdue University.
Dufey, Annie. 2006. “Biofuels Production, Trade and Sustainable Development: Emerging
Issues.” International Institute for Environment and Development (IIED). Sustainable
Markets Discussion Paper Number 2.
EDRI (Ethiopian Development Research Institute). 2009. “Ethiopia Input Output Table and
Social Accounting Matrix (SAM) 2005/06.” Addis Ababa: EDRI.
FAO (Food and Agriculture Organization of the United Nations). 2008. “The State of Food and
Agriculture. Biofuels: Prospects, Risks and Opportunities.” Rome: FAO.
FAPRI (Food and Agricultural Policy Research Institute). 2010. “US and World Agricultural
Outlook.” FAPRI Staff Report 10-FSR 1. Ames, Iowa: Iowa State University and
University of Missouri-Columbia.
Gebreegziabher, Z. and Y. Mohammednurm. 2012. “Sources of Technical Efficiency
Differentials Among Smallholder Farmers in Tigrai, Northern Ethiopia: Panel Data
Evidence and Implications for Food Security.” In: W. Gebeyehu and D. Getachew, eds.
Proceedings of the First Regional Conference of the Tigrai Regional State Economic
Development, EEA (Ethiopian Economics Association). March 2013, pp85-108.
Gebreegziabher, Z., A. Mekonnen, T.Ferede, F.Guta, J. Levin, G. Köhlin, T.Alemu, and L.
Bohlin. 2013. “The Distributive Effect and Food Security Implications of Biofuels
Investment in Ethiopia: A CGE analysis.” EfD Discussion Paper 13-02.Environment for
Development (EfD) Initiative and Resources for the Future (RFF). Washington, DC.
January 2013. (http://www.rff.org/rff/documents/EfD-DP-13-02.pdf.
Gebremeskel, L. and M. Tesfaye. 2008. “A Preliminary Assessment of Socioeconomic and
Environmental Issues Pertaining to Liquid Biofuel Development in Ethiopia.” In T.
Page 27
Environment for Development Ferede et al.
23
Heckett and N. Aklilu, eds.Agrofuel Development in Ethiopia: Rhetoric, Reality and
Recommendations. Forum for Environment, Addis Ababa.
Hausmann, R. 2007. “Biofuels Can Match Oil Production.” Financial Times. November 6.
Huang, J., H. Qiu, J. Yang, M. Keyzer, W. van Veen, S. Rozelle, G. Fischer, and T. Ermolieva.
2009. “Biofuel Use and Agricultural Intensification in China.” Paper presented at the
17th Annual conference of the European Association of Environmental and Resource
Economists (EAERE), Amsterdam. June 24-25, 2009.
Huang, J., J. Yang, S. Msangi, S. Rozelle, and A. Weersink. 2012. “Biofuels and the Poor:
Global Impact Pathways of Biofuels on Agricultural Markets.” Food Policy 37: 439–451.
IEA (International Energy Agency). 2010. World Energy Outlook 2010, Executive Summary.
OECE/IAE, Paris.
IEA (International Energy Agency) 2006. World Energy Outlook 2006, The Outlook for
Biofuels. OECE/IAE, Paris.
Janda, K., L. Kristoufek, and D. Zilberman. 2011. “Modeling the Environmental and Socio-
Economic Impacts of Biofuels.” IES Working Paper: 33/2011.
Lakew, H. and Y. Shiferaw. 2008. “Rapid Assessment of Biofuels Development Status in
Ethiopia.” In T.Anderson and M. Belay, eds. Rapid Assessment of Biofuels Development
Status in Ethiopia and Proceedings of National Workshop on Environmental Impact
Assessment and Biofuels. MELCA Mahiber, Addis Ababa.
Lashitew, A.A. 2008. “Competition Between Biofuel and Food Production in Ethiopia: A Partial
Equilibrium Analysis.” MSc Thesis, Wageningen University.
McNew, K. and D. Griffith. 2005. “Measuring the Impact of Ethanol Plants on Local Grain
Prices.” Review of Agricultural Economics 2(27): 164–180.
Ministry of Agriculture and Rural Development (MoARD). 2010. “Ethiopia’s Agriculture Sector
Policy and Investment Framework (PIF).” 2010-2020. Addis Ababa, Ethiopia: MoARD.
MoFED (Ministry of Finance and Economic Development). 2010. “The Five Years (2010/11-
2014/15) GTP (Growth and Transformation Plan).” MoFED, Addis Ababa.
MoFED. 2012. “Ethiopia’s Progress Towards Eradicating Poverty: An Interim Report on
Poverty Analysis Study (2010/11).” Addis Ababa, Ethiopia.
Page 28
Environment for Development Ferede et al.
24
MoME.Ministry of Mines and Energy. 2007. “The Biofuel Development and Utilization Strategy
of Ethiopia.” MoME, Addis Ababa.
Mitchell, D. 2008. “A Note on Rising Food Prices.” Policy Research Working Paper 4682. The
World Bank.
Moges, K.T.2010. “Smallholder Farmers and Biofuel: Farmers’ Perspectives in Growing Castor
Beans in Ethiopia.” MSc Thesis, Swedish University of Agricultural Sciences.
NBE (National Bank of Ethiopia). 2010. Annual Report 2008/2009. Addis Ababa: NBE.
NBE. 2008. “Developments in the External Sector.” www.nbe.gov.et/annualreports (accessed
June 2008).
Negash, M. 2012. “Biofuels and Food Security: Micro-evidence from Ethiopia.” Poster prepared
for presentation at the International Association of Agricultural Economists (IAAE)
Triennial Conference, Foz do Iguaçu, Brazil. August 18-24, 2012.
Nin Pratt, A. and B. Yu. 2008. “An Updated Look at the Recovery of Agricultural Productivity
in Sub-Saharan Africa.” IFPRI Discussion Paper 00787. Development Strategy and
Governance Division, Washington, D.C.
Peskett, L., R. Slater, C. Stevens, and A. Dufey. 2007. “Biofuels, Agriculture and Poverty
Reduction.” Natural Resource Perspectives 107. London: Overseas Development
Institute.
Slater, R. 2007. “Biofuels: Starving People to Feed Cars? Or Growing Our Way Out of
Poverty?” ODI http://www.odi.org.uk/events/2007/06/27/203-presentation-rachel-slater.pdf
(accessed 19 September 2009)
OECD–FAO (Organisation for Economic Cooperation and Development–Food and Agriculture
Organization of the United Nations). 2006. OECD–FAO Agricultural Outlook 2006–
2015. Paris.
Rosegrant, M.W. 2008. “Biofuels and Grain Prices: Impacts and Policy Responses.”
International Food Policy Research Institute.
Sourie, J.-C., D.Treguer, and S.Rozakis. 2006. “Economic Impact of Biofuel Chains in France.
Mixed Unit of Research INRA and INA P-G.” EconomiePublique, Paris and Grignon,
France.
Treguer, D. and J.-C.Sourie. 2006. “The Impact of Biofuel Production on Farm Jobs and Income:
The French Case.” Article presented for the 96th EAAE seminar in Tanikon, Switzerland.
Page 29
Environment for Development Ferede et al.
25
Van Rheenen, T. and T. Olofinbiyi. 2007. “Policy Making and Land Use Changes: Facing New
and Complex Realities.” In E. Bulte and R. Ruben, eds. Development Economics
Between Markets and Institutions: Incentives for Growth, Food Security and Sustainable
Use of the Environment.Wageningen Academic Publishers.
Ugarte, Daniel G. De La Torre, B.C. English, C.M. Hellwinckel, R.J. Menard, and M.E. Walsh.
2007. “Economic Implications to the Agricultural Sector of Increasing the Production of
Biomass Feedstocks to Meet Biopower, Biofuels, and Bioproduct Demands.” The
University of Tennessee, Department of Agricultural Economics. Research Series 08-01.
World Bank. 2009. Ethiopia Country Economic Memorandum. Background Paper. Quantitative
Framework for Public Investment Policies in Ethiopia. Draft. Available at
http://siteresources.worldbank.org/INTETHIOPIA/Resources/PREM/QuantitativeFrame
workforPublicInvestmentPoliciesInEthiopia.pdf (accessed 20 September, 2009).
World Watch Institute. 2007. “Biofuels for Transport: Global Potential and Implications for
Sustainable Energy and Agriculture.” Earth Scan, London.
Yao, S. and A. Liu. 2000. “Policy Analysis in a General Equilibrium Framework.” Journal of
Policy Modeling 22(5): 589–610.
Page 30
Environment for Development Ferede et al.
Tables and Figures
Table 1. Trends in Exports and Imports
Source: Computed from ERCA data
Volume (in ‘000’metric ton) Share in GDP (%)
1991/92 2000/01 2011/12
1991/92-2011/12
Average growth rate
(%)
1991/92 2000/01 2011/12 Average
growth
rate
Exports 126.3 280.8 1,250.8 9.91 1.34 7.13 8.71 6.62
Imports 546.3 2,479.9 8,338.1 8.75 17.72 10.45 25.37 19.29
Page 31
Environment for Development Ferede et al.
Table 2. Share of Fuel Imports (%)
Share in 1991/92 2000/01 2011/12 1991/92-2011/12
Exports 42.0 52.0 40.9 51.0
Imports 31.8 35.5 11.6 28.5
GDP 0.6 3.7 3.7 3.1
Source: Computed from ERCA
Page 32
Environment for Development Ferede et al.
Table 3. Structure of Ethiopia's Economy in 2005/06
Share of total (%)
Export
Intensitya
(%)
Import
penetrationa
(%)
GDP Employment Exports Imports
Total 100.00 100.00 100.00 100.00 11.22 23.21
Agriculture 51.92 73.84 40.66 4.72 25.31 7.51
Cereal crops 14.91 22.94 0.00 3.51 0.00 16.05
Cash Crops 14.07 14.04 33.67 0.69 48.22 3.38
Sugar Cane 0.19 0.27 0.00 0.00 0.00 0.00
Jatropha 0.00 0.00 0.00 0.00 0.00 0.00
Castor Bean 0.00 0.00 0.00 0.00 0.00 0.00
Palm Oil 0.00 0.00 0.00 0.00 0.00 0.00
Livestock 13.42 20.05 3.02 0.00 15.07 0.00
Other Agriculture 4.93 7.88 3.97 0.52 30.40 7.81
Forestry and Fisheries 4.39 8.65 0.00 0.00 0.00 0.00
Non-Agriculture 48.09 26.16 59.34 95.28 8.12 25.89
Industry 10.34 7.31 19.07 70.97 6.55 35.20
Food processing 2.15 1.68 6.40 3.37 8.01 9.31
Biofuel processing 0.00 0.00 0.00 0.00 0.00 0.00
Ethanol processing 0.00 0.00 0.00 0.00 0.00 0.00
Other industrial processing 8.19 5.63 12.67 67.61 6.01 40.90
Services 37.75 18.85 40.27 24.31 9.16 14.61
Note: a ‘Export intensity’ is the share of exports in domestic output, ‘import penetration’ is the share of imports in total domestic demand. Sums of shares in
this table and subsequent tables may not equal to 100 due to rounding.
Source: Modified versions of Ethiopia’s 2005/06 social accounting matrix (SAM) with biofuels included.
Page 33
Environment for Development Ferede et al.
Table 4. Biofuel Investment by Agroecology
Type of feed stock used for the production of biofuel
Agro-ecological zone
Jatropha fruit Castor bean
seed
Palm oil Sugar cane
AEZ 1 Yes
AEZ 2 Yes
AEZ 3 Yes
AEZ 4 Yes Yes
AEZ 5 Yes
Source: Biofuel investment survey, 2010
Table 5. Overview of the Biofuels Sector in Ethiopia
Indicator Number / description
No of firms/companies >15 (incl. NGOs)
Total investment (capital) Multimillion >1.3 b ETB (>0.1 billion USD)
Investment (type) Largely foreign but also domestic
Land (000’ ha) >308 (currently operated); >101 (additional)
Year in operation Since 2005
Installed plant capacity 492 to 28,800 liters/day
Employment opportunities. >17,714 (Temp), >236 (Perm)
Crop types Sugarcane, jatropha, castor bean, palm oil
Technology Plantation and out-growers schemes
Regions All regions, Oromiya, SNNPR, Amhara, etc
Source: Results of biofuels investment survey 2010.
Page 34
Environment for Development Ferede et al.
30
Table 6. Biofuel Production Characteristics/Technical Coefficients
Sugarcane and ethanol Jatropha/castor bean diesel
Land employed (ha) 11,248.00 3,284.00
Biofuel crop production (tons) 569,168.00 200.00
Farm workers employed (in number) 5,365.00 4,384.00
Land yield 50.60 0.06
Farm labour yield 106.09 0.05
Land per capita 2.10 0.75
Capital per hectare 16.46 0.00
Labour-capital ratio 0.029 0.00
Biofuel produced (liters) 5,323,866.05 2,880.69
Processing workers employed 27 0.00
Feedstock yield (L/ton) 9.35 14.40
Processing labour yield 197,180.22
Source: Biofuel investment survey, 2010
Table 7. Core Macroeconomic Assumptions for the Dynamic CGE Model
Initial (2005) Baseline scenario (growth rates)
Population (in thousands) 70,167 2.5
GDP 100.0 2.54
Labour supply 40,479.4 7.0
Skilled labour 7.9 7.9
Professional labour-rural 5.0 5.0
Administrative labour-urban 5.0 5.0
Unskilled labour-urban 4.4 4.4
Agricultural labour-rural 4.4 4.4
Capital stock 56,455.9 10
Land supply 3.2 3.2
Page 35
Environment for Development Ferede et al.
31
Table 8. Scenarios for Biofuel Simulation
Scenarios
Technology
Plantation(Capital intensive) Out-grower (labour intensive)
(i) S1: Sugarcane S1
(ii) S2: Jatropha S2
(iii) S3: Castor bean S3
(iv) S4: Palm oil S4
(v) S5: Spillover effect S2+ improvements in smallholder
productivity
(vi) S6: Spillover effect S3+ improvements in smallholder
productivity
(vii) S7: Combined (i-iv) S1+S2+S3+S4+S5+S6
Figure 1. Trends in the Share of Fuel Imports in Total Value of Exports and Imports (%)
Source: Computed from ERCA data
Figure 2. Trends in the Share of Fuel Imports in GDP (%)
Source: Computed from ERCA data
Page 36
Environment for Development Ferede et al.
32
Figure 3. Trends in the Real Effective Exchange Rate
Source: National Bank of Ethiopia
Figure 4. Trends in the Balance of Payments (% GDP)
Source: ERCA
Figure 5. Share in Total Biofuel Crop Land by Biofuel Crop Type (%)
Source: Biofuel investment survey, 2010
Page 37
Environment for Development Ferede et al.
33
Figure 6. Ratio of Utilized Land to Total Land Allocated to Each Biofuel Crop (%)
Source: Computed from survey
Figure 7. GDP Effects of Biofuel Expansion (% Deviation from the Base, Average 2005-2020)
Source: CGE simulation
Figure 8. Sectoral Effects of Biofuel Expansion (% Deviation from the Base, Average 2005-2020)
Source: CGE simulation
Page 38
Environment for Development Ferede et al.
34
Figure 9. Effects of Biofuel Expansion on Cereals and Cash Crops (% Deviation from the Base, Average 2005-2020)
Source: CGE simulation
Figure 10. Effects of Biofuel Expansion on Exports and Imports (% Change from the Base, Average 2005-2020)
Source: CGE simulation
Figure 11. Effects of Biofuel Expansion on Real Exchange Rate (% Change from the Base, Average 2005-2020)
Source: CGE simulation