Abstract: Biofuels policy instruments are important in the development and diffusion of biogas as atransport fuel in Sweden. Their effectiveness with links to geodemographic conditions has not beenanalysed systematically in studying biogas development in a less urbanised regions, with high po-tential and primitive gas infrastructure. One such region identified is Gävleborg in Sweden. By usingvalue chain statistics, interviews with related actors, and studying biofuels policy instruments andimplications for biogas development, it is found that the policy measures have not been as effectivein the region as in the rest of Sweden due to different geodemographic characteristics of the region,which has resulted in impeded biogas development. In addition to factors found in previous studies,the less-developed biogas value chain in this region can be attributed particularly to undefinedrules of the game, which is lack of consensus on trade-off of resources and services, unnecessarycompetition among several fuel alternatives, as well as the ambiguity of municipalities’ prioritization,and regional cultural differences. To strengthen the regional biogas sector, system actors need astrategy to eliminate blocking effects of identified local factors, and national policy instrumentsshould provide mechanisms to process geographical conditions in regulatory, economic support,and market formation.
Keywords: biogas; transport; value chain; policy instruments; system analysis
1. Introduction
Globally the transport sector is one of the major sources contributing to greenhousegases (GHG) emission and requires an urgent transition from fossil to renewable fuelsto mitigate climate change. The GHG emissions from the Swedish road transport sectorwere 16.5 Mt CO2-eq. in 2018. This was approximately 79% of the total GHG emissionsfrom domestic transport and 32% of national GHG emissions excluding land use, land-usechange, and forestry (LULUCF). The increase in the net GHG emissions from road transportin 2018 was 4.1% since 1990. To mitigate environmental problems, several policies andtargets have been set by the European Union (EU) and its member states together withdifferent measures to achieve these goals. In Sweden, the share of renewables in transportwas 22% in 2017 [1], which had already crossed the EU mandate of 20% by 2020. (Measuredby energy content. The directive allows for double counting of transport biofuels thatare produced from residues or waste. In Sweden, the use of biogas and HVO producedfrom waste and residues is thus double counted, resulting in a higher value comparedto the share of renewables measured by energy content. Counting as specified in thedirective ) However, the Swedish government has set ambitious targets for the transportsector such as a fossil-independent vehicle fleet by 2030 and zero net GHG emissionsby 2045 [2]. To achieve these targets, one measure among others is to increase the useof different renewable fuels in the transport sector. For instance, biogas is a promisingrenewable transport fuel with production reached 2.1 TWh by 2017 and offers significantenvironmental, economic, and social benefits [3,4].
Biofuel development, in general, is dependent on many factors such as technical,economic, and political. The effect of policy incentives on the growth of biofuels hasalready been studied by many authors [5–7]. Biofuels and policy literature representdifferent geography and have analysed the subject from different perspectives. Someauthors [8–10] have analysed the national policy and other factors impacts the expansionof different biogas systems in the Netherlands, Ireland, and Sweden. They emphasised thatpolicies, in the long run, should focus on increasing incentives for all biogas value chainsegments simultaneously. They also suggested that the policy measures should facilitatethe introduction of biogas to the captive fleet, injection to the gas grid, and feed-in tariffregulation. Other studies, such as [11–15], identified different types of barriers to biogasdevelopment and use in transport from a national perspective in different EU memberstates. They found uncertainties regarding feedstock and fuel supply security, limited in-frastructure, and higher costs of alternative fuels and vehicles as significant factors limitingbiogas development. The recent studies [1,7,16–18] on policies, incentives, and barriersfor biogas development and use in transport from regional perspectives in Sweden fo-cused on well-developed and densely populated areas (i.e., Stockholm, Linköping, Skåneetc.) having a long history of gas infrastructure and related developments. According tothese studies, national biogas policy directions and incentive programs are powerful tools,but regional development is mostly dependent on specific local characteristics. Further,Gustafsson and Mignon [19], write that municipalities act as intermediate bodies in trans-lating the national vision and their strategies are highly influenced by local circumstancesand guided by local experiments, rather than central governance systems and nationalpolicies. Thus, subnational/regional boundary should be considered in understanding theadditional factors and policy issues that constraint biogas development as transport fuelsin a specific region of Sweden. Such analysis can also facilitate understanding what actorsat the regional level (including policymakers) can achieve by themselves and what can bebuilt on through an exogenous system (e.g., external support and policies).
Although the ‘geographical characteristics turn’ is well persuasive in biogas literatureon development and barriers, there is no study available that has systematically analysedthe influence of biofuels policy instruments and geodemographic characteristics on biogasas a transport fuel in a less urbanised region with scattered population and primitivegas infrastructure such as Gävleborg in Sweden. The Gävleborg region is utilizing onlyaround 10% of its total theoretical biogas potential (excluding forest biomass) [20]. For thisregion and other regions with similar geodemographic characteristics, there is a need tounderstand why the existing biogas potential has not been utilised. Therefore, this paperaims to fill the highlighted knowledge gap by identifying and analysing the role of themost relevant national biofuels policy instruments and geodemographic characteristics tothe biogas value chain development in the Gävleborg region. To fully address the aim ofthis study, the following research questions are to be answered:
1. How has biogas evolved as transport fuel in Gävleborg compared to rest of Sweden?2. What regional geodemographic characteristics have restricted biogas development
in Gävleborg?3. What lessons can be learnt to expand biogas as a transport fuel in Gävleborg and
similar regions?
Towards that end, the system under study, strategy for data collection and analysisare described first. Following these, analysis of Swedish biofuels policy instrumentsimplications to biogas as a transport fuel, the biogas development over time and alongthe value chain in Gävleborg are statistically presented and compared with the biogasdevelopment in the rest of Sweden. Subsequently, the factors affecting biogas developmentin the region and suggestions on actions to build on existing strengths and to eliminatenegative factors for further development of biogas as a transport fuel in Gävleborg andother similar regions are discussed.
Sustainability 2021, 13, 4560 3 of 20
2. Materials and Methods
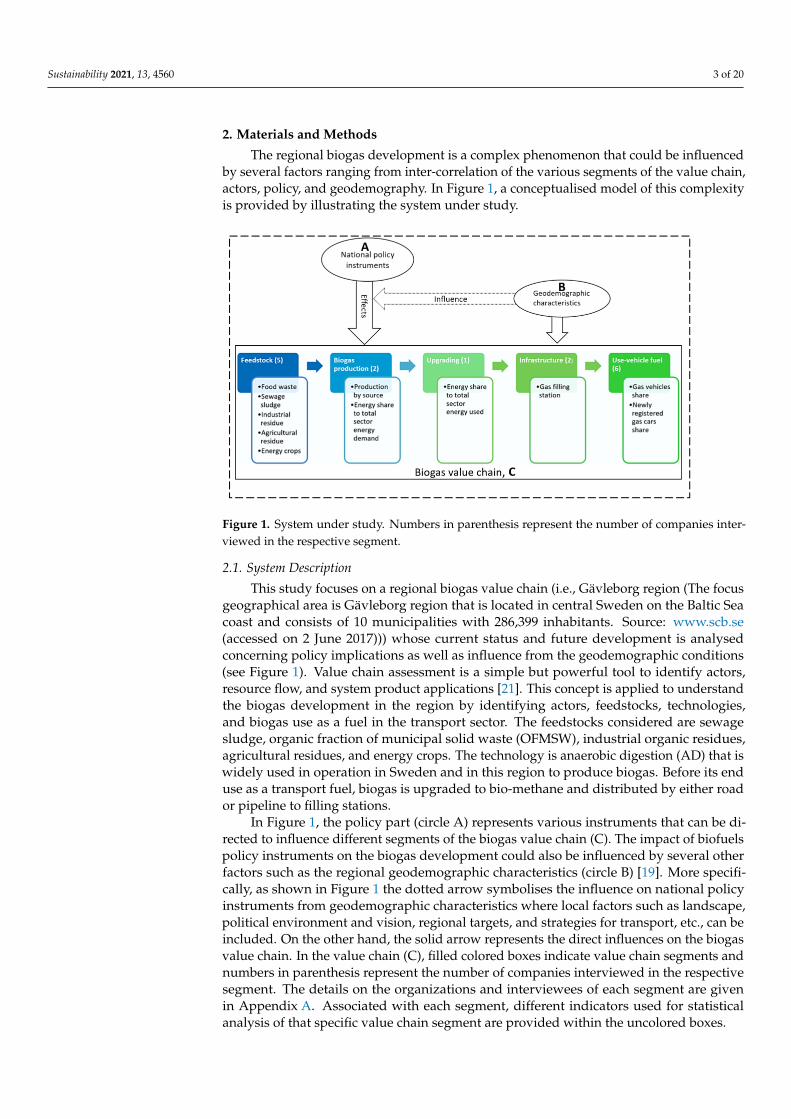
The regional biogas development is a complex phenomenon that could be influencedby several factors ranging from inter-correlation of the various segments of the value chain,actors, policy, and geodemography. In Figure 1, a conceptualised model of this complexityis provided by illustrating the system under study.
Sustainability 2021, 13, x FOR PEER REVIEW 3 of 21
the region and suggestions on actions to build on existing strengths and to eliminate neg-ative factors for further development of biogas as a transport fuel in Gävleborg and other similar regions are discussed.
2. Materials and Methods The regional biogas development is a complex phenomenon that could be influenced
by several factors ranging from inter-correlation of the various segments of the value chain, actors, policy, and geodemography. In Figure 1, a conceptualised model of this complexity is provided by illustrating the system under study.
2.1. System Description This study focuses on a regional biogas value chain (i.e., Gävleborg region (The focus
geographical area is Gävleborg region that is located in central Sweden on the Baltic Sea coast and consists of 10 municipalities with 286,399 inhabitants. Source: www.scb.se [ac-cessed on 2 June 2017]).) whose current status and future development is analysed con-cerning policy implications as well as influence from the geodemographic conditions (see Figure 1). Value chain assessment is a simple but powerful tool to identify actors, resource flow, and system product applications [21]. This concept is applied to understand the bi-ogas development in the region by identifying actors, feedstocks, technologies, and biogas use as a fuel in the transport sector. The feedstocks considered are sewage sludge, organic fraction of municipal solid waste (OFMSW), industrial organic residues, agricultural res-idues, and energy crops. The technology is anaerobic digestion (AD) that is widely used in operation in Sweden and in this region to produce biogas. Before its end use as a transport fuel, biogas is upgraded to bio-methane and distributed by either road or pipe-line to filling stations.
Figure 1. System under study. Numbers in parenthesis represent the number of companies inter-viewed in the respective segment.
In Figure 1, the policy part (circle A) represents various instruments that can be di-rected to influence different segments of the biogas value chain (C). The impact of biofuels policy instruments on the biogas development could also be influenced by several other factors such as the regional geodemographic characteristics (circle B) [19]. More specifi-cally, as shown in Figure 1 the dotted arrow symbolises the influence on national policy instruments from geodemographic characteristics where local factors such as landscape, political environment and vision, regional targets, and strategies for transport, etc., can be included. On the other hand, the solid arrow represents the direct influences on the biogas
Figure 1. System under study. Numbers in parenthesis represent the number of companies inter-viewed in the respective segment.
2.1. System Description
This study focuses on a regional biogas value chain (i.e., Gävleborg region (The focusgeographical area is Gävleborg region that is located in central Sweden on the Baltic Seacoast and consists of 10 municipalities with 286,399 inhabitants. Source: www.scb.se(accessed on 2 June 2017))) whose current status and future development is analysedconcerning policy implications as well as influence from the geodemographic conditions(see Figure 1). Value chain assessment is a simple but powerful tool to identify actors,resource flow, and system product applications [21]. This concept is applied to understandthe biogas development in the region by identifying actors, feedstocks, technologies,and biogas use as a fuel in the transport sector. The feedstocks considered are sewagesludge, organic fraction of municipal solid waste (OFMSW), industrial organic residues,agricultural residues, and energy crops. The technology is anaerobic digestion (AD) that iswidely used in operation in Sweden and in this region to produce biogas. Before its enduse as a transport fuel, biogas is upgraded to bio-methane and distributed by either roador pipeline to filling stations.
In Figure 1, the policy part (circle A) represents various instruments that can be di-rected to influence different segments of the biogas value chain (C). The impact of biofuelspolicy instruments on the biogas development could also be influenced by several otherfactors such as the regional geodemographic characteristics (circle B) [19]. More specifi-cally, as shown in Figure 1 the dotted arrow symbolises the influence on national policyinstruments from geodemographic characteristics where local factors such as landscape,political environment and vision, regional targets, and strategies for transport, etc., can beincluded. On the other hand, the solid arrow represents the direct influences on the biogasvalue chain. In the value chain (C), filled colored boxes indicate value chain segments andnumbers in parenthesis represent the number of companies interviewed in the respectivesegment. The details on the organizations and interviewees of each segment are givenin Appendix A. Associated with each segment, different indicators used for statisticalanalysis of that specific value chain segment are provided within the uncolored boxes.
Based on the nature of the research questions, different methods including literaturestudy, statistical analysis, and interviews with regional value chain actors were deployed.The statistics mostly obtained from published reports by Swedish Energy Agency (SEA)and Statistics Sweden (SCB) were compiled to analyse the actual development in the regionas well as in Sweden. The implications of different policy instruments to biogas devel-opment are summarised based on published material (i.e., articles and research reports).Interviews with the target groups were conducted to identify the regional geodemographicfactors and policy’s role in biogas development in the region. Other aspects that wereregarded as prerequisites (such as infrastructure, legitimacy, political beliefs, etc.) fora regional biogas expansion were also discussed. Initially, twenty actors/organizationswere identified as important players and approached through emails and phone calls tocheck the availability of the most relevant person(s) and their willingness to participatein an interview. The selection of the participating organizations was made to ensure thatthe whole value chain was covered, and the organizations have some form of functionin relation to biogas activities in the region. Fourteen organizations participated in theinterview process; brief information about the organization and the respondents are listedin Appendix A Table A1. The other six organizations, due to the unavailability of suitableresources, did not participate.
The interviews with the regional biogas value chain actors were conducted during2018 and 2019 and lasted between 1 and 2 hrs each. An approach called “responsive inter-viewing” was used [22]. This approach “relies heavily on the interpretive constructionistphilosophy, mixed with a bit of critical theory, and then shaped by the practical needs ofdoing interviews” (ibid). Interviews were preferred over questionnaires because somequestions required elaboration from some of the actors involved. The interview questionscan be divided into three types: main questions, follow-up questions and probes. The mainquestions were designed to focus on the research problem (i.e., what is lacking?) and to stayon target with addressing the research puzzle. The follow-up and probe questions wereasked to ensure that we pursued depth, detail, vividness, richness, and nuance. The focuswas on the research questions, but there was also room for each respondent to elaborate onissues they considered challenging and important. The interview questions were preparedusing the key terms policies, support schemes, regulations, influencing factors outsidenational policies and regulations, and actions required for biogas expansion as a transportfuel in the region. Some sample interview questions are given in Appendix B.
3. Policy Instruments and Implications to Biogas
The national policy instruments on biofuels development are assumed as politicallyderived tools that can be applied to different segments of the biofuels value chain toinfluence its development. These instruments can be categorised as economic, fiscal,regulatory, information, and research, development, and demonstration (RD&D) [23].The fiscal, economic and regulatory policy instruments have been regarded as the mostpowerful and effective ones in developing the biofuel industry and market for alternativetransport fuels in Sweden [24–26]. Table 1 summarises the fiscal, regulatory, and economicinstruments that are related to biofuels development for transport in Sweden, and theirimplications to biogas value chain based on peer-reviewed scientific literature mainly.
It is difficult to differentiate the effect of an individual policy instrument due to theoverlap of different instruments in time and continuation of a programme in a differentform as well as from other factors on biogas development. It is a complex situation and therecould be synergetic effects of a combination of different instruments. For example, energyand CO2 tax exemptions for biofuels reduce prices and make the fuels competitive withfossil fuels, while the same type of tax on fossil fuels creates a market for biofuels throughthe blend-in option. Another point is the period when considering the policy instrumentsfor effect analysis; often there is a time lag of one to four years between an investmentdecision and the production start for a complete biogas facility [11]. If initial planning time
Sustainability 2021, 13, 4560 5 of 20
is also considered, this time lag could be six to eight years. Thus, it is reasonable to considera policy instrument available six to eight years back, such as the climate investmentprogram (KLIMP), from the starting year of statistical analysis. The implications of policyinstruments (Table 1) indicate that the measures have had more focus on market i.e., use ofbiogas or biofuels as vehicle fuel than other segments. For example, higher tax exemptionbenefits biogas as transport fuel, green vehicles rebate, public procurement, and supportfor renewable fuel supply have incentive the use as vehicle fuel segment of the value chain.
Table 1. Swedish national policy instruments and measures with their implications for biogas in the transport sector.
Type Year (Start-End) Policy Instrument Name Implications
Fiscal
(2004-) Full energy and carbon taxexemption for biofuels [27]
It is considered as one of the most important policyinstruments in the introduction of renewable fuels inSweden. The combination of the instruments mayhave synergy effects, but this instrument has been
the single most influential. It reduced the end price,and thus made biogas use as transport fuel
competitive [11]. It has a lower effect on productionthan on use segment [24].
(2010-)Tax exemption for
environmentally friendlyvehicles [28]
Influenced the choice of vehicles whenenvironmentally friendly technology is beingpreferred. The choice is strongly connected to
financial incentives, fueling infrastructure, vehicletechnology and availability of different models and
their resale market value [7].
(2011-) Energy and CO2 tax on fossilfuels [27]
It favoured renewable energy demand in general butparticularly the use of renewable fuels in the
domestic transport sector [29].
Regulatory
(2002-)Ban on landfilling organic
materials and methanecollection [30]
Favoured anaerobic digestion (AD) of organic wastewith energy recovery (e.g., biogas). In Sweden, in2011, 24% of municipal food waste was treated inAD with biogas production while in 2016–2017, it
was 35%. Lower incentives for related infrastructuredevelopment needs to be made expensive in somemunicipalities and acted as a barrier to break the
lock-in effect of conventional waste treatmentmethods, i.e., incineration [10,11,29].
(2006-) Requirements of renewablefuels at filling stations [31]
In general, this instrument has been very effective inimproving biofuel infrastructure in Sweden but not
so effective for the regions with no natural gasnetwork and biogas production. About 57 new
vehicle gas filling stations were constructed between2007 and 2010 and by the end of 2017; there were
185 vehicle gas pumps in Sweden [7,24]
(2009-) Green public procurement [32]
The instrument improved the knowledge andexperience of companies and municipalities on
mechanisms of diffusion of new technology. Provedto be a successful tool in creating an early market for
alternative fuels and vehicles. Still, in manymunicipalities, the public transport fleet is the mainbuyer and user of biogas as a transport fuel [7,29,33].
Sustainability 2021, 13, 4560 6 of 20
Table 1. Cont.
Type Year (Start-End) Policy Instrument Name Implications
Economic
(1998–2002) Local Investment Programme(LIP) [34]
A predecessor of KLIMP. Biogas infrastructuredevelopment programs also benefited in addition to
KLIMP enabled municipalities and other local actorsto receive financial support for projects that reduceGHG emissions. Mature technologies benefited most
because the most cost and emission reductionefficient solutions were awarded. Supported several
biogas plants, mainly large projects in whichmunicipalities took an active part [10,26]. The grants
have been given to 67 municipalities, sevenmunicipal associations, five regional councils and
four companies in Sweden [36].
(2009–2020)The Rural Development
Programme 2009–2013 and2014–2020 [37,38]
Available only for farmers for climate emissionsreduction projects. Due to limited subsidy (EUR200,000, or 30–50% of the investment), large-scale
production of biogas from manure could not benefit,nor does it increase the incentives for actors outside
the agricultural sector [11].
(2013–2020)Investment support; production,infrastructure and use of biogas
[32]
A powerful incentive, if given in sufficient amounts.The program focused on support to novel
technologies for demonstration projects. The effectsof the program on biogas production and use werelimited due to the very low support premium [10].
(2015–2020) Local climate investmentprogram [39]
Several biogas plants and infrastructure projects,e.g., gas filling stations received support [25]. Mostcost-effective and mature technology solutions were
awarded [24].
(2007–2009) Green car rebate [40] The instrument did not affect the biogas marketmuch due to the very low premium [7,26].
(2009-) Support for renewable fuelssupply [32]
An important incentive that significantly increasedthe number of renewable fuel filling stations.
However, the impact of the program was smallerthan expected on biogas infrastructure developmentdue to issues regarding the supply and demand ofbiogas and vehicles as well as the structure of the
grant [41].
(2011-) Super-green car rebate [40]
This has a neutral effect on the biogas passenger carmarket but increased the drive of the introduction of
electric technology and vehicles. Boosts the greenvehicle technology debate that influenced
individuals and companies [7,24,26].
(2009–2020)Lower benefit value on cars
with advanced environmentaltechnology [25]
Benefits companies in car leasing business and taxi.There has been very little impact on the biogas
market [7,26].
4. Results-Value Chain Development4.1. Feedstock
Figure 2 shows the share of different feedstocks for biogas production in Gävleborg aswell as the rest of Sweden. This is not limited to biogas production used in the transport sec-tor, but rather total raw biogas produced in Gävleborg and the rest of Sweden. The purposehere is not to show the amount of feedstock but rather to show the trend on different typesof feedstock entered into the biogas production system over time. Sewage sludge fromwastewater treatment plants has been the main feedstock for biogas production in boththe Gävleborg region and Sweden. Since 2008, other feedstocks such as manure, foodwaste and industrial waste have increased on the national level (Figure 2a) but this wasnot the case in the region until the biogas plant (Forsbacka) started its operations in 2017
Sustainability 2021, 13, 4560 7 of 20
with source-separated food waste as the main substrate. In 2018–2019, horse manure wasadded as a substrate during co-digestion (Figure 2b). It is worth highlighting here that thiskind of feedstock for biogas production has been very limited in this region and develop-ment related to the installation of a biogas plant started very late. It is why other typesof feedstocks were not used in the regional biogas production. From policy instrumentsimplications perspective (Table 1), it is difficult to relate a specific policy instrument tothe development of using other types of feedstocks for biogas production in Sweden andGävleborg due to the complexity of the biogas system and synergetic effects of the differentpolicy instruments. However, based on Table 1, the rural development program, KLIMP,and partially the ban on the landfill of organic waste can be assumed to play importantroles in turning manure and food waste into the biogas production system in Sweden, butthis argument does not seem valid for the Gävleborg region until 2017–2018, even if thefeedstocks were available.
Sustainability 2021, 13, x FOR PEER REVIEW 7 of 21
types of feedstocks were not used in the regional biogas production. From policy instru-ments implications perspective (Table 1), it is difficult to relate a specific policy instrument to the development of using other types of feedstocks for biogas production in Sweden and Gävleborg due to the complexity of the biogas system and synergetic effects of the different policy instruments. However, based on Table 1, the rural development program, KLIMP, and partially the ban on the landfill of organic waste can be assumed to play im-portant roles in turning manure and food waste into the biogas production system in Swe-den, but this argument does not seem valid for the Gävleborg region until 2017–18, even if the feedstocks were available.
Figure 2. Feedstocks used for biogas production [(a): Sweden, (b): Gävleborg region] [42].
However, some actors during interviews mentioned that two projects (Biogas Mel-lanNorrland (Biogas Mellannorrland AB was owned by three municipalities [Sundsvall, Östersund och Hudiksvall]. Hudiksvall is a municipality of Gävleborg Region. [https://sundsvall.se/kommun-och-politik/overklaga-beslut-rattssakerhet/moten-och-protokoll/bolag-och-forbund/biogas-mellannorrland-ab/] [accessed on 20 January 2021]) and SETA) in the Gävleborg region received grants in 2011–12 for producing biogas from manure and agricultural residue, but could not continue, predominantly due to higher biogas production costs, and longer transport distances and maintenance than for similar projects at other locations in Sweden. Forsbacka biogas plant in Gävle was partially funded by the local climate investment program. The plant has been designed to work with 25,000 tonnes of feedstock per year; however, in 2018 the plant was working with an average of 14,808 t/year correspond to the co-digestion of 80% of source-separated food waste from households and groceries, and 20% of green waste (Garden waste usually con-sists of tree branches, grass.). Around 4.3% of the total input feedstock correspond to a semi-liquid residue such as food slurry/grease sludge collected from regional large kitch-ens and restaurants. Depending on the methane yield of the substrate, the plant at full capacity can produce 1.6–1.9 million Nm3 CH4 gas per year, whereas the regional theoret-ical biogas production potential is around 23 million Nm3CH4/year [20], which indicates that a lot more food waste, green waste, and food slurry/grease are available in the region than that used today.
4.2. Production and Upgrading Until 2001, almost all biogas produced in Sweden was used for heat and electricity
production [42]. However, after 2003, a combination of several policy instruments such as energy and CO2 tax, public procurement, green car rebate, renewable fuel supply, and emission reduction requirements on fossil fuels, etc. (Table 1), promoted biogas upgrad-ing and use in transport. In 2017, around 64% of the produced raw biogas in Sweden was upgraded and mainly used as a transport fuel [42]. In this section, we use ‘share of biogas energy input to road transport sector energy demand’ as an indicator to compare the de-velopment of biogas production and upgrading in the region in relation to the rest of Swe-den. Here, it is also assumed that all the upgraded biogas is used as a transport fuel. It can be seen in Figure 3 that the development of regional biogas production is seemingly fol-
Figure 2. Feedstocks used for biogas production [(a): Sweden, (b): Gävleborg region] [42].
However, some actors during interviews mentioned that two projects (Biogas Mel-lanNorrland (Biogas Mellannorrland AB was owned by three municipalities [Sundsvall,Östersund och Hudiksvall]. Hudiksvall is a municipality of Gävleborg Region. [https://sundsvall.se/kommun-och-politik/overklaga-beslut-rattssakerhet/moten-och-protokoll/bolag-och-forbund/biogas-mellannorrland-ab/] (accessed on 20 January 2021) and SETA)in the Gävleborg region received grants in 2011–2012 for producing biogas from manureand agricultural residue, but could not continue, predominantly due to higher biogas pro-duction costs, and longer transport distances and maintenance than for similar projects atother locations in Sweden. Forsbacka biogas plant in Gävle was partially funded by the lo-cal climate investment program. The plant has been designed to work with 25,000 tonnes offeedstock per year; however, in 2018 the plant was working with an average of 14,808 t/yearcorrespond to the co-digestion of 80% of source-separated food waste from households andgroceries, and 20% of green waste (Garden waste usually consists of tree branches, grass).Around 4.3% of the total input feedstock correspond to a semi-liquid residue such as foodslurry/grease sludge collected from regional large kitchens and restaurants. Depending onthe methane yield of the substrate, the plant at full capacity can produce 1.6–1.9 millionNm3 CH4 gas per year, whereas the regional theoretical biogas production potential isaround 23 million Nm3CH4/year [20], which indicates that a lot more food waste, greenwaste, and food slurry/grease are available in the region than that used today.
4.2. Production and Upgrading
Until 2001, almost all biogas produced in Sweden was used for heat and electric-ity production [42]. However, after 2003, a combination of several policy instrumentssuch as energy and CO2 tax, public procurement, green car rebate, renewable fuel supply,and emission reduction requirements on fossil fuels, etc. (Table 1), promoted biogas up-grading and use in transport. In 2017, around 64% of the produced raw biogas in Swedenwas upgraded and mainly used as a transport fuel [42]. In this section, we use ‘share ofbiogas energy input to road transport sector energy demand’ as an indicator to comparethe development of biogas production and upgrading in the region in relation to the rest ofSweden. Here, it is also assumed that all the upgraded biogas is used as a transport fuel.
It can be seen in Figure 3 that the development of regional biogas production is seeminglyfollowing the national trend. However, the share of upgraded biogas to the total sectorenergy demand has been almost zero in the region until 2010, mainly due to the lack ofupgrading facilities. Even though biogas upgrading started in 2011, the share remainedconsiderably lower (around 0.25%) until the end of 2018 in the region compared to thenational average (1.75%). However, within 2019, a sharp increase of about almost 80%(from 0.25 to 0.75) in the use of upgraded biogas as a transport fuel has happened in theGävleborg region which should be linked to an increase in the number of biogas buses(around 40) in the public transport in Gävle. From this situation, it could be assumed thatthe biogas production and upgrading segments of the value chain in the region has beenrestricted by late municipalities decisions concerning public procurement of biogas-drivenvehicles. Consequently, due to lower market demand in 2017–18, not all of the producedbiogas in the region was upgraded; most often, the biogas not upgraded was flared. Fur-thermore, this lower market demand issue can also be attributed to gas filling stationinfrastructure and regional politics (see, Section 5). The programs (public procurement,tax on fossil fuels and exemption for biofuels) have been very successful in creating anupgraded biogas market in many parts of Sweden (Table 1), but the impact of these policyinstruments in the region is constrained by the regional political decisions.
Sustainability 2021, 13, x FOR PEER REVIEW 8 of 21
lowing the national trend. However, the share of upgraded biogas to the total sector en-ergy demand has been almost zero in the region until 2010, mainly due to the lack of up-grading facilities. Even though biogas upgrading started in 2011, the share remained con-siderably lower (around 0.25%) until the end of 2018 in the region compared to the na-tional average (1.75%). However, within 2019, a sharp increase of about almost 80% (from 0.25 to 0.75) in the use of upgraded biogas as a transport fuel has happened in the Gäv-leborg region which should be linked to an increase in the number of biogas buses (around 40) in the public transport in Gävle. From this situation, it could be assumed that the bio-gas production and upgrading segments of the value chain in the region has been re-stricted by late municipalities decisions concerning public procurement of biogas-driven vehicles. Consequently, due to lower market demand in 2017–18, not all of the produced biogas in the region was upgraded; most often, the biogas not upgraded was flared. Fur-thermore, this lower market demand issue can also be attributed to gas filling station in-frastructure and regional politics (see, Section 5). The programs (public procurement, tax on fossil fuels and exemption for biofuels) have been very successful in creating an up-graded biogas market in many parts of Sweden (Table 1), but the impact of these policy instruments in the region is constrained by the regional political decisions.
Figure 3. Share of raw and upgraded biogas to total transport sector energy consumption[42].
4.3. Infrastructure For successful penetration of new vehicle fuel technology, filling stations should cor-
respond to 5–20% of the number of conventional filling stations [11]. In 2017, there were 2970 petrol stations in Sweden and 250 gas stations (190 public and 60 non-public). (Non-public gas stations are mainly targeted at the private sector such as taxi companies. Bus filling stations are usually reserved for public transport buses, as they are the main user of biogas in Sweden. This categorization is to ensure security of supply, as not all filling stations are connected to the gas network.) Based on these statistics, the percentage of gas filling stations was 6.9% in Sweden, which is in the range of 5–20%. However, the infra-structure situation varies greatly between regions. Regions with an existing gas network and high population density, particularly southern counties, have shown faster develop-ment in building gas infrastructure and creating market demand compared to northern counties having no prior gas infrastructure such as Gävleborg.
In Sweden, gas filling stations have continually increased over the last decade but this has not happened in the Gävleborg region (Figure 4). In the region, total gas filling stations (public and non-public) are two; the first one was built in 2010 at Gävle and the
Share, raw biogas to total road transport sector energy consumption (GWh)-Gävleborg
Share, raw biogas to total road transport sector energy consumption (GWh)-Sweden
Share, upgraded biogas to total road transport sector energy consumption (GWh)-Sweden
Share, upgraded biogas to total road transport sector energy consumption (GWh)-Gävleborg
Figure 3. Share of raw and upgraded biogas to total transport sector energy consumption [42].
4.3. Infrastructure
For successful penetration of new vehicle fuel technology, filling stations shouldcorrespond to 5–20% of the number of conventional filling stations [11]. In 2017, therewere 2970 petrol stations in Sweden and 250 gas stations (190 public and 60 non-public).(Non-public gas stations are mainly targeted at the private sector such as taxi companies.Bus filling stations are usually reserved for public transport buses, as they are the mainuser of biogas in Sweden. This categorization is to ensure security of supply, as not allfilling stations are connected to the gas network.) Based on these statistics, the percentageof gas filling stations was 6.9% in Sweden, which is in the range of 5–20%. However,the infrastructure situation varies greatly between regions. Regions with an existing gasnetwork and high population density, particularly southern counties, have shown fasterdevelopment in building gas infrastructure and creating market demand compared tonorthern counties having no prior gas infrastructure such as Gävleborg.
In Sweden, gas filling stations have continually increased over the last decade but thishas not happened in the Gävleborg region (Figure 4). In the region, total gas filling stations(public and non-public) are two; the first one was built in 2010 at Gävle and the second in
Sustainability 2021, 13, 4560 9 of 20
2017 at the Forsbacka biogas plant. Both are in the municipality of Gävle, implying that theremaining nine municipalities in the region have no gas filling stations. However, there is aplan to build more gas filling stations (around five) in the region by 2021–2022 (Personalcommunication with Eklund Öberg, Å. energy and climate coordinator, Gävleborg regionadministrative board (dated: 3 October 2019)). The policy instruments such as KLIMP, localclimate investment, support for renewable fuel supply, etc., have shown great contributionsto biogas infrastructure development in Sweden generally (Table 1), but this seems minorin the region.
Sustainability 2021, 13, x FOR PEER REVIEW 9 of 21
second in 2017 at the Forsbacka biogas plant. Both are in the municipality of Gävle, implying that the remaining nine municipalities in the region have no gas filling stations. However, there is a plan to build more gas filling stations (around five) in the region by 2021–22 (Personal communication with Eklund Öberg, Å. energy and climate coordinator, Gävleborg region administrative board (dated: 3 October 2019)). The policy instruments such as KLIMP, local climate investment, support for renewable fuel supply, etc., have shown great contributions to biogas infrastructure development in Sweden generally (Table 1), but this seems minor in the region.
Figure 4. Vehicle gas filling stations [42].
4.4. Use as a Vehicle Fuel The use of biogas buses in public transport in Sweden led to the early market for-
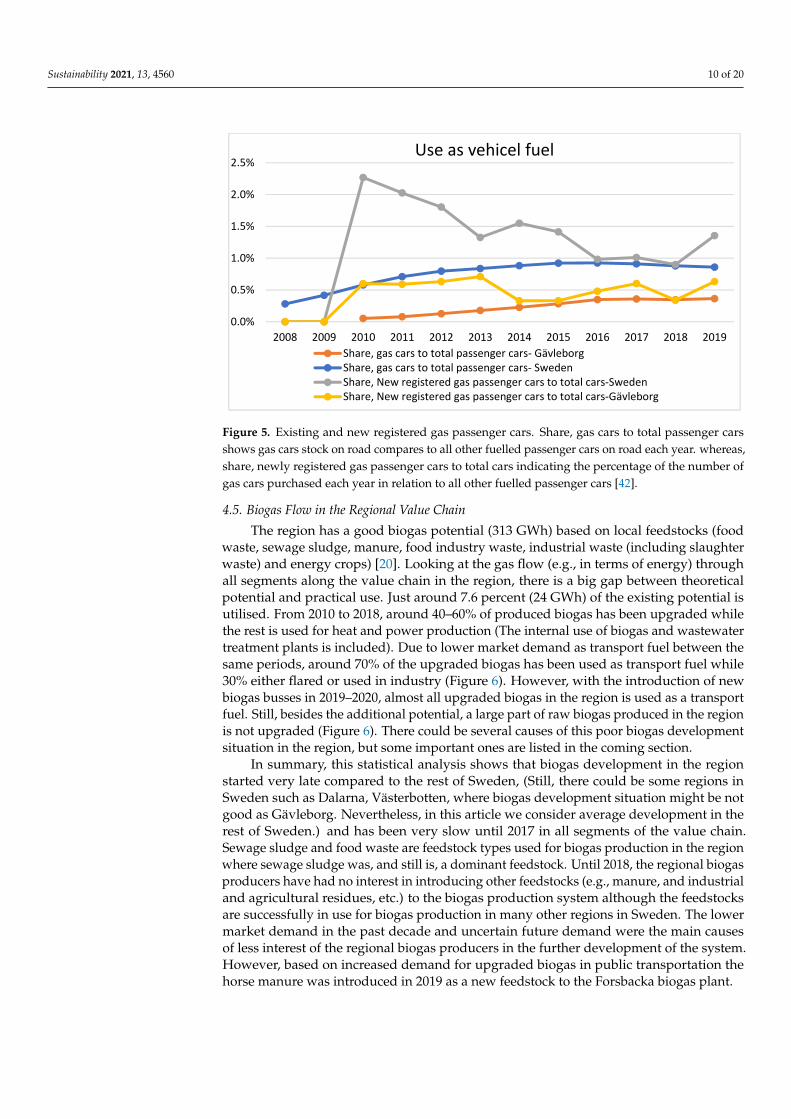
mation for biogas as a transport fuel. This was further promoted through public procure-ment policy instrument [11]. In the Gävleborg region, initially, Gävle municipality intro-duced biogas as transport fuel with biogas buses in the public transport and biogas cars in the municipal vehicle fleet. Since 2010, the number of biogas buses remained around 40–45 until 2018 but this number has reached 90 in 2020 (this is based on the interview with Biodrivmitt and Xtrafik; official statistics were not updated), which is a big develop-ment in the region. The share of gas passenger cars in the region is five times lower than the national average. However, Figure 5 indicates that the gas cars have a better trend in Gävleborg than in Sweden as a whole. At least, the share of new gas cars sold has been quite stable compared to a decline on the national level. Passenger cars and buses (public transport) are the main users of vehicle gas, but interest in introducing liquefied vehicle gas for heavy-duty transport and shipping is developing fast in Sweden (Energy gas Swe-den, 2019).
The gas cars in the region are mostly owned by the municipality of Gävle and organ-izations working for the municipality. There are some biogas trucks and cars at Sandviken probably due to the availability of gas filling stations at Forsbacka and Gävle city. The rest eight municipalities of the region have no gas vehicles. This could be because of many reasons but the most prominent ones are lack of gas filling stations and political support (see Section 6 for details). The green car rebate programs have shown a contribution to increased sale of gas and other green cars in Stockholm [11] and other regions in Sweden (Table 1). This might be the case in Gävle although the companies interviewed have had very less knowledge about the related policy instruments.
Non-public vehicle gas filling stations-Sweden Bus & others vehicles gas filling stations-SwedenPublic vehicle gas filling stations-Sweden Total vehicle gas filling stations-Gävleborg
Figure 4. Vehicle gas filling stations [42].
4.4. Use as a Vehicle Fuel
The use of biogas buses in public transport in Sweden led to the early market formationfor biogas as a transport fuel. This was further promoted through public procurementpolicy instrument [11]. In the Gävleborg region, initially, Gävle municipality introducedbiogas as transport fuel with biogas buses in the public transport and biogas cars in themunicipal vehicle fleet. Since 2010, the number of biogas buses remained around 40–45until 2018 but this number has reached 90 in 2020 (this is based on the interview withBiodrivmitt and Xtrafik; official statistics were not updated), which is a big developmentin the region. The share of gas passenger cars in the region is five times lower than thenational average. However, Figure 5 indicates that the gas cars have a better trend inGävleborg than in Sweden as a whole. At least, the share of new gas cars sold has beenquite stable compared to a decline on the national level. Passenger cars and buses (publictransport) are the main users of vehicle gas, but interest in introducing liquefied vehiclegas for heavy-duty transport and shipping is developing fast in Sweden (Energy gasSweden, 2019).
The gas cars in the region are mostly owned by the municipality of Gävle and organi-zations working for the municipality. There are some biogas trucks and cars at Sandvikenprobably due to the availability of gas filling stations at Forsbacka and Gävle city. The resteight municipalities of the region have no gas vehicles. This could be because of manyreasons but the most prominent ones are lack of gas filling stations and political support(see Section 6 for details). The green car rebate programs have shown a contribution toincreased sale of gas and other green cars in Stockholm [11] and other regions in Sweden(Table 1). This might be the case in Gävle although the companies interviewed have hadvery less knowledge about the related policy instruments.
Sustainability 2021, 13, 4560 10 of 20Sustainability 2021, 13, x FOR PEER REVIEW 10 of 21
Figure 5. Existing and new registered gas passenger cars. Share, gas cars to total passenger cars shows gas cars stock on road compares to all other fuelled passenger cars on road each year. whereas, share, newly registered gas passenger cars to total cars indicating the percentage of the number of gas cars purchased each year in relation to all other fuelled passenger cars [42].
4.5. Biogas Flow in the Regional Value Chain The region has a good biogas potential (313 GWh) based on local feedstocks (food
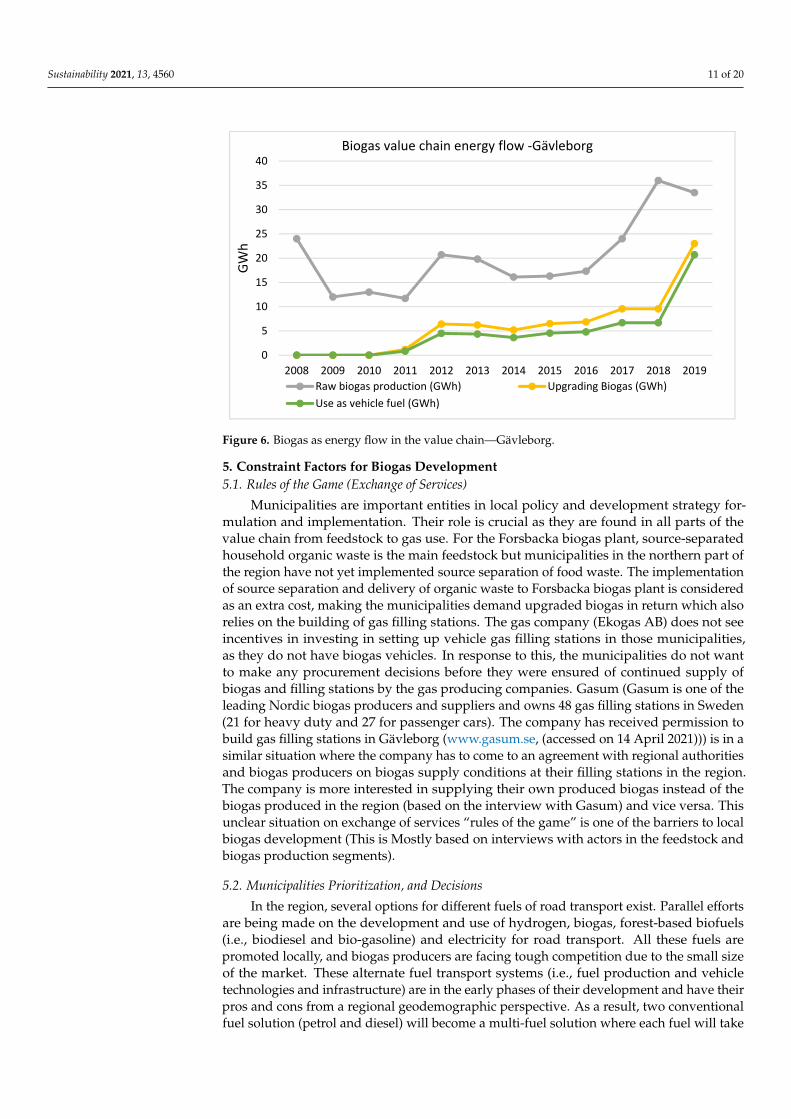
waste, sewage sludge, manure, food industry waste, industrial waste (including slaughter waste) and energy crops) [20]. Looking at the gas flow (e.g., in terms of energy) through all segments along the value chain in the region, there is a big gap between theoretical potential and practical use. Just around 7.6 percent (24 GWh) of the existing potential is utilised. From 2010 to 2018, around 40–60% of produced biogas has been upgraded while the rest is used for heat and power production (The internal use of biogas and wastewater treatment plants is included.). Due to lower market demand as transport fuel between the same periods, around 70% of the upgraded biogas has been used as transport fuel while 30% either flared or used in industry (Figure 6). However, with the introduction of new biogas busses in 2019–20, almost all upgraded biogas in the region is used as a transport fuel. Still, besides the additional potential, a large part of raw biogas produced in the re-gion is not upgraded (Figure 6). There could be several causes of this poor biogas devel-opment situation in the region, but some important ones are listed in the coming section.
Share, gas cars to total passenger cars- GävleborgShare, gas cars to total passenger cars- SwedenShare, New registered gas passenger cars to total cars-SwedenShare, New registered gas passenger cars to total cars-Gävleborg
Figure 5. Existing and new registered gas passenger cars. Share, gas cars to total passenger carsshows gas cars stock on road compares to all other fuelled passenger cars on road each year. whereas,share, newly registered gas passenger cars to total cars indicating the percentage of the number ofgas cars purchased each year in relation to all other fuelled passenger cars [42].
4.5. Biogas Flow in the Regional Value Chain
The region has a good biogas potential (313 GWh) based on local feedstocks (foodwaste, sewage sludge, manure, food industry waste, industrial waste (including slaughterwaste) and energy crops) [20]. Looking at the gas flow (e.g., in terms of energy) throughall segments along the value chain in the region, there is a big gap between theoreticalpotential and practical use. Just around 7.6 percent (24 GWh) of the existing potential isutilised. From 2010 to 2018, around 40–60% of produced biogas has been upgraded whilethe rest is used for heat and power production (The internal use of biogas and wastewatertreatment plants is included). Due to lower market demand as transport fuel between thesame periods, around 70% of the upgraded biogas has been used as transport fuel while30% either flared or used in industry (Figure 6). However, with the introduction of newbiogas busses in 2019–2020, almost all upgraded biogas in the region is used as a transportfuel. Still, besides the additional potential, a large part of raw biogas produced in the regionis not upgraded (Figure 6). There could be several causes of this poor biogas developmentsituation in the region, but some important ones are listed in the coming section.
In summary, this statistical analysis shows that biogas development in the regionstarted very late compared to the rest of Sweden, (Still, there could be some regions inSweden such as Dalarna, Västerbotten, where biogas development situation might be notgood as Gävleborg. Nevertheless, in this article we consider average development in therest of Sweden.) and has been very slow until 2017 in all segments of the value chain.Sewage sludge and food waste are feedstock types used for biogas production in the regionwhere sewage sludge was, and still is, a dominant feedstock. Until 2018, the regional biogasproducers have had no interest in introducing other feedstocks (e.g., manure, and industrialand agricultural residues, etc.) to the biogas production system although the feedstocksare successfully in use for biogas production in many other regions in Sweden. The lowermarket demand in the past decade and uncertain future demand were the main causesof less interest of the regional biogas producers in the further development of the system.However, based on increased demand for upgraded biogas in public transportation thehorse manure was introduced in 2019 as a new feedstock to the Forsbacka biogas plant.
Sustainability 2021, 13, 4560 11 of 20Sustainability 2021, 13, x FOR PEER REVIEW 11 of 21
Figure 6. Biogas as energy flow in the value chain—Gävleborg.
In summary, this statistical analysis shows that biogas development in the region started very late compared to the rest of Sweden, (Still, there could be some regions in Sweden such as Dalarna, Västerbotten, where biogas development situation might be not good as Gävleborg. Nevertheless, in this article we consider average development in the rest of Sweden.) and has been very slow until 2017 in all segments of the value chain. Sewage sludge and food waste are feedstock types used for biogas production in the re-gion where sewage sludge was, and still is, a dominant feedstock. Until 2018, the regional biogas producers have had no interest in introducing other feedstocks (e.g., manure, and industrial and agricultural residues, etc.) to the biogas production system although the feedstocks are successfully in use for biogas production in many other regions in Sweden. The lower market demand in the past decade and uncertain future demand were the main causes of less interest of the regional biogas producers in the further development of the system. However, based on increased demand for upgraded biogas in public transporta-tion the horse manure was introduced in 2019 as a new feedstock to the Forsbacka biogas plant.
5. Constraint Factors for Biogas Development 5.1. Rules of the Game (Exchange of Services)
Municipalities are important entities in local policy and development strategy for-mulation and implementation. Their role is crucial as they are found in all parts of the value chain from feedstock to gas use. For the Forsbacka biogas plant, source-separated household organic waste is the main feedstock but municipalities in the northern part of the region have not yet implemented source separation of food waste. The implementa-tion of source separation and delivery of organic waste to Forsbacka biogas plant is con-sidered as an extra cost, making the municipalities demand upgraded biogas in return which also relies on the building of gas filling stations. The gas company (Ekogas AB) does not see incentives in investing in setting up vehicle gas filling stations in those mu-nicipalities, as they do not have biogas vehicles. In response to this, the municipalities do not want to make any procurement decisions before they were ensured of continued sup-ply of biogas and filling stations by the gas producing companies. Gasum (Gasum is one of the leading Nordic biogas producers and suppliers and owns 48 gas filling stations in Sweden (21 for heavy duty and 27 for passenger cars). The company has received permis-sion to build gas filling stations in Gävleborg (www.gasum.se).) is in a similar situation where the company has to come to an agreement with regional authorities and biogas
Raw biogas production (GWh) Upgrading Biogas (GWh)Use as vehicle fuel (GWh)
Figure 6. Biogas as energy flow in the value chain—Gävleborg.
5. Constraint Factors for Biogas Development5.1. Rules of the Game (Exchange of Services)
Municipalities are important entities in local policy and development strategy for-mulation and implementation. Their role is crucial as they are found in all parts of thevalue chain from feedstock to gas use. For the Forsbacka biogas plant, source-separatedhousehold organic waste is the main feedstock but municipalities in the northern part ofthe region have not yet implemented source separation of food waste. The implementationof source separation and delivery of organic waste to Forsbacka biogas plant is consideredas an extra cost, making the municipalities demand upgraded biogas in return which alsorelies on the building of gas filling stations. The gas company (Ekogas AB) does not seeincentives in investing in setting up vehicle gas filling stations in those municipalities,as they do not have biogas vehicles. In response to this, the municipalities do not wantto make any procurement decisions before they were ensured of continued supply ofbiogas and filling stations by the gas producing companies. Gasum (Gasum is one of theleading Nordic biogas producers and suppliers and owns 48 gas filling stations in Sweden(21 for heavy duty and 27 for passenger cars). The company has received permission tobuild gas filling stations in Gävleborg (www.gasum.se, (accessed on 14 April 2021))) is in asimilar situation where the company has to come to an agreement with regional authoritiesand biogas producers on biogas supply conditions at their filling stations in the region.The company is more interested in supplying their own produced biogas instead of thebiogas produced in the region (based on the interview with Gasum) and vice versa. Thisunclear situation on exchange of services “rules of the game” is one of the barriers to localbiogas development (This is Mostly based on interviews with actors in the feedstock andbiogas production segments).
5.2. Municipalities Prioritization, and Decisions
In the region, several options for different fuels of road transport exist. Parallel effortsare being made on the development and use of hydrogen, biogas, forest-based biofuels(i.e., biodiesel and bio-gasoline) and electricity for road transport. All these fuels arepromoted locally, and biogas producers are facing tough competition due to the small sizeof the market. These alternate fuel transport systems (i.e., fuel production and vehicletechnologies and infrastructure) are in the early phases of their development and have theirpros and cons from a regional geodemographic perspective. As a result, two conventionalfuel solution (petrol and diesel) will become a multi-fuel solution where each fuel will take
its relevant place in the system. However, municipalities are reluctant in prioritising andtaking the decision on which transport system (i.e., fuel and vehicle technology) they shouldchoose (based on interviews with production and use segments actors); this ambiguity hasbeen and still is one of the main factors for the slow biogas development in the region.
5.3. Regional Culture
The Gävleborg region as a whole is characterised by special conditions for entrepreneur-ship, i.e., a large number of small companies tend to have strong local anchors rather thanhave interests in business expanding or participation in sustainable development. It isalso known that there is statistically relatively higher unemployment and lower level ofeducation within this region as compared to the rest of Sweden (Swedish national statis-tics database (SCB)). Educational attainment of the population (see excel file. Source:www.scb.se (accessed on 14 April 2021)). A low level of education has been pointed out asone of the significant socio-cultural barriers to a lift of biogas development [43]. This canbe understood that a low level of knowledge of the general population leads to a lackof awareness and acceptance about the importance of biogas as a renewable fuel alterna-tive. As a matter of fact, the county of Gävleborg constitutes two parts, the landscapesof Gästrikland (southern part) and Hälsingland (northern part) that are quite different interms of social culture, norms, and topography. People in the northern part has a lowerlevel of education compared to the southern part of the region. For instance, the lateststatistics suggest that the southern part has a higher number of registered students in highschool per 1000 inhabitants [44]. Although both parts are well connected to the developedroad infrastructure, different social norms act as a blocking mechanism in developing acomprehensive long-term strategy on biogas as a transport fuel for the whole region (basedon interviews with the feedstock segment actors).
5.4. Policy Issues
Municipal governments in Sweden manage most of the fiscal resources, performplanning, make strategies, and take decisions based on local conditions. Private and publiccompanies in a region usually follow regional political directions and policies. Whereasregional politics are the bodies that implement a national vision. In Gävleborg, the biogasinfrastructure is poorly developed so that national directions have been impossible to liveup to for the regional authorities. This has been a contradictory point regarding consensusamong the region’s municipalities on setting the biogas sector as an important player inthe regional sustainable transport vision.
Several biofuel development policy instruments such as the local climate investmentprogram KLIMP and the rural development program were aimed to benefit more climatechange mitigation projects in rural areas of Sweden. The measures enabled municipalitiesand other local actors in the renewable energy field to receive financial support for projectsthat reduce GHG emissions. Based on interviews with production and use segments ofthe value chain (See Table 1), the effects were not as intended and counties with a demo-graphic and political situation similar to Gävleborg could not take as much advantage assome other counties (e.g., Skåne, Stockholm, and Västra Götaland) in Sweden. In Gävleborg,the projects (Biogas MellanNorrland (Biogas i Mellannorrland) AB owned by three munici-palities [Sundsvall, Östersund, and Hudiksvall]. Hudiksvall is a municipality of GävleborgRegion. [https://sundsvall.se/kommun-och-politik/overklaga-beslut-rattssakerhet/moten-och-protokoll/bolag-och-forbund/biogas-mellannorrland-ab/], (accessed on 20 January 2020)and SETA) received grants through the programs but could not succeed. Higher productioncost and lower GHG emission reduction efficiencies due to large distances between feed-stock sources such as dairy farms and proposed production facility were the main reasonsof failure of the projects. These lower GHG reduction efficiency and energy balance areparameters used by the authorities (such as Swedish environmental and energy agencies),to some extent, to claim that the policy is efficient. Therefore, in an “efficient policy per-spective” there will be no grants for regions like Gävleborg. This implies that more support
must be added from another body such as municipalities or private companies, and, ifthey are relatively small in size, biogas is a “luxury” they cannot afford. In short, nationalbiofuel instruments and other biogas programs (e.g., regulatory, financial, and economic)have not played much of a role, particularly in promoting biogas as a transport fuel in theregion (actors in the whole value chain).
5.5. Lack of Network
Networks play an important role in a technological system expanse and developmentas they help in the transfer of knowledge, create legitimacy, and influence the politicalgoals by people having similar ideas, beliefs, etc. [45]. The political environment in theregion was not in favour of biogas at times when several national investment programson biofuels (Table 1) were announced. The important factors behind the situation wereinsufficient knowledge on biogas potential, available resources, and other supporting assets(i.e., financial and technical support), its economic and social implications and very weakpro-biogas social and other related organizations’ movements. This can be attributed to alack of proper communication and marketing between the actors and politicians supportingbiogas. This is assumed as a big barrier to early biogas development in the region (mainlybased on interview with Biodrivmitt and some actors in the use segment).
5.6. The Dilemma of Lack of Infrastructure and Market
Which should come first, filling stations or biogas vehicles? Some of the actorsinterviewed assumed that the municipalities’ role is crucial in this case as they are bigsuppliers of substrate and buyers of upgraded biogas. They can create a market throughpublic transport and force biogas producers, suppliers, to build related infrastructure.The dilemma is that the public transport service providers and other private companiessuch as taxi companies in the region were not willing to invest in biogas vehicles before thebiogas supply infrastructure is securely in place. On the other side, biogas producers wouldlike to have a biogas market first. This has been a dilemma in the region for a long time,which has slowed down the biogas development (actors in production and use segments).In 2011, an effort was done by Gävle Energi AB to solve this issue by first building thefilling station and supported it with imported gas from outside the region (Stockholm).A year later, the upgrading facility at Duvbacken was inaugurated. However, some yearslater the opposite problem arrived when new production capacity was not followed byincreased demand and the implication of cheap Danish biogas ruined the possibility to“export” the upgraded biogas to the greater Stockholm area.
All interviewed actors mentioned the insufficient number of filling stations in theregion as an important barrier to biogas development in the past and present. The infras-tructure development companies such as Ekogas AB and Gasum AB have pointed out thatthe permit process to build related infrastructure is very slow which has further delayedthe development in addition to the dilemma on infrastructure and market. This problemhas also been identified as a barrier to biogas development in Sweden by many authors(see, Introduction). The actors in the used segment strongly mentioned the effects of thiscause as the regional transport companies and even private persons in the region have notconsidered the green car rebate and other schemes in their procurement decisions (basedon the transport companies in the county).
5.7. Public Transport as Focused User
Some actors assumed that too much focus on public transport as a consumer ofbiogas and non-proactive marketing and long-term planning attitude of the regionalbiogas producers as causes for insufficient biogas infrastructure in the region. Most ofthe Swedish municipalities have used the public procurement instrument as a tool toconvince companies that are owned by local governments or operating in the sectors ofwaste management, energy, and public transport, to use renewable fuels such as biogasto fulfil political ambitions concerning energy and climate matters [7,11,33]. This tactic
Sustainability 2021, 13, 4560 14 of 20
has been used as a powerful tool by the Gävle municipality to create an early biogasmarket in the region. The actors further mentioned that the biogas producers in the regionhave not been active in creating a market (i.e., by delivering information and signingcontracts with private transport companies in the region) at the initial stage of a project(i.e., the building of a biogas plant). This resulted in a limited market due to the lowernumber of biogas vehicles which slowed the biogas development in the region (based oninterview with BiodrivMitt and transport companies).
6. Lessons Learnt and Recommendations for Improvement
Government support schemes are vital for further biogas development and should bedesigned in a way that can integrate local factors in grant evaluation criteria and reducerisks on investment with clarity on future market conditions of the fuel. For example,in the project evaluation process the system benefits of fuel, fertiliser, and waste treatmentthat are shared among many actors and the whole of society, should also weigh with GHGreduction potential and net energy balance. The regions with similar geodemographicconditions should consider system benefits as a basis for their decisions rather than theconventional cost of alternate transport technologies.
In a situation where multiple solutions to a problem exist with their own limitationsand opportunities, ad hoc events can occur. The situation is the same in Gävleborg onsustainable energy solutions for transport. The regional municipalities are weighing thealternate transport energy solutions for their best interests so that they invest public moneyefficiently. The municipalities should come out of this ambiguous situation with the helpof the relevant experts (e.g., academic researchers) to build consensus on what part of thetransport sector (i.e., heavy trucks, public transport, passenger cars, etc.) should be directedto biogas and to other fuels. This will make it easier for them to find out at which segmentof the biogas value chain they should invest, with whom, and on what terms. One possiblesolution for further development of the regional biogas sector could be public transport inall the regional municipalities include biogas buses to secure the gas market and maximisethe use of upgraded biogas.
Regional transport system actors are promoting alternate renewable fuels (hydrogen,bio-oil from forest biomass, and HVO) but the alternate fuels developments are in theirearly phases of development in the region. The actors belong to different technologicaldevelopment routes should learn from the biogas case to prepare in advance to avoidthe issues that the regional biogas sector had, and is still, facing. Simultaneously, thereis a need for the biogas sector to collaborate with others to increase the development bylearning, knowledge sharing, and better communication among the regional municipalitiesand other biofuel value chain actors and networks.
Waste management and nutrient circularity aspects are the benefits that make biogasan opportunity to expand and develop. Therefore, apart from sewage sludge and foodwaste, regional biogas producers should also focus on introducing diverse kind of feed-stocks such as agricultural residues, pulp and paper mill residues, and animal manure toincrease biogas production and maximise the biogas system benefits to society.
The anaerobic digestion process for biogas production is mature and well-established.From economic and operations control perspective, the technology is applicable to small-and commercial scales but upgrading biogas is costly both from a technology and opera-tions perspective. In the region, around 40–50% of produced biogas is not upgraded due tohigher cost. Incentives should be introduced to promote R&D for innovative technologicalsolutions to biogas upgrading. This might be difficult for the regions but probably couldbe managed at national and EU-regional levels. Innovative cost-effective upgrading tech-nology for small-scale biogas plants can help a lot to improve the economic situation of thebiogas sector and market conditions in such counties.
In addition to infrastructure, the security of biogas supply for a long time has beenhighly important for transport companies. The actors proposed that, for continued expan-sion of biogas as a transport fuel in the region, required infrastructure should be built first
Sustainability 2021, 13, 4560 15 of 20
by the gas producers and suppliers. The municipalities should play their role in this caseeither through subsidizing and/or making the permit process fast. To ensure the securityof gas supply a gas grid/terminal in the region may also be required. These actions canstrengthen the user´s confidence and boost the market. Moreover, a higher discount on gasvehicles, carbon, and energy tax exemption for biogas, as transport fuel should continueand for a long time. The biogas sector could face tough challenges in the future due tofast development in alternate green energy technologies such as hydrogen and fuel cells,biodiesel, electrification etc., and changing political views on electrifying public transport.Thus, it may not be right to focus on building a gas market for cars and public transportonly. Heavy-duty transport, shipping and industry should be prioritised in future biogasstrategy as potential users. In the short run, public sector organizations should use theirprocurement strength to support the biogas sector and other green fuels as well. Further,looking to the shipping industry as an alternate future user for upgraded gas is good forthe regional biogas sector as the region has a harbour.
7. Conclusions and Outlook
The interviews and statistical analysis of value chain development resulted in a greatdeal of relevant information. Largely, the respondents, not all, on the production, supply,distribution, and use segments provided a similar picture, and there appears to be aconsensus regarding many local issues influencing the biogas development, even if therecould be some limitations in their generalization and validity in similar cases.
In the region, biogas can play an important role in establishing a strong socio-technicalsystem providing transport services of different kinds but lacks a long-term developmentstrategy. From a biogas potential standpoint, statistical analysis shows that the amount ofbiogas could increase significantly within the region, but expansion and development forbiogas as transport fuel started very late and have been very slow compared to the rest ofSweden. This is mostly caused by local factors, explained above (Section 5), and to someextent by policy design which lacks integration capability of geodemographic conditionsand system benefits. The interviewees reflected a similar picture. The additional issues withnational policy measures are linked to investment cost, infrastructure, and market demand.These national policy-related and local factors as barriers to the biogas developments:lack of consensus among the regional municipalities on biogas as a transport fuel, poorcommunication and weak network of regional biogas producers, users and legislators,and insufficient knowledge of the actors on regional biogas potential and its socio-economicimplications, etc., reported by similar studies (e.g., [5,7,17,46]) on other regions of Sweden,see the introduction section, are also confirmed. Additionally, this study identifies someadditional regional factors influencing biogas development which are worth mentioningand not have been previously reported in detail; these are undefined rules of the game(exchange of services), competition among several alternatives due to a small market,as well as the ambiguity of municipalities prioritization, and regional cultural differences(Section 5).
To strengthen the regional biogas sector and expansion, national policy instrumentsshould provide mechanisms that can process geographical conditions in regulatory, eco-nomic support, and market formation, e.g., in the evaluation process for granting incentives.The building of gas filling stations at other municipalities and long-term contracts betweenbiogas producers and buyers are needed to expand the system. An active network ofbiofuel producers, users, and legislators is vital in the region to speed up the developmentby learning, knowledge sharing, legitimation, and better communication. Furthermore,the biogas value chain actors’ knowledge about the regional resources/feedstocks suitablefor biogas production and their techno-economic analysis are very important for the futuredevelopment strategy of the sector. In short, at the local level, suitable measures should betaken by the system actors to eliminate the blocking effects of identified local factors andfor the continued development of the regional biogas value chain.
Sustainability 2021, 13, 4560 16 of 20
Author Contributions: M.A. collected the data, designed methodology, and performed value chainanalysis. Z.W. and S.S. contributed to conceptualization, data collection, supervision, and contributedin writing—review and editing. Project administration, O.E.; funding acquisition, O.E. and con-tributed in writing—review and editing. All authors have read and agreed to the published versionof the manuscript.
Funding: The European Regional Development Fund of the European Union, Region Gävleborg andthe University of Gävle, project number 7441, funded this research.
Data Availability Statement: Not applicable.
Acknowledgments: This work has been carried out within the project RATT-X, (Regional AlternativeTechnologies for the Traffic in Gävleborg region) project no. 7441. We are thankful to Karl Hillman,Associate Professor at the University of Gävle for providing important literature, latest news articles,and intellectual discussions when the manuscript was in the preparation phase. The authors alsogratefully acknowledge all the reviewers for their constructive comments. The authors would alsolike to thank all the regional biogas value chain actors who participated in the interview process.
Conflicts of Interest: The authors declare no conflict of interest.
Appendix A
Table A1. Organizations involved in the study, their roles and information about respondents. This article mainly focusedon regional organizations that are linked to the biogas value chain and organizations that have influenced or can influencethe value chain. Note: All interviews were recorded, analysed, and summarised in the text.
Value Chain Organization Description of the Organization and Interviewee
Feedstock
Gästrike Återvinnare
Waste management company owned by five municipalities inthe region of Gävleborg (Gävle, Sandviken, Hofors, Ockelboand Söderhamn). The company is part owner of Ekogas (see
below). It collects biological waste from these fivemunicipalities and delivers to the Forsbacka biogas plant.
Respondent: CEO.
Borab
Waste management company owned by two municipalities(Bollnäs and Ovanåker). The company operates the waste
facility at Sävstaås in Bollnäs, as well as the recycling centres inBollnäs and Edsbyn. Respondent: CEO.
Gästrike vatten
Wastewater treatment company owned by three municipalities(Gävle, Hofors, and Ockelbo) which operate 15 wastewater
treatment plants in the region. The biggest plant in Gävle has acapacity of up to 100,000 people’s equivalent (pe) and producesand upgrades biogas from sludge. The upgrading unit at this
facility is owned and operated by Ekogas (see below).Respondent: Process Engineer.
Söderhamn Nära
The company is involved in multiple businesses, waste andwastewater treatment and management, electricity and heat
production and supply. It is owned by Söderhamn municipality.It collects biological waste from three municipalities
(Söderhamn, Bollnäs and Hudiksvall) and transports it to theForsbacka biogas plant. Respondent: Waste collection manager.
The Federation of SwedishFarmers (Lantbrukarnas
Riksförbund)
The regional branch of the Federation of Swedish Farmers is anagricultural interest organization. Interview regarding
possibilities for and perception of biogas among Swedishfarmers. Respondent: Regional manager.
Sustainability 2021, 13, 4560 17 of 20
Table A1. Cont.
Value Chain Organization Description of the Organization and Interviewee
Production and upgrading Ekogas
The only company in the region that has industrial-scale biogasproduction with an upgrading facility is partly owned by the
municipality. Feedstocks used are food waste, green waste, andwastewater sludge. The company facility at Forsbacka is based
on dry anaerobic digestion technology and produces around6–7 thousand Nm3 raw biogas per day with 55–60% methane
content. On average, this is 2.3 million Nm3 per year. The gas isupgraded to 97–99% CH4 content. The company owns and is
responsible for a biogas upgrading plant at Duvbackenwastewater treatment plant (owned by Gästrike vatten).
Respondent: Chief Operating Officer.Gästrike vatten See above.
Infrastructure
EkogasThe region has two biogas filling stations owned by this
company. Two to three more filling stations by 2021 are inplanning by the company. Respondent: Chief Operating Officer.
Gasum
Gasum is one of the leading Nordic biogas producers andsuppliers. It owns a gas filling-station network, which also
serves heavy-duty vehicles. The company supplies both CBGand LBG and is a big player in the Nordic market. The companyhas no gas production in the region while it has got permits to
build gas filling stations both for liquefied and compressedbio-methane in the region. Respondent: Traffic Business
Development Director.
Use as vehicle fuel
Entrepreneurs organization(Företagarna)
The organization represents about 60,000 entrepreneurs through250 local associations in Sweden. It offers networks, knowledge,
and practical help, and drives the development for a betterbusiness climate. The regional office of the organization is in
Gävle. Respondent: Regional Business Analyst.
Gävle Taxi
One of the oldest and leading taxi companies with 60 vehicles.Mainly operates in the cities of Gävle and Sandviken. The
company is fossil-free with all vehicles on 100% HVO.Respondent: Regional Manager.
Regional Administrative Board(Länsstyrelsen)
The regional administrative board works to ensure nationalpolicies are implemented and targets are being achieved whiletaking into account local conditions and circumstances. It also
monitors developments and informs the government of theregion’s needs. The board is an important link between people
and municipalities in the region on the one hand and thegovernment, parliament, and central authorities on the other.Respondent: Agronomist, climate, and energy coordinator.
Region Gävleborg
A public organization, where the regional council is the highestdecision-making body. The organization is responsible for areas
that contribute to regional development. The main areas ofmanagement and responsibility are public health and healthcare, infrastructure and public transport, skills and educationissues, business development, international co-operation, andculture. Respondents: Project manager and strategist, Projectleader (environment and strategy), and Strategist sustainable
development.
X-trafik
An authority, responsible for regional transport services as partof Region Gävleborg. The authority does not own any buses ortrains but acts as a decision-maker and is responsible for public
transport strategy, functions, and development. It is alsoinvolved in the procurement of vehicles and services outsidepublic transport as well. Respondent: Project Manager and
strategist.
Sustainability 2021, 13, 4560 18 of 20
Appendix B
Sample Interview questions for each segment of the biogas value chain. The questionswere adjusted to the interests of the interviewee and there have been follow-up questionsbased on the response of the interviewee to the main question.
General questions
1. Can you speak briefly about yourself, the company/organization and its activitiesconcerning biogas a transport fuel in the region?
2. How can immigrants participate at the organisation/company and biogas systemlevels, in relation to the work with sustainable transport?
Feedstock
1. What types of waste/feedstock is delivered to biogas producers and the source?2. How do municipalities work with the waste management companies and how many
they are in the region?3. How good the waste/feedstock is source sorted? How can it be improved?4. What happened with the collected biological waste? Is it used to produce biogas?5. How do you see the importance of collaboration between the regional waste manage-
ment companies, agricultural sector, and renewable fuels (e.g., biogas and bio-diesel)producers? And, what could be done to improve the situation?
6. What are the opportunities and challenges for regional agricultural SMEs and munici-palities with providing biological waste/substrates for biofuels production?
7. What kind of legislative, financial, and R&D support, you think, would require topromote the use of regional agricultural and other biological resources for biogasproduction?
8. Which type of biological waste is being imported to other regions and why?9. What are the key challenges the company is facing? What and how regulations/standards/
policy can help with?
Production and Upgrading
1. What technology and feedstocks are used for biogas production?2. What are the sources of feedstocks?3. How much biogas is produced, upgraded, and delivered to biogas filling stations?4. How do you see the future of biogas in a regional context?5. What are the key challenges for biogas producers in this region?6. What and how national biofuel related policy instruments have been supporting/
influenced biogas development in the region?7. How regional politics/cultural believes/geographic conditions influenced biogas
development in the region?8. What needs to do for further expansion of biogas as a transport fuel in the region?
Infrastructure
1. Why infrastructure (filling stations) poorly developed?2. How do you see the role of national biofuel policy instruments in this context?3. How can the situation be improved? Who has to do what?4. How you relate regional biogas market (demand) as transport fuel and infrastructure
conditions?
Use
1. What percentage of vehicles are biogas fuelled?2. Why/why not biogas as transport fuel?3. How are national biofuels policy instruments (e.g., biogas vehicle rebate program)
evaluated in vehicles procurement decisions?4. What needs to do for increased use of biogas as a transport fuel in the region?
Regulative actors (Municipalities and regional authorities)
1. Why the Gävleborg should have biogas as transport fuel?2. How do you predict the future of biogas in the region?
Sustainability 2021, 13, 4560 19 of 20
3. How have the regional authorities supported biogas as a transport fuel in the region?4. What can the regional authorities and municipalities do for the further expansion of
biogas as transport fuel?5. How do you value the national biofuels policy instruments for biogas as transport
fuel development in the region?
References1. Lönnqvist, T.; Ammenberg, J.; Grönkvist, S.; Anderberg, S.; Sandberg, T. Biogas in the Transport Sector—An Actor and Policy Analysis
of the Stockholm County; (Report No 2019:02); The Swedish Knowledge Centre for Renewable Transportation Fuels (f3 centre):Stockholm, Sweden, 2019.
2. Swedish EPA. Sweden’s Climate Act and Climate Policy Framework. Available online: http://www.swedishepa.se/Environmental-objectives-and-cooperation/Swedish-environmental-work/Work-areas/Climate/Climate-Act-and-Climate-policy-framework-/ (accessed on 20 January 2020).
3. Ros, T.; Ödlund, L. System perspective on biogas use for transport and electricity production. Energies 2019, 44, 27–28. [CrossRef]4. Feiz, R.; Ammenberg, J. Assessment of feedstocks for biogas production, part I—A multi-criteria approach. Resour. Conserv. Recycl.
2017, 122, 373–387. [CrossRef]5. Fallde, M.; Eklund, M. Towards a sustainable socio-technical system of biogas for transport: The case of the city of Linköping in
Sweden. J. Clean. Prod. 2014, 98, 17–28. [CrossRef]6. Hjalmarsson, L. Biogas as a boundary object for policy integration—The case of Stockholm. J. Clean. Prod. 2015, 98, 185–193.
[CrossRef]7. Ammenberg, J.; Anderberg, S.; Lönnqvist, T.; Grönkvist, S.; Sandberg, T. Biogas in the transport sector—Actor and policy analysis
focusing on the demand side in the Stockholm region. Resour. Conserv. Recycl. 2018, 129, 70–80. [CrossRef]8. Eker, S.; van Daalen, E. A model-based analysis of biomethane production in the Netherlands and the effectiveness of the
subsidization policy under uncertainty. Energy Policy 2015, 82, 178–196. [CrossRef]9. Goulding, D.; Gallagher, C.; Power, N.M. What policies should be implemented to develop a gaseous transport industry in
Ireland? Env. Sci. Policy 2014, 44, 215–225. [CrossRef]10. Lantz, M.; Svensson, M.; Björnsson, L.; Börjesson, P. The prospects for an expansion of biogas systems in Sweden—Incentives,
barriers and potentials. Energy Policy 2007, 35, 1830–1843. [CrossRef]11. Larsson, M.; Grönkvist, S.; Per, A. Upgraded biogas for transport in Sweden- effects of policy instruments on production,
infrastructure deployment and vehicle sales. J. Clean. Prod. 2016, 112, 3774–3784. [CrossRef]12. Uusitalo, V.; Havukainen, J.; Soukka, R.; Väisänen, S.; Havukainen, M.; Luoranen, M. Systematic approach for recognizing
limiting factors for growth of biomethane use in transportation sector—A case study in Finland. Renew. Energy 2015, 80, 479–488.[CrossRef]
13. Olsson, L.; Fallde, M. Waste(d) potential: A socio-technical analysis of biogas production and use in Sweden. J. Clean. Prod. 2015.[CrossRef]
14. Browne, D.; O’Mahony, M.; Caulfield, B. How should barriers to alternative fuels and vehicles be classified and potential policiesto promote innovative technologies be evaluated? J. Clean. Prod. 2012, 35, 140–151. [CrossRef]
15. Steenberghen, T.; López, E. Overcoming barriers to the implementation of alternative fuels for road transport in Europe.J. Clean. Prod. 2008, 16, 577–590. [CrossRef]
16. Mutter, A. Obduracy and change in urban transport-understanding competition between sustainable fuels in swedish municipali-ties. Sustainability 2019, 11, 6092. [CrossRef]
17. Lönnqvist, T.; Anderberg, S.; Ammenberg, J.; Sandberg, T.; Grönkvist, S. Stimulating biogas in the transport sector in a Swedishregion—An actor and policy analysis with supply side focus. Renew. Sustain. Energy Rev. 2019, 113, 109–269. [CrossRef]
18. Lönnqvist, T.; Sanches-Pereira, A.; Sandberg, T. Biogas potential for sustainable transport—A Swedish regional case. J. Clean.Prod. 2015, 108, 1–10. [CrossRef]
19. Gustafsson, S.; Mignon, I. Municipalities as intermediaries for the design and local implementation of climate visions.Eur. Plan. Stud. 2019, 28, 1161–1182. [CrossRef]
20. Arfan, M. Biogas Value Chain in Gävleborg—Feedstock, Production and Use; University of Gävle: Gävle, Sweden, 2019.21. Kaplinsky, R. Globalisation and unequalisation: What can be learned from value chain analysis? J. Dev. Stud. 2000, 37, 117–146.
[CrossRef]22. Owen, G.T. Qualitative methods in higher education policy analysis: Using interviews and document analysis. Qual. Rep. 2014,
19, 1–19.23. EEA. National Policies and Measures on Climate Change Mitigation in Europe in 2017: Technical Overview of the Information Reported by
Member States Under the European Union’s Climate Monitoring Mechanism Regulation; (EEA Report No. 9/2018); EEA: Copenhagen,Denmark, 2018.
24. Fagerström, A.; Anderson, S. The Contribution of Advanced Renewable Transport. Fuels to Transport Decarbonization in Sweden—2030and Beyond; (Report No.C416); IVL Swedish Environmental Research Institute: Stockholm, Sweden, 2019.
25. Government of Sweden. Report for Sweden on Assessment of Projected Progress, March 2019; Government of Sweden: Stockholm,Sweden, 2019.
26. Holmgren, K. Policies Promoting Biofuels in Sweden; (Report f3 2012:3); The Swedish Knowledge Centre for Renewable Transporta-tion Fuels f3: Gothenburg, Sweden, 2012.
27. The Swedish Parliament. Swedish Code of Statutes (1994). Act on Energy Taxes; The Swedish Parliament: Stockholm, Sweden, 1994.(in Swedish)
28. The Swedish Parliament. Swedish Code of Statutes (2006). Act on Road Traffic Taxes; The Swedish Parliament: Stockholm, Sweden,2006. (in Swedish)
29. Lantz, M. Biogas in Sweden: Opportunities and Challenges from a Systems Perspective; Lund University: Lund, Sweden, 2013.30. The Swedish Parliament. Swedish Code of Statutes (2001). Regulation (2001:512) on Landfill of Waste (Förordning (2001:512) om
deponering av avfall).pdf ; Environmental Department: Stockholm, Sweden, 2001.31. The Swedish Parliament. Swedish Code of Statutes (2005). Act on Obligation to Provide Renewable Fuel; SFS 2005:1248.pdf; The
Swedish Parliament: Stockholm, Sweden, 2005. (in Swedish)32. The Swedish Parliament. Swedish Code of Statutes (2009). Act on Support for Measures on Production, Distribution and Use of Biogas
and Other Renewable Gases; SFS 2009:938.pdf; The Swedish Parliament: Stockholm, Sweden, 2009. (in Swedish)33. SEPA. Green Public Procurement in Sweden; SEPA: Stockholm, Sweden, 2009.34. Johansson, T.B.; Kågesson, P.; Johansson, H.; Jonsson, L.; Westin, J.; Hejenstedt, H.; Hådell, O.; Holmgren, K.; Wollin, P. On the Road
to Fossil-Free Transport (in Swedish: Fossilfrihet på väg-Del 2); Ministry of Enterprise: Stockholm, Sweden, 2013; ISBN 9789138240557.35. SEPA. Climate Investment Programmes in Sweden—A Tool for Reaching the Swedish Climate Objective; SEPA: Stockholm, Sweden, 2008.36. Kalhori, E. Rätt Väg Framåt! En Sammanfattning av Klimatpolitiska Rådets Rapport 2019 (Report 1-2019); Swedish Climate Policy
Council: Stockholm, Sweden, 2019.37. Government of Sweden. Rural Development Programme for Sweden—Period 2007–2013; Government of Sweden: Stockholm,
Sweden, 2013.38. Government of Sweden. Fact. Sheet—A Rural Development Programme for Sweden, 2014–2020; Government of Sweden: Stockholm,
Sweden, 2015.39. Government of Sweden. Sweden’ s Draft Integrated National Energy and Climate Plan; Government of Sweden: Stockholm,
Sweden, 2018.40. The Swedish Parliament. Swedish Code of Statutes (2009). Regulation (2009: 211) on Environmental Cars; The Swedish Parliament:
Stockholm, Sweden, 2009. (in Swedish)41. The Swedish Parliament. The Act on the Obligation to Supply Renewable Fuels—A Follow-Up Report (2009/10:RFR7); The Swedish
Parliament: Stockholm, Sweden, 2009.42. Swedish Energy Agency (SEA). Energy in Sweden, Facts and Figures 2021. Available online: http://www.energimyndigheten.
se/Statistik/Energibalans/?currentTab=1#mainheading (accessed on 20 February 2021).43. Nevzorova, T.; Kutcherov, V. Barriers to the wider implementation of biogas as a source of energy: A state-of-the-art review.
Energy Strat. Rev. 2019, 26, 100414. [CrossRef]44. Region Gävleborg. Gävleborgare i utbildning 2019; Region Gävleborg: Gävle, Sweden, 2019.45. Bergek, A.; Jacobsson, S.; Carlsson, B.; Lindmark, S.; Rickne, A. Analyzing the functional dynamics of technological innovation
systems: A scheme of analysis. Res. Policy 2008, 37, 407–429. [CrossRef]46. Lönnqvist, T. Biogas in Swedish Transport—A Policy-Driven Systemic Transition; KTH—Royal Institute of Technology: Stockholm,