57
10/26/2016 1 BIOGAS POWER PLANT Market Development & Technology Overview USAID ICED II Belitung, 26 October 2016
10/26/2016 1
BIOGAS POWER PLANT
Market Development & Technology Overview
USAID ICED II
Belitung, 26 October 2016
Presentation Outline
1. Definition and Project Type
2. Market Potential and Development
3. Typical Design of Biogas Power Project
4. Project Development
1. Definition and Project Type
1.1 What is Biogas ?
1.2 Anaerobic Digestion
1.3 Gas Composition
1.4 Feedstock of Biogas
1.4 Type of Biogas System
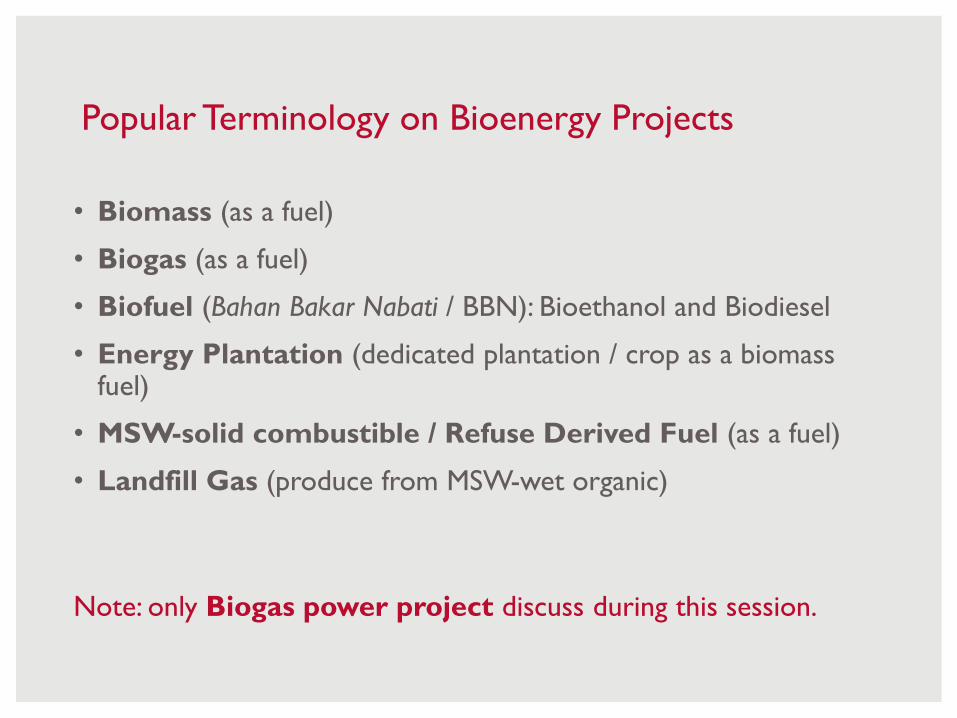
Popular Terminology on Bioenergy Projects
• Biomass (as a fuel)
• Biogas (as a fuel)
• Biofuel (Bahan Bakar Nabati / BBN): Bioethanol and Biodiesel
• Energy Plantation (dedicated plantation / crop as a biomass fuel)
• MSW-solid combustible / Refuse Derived Fuel (as a fuel)
• Landfill Gas (produce from MSW-wet organic)
Note: only Biogas power project discuss during this session.
5
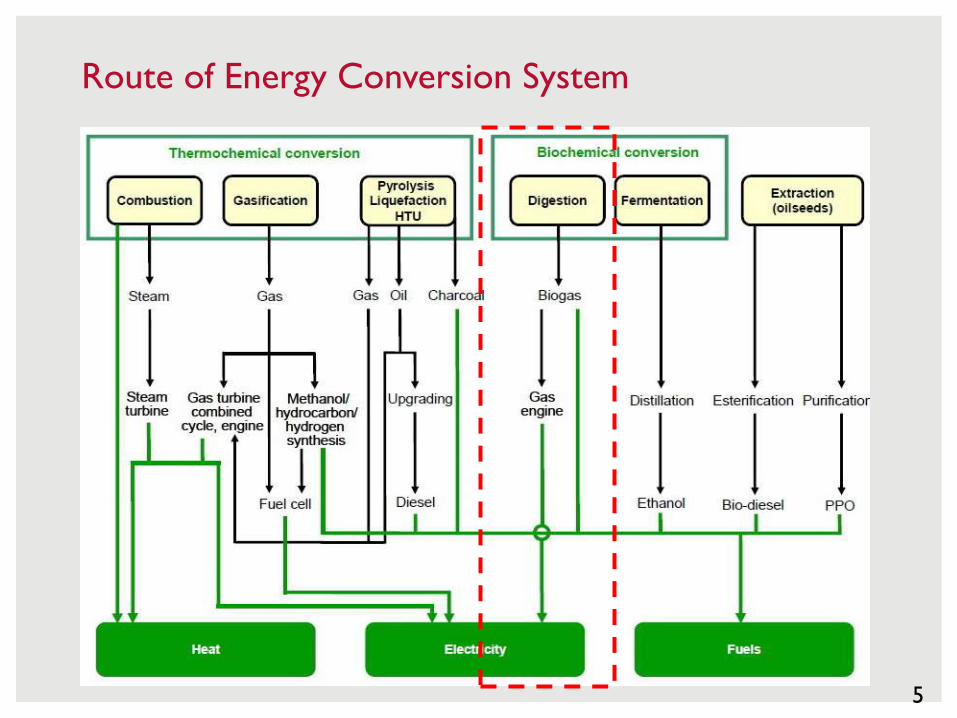
Route of Energy Conversion System
• Biogas is gas produced by anaerobic digestion of biodegradable
materials by microorganism especially bacteria. The biodegradable
material are typically biomass, manure, sewage, municipal waste, and
crops waste.
• Anaerobic Digestion (AD) as metabolism process in the absence of
oxygen is more effective on producing high yield of methane (biogas),
pre-tread waste water rich in nutrients (Nitrogen and Phosphorus) and
minimize the sludge production.
BIOGAS
7Sumber: nachwachsende-rohstoffe.de & EIA Bioenergy 2006
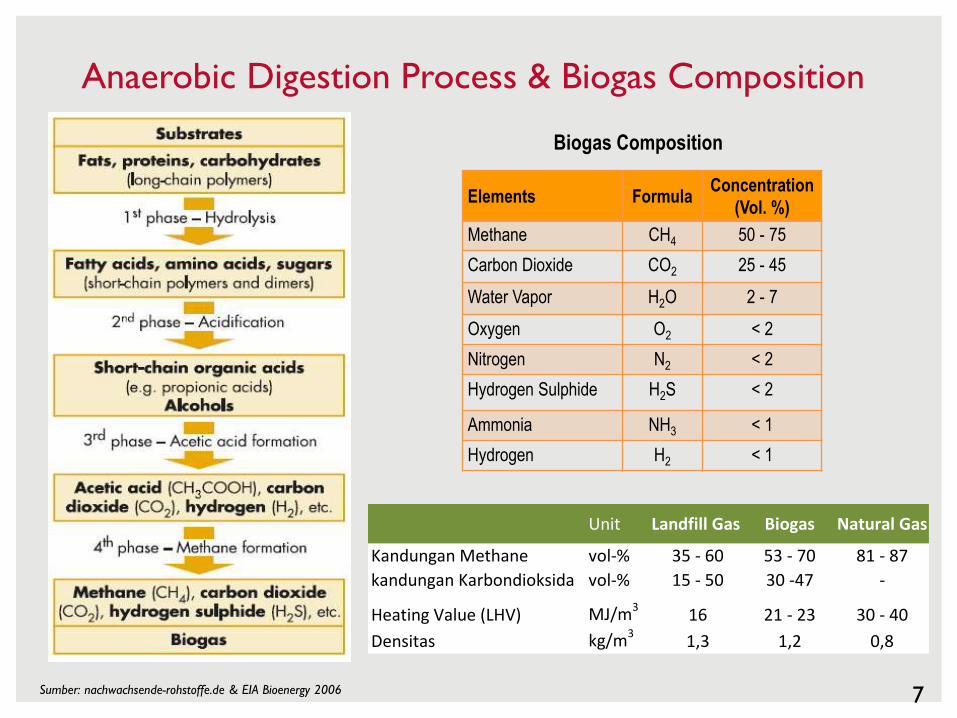
Anaerobic Digestion Process & Biogas Composition
Elements FormulaConcentration
(Vol. %)
Methane CH4 50 - 75
Carbon Dioxide CO2 25 - 45
Water Vapor H2O 2 - 7
Oxygen O2 < 2
Nitrogen N2 < 2
Hydrogen Sulphide H2S < 2
Ammonia NH3 < 1
Hydrogen H2 < 1
Biogas Composition
Unit Landfill Gas Biogas Natural Gas
Kandungan Methane vol-% 35 - 60 53 - 70 81 - 87
kandungan Karbondioksida vol-% 15 - 50 30 -47 -
Heating Value (LHV) MJ/m316 21 - 23 30 - 40
Densitas kg/m31,3 1,2 0,8
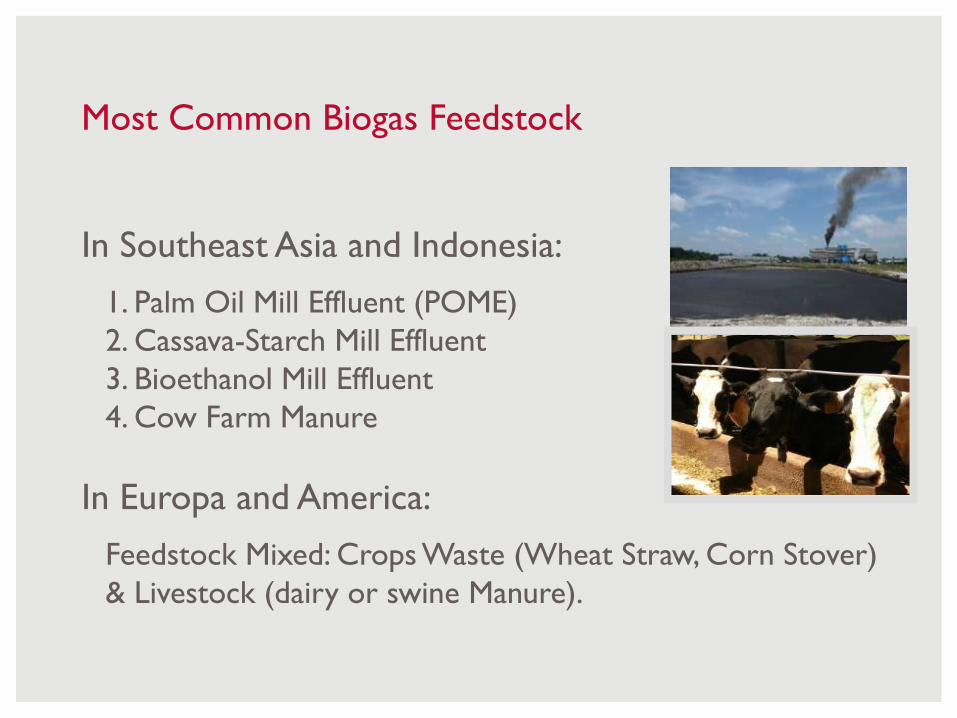
Most Common Biogas Feedstock
In Southeast Asia and Indonesia:
1. Palm Oil Mill Effluent (POME)
2. Cassava-Starch Mill Effluent
3. Bioethanol Mill Effluent
4. Cow Farm Manure
In Europa and America:
Feedstock Mixed: Crops Waste (Wheat Straw, Corn Stover)
& Livestock (dairy or swine Manure).
9
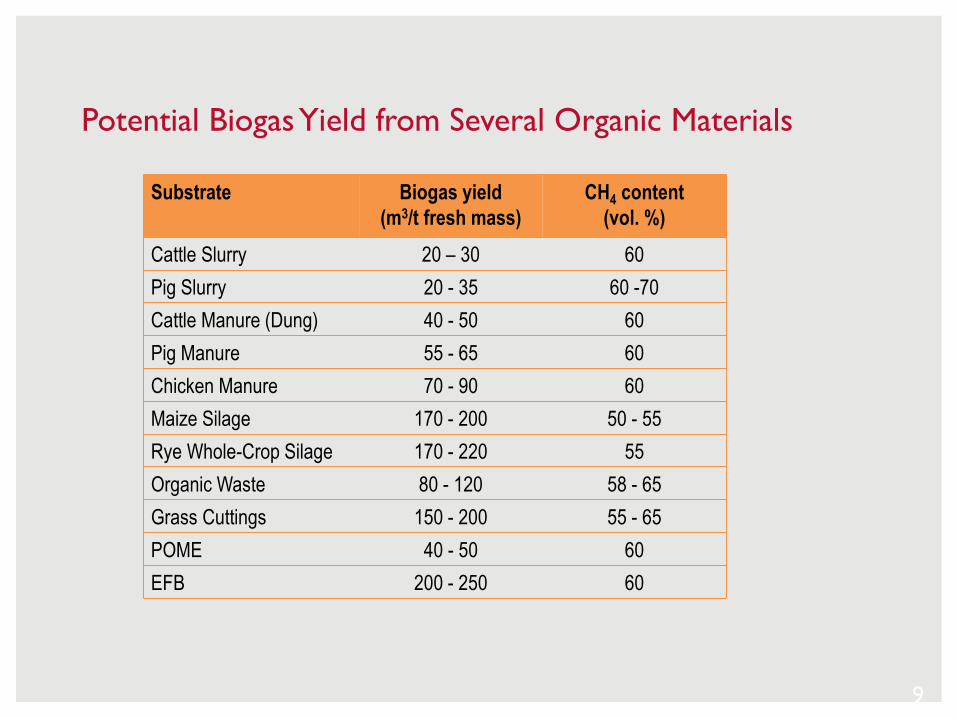
Potential Biogas Yield from Several Organic Materials
Substrate Biogas yield
(m3/t fresh mass)
CH4 content
(vol. %)
Cattle Slurry 20 – 30 60
Pig Slurry 20 - 35 60 -70
Cattle Manure (Dung) 40 - 50 60
Pig Manure 55 - 65 60
Chicken Manure 70 - 90 60
Maize Silage 170 - 200 50 - 55
Rye Whole-Crop Silage 170 - 220 55
Organic Waste 80 - 120 58 - 65
Grass Cuttings 150 - 200 55 - 65
POME 40 - 50 60
EFB 200 - 250 60
10
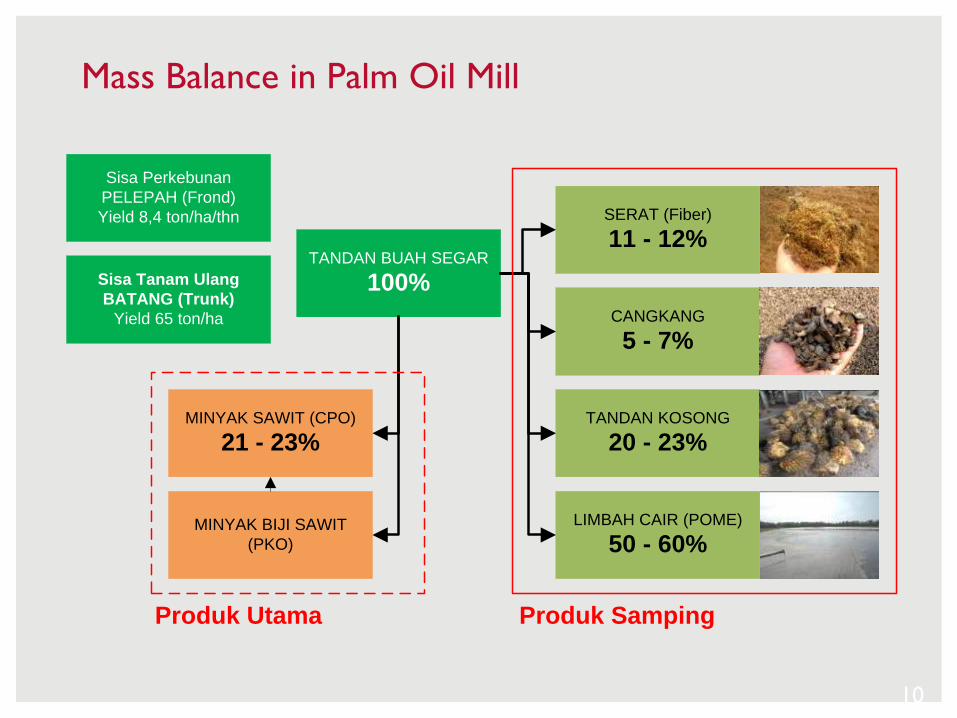
TANDAN BUAH SEGAR
100%
MINYAK SAWIT (CPO)
21 - 23%
MINYAK BIJI SAWIT
(PKO)
SERAT (Fiber)
11 - 12%
CANGKANG
5 - 7%
TANDAN KOSONG
20 - 23%
LIMBAH CAIR (POME)
50 - 60%
Produk Utama Produk Samping
Sisa Perkebunan
PELEPAH (Frond)
Yield 8,4 ton/ha/thn
Sisa Tanam Ulang
BATANG (Trunk)
Yield 65 ton/ha
Mass Balance in Palm Oil Mill
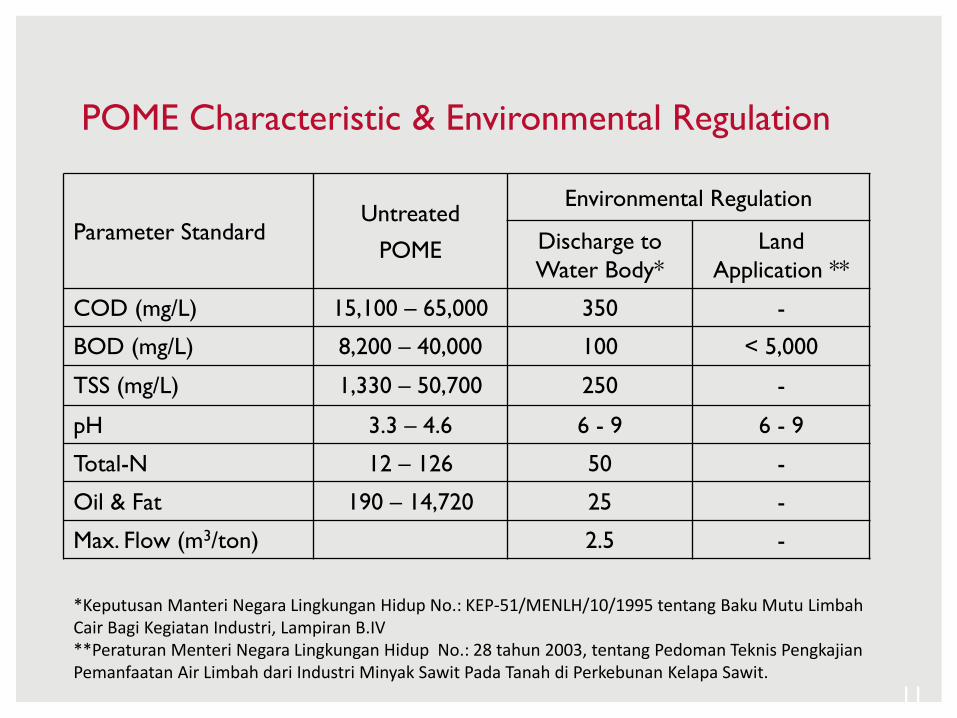
Parameter Standard Untreated
POME
Environmental Regulation
Discharge to
Water Body*
Land
Application **
COD (mg/L) 15,100 – 65,000 350 -
BOD (mg/L) 8,200 – 40,000 100 < 5,000
TSS (mg/L) 1,330 – 50,700 250 -
pH 3.3 – 4.6 6 - 9 6 - 9
Total-N 12 – 126 50 -
Oil & Fat 190 – 14,720 25 -
Max. Flow (m3/ton) 2.5 -
11
*Keputusan Manteri Negara Lingkungan Hidup No.: KEP-51/MENLH/10/1995 tentang Baku Mutu LimbahCair Bagi Kegiatan Industri, Lampiran B.IV **Peraturan Menteri Negara Lingkungan Hidup No.: 28 tahun 2003, tentang Pedoman Teknis Pengkajian Pemanfaatan Air Limbah dari Industri Minyak Sawit Pada Tanah di Perkebunan Kelapa Sawit.
POME Characteristic & Environmental Regulation
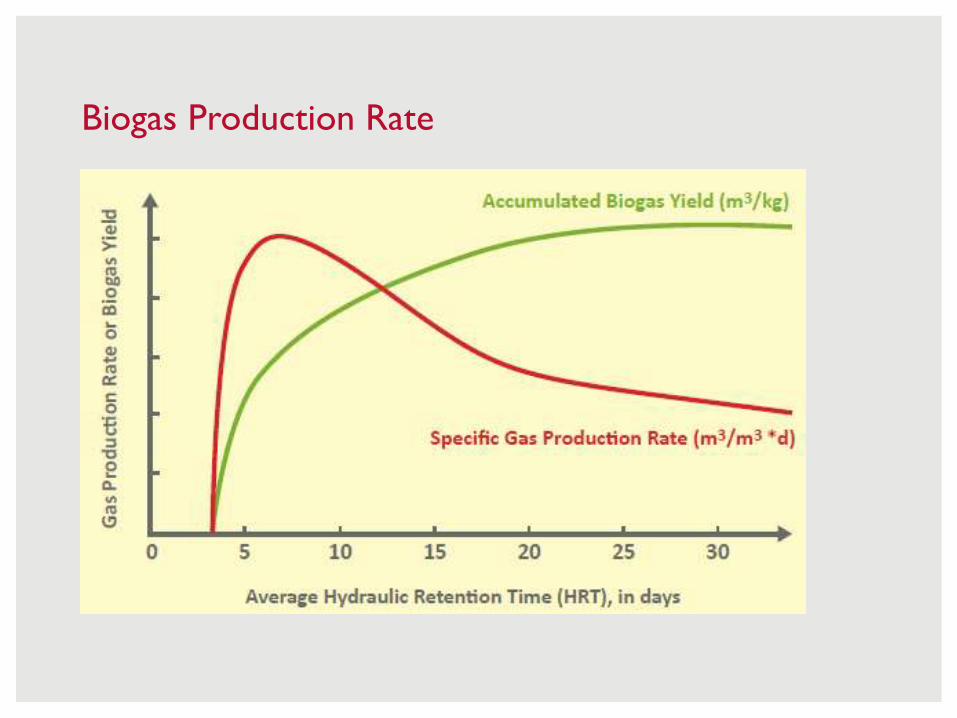
Biogas Production Rate
Type of Biogas System
1. Domestic or Household Biogas System
Mainly the feedstock is from livestock-dung and use
in household for cooking purpose.
2. Utility Scale Biogas System
Agro-industries that have large number of potential
feedstock. In Indonesia Palm Oil Mill industry is the
main potential resources.

14
Inlet
Manhole
Kubah Dome
Pipa
InletReaktor Digester
Penguras
Air
Kandang
Sapi
Aplikasi
Kompor
Penampung
Slurry
Outlet
Katup
Gas
Aplikasi
Lampu Gas
Sumber: Program Biru Hivos, 2008
Domestic / Household Biogas System
Fixed Dome Digester 4 m3 – 12 m3
15
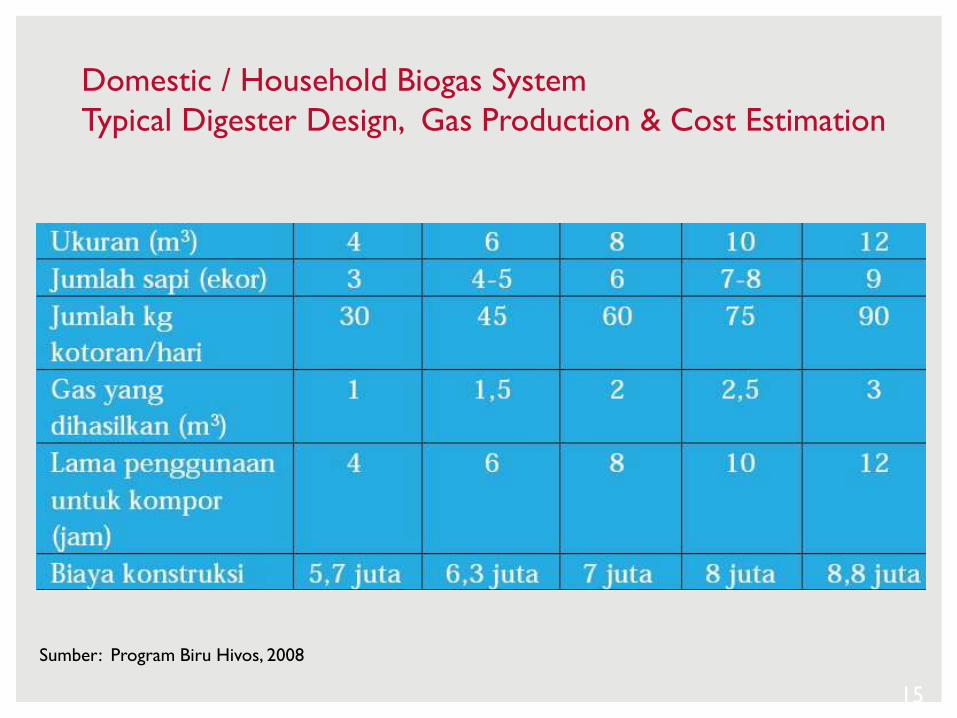
Sumber: Program Biru Hivos, 2008
Domestic / Household Biogas System
Typical Digester Design, Gas Production & Cost Estimation
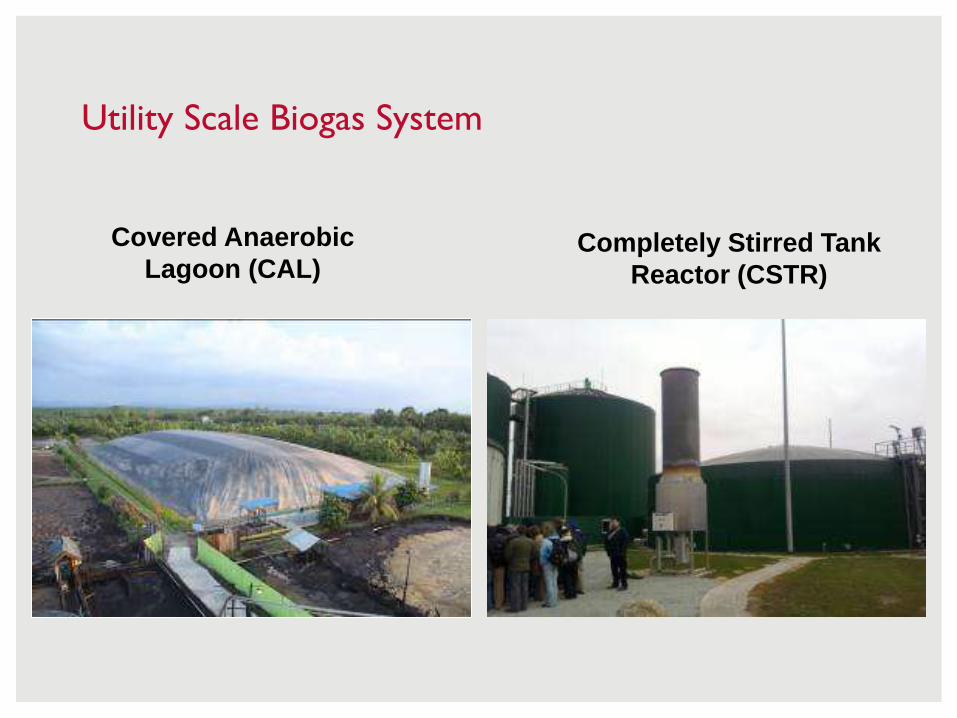
Utility Scale Biogas System
Completely Stirred Tank
Reactor (CSTR)
Covered Anaerobic
Lagoon (CAL)
17
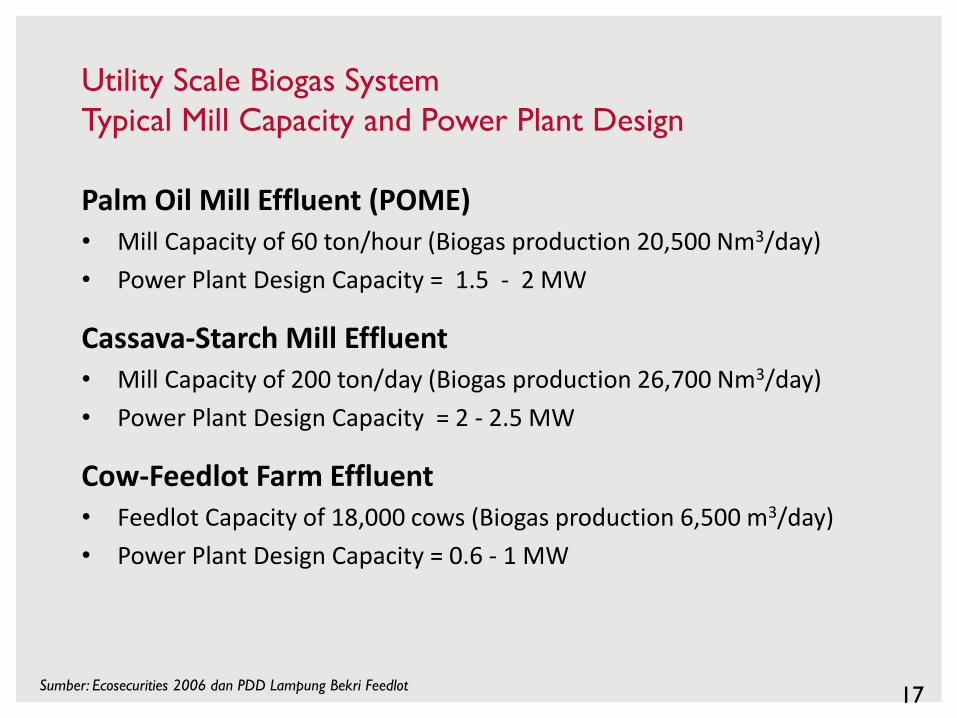
Palm Oil Mill Effluent (POME)• Mill Capacity of 60 ton/hour (Biogas production 20,500 Nm3/day)
• Power Plant Design Capacity = 1.5 - 2 MW
Cassava-Starch Mill Effluent• Mill Capacity of 200 ton/day (Biogas production 26,700 Nm3/day)
• Power Plant Design Capacity = 2 - 2.5 MW
Cow-Feedlot Farm Effluent• Feedlot Capacity of 18,000 cows (Biogas production 6,500 m3/day)
• Power Plant Design Capacity = 0.6 - 1 MW
Sumber: Ecosecurities 2006 dan PDD Lampung Bekri Feedlot
Utility Scale Biogas System
Typical Mill Capacity and Power Plant Design
2. Market Potential & Development
2.1 Technology Maturity
2.2 Global Biogas Development
2.3 Development Status in Indonesia
2.4 Market Potential & Project Sizing in Indonesia

P19Source: EPRI, 2010
Technology Maturity
P20
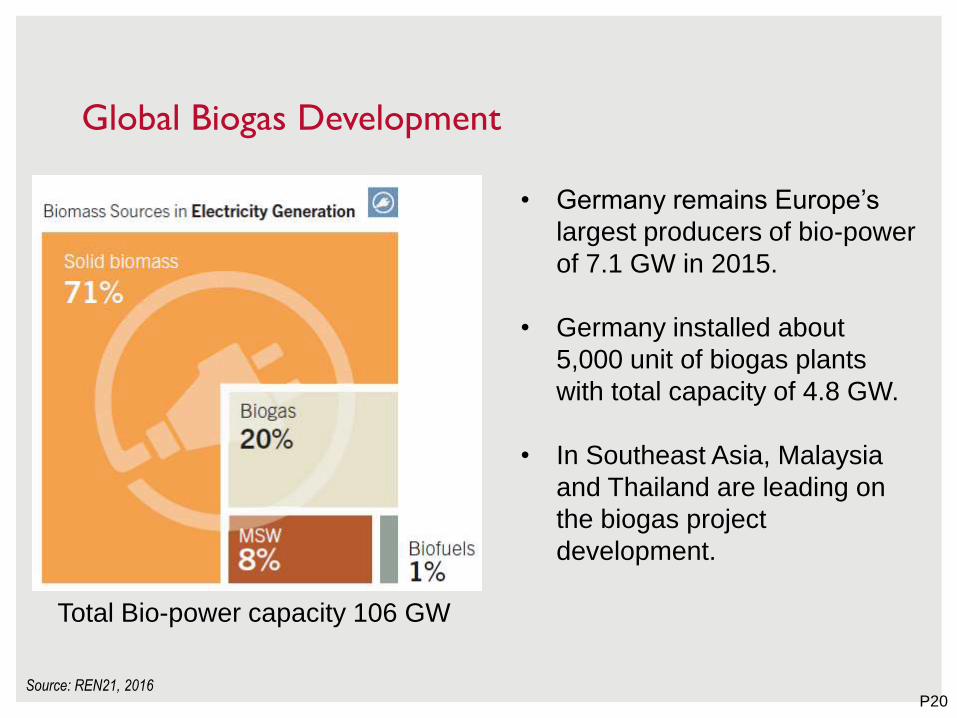
Global Biogas Development
Source: REN21, 2016
Total Bio-power capacity 106 GW
• Germany remains Europe’s
largest producers of bio-power
of 7.1 GW in 2015.
• Germany installed about
5,000 unit of biogas plants
with total capacity of 4.8 GW.
• In Southeast Asia, Malaysia
and Thailand are leading on
the biogas project
development.
P21
Development Status in IndonesiaProject Scheme & Utilization
1. Independent Power Producer (IPP) SchemeSell the whole electricity production to the grid.
2. Internal Use and Excess Power SchemeUse for the internal mill utilization and sell the surplus of electricity to the grid.
3. Captive Power Scheme (Power Plant & Co-Firing)Use for the internal mill power (electricity or heat) utilization.
4. Rural Electrification Off-Grid SchemeSell the whole electricity production to the isolated grid for rural electrification.

• Biogas PP capacity 1 MWe in Belitung, On-grid system
• Using Covered Anaerobic Lagoon
• Feedstock POME: 150,000 m3
Sources: AANE 2013
The first IPP Biogas Power Plant in Indonesia.
1. Independent Power Producer (IPP) Scheme
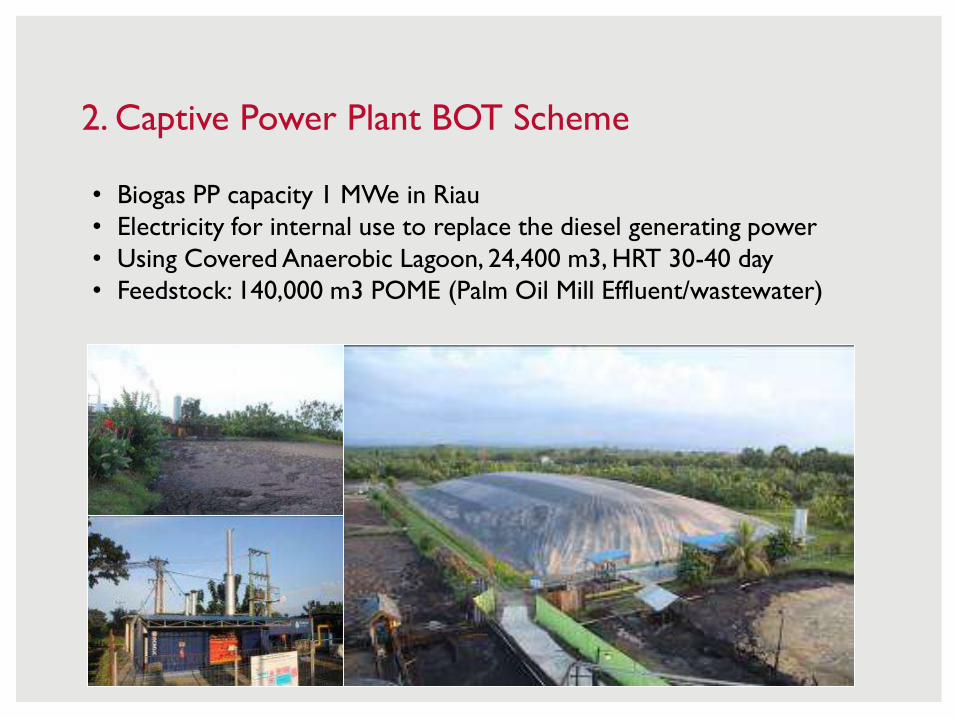
• Biogas PP capacity 1 MWe in Riau
• Electricity for internal use to replace the diesel generating power
• Using Covered Anaerobic Lagoon, 24,400 m3, HRT 30-40 day
• Feedstock: 140,000 m3 POME (Palm Oil Mill Effluent/wastewater)
2. Captive Power Plant BOT Scheme

• Biogas Power Plant 1 MW di Lampung (Starch Processing Mill)
• System UASB (Up-flow Anaerobic Sludge Blanket)
• Feedstock 550.000 m3 Starch Mill Effluent
Sources: Illustration UASB24
3. Captive Power Plant (Substitute Diesel Plant)
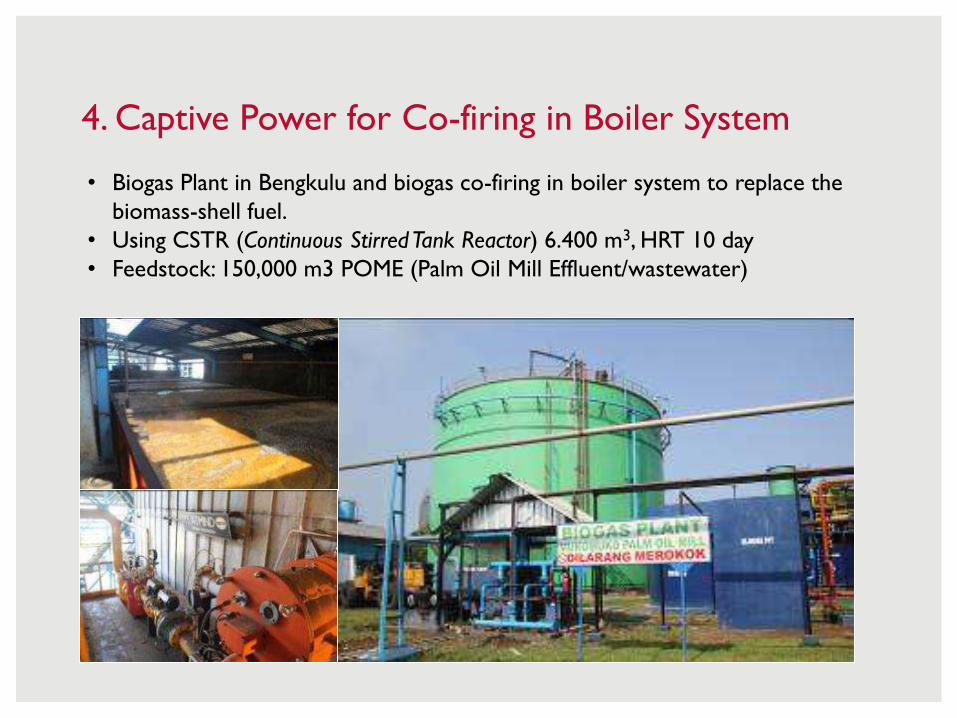
• Biogas Plant in Bengkulu and biogas co-firing in boiler system to replace the
biomass-shell fuel.
• Using CSTR (Continuous Stirred Tank Reactor) 6.400 m3, HRT 10 day
• Feedstock: 150,000 m3 POME (Palm Oil Mill Effluent/wastewater)
4. Captive Power for Co-firing in Boiler System
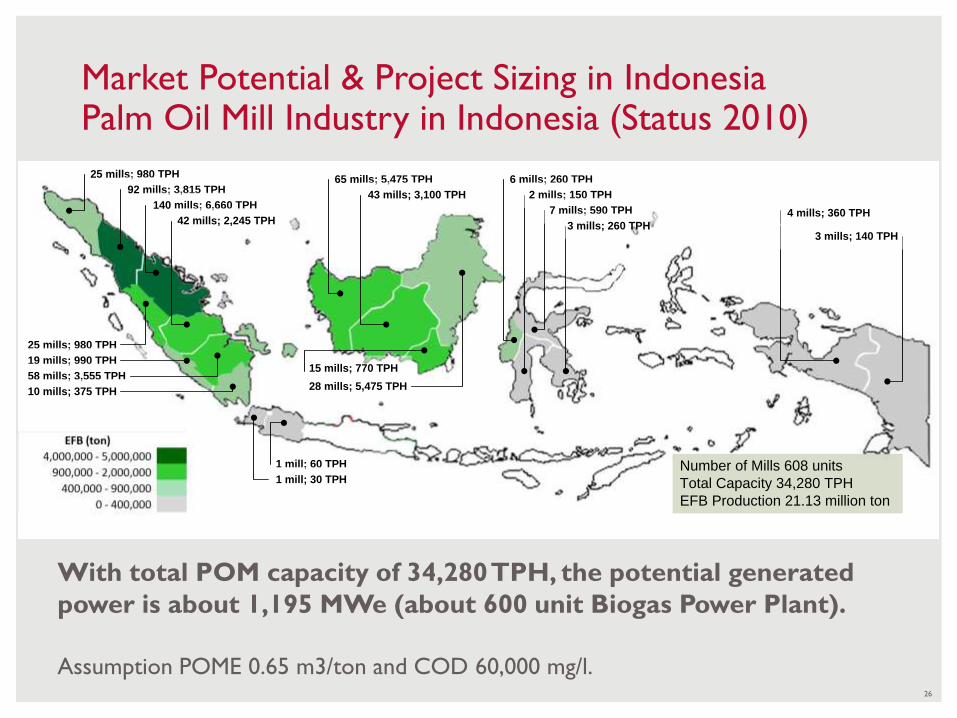
25 mills; 980 TPH
92 mills; 3,815 TPH
140 mills; 6,660 TPH
25 mills; 980 TPH
19 mills; 990 TPH
42 mills; 2,245 TPH
58 mills; 3,555 TPH
10 mills; 375 TPH
65 mills; 5,475 TPH
43 mills; 3,100 TPH
15 mills; 770 TPH
28 mills; 5,475 TPH
1 mill; 60 TPH
1 mill; 30 TPH
6 mills; 260 TPH
2 mills; 150 TPH
7 mills; 590 TPH
3 mills; 260 TPH
4 mills; 360 TPH
3 mills; 140 TPH
Number of Mills 608 units
Total Capacity 34,280 TPH
EFB Production 21.13 million ton
26
Market Potential & Project Sizing in IndonesiaPalm Oil Mill Industry in Indonesia (Status 2010)
With total POM capacity of 34,280 TPH, the potential generated
power is about 1,195 MWe (about 600 unit Biogas Power Plant).
Assumption POME 0.65 m3/ton and COD 60,000 mg/l.
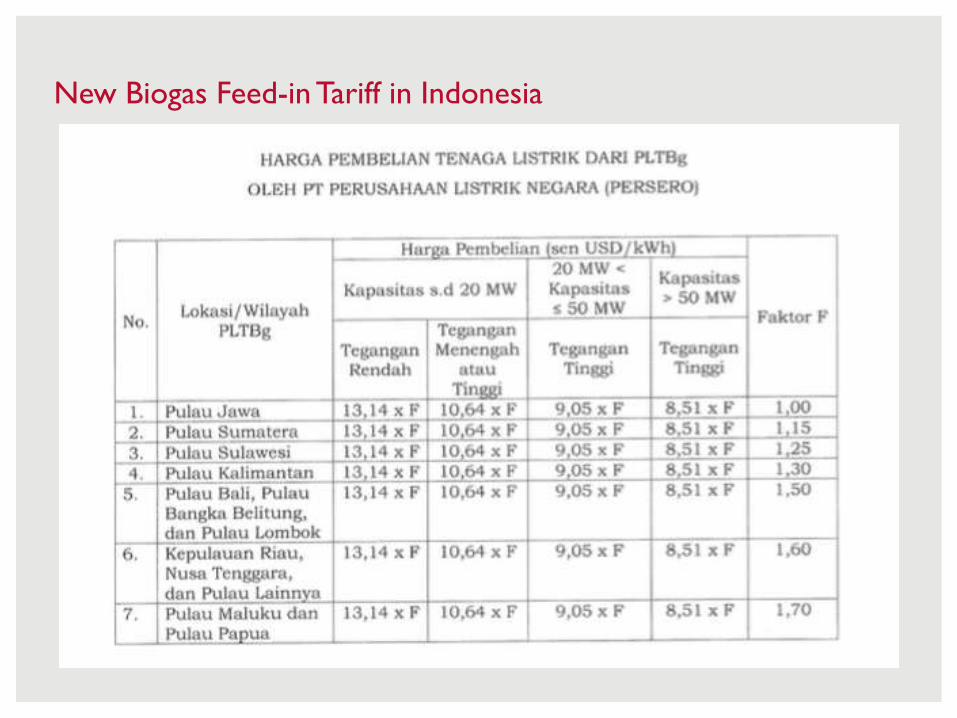
New Biogas Feed-in Tariff in Indonesia
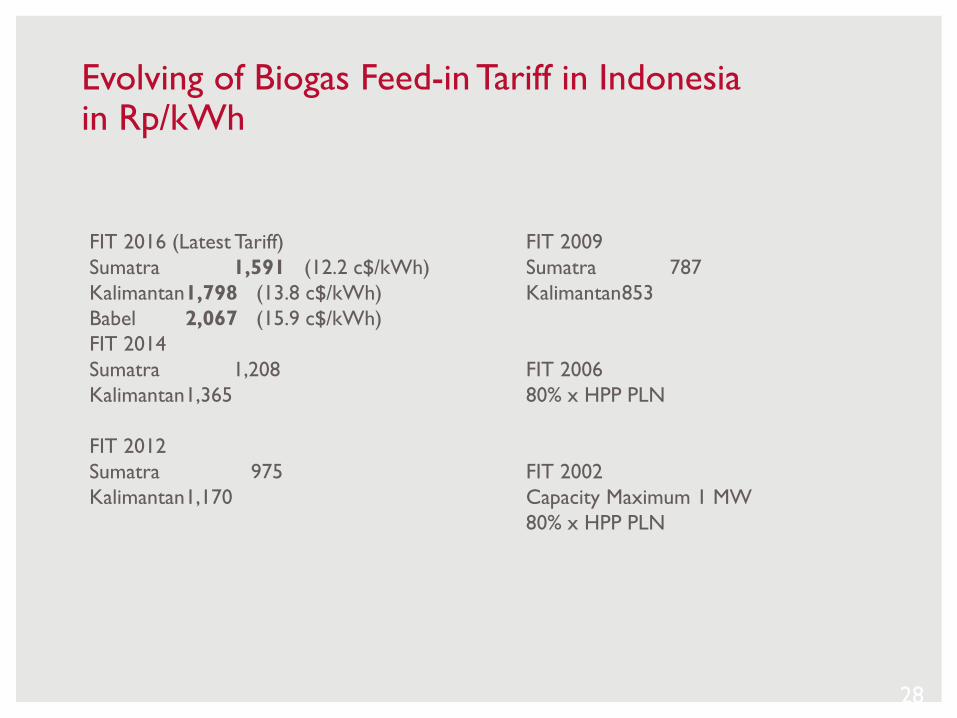
FIT 2016 (Latest Tariff)
Sumatra 1,591 (12.2 c$/kWh)
Kalimantan1,798 (13.8 c$/kWh)
Babel 2,067 (15.9 c$/kWh)
FIT 2014
Sumatra 1,208
Kalimantan1,365
FIT 2012
Sumatra 975
Kalimantan1,170
28
Evolving of Biogas Feed-in Tariff in Indonesiain Rp/kWh
FIT 2009
Sumatra 787
Kalimantan853
FIT 2006
80% x HPP PLN
FIT 2002
Capacity Maximum 1 MW
80% x HPP PLN
3. Typical Design of Biogas Power Plant
3.1 Type of System & Layout Diagram
3.2 Technology Selection & Characteristic
3.3 Mass and Energy Balance
3.4 Project Design Characteristic
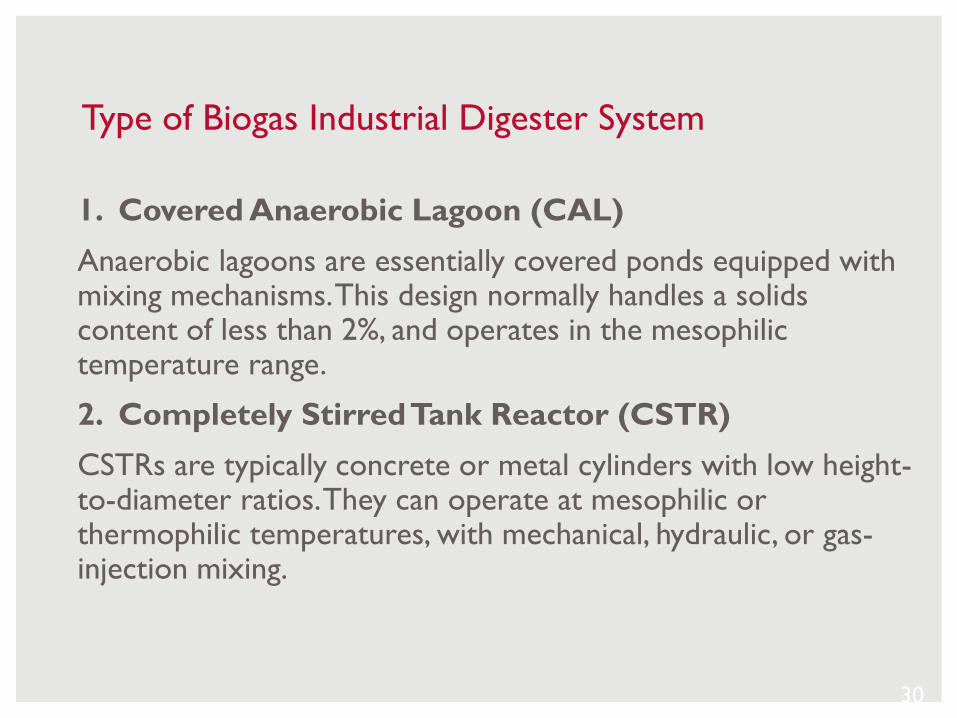
1. Covered Anaerobic Lagoon (CAL)
Anaerobic lagoons are essentially covered ponds equipped with mixing mechanisms. This design normally handles a solids content of less than 2%, and operates in the mesophilictemperature range.
2. Completely Stirred Tank Reactor (CSTR)
CSTRs are typically concrete or metal cylinders with low height-to-diameter ratios. They can operate at mesophilic or thermophilic temperatures, with mechanical, hydraulic, or gas-injection mixing.
30
Type of Biogas Industrial Digester System
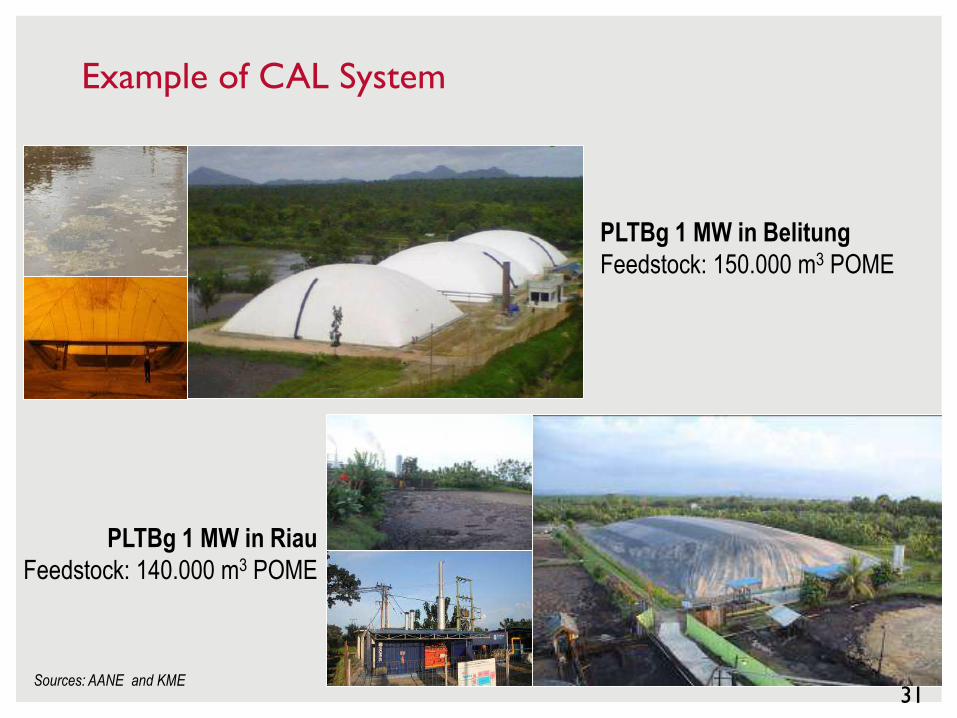
PLTBg 1 MW in Belitung
Feedstock: 150.000 m3 POME
Sources: AANE and KME
PLTBg 1 MW in Riau
Feedstock: 140.000 m3 POME
31
Example of CAL System
32
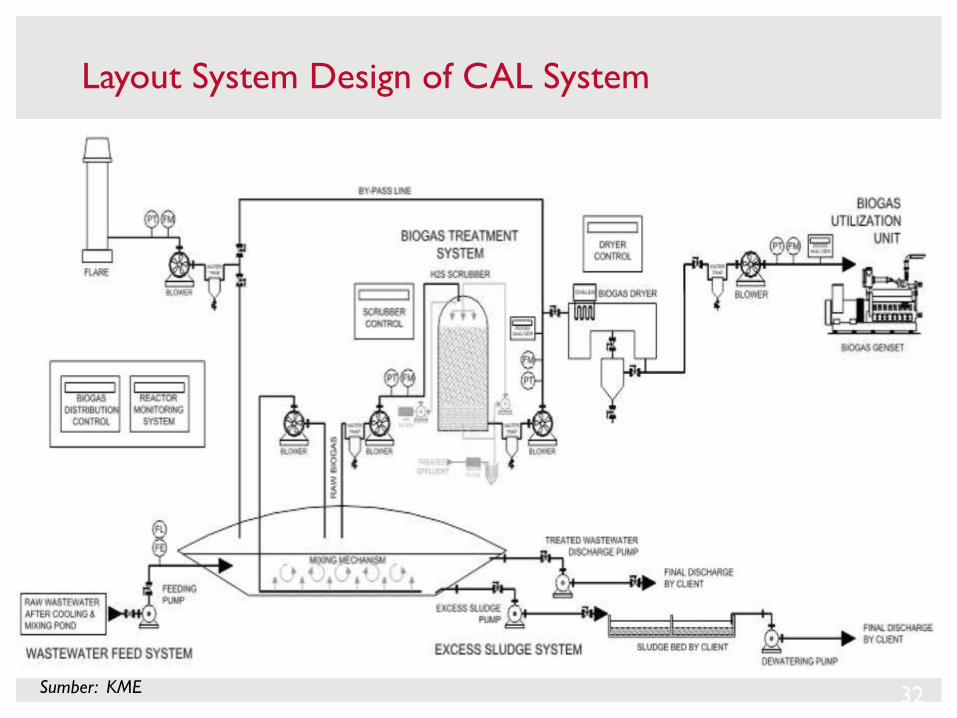
Layout System Design of CAL System
Sumber: KME
33
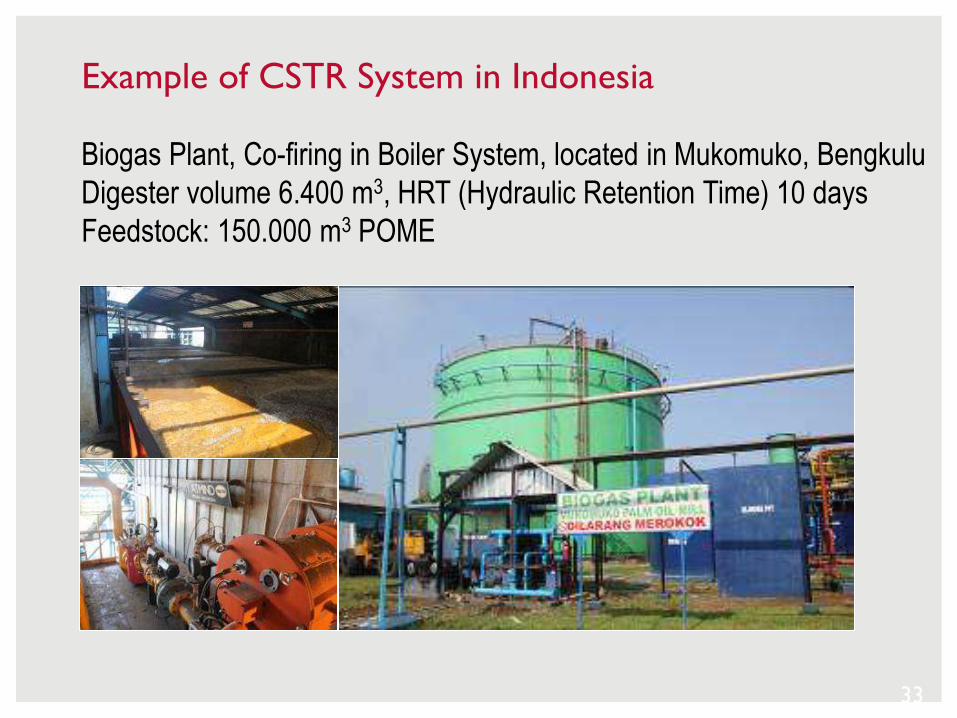
Biogas Plant, Co-firing in Boiler System, located in Mukomuko, Bengkulu
Digester volume 6.400 m3, HRT (Hydraulic Retention Time) 10 days
Feedstock: 150.000 m3 POME
Example of CSTR System in Indonesia
34
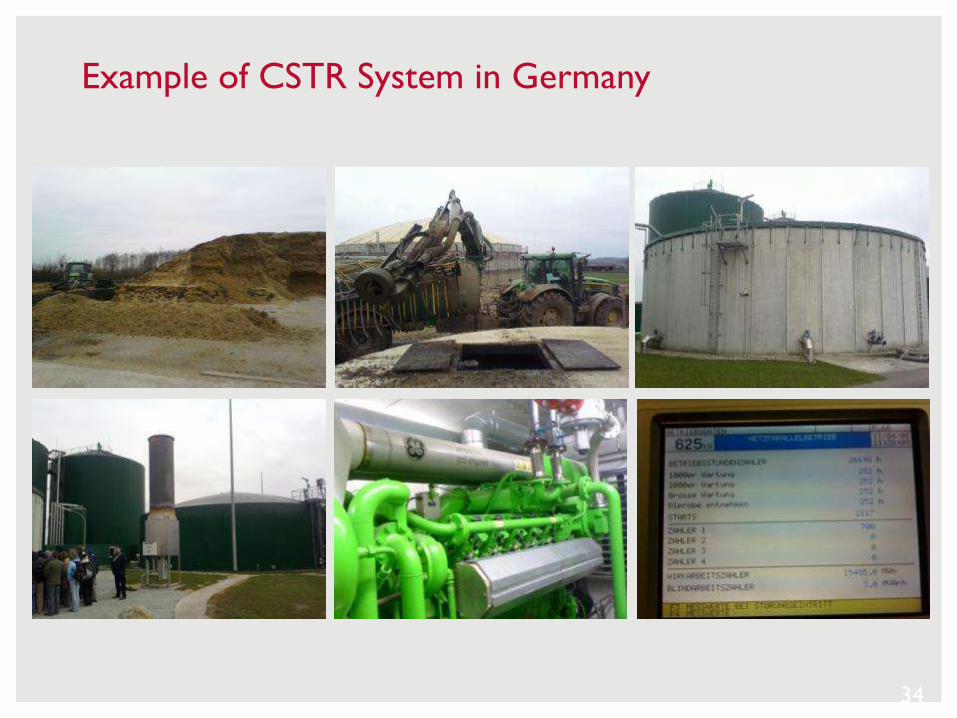
Example of CSTR System in Germany
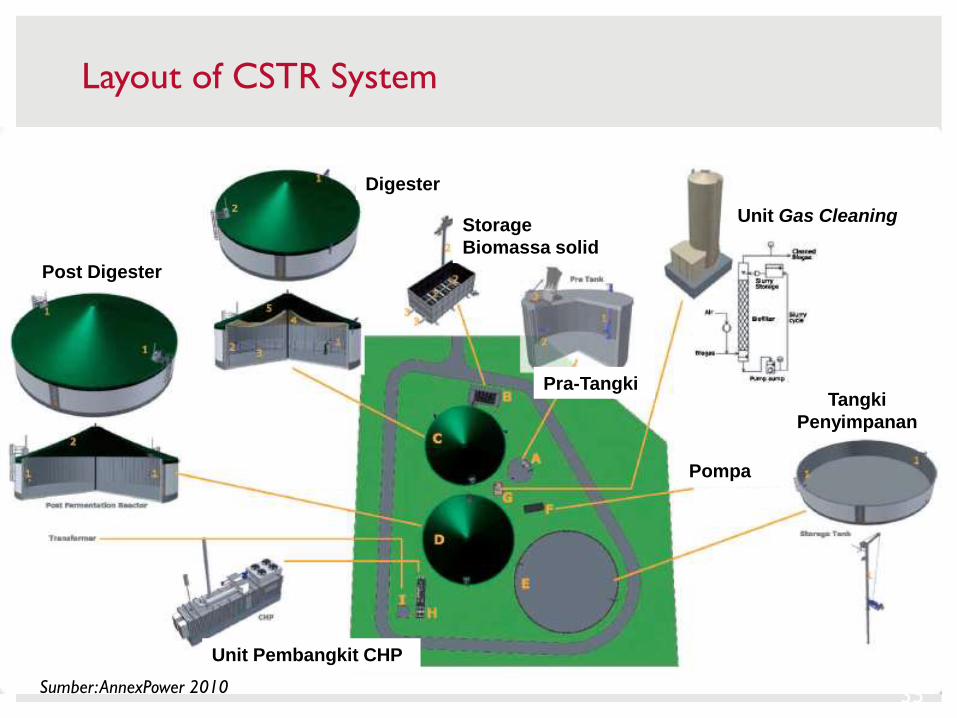
Digester
Post Digester
Storage
Biomassa solid
Tangki
Penyimpanan
Unit Pembangkit CHP
Pompa
Unit Gas Cleaning
Pra-Tangki
Sumber: AnnexPower 2010 35
Layout of CSTR System
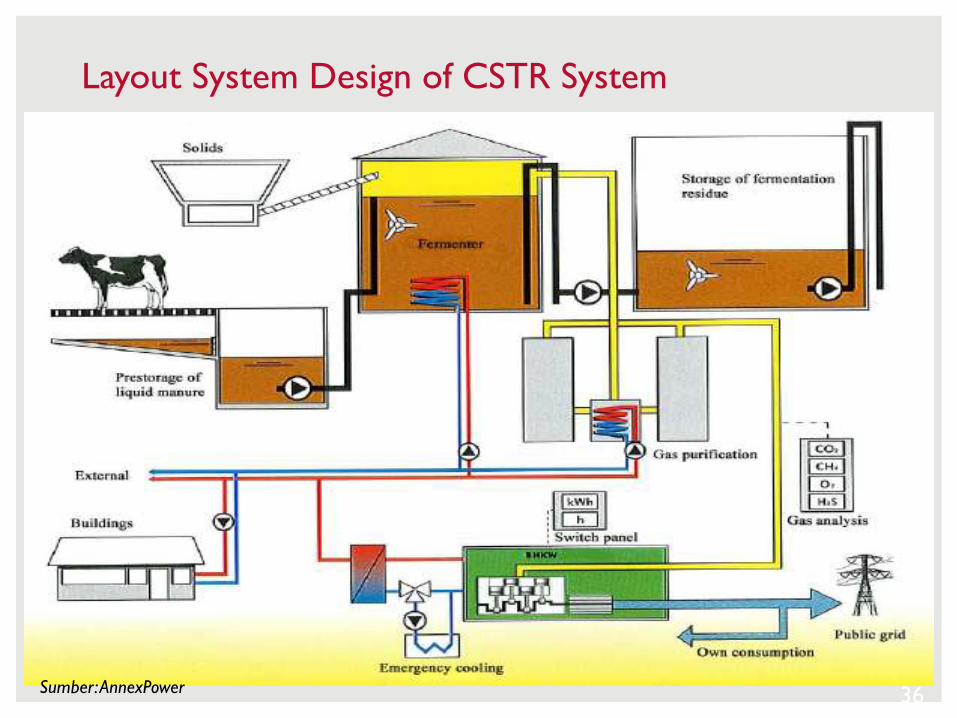
Sumber: AnnexPower 36
Layout System Design of CSTR System
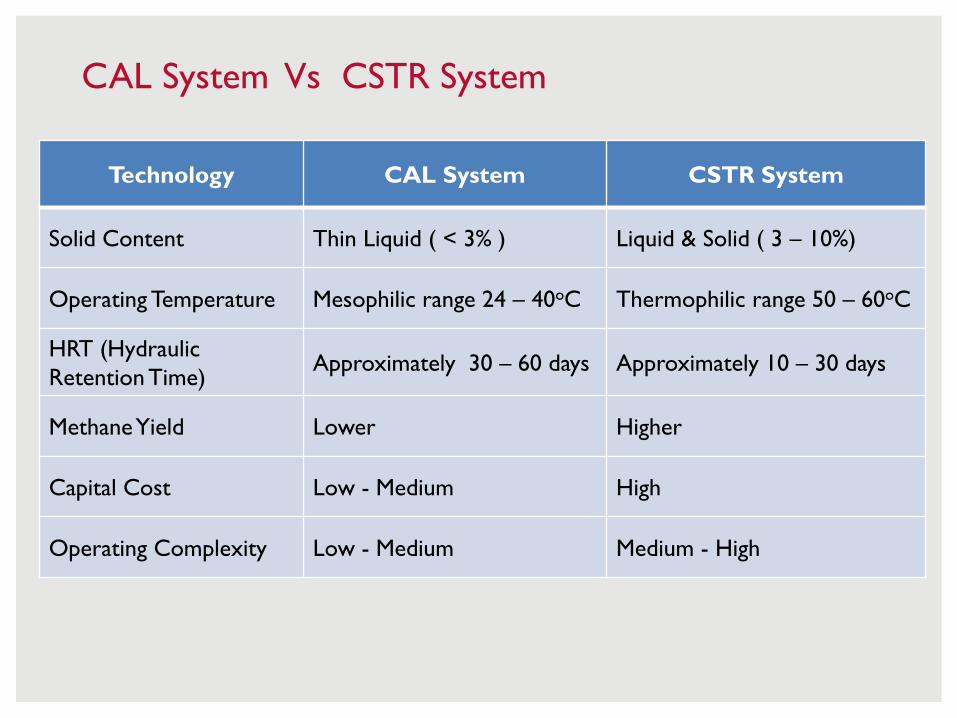
Technology CAL System CSTR System
Solid Content Thin Liquid ( < 3% ) Liquid & Solid ( 3 – 10%)
Operating Temperature Mesophilic range 24 – 40oC Thermophilic range 50 – 60oC
HRT (Hydraulic
Retention Time)Approximately 30 – 60 days Approximately 10 – 30 days
Methane Yield Lower Higher
Capital Cost Low - Medium High
Operating Complexity Low - Medium Medium - High
CAL System Vs CSTR System

Conversion System of POME to MW Capacity
Feedstock Parameters Unit Palm Oil Mill Capacity
Mill Capacity TPH 30 45 60 Supply FFB ton/year 150,000 230,000 300,000
Factor of Wastewater volume generated m3 POME/t FFB 0.65 0.65 0.65
Effluent quantity m3/year 97,500 149,500 195,000
COD of POME entering the digester mg/L 60,000 60,000 60,000
Methane fraction in Biogas m3 CH4/m3 Biogas 0.600 0.600 0.600
Digester efficiency 80% 80% 80%
Gas engine efficiency 38% 38% 38%
Potential Biogas generation m3 biogas/year 2,723,464 4,175,978 5,446,927
Methane content in Biogas m3 CH4/year 1,634,078 2,505,587 3,268,156
Potential gross total electricity generated kWh/year 6,188,950 9,490,830 12,380,788
Operational hours hours/year 7,008 7,008 7,008
Average Generated Capacity kWe 883 1,354 1,767
Installed Capacity MWe 1.0 1.5 2.0
Gas Engine Configuration MWe 1 1 + 5 2 x 1
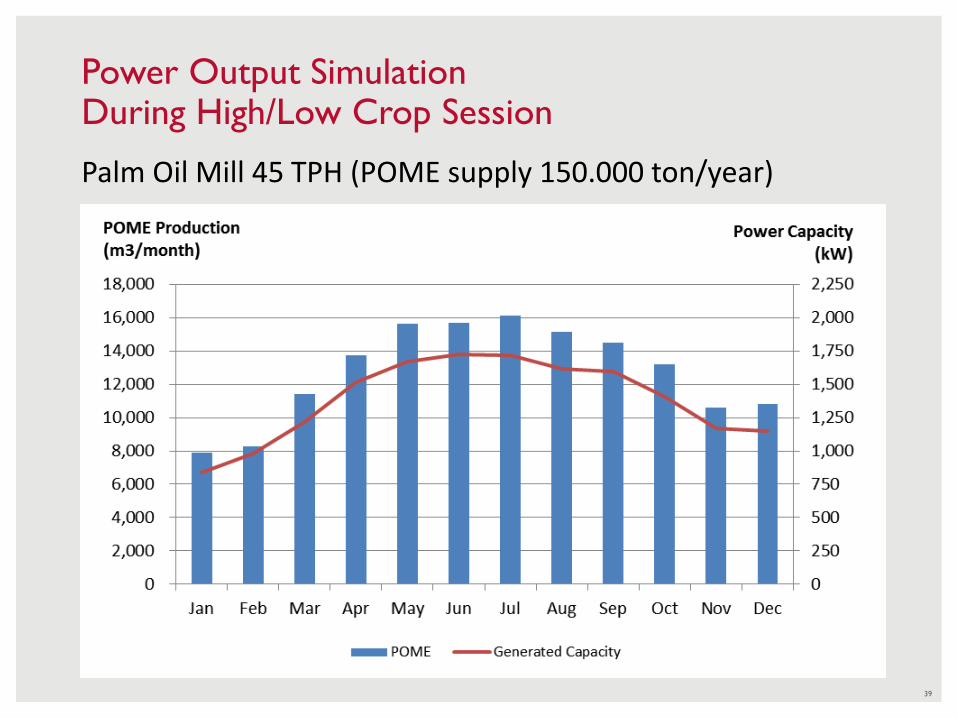
39
Palm Oil Mill 45 TPH (POME supply 150.000 ton/year)
Power Output SimulationDuring High/Low Crop Session
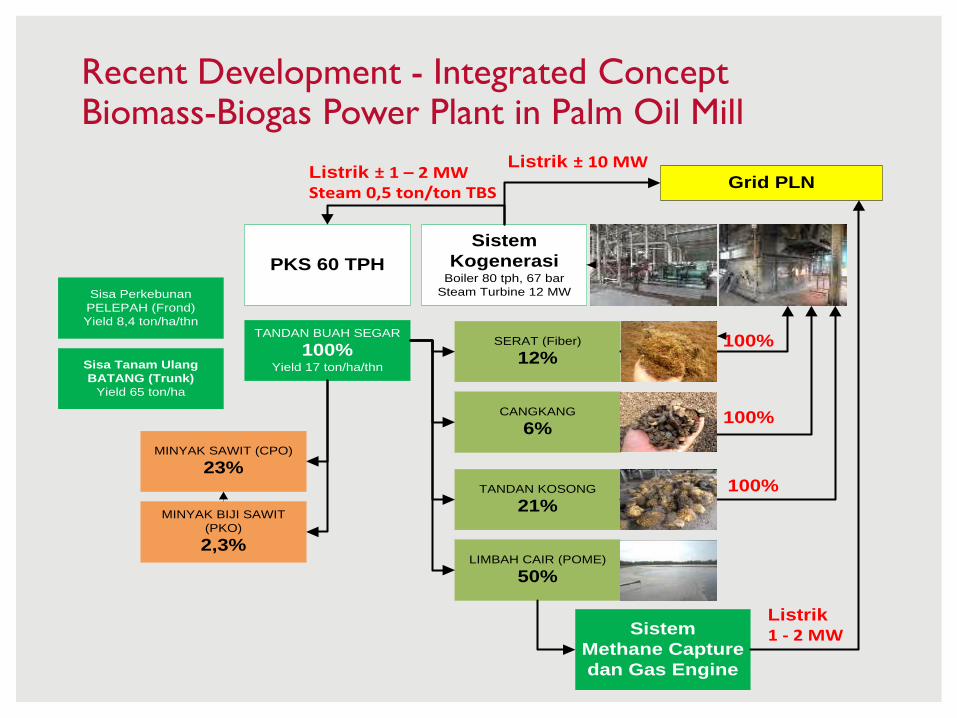
TANDAN BUAH SEGAR
100%Yield 17 ton/ha/thn
MINYAK SAWIT (CPO)
23%
MINYAK BIJI SAWIT
(PKO)
2,3%
SERAT (Fiber)
12%
CANGKANG
6%
TANDAN KOSONG
21%
LIMBAH CAIR (POME)
50%
Sisa Perkebunan
PELEPAH (Frond)
Yield 8,4 ton/ha/thn
Sisa Tanam Ulang
BATANG (Trunk)
Yield 65 ton/ha
PKS 60 TPH
Sistem
KogenerasiBoiler 80 tph, 67 bar
Steam Turbine 12 MW
100%
100%
100%
Grid PLN
Listrik ± 10 MW
Sistem
Methane Capture
dan Gas Engine
Listrik 1 - 2 MW
Listrik ± 1 – 2 MW Steam 0,5 ton/ton TBS
Recent Development - Integrated Concept Biomass-Biogas Power Plant in Palm Oil Mill
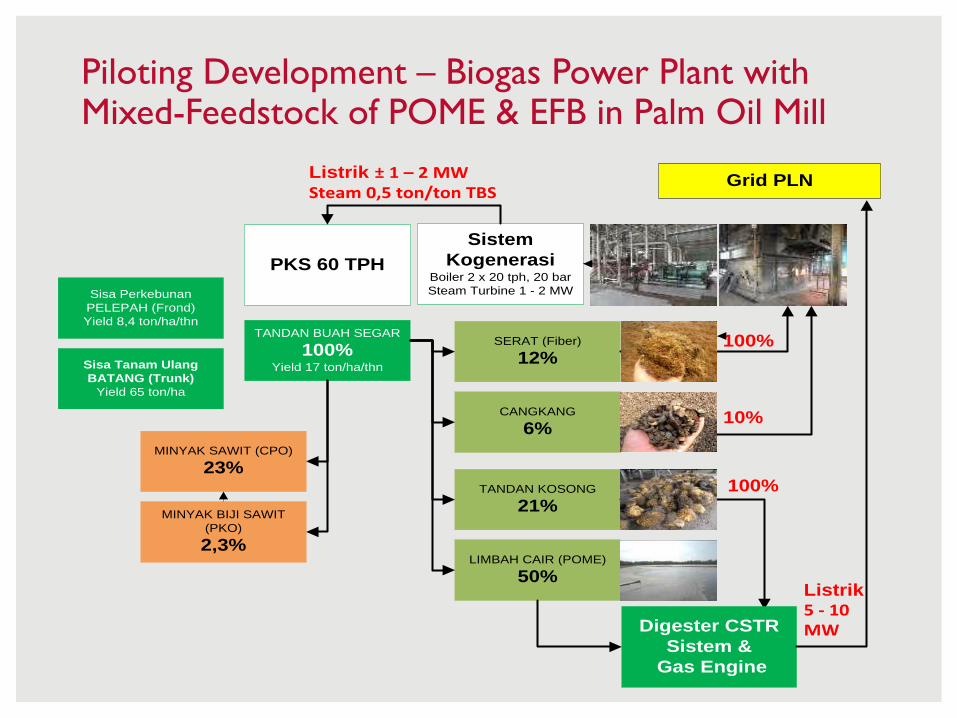
TANDAN BUAH SEGAR
100%Yield 17 ton/ha/thn
MINYAK SAWIT (CPO)
23%
MINYAK BIJI SAWIT
(PKO)
2,3%
SERAT (Fiber)
12%
CANGKANG
6%
TANDAN KOSONG
21%
LIMBAH CAIR (POME)
50%
Sisa Perkebunan
PELEPAH (Frond)
Yield 8,4 ton/ha/thn
Sisa Tanam Ulang
BATANG (Trunk)
Yield 65 ton/ha
PKS 60 TPH
Sistem
KogenerasiBoiler 2 x 20 tph, 20 bar
Steam Turbine 1 - 2 MW
100%
10%
100%
Grid PLN
Digester CSTR
Sistem &
Gas Engine
Listrik 5 - 10 MW
Listrik ± 1 – 2 MW Steam 0,5 ton/ton TBS
Piloting Development – Biogas Power Plant with Mixed-Feedstock of POME & EFB in Palm Oil Mill
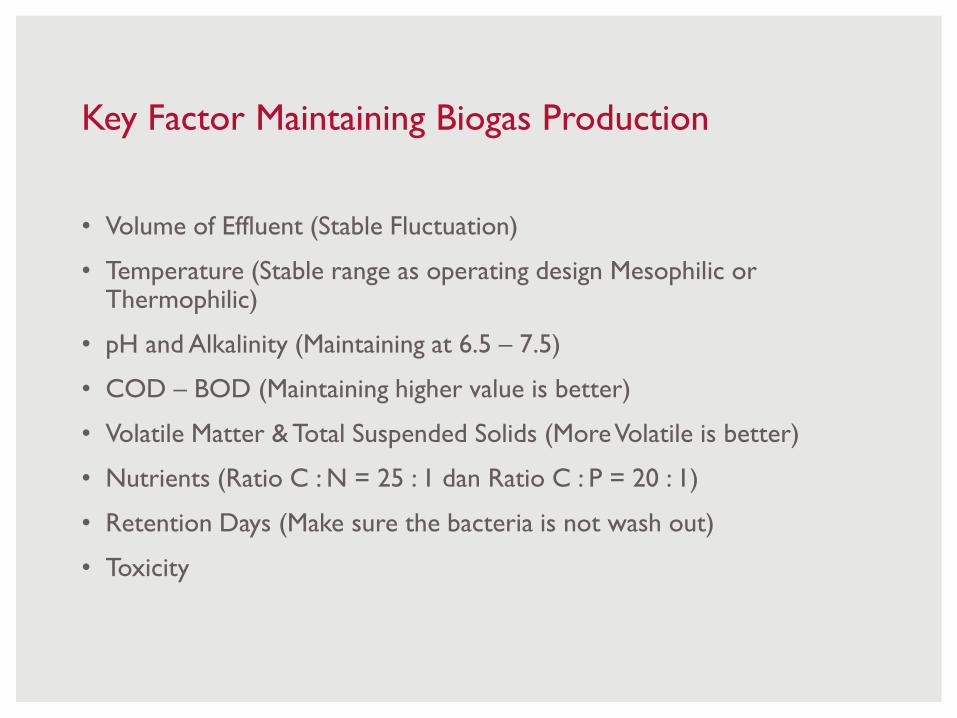
Key Factor Maintaining Biogas Production
• Volume of Effluent (Stable Fluctuation)
• Temperature (Stable range as operating design Mesophilic or Thermophilic)
• pH and Alkalinity (Maintaining at 6.5 – 7.5)
• COD – BOD (Maintaining higher value is better)
• Volatile Matter & Total Suspended Solids (More Volatile is better)
• Nutrients (Ratio C : N = 25 : 1 dan Ratio C : P = 20 : 1)
• Retention Days (Make sure the bacteria is not wash out)
• Toxicity
4. Project Development
4.1 Project Management
4.2 Project Construction
4.3 Project Cost
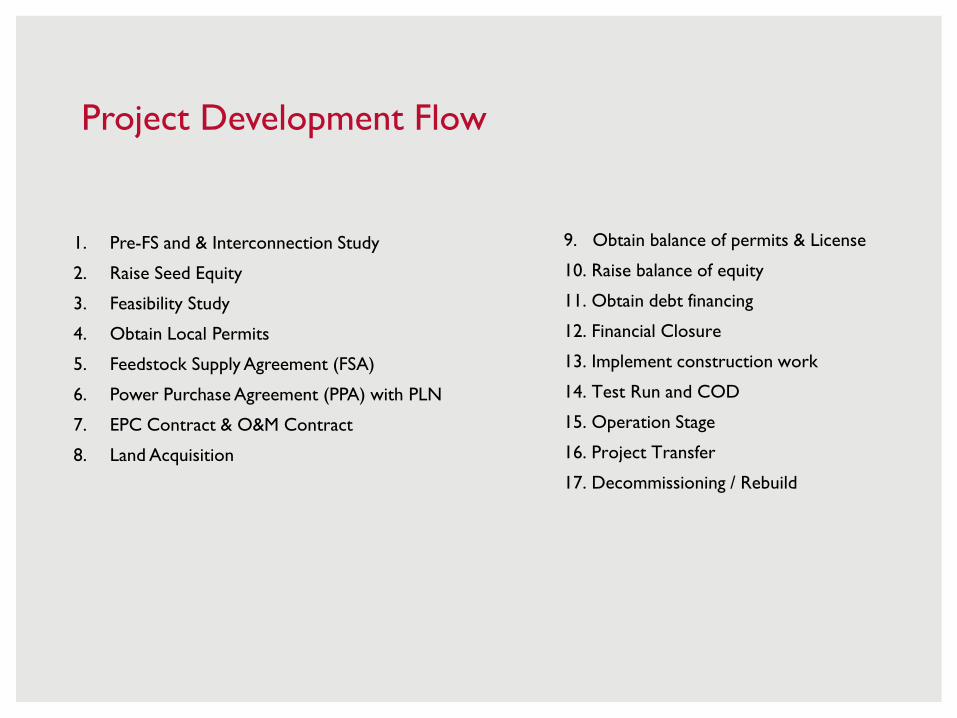
Project Development Flow
1. Pre-FS and & Interconnection Study
2. Raise Seed Equity
3. Feasibility Study
4. Obtain Local Permits
5. Feedstock Supply Agreement (FSA)
6. Power Purchase Agreement (PPA) with PLN
7. EPC Contract & O&M Contract
8. Land Acquisition
9. Obtain balance of permits & License
10. Raise balance of equity
11. Obtain debt financing
12. Financial Closure
13. Implement construction work
14. Test Run and COD
15. Operation Stage
16. Project Transfer
17. Decommissioning / Rebuild
45
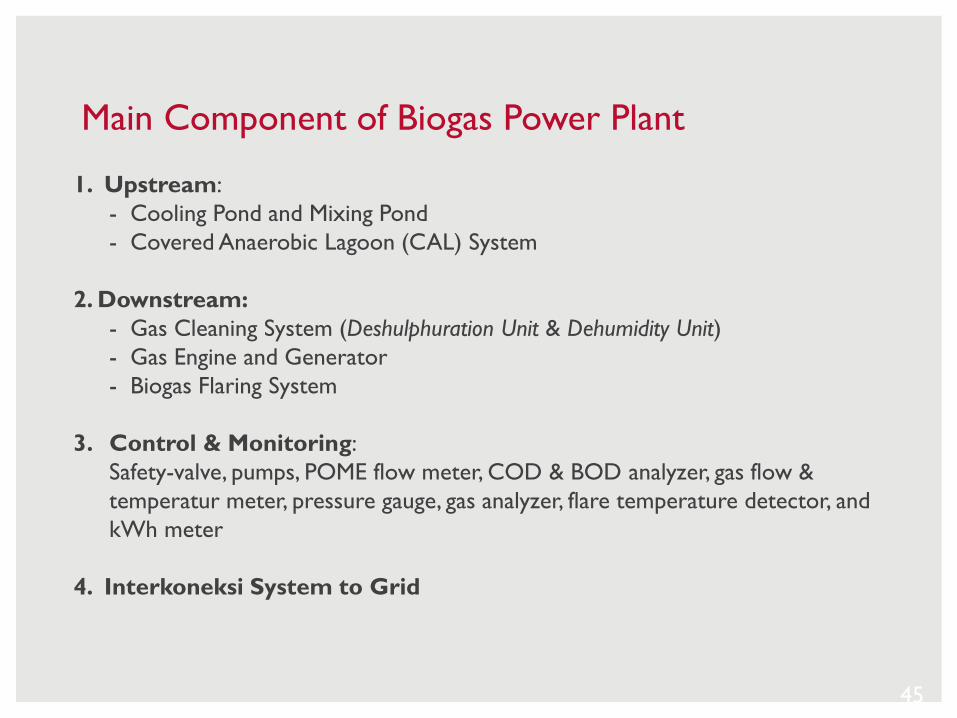
1. Upstream:
- Cooling Pond and Mixing Pond
- Covered Anaerobic Lagoon (CAL) System
2. Downstream:
- Gas Cleaning System (Deshulphuration Unit & Dehumidity Unit)
- Gas Engine and Generator
- Biogas Flaring System
3. Control & Monitoring:
Safety-valve, pumps, POME flow meter, COD & BOD analyzer, gas flow &
temperatur meter, pressure gauge, gas analyzer, flare temperature detector, and
kWh meter
4. Interkoneksi System to Grid
Main Component of Biogas Power Plant
46
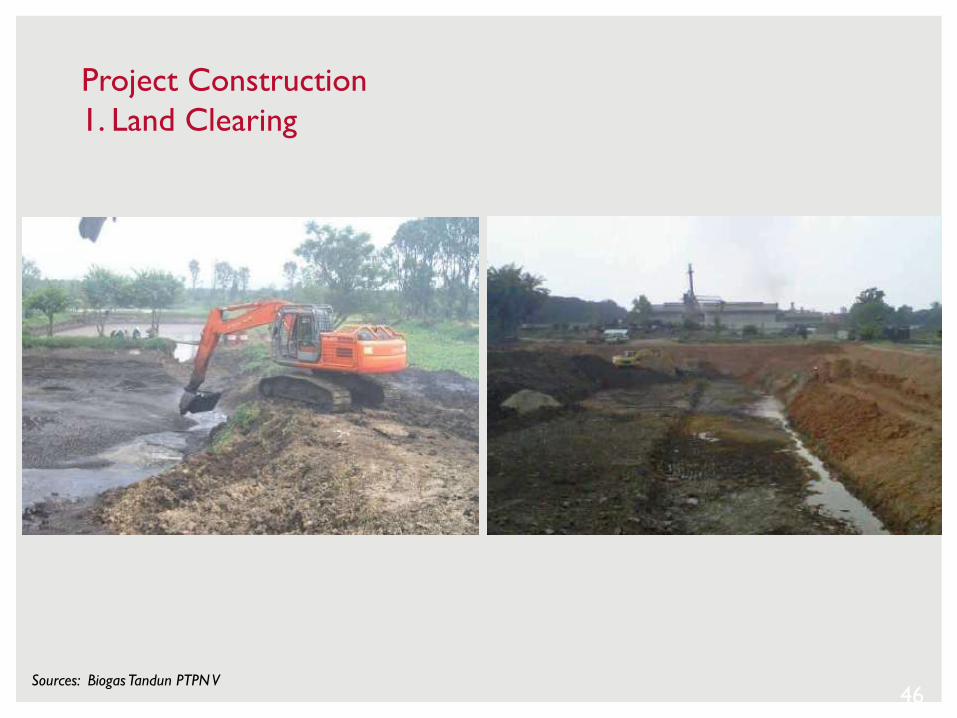
Project Construction
1. Land Clearing
Sources: Biogas Tandun PTPN V
47
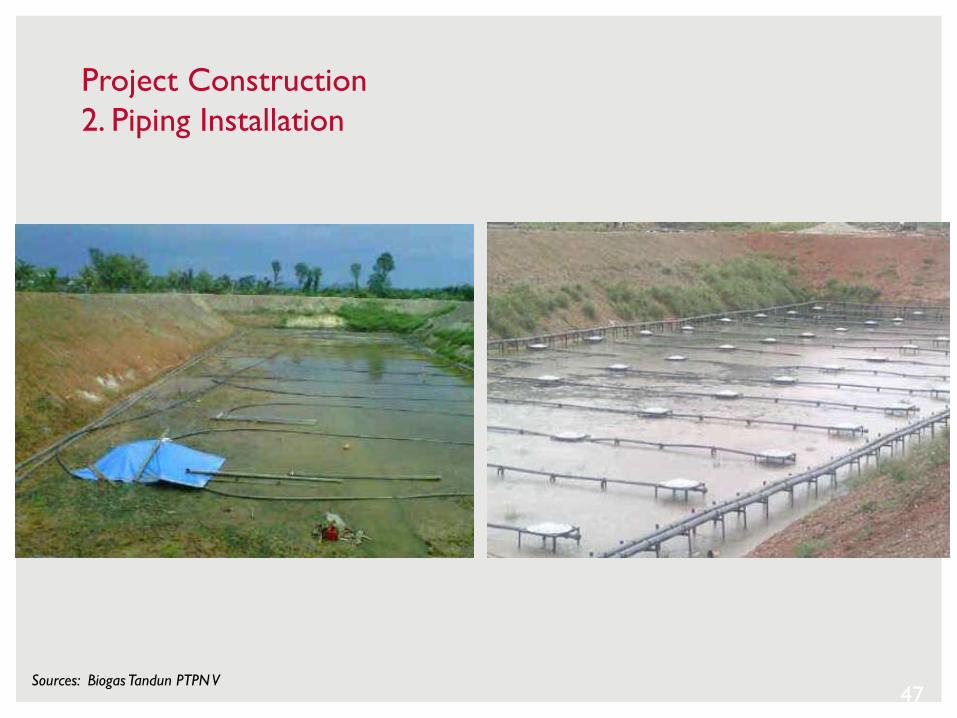
Project Construction
2. Piping Installation
Sources: Biogas Tandun PTPN V
48
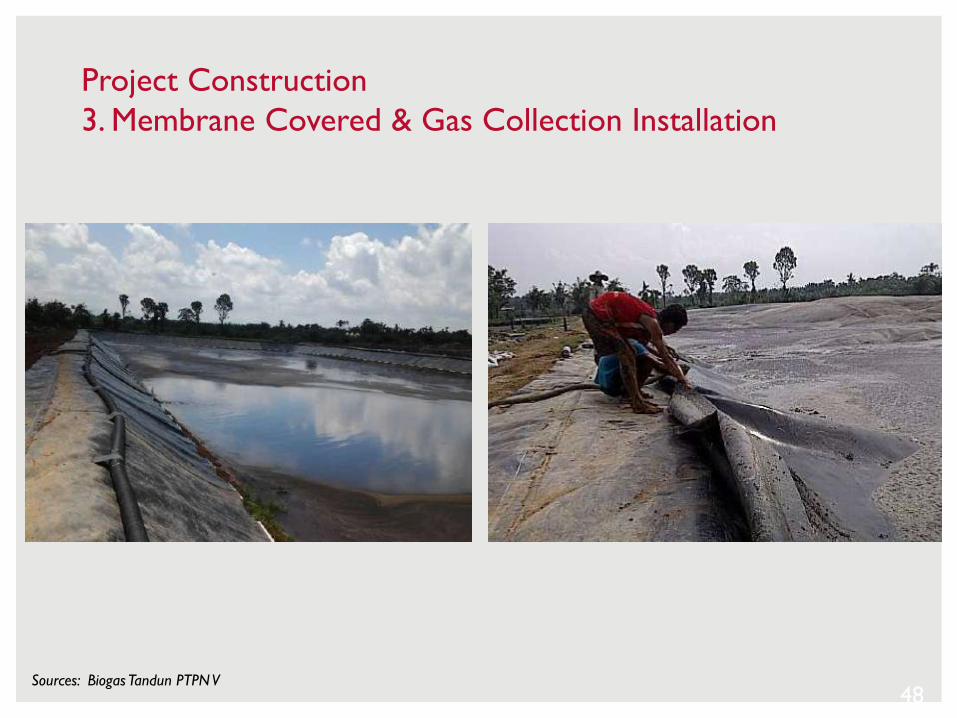
Project Construction
3. Membrane Covered & Gas Collection Installation
Sources: Biogas Tandun PTPN V
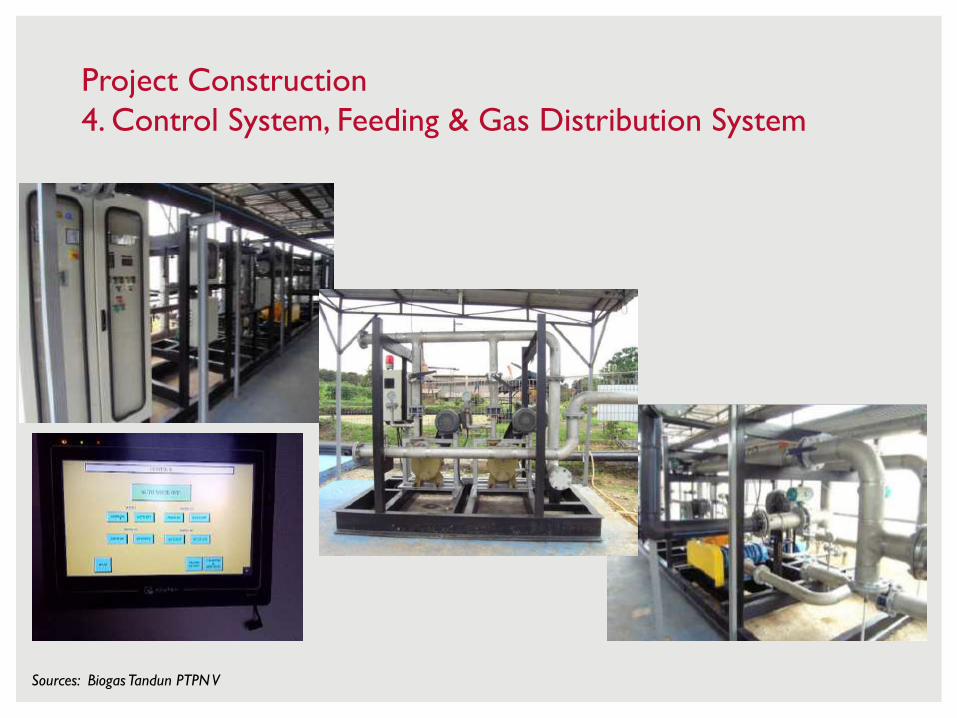
Project Construction
4. Control System, Feeding & Gas Distribution System
Sources: Biogas Tandun PTPN V
50
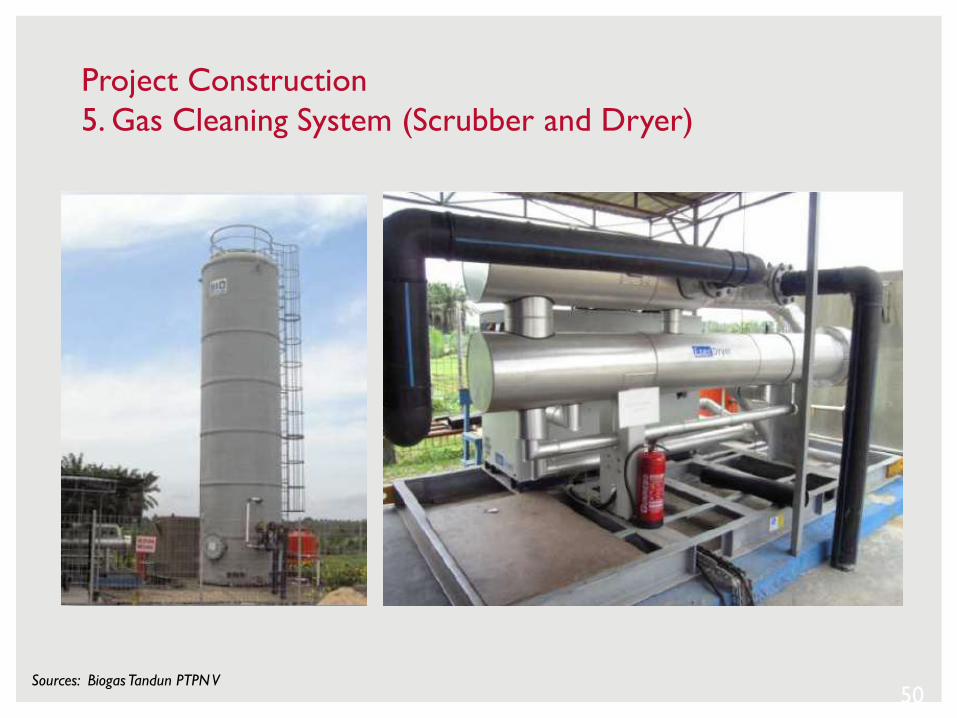
Project Construction
5. Gas Cleaning System (Scrubber and Dryer)
Sources: Biogas Tandun PTPN V
51
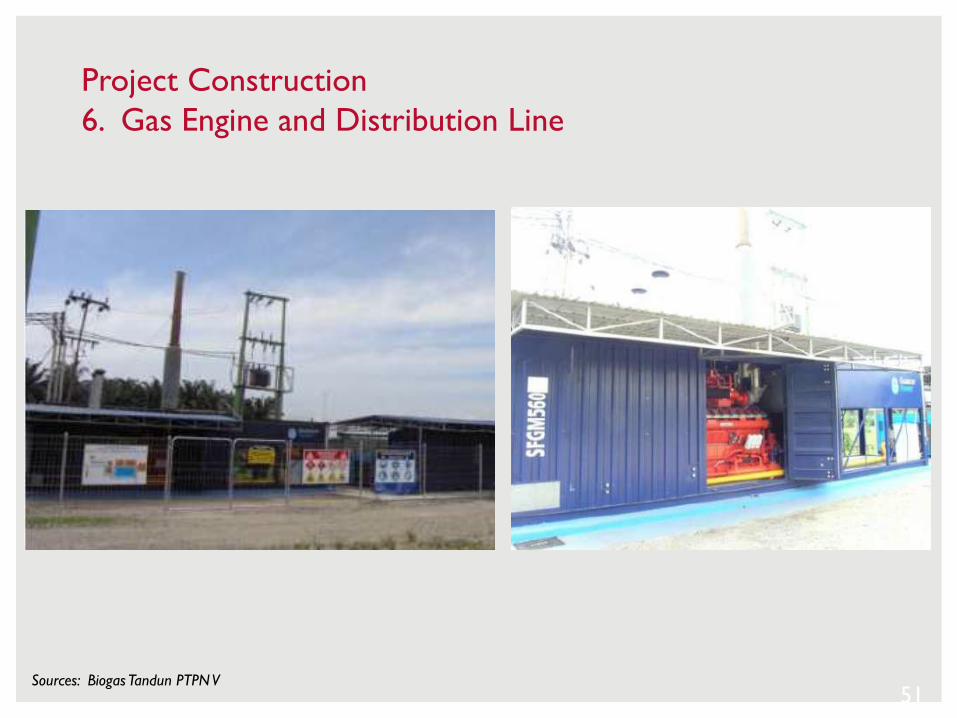
Project Construction
6. Gas Engine and Distribution Line
Sources: Biogas Tandun PTPN V
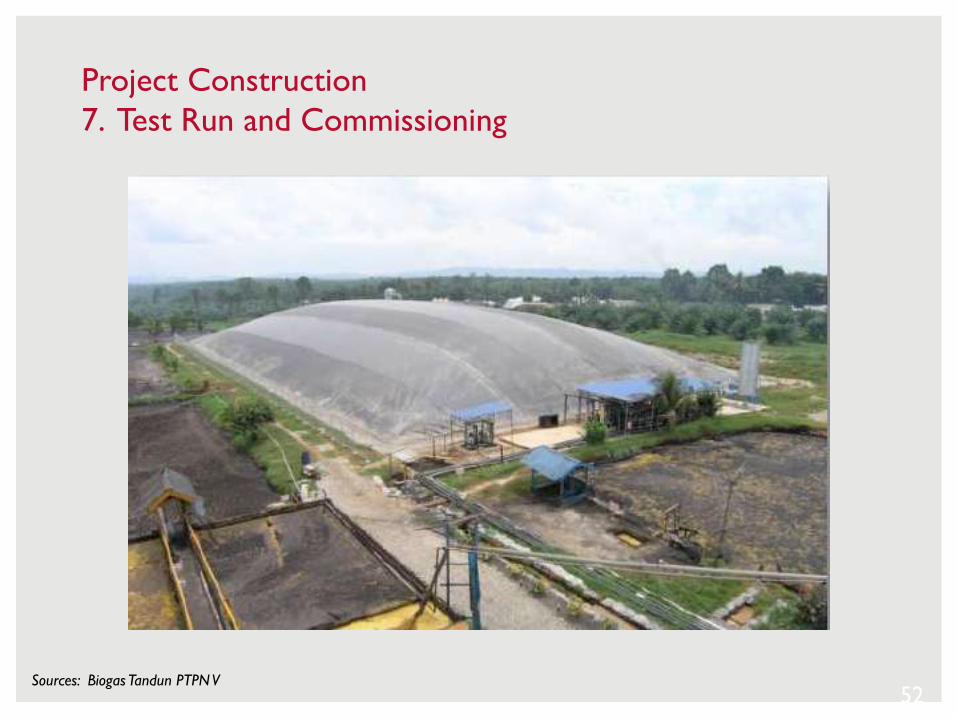
52Sources: Biogas Tandun PTPN V
Project Construction
7. Test Run and Commissioning
53
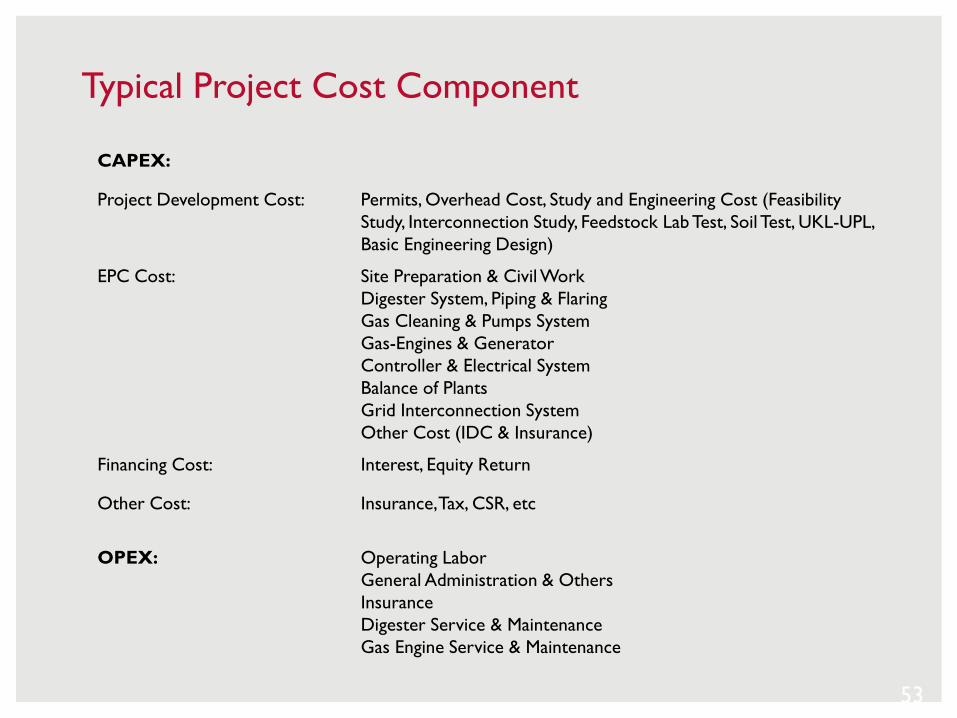
Typical Project Cost Component
CAPEX:
Project Development Cost: Permits, Overhead Cost, Study and Engineering Cost (Feasibility
Study, Interconnection Study, Feedstock Lab Test, Soil Test, UKL-UPL,
Basic Engineering Design)
EPC Cost: Site Preparation & Civil Work
Digester System, Piping & Flaring
Gas Cleaning & Pumps System
Gas-Engines & Generator
Controller & Electrical System
Balance of Plants
Grid Interconnection System
Other Cost (IDC & Insurance)
Financing Cost: Interest, Equity Return
Other Cost: Insurance, Tax, CSR, etc
OPEX: Operating Labor
General Administration & Others
Insurance
Digester Service & Maintenance
Gas Engine Service & Maintenance
54
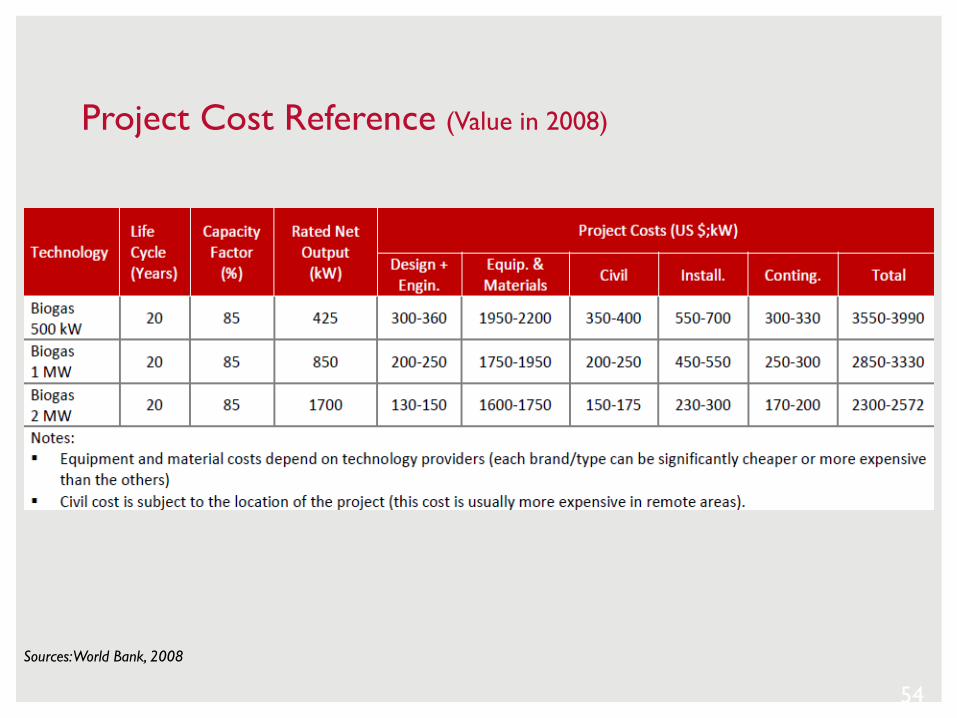
Sources: World Bank, 2008
Project Cost Reference (Value in 2008)
55
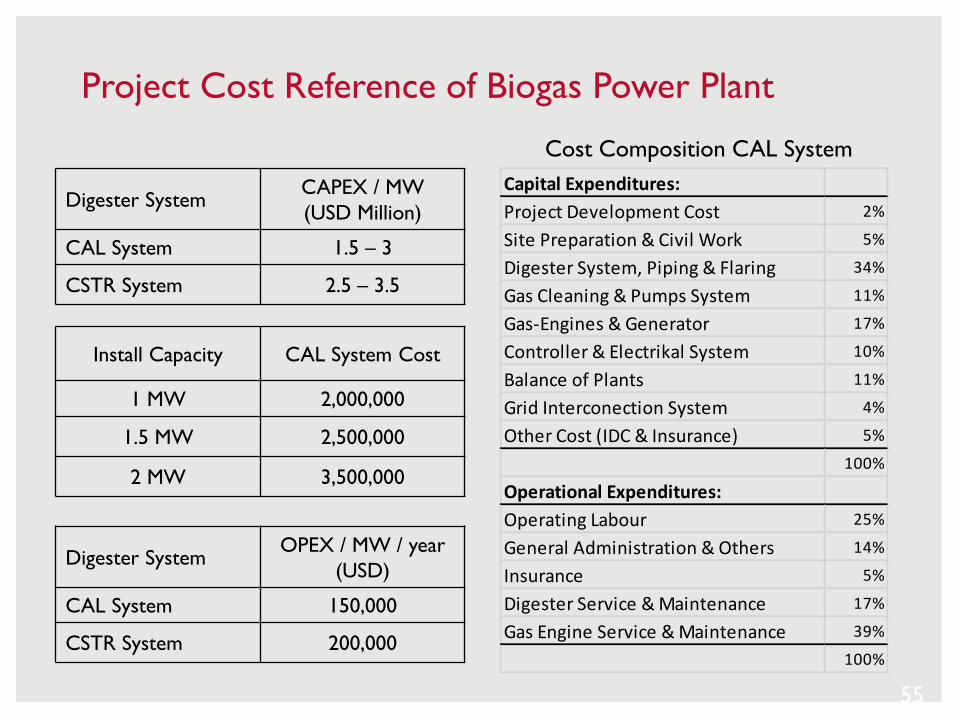
Project Cost Reference of Biogas Power Plant
Capital Expenditures:
Project Development Cost 2%
Site Preparation & Civil Work 5%
Digester System, Piping & Flaring 34%
Gas Cleaning & Pumps System 11%
Gas-Engines & Generator 17%
Controller & Electrikal System 10%
Balance of Plants 11%
Grid Interconection System 4%
Other Cost (IDC & Insurance) 5%
100%
Operational Expenditures:
Operating Labour 25%
General Administration & Others 14%
Insurance 5%
Digester Service & Maintenance 17%
Gas Engine Service & Maintenance 39%
100%
Cost Composition CAL System
Digester SystemCAPEX / MW
(USD Million)
CAL System 1.5 – 3
CSTR System 2.5 – 3.5
Install Capacity CAL System Cost
1 MW 2,000,000
1.5 MW 2,500,000
2 MW 3,500,000
Digester SystemOPEX / MW / year
(USD)
CAL System 150,000
CSTR System 200,000
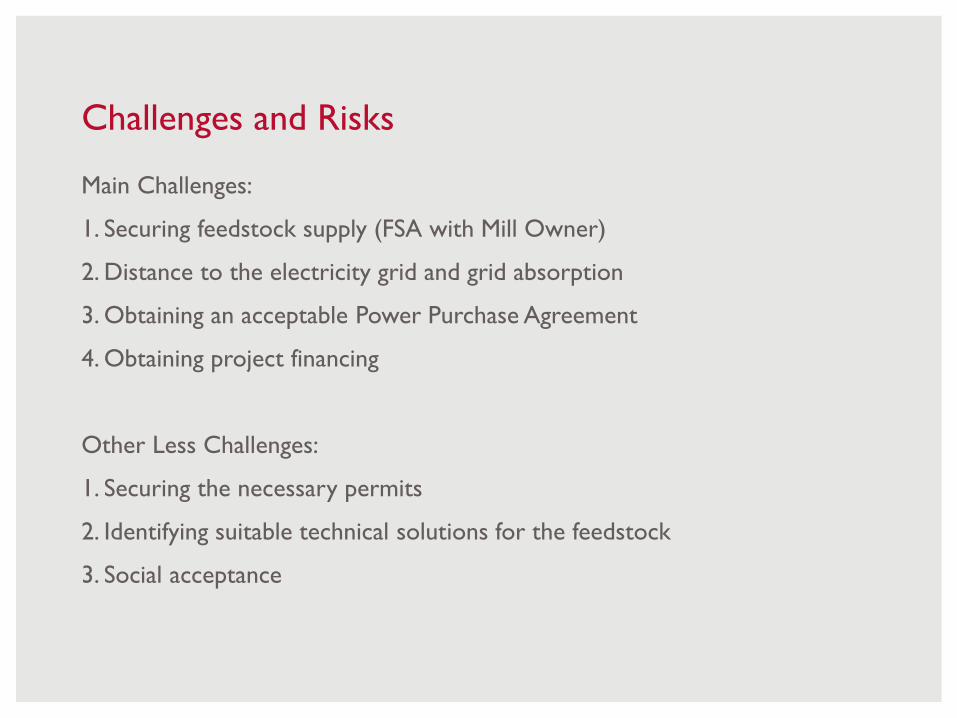
Challenges and Risks
Main Challenges:
1. Securing feedstock supply (FSA with Mill Owner)
2. Distance to the electricity grid and grid absorption
3. Obtaining an acceptable Power Purchase Agreement
4. Obtaining project financing
Other Less Challenges:
1. Securing the necessary permits
2. Identifying suitable technical solutions for the feedstock
3. Social acceptance
Thank You
Bayuaji Kencana
USAID ICED – Indonesia Clean Energy Development II
Implemented by
Tetra Tech | Complex World, Clear Solutions™
Menara Jamsostek, North Tower 14th Floor | Jl. Gatot Subroto No. 38 | Jakarta12710 INDONESIA
Main: +62 21 5296 2325 | Fax: +62 21 5296 2326
www.iced.or.id


