162
Biogas Digestion: Economic and Asset Assessment for Missouri Report to: Missouri Agricultural and Small Business Development Authority Missouri Value added Grant Program July 2020

Biogas Digestion: Economic and Asset Assessment for Missouri
Report to:
Missouri Agricultural and Small Business Development Authority Missouri Value added Grant Program
July 2020

PROJECT DEVELOPERS James Kaufman, MS, is a project director at the Economics and Management of Agrobiotechnology Center at the University of Missouri where he has developed 20 years of experience in assessing the economics and impacts of innovative technologies applied to agriculture. He received his MS in Agricultural Economics at MU in 2000. Alice Roach, MBA, is a senior research associate in the Division of Applied Social Sciences at the University of Missouri. Alice has conducted market research, assessed market opportunities, developed market analysis reports, evaluated business concept feasibility and recommended marketing strategies. In May 2008, Alice earned her bachelor's degree in agricultural journalism from the University of Missouri. In May 2010, she graduated with an MBA from the University of Missouri. She grew up on her family’s diversified farm in Harrisonville, Mo. Jill Moreland, MBA, is a program director in the Division of Applied Social Sciences at the University of Missouri. She received her BS in agricultural economics from the University of Missouri and her MBA in fall 2009 from William Woods University with an agricultural business emphasis. A native of California, Mo., Jill was raised on her family’s beef farm. Joe Parcell, PhD, is the director of the Division of Applied Social Sciences. He received his BA in mathematics from the University of Northern Iowa and MS and PhD from Kansas State University. He has directed feasibility and business analyses for more than 50 different projects since 2002. He is the author of more than 100 journal articles, meetings papers and extension publications related to agriculture. He is the co-author of one textbook, which is used widely both domestically and internationally.

TABLE OF CONTENTS INTRODUCTION ................................................................................................................................................ 6
EXECUTIVE SUMMARY ..................................................................................................................................... 8
1. INTRODUCTION TO ANEROBIC DIGESTER TECHNOLOGY ................................................................................. 19
Adoption of Biogas ............................................................................................................................... 19
Anaerobic Digestion Process .............................................................................................................. 20
Feedstocks ............................................................................................................................................ 20
Municipal Solid Waste ..................................................................................................................... 21
Wastewater ....................................................................................................................................... 21
Food and Food Processing Waste .................................................................................................. 21
Crops .................................................................................................................................................. 22
Crop Residues ................................................................................................................................... 22
Green Waste, Brown Waste and Compost ..................................................................................... 22
Manure ............................................................................................................................................... 23
Co-Digestion ...................................................................................................................................... 24
Digester Types ....................................................................................................................................... 25
Choosing the Optimal AD Bioreactor ............................................................................................. 25
2. MARKET ANALYSIS .................................................................................................................................... 33
Missouri Overview ................................................................................................................................. 33
Primary Feedstocks .............................................................................................................................. 35
Manure ............................................................................................................................................... 36
Food and Beverage Waste ............................................................................................................... 40
Grass, Woodland and Crop Residues ............................................................................................. 42
Crop Residue and Biomass Crops ................................................................................................... 45
Woody Biomass Feedstocks ............................................................................................................ 46
Potential Methane Production Potential ........................................................................................... 47
Product Markets ................................................................................................................................... 51
Electricity Markets ........................................................................................................................... 51
Natural Gas Markets ........................................................................................................................ 54
Fertilizer Market ............................................................................................................................... 58
Market Analysis .................................................................................................................................... 64
3. POLICY ..................................................................................................................................................... 68

Feed-in Tariffs or Production Incentives ............................................................................................ 68
Tax Credits ............................................................................................................................................. 68
Loans and Grants .................................................................................................................................. 69
Net Metering and Production Contracts ............................................................................................ 69
Missouri Renewable Energy Standard ............................................................................................... 70
Alternative Fuel Tax Exemptions ........................................................................................................ 70
Renewable and Low-Carbon Fuel Incentives .................................................................................... 71
4. ECONOMICS .............................................................................................................................................. 79
Capital Costs ......................................................................................................................................... 79
Anaerobic Digestion ......................................................................................................................... 79
Combined Heat and Power Costs ................................................................................................... 80
Production Costs ................................................................................................................................... 82
Biogas ................................................................................................................................................ 82
Electricity ........................................................................................................................................... 83
Biomethane Upgrading .................................................................................................................... 84
Transportation Costs and Centralization ........................................................................................... 86
Feasibility Analysis ............................................................................................................................... 88
Feasibility of Producing Commodity Energy .................................................................................. 88
Feasibility Assessment from Literature ......................................................................................... 90
Feasibility: Simulation Model .......................................................................................................... 95
Non-Pecuniary Biomethane Benefits ............................................................................................. 99
Feasibility: Failure Rates .............................................................................................................. 101
5. ANAEROBIC DIGESTION IN PRACTICE ........................................................................................................ 103
Livestock Facility Projects ................................................................................................................. 104
Livestock Case Examples .............................................................................................................. 107
Missouri Cases ................................................................................................................................ 109
Digesters Processing Food Waste .................................................................................................... 115
Food Waste Case Examples .............................................................................................................. 118
Landfill Gas Projects .......................................................................................................................... 120
6. CONCLUSIONS ......................................................................................................................................... 122
REFERENCES .............................................................................................................................................. 124
SUPPLEMENTAL MATERIALS ........................................................................................................................ 138
Biochemistry .................................................................................................................................... 138

Process Parameters ....................................................................................................................... 140
Digester Systems ................................................................................................................................ 142
Anaerobic Lagoons ......................................................................................................................... 142
Plug-Flow Digesters ........................................................................................................................ 143
Complete Mix or Continuously Stirred Tank Reactor ................................................................. 143
Induced Blanket Reactor (IBR) ..................................................................................................... 144
Dry Digestion ................................................................................................................................... 144
Digester Outputs ................................................................................................................................. 145
Biogas .............................................................................................................................................. 145
Digestate ......................................................................................................................................... 147
Biogas Upgrading to Biomethane ..................................................................................................... 150
Upgrading Process.......................................................................................................................... 150
Biomethane Upgrading Costs ....................................................................................................... 156
Industry Use of Biogas Upgrading ................................................................................................ 160
Conclusion ........................................................................................................................................... 161
INTRODUCTION Biogas production has the potential to extract value from waste streams and offer economic and environmental benefits. Its effect on rural economies and environments has led to biogas production becoming a popular renewable energy technology in Europe. Adoption of the technology has also grown in North America during the past decade but has been slowed by uncertain incentives and regulation, volatile energy prices and changing agricultural markets. Given its abundant supply of agricultural residues, manure and food processing waste, Missouri may be well-positioned to attract investment in biogas to manage these waste streams. The biogas that’s produced could then generate electricity or undergo further processing into renewable natural gas. Biogas plants have trended toward larger installations that focus on using multiple waste streams and converting waste into multiple co-products to improve efficiency and profitability. Co-products generated from biogas production—namely, digestate, heat, carbon dioxide and liquid fertilizer—could have value as inputs for multiple Missouri industries. A need exists, however, to determine whether and where Missouri has the environment—in terms of biogas feedstock material and co-product demand—to support biogas production investment. To respond to this need, this study identifies opportunities and challenges related to biogas production in Missouri. Ultimately, it will help stakeholders determine under what conditions biogas production makes sense within the state. The project addresses five objectives:
1) Assess the economic factors that impact biogas production feasibility. 2) Develop a present-day asset inventory of Missouri’s existing biomass feedstocks. 3) Conduct an inventory of markets for biogas and co-products. 4) Provide a general assessment of biogas feasibility. 5) Analyze select biogas operations through case studies and surveys.
Target Audience This document intends to identify the primary considerations for firms considering investments in biogas anaerobic digesters, especially in Missouri. The paper is written for the nontechnical enthusiast. Disclaimer This report is the product of a research study meant to describe how to produce biogas, identify nontechnical factors relevant to its effective production, describe potential markets and broadly contextualize biogas within Missouri. It does not consider a specific set of technologies or circumstances and is not meant as a tool to forecast the feasibility of any business operation. Additional Resources Supplemental material collects additional resources and research that the authors believed would be instructive for readers. Abbreviations AD Anaerobic digester CAFO Concentrated animal feeding operation CARB California Air Resources Board
CH4 Methane CHP Combined heat and power CI Carbon intensity CNG Compressed natural gas CO2 Carbon dioxide CTSR Continuously stirred tank reactor DGE Diesel gallon equivalent EISA Energy Independence and Security Act EPA Environmental Protection Agency FIT Feed-in-tariffs GGE Gasoline gallon equivalent GHG Greenhouse gas GW Gigawatt H2S Hydrogen sulfide HRT Hydraulic retention time IBR Induced blanket reactor IEA International Energy Agency ITC Investment tax credit kW kilowatts kWh Kilowatts per hour LBM Liquefied biomethane LCFS Low carbon fuel standard LFP Landfill gas LNG Liquefied natural gas MSW Municipal solid waste MW Megawatts NASS National Agricultural Statistics Service O&M Operations and maintenance ODM Organic dry matter PTC Production tax credit RES Renewable energy standard RFS Renewable Fuel Standard RIN Renewable identification number SS Suspended solids TS Total solids UASB Upflow anaerobic sludge blanket VS Volatile solids WWTP Wastewater treatment plant
EXECUTIVE SUMMARY The “Biogas Digestion: Economic and Asset Assessment for Missouri” report describes key considerations for Missouri operations interested in biogas production. Anaerobic Digestion To produce biogas, biodegradable material undergoes anaerobic digestion, which occurs as anaerobic microorganisms decompose organic matter in an environment without oxygen. This process produces biogas rich in methane and carbon dioxide. In the U.S., facilities use biogas to power engine-generators or boilers that produce electricity and heat. Alternatively, they may upgrade the biogas to prepare it for being injected into natural gas pipelines or used as a vehicle fuel. Feedstocks Feedstocks refer to the waste streams or substrates used to feed an anerobic digester. They vary according to their source, composition, homogeneity, fluid dynamics, dry matter content, methane yield and biodegradability. For decades, municipal wastewater facilities have used anaerobic digesters. Today, most digesters process residual sludge from wastewater treatment plants or livestock manure. However, facilities may consider a broad range of feedstocks, including fats, oils and greases; food processing waste; crop residues; garden and yard waste; food refuse; slaughterhouse waste; sewage sludge; and energy crops. Digester operators may choose to supplement the primary feedstock with other substrates. Known as co-digestion, this approach may allow a digester to collect tipping fees, which industries pay to dispose of waste streams they generate. Other co-digestion benefits include increasing biogas productivity, reducing dependence on one feedstock and managing seasonal feedstock supply fluctuations. Digester Systems Facilities may choose from a variety of possible digesters, including covered lagoons, plug flow systems, complete mix tanks and induced blanket reactors. Depending on the digester, systems can operate in mesophilic, thermophilic or ambient conditions. Mesophilic systems operate at moderate (stable) temperatures, but thermophilic systems require heating to 122°F and above. Selecting an optimal digester depends on a number of factors. Perhaps the top considerations are the feedstock used and its total solids content. Where total solids are low, covered lagoons or high-rate digesters can fit well; however, feedstocks with solids content greater than 3% may work well in complete mix or plug flow systems. Dry digesters are an option for material drier than 15%. When choosing a system, also consider its fit with an operation’s existing management practices. For example, if a livestock operation already uses lagoons to manage manure, then it likely needs anaerobic lagoons to leverage existing infrastructure and minimize cost. Biogas Utilization Generally, biogas has one of three applications: heat, combined heat and power (electricity) or natural gas alternative. When only heat is desired, a boiler combusts the biogas to warm water for heating purposes. Typically, the digester itself and the local facility use the heat. In a combined heat and power
system, the biogas fuels an engine to produce mechanical energy and heat, a generator converts the mechanical energy into electricity, and a heat recovery system harnesses waste heat into useable energy. Although the local site tends to use the heat, the electricity can be transported off site. Upgrading the biogas to biomethane generates an alternative to natural gas that could be injected into a pipeline or consumed as a vehicle fuel. Missouri Energy Use A number of underlying factors condition Missouri’s biogas adoption and use. In terms of energy production, it totaled 184 trillion Btus in 2017; much originated from renewable sources. However, state energy consumption exceeded 1,850 trillion Btus in 2018. As suggested by this difference, the state relies heavily on energy imports. Combined, the transportation and residential sectors each consume roughly 30% of the state’s energy. Because of its moderate climate, the state’s energy consumption per capita is close to the national median. Coal and petroleum supplied nearly 70% of the state’s total energy use in 2018. Renewable sources contributed about 6% of Missouri's total electricity net generation. The primary renewable electricity sources were wind and hydropower. Missouri Feedstock Supply Missouri has a number of feedstock resources relevant to biogas production. Manure and food waste are considered primary feedstocks. Waste from cattle, swine and poultry could power a digester. However, to use the manure, livestock operations must have a system to collect the manure efficiently. Because most cattle graze on pasture, collecting cattle manure would be difficult. Poultry litter and swine manure could be viable feedstocks. Given the need for efficient manure collection, only manure generated by concentrated animal feeding operations (CAFOs) would likely be relevant to a biogas facility. North central, east central and southwestern Missouri have concentrations of CAFOs that potentially could coordinate an anaerobic digester’s development. Food and beverage manufacturing waste often increases biogas yields relative to typical feedstocks such as manure. The manufacturing waste also tends to be relatively homogenous and consistent. In Missouri, areas estimated to have the greatest amount of food processing waste available (aside from urban areas) tend to loosely align with areas where CAFOs tend to concentrate—most notably in the southwest corner of the state and to a lesser degree in the northern and central portions of the state. This suggests potential opportunities to co-digest manure and food processing waste. Residential and commercial food waste may also be important and is correlated with urban areas. Digesters may also consider other materials, such as grass, crop residues and wood resources, as secondary feedstocks for producing biogas. Their carbon-to-nitrogen (C/N) ratio and lignocellulose content affect their utilization as digester feedstocks. The C/N ratio is important because raw materials should have enough nitrogen to derive their energy from carbon. Slow-to-digest lignin may reduce biogas yields and increase digestate solid production. Missouri has an abundance of biomass resources including grasses, wood and crop residues; however, these resources have not been widely used in the U.S. because of the costs involved in using them, their value for existing uses, difficulties in digesting them and the abundance of other feedstocks. However, combined with other feedstocks, some carefully chosen cellulosic materials may enhance a digester’s operation and yield.

Missouri Biogas Production Potential Missouri could produce more than an estimated 200,000 tonnes of biomethane per year—an amount equivalent to 9.51 trillion Btus or 9.85 billion ft3 of natural gas. See Exhibit 1. To put this volume into context, Missouri residential consumers in 2019 used 112.7 billion ft3 of natural gas. All consumption totaled 310 billion ft3. This biomethane production projection, calculated by the National Renewable Energy Laboratory, assumes that biomethane is derived from four types of feedstocks: 1) landfill gas, 2) methane from wastewater treatment, 3) methane from institutional and commercial organic waste and 4) methane from animal manure. Animal manure could supply 46% of total potential biomethane production, and food wastes could supply 11%. Exhibit 1. Biomethane Production Potential in Missouri
Animal Manure Food Waste WWTP MSW TOTAL Tonnes CH4 94,524 22,780 51,387 36,781 205,472 Share 46% 11% 25% 18% 100%
Source: NREL (2013) Given feedstock availability, Missouri’s biogas production potential varies by county. See Exhibit 2. When considering only agricultural feedstocks, central and southwestern Missouri stand out as do a few other isolated counties. Sullivan, Vernon and St. Louis counties had the highest biomethane potential of all Missouri counties, according to the biomethane potential from animal and industrial and commercial organic wastes. When municipal solid waste and wastewater treatment plant potential is added to the agricultural feedstocks, the picture remains similar, though urban areas become more important because urban and suburban areas have existing landfill and wastewater treatment plant infrastructure. St. Louis, Jackson and Sullivan counties ranked as the top three counties for biomethane production potential when considering all primary biogas feedstock sources. Exhibit 2. Biogas Potential from All Primary Sources
Source: NREL (2013) Energy Analysis: Biogas Potential in the United States
Product Markets Anaerobic digestion yields electricity, natural gas and digestate that digesters must use or market. Electricity A large share of biogas production has been used for combined heat and power, which yields electricity as the main product. By generating electricity, an AD can reduce or eliminate electricity expenses incurred. This is especially important if the AD is associated with another operation such as a dairy or other adjacent business. In this case, the operation can forgo paying retail electricity prices. Second, it can sell excess electricity back to the grid. Missouri has some of the lowest electricity rates in the U.S. In the first half of 2020, residential electricity prices fluctuated around 25% lower than the U.S. average. Commercial electricity rates were more than 20% below the national average, though industrial rates were closer to parity. For at least the past decade, electricity consumption has been largely flat given factors such as greater energy efficiency, heavy industry outsourcing and customers generating their own power on site. Looking forward, the Energy Information Administration predicts the electricity demand will continue to be stagnant through 2050. Given the relatively weak electricity demand and falling prices, selling “commodity” electricity is not particularly attractive in the next 10 years to 20 years. Natural Gas As biogas and natural gas are both composed of methane, the two inherently compete. In recent decades, natural gas production has risen considerably due to advances in horizontal drilling and hydraulic fracturing technology that launched the shale gas revolution roughly a decade ago. Production growth is anticipated in the future but at a slower rate. As natural gas production has increased, consumption has also grown. The bulk of this added consumption has originated from electricity generation as the industry moves from coal to natural gas. Relative to other states, Missouri ranks low both in total and per capita natural gas consumption. In Missouri, the largest natural gas use is heating residential and commercial buildings. Using natural gas to generate electricity in Missouri has grown, partly because of the declining price, but lagged other states. Using compressed natural gas for vehicle fuel has also begun to grow, though it’s a small market. Digestate Managing digestate and extracting value from it can be an integral part of a feasible AD. Relative to manure, digestate tends to have a high nutrient content, less odor, reduced pathogen counts, denatured weed seed, a lower likelihood to burn plants and relevant amounts of humus-effective carbon. Commonly, digestate is land-applied, which minimizes disposal costs and retains nutrient value. Digestate’s most basic value is its use as a fertilizer in agricultural, horticultural and other markets. Given that fertilizer can represent the largest expense in some row-crop production, digestate may have great market potential. However, digestate and the liquid fertilizer component must fit within an increasingly regulated fertilizer market that demands more precise applications. Digestate that can reduce costs

associated with transportation and application relative to the feedstock (e.g., manure), offer a “higher power” fertilizer value or provide more consistent nutrient concentration would have value. Some operations can have a problem disposing wastes (e.g., manure) at rates allowable by the U.S. EPA, so they incur high transportation costs to move manure waste to areas that can receive it. An anaerobic digester that could lower nutrient management or transportation costs would create value. Adding value to the digestate may improve the digestate’s market potential. For example, separating the digestate’s liquid and solid fractions would reduce water content and volume and increase transportability. To process digestate, operations often use screw press separators. The liquid fraction is more likely to contain ammonium (NH4) and potassium (K2O), and the solid fraction is more likely to contain phosphate (P2O5) and organic material. Digestate liquid is likely to compete with manure, and the concentrated nutrients may compete with higher value commercial fertilizers. Other processing technologies are available. They aid in recovering nutrients (N, P, K) and include composting, drying, ammonia stripping, evaporation and membrane filtration. Generally, these technologies entail high investment costs, energy requirements and maintenance costs, and they involve a large amount of chemical reagents. Such processing can yield products other than fertilizer. For example, the second most common digestate use after fertilizer has been livestock bedding. Bedding represents a significant cost for some livestock producers—namely, dairy farmers. Making bedding generally involves solids separation to reduce the moisture content to a storable, stackable level. Missouri may have a limited market for bedding. Poultry operations may use digestate as bedding but may face more complicated adoption compared with dairies. Alternatively, separated digestate solids can be composted to further break down the solids. Composted digestate has a reduced volume and lower moisture content, so it’s lighter and easier to handle. Plus, composting further reduces pathogen numbers and stabilizes carbon. Such attributes make compost an attractive soil amendment or an ingredient in blended nursery and garden soil mixtures. Mixing compost with digestate fiber could produce a higher value potting soil. The fiber could also potentially substitute as a peat moss-like product. Other uses for the fiber include engineered construction materials, such as medium-density fiberboard and wood-plastic composites, but they may not be widely feasible. Locating a Digester ADs have many potential configurations in terms of feedstocks utilized and products sold. They realize the value derived from nearby sourcing and capturing value from multiple revenue streams. A successful digester will locate in an area with an ample feedstock supply and ample demand for AD outputs. Determining an appropriate location is usually done on a case-by-case basis, where a business identifies a business opportunity. To evaluate suitability of areas across Missouri, Value Ag LLC conducted an inventory of markets in 2011/2012. The analysis found that “strong” and “very strong” markets occurred in many areas of Missouri. Policy Although electricity, methane and digestate are a digester’s primary outputs to sell, environmental and governmental incentives can affect an operation’s revenues. In fact, environmental policies have the

potential to dramatically shape the biogas industry. In recent years, large biogas production investments have responded to specific environmental incentives. Common policy incentives for AD operators include tax incentives, loans and grants, net metering, renewable fuel standards and rebates. Tax credits are dollar-for-dollar reductions in a company’s tax liability. Investment tax credits and production tax credits are common for renewable energy projects. With respect to grants, many U.S. ADs have received grant funding through programs such as the Rural Energy for America Program, the Conservation Innovation Grants program and the Environmental Quality Improvement Program. The grants tend to affect AD economic feasibility and defray initial capital costs. Through net metering, a utility customer pays for the net energy consumed from the utility grid. Generally, an AD will use electricity it generates on site. If it produces more electricity than it consumes, however, then it exports the excess to the utility’s electric grid, and the utility pays for the electricity on a per-kilowatt-hour basis. Compensation varies by location and depends on state and local policies. Renewable energy standards also shape AD viability. For example, the Missouri Renewable Fuel Standard requires investor-owned utilities in the state to acquire renewable energy resources or renewable energy credits equal to a percentage of the total retail sales that each utility makes to its customers in the state. After 2020, that percentage grows to 15% and includes solar and non-solar sources. This demand creates a market for renewably generated electricity in Missouri. The majority of certified renewable electricity generators in the program have been solar; however, the majority of electricity generated has come from wind. As another Missouri policy, the Missouri Alternative Fuel Tax establishes tax rates for compressed natural gas (CNG) and liquefied natural gas (LNG); the rates for the renewable fuels are lower than those for more conventional fuels. At the federal level, the Renewable Fuel Standard (RFS) requires transportation fuel sold in the U.S. to contain a minimum volume of renewable fuels. Biogas can be used to produce fuels that qualify, which requires converting the biogas to CNG or LNG. Similar to the RFS, low-carbon fuel standards have been enacted in California and Oregon and are being discussed in other states. In these programs, a credit’s value depends on the amount of carbon the fuel keeps out of the atmosphere. Such standards are helping to drive renewable natural gas production. Aa number of operations in Missouri participate by generating biomethane for vehicle fuel. Economics Considering biogas and biomethane production system costs represents a first step to assess economic feasibility. In particular, comparing biogas production costs to prevailing energy prices gauges how biogas performs economically. This approach suggests biogas production’s competitiveness before accounting for tax credits, co-product revenues or other incentives. Capital Costs Capital costs for specific technologies suggest that scale economies largely affect biogas operation feasibility. Smaller operations work in some situations, but larger facilities are likely to perform better, especially where the primary output is biomethane or electricity for sale. To gauge common capital costs, Exhibit 3 summarizes anaerobic digester and generator capital costs for livestock operations of

various sizes. For dairies, capital costs are high until the operation has more than 1,500 cows. Because one dairy cow is roughly equivalent to 3.6 head of swine, even when the scales are set to parity, swine operations tend to have somewhat higher costs due in part to the more dilute nature of most manure systems. For reference, dairies and swine operations with a digester or a planned digester average 2,500 cows or more than 36,500 swine, respectively (U.S. EPA AgSTAR). Exhibit 3. Capital Cost (Digester and Genset) Per MMBtu Produced Annually by Number of Livestock
Source: Biggar et al. (2013) Total Production Costs Adding operating costs to the capital costs gauges biogas production unit costs. A review of studies suggests a wide range of costs, which depend largely on scale but also other factors including the type of digester and feedstocks used. Exhibit 4 summarizes these production costs. For operations with an anaerobic digester and a CHP generator, biogas production costs range from $6.74 per MMBtu on larger more efficient operations to as much as $17.41 on smaller operations. For comparison, landfill biogas has a much lower cost, which supports its relatively high levels of adoption compared with other biogas systems. When these systems produce electricity, their production costs are between $0.06 and $0.12 Kwh. Biomethane production, which involves upgrading and purifying the biogas, adds capital and operating costs. Biomethane produced from manure-based systems might cost between $10.40 per MMBtu for very large systems and at least $25 per MMBtu for smaller systems. Exhibit 4. Biogas Production Costs Per Unit
System Low (Large Scale) High (Smaller Scale) Biogas ($/MMBtu) Manure 6.74 17.41 Biogas ($/MMBtu) Landfill 2.01 10.33 Biogas Electricity ($/kWh) Manure 0.06 0.12 Biomethane ($/MMBtu) Manure 10.4 25.1
Sources: Various, See Exhibits 4.4-4.7
-
100.0
200.0
300.0
400.0
500.0
600.0
700.0
0 1000 2000 3000 4000 5000 6000
Capi
tal $
/mm
Btu
Dairy Covered Lagoon Swine Covered LagoonDairy Complete Mix Swine Complete MixBeef feedlot Complete Mix Dairy Plug FlowSwine Plug Flow Power (Swine Covered Lagoon)Power (Dairy Complete Mix) Power (Dairy Plug Flow)

To put those production costs in the context of prevailing prices, Exhibit 5 uses current fuel prices and converts them into $/MMBtu, so they can be easily compared. Industrial retail prices have been roughly $6.50 per 1,000ft3 or $6.27 per MMBtu. When compared with expected biogas production costs in Exhibit 4, production is likely feasible only for larger operations. This exercise is useful for operations considering an AD to produce biogas and reduce (or “avoid”) fuel expenditures. Here, biogas is likely to be advantageous to liquid fuels and possibly natural gas when they can be used interchangeably. If they can avoid purchasing fuels at retail prices, then biogas producers escape paying taxes and delivery costs associated with those fuels. Note, however, facilities may also sell fuels off-site. The (average 2008-2009) natural gas city gate price better reflects the wholesale price at $4.28 per MMBtu, which is likely less than most biogas production costs for most operations. Further, biogas is not a comparative fuel for most users and would need to be upgraded and compressed, which add production costs. Making biogas comparable to other liquid fuels would require further upgrading, compression, transportation and taxes. Ultimately, biomethane would most closely compete against CNG or LNG. CNG and LNG retail prices (July 2020) are $19.21 and $21.08 per MMBtu, respectively, and the “wholesale” price available to the biogas facility would be well less than that. Large operations may be able to supply biomethane below retail prices, but wholesale prices are less clear. Exhibit 5. Energy Values at Prevailing Prices
Fuel Units Missouri
Retail Price $/MMBtu Biogas Production Cost (hypothetical) 1000ft3 4.50 7.50
Natural gas (industrial) 1000ft3 6.50 6.27 Natural gas (city gate) 1000ft3 4.50 4.28 CNG* GGE 2.19 19.21 LNG* DGE 2.73 21.08 Gasoline gal 1.85 15.37 Diesel gal 2.01 14.63 LP gas gal 1.66 18.04
*National Retail Price Source: EIA; U.S. Dept of Energy, Alternative Fuels Data Center Other Keys to Financial Feasibility The above exercise omits all other factors that influence feasibility. Those factors include co-product revenues, incentives, grants and inefficiency. To evaluate the role of such other factors, the project team conducted a literature review of biogas project feasibility studies. The review offered a collection of insights, including the following:
• System choice matters. There are many possible configurations of feedstocks, equipment and products. System choice can determine the viability of the operation. For example, boilers may be less feasible than CHP, though studies may not consider systems that can effectively use all heat as cost avoidance for the digester or associated business.
• On-site product use enhances viability. Cost avoidance generally allows for higher “revenues” and greater feasibility than selling heat or power on the open market as electricity prices

received need to be higher than most “net metering” rates for feasibility. The avoided cost of bedding, electricity and heat has a large impact on improving dairy project feasibility compared with projects implemented by other animal operations.
• Scale is important. Larger operations likely perform better. Based on the literature, a minimum number of dairy cattle may be 500 head to 1,500 head. For swine, the minimum may be in excess of 5,000 animals. The feasible scale differs across projects due to investment and operating costs as well as the ability to maximize potential revenues.
• Multiple revenue streams improve feasibility. Biogas production where a boiler or CHP generator is the only source of revenue is not likely to be feasible in most cases. Leveraging multiple revenue streams—other than solely heat and power—is important. Examples include tipping fees and digestate sales (e.g., bedding, compost, fertilizer).
• Incentives can offer support. Grants and loan funding can be key, especially when it offsets expensive capital investments, such as digesters and upgrading equipment. Premiums for electricity and biomethane are often necessary for feasibility, especially when sold off-site.
• Look to emerging opportunities. Biomethane production generally offers greater feasibility compared with CHP or boilers due to environmental incentives offered for using the substance as vehicle fuel. However, it also has the highest capital and production costs. As such, biomethane facilities have higher scale economies than most other configurations.
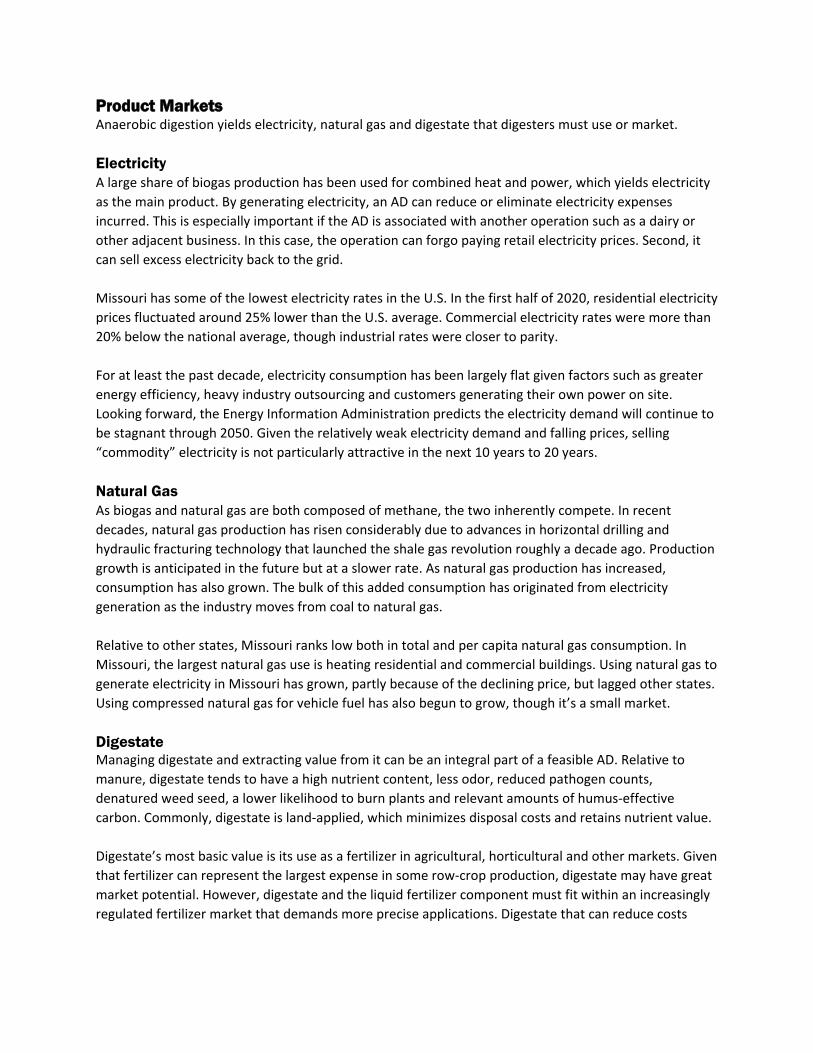
Simulation Model To operationalize information collected from multiple studies, a simulation model tested feasibility of various operation configurations. The model used was the “Anaerobic Digester System Enterprise Budget Calculator” developed by Gregory Astill and Richard Shumway from Washington State and USDA ERS. It considers a representative AD operation. The most typical agricultural biogas facility in the U.S. primarily uses dairy manure in a mixed tank digester to produce biogas to operate a CHP generator. It is an appropriate case as most feedstocks are, or can be made, suitable for digestion via a mixed tank AD (including co-digestion). Further, the mixed tank system allows for assessing various operational configurations to investigate the impact on profitability. For the base case, a 1,600-cow dairy is considered. This would be a large dairy, especially for Missouri, and would roughly equate to a 5,700-head swine operation or 286,000 broiler chickens in terms of USDA animal unit equivalents. However, this is well smaller than the average agricultural AD according to the EPA’s AgSTAR database. The base case where only electricity is sold is never profitable, even at large scales. In order improve the economics, facilities must earn higher prices or leverage additional revenue sources. Exhibit 6 shares a selection of options. It first shows how each option changes net present value (NPV) relative to the base case. Stacking the options determines feasibility of a likely operation that effectively leverages multiple opportunities. The options considered three potential electricity prices: $0.05, $0.07 and $0.11 kWh. A 50% grant decreases capital costs and more than halves the negative NPV of the base case. A production tax credit indicative of the prevailing federal rate of 1.3 cents/kWh had a small impact by raising the NPV by a few hundred thousand dollars. Producing and utilizing bedding, which is valued at $86 ton, had a significant positive effect on NPV. Depending on the value of electricity, co-digestion had the largest impact by generating tipping fees and, to a lesser extent, increasing electricity production. Individually, each of these options positively affected NPV but did not make the facility feasible, except at the highest electricity price. However, these options are not exclusive of each other. When stacked, they can
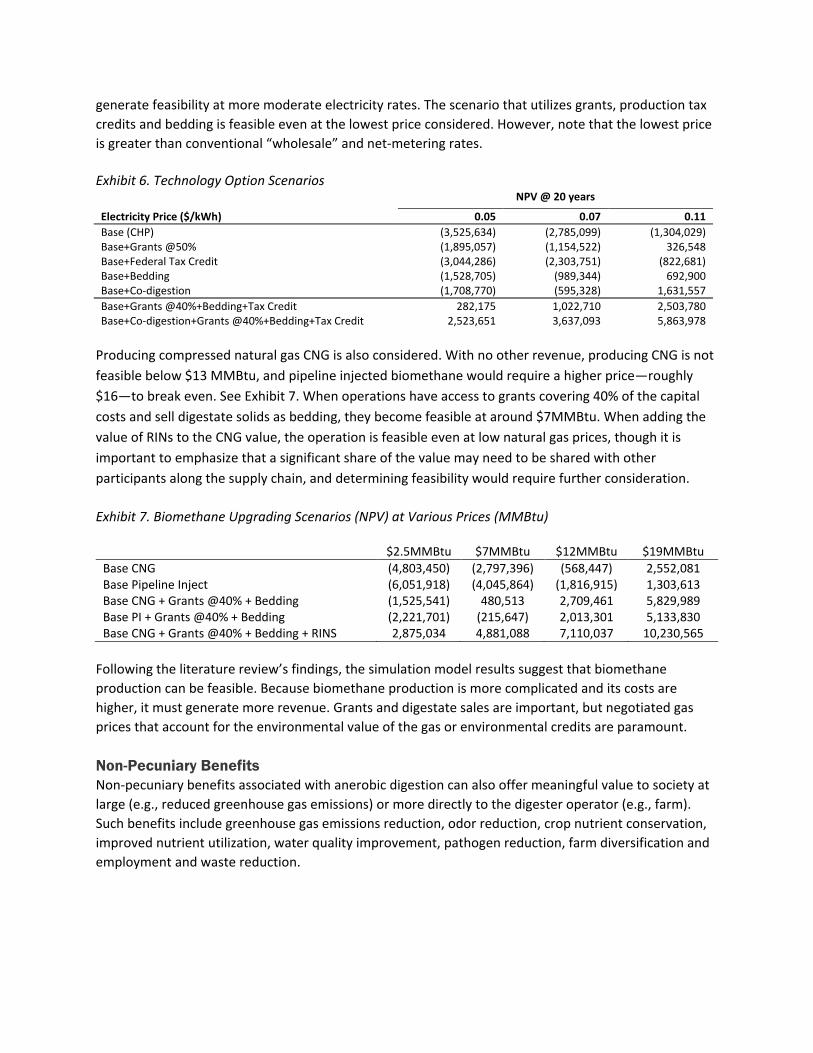
generate feasibility at more moderate electricity rates. The scenario that utilizes grants, production tax credits and bedding is feasible even at the lowest price considered. However, note that the lowest price is greater than conventional “wholesale” and net-metering rates. Exhibit 6. Technology Option Scenarios
NPV @ 20 years
Electricity Price ($/kWh) 0.05 0.07 0.11 Base (CHP) (3,525,634) (2,785,099) (1,304,029) Base+Grants @50% (1,895,057) (1,154,522) 326,548 Base+Federal Tax Credit (3,044,286) (2,303,751) (822,681) Base+Bedding (1,528,705) (989,344) 692,900 Base+Co-digestion (1,708,770) (595,328) 1,631,557 Base+Grants @40%+Bedding+Tax Credit 282,175 1,022,710 2,503,780 Base+Co-digestion+Grants @40%+Bedding+Tax Credit 2,523,651 3,637,093 5,863,978
Producing compressed natural gas CNG is also considered. With no other revenue, producing CNG is not feasible below $13 MMBtu, and pipeline injected biomethane would require a higher price—roughly $16—to break even. See Exhibit 7. When operations have access to grants covering 40% of the capital costs and sell digestate solids as bedding, they become feasible at around $7MMBtu. When adding the value of RINs to the CNG value, the operation is feasible even at low natural gas prices, though it is important to emphasize that a significant share of the value may need to be shared with other participants along the supply chain, and determining feasibility would require further consideration. Exhibit 7. Biomethane Upgrading Scenarios (NPV) at Various Prices (MMBtu)
$2.5MMBtu $7MMBtu $12MMBtu $19MMBtu Base CNG (4,803,450) (2,797,396) (568,447) 2,552,081 Base Pipeline Inject (6,051,918) (4,045,864) (1,816,915) 1,303,613 Base CNG + Grants @40% + Bedding (1,525,541) 480,513 2,709,461 5,829,989 Base PI + Grants @40% + Bedding (2,221,701) (215,647) 2,013,301 5,133,830 Base CNG + Grants @40% + Bedding + RINS 2,875,034 4,881,088 7,110,037 10,230,565
Following the literature review’s findings, the simulation model results suggest that biomethane production can be feasible. Because biomethane production is more complicated and its costs are higher, it must generate more revenue. Grants and digestate sales are important, but negotiated gas prices that account for the environmental value of the gas or environmental credits are paramount. Non-Pecuniary Benefits Non-pecuniary benefits associated with anerobic digestion can also offer meaningful value to society at large (e.g., reduced greenhouse gas emissions) or more directly to the digester operator (e.g., farm). Such benefits include greenhouse gas emissions reduction, odor reduction, crop nutrient conservation, improved nutrient utilization, water quality improvement, pathogen reduction, farm diversification and employment and waste reduction.
Anaerobic Digestion in Practice Missouri has shown growing interest in biogas production in recent years. According to the American Biogas Council, the state had 37 operational biogas systems in August 2015. The Council’s biogas profile online during June 2020 indicated the number had increased to 46. Despite the growth, the council had estimated Missouri could support many other systems, given its organic material supply. In 2020, the Council described the potential for 386 systems. Although the majority of Missouri’s biogas operations are either landfills or waste water treatment plants, several agricultural AD projects have emerged. For example, in 2012, Hampton Feedlot became the first commercial digester to operate in Missouri and process waste from beef cattle. More recently, Roeslein Alternative Energy and Green Energy Sustainable Solutions Inc. have announced more than a dozen large-scale biogas production facilities that convert animal manure and other substrates into biogas. After cleaning the gas, the facilities will inject the gas into the natural gas pipeline and/or convert it into vehicle fuel. Much of this recent investment collects manure or biogas from multiple farms and consolidates it into a central upgrading facility. Such business models may allow farmer participation in biogas production but minimize the expense and managerial requirements involved in owning a biomethane operation. Digesting food waste represents another opportunity for biogas operations. According to research from the Environmental Protection Agency, U.S. food waste digesters process a variety of feedstocks. Among stand-alone digesters, the most common feedstocks have been beverage processing, food processing and fruit and vegetable wastes. Food processing industry waste; fats, oils and grease; and beverage processing waste were the top three feedstocks for both on-farm digesters and water resource recovery facilities. In Missouri, Anheuser Busch’s St. Louis facility produces methane, which the brewery then combusts, from waste generated during processing. It also sells the solids separated from wastewater.

1. INTRODUCTION TO ANAEROBIC DIGESTER TECHNOLOGY Anaerobic fermentation of biodegradable material produces biogas. Anaerobic bacteria occur naturally in marshes, wetlands and the digestive tracts of ruminants and certain insect species. When collected or captured, biogas can serve as a renewable energy source similar to natural gas. Anaerobic digester systems have been used for decades at municipal wastewater facilities. More recently, they have processed industrial and agricultural wastes (Burke 2001). These systems are designed to optimize growth of methane-forming (methanogenic) bacteria in order to generate and capture methane, or CH4. Adoption of Biogas Biogas production facilities that treat wet-waste biomass and recover gas from landfills operate in a number of countries. In developing countries, biogas is mainly produced in small, domestic-scale digesters, and it provides fuel for cooking or lighting. Developed countries use biogas in larger facilities for electricity and heat. Exhibit 1.1 illustrates the evolution of global installed biogas electricity plant capacity in different regions. In 2000, global biogas electricity production capacity was less than 2.5 gigawatts (GW). By 2018, it exceeded 17.7 GW (IRENE 2019). Exhibit 1.1. Global Biogas Production Capacity (MW)*
* Maximum net generating capacity of biogas Source: IRENA (2019) Biogas production has had most significant growth in Europe, mainly driven by favorable support schemes in several European Union (EU) member states. Europe had more than 17,400 biogas plants in 2015 (Scarlat 2018). These facilities ranged from small anaerobic digesters on farms to large co-digestion plants. Most EU-produced biogas is used as a fuel for electricity generation in electricity-only or combined heat and power plants. Biogas production varies by country in terms of the quantity produced and biogas source (i.e., landfill gas, sewage sludge, anaerobic digestion or thermochemical processes). Within the U.S., the biogas industry is composed primarily of landfills that collect and utilize landfill gas (LFG) and wastewater treatment plants that use anaerobic digesters. Digestion of dairy and swine manure has also gained acceptance to produce energy and manage manure-related environmental and societal impacts (Minz and Voss 2019). According to the American Biogas Council (2019), the U.S. has
0
5,000
10,000
15,000
20,000
2009 2010 2011 2012 2013 2014 2015 2016 2017 2018
Meg
awat
ts (M
W)
Europe N America Asia Eurasia S America Other

1,269 water resource recovery facilities using anaerobic digesters and 68 stand-alone systems that digest food waste. Further, the EPA reports 255 anaerobic digesters on farms (EPA AgSTAR 2020) and 564 landfill gas projects (EPA LMOP 2020). Biogas produced in the U.S. is used primarily in engine-generators or boilers to generate electricity and heat, though recent efforts have moved toward upgrading biogas into biomethane (Minz and Voss 2019).
Anaerobic Digestion Process As a biochemical process, anaerobic digestion involves anaerobic microorganisms decomposing organic matter without oxygen (Al Seadi 2008). During this process, bacteria degrade complex organic polymers to yield energy for bacterial maintenance and growth. The degradation occurs in stages, which each yielding intermediate products used by bacteria in the next stage. During the final stage — methanogenesis — most of the intermediate products are reduced to methane (CH4) and carbon dioxide (CO2). The rate at which this process produces biogas depends on parameters that include pH, temperature, nature of the substrate, nutrients, digester construction and size (Al Seadi 2008). See the supplement section to this report for detail on the anaerobic digestion process. Feedstocks A wide range of biomass feedstocks or substrates may produce biogas. Feedstocks vary by composition, homogeneity, fluid dynamics, dry matter content, methane yield and biodegradability. Most existing installations process residual sludge from wastewater treatment plants or livestock manure. Other common feedstocks or substrates are agricultural waste, garden waste, food refuse, slaughterhouse waste, sewage sludge and other commercial and industrial organic waste (Al Seadi 2008). The range of potential waste feedstocks is much broader, however, and may include most organic matter. Examples include food processing waste, energy crops and crop residues. Food processing waste may come from fruit processing, dairy processing, vegetable canning, potato processing, breweries or sugar production. Energy crops suitable for biogas production include sugarcane, sorghum, grasses and even woody crops. Exhibit 1.2 highlights potential biogas yields associated with a selection of feedstocks. Exhibit 1.2. Biogas Digestion Feedstock Yields and Productivity
Feedstock Biogas Yield (m3/t) Feedstock Biogas Yield (m3/t) Cattle slurry 15-25 (10% DM) Potatoes 276-400 Pig slurry 15-25 (8% DM) Rye grain 283-492 Poultry 30-100 (20% DM) Clover grass 290-390 Grass silage 160-200 (28% DM) Sorghum 295-372 Whole wheat crop 185 (33% DM) Grass 298-467 Maize silage 200-220 (33% DM) Red clover 300-350 Maize grain 560 (80% DM) Oilseed rape 340-340 Crude glycerine 580-1000 (80% DM) Canary grass 340-430 Wheat grain 610 (85% DM) Alfalfa 340-500 Rape meal 620 (90% DM) Clover 345-350 Fats up to 1200 Barley 353-658 Miscanthus 179-218 Hemp 355-409 Flax 212 Wheat grain 384-426 Sudan grass 213-303 Peas 390 Straw 242-324 Ryegrass 390-410 Oats grain 250-295 Leaves 417-453 Chaff 270-316
Source: Cropgen database cropgen.soton.ac.uk/deliverables.htm

Municipal Solid Waste Municipal solid waste (MSW) landfills are the third-largest source of human-related methane emissions in the U.S. and accounted for approximately 15.1% of total emissions in 2018 (EPA 2019). These emissions represent an environmental liability and a potentially valuable energy resource. According to the EPA, about 515 landfills channel biogas to one or more of the 564 operational energy projects. EPA estimates that roughly 480 other “candidate” landfills could cost-effectively direct methane to energy uses (EPA 2019). Of the 564 operating digesters, 71% use the gas to produce electricity, and 12% upgrade it to renewable natural gas. Currently, landfills are the largest producer of biogas in the U.S. When MSW is first deposited in a landfill, it undergoes aerobic decomposition until the available oxygen in depleted. Then, typically within one year, anaerobic conditions are established, and methane-producing bacteria begin to decompose the waste and generate methane, which systems can capture. In most cases, these systems seal the existing landfill and allow the methane to be extracted with a system of pipes. The nature of the system usually makes landfill gas production a “stand alone” system not suitable for co-digestion. As such, this report does not focus on these systems. Wastewater Wastewater treatment plants (WWTPs) produce sewage sludge as part of the water cleaning process. Gravitational sedimentation in the primary settler generates raw, primary sludge, which contains particles rich in nutrients and organic matter. Under optimal conditions, methane yields when digesting primary sludge range from 315 normal cubic meters (Nm3/t) to 400 Nm3/t organic dry matter (Bachmann et al. 2015). Treating wastewater also produces excess sludge, which has a smaller degradable fraction than primary sludge and a lower biogas yield (Bachmann et al. 2015). Together, these sludge sources — along with any co-digestion of substrates — are treated and routed to the AD. The temperature of the wastewater and organic content will affect anaerobic process design and feasibility. Low- and medium-strength wastewaters that are cool require significant amounts of heat to bring them to mesophilic temperatures. Of the 1,269 WWTPs with digesters, roughly 860 use the biogas they produce in their operations to generate electricity or usable heat. Historically, many have used AD as part of the treatment process and not emphasized the generation of biogas for external sale. This report doesn’t explicitly consider the details of wastewater AD. However, co-digesting wastewater sludge with other feedstocks may be attractive in some circumstances. Food and Food Processing Waste The EPA estimated that 219 pounds of food waste was sent for disposal per person in 2010. Similarly, the USDA estimated that the U.S. residential and commercial food sectors in 2010 produced roughly 133 billion pounds (66.5 million tons) of food waste. This equates to 31% of the total food supply in those sectors (Buzby et al. 2014). Much of this waste ultimately ends up in landfills; food waste makes up 22% of U.S. landfills (U.S. EPA 2019). Food waste offers a significant feedstock opportunity for AD. Food processing wastes are generally clean of nonorganic material and relatively consistent in terms of quality and supply. Food processing industries typically dispose of waste by treating it aerobically on-site, discharging it into sewer systems,

sending solids to landfills or directing it to regulated land application. All are relatively expensive, and users of these waste streams must meet local, state and federal standards. Accordingly, AD may be an attractive strategy for avoiding these costs. In fact, food processors may pay tipping fees to the AD for taking their waste. Food wastes have a number of other benefits. Most notably, they often offer a very high biogas yield and lower digestate solids. The EPA has conducted a series of surveys on anaerobic digestion of various food wastes (EPA 2019). In 2018, it found the top five feedstocks accepted by U.S. anaerobic digesters were the following:
• Fats, oils and greases; • Food processing industry waste; • Beverage processing industry waste; • Fruit and vegetable waste; and • Food service waste, pre- and post-consumer.
These feedstocks tended to originate from the following top sources:
• Food and beverage processors; • Restaurants and food service businesses; • Grocery stores and supermarkets • Industrial sources; and • Municipal and residential sources.
Crops Crops can be grown specifically for digestion as a stand-alone feedstock, or they can stabilize or supplement other feedstocks such as low-yielding slurries or variable-quality food waste. Such crops include corn, grasses, energy beet and whole-crop cereals. Energy crops can offer high yields, but they have a number of potential concerns. Their seasonal production may not align well with an AD’s need for a consistent, year-round feedstock supply. Seeds from crops (e.g., corn, sorghum) could be stored throughout the year and delivered at regular intervals. Such crops often have a relatively high opportunity cost outside of the digester that may make them economically infeasible for producing biogas. Poor quality or rejected crops may be the most feasible. Crop Residues Crop residues refer to “production residues” generated when raising agricultural crops. They may include damaged or misshapen fruit or vegetables; trimmings; and other plant parts that are not the intended end product, such as straw, stover, leaves or tops. These can be collected from the field or a packing unit prior to leaving the farmgate. In some cases, these feedstocks can be stored (e.g., baled corn stover, straw). In other cases, they cannot (e.g., vegetable discards). Green Waste, Brown Waste and Compost Common green wastes include garden refuse, such as grass clippings or leaves, and some kitchen wastes that tend to contain high nitrogen concentrations. Brown waste tends to include carbon-rich dried leaves, straw or hay. Both of these waste streams can be digested and may be especially attractive for co-digestion to help optimize a digester’s performance and yield.

To digest residential yard waste, the waste would likely require some degree of precleaning or pretreatment to manage wood and other debris or contaminants. Yard waste can also have pesticide, chemical and fertilizer contamination, which could negatively affect the digester or digestate. Manure Aside from MSW, manure is the most frequently used AD feedstock in Missouri. Although it is not a particularly high-yielding feedstock, manure is produced in large and predictably constant quantities. Perhaps most importantly, it can often be sourced freely. Biogas yielded by manure digestion is determined, in part, by the operation’s manure management system. Key considerations for biogas production include the manure’s freshness and concentration of digestible materials. The shorter the time the manure is waiting to enter the digester, the higher its yield. In theory, flushed manure collection systems produce less gas than regularly scraped manure systems because the digestible materials are dispersed and diluted. However, because scraped manure is collected less frequently or stored for longer periods, the manure may decompose and become less valuable for anaerobic digestion. Scraping dirt lots incorporates dirt and stones into the scraped manure, and these materials may damage equipment, accumulate in a digester and prompt frequent cleanout. Drylot storage produces comparatively little biogas because aerobic conditions inhibit development of methanogenic bacteria that create biogas. Water is a principal component of manure and sludge, and it facilitates the ability to transport the suspended solids as a fluid. However, not only does the water dilute a slurry’s potential bioenergy content, but it also may impact anaerobic digester design and operation. That is, it may increase the digester volume and the amount of heat needed to maintain mesophilic or thermophilic temperatures. Accordingly, the most important parameters for characterizing manure slurries are total solids content (TS) and volatile solids (VS) content. Above an upper limit for TS content, the material is no longer a slurry, and mixing and pumping become problematic. This upper limit depends on the rheological properties of the suspended solids making up the slurry. For most manure and sludge, this occurs at 10% TS to 15% TS. Waste with a higher TS content may be a candidate for high-solids treatment, or it will require dilution if it is to be treated as a slurry. The material’s VS content is as important as TS content because VS represent the fraction of the solid that may be transformed into biogas. Although the VS content indicates potential methane production, the specific methane yield on a VS basis is not constant. This is due to the waste’s VS, which includes readily degradable organic compounds (e.g., lipids, proteins, carbohydrates). Other components can also affect the anaerobic treatment. For example, some manures (e.g., poultry, swine) generate higher amounts of nitrogen and sulfur, which can inhibit yield and add biogas cleanup requirements. Adoption of AD varies by animal species. Dairies have been the main adopters because they produce and manage manure in a way that allows it to be effectively digested. They also tend to have use for both the digestate and biogas — digestate for bedding and biogas for on-site heat and electricity.

Swine operations are often less well-positioned to adopt anaerobic digestion. These facilities generally flush manure, which creates a system where (covered) lagoons are necessary. In temperate climates, lagoons can have relatively low biogas yields. Further, swine operations don’t usually benefit from digestate bedding, heat or electricity to the same extent as dairies. Instead, the main driver for swine operations to add AD has been environmental considerations to address odor and nutrient pollution. An AD’s environmental benefits have become more apparent in recent years where there have been financial incentives to limit carbon emissions associated with the methane naturally produced in swine manure management systems. Policies and programs to utilize biogas (or electricity from biogas) represent a large impetus for elevated AD interest in the swine and dairy industries. Poultry operations have more slowly adopted AD. Like swine operations, poultry farms are not as well-positioned to leverage biogas. Heat and electricity aren’t major costs for most poultry concentrated animal feeding operations (CAFOs). Moreover, manure management is often not a large problem. Because poultry litter is relatively dry, it is relatively easy to transport and often sold to create a revenue stream. Thus, operating an AD could dramatically change nutrient use and application. Poultry CAFOs also have less incentive to generate biogas. Already, some poultry litter is burned to create renewable electricity, which is a less expensive technology. Co-Digestion Co-digestion refers to supplementing the primary feedstock (e.g., manure) with other substrates such as institutional wastes, residential yard wastes, food industry wastes, slaughterhouse waste or sewage. Certain co-substrates can produce a disproportionate increase in biogas production relative to the feed percentage. The high energy content and low acquisition cost of some substrates can justify sourcing smaller quantities and collecting feedstocks (e.g. fats, oils and grease) from longer distances. Co-digestion of feedstocks may also optimize digester conditions. Most importantly, from a revenue perspective, some feedstocks may generate tipping fees. Tipping Fees Co-digestion’s main advantage is the potential to generate tipping fees. Some industries generate bioproduct that requires some degree of treatment or disposal costs paid as landfill tipping fees or wastewater remediation fees. Much of the waste incurring such fees can be used as biogas feedstock. Using waste that has negative value as a commodity can be economically attractive as it becomes a direct revenue stream for the digester. MSW landfill tipping fees in the U.S. continue to rise. Fees increased from 2018 to 2019 by 5.2%, according to the Environmental Research & Education Foundation (EREF) (EREF 2019). Nationally, the EREF 2019 Landfill Tip Fee Data report found the MSW tip fee to average $55.36 per ton. Compared with the national average, the Midwest region, which includes Missouri, had slightly more moderate tipping fees; they averaged $48.87 per ton in 2019. MSW tipping fees are likely to be higher than those a digester would receive because digestors would require a relatively consistent supply of organic feedstocks and cannot handle household trash. Dumping fees for yard waste, another possible feedstock material, are much lower than landfill tipping fees. Many locations, including MSW sites, accept clean yard waste at a reduced price. Yard waste dumping fees are typically less than $7.50 per cubic yard in suburban Missouri landfills. Assuming yard

waste weighs 600 pounds per cubic yard, tipping fees would be roughly $25 per ton. Yard wastes, especially highly cellulosic feedstocks, may not be attractive from a biogas yield standpoint. Accepting yard waste would likely require considerable sorting, processing and management. Food wastes could offer a higher tipping fee and a higher biogas yield; however, accepting food waste would likely require considerable sorting and screening. The tipping fee at a bioenergy facility must be lower than the landfill fee to incentivize food waste generators to separate organic and inorganic wastes and motivate haulers to collect and deliver to the facility. Depending on the situation, screening could either be conducted by a third party or the AD operation. Other Co-digestion Benefits Co-digestion also enables digesters to address seasonal feedstock supply fluctuations, increase biogas productivity and decrease dependence on a single feedstock source. Other benefits include the following (Shah et al. 2015, Astals et al. 2014, Kacprzak et al. 2010, Mata-Alvarez et al. 2014):
• Stabilize the process, • Dilute inhibitory substances, • Balance nutrient levels (e.g. carbon/nitrogen ratio) or pH; • Reach required moisture contents in the digester feed, • Reduce greenhouse gas emissions, • Yield synergetic effects of microorganisms, • Increase the load of biodegradable organic matter, and • Realize economic advantages through sharing equipment and cost.
Digester Types General categories of AD technology include traditional and high rate.
• Traditional digesters include anaerobic lagoons, plug flow and complete mix reactors. These can be either mesophilic, which operate at ambient or moderate temperatures, or thermophilic heated to 122°F and above.
• High-rate digesters are thermophilic and designed to digest feedstocks at a higher loading rate. Such reactors can be especially useful in situations such as WWTP that have a large volume of diluted slurry. Due to clogging issues and the limitations for processing only soluble fractions, most high-rate designs are not commonly used for manure. However, anaerobic sludge blanket (UASB) systems, such as the induced blanket reactor (IBR), are designed to handle feedstocks with slightly higher solids content.
Choosing the Optimal AD Bioreactor Choosing a digester technology depends on a number of unique operating conditions. Exhibit 1.3 summarizes the conditions and the tradeoffs associated with certain reactor types. The supplement to this report provides a more detailed description of the digester technologies.

Exhibit 1.3. Digester Selection Criteria
Covered Lagoon Plug Flow
Complete Mix / Continuously Stirred Tank
Induced Blanket Reactor
Max allowable solids size Fine Coarse Coarse Coarse Technology level Low Low Medium Medium
Operating temp Psychrophilic Mesophilic Mesophilic or thermophilic Mesophilic
Co-digestion compatible Limited Limited Yes Limited Solids separation prior to digestion Recommended Not necessary Not Necessary Not Necessary Foot print Large Small (if underground) Medium Small OLR Low Medium Medium High HRT > 48 days 20 - 40 days 20 - 30 days 10 days VS reduction 35 – 45% 35 – 45% 35 - 45% 50-55% Biogas yields Low High High High Costs Low Medium Medium Medium Suitable Total solids < 3% 7 – 13% 3 –12% 2 – 10%
Source: Oregon, E.C. (2009) A feedstock’s TS content affects AD choice. Dilute feedstocks necessitate larger digesters, which negatively impact feasibility. Where TS is very low, a covered lagoon is often most suitable due to its relatively low cost to hold large feedstock volumes. Although they offer lower costs, they require preprocessing of any co-digested feedstocks. Plus, they have low yields, long retention times and geographic limitations. Using high-rate digesters lowers retention times when handling dilute feedstock. When TS approaches 2%, high-rate digesters (i.e., UASB or IBR) can be used. These systems have higher yields and short retention times. However, they must be heated and have higher capital and O&M costs. Continuously stirred tank reactor (CTSR) systems can be used above 3% TS. They offer highly flexible designs and feedstock use. They can operate mesophilically or thermophilically, accommodate co-digestion and offer relatively high biogas yields at moderate costs. As the solids content increases to around 7%, plug flow reactors can become an option. At TS levels higher than 13% to 15%, the feedstock becomes too thick and needs to be diluted, or a dry digester is needed. In contrast, to manipulate TS content in dilute systems, solids can be added — possibly by co-digesting feedstocks with a high solids content, such as food waste, poultry litter, animal bedding or biomass. Exhibit 1.4 illustrates digester management considerations and how they vary according to the feedstock’s total solids content. Exhibit 1.4. Total Solids Effect on Digester and Feedstock Management
Source: NRCS (2017)
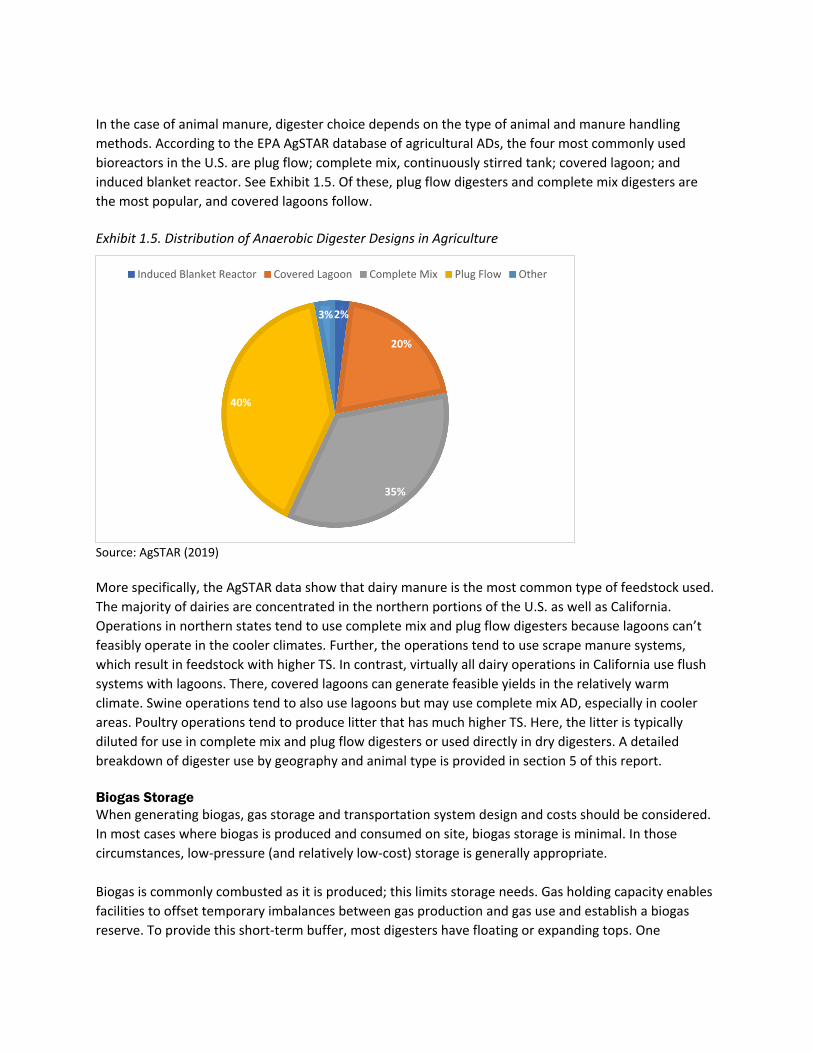
In the case of animal manure, digester choice depends on the type of animal and manure handling methods. According to the EPA AgSTAR database of agricultural ADs, the four most commonly used bioreactors in the U.S. are plug flow; complete mix, continuously stirred tank; covered lagoon; and induced blanket reactor. See Exhibit 1.5. Of these, plug flow digesters and complete mix digesters are the most popular, and covered lagoons follow. Exhibit 1.5. Distribution of Anaerobic Digester Designs in Agriculture
Source: AgSTAR (2019) More specifically, the AgSTAR data show that dairy manure is the most common type of feedstock used. The majority of dairies are concentrated in the northern portions of the U.S. as well as California. Operations in northern states tend to use complete mix and plug flow digesters because lagoons can’t feasibly operate in the cooler climates. Further, the operations tend to use scrape manure systems, which result in feedstock with higher TS. In contrast, virtually all dairy operations in California use flush systems with lagoons. There, covered lagoons can generate feasible yields in the relatively warm climate. Swine operations tend to also use lagoons but may use complete mix AD, especially in cooler areas. Poultry operations tend to produce litter that has much higher TS. Here, the litter is typically diluted for use in complete mix and plug flow digesters or used directly in dry digesters. A detailed breakdown of digester use by geography and animal type is provided in section 5 of this report. Biogas Storage When generating biogas, gas storage and transportation system design and costs should be considered. In most cases where biogas is produced and consumed on site, biogas storage is minimal. In those circumstances, low-pressure (and relatively low-cost) storage is generally appropriate. Biogas is commonly combusted as it is produced; this limits storage needs. Gas holding capacity enables facilities to offset temporary imbalances between gas production and gas use and establish a biogas reserve. To provide this short-term buffer, most digesters have floating or expanding tops. One
2%
20%
35%
40%
3%
Induced Blanket Reactor Covered Lagoon Complete Mix Plug Flow Other

advantage of a digester with an integral gas storage component is the reduced capital cost. When a digester design doesn’t offer adequate biogas storage, a dedicated biogas storage container may be needed. Walls of a typical gas holder are flexible to allow the containment volume to match the volume of biogas inside and cause little change in internal pressure. Given they have flexible walls, gas holders operate within a range of volumes rather than at a fixed volume. Facilities should have enough gas storage available to address a situation when biogas production drops drastically. At such times, the operator will need to initiate process control measures to reduce or stop gas consumption or divert to backup fuel sources. Typically, this reserve volume will then be equivalent to one or several hours of biogas consumption. If the minimum volume selected is too small, then the operator will face frequent process upsets. If biogas production exceeds consumption, then a flare can help to manage biogas supplies when the gas holder is nearly full. Biogas flares prevent unburnt biogas from escaping into the atmosphere and, therefore, are essential for environmental protection. They are often integrated into a system to automatically mitigate oversupply situations as they occur. As flaring gas represents lost revenue, the goal should be to optimize the system to maximize equipment utilization and avoid excessive flaring. Processes for Biogas Utilization Biogas is generally used on-site for one of three applications:
• Heat. The gas is combusted in a boiler. The heat generated warms up water, which can be used to heat the digester and nearby buildings or be exchanged on a local district heating network.
• Combined Heat and Power (CHP). Biogas can be used as a fuel in stationary engines, typically diesel engines, or gas turbines. About 30% to 40% of the energy in the fuel is used to produce electricity. The remaining energy becomes heat or is lost.
• Natural Gas Alternative (e.g., LNG/CNG). Biogas can be upgraded (purified) and used as an alternative to natural gas. Due to renewable fuel standards, biogas may be attractive as a vehicle fuel for cars, buses and trucks. Upgrading involves removing carbon dioxide, water and hydrogen sulfide (H2S) to meet vehicular or pipeline standards. Ultimately, the gas must also be odorized and pressurized.
The following section details these processes of utilizing biogas. Heat Production Boilers consist of a pressure vessel containing water that is heated and evaporated by burning fuel. Steam can be used to provide heat or work when expanded through a steam engine or turbine. Most frequently, boilers produce heat for the AD itself and address other heating needs of the local facility. Boilers are often configured to operate on multiple fuel sources (e.g., natural gas, propane) to ensure the digester produces process heat even in the event of inadequate biogas production. Heat production in gas heaters or boiler systems does not generally require high gas quality. However, reducing the gas’ H2S and water content — usually through condensation — is often recommended to prevent corrosion and interference with gas nozzles. Boilers are relatively simple and have minimal cost and maintenance. Their thermal efficiency is generally between 75% and 85% (Ong et al. 2014), so they are common where heating needs predominate, such as at wastewater treatment facilities.

Electricity Production Most commonly, biogas is used to produce electricity, which yields heat as a significant byproduct. Leveraging both energy streams is an efficient approach, and the process is commonly called combined heat and power (CHP). In general, CHP systems convert biogas into mechanical energy for electricity production and thermal energy. Of the numerous CHP technologies, each varies in the total efficiency and ratio of electricity and heat produced. Electricity can relatively easily be transported off site; however, CHP necessitates that generation occurs at or near the heat use site, so the heat released from power production can meet the user’s thermal requirements. Applications that constantly demand thermal energy and electricity may be CHP candidates. A combustion CHP system has three major components: the engine that combusts the biogas to convert it into mechanical energy and heat; a generator that converts the mechanical energy into electricity; and a heat recovery system that harnesses waste heat into useable energy. Heat can be recovered from a gas engine at a number of points including the intercooler, lube oil and water jacket cooler, which are generally in a circuit, producing hot water. The exhaust gases from biogas engines can be used directly in a drier or waste heat boiler, or they can be converted into hot water using a heat exchanger to supplement the heat from the engine cooling systems. Commonly, the heat warms the (mesophilic and thermophilic) AD tanks to the optimal temperature. Remaining heat can be used by other on-site processes. AD heat demand may vary by season. The heat recovery system can dump excess heat that is not needed for process heat or other beneficial uses. In a system not connected to the electrical grid, size depends on maximum expected on-site demand. When demand is lower than maximum production, the engines can be slowed (in some cases) or stopped, or excess gas can be flared. The ability to modulate production is a key factor for such systems. Reciprocating engines usually perform the best as turbine efficiency decreases at lower capacity and start-up times can be longer. More commonly, systems connect to the grid, and system size should not exceed the biogas supply. It is often preferable to size the unit slightly smaller than the gas supply will support, so the engine can operate continuously and at full capacity. Oversizing will result in greater initial capital cost, lower system operating efficiency and higher maintenance costs per unit of energy generated. At full capacity, the engine will operate more than 8,000 hours each year. Thus, system durability is essential. Around-the-clock operation requires well-executed maintenance. It also requires careful evaluation of how gas quality affects engine wear and performance. Several technologies produce electricity, and each has relative advantages and disadvantages. The main technologies include the following:
1. Reciprocating internal combustion engines 2. Combustion turbines or microturbines 3. Fuel cells
Across all power-generating industries, gas turbines and steam turbines generate the most electricity. Gas turbines contribute 64% and steam turbines contribute 32% of total CHP capacity (Darrow et al.

2017). However, these technologies are most often used at very large scale. For example, central station power generation commonly uses gas turbines at scales greater than 5MW. Because they generate steam, they are often coupled with steam generators to increase electricity production. For the application of CHP from biogas, the most commonly used technologies are reciprocating engines, specifically spark and compression ignition engines (i.e., internal combustions engines). Microturbines are also used but less frequently. More recently, fuel cells have become a viable technology, especially in applications where environmental impact is important. Exhibit 1.6 summarizes each technology’s dimensions and advantages. Exhibit 1.6. Comparison of CHP Technologies
Recip. Engine Gas Turbine Microturbine Fuel Cell Electric efficiency (HHV) 27-41% 24-36% 22-28% 30-63% Overall CHP efficiency (HHV) 77-80% 66-71% 63-70% 55-80% Effective electrical efficiency 75-80% 50-62% 49-57% 55-80% Typical capacity (MWe) .005-10 0.5-300 0.03-1.0 200-2.8 Typical power to heat ratio 0.5-1.2 0.6-1.1 0.5-0.7 1-2 Part-load ok poor ok good CHP Installed costs ($/kWe) 1,500-2,900 1,200-3,300 2,500-4,300 5,000-6,500 Non-fuel O&M costs ($/kWhe) 0.009-0.025 0.009-0.013 0.009-.013 0.032-0.038 Hours to overhauls 30,000-60,000 25,000-50,000 40,000-80,000 32,000-64,000 Start-up time 10 sec 10 min -1 hr 60 sec 3 hrs -2 days Fuel pressure (psig) 1-75 100-500 50-140 0.5-45 Biogas Cleaning Low Moderate Moderate Moderate/High Emissions High Low Low Low
Source: Darrow et al. (2017) Reciprocal Engines. Using biogas in internal combustion engines is a long-established technology and represents the majority of biogas CHP systems. Engine sizes commonly range from 50 kW in small plants to several MW in large biogas plants or landfill sites. Biogas facilities often use diesel engines rebuilt to spark-ignited gas engines or dual-fuel engines (Wellinger 1999). Small-scale CHP systems (< 45 kWe) reach an electrical efficiency of 29% (spark-ignition) and 31% (dual-fuel engine). Larger engines can reach an electrical efficiency of 38% (Wellinger 1999). The remaining energy is either lost as waste (roughly 15%) or yielded as usable thermal energy (roughly 50%). With relatively dirty biogas, reciprocating engines usually work well. Aside from drying the biogas via condensation, fueled engines resist corrosion by continuous operation at high temperatures. Systems require more frequent oil changes if they use dirty biogas than they do in cleaner fuel source scenarios. Reciprocating engines tend to have the lowest capital cost but often have higher operating costs due to constant maintenance needs. They also have the shortest start-up time and usually perform well at partial capacity. Additionally, they have little need for biogas compression. Microturbines. Numerous installations use gas microturbines, which are smaller versions of large industrial turbine generators. Several manufacturers offer microturbine units in sizes from 30 kW to more than 250 kW.
Advantages of microturbine generators include mechanical simplicity, quiet operation, capability of computerized remote operation and small size. Units can be installed in series and operated automatically to respond to varying loads or fuel gas supply. They also have lower emissions compared with reciprocating engines and often have lower maintenance costs. Microturbines are less efficient at converting biogas to electricity (22% to 28% efficiency) than most combustion systems as they convert a higher percentage to thermal energy and exhaust heat (Darrow et al. 2017). They also have higher capital costs than reciprocating engines and require biogas compression, which may require more attention to H2S and H2O reduction compared to reciprocating engines. Fuel Cell CHP Systems. In recent years, fuel cells have garnered significant attention for distributed power, transportation and small mobile applications. They have high electrical efficiency and very low air pollutant emissions. To use biogas methane for fuel cells, it first must be reformed to hydrogen and CO2. This can be accomplished by externally steam-reforming methane using a catalyst at high temperatures and pressures. Such high-temperature fuel cells are fuel-flexible and tolerant to fuel impurities. The reactor generally has a net efficiency of 75% for large-scale installations and 60% for smaller ones. Potential electrical efficiency is >50% (Darrow et al. 2017). This makes fuel cells more attractive where electrical efficiency is important and especially where environmental impact is a concern. However, high costs have generally limited fuel cell adoption. Biomethane Production: Upgrading Instead of using biogas for CHP, facilities may upgrade it to biomethane and inject the biomethane into the natural gas pipeline or use it as a vehicle fuel. Although this has not been as common in the U.S. as CHP, interest is growing. Biomethane production is comparatively popular in Europe. Worldwide, the number of upgrading plants totaled 485 in 2015 with 430 of those in IEA Bioenergy Task 37-member countries (Cucchiella et al. 2018). By the end of 2017, 532 biogas-upgrading plants operated in IEA Bioenergy Task 37-member countries (IEA 2019). In 2017, 61 U.S. facilities operated. That number grew to 89 in first-quarter 2019. Further, growth is expected with 31 facilities under construction and 82 in the planning stage (Mintz and Voss 2019). The majority of existing operations are associated with landfills and wastewater treatment. However, farms are expected to fuel most upcoming growth. Much of the U.S. interest stems from biomethane qualifying as a renewable vehicle fuel and capturing the associated financial incentives. However, relative to producing biogas, producing biomethane requires greater scale and cost. A supplement to this report details biomethane production and economics. Summary of Biogas Production Systems Exhibit 1.7 provides a simplified summary of the biogas production process, including main process options and configurations. It focuses on the products produced (in orange), inputs (yellow) and processes (blue). As shown, various feedstocks go to an appropriately designed AD. The resulting biogas may fuel a boiler to produce process heat (e.g., for the digester), or it can be cleaned for use in CHP to produce electricity. The biogas can also be upgraded to produce biomethane, usually for vehicle fuel as CNG. The digestate produced by the digester can either be land applied, or the solids can be separated from the liquid portion. Separating is typically the first step in adding value to digestate by stabilizing the solids for use as animal bedding or a soil amendment. The liquid portion can be more easily applied to

land or further concentrated to increase its fertilizer value. See this report’s supplement section for more details about each of these processes. Exhibit 1.7. Biogas Production Process
Biogas Safety Any biogas facility has a number of safety concerns to consider. Regarding biogas handling safety, the main considerations are human health risks due to gas exposure (e.g., H2S), explosive potential when mixed with air in concentrations of 5% to 15% and pressure with systems that pressurize clean biogas. Excess biogas should be flared, and all gas lines should be fitted with flame traps. To reduce risks that biogas pressure poses to the system and operators, facilities incorporate sensors and pressure relief valves. Digester buildings should be equipped with CH4
and H2S detectors, and
access to the digester vessel itself should be restricted. When working in enclosed spaces with machinery, it is important that the safety sensor notify the user through multiple senses. Typically, safety sensors will vibrate, flash and chirp when they detect an alarm condition. When working around manure storage or treatment systems, workers should wear a H2S personal gas monitor, which detects H2S and alerts of dangerous conditions. Not only do dangerous gases present a risk, but the absence of oxygen also presents a dangerous. When manure gas is produced in a confined space without ventilation, it displaces air and can lead to insufficient oxygen to support human life. In covered manure storage and collection pits, digester tanks, covered lagoons, upright storage tanks and tanker spreaders, manure gases can accumulate to produce a deadly atmosphere.
Feedstock-Manure-Food waste-Biomass (grass, residue, etc.)
CollectionPreprocessing
Anaerobic Digestion-Complete Mix-Plug Flow-Lagoon
Biogas
Biomethane Upgrading Biomethane
RNG: Inject into Pipeline
Compress for CNG
CHP-Reciprocal Engine-Microturbine
Electricity
BoilerProcess
HeatPre-
cleaning
Digestate
Land Apply: Fertilizer
Solids Separation
Liquid
Land Apply:
Fertilizer
Nutrient Concentration or Extraction
Digestate Solids
Land Apply: Fertilizer
Bedding
Compost
DryPeat Moss
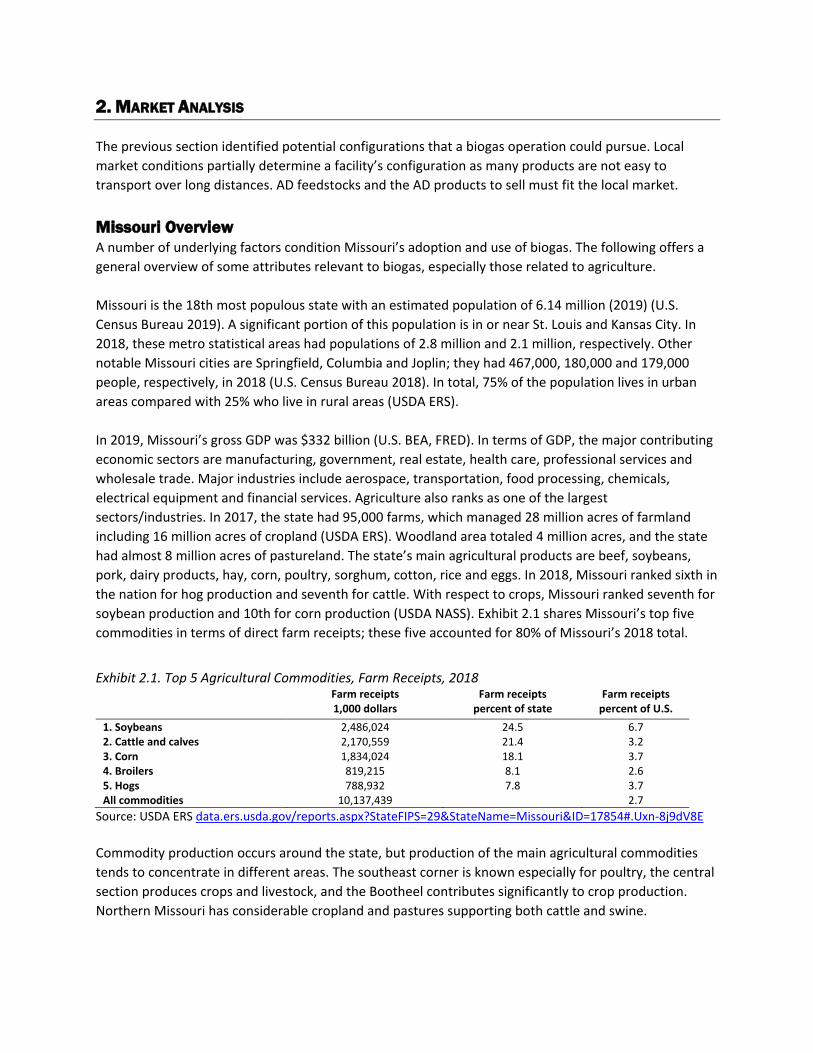
2. MARKET ANALYSIS The previous section identified potential configurations that a biogas operation could pursue. Local market conditions partially determine a facility’s configuration as many products are not easy to transport over long distances. AD feedstocks and the AD products to sell must fit the local market.
Missouri Overview A number of underlying factors condition Missouri’s adoption and use of biogas. The following offers a general overview of some attributes relevant to biogas, especially those related to agriculture. Missouri is the 18th most populous state with an estimated population of 6.14 million (2019) (U.S. Census Bureau 2019). A significant portion of this population is in or near St. Louis and Kansas City. In 2018, these metro statistical areas had populations of 2.8 million and 2.1 million, respectively. Other notable Missouri cities are Springfield, Columbia and Joplin; they had 467,000, 180,000 and 179,000 people, respectively, in 2018 (U.S. Census Bureau 2018). In total, 75% of the population lives in urban areas compared with 25% who live in rural areas (USDA ERS). In 2019, Missouri’s gross GDP was $332 billion (U.S. BEA, FRED). In terms of GDP, the major contributing economic sectors are manufacturing, government, real estate, health care, professional services and wholesale trade. Major industries include aerospace, transportation, food processing, chemicals, electrical equipment and financial services. Agriculture also ranks as one of the largest sectors/industries. In 2017, the state had 95,000 farms, which managed 28 million acres of farmland including 16 million acres of cropland (USDA ERS). Woodland area totaled 4 million acres, and the state had almost 8 million acres of pastureland. The state’s main agricultural products are beef, soybeans, pork, dairy products, hay, corn, poultry, sorghum, cotton, rice and eggs. In 2018, Missouri ranked sixth in the nation for hog production and seventh for cattle. With respect to crops, Missouri ranked seventh for soybean production and 10th for corn production (USDA NASS). Exhibit 2.1 shares Missouri’s top five commodities in terms of direct farm receipts; these five accounted for 80% of Missouri’s 2018 total.
Exhibit 2.1. Top 5 Agricultural Commodities, Farm Receipts, 2018 Farm receipts Farm receipts Farm receipts 1,000 dollars percent of state percent of U.S. 1. Soybeans 2,486,024 24.5 6.7 2. Cattle and calves 2,170,559 21.4 3.2 3. Corn 1,834,024 18.1 3.7 4. Broilers 819,215 8.1 2.6 5. Hogs 788,932 7.8 3.7 All commodities 10,137,439
2.7
Source: USDA ERS data.ers.usda.gov/reports.aspx?StateFIPS=29&StateName=Missouri&ID=17854#.Uxn-8j9dV8E Commodity production occurs around the state, but production of the main agricultural commodities tends to concentrate in different areas. The southeast corner is known especially for poultry, the central section produces crops and livestock, and the Bootheel contributes significantly to crop production. Northern Missouri has considerable cropland and pastures supporting both cattle and swine.
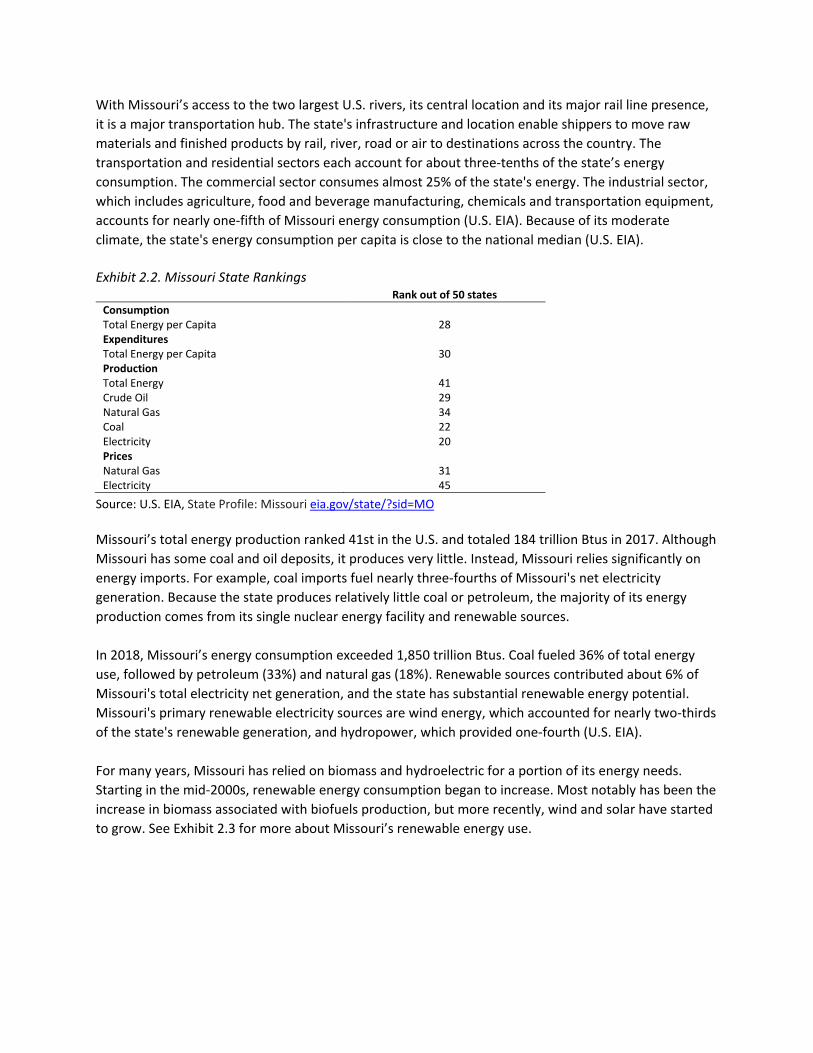
With Missouri’s access to the two largest U.S. rivers, its central location and its major rail line presence, it is a major transportation hub. The state's infrastructure and location enable shippers to move raw materials and finished products by rail, river, road or air to destinations across the country. The transportation and residential sectors each account for about three-tenths of the state’s energy consumption. The commercial sector consumes almost 25% of the state's energy. The industrial sector, which includes agriculture, food and beverage manufacturing, chemicals and transportation equipment, accounts for nearly one-fifth of Missouri energy consumption (U.S. EIA). Because of its moderate climate, the state's energy consumption per capita is close to the national median (U.S. EIA). Exhibit 2.2. Missouri State Rankings
Rank out of 50 states Consumption Total Energy per Capita 28 Expenditures Total Energy per Capita 30 Production Total Energy 41 Crude Oil 29 Natural Gas 34 Coal 22 Electricity 20 Prices Natural Gas 31 Electricity 45
Source: U.S. EIA, State Profile: Missouri eia.gov/state/?sid=MO Missouri’s total energy production ranked 41st in the U.S. and totaled 184 trillion Btus in 2017. Although Missouri has some coal and oil deposits, it produces very little. Instead, Missouri relies significantly on energy imports. For example, coal imports fuel nearly three-fourths of Missouri's net electricity generation. Because the state produces relatively little coal or petroleum, the majority of its energy production comes from its single nuclear energy facility and renewable sources. In 2018, Missouri’s energy consumption exceeded 1,850 trillion Btus. Coal fueled 36% of total energy use, followed by petroleum (33%) and natural gas (18%). Renewable sources contributed about 6% of Missouri's total electricity net generation, and the state has substantial renewable energy potential. Missouri's primary renewable electricity sources are wind energy, which accounted for nearly two-thirds of the state's renewable generation, and hydropower, which provided one-fourth (U.S. EIA). For many years, Missouri has relied on biomass and hydroelectric for a portion of its energy needs. Starting in the mid-2000s, renewable energy consumption began to increase. Most notably has been the increase in biomass associated with biofuels production, but more recently, wind and solar have started to grow. See Exhibit 2.3 for more about Missouri’s renewable energy use.

Exhibit 2.3. Missouri Renewable Energy Consumption by Year
Source: U.S. EIA, State Energy Data System Missouri has the potential to further develop wind and solar resources. Although Missouri has a moderate supply of these resources relative to other states, using these materials is generally feasible. For example, Missouri’s solar irradiance is much lower than that in the southwest U.S., but it is generally higher than that in northern states (NREL 2018) and has encouraged moderate investment. Likewise, much of Missouri has near average windspeeds, especially in the southeast. In northwestern Missouri, windspeeds are more significant and have resulted in wind turbine investment. At the end of 2019, Missouri had almost 1,000 megawatts of wind power generating capacity from 500 wind turbines, and nearly 900 megawatts were under construction. Likewise, Missouri continues to add solar capacity at an increasing rate. According to the Solar Energy Industries Association, Missouri had 258 MW of solar capacity installed in 2019 and ranked as the 27th state in the U.S. Missouri's largest sources of renewable energy include fuel ethanol and biodiesel. The state has the third-largest biodiesel production capacity in the nation. Its 10 biodiesel plants produced 247 million gallons in 2018 (U.S. EIA). Missouri has six corn-based ethanol plants. State ethanol production capacity totals 261 million gallons per year — 1.6% of the nation’s ethanol production capacity (EIA). In addition to biofuels, Missouri has significant potential to produce energy from biomass, including agricultural waste, municipal solid waste and landfill gas and the 14 million acres of forest that cover roughly one-third of the state. Missouri's forests and biomass resources are feedstock for the state's wood pellet industry. Industry accounts for the majority of wood and wood-waste fuel consumption in the U.S. The largest industrial users are wood products, paper manufacturers and the residential sector. Primary Feedstocks A key component to determining biogas production feasibility is access to a suitable feedstock. Missouri has a number of feedstock resources relevant to biogas production.
0
20
40
60
80
100
120
1960
1970
1972
1974
1976
1978
1980
1982
1984
1986
1988
1990
1992
1994
1996
1998
2000
2002
2004
2006
2008
2010
2012
2014
2016
2018
Trill
ion
Btu
Hydro Electric Biomass Geothermal Solar Wind

Manure Manure is the most common resource for AD in many parts of the state, and it serves as a feedstock possibility in areas where livestock production takes place. Exhibit 2.4 maps Missouri animal inventory by species in 2017. Missouri is a major cattle producer. In 2019, it had the third largest beef cattle inventory of any state (USDA NASS). Cattle production occurs broadly across the state, but it tends to highly concentrate in the southwest quadrant. Although Missouri is a significant cattle-producing state, it has relatively few confined cattle feeding operations. Instead, cattle in most cases graze on pasture. This production scenario makes manure collection difficult. Dairies have been one of the main adopters of AD across the country, but Missouri has relatively few large dairies. Exhibit 2.4. Missouri Animal Inventory, 2017
Source: USDA NASS, 2017 Agricultural Census Poultry litter tends to be available in southwest and central Missouri. It could be a viable feedstock, especially because it is relatively dry and easier to transport than liquid manure. The swine industry has also shown interest in AD to manage manure and will likely be a significant Missouri source of biogas feedstock. Missouri’s hog population tends to be in the central, northern and

northwestern portions of the state. Relative to poultry operations, hog operations have tended to have more significant incentives to manage manure in innovative ways (Outz 2018). In order to consider the manure supply available, Exhibit 2.5 converts animal inventory into a standard 1,000-pound animal unit. The map shows the principal animals — poultry and hogs — converted into animal units to identify counties with the largest relevant animal inventories. Exhibit 2.5. Missouri Hog and Poultry Animal Units, 2017
Source: USDA NASS, 2017 Agricultural Census Because manure is difficult to handle and transport, its collection must occur efficiently. As such, only manure generated by concentrated animal feeding operations (CAFOs) would likely be relevant to a biogas facility. Exhibit 2.6 maps CAFO facilities by size (number of animal units), type and location to help gauge what type of biogas facilities are appropriate and where they might be located. Areas with large CAFOs or those with closely located CAFOs are most promising for biogas production. A number of CAFOS across the state would support AD. In a few areas where CAFOS are especially concentrated, facilities could coordinate AD development. These areas include the north central (e.g., around Sullivan County), east central (e.g., around Audrain County) and southwest regions.
Exhibit 2.6. Missouri CAFOs

Source: Missouri Department of Natural Resources, Animal Feeding Operations Map modnr.maps.arcgis.com/apps/webappviewer/index.html?id=cf630b020a17452fb30994cb4b36f003 Exhibit 2.7 combines the above CAFO maps and overlays them with cropland acreage in Missouri. The CAFO populations were converted to animal units to better represent the total amount of manure produced. As mentioned, CAFOs hold potential as biogas feedstock sources because they can efficiently capture manure generated by animals on-site. Cropland is relevant as it could also yield feedstock material for biogas production, but more importantly, the cropland could receive digestate generated by ADs. Considering cropland availability may be especially important where digestate would be used differently from manure — for example, where large operations aggregate feedstocks for AD or where poultry operations with AD use digestate differently from how they use litter. In some cases, digestate may have higher land application costs than litter due to its higher moisture content.
Exhibit 2.7. CAFO Locations and Cropland in Missouri
Source: Missouri Department of Natural Resources, Animal Feeding Operations Map; USDA NASS (2017)
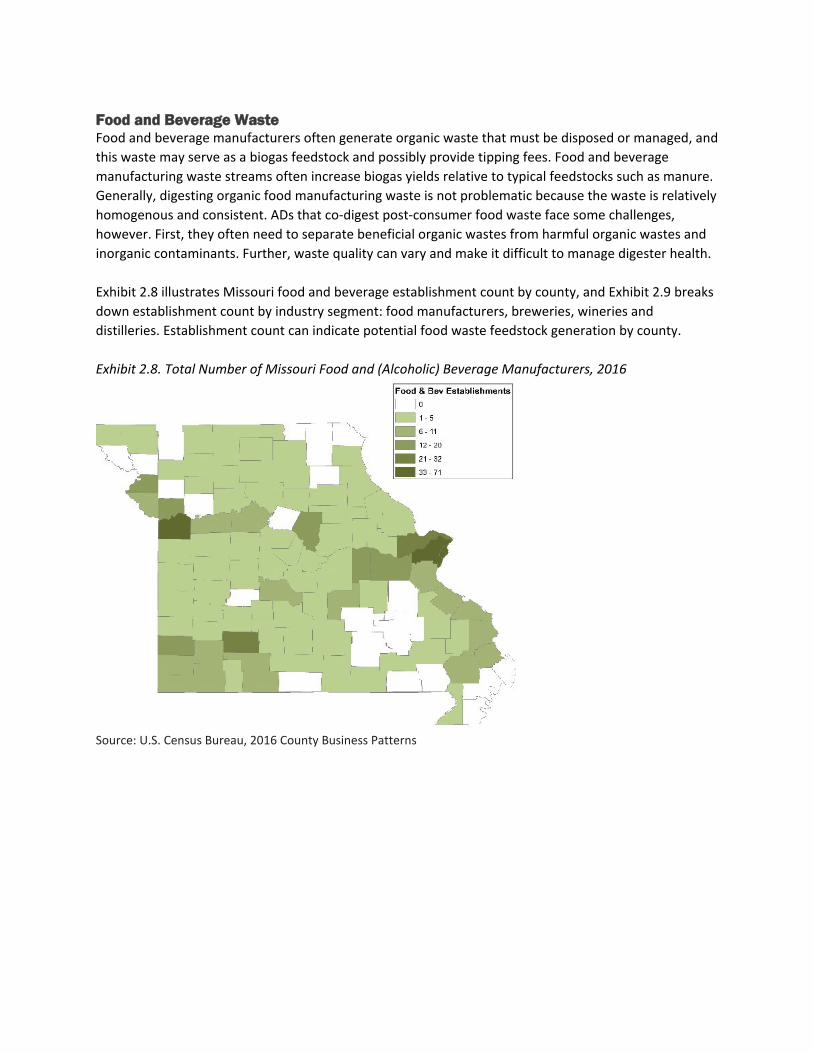
Food and Beverage Waste Food and beverage manufacturers often generate organic waste that must be disposed or managed, and this waste may serve as a biogas feedstock and possibly provide tipping fees. Food and beverage manufacturing waste streams often increase biogas yields relative to typical feedstocks such as manure. Generally, digesting organic food manufacturing waste is not problematic because the waste is relatively homogenous and consistent. ADs that co-digest post-consumer food waste face some challenges, however. First, they often need to separate beneficial organic wastes from harmful organic wastes and inorganic contaminants. Further, waste quality can vary and make it difficult to manage digester health. Exhibit 2.8 illustrates Missouri food and beverage establishment count by county, and Exhibit 2.9 breaks down establishment count by industry segment: food manufacturers, breweries, wineries and distilleries. Establishment count can indicate potential food waste feedstock generation by county. Exhibit 2.8. Total Number of Missouri Food and (Alcoholic) Beverage Manufacturers, 2016
Source: U.S. Census Bureau, 2016 County Business Patterns
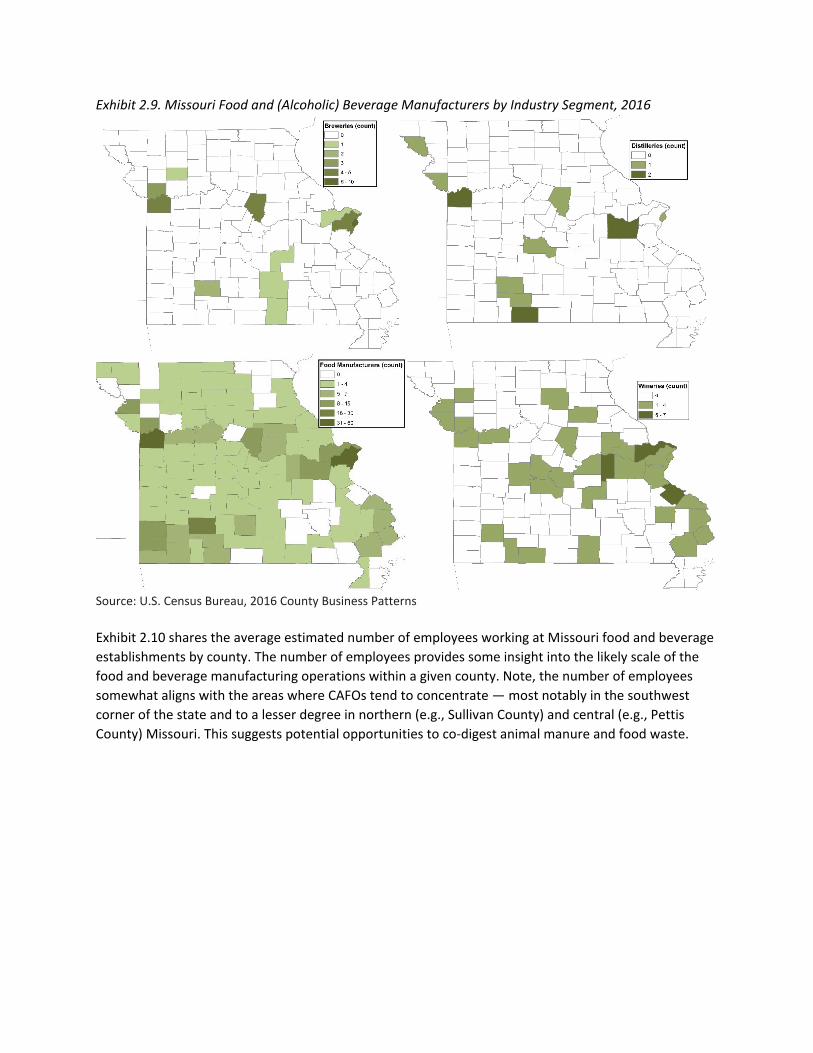
Exhibit 2.9. Missouri Food and (Alcoholic) Beverage Manufacturers by Industry Segment, 2016
Source: U.S. Census Bureau, 2016 County Business Patterns Exhibit 2.10 shares the average estimated number of employees working at Missouri food and beverage establishments by county. The number of employees provides some insight into the likely scale of the food and beverage manufacturing operations within a given county. Note, the number of employees somewhat aligns with the areas where CAFOs tend to concentrate — most notably in the southwest corner of the state and to a lesser degree in northern (e.g., Sullivan County) and central (e.g., Pettis County) Missouri. This suggests potential opportunities to co-digest animal manure and food waste.

Exhibit 2.10. Estimated Employees of Missouri Food and (Alcoholic) Beverage Manufacturers, 2016
Source: U.S. Census Bureau, 2016 County Business Patterns Grass, Woodland and Crop Residues Missouri has abundant biomass resources including grasses, wood and crop residues. Continued interest has focused on using such biomass feedstocks to make biogas; however, these resources have not been widely used in the U.S. to generate biogas for a number of reasons:
1) The abundance of available feedstocks such as manure relative to biogas demand, 2) The cost of acquiring, gathering and transporting feedstocks, 3) The value of feedstocks for existing uses such as feed and energy and 4) Difficulties in digesting these feedstocks.
Given these characteristics, cellulosic feedstocks are unlikely to be well-suited as primary feedstocks for anaerobic digestion; however, considerable interest has focused on using such materials as secondary feedstocks. In many situations, blending cellulosic feedstocks with other feedstocks (e.g., manure) can enhance a digester’s operation and yield. As biogas production and demand increase, more facilities may incorporate biomass into the AD model to increase production. A feedstock’s composition impacts its suitability for anaerobic digestion and how it can be effectively used. The carbon-to-nitrogen (C/N) ratio and lignocellulose content are two key aspects. Regardless of the material used, gas production proceeds most efficiently when the raw materials fed to the digester have enough nitrogen to derive their energy from carbon. A high C/N ratio means the nitrogen will be exhausted before the carbon is digested. Conversely, a low C/N ratio or too much nitrogen relative to carbon results in high ammonium concentrations, which may become toxic to the anaerobic bacteria. Digester operators may adjust the C/N ratio by adding material to complement the material already in the digester. For instance, sawdust, which has a high C/N ratio, could be added to poultry or swine manure, which has a low C/N ratio. Conversely, dairy cow manure has a C/N ratio just slightly below that

required by the bacteria and may not benefit from addition. As such, biomass feedstocks can be used to improve manure digestion systems, especially those that use swine and poultry manure. Exhibit 2.11 shows the C/N ratio of select feedstocks. A feedstock’s lignin content also affects its digestion suitability. Plant cell wall material is composed of three important constituents: cellulose, lignin and hemicellulose. Lignin is particularly difficult to biodegrade, and it reduces bioavailability of the other cell wall constituents. Accordingly, highly lignified feedstocks (e.g., wood chips) are slow to digest, have relatively low yields and may increase digestate solid production. Food wastes often have relatively low lignin content, which helps to elevate their biogas yield potential. Crop residues and grasses vary in lignin levels, but their levels tend to be moderately higher than manure’s. Manure from animals fed high levels of lignins (e.g., grass-fed ruminants) tends to have higher lignin content than manure from animals fed grain-based diets (e.g., poultry, swine). Exhibit 2.11 presents the lignin content of select feedstocks. Under optimal conditions, wastes high in lignin can require in excess of 90 days to reach maximum conversion of organic waste to CH4 and CO2 (Rivard et al. 1988). For wastes with less lignin (e.g., corn), digestion may occur in less than 20 days (Banks 2014). However, pretreatment methods can improve the digestion of lignin and decrease the retention time (Sayara and Sanchez 2019). Exhibit 2.11. Typical Carbon-to-Nitrogen Ratios and Lignin Content of Biomass Feedstocks
Substrate Lignin % C/N Wheat straw 8.9-18 127 Corn stover 11 60-70 Fescue hay 7 32 Newsprint 20.9 398-852 Chicken manure 3.4 6-14* Pig manure 2.2 14 Cow manure 8.1 19 Wood: Pine 27.8 641 Vegetable wastes 11-13 Slaughterhouse waste 0 2-4 Food Waste >1 14-16
*6-1 for laying hens and 14-1 for broiler litter Source: Rynk et al. (1992); Cornell Waste Management Institute Biomass generally has a low moisture content, which also increases its transportability and storability. Biomass’ moisture content can also affect digestion performance. In situations where the primary feedstock’s dry matter is lower than desired, biomass can increase TS improving its rheological properties and biogas yield. Clearly, biomass resources have the potential for anaerobic digestion in Missouri. Missouri has significant grassland and pastures — often in areas where manure is produced. Much of that grass is used for animal feed — possibly making it too valuable for widescale use as a biogas feedstock. Conservation Reserve Program Land Missouri’s Conservation Reserve Program (CRP) land is one potential underutilized feedstock resource. Large acreages of grasslands have been re-established on CRP land. The program sets aside highly

erodible and environmentally sensitive cropland using 10- to 15-year contracts. Land under CRP is planted to conservation crops such as perennial grasses and trees. The program’s purpose is to cost-effectively assist producers in conserving and improving soil, water and wildlife resources. The Farm Security and Rural Investment Act of 2002 (FSRIA) permitted managed haying, grazing and biomass harvesting of CRP grassland in accordance with a conservation plan (USDA 2003). Harvesting CRP resources is limited according to frequency and timing during the year. The Food, Conservation, and Energy Act of 2008 — the 2008 farm bill — Title II, Subtitle B allowed forage or biomass harvests after the primary nesting season for grass-nesting birds (USDA 2008), and other restrictions apply (USDA FSA 2011). Participants accept a 25% reduction in the CRP land rental payment during years when biomass is hayed, grazed or harvested (USDA FSA 2011). Currently, northern Missouri has a high concentration of CRP acres. Exhibit 2.12 shows Missouri CRP acreage in grass and woods. Other CRP acreage may be less appropriate as a biomass feedstock for biogas production. These acreages tend to be smaller but are included in the map. Exhibit 2.12. Missouri CRP Acreage by County, 2017
Source: USDA, Farm Service Agency, Conservation Practices Installed on CRP (Acres) Most CRP acres have been reseeded to indigenous species, and once established, these species are very persistent. However, they are not high-yielding, and policy restricts harvest to once in three years. Another issue involves the harvest season’s length. A wide harvest window would enable using harvest machines and harvest crews over many months. However, because the most important feedstock component is carbon and carbon is stored in the lignin and cellulose chains, harvest timing is not expected to be critical.
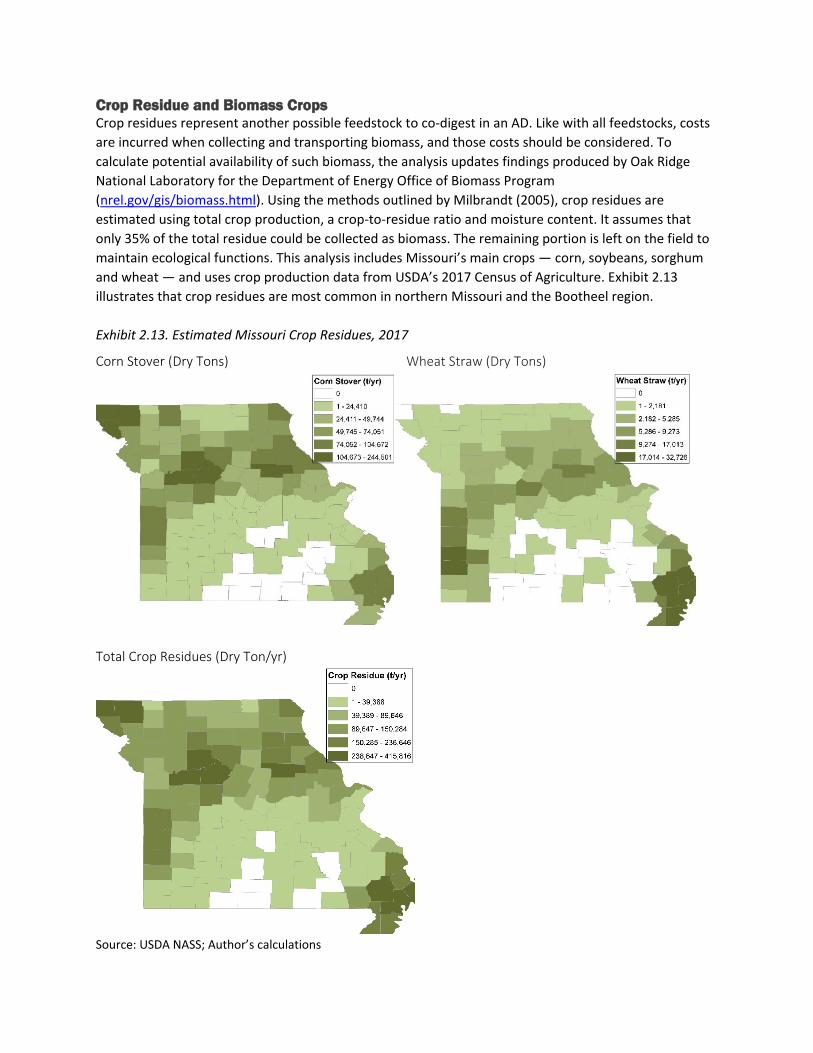
Crop Residue and Biomass Crops Crop residues represent another possible feedstock to co-digest in an AD. Like with all feedstocks, costs are incurred when collecting and transporting biomass, and those costs should be considered. To calculate potential availability of such biomass, the analysis updates findings produced by Oak Ridge National Laboratory for the Department of Energy Office of Biomass Program (nrel.gov/gis/biomass.html). Using the methods outlined by Milbrandt (2005), crop residues are estimated using total crop production, a crop-to-residue ratio and moisture content. It assumes that only 35% of the total residue could be collected as biomass. The remaining portion is left on the field to maintain ecological functions. This analysis includes Missouri’s main crops — corn, soybeans, sorghum and wheat — and uses crop production data from USDA’s 2017 Census of Agriculture. Exhibit 2.13 illustrates that crop residues are most common in northern Missouri and the Bootheel region. Exhibit 2.13. Estimated Missouri Crop Residues, 2017
Corn Stover (Dry Tons) Wheat Straw (Dry Tons)
Total Crop Residues (Dry Ton/yr)
Source: USDA NASS; Author’s calculations

Energy crops could be produced to enhance biogas production. Possible energy crops include biomass sorghum, miscanthus and other grasses. Such crops could significantly enhance the biogas yield, and they might be attractive if biogas were valued highly. However, this is not likely to be the case on a large scale due to the cost of production and availability of other feedstocks. Woody Biomass Feedstocks Missouri is a large wood producer, and sawdust and other woody biomass could be added to digesters to increase production. However, woody biomass is likely to be constrained to co-digestion scenarios. In those cases, wood products would represent a relatively small portion of the digester’s supply due to their high carbon and lignin content. Digesters looking to increase solids and carbon may consider sourcing woody biomass waste such as sawdust, especially where it is freely available. Exhibit 2.14 shades Missouri counties according to their number of operational wood product businesses. These businesses may create a supply of primary and secondary milling residues that an anaerobic digester could co-digest. These businesses tend to concentrate south of the Missouri River. South central Missouri tends to have particularly strong numbers of wood products businesses. Exhibit 2.14. Number of Missouri Wood Businesses, 2017
Source: U.S. Census Bureau, 2016 County Business Patterns Forest residues represent another possible feedstock stream for anaerobic digestion. Exhibit 2.15 presents total forest biomass per county on a tonnage basis. As illustrated, the southern portion of Missouri — the south-central region in particular — has a rich forest biomass supply.
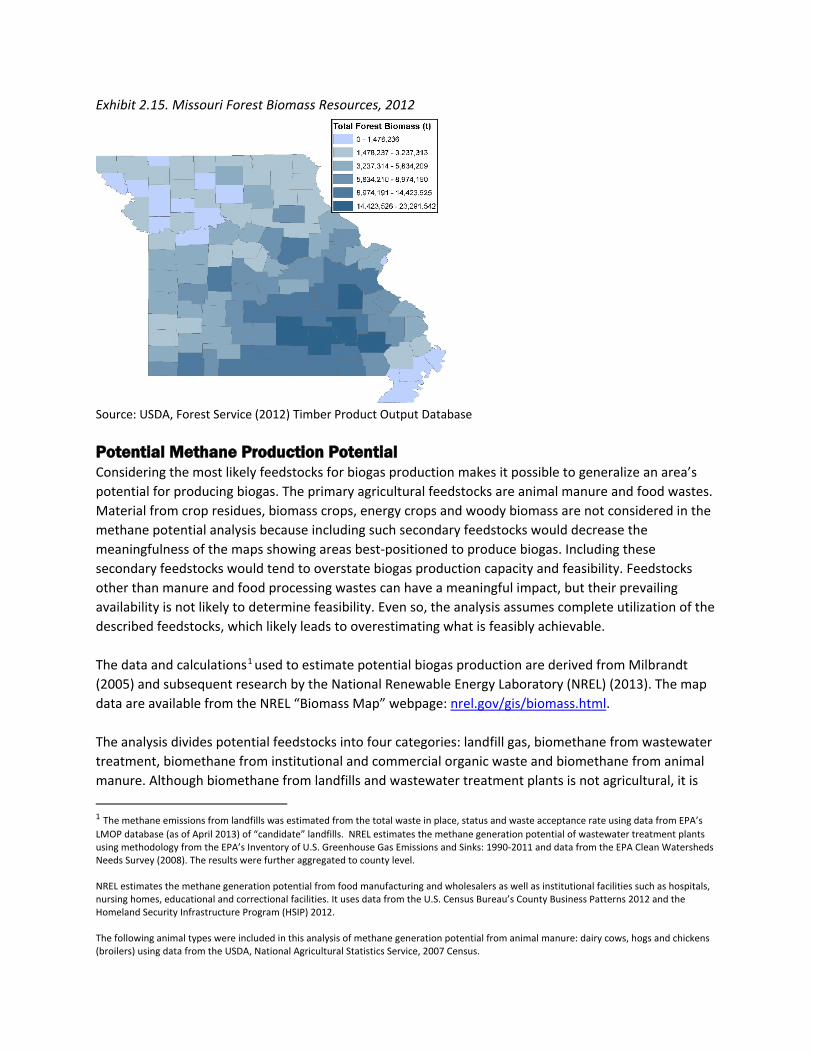
Exhibit 2.15. Missouri Forest Biomass Resources, 2012
Source: USDA, Forest Service (2012) Timber Product Output Database
Potential Methane Production Potential Considering the most likely feedstocks for biogas production makes it possible to generalize an area’s potential for producing biogas. The primary agricultural feedstocks are animal manure and food wastes. Material from crop residues, biomass crops, energy crops and woody biomass are not considered in the methane potential analysis because including such secondary feedstocks would decrease the meaningfulness of the maps showing areas best-positioned to produce biogas. Including these secondary feedstocks would tend to overstate biogas production capacity and feasibility. Feedstocks other than manure and food processing wastes can have a meaningful impact, but their prevailing availability is not likely to determine feasibility. Even so, the analysis assumes complete utilization of the described feedstocks, which likely leads to overestimating what is feasibly achievable. The data and calculations1 used to estimate potential biogas production are derived from Milbrandt (2005) and subsequent research by the National Renewable Energy Laboratory (NREL) (2013). The map data are available from the NREL “Biomass Map” webpage: nrel.gov/gis/biomass.html. The analysis divides potential feedstocks into four categories: landfill gas, biomethane from wastewater treatment, biomethane from institutional and commercial organic waste and biomethane from animal manure. Although biomethane from landfills and wastewater treatment plants is not agricultural, it is
1 The methane emissions from landfills was estimated from the total waste in place, status and waste acceptance rate using data from EPA’s LMOP database (as of April 2013) of “candidate” landfills. NREL estimates the methane generation potential of wastewater treatment plants using methodology from the EPA’s Inventory of U.S. Greenhouse Gas Emissions and Sinks: 1990-2011 and data from the EPA Clean Watersheds Needs Survey (2008). The results were further aggregated to county level. NREL estimates the methane generation potential from food manufacturing and wholesalers as well as institutional facilities such as hospitals, nursing homes, educational and correctional facilities. It uses data from the U.S. Census Bureau’s County Business Patterns 2012 and the Homeland Security Infrastructure Program (HSIP) 2012. The following animal types were included in this analysis of methane generation potential from animal manure: dairy cows, hogs and chickens (broilers) using data from the USDA, National Agricultural Statistics Service, 2007 Census.
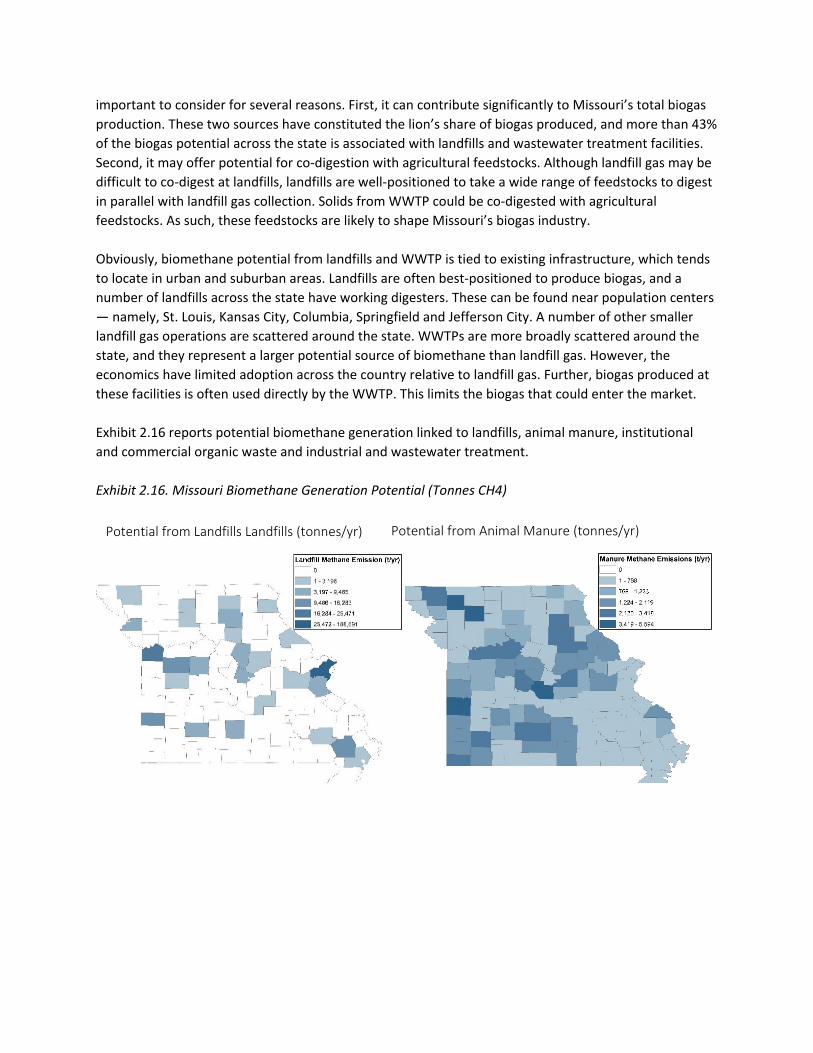
important to consider for several reasons. First, it can contribute significantly to Missouri’s total biogas production. These two sources have constituted the lion’s share of biogas produced, and more than 43% of the biogas potential across the state is associated with landfills and wastewater treatment facilities. Second, it may offer potential for co-digestion with agricultural feedstocks. Although landfill gas may be difficult to co-digest at landfills, landfills are well-positioned to take a wide range of feedstocks to digest in parallel with landfill gas collection. Solids from WWTP could be co-digested with agricultural feedstocks. As such, these feedstocks are likely to shape Missouri’s biogas industry. Obviously, biomethane potential from landfills and WWTP is tied to existing infrastructure, which tends to locate in urban and suburban areas. Landfills are often best-positioned to produce biogas, and a number of landfills across the state have working digesters. These can be found near population centers — namely, St. Louis, Kansas City, Columbia, Springfield and Jefferson City. A number of other smaller landfill gas operations are scattered around the state. WWTPs are more broadly scattered around the state, and they represent a larger potential source of biomethane than landfill gas. However, the economics have limited adoption across the country relative to landfill gas. Further, biogas produced at these facilities is often used directly by the WWTP. This limits the biogas that could enter the market. Exhibit 2.16 reports potential biomethane generation linked to landfills, animal manure, institutional and commercial organic waste and industrial and wastewater treatment. Exhibit 2.16. Missouri Biomethane Generation Potential (Tonnes CH4)
Potential from Landfills Landfills (tonnes/yr) Potential from Animal Manure (tonnes/yr)

Source: NREL (2013) Energy Analysis: Biogas Potential in the United States nrel.gov/docs/fy14osti/60178.pdf Overlaying potential biogas production from these feedstocks helps to estimate total production across the state. See Exhibit 2.17. When considering only food (institutional and commercial) and agricultural feedstocks, central and southwest Missouri stand out as do a few other isolated counties. When MSW and WWTP potential is added to the agricultural feedstocks, the picture remains similar, though urban areas become more important. Exhibit 2.17. Total Potential Biomethane Production Per Square Mile (Tonnes CH4, sqmi)
Source: NREL (2013) Energy Analysis: Biogas Potential in the United States nrel.gov/docs/fy14osti/60178.pdf Exhibit 2.18 reports that Sullivan, Vernon and St. Louis counties had the highest biomethane potential of all Missouri counties according to the biomethane potential from animal and institutional/commercial
Potential from Institutional and Commercial Organic Waste (tonnes/yr)
Potential from Industrial and Wastewater Treatment (tonnes/yr)
Biogas Potential from Animal Manure, Institutional and Commercial
Biogas Potential from All Sources

organic wastes. It also ranks counties based on their biomethane potential from all biogas sources. St. Louis, Jackson and Sullivan counties ranked as the top three counties for biomethane production when using all primary biogas feedstock sources. Exhibit 2.18. Rank of Biomethane Production of Top 10 Counties (tonnes CH4)
Rank County Manure, Institutional and Commercial Sources County
All Biomethane Sources*
1 Sullivan 11,154 St. Louis 16,887 2 Vernon 10,862 Jackson 16,872 3 St. Louis 4,795 Sullivan 11,206 4 Daviess 4,030 Vernon 10,957 5 Marion 3,387 Wright 9,432 6 Saline 3,224 St. Louis City 8,468 7 Jackson 2,926 Pettis 6,456 8 Miller 2,731 Macon 5,728 9 Callaway 2,498 Stoddard 5,301 10 Audrain 2,472 Pike 5,152
*Includes: landfill gas, WWTP/industrial biomass, manure, food waste from institutional and commercial sources Source: NREL (2013) Energy Analysis: Biogas Potential in the United States nrel.gov/docs/fy14osti/60178.pdf In total, the NREL analysis estimates that Missouri could produce in excess of 200,000 tonnes of biomethane gas per year — an amount equivalent to 9.51 trillion Btus or 9.85 billion ft3 of natural gas. See Exhibit 2.19. To put this volume into context, Missouri residential consumers in 2019 used 112.7 ft3 of natural gas, and consumption across all users totaled 310 ft3 (EIA 2009). This suggests that, according to NREL (2013), Missouri biogas feedstocks could meet 8% of residential natural gas demand. The American Biogas Council (2020) offers a higher estimate. It suggests that Missouri has available feedstocks to produce as many as 628,000 tonnes of biomethane. Of the considered feedstocks, animal manure could supply 46% of total biomethane production, and food wastes could supply 11%, according to the NREL projections. Nonagricultural feedstocks could supply 43% of the total biomethane. In its biogas production potential estimates, the American Biogas Council in 2020 found much higher biogas potential from animal manure and food wastes than NREL, and it estimated lower biogas potential from WWTP and MSW.
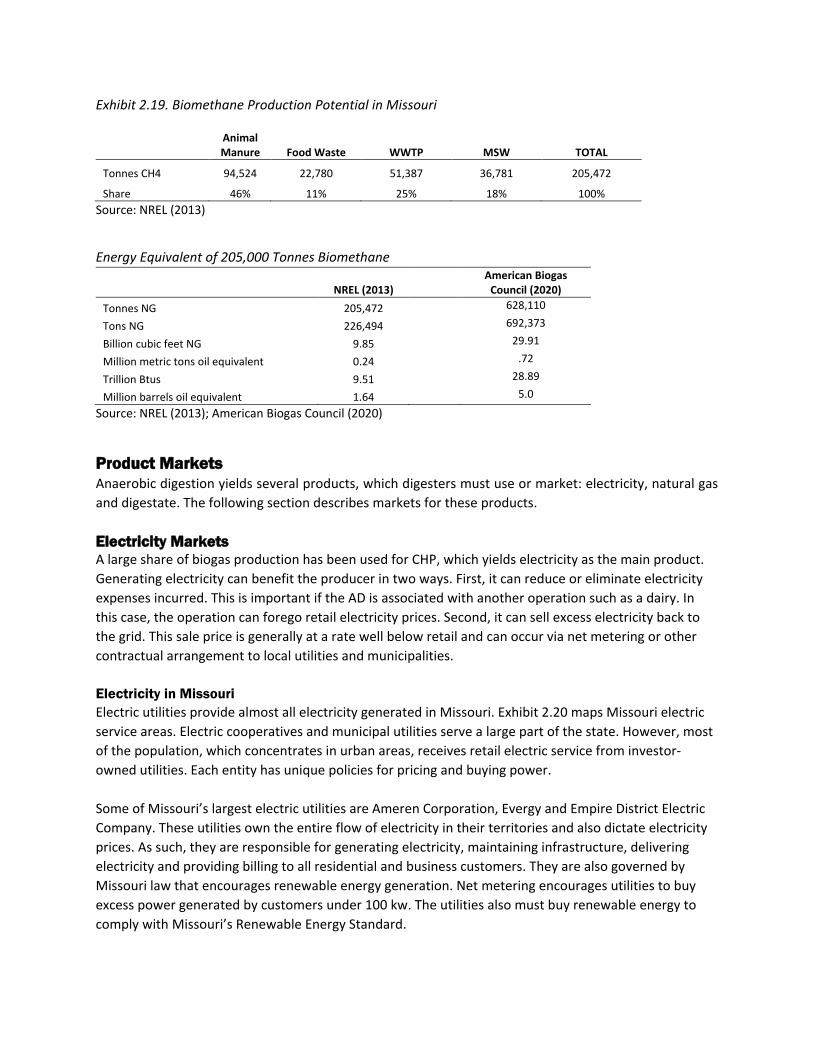
Exhibit 2.19. Biomethane Production Potential in Missouri
Animal Manure Food Waste WWTP MSW TOTAL
Tonnes CH4 94,524 22,780 51,387 36,781 205,472
Share 46% 11% 25% 18% 100% Source: NREL (2013)
Energy Equivalent of 205,000 Tonnes Biomethane
NREL (2013) American Biogas
Council (2020) Tonnes NG 205,472 628,110
Tons NG 226,494 692,373
Billion cubic feet NG 9.85 29.91
Million metric tons oil equivalent 0.24 .72
Trillion Btus 9.51 28.89
Million barrels oil equivalent 1.64 5.0
Source: NREL (2013); American Biogas Council (2020)
Product Markets Anaerobic digestion yields several products, which digesters must use or market: electricity, natural gas and digestate. The following section describes markets for these products. Electricity Markets A large share of biogas production has been used for CHP, which yields electricity as the main product. Generating electricity can benefit the producer in two ways. First, it can reduce or eliminate electricity expenses incurred. This is important if the AD is associated with another operation such as a dairy. In this case, the operation can forego retail electricity prices. Second, it can sell excess electricity back to the grid. This sale price is generally at a rate well below retail and can occur via net metering or other contractual arrangement to local utilities and municipalities. Electricity in Missouri Electric utilities provide almost all electricity generated in Missouri. Exhibit 2.20 maps Missouri electric service areas. Electric cooperatives and municipal utilities serve a large part of the state. However, most of the population, which concentrates in urban areas, receives retail electric service from investor-owned utilities. Each entity has unique policies for pricing and buying power. Some of Missouri’s largest electric utilities are Ameren Corporation, Evergy and Empire District Electric Company. These utilities own the entire flow of electricity in their territories and also dictate electricity prices. As such, they are responsible for generating electricity, maintaining infrastructure, delivering electricity and providing billing to all residential and business customers. They are also governed by Missouri law that encourages renewable energy generation. Net metering encourages utilities to buy excess power generated by customers under 100 kw. The utilities also must buy renewable energy to comply with Missouri’s Renewable Energy Standard.

Exhibit 2.20. Missouri Electricity Utilities
Source: Missouri Public Service Commission (2019) Electricity differs from other commodities in that it cannot be easily stored. Thus, system capacity is as important as the quantity of electricity generated. The electrical load is the flow of electricity required at a specific point in time. Kilowatts are used to measure the system’s capacity, and kilowatt-hours indicate the amount of electricity that a system will generate or use in one hour. For example, a 1-kW generator that is running 100% of the time will generate 8,760 kWh in a year. Baseload electricity is electricity that is generated all the time. It includes electricity from a nuclear plant, which is hard to turn on and off. Peaking electricity is generated upon demand during periods when the load is highest. An electricity source with production that matches demand is a load-following resource. For example, a solar photovoltaic system is a load-following resource because its output increases at the same time that demand for air conditioning is highest. Priced in kWh, retail electricity prices include many components in addition to electricity generation charges: demand charges, standby charges, transmission and distribution charges and public purpose charges. Utilities can have multiple prevailing rates, so a biogas facility selling electricity may sell at different prices. Often, these are time-of-use tariffs that reflect different charges for different times. Missouri has some of the lowest electricity rates in the U.S. In the first half of 2020, residential electricity prices fluctuated around 25% lower than the U.S. average. See Exhibit 2.21. Commercial electricity rates were more than 20% below the national average, though industrial rates were closer to parity (EIA eia.gov/state/?sid=MO). Such low electricity price could impact biogas electricity to the extent that biogas electricity must compete.
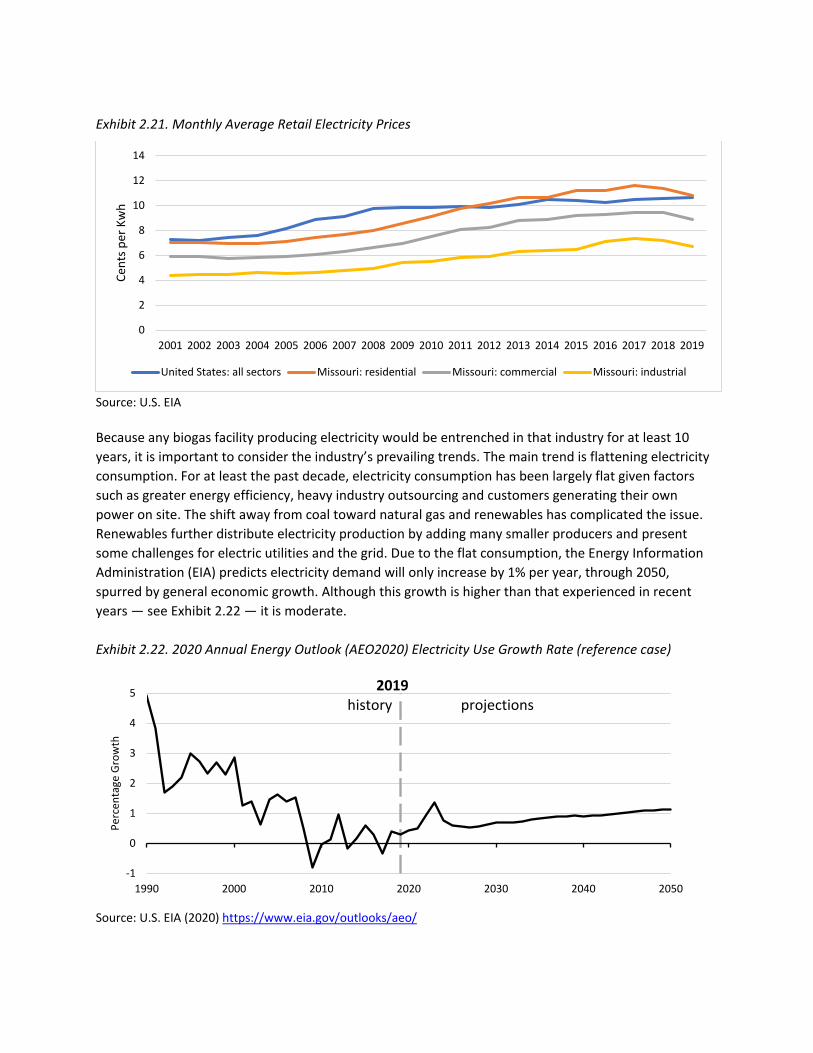
Exhibit 2.21. Monthly Average Retail Electricity Prices
Source: U.S. EIA Because any biogas facility producing electricity would be entrenched in that industry for at least 10 years, it is important to consider the industry’s prevailing trends. The main trend is flattening electricity consumption. For at least the past decade, electricity consumption has been largely flat given factors such as greater energy efficiency, heavy industry outsourcing and customers generating their own power on site. The shift away from coal toward natural gas and renewables has complicated the issue. Renewables further distribute electricity production by adding many smaller producers and present some challenges for electric utilities and the grid. Due to the flat consumption, the Energy Information Administration (EIA) predicts electricity demand will only increase by 1% per year, through 2050, spurred by general economic growth. Although this growth is higher than that experienced in recent years — see Exhibit 2.22 — it is moderate. Exhibit 2.22. 2020 Annual Energy Outlook (AEO2020) Electricity Use Growth Rate (reference case)
Source: U.S. EIA (2020) https://www.eia.gov/outlooks/aeo/
0
2
4
6
8
10
12
14
2001 2002 2003 2004 2005 2006 2007 2008 2009 2010 2011 2012 2013 2014 2015 2016 2017 2018 2019
Cent
s per
Kw
h
United States: all sectors Missouri: residential Missouri: commercial Missouri: industrial
-1
0
1
2
3
4
5
1990 2000 2010 2020 2030 2040 2050
Perc
enta
ge G
row
th
2019history projections

Increasingly, natural gas and renewable sources are predicted to fuel the growing electricity demand. The EIA forecasts that natural gas and solar generation will offset retiring coal and nuclear facilities. Wind generation continues but is overshadowed by solar. These trends of increasing generation efficiency, low fuel prices and weak demand growth coalesce into a net decline in electricity prices as predicted by the EIA. Exhibit 2.23 charts historical and projected prices. Exhibit 2.23. AEO2020 Average Electricity Price (reference case)
Source: U.S. EIA (2020) https://www.eia.gov/outlooks/aeo/ Market Implications for Biofuel Producers Selling “commodity” electricity is not particularly attractive in the next 10 years to 20 years. Falling prices and weak demand suggest a difficult market — further complicated by projected declines in the cost of electricity production using natural gas and other renewables. Biogas is not likely to benefit from technology improvements such as those that have facilitated solar and natural gas (i.e., fracking) industries. As such, it is difficult to assume that biogas will increase its relative cost competency. Missouri’s market for conventional electricity is not likely to differ significantly from that of the rest of the country. Missouri has a number of notable issues, however. For one, the state relies heavily on coal. This suggests that many of Missouri’s electric generation facilities may become less competitive in the future as other technologies become more desirable. As these facilities age, Missouri will likely transition to a new mix of fuel inputs. Natural gas seems likely, though Missouri is not a natural gas producer. Wind and solar are also likely. Other fuel sources, and distributed producers, may fill the gaps. Natural Gas Markets As biogas and natural gas are both composed of methane, the two gases inherently compete. In recent decades, natural gas production has risen considerably due to advances in horizontal drilling and hydraulic fracturing technology that launched the shale gas revolution roughly a decade ago. Although the once-tight oil production associated with western oil fields increased in the past 20 years, dry shale gas from eastern oilfields has contributed much more to total production. This led to a 60% increase in U.S. dry natural gas production since 2008 and an increase in new natural gas proved reserves (EIA). Exhibit 2.24 charts the trend in proved reserves.
8
9
10
11
12
2010 2020 2030 2040 2050
Cent
s Per
Kilo
wat
t Hou
r
2019history projections

Exhibit 2.24. U.S. Natural Gas Proved Reserves (Bcf)
Source: U.S. EIA eia.gov/dnav/ng/NG_ENR_DRY_DCU_NUS_A.htm Continued availability of natural gas reserves has informed forecasts of continued natural gas production into the foreseeable future. The EIA AEO2020 reference forecast predicts natural gas production to increase 1.9% per year from 2020 to 2050, which is slower than the 5.1%-per-year average growth rate from 2015 to 2020. See Exhibit 2.25. Exhibit 2.25. Historical and Projected U.S. Dry Natural Gas Production (reference case)
Source: U.S. EIA (2020) https://www.eia.gov/outlooks/aeo/ As natural gas production has increased, consumption has also grown. The bulk of this added consumption has originated from electricity generation as the industry moves from coal to natural gas. Other sectors, including the industrial and transportation sectors, have somewhat increased natural gas consumption. Additionally, natural gas exports have increased and allowed the U.S. to become a net exporter. Much of this gas leaves the U.S. via pipeline to Mexico, but Canada is another market served. In recent years, natural gas has increasingly been exported via ship as liquified natural gas.
-
50,000
100,000
150,000
200,000
250,000
300,000
350,000
400,000
450,000
500,000
1990
1991
1992
1993
1994
1995
1996
1997
1998
1999
2000
2001
2002
2003
2004
2005
2006
2007
2008
2009
2010
2011
2012
2013
2014
2015
2016
2017
2018
Bcf
05
101520253035404550
2000 2010 2020 2030 2040 2050
trillio
n cu
bic
feet
2019history projections

As suggested by the increasing exports, natural gas production has outpaced domestic consumption. This has resulted in relatively low prices compared with the two previous decades. Exhibit 2.26 shows the EIA AEO2020 predicts that prices will remain low and grow at a nominal rate. Exhibit 2.26. Historical and Projected Natural Gas Spot Prices at Henry Hub (reference case)
Source: U.S. EIA (2020) https://www.eia.gov/outlooks/aeo/ Relative to other states, Missouri ranks low in total and per capita natural gas consumption. Recently, Missouri’s consumption ranking has fallen as other states have increased consumption more quickly. The difference has been driven primarily by replacing coal-fired power plants with natural gas-fired plants to generate electricity. In Missouri, natural gas most commonly heats residential and commercial buildings. Half of Missouri households primarily heat with natural gas (U.S. EIA). The state’s commercial, electric power and industrial sectors each account for about one-fifth of natural gas consumption. Use of compressed natural gas for vehicle consumption, though small, has grown (U.S. EIA). Exhibit 2.27. Missouri Natural Gas Consumption (MMcf)
Source: U.S. EIA
0
2
4
6
8
10
12
2000 2010 2020 2030 2040 2050
2019
dol
lars
/mm
Btu
2019history projections
-
50,000
100,000
150,000
200,000
250,000
300,000
350,000
2019
2018
2017
2016
2015
2014
2013
2012
2011
2010
2009
2008
2007
2006
2005
2004
2003
2002
2001
2000
1999
1998
1997
MM
cf
Industrial Electric Power Commercial Residential Vehicle Fuel

Natural gas prices are reported at various places in the supply chain. The wellhead price is the price at the gas’ point of origin. In the West, this is the Henry Hub price. The city gate price is the price when the gas is delivered to the distributing gas utility from the natural gas pipeline or transmission facility. It incorporates the wellhead price and transportation to the city gate. A typical Missouri customer pays a retail price, which includes taxes, fees and delivery. Exhibit 2.28 charts the trend in Missouri natural gas prices. In Missouri, average natural gas prices have tended to be higher than the national average price in all sectors, though this is not always the case. Exhibit 2.28. Missouri Natural Gas Prices
Source: U.S. EIA Natural gas prices are an increasingly important component of electrical prices because a growing share of electricity comes from combusting natural gas. Wholesale prices for natural gas and electricity are correlative. At the retail level, prices have less correlation because of price regulation, hedging, market power, environmental permitting and other issues. Electricity cannot be stored, so prices respond to even small demand changes and make retail electricity prices far more volatile than natural gas prices. Other Energy Sources Biogas would likely compete with fuels other than natural gas. Household heating usage provides one example of how Missourians use various fuels. Although a majority of Missouri homes use natural gas and electricity for heating (87% of the 2018 total), many homes in 2018 used propane and wood. See Exhibit 2.29. Wood may be a low-cost fuel for some, and other homes may use wood or propane when natural gas is not available. In such cases, biogas could replace propane, which has a much higher retail price. Agricultural operations have often used propane for heating and grain drying. Accordingly, biogas may have small and situational opportunities to displace other fuels used within the state.
0
2
4
6
8
10
12
14
16
1967
1969
1971
1973
1975
1977
1979
1981
1983
1985
1987
1989
1991
1993
1995
1997
1999
2001
2003
2005
2007
2009
2011
2013
2015
2017
2019
$/M
cf
Citygate Retail: Commercial Retail: Residential Retail: Industrial

Exhibit 2.29. Sources of Household Heating in Missouri, 2018
Households Share Utility gas 1,218,643 50.1% Bottled, tank, or LP gas 213,759 8.8% Electricity 902,139 37.1% Fuel oil, kerosene, etc. 4,966 0.2% Coal or coke 882 0.0% Wood 77,808 3.2% Solar energy 870 0.0% Other fuel 9,010 0.4% No fuel used 6,729 0.3%
2,434,806 100% Source: U.S. Census Bureau (2018) House Heating Fuel Fertilizer Market Digestate’s most basic value is its use as a fertilizer. Thus, fertilizer markets are highly relevant to biogas operations. Although application on agricultural fields represents the most common digestate use, the material also has application in other markets, such as horticulture and residential gardening. Fertilizer demand is important, but fertilizer markets are increasingly regulated. As a result, fertilizer applications must be more precise — often limiting the amount of fertilizer applied. Recently, farmers began using precision technologies to match fertilizer use with crop needs. As such, they need a predictable and high-power fertilizer. Digestate can be leveraged to produce a fertilizer with the following characteristics to increase its value relative to its feedstock:
1) Transported and/or applied at less cost than the feedstock (i.e., manure) 2) Higher power fertilizer with improved nutrient availability 3) More consistent nutrient concentration and lower pathogen load
Regarding the first item, large animal operations can have a problem disposing manure at rates allowable by the U.S. EPA — that is, rates that match the manure’s nutrients to plant nutrient uptake. This often involves incurring added costs to haul manure across a larger area. In areas with a large number of CAFOs, availability of suitable land may be a significant constraint (Andersen 2017). Given this, an area's manure supply and demand dictate whether manure nutrients have positive value or negative value in the area. The maps in Exhibit 2.30 denote areas according to their nutrient supply. Darker green colors show areas with heavy fertilizer use, and brown colors show areas that produce more manure nutrients than nearby crops can use. To comply with environmental guidelines, areas experiencing the latter scenario would need to ship manure farther to areas that need the nutrients —and thus, incur higher transportation costs — or risk nutrient pollution by applying more manure than crops can use. Take Iowa as an example. It not only has a large supply of livestock but also a significant amount of cropland that can receive manure. In southwest Missouri and counties farther south, the significant poultry production generates more manure than the cropland can use (Spiegal et al. 2020). Farm operations in these geographies may be more likely to see manure as a liability. In such conditions, an anaerobic digester that could lower nutrient management or transportation costs would be valuable. In areas with high demand for fertilizer, digestate can add value to manure by making it easier to use.

Exhibit 2.30. Areas of Manure Nutrient Surplus and Deficit, 2012
Source: Spiegal et al. (2020) Anaerobic digestion only decomposes part of a feedstock’s organic compounds. The mineral part remains almost completely in the digestate. Due to its high plant-available nutrient content, digestate is an attractive organic fertilizer. Digestate has further advantages as decomposition significantly degrades volatile organic compounds and minimizes odor. Furthermore, the process largely breaks down organic acids, reduces pathogen counts and denatures weed seeds present in raw manure. In addition to these advantages, the digestate also contains humus-effective carbon, which improves soil fertility. Despite its advantages, digestate has several potential drawbacks that need to be considered in order to optimize the efficiency and environmental performance of biomass production systems. First, because the digestate’s nutrient composition depends on the feedstocks used, nutrient content can vary if using multiple feedstocks. Operations should monitor nutrient composition as plants can only be fertilized as required if the digestate’s nutrient content is known. That said, digestate is often better homogenized and more consistent than manure.

Digestate accumulates at biogas plants, and its high water content (>90%) often limits its storage and transportation potential. Given this, operations may separate the digestate’s liquid and solid fractions on site in order to reduce the water content and volume and increase transportability. The separated liquid fraction has high N (mainly in the form of plant-available ammonium) and potassium content and a total solids content less than 5% (Gutser et al. 2005). The solid fraction contains roughly 20% of the total N, a third of the total phosphorus, 15% of the potassium and up to 35% total solids (Vaneeckhaute et al. 2017). Therefore, when separating digestate’s liquid and solid fractions, the liquid fraction contains relatively more ammonium (NH4) and potassium (K2O), and the solid fraction contains relatively more phosphate (P2O5) and organic material. Because manure applications are often limited to the amount of P, separating solid and liquid portions may be a nutrient management strategy. Digestate liquid is likely to compete with manure. If further concentrated, then it may compete with higher value commercial fertilizers. Dried digestate is easier to transport and use. In summary, digestate retains much of the manure’s nutrients while enhancing its bioavailability, making it safer to use, possibly lowering transportation costs and offering options for tailoring nutrient profiles to crop needs. Fertilizer Value Fertilizer is an important input for farmers, and to the extent digestate can enhance a feedstock’s usability, it has ample market potential. Fertilizer, especially nitrogen, consumption has increased over time. In 2018, Missouri corn received roughly 170 pounds per acre compared with 80 pounds in the 1960s (USDA ERS, NASS). This fertilizer represents an increasingly large share of farmers’ production budgets. From 2009 to 2018, fertilizers represented 41% of a corn crop’s operating costs of production — by far the largest expense. See Exhibit 2.31. Exhibit 2.31. Share of Operating Costs in Corn Production
Source: USDA, ERS, Commodity Costs and Returns ers.usda.gov/data-products/commodity-costs-and-returns/ As fertilizer demand has strengthened, prices have increased. Fertilizer price increases through 2008 were largely driven by high energy prices and high input costs. In response to record fertilizer prices in
0%
10%
20%
30%
40%
50%
60%
70%
80%
90%
100%
2018
2017
2016
2015
2014
2013
2012
2011
2010
2009
2008
2007
2006
2005
2004
2003
2002
2001
2000
1999
1998
1997
1996
Fertilizer Seed Chemicals Repairs Fuel, lube, and electricity Other

2008, farmers reduced fertilizer use. Subsequently, fertilizer prices declined through 2010 but then recovered somewhat — driven by strong domestic demand for plant nutrients due to higher crop prices and limited domestic production capacity. Prices have since trended downward as crop prices have also declined. Lower energy prices (e.g. natural gas) have also facilitated this drop. Exhibit 2.32 shows the relationship between fertilizer and crop prices. Exhibit 2.32. Index of Fertilizer Prices Paid by Farmers and Prices Received for All Crops, 1990 to 2018
Source: USDA, ERS, Fertilizer Use and Price ers.usda.gov/data-products/fertilizer-use-and-price/ In summary, fertilizer value is meaningful. However, transportation costs lead to localized nutrient supply and demand conditions, which can complicate the ability to capitalize on that value. Moreover, the AD feedstock (e.g., manure) and digestate often have similar nutrient levels. Although digestate can increase the fertilizer value by increasing nutrient availability — and reducing odors and transport costs — those benefits are likely relatively small. Further processing can improve the digestate’s value. Digestate with Added Value An AD may increase digestate’s fertilizer value (i.e., relative to manure’s value) through a number of processing methods. Often, this processing involves some degree of concentrating a desired fraction of the digestate. Doing this reduces transportation costs and/or creates a higher value product. As more biogas facilities emerge and desire enhanced profitability, digestate markets will need to grow. Partial processing would reduce the digestate’s volume, but complete processing would refine digestate to pure water, a solid biofertilizer fraction and fertilizer concentrates (Drosg et al. 2015). Partial treatment is less energy-demanding, cheaper and generally the most economical. A partial treatment separates solids and liquid, and it is usually the first step in digestate processing, which divides digestate into a phosphorus-rich solid phase and a nitrogen-rich fluid phase. It aims to dewater the digestate and allows for handling nutrients separately. Solid-liquid separation decreases transport costs because water content declines. The processing also makes digestate storage and application simpler.
0
20
40
60
80
100
120
140
1990
1991
1992
1993
1994
1995
1996
1997
1998
1999
2000
2001
2002
2003
2004
2005
2006
2007
2008
2009
2010
2011
2012
2013
2014
2015
2016
2017
2018
Price Paid for Fertilizer Prices Received by Farmers for All Crops

Other processing technologies recover nutrients. They include combinations of composting, drying, ammonia stripping, evaporation and membrane filtration. Generally, they entail high investment costs, energy needs and maintenance costs, and they can involve large amounts of chemical reagents. Not only may processing digestate reduce transport, storage and application costs, but the potential revenue streams connected to value-added digestate can be even larger. Adding value to digestate focuses on creating products that enhance soil for farms, golf courses, home gardens and other users. The nutrients — the most important are nitrogen, phosphorous, potassium and sulfur — are separated and concentrated for sale in a liquid, pellet or dry format to create enhanced organic fertilizers. The fibers go mainly into products that improve soils’ ability to control moisture and nutrient release. Such products include peat moss, compost and potting soil. Other options include using the fiber to make plant boxes, land stabilization materials, pressboard for home construction or additives to strengthen plastics. In some cases, dried fiber has been pelletized for use as a fuel. Livestock Bedding After fertilizer, the second most common digestate use has been livestock bedding, especially for dairies. Making bedding generally involves separating solids to reduce moisture content to a storable, stackable level. Dairy bedding prices vary, and digestate must compete with other bedding options. Bedding is a significant cost for dairy operations. However, it is a relatively low-value product, and many AD operations may not have a need for livestock bedding or an opportunity to sell the bedding locally. The bedding’s price floor is likely set by traditional separated manure solids. Typically, manure solids are produced in a similar fashion to digestate solids, which are usually preferred due to the lower odor and pathogen load. Composting manure solids may manage these shortcomings at an added cost. Manure solids, however, are the least expensive bedding. Separation costs can be $100 per cow per year at moderate to small scale. For larger farms, cost may be as low as $60 per cow per year. The price ceiling for digestate solids may be set by sand, the most common bedding material. Sand can often be acquired for $150 per cow per year. Typical revenues calculated from offset savings range from $8 to $10 per wet cubic yard or $24 to $30 per wet ton, which is roughly $72 to $120 per cow per year. In areas with high bedding costs, this range is considerably higher. Dairy farms generally can use about 50% of the produced fiber internally (Jensen, Frear and Ma 2015). They can sell the remainder as bedding to nearby dairies, process it into other value-added products or simply use it as a soil amendment. The bedding market may be more limited in Missouri, where most livestock operations do not use bedding. Poultry operations, which typically use wood shavings, may use digestate as bedding, but they may face more complicated adoption compared with dairies. As such, though animal bedding revenues have been a major component of AD feasibility for many operations, that opportunity is not universal. Soil and Compost Separated digestate solids can be composted to further break down the solids. Composting can be accomplished through standard processes. The separated solids are stackable, and they have adequate moisture and a suitable C:N ratio (Alexander 2012).
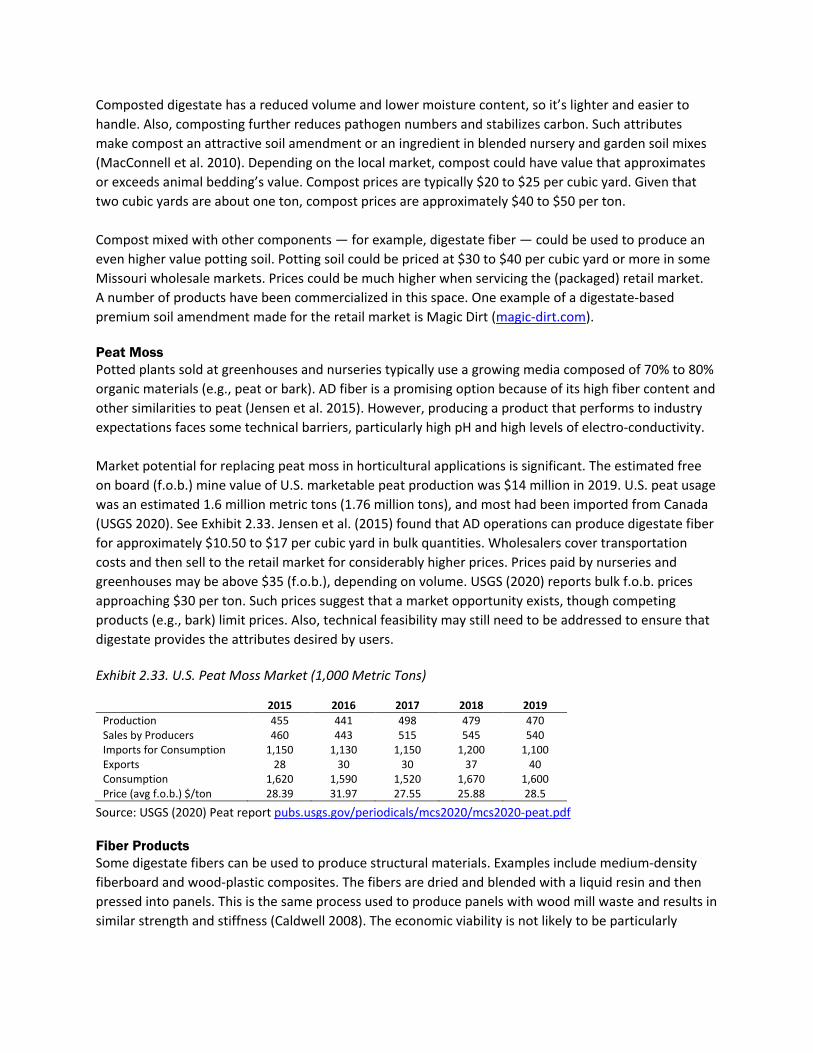
Composted digestate has a reduced volume and lower moisture content, so it’s lighter and easier to handle. Also, composting further reduces pathogen numbers and stabilizes carbon. Such attributes make compost an attractive soil amendment or an ingredient in blended nursery and garden soil mixes (MacConnell et al. 2010). Depending on the local market, compost could have value that approximates or exceeds animal bedding’s value. Compost prices are typically $20 to $25 per cubic yard. Given that two cubic yards are about one ton, compost prices are approximately $40 to $50 per ton. Compost mixed with other components — for example, digestate fiber — could be used to produce an even higher value potting soil. Potting soil could be priced at $30 to $40 per cubic yard or more in some Missouri wholesale markets. Prices could be much higher when servicing the (packaged) retail market. A number of products have been commercialized in this space. One example of a digestate-based premium soil amendment made for the retail market is Magic Dirt (magic-dirt.com). Peat Moss Potted plants sold at greenhouses and nurseries typically use a growing media composed of 70% to 80% organic materials (e.g., peat or bark). AD fiber is a promising option because of its high fiber content and other similarities to peat (Jensen et al. 2015). However, producing a product that performs to industry expectations faces some technical barriers, particularly high pH and high levels of electro-conductivity. Market potential for replacing peat moss in horticultural applications is significant. The estimated free on board (f.o.b.) mine value of U.S. marketable peat production was $14 million in 2019. U.S. peat usage was an estimated 1.6 million metric tons (1.76 million tons), and most had been imported from Canada (USGS 2020). See Exhibit 2.33. Jensen et al. (2015) found that AD operations can produce digestate fiber for approximately $10.50 to $17 per cubic yard in bulk quantities. Wholesalers cover transportation costs and then sell to the retail market for considerably higher prices. Prices paid by nurseries and greenhouses may be above $35 (f.o.b.), depending on volume. USGS (2020) reports bulk f.o.b. prices approaching $30 per ton. Such prices suggest that a market opportunity exists, though competing products (e.g., bark) limit prices. Also, technical feasibility may still need to be addressed to ensure that digestate provides the attributes desired by users. Exhibit 2.33. U.S. Peat Moss Market (1,000 Metric Tons)
2015 2016 2017 2018 2019 Production 455 441 498 479 470 Sales by Producers 460 443 515 545 540 Imports for Consumption 1,150 1,130 1,150 1,200 1,100 Exports 28 30 30 37 40 Consumption 1,620 1,590 1,520 1,670 1,600 Price (avg f.o.b.) $/ton 28.39 31.97 27.55 25.88 28.5
Source: USGS (2020) Peat report pubs.usgs.gov/periodicals/mcs2020/mcs2020-peat.pdf Fiber Products Some digestate fibers can be used to produce structural materials. Examples include medium-density fiberboard and wood-plastic composites. The fibers are dried and blended with a liquid resin and then pressed into panels. This is the same process used to produce panels with wood mill waste and results in similar strength and stiffness (Caldwell 2008). The economic viability is not likely to be particularly

encouraging, especially at smaller scales (Spelter et al. 2008). However, this is just one application. Other fiber products being considered include degradable plant pots, packing forms and golf tees. Market Analysis ADs have many potential configurations in terms of feedstocks utilized and products sold. A successful digester will locate in an area with an ample feedstock supply and ample demand for AD outputs. Determining an appropriate location is usually done on a case-by-case basis, where a business identifies a business opportunity. To evaluate areas in Missouri according to their potential business opportunities, Value Ag LLC conducted an inventory of markets in 2011/2012. The first stage of the inventory involved identifying feedstock options. Missouri has several industries that could supply feedstock. Exhibit 2.34 summarizes the feedstocks that various industries with a Missouri presence could direct to AD operations. Exhibit 2.34. Potential Missouri Digester Feedstock Sources

Second, the inventory analysis involved recognizing industries available to use biogas, digestate, heat and other digester co-products. By industry, Exhibit 2.35 presents possible needs for digester outputs. Exhibit 2.35 Potential Missouri Industries to Use or Purchase Digester Outputs*
* To date, biomethane only appears feasible in subsidized vehicle fuel markets; it is omitted from this analysis. As suggested, successful biogas operations tend to do more than generate and use or sell commodity biogas. They realize the value derived from sourcing high-quality inputs from nearby sources and capturing value from multiple revenue streams. The analysis conducted in 2011/2012 sought to determine optimal locations for operating anaerobic digesters in Missouri. To conduct the analysis, the

project team built a tool that would account for feedstock material generated by several key industries — most of those listed in the previous two exhibits — and these industries’ demand for digester co-products. The values inputted in the tool were index values that communicated two pieces of information: (1) the extent of an industry’s presence or absence in a given county and (2) the size of a particular industry in a given county. The index values would communicate industry presence or size in a given county relative to industry presence or size in an average Missouri county. The supply index values estimated feedstock material that a given industry in a given county could supply to a digester. The demand index values represented the degree to which an industry would demand digester co-products. Some index values had weights applied. Supply-side weights intended to account for feedstock quality, and demand-side weights intended to account for the strength of an industry’s demand for a particular co-product. After making the necessary adjustments to index values, those values were ranked from “1” to “115” for supply and demand. A “1” would indicate very strong industry presence in a particular county. In other words, the county would be more likely have good access to an industry’s feedstock material, and the industry’s businesses in that county would be more likely to strongly demand digester co-products. A “115” rank would signal relative lack of industry presence in a particular county. In other words, that county would likely to have poor access to feedstock material from an industry and weak industry demand for digester co-products. Exhibit 2.36 shades Missouri counties based on their projected potential for supporting a digester. The overall rank considers a county’s feedstock supply, primary demand based on electricity prices charged and secondary demand for co-products generated by a digester. Counties in the top 10 best prospects list were Jackson, Boone, St. Louis, Ste. Genevieve, Franklin, Audrain, Lafayette, Clay, Callaway and Stoddard counties. Note, this analysis used data and conditions applicable to the early 2010s, and some variables — and consequently, county ranks — may have changed since this analysis was completed. The project team, however, estimates only minor changes may have occurred, and counties labeled as strong or weak candidates in this analysis likely have similar conditions today.

Exhibit 2.36. 2011/2012 Estimation of Best Digester Location Prospects by County
Source: Value Ag LLC (2012) Biomass Co-Products Marketing Study

3. POLICY Although electricity, methane and digestate are a digester’s primary outputs to sell, environmental and governmental incentives can affect an operation’s revenues. These incentives can take multiple forms ultimately intending to increase social welfare. Although some incentives may target increasing jobs and economic activity, the target is usually environmental benefits. This section shares common policy incentives for AD operators: 1) production incentives, 2) tax incentives (production- or investment-based), 3) loans and grants, 4) net metering and 5) renewable fuel standards. Exhibit 3.1 summarizes which of these policies are relevant to the electricity produced via CHP and which are relevant to biomethane (used in vehicle fuels). Exhibit 3.1 Policies Relevance to ADs Producing Electricity or Biomethane
* Private includes utilities or corporate entities. Feed-in Tariffs or Production Incentives Used to a limited extent in the U.S., feed-in tariffs (FITs) are a policy mechanism used commonly in Europe and elsewhere internationally. For example, a FIT program typically guarantees that customers who own a FIT-eligible renewable electricity generation facility will receive a set price from their utility for all electricity they generate and provide to the grid. Generally, the government mandates that utilities enter into long-term contracts with generators at specified rates — typically well above the electricity retail price. In the U.S., a few states have enacted such programs. However, a different model has also emerged in which utilities independently establish a utility-level FIT either voluntarily or in response to state or local government mandates. Tax Credits Tax credits are dollar-for-dollar reductions in a company's tax liability. State and federal governments use tax credits to encourage activities they deem beneficial. The tax credits most common for renewable energy projects are investment tax credits and production tax credits.
• Investment Tax Credit: An investment tax credit provides a direct tax rebate of a certain percentage of the investment in a qualified asset or business. The tax credit takes the form of a
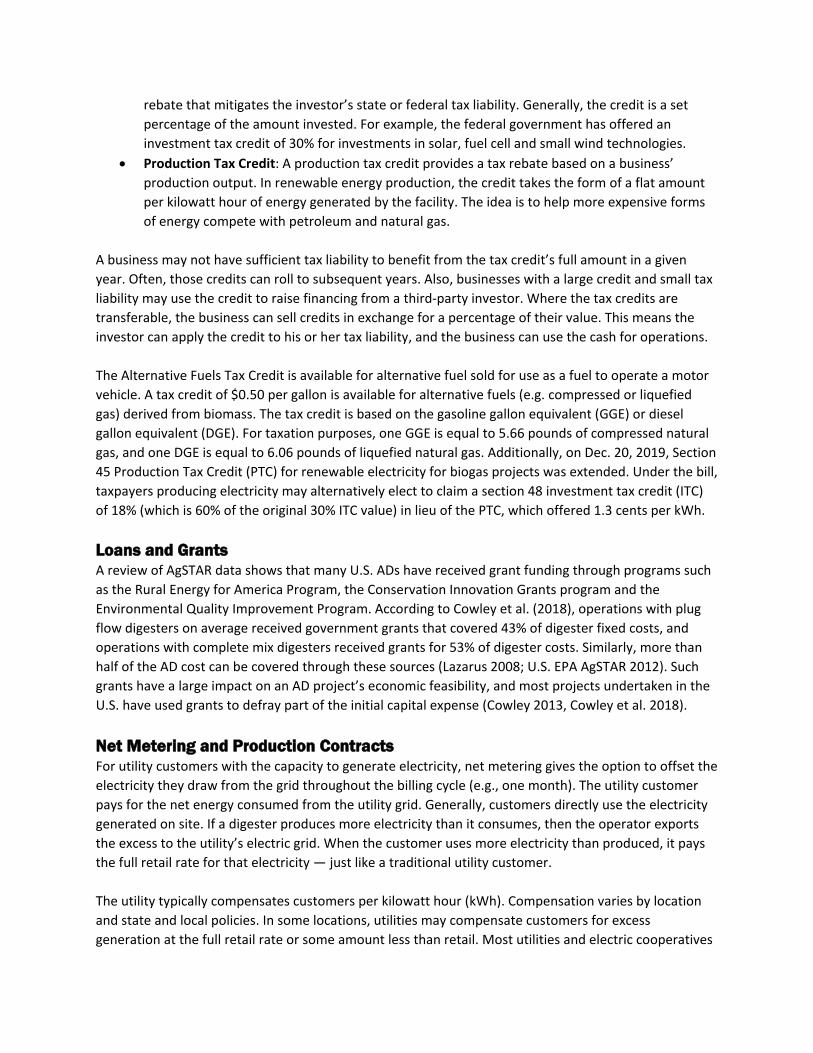
rebate that mitigates the investor’s state or federal tax liability. Generally, the credit is a set percentage of the amount invested. For example, the federal government has offered an investment tax credit of 30% for investments in solar, fuel cell and small wind technologies.
• Production Tax Credit: A production tax credit provides a tax rebate based on a business’ production output. In renewable energy production, the credit takes the form of a flat amount per kilowatt hour of energy generated by the facility. The idea is to help more expensive forms of energy compete with petroleum and natural gas.
A business may not have sufficient tax liability to benefit from the tax credit’s full amount in a given year. Often, those credits can roll to subsequent years. Also, businesses with a large credit and small tax liability may use the credit to raise financing from a third-party investor. Where the tax credits are transferable, the business can sell credits in exchange for a percentage of their value. This means the investor can apply the credit to his or her tax liability, and the business can use the cash for operations. The Alternative Fuels Tax Credit is available for alternative fuel sold for use as a fuel to operate a motor vehicle. A tax credit of $0.50 per gallon is available for alternative fuels (e.g. compressed or liquefied gas) derived from biomass. The tax credit is based on the gasoline gallon equivalent (GGE) or diesel gallon equivalent (DGE). For taxation purposes, one GGE is equal to 5.66 pounds of compressed natural gas, and one DGE is equal to 6.06 pounds of liquefied natural gas. Additionally, on Dec. 20, 2019, Section 45 Production Tax Credit (PTC) for renewable electricity for biogas projects was extended. Under the bill, taxpayers producing electricity may alternatively elect to claim a section 48 investment tax credit (ITC) of 18% (which is 60% of the original 30% ITC value) in lieu of the PTC, which offered 1.3 cents per kWh. Loans and Grants A review of AgSTAR data shows that many U.S. ADs have received grant funding through programs such as the Rural Energy for America Program, the Conservation Innovation Grants program and the Environmental Quality Improvement Program. According to Cowley et al. (2018), operations with plug flow digesters on average received government grants that covered 43% of digester fixed costs, and operations with complete mix digesters received grants for 53% of digester costs. Similarly, more than half of the AD cost can be covered through these sources (Lazarus 2008; U.S. EPA AgSTAR 2012). Such grants have a large impact on an AD project’s economic feasibility, and most projects undertaken in the U.S. have used grants to defray part of the initial capital expense (Cowley 2013, Cowley et al. 2018). Net Metering and Production Contracts For utility customers with the capacity to generate electricity, net metering gives the option to offset the electricity they draw from the grid throughout the billing cycle (e.g., one month). The utility customer pays for the net energy consumed from the utility grid. Generally, customers directly use the electricity generated on site. If a digester produces more electricity than it consumes, then the operator exports the excess to the utility’s electric grid. When the customer uses more electricity than produced, it pays the full retail rate for that electricity — just like a traditional utility customer. The utility typically compensates customers per kilowatt hour (kWh). Compensation varies by location and state and local policies. In some locations, utilities may compensate customers for excess generation at the full retail rate or some amount less than retail. Most utilities and electric cooperatives
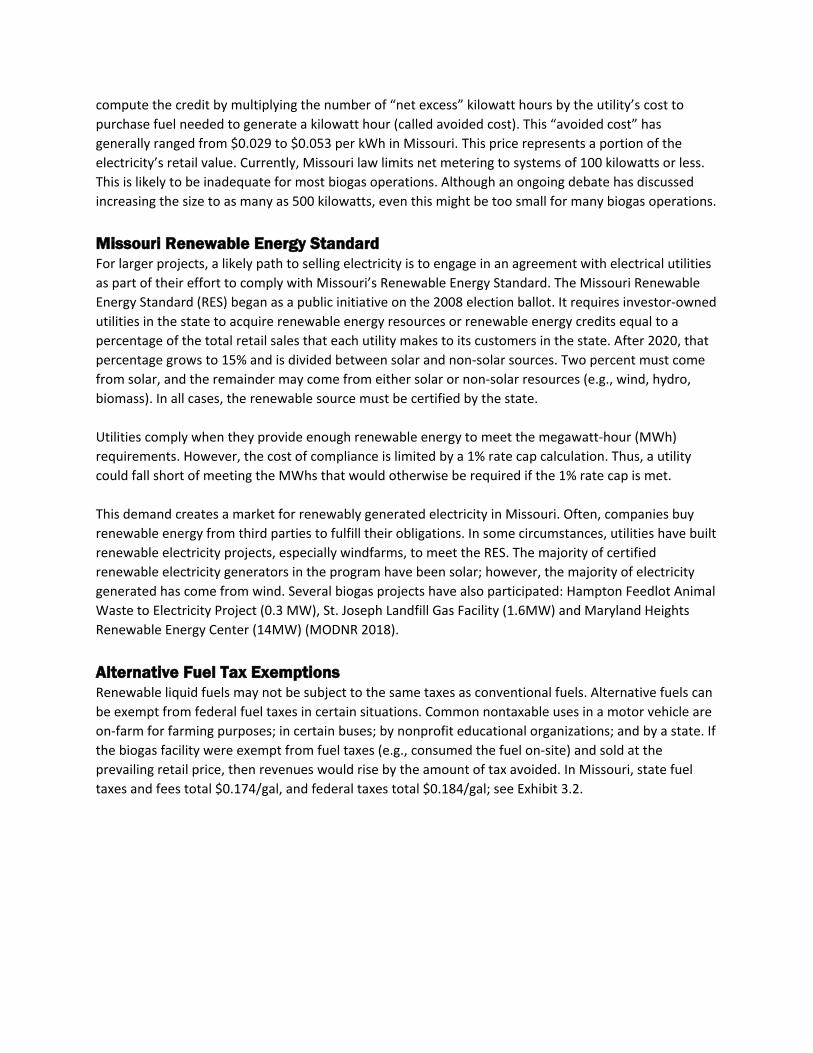
compute the credit by multiplying the number of “net excess” kilowatt hours by the utility’s cost to purchase fuel needed to generate a kilowatt hour (called avoided cost). This “avoided cost” has generally ranged from $0.029 to $0.053 per kWh in Missouri. This price represents a portion of the electricity’s retail value. Currently, Missouri law limits net metering to systems of 100 kilowatts or less. This is likely to be inadequate for most biogas operations. Although an ongoing debate has discussed increasing the size to as many as 500 kilowatts, even this might be too small for many biogas operations.
Missouri Renewable Energy Standard For larger projects, a likely path to selling electricity is to engage in an agreement with electrical utilities as part of their effort to comply with Missouri’s Renewable Energy Standard. The Missouri Renewable Energy Standard (RES) began as a public initiative on the 2008 election ballot. It requires investor-owned utilities in the state to acquire renewable energy resources or renewable energy credits equal to a percentage of the total retail sales that each utility makes to its customers in the state. After 2020, that percentage grows to 15% and is divided between solar and non-solar sources. Two percent must come from solar, and the remainder may come from either solar or non-solar resources (e.g., wind, hydro, biomass). In all cases, the renewable source must be certified by the state. Utilities comply when they provide enough renewable energy to meet the megawatt-hour (MWh) requirements. However, the cost of compliance is limited by a 1% rate cap calculation. Thus, a utility could fall short of meeting the MWhs that would otherwise be required if the 1% rate cap is met. This demand creates a market for renewably generated electricity in Missouri. Often, companies buy renewable energy from third parties to fulfill their obligations. In some circumstances, utilities have built renewable electricity projects, especially windfarms, to meet the RES. The majority of certified renewable electricity generators in the program have been solar; however, the majority of electricity generated has come from wind. Several biogas projects have also participated: Hampton Feedlot Animal Waste to Electricity Project (0.3 MW), St. Joseph Landfill Gas Facility (1.6MW) and Maryland Heights Renewable Energy Center (14MW) (MODNR 2018). Alternative Fuel Tax Exemptions Renewable liquid fuels may not be subject to the same taxes as conventional fuels. Alternative fuels can be exempt from federal fuel taxes in certain situations. Common nontaxable uses in a motor vehicle are on-farm for farming purposes; in certain buses; by nonprofit educational organizations; and by a state. If the biogas facility were exempt from fuel taxes (e.g., consumed the fuel on-site) and sold at the prevailing retail price, then revenues would rise by the amount of tax avoided. In Missouri, state fuel taxes and fees total $0.174/gal, and federal taxes total $0.184/gal; see Exhibit 3.2.
Exhibit 3.2. Liquid Fuel Taxes
Source: EIA The Missouri Alternative Fuel Tax establishes tax rates for compressed natural gas (CNG) and liquefied natural gas (LNG), which would apply to biomethane. Compressed natural gas used as a vehicle fuel is taxed on a gasoline gallon equivalent (GGE) basis as follows:
• $0.05 per GGE until Dec. 31, 2019; • $0.11 per GGE from Jan. 1, 2020, until Dec. 31, 2024; and • $0.17 per GGE from Jan. 1, 2025, and beyond.
LNG used as a vehicle fuel is taxed on a diesel gallon equivalent (DGE) basis as follows: • $0.05 per DGE until Dec. 31, 2019; • $0.11 per DGE from Jan. 1, 2020, until Dec. 31, 2024; and • $0.17 per DGE from Jan. 1, 2025, and beyond.
Renewable and Low-Carbon Fuel Incentives The U.S. government has policies to encourage renewable fuels use. Additionally, states have individually enacted similar policies —most notably, the California Low Carbon Fuel Standard (LCFS). Since California enacted the LCFS, other states have followed suit. Oregon has enacted a similar policy. Other states including Washington, New York and Colorado are considering similar proposals. Prompting these policies and incentives is a key environmental concern — greenhouse gas (GHG) emissions. Greenhouse gas refers to any gaseous compound in the atmosphere capable of absorbing infrared radiation and trapping and holding heat in the atmosphere. By increasing the heat in the atmosphere, greenhouse gases create the greenhouse effect, which ultimately leads to global warming. In 2018, U.S. greenhouse gas emissions totaled 6,677 million metric tons of carbon dioxide equivalents or 5,903 million metric tons of carbon dioxide equivalents after accounting for sequestration from the land sector (U.S. EPA 2020). The majority of emissions were from carbon dioxide; the second largest volume originated from methane. Methane is more effective at trapping heat than carbon dioxide with 25 to 34 times the warming potential over 100 years (Myhre et al. 2013). After adjusting for the relatively large per-unit impact of methane, it accounts for 10% of U.S. greenhouse gas emissions.
$0.
$0.1
$0.2
$0.3
$0.4
$0.5
$0.6
Average state Missouri Average state Missouri
Gasoline Diesel
Dolla
rs P
er G
allo
n
Total State Total Federal
Large shares of methane gas emissions in 2018 originated from the enteric fermentation of animals (28%) and natural gas and petroleum systems (28%). Landfills (17%) and manure management (10%) were also significant contributors (Hockstad and Hanel 2018). See Exhibit 3.3. When capturing biogas from livestock and landfills, methane that would enter the atmosphere converts to less potent carbon dioxide when combusted. In this way, biogas production and use can lower GHG emissions on a life-cycle basis relative to managing wet-waste feedstocks in their usual way. Exhibit 3.3. 2018 Sources of GHG and Methane Emissions
Source: U.S. EPA (2020) Inventory of US GHG Emissions and Sinks: 1990-2018 epa.gov/ghgemissions/overview-greenhouse-gases#methane Renewable Fuel Standard The Renewable Fuel Standard (RFS) is a federal program that requires transportation fuel sold in the U.S. to contain a minimum volume of renewable fuels. It originated with the Energy Policy Act of 2005, and the Energy Independence and Security Act (EISA) of 2007 expanded and extended it. The U.S. EPA administers the RFS program and establishes volume requirements for each fuel type. The RFS requires blending renewable fuel into transportation fuel in increasing amounts each year and escalating to a target of 36 billion gallons by 2022. Each renewable fuel category in the RFS program must emit lower levels of GHGs relative to the petroleum fuel it replaces. Exhibit 3.4a shows the target volumes of renewable fuels to be produced, which determines the renewable volume obligation. Target volumes adjust each year to reflect market conditions. This has resulted in more modest blending requirements; see Exhibit 3.4b. Many factors contributed to this. In the case of cellulosic fuel, it has been difficult to cost-effectively generate the fuel with anticipated technologies.
81%7%
3%
10%
GHG: Emissions (CO2eq)
Carbon Dioxid Nitrous Oxide
Flourinated Gases Methane
8%
10%
17%
28%
28%
9%
Methane: Sources
Coal Mining Manure Landfills
Fuel Production Livestock Other
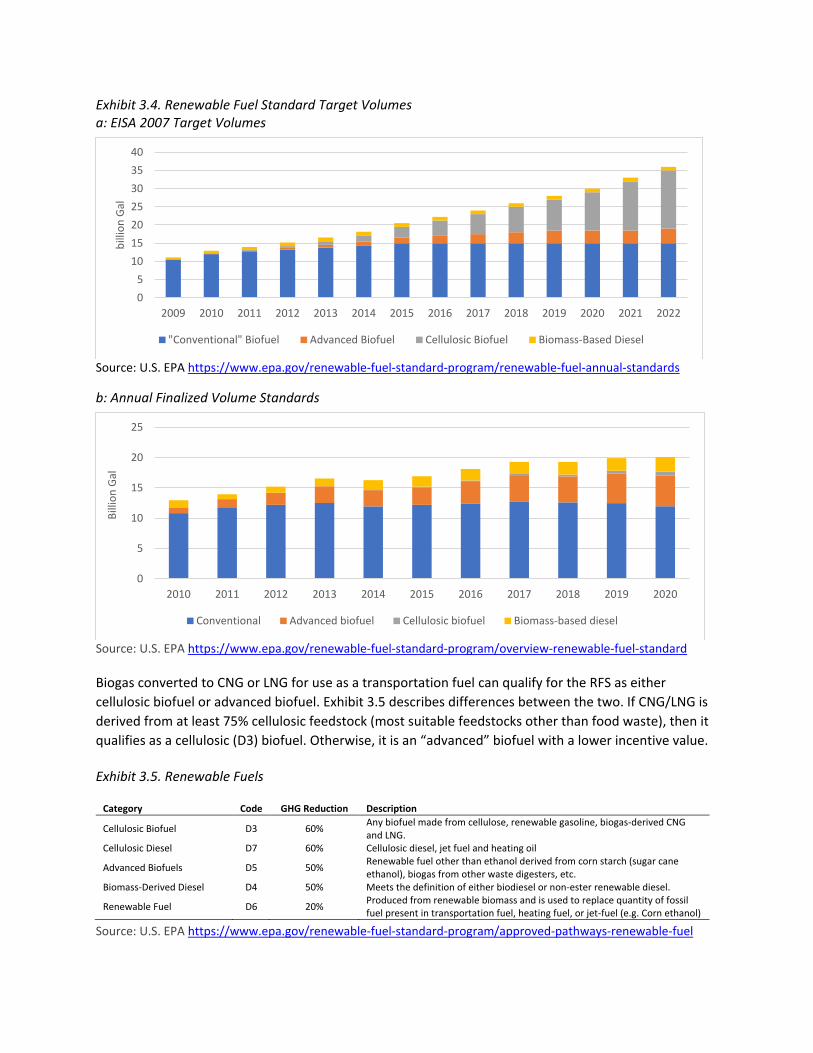
Exhibit 3.4. Renewable Fuel Standard Target Volumes a: EISA 2007 Target Volumes
Source: U.S. EPA https://www.epa.gov/renewable-fuel-standard-program/renewable-fuel-annual-standards
b: Annual Finalized Volume Standards
Source: U.S. EPA https://www.epa.gov/renewable-fuel-standard-program/overview-renewable-fuel-standard Biogas converted to CNG or LNG for use as a transportation fuel can qualify for the RFS as either cellulosic biofuel or advanced biofuel. Exhibit 3.5 describes differences between the two. If CNG/LNG is derived from at least 75% cellulosic feedstock (most suitable feedstocks other than food waste), then it qualifies as a cellulosic (D3) biofuel. Otherwise, it is an “advanced” biofuel with a lower incentive value. Exhibit 3.5. Renewable Fuels
Category Code GHG Reduction Description
Cellulosic Biofuel D3 60% Any biofuel made from cellulose, renewable gasoline, biogas-derived CNG and LNG.
Cellulosic Diesel D7 60% Cellulosic diesel, jet fuel and heating oil
Advanced Biofuels D5 50% Renewable fuel other than ethanol derived from corn starch (sugar cane ethanol), biogas from other waste digesters, etc.
Biomass-Derived Diesel D4 50% Meets the definition of either biodiesel or non-ester renewable diesel.
Renewable Fuel D6 20% Produced from renewable biomass and is used to replace quantity of fossil fuel present in transportation fuel, heating fuel, or jet-fuel (e.g. Corn ethanol)
Source: U.S. EPA https://www.epa.gov/renewable-fuel-standard-program/approved-pathways-renewable-fuel
05
10152025303540
2009 2010 2011 2012 2013 2014 2015 2016 2017 2018 2019 2020 2021 2022
billi
on G
al
"Conventional" Biofuel Advanced Biofuel Cellulosic Biofuel Biomass-Based Diesel
0
5
10
15
20
25
2010 2011 2012 2013 2014 2015 2016 2017 2018 2019 2020
Billi
on G
al
Conventional Advanced biofuel Cellulosic biofuel Biomass-based diesel

Entities regulated by the RFS include oil refiners and gasoline and diesel importers. The volumes required of an obligated party are based on a percentage of its petroleum product sales. EPA tracks compliance through the Renewable Identification Number (RIN) system, which assigns a RIN to each gallon of renewable fuel. Obligated parties can meet their renewable volume obligations by selling required biofuels volumes or purchasing RINs from parties that exceed their requirements. Failure to meet requirements results in a significant fine. Because RINS can be bought and sold, their prices may fluctuate. If a biogas facility creates qualifying renewable fuels, then it will be issued RINs to sell to obligated parties at the prevailing market price. Exhibit 3.6 shows the value of RINs over time. As shown, a (cellulosic D3) RIN might be valued at $1.00 to $1.25. Likewise, an (Advanced D5) RIN might be worth $0.50. Exhibit 3.6. Historical RIN Prices
Source: U.S. EPA epa.gov/fuels-registration-reporting-and-compliance-help/rin-trades-and-price-information The process starts with converting a feedstock into biogas via a digester or landfill gas capture. That gas is then upgraded to meet renewable natural gas specifications and compressed. Next, a gas off-taker, such as a fueling company, purchases the RIN. With the help of a RIN validation partner, who provides quality assurance and control, the RIN is retired, and the natural gas is transferred to a gas filling station or a natural gas-fueled vehicle. RINS can be separated from the fuel unit, which allows for injecting biomethane into the national pipeline and selling the RIN to any buyer. The buyer would then “attach” the RIN to any natural gas used for vehicle fuel. In July 2014, EPA changed RNG’s treatment under the RFS. Following the change, RNG production increased from 33 million ethanol-equivalent gallons in 2014 to 404 million ethanol-equivalent gallons in 2019, and it constituted 98% of all cellulosic RINs generated for policy compliance (U.S. Environmental Protection Agency, 2020) Exhibit 3.7 shows the number of RINS generated via biogas through 2019. Landfills produce a majority of that biogas. A small share comes from agricultural digesters.
0
0.5
1
1.5
2
2.5
3
Jul-2
010
Oct
-201
0Ja
n-20
11Ap
r-20
11Ju
l-201
1O
ct-2
011
Jan-
2012
Apr-
2012
Jul-2
012
Oct
-201
2Ja
n-20
13Ap
r-20
13Ju
l-201
3O
ct-2
013
Jan-
2014
Apr-
2014
Jul-2
014
Oct
-201
4Ja
n-20
15Ap
r-20
15Ju
l-201
5O
ct-2
015
Jan-
2016
Apr-
2016
Jul-2
016
Oct
-201
6Ja
n-20
17Ap
r-20
17Ju
l-201
7O
ct-2
017
Jan-
2018
Apr-
2018
Jul-2
018
Oct
-201
8Ja
n-20
19Ap
r-20
19Ju
l-201
9O
ct-2
019
D3 D4 D5 D6

Exhibit 3.7. Biogas RNG RINS Produced
Source: U.S. EPA epa.gov/fuels-registration-reporting-and-compliance-help/rins-generated-transactions California’s Low-Carbon Fuel Standard California and Oregon both manage market-based low-carbon fuel standards (LCFS). These standards help to drive RNG production. California’s LCFS, which took effect in 2011, requires reducing the average carbon intensity of transportation fuels sold in the state to 10% below 2010 levels by 2020 (California Air Resources Board). This reduction was successfully reached in 2016. Oregon began fully implementing a similar program in 2016 that will reduce the average carbon intensity of the state’s transportation fuels by 10% below 2015 levels by 2025 (Oregon Department of Environmental Quality). At its most basic level, the LCFS works similarly to RINs by attaching a credit to fuel. Credits under these programs are generated according to the life-cycle carbon intensities of fuels certified by the California Air Resources Board (CARB) and sold in the state. The LCFS value is associated with the carbon that the fuel keeps out of the atmosphere. To accomplish this, each fuel producer conducts an audit to determine its fuel’s carbon intensity (CI) compared with a baseline (i.e., conventional gasoline fuel) (CARBOB). The difference between CIs determines the LCFS credit’s value to the fuel producer. Exhibit 3.8 summarizes all CI values certified for the LCFS. It shows the relative magnitude of CO2 reductions possible. CARBOB at roughly 100 represents the emissions associated with commodity gasoline. In the case of most fuels, the relative greenhouse emissions are moderate and seldom drop below zero. For example, ethanol and biodiesel — the two most common renewable fuels — have average CIs of roughly one-third to two-thirds of gasoline, respectively. On the other hand, biogas has an intensity lower than -400 to 100. Landfill gas facilities, though the most common, tend to have the highest CI of biogas operations. Wastewater treatment facilities follow. Operations that keep waste (e.g., food waste) out of landfills can have negative CIs, but those digesting manure have the lowest Cis — on average below -200 (California Air Resources Board).
-
50.0
100.0
150.0
200.0
250.0
300.0
350.0
400.0
450.0
2014 2015 2016 2017 2018 2019
Mill
ion
RIN
S
Biogas from agricultural digesters Biogas from landfills Biogas from WWTF

Exhibit 3.8. Carbon Intensity Values of Current Certified Pathways, 2020
Source: CARB ww3.arb.ca.gov/fuels/lcfs/fuelpathways/pathwaytable.htm Operations in Missouri have obtained certified LCFS pathways through the CARB. The operations associated with Roeslein and Smithfield — see this report’s fifth section for more about these two projects — have certified three pathways for each of their operations. In summary, the gas they generate from swine manure enters the national pipeline in Missouri. From there, it is either used in California as CNG or liquified in Arizona and trucked to California for final use. Interestingly, two of the AD sites plan to truck the bio-CNG from the farm to the pipeline injection point. These pathways yield carbon intensities as low as -372 (CARB). Consider an example of a pathway where RNG is generated from digesting dairy manure and assigned a CI of -250 gCO2e/MJ. Compared with the CARB assigned average CI of 82.87 for diesel, the project will generate LCFS credits based on the -332.87-point differential. Using a pathway with an extremely low, or negative, CI value generates more LCFS credits, which can then be traded on the open market. Exhibit 3.9 shows LCFS credit prices over time. They were roughly $198 in 2019.

Exhibit 3.9. LCFS Weekly Average Credit Price ($/MT)
Source: CARB ww3.arb.ca.gov/fuels/lcfs/credit/lrtweeklycreditreports.htm Working through an environmental credit value calculation serves as an instructive example. Consider an operation capable of producing 133,786 MMBtu of upgraded biomethane (roughly 6,690 dairy cows). If the operation injected biomethane into the national pipeline as a commodity natural gas at about $2.50 MMBtu, then it would annually earn $334,465 in revenue. It would need to cover the costs of anaerobic digestion, biogas cleaning, biogas upgrading, compression and injection into the national grid. This same gas can also generate D3 RINs; assume they trade at $0.91. The operation would generate 1.64 million RINs per year totaling $1.5 million. This equates to $11.18 per MMBtu. In addition to the RIN, it is possible to generate LCFS credits. The biogas producer would need to enter into a contract with a California user that would buy the credits and have the biogas process evaluated as to its CI. Likely, net CI would be close to -300 under current guidance. Assuming LCF credits trade at $198 and the operation would generate 41,808 credits, the total revenue to the operation would be $8.2 million. This means a value of $61.88 per MMBtu. Combining these three value streams, a biogas facility might sell a MMBtu of biomethane for as much as $75.55, which is a large premium relative to the $2.50 commodity value. Selling environmental credits involves significant transaction costs, and because the example does not account for them, it is likely to dramatically overestimate the benefit to the biogas producer. However, the market opportunity is significant and has attracted attention of numerous operations. As with all “significant opportunities,” the potential value will likely erode as more producers enter the market and incentive prices decline.
0
50
100
150
200
2505/
2/20
16
7/2/
2016
9/2/
2016
11/2
/201
6
1/2/
2017
3/2/
2017
5/2/
2017
7/2/
2017
9/2/
2017
11/2
/201
7
1/2/
2018
3/2/
2018
5/2/
2018
7/2/
2018
9/2/
2018
11/2
/201
8
1/2/
2019
3/2/
2019
5/2/
2019
7/2/
2019
9/2/
2019
11/2
/201
9
1/2/
2020
3/2/
2020
5/2/
2020
Dolla
rs
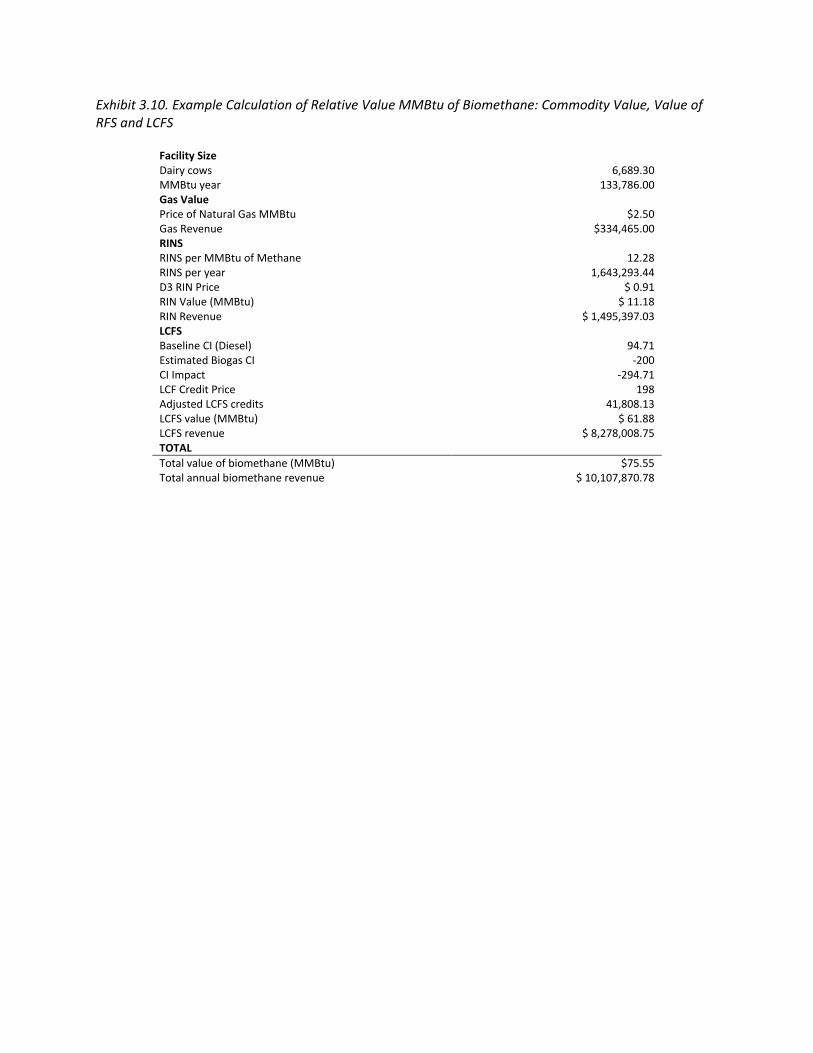
Exhibit 3.10. Example Calculation of Relative Value MMBtu of Biomethane: Commodity Value, Value of RFS and LCFS
Facility Size Dairy cows 6,689.30 MMBtu year 133,786.00 Gas Value Price of Natural Gas MMBtu $2.50 Gas Revenue $334,465.00 RINS RINS per MMBtu of Methane 12.28 RINS per year 1,643,293.44 D3 RIN Price $ 0.91 RIN Value (MMBtu) $ 11.18 RIN Revenue $ 1,495,397.03 LCFS Baseline CI (Diesel) 94.71 Estimated Biogas CI -200 CI Impact -294.71 LCF Credit Price 198 Adjusted LCFS credits 41,808.13 LCFS value (MMBtu) $ 61.88 LCFS revenue $ 8,278,008.75 TOTAL Total value of biomethane (MMBtu) $75.55 Total annual biomethane revenue $ 10,107,870.78

4. ECONOMICS This economics section considers the costs of technologies described earlier and compares them to market opportunities outlined above. Cost assumptions can vary considerably across projects. This section reports multiple perspectives about costs for biogas and biomethane production and utilization systems. Comparing biogas production costs to prevailing energy prices gauges how biogas performs economically. This approach suggests biogas production’s competitiveness before accounting for tax credits, co-product revenues or other incentives. Based on this basic cost-benefit analysis, this section then considers biogas production feasibility, which depends on a particular operation’s configuration and market situation. As generalization dilutes the value of that assessment, a literature review of feasibility studies 1) confirms cost/benefit analysis findings and 2) provides more insight into operations deemed feasible or infeasible. Last, this section includes a representative simulation model used to compare various operational configurations using assumptions relevant to the Missouri market. The simulation allows for further testing of how biogas operations might perform in Missouri. Note, for consistency purposes, this analysis uses MMBtu as the common unit of energy. Kw and KWh measure electricity. Where possible, costs are reported in these units. Capital Costs Capital costs are upfront investment costs incurred for facilities and equipment. The section below indicates what specific technologies might cost to implement. Note, scale economies are likely to play a large role in biogas operation feasibility. Smaller operations work in some situations, but larger facilities are likely to perform better, especially where the primary output is biomethane or electricity for sale. Anaerobic Digestion Despite AD’s benefits, these systems have significant capital costs, which are commonly cited as the main hindrance to economic feasibility (Kruger et al. 2008; Lazarus and Rudstrom 2007; Stokes, Rajagopalan and Stefanou 2008; Bishop and Shumway 2009; Wang et al. 2011; DeVuyst et al. 2011). Accordingly, capital costs have considerable importance. Fortunately, a large body of literature looks at anaerobic digestion’s cost for a relatively wide range of operational configurations. For manure-based systems, a number of studies have attempted to synthesize the digester costs using the following equations2, which are based largely on data from the U.S. EPA AgSTAR database.
Plug flow capital costs (digester): Y = 617x + 566,006 Lagoon, dairy (digester): Y= 400x + $599,566 Lagoon, swine (digester): Y = 124x + 599,566 Compete mix, dairy Y = 563x + 320,864
2 This report uses methodology from Lazarus, W. (2008), Murray, B., Galik, C., & Vegh, T. (2014). A significant source of the data came from Biggar, S., Man, D., Moffroid, K., Pape, D., Riley-Gilbert, M., Steele, R., & Thompson, V. (2013) and the AgStar database.

These equations suggest operations have meaningful cost differences, and each operation has a unique cost structure. Based on the equations, anaerobic digester and generator capital costs for each operation size were calculated for various livestock operations and sizes (Biggar et al. 2013). Exhibit 4.1 shares the results and illustrates significant economies of scale. As noted, capital costs are high until the operation has more than 1,500 dairy cows. However, even then, operations capture meaningful scale economies, especially for complete mix and plug flow digesters. Note, one dairy cow is roughly equivalent to 3.6 head of swine, so a 1,000-cow digester is roughly equivalent to a 3,600-hog operation in terms of animal units (USDA NRCS). Even when the scales are set to parity, swine operations tend to have somewhat higher costs, due in part to the more dilute nature of most manure systems. Covered lagoons also tend to have higher costs likely due to the size needed to hold dilute manure for a longer time. Exhibit 4.1. Capital Cost (Digester and Genset) Per MMBtu Produced Annually by Number of Livestock
Source: Biggar et al. (2013) Capital costs include the cost of the genset, as AD are typically built with a CHP system in place to create heat and power (AgSTAR database). However, not all facilities — including those that produce biomethane—may integrate that equipment into the facility design. A facility may choose to forgo such equipment altogether or only install a boiler to heat the digester when necessary. Studies suggest that CHP systems can represent 36% of a biogas facility’s capital costs (Faulhaber et al. 2012). Accordingly, adjusting capital expenses by this amount would be appropriate when considering alternative technologies — each of which has unique scale economies. Combined Heat and Power Costs
-
100.0
200.0
300.0
400.0
500.0
600.0
700.0
0 1000 2000 3000 4000 5000 6000
Capi
tal $
/mm
Btu
HeadDairy Covered Lagoon Swine Covered Lagoon Dairy Complete MixSwine Complete Mix Beef feedlot Complete Mix Dairy Plug FlowSwine Plug Flow Power (Swine Covered Lagoon) Power (Dairy Complete Mix)Power (Dairy Plug Flow)
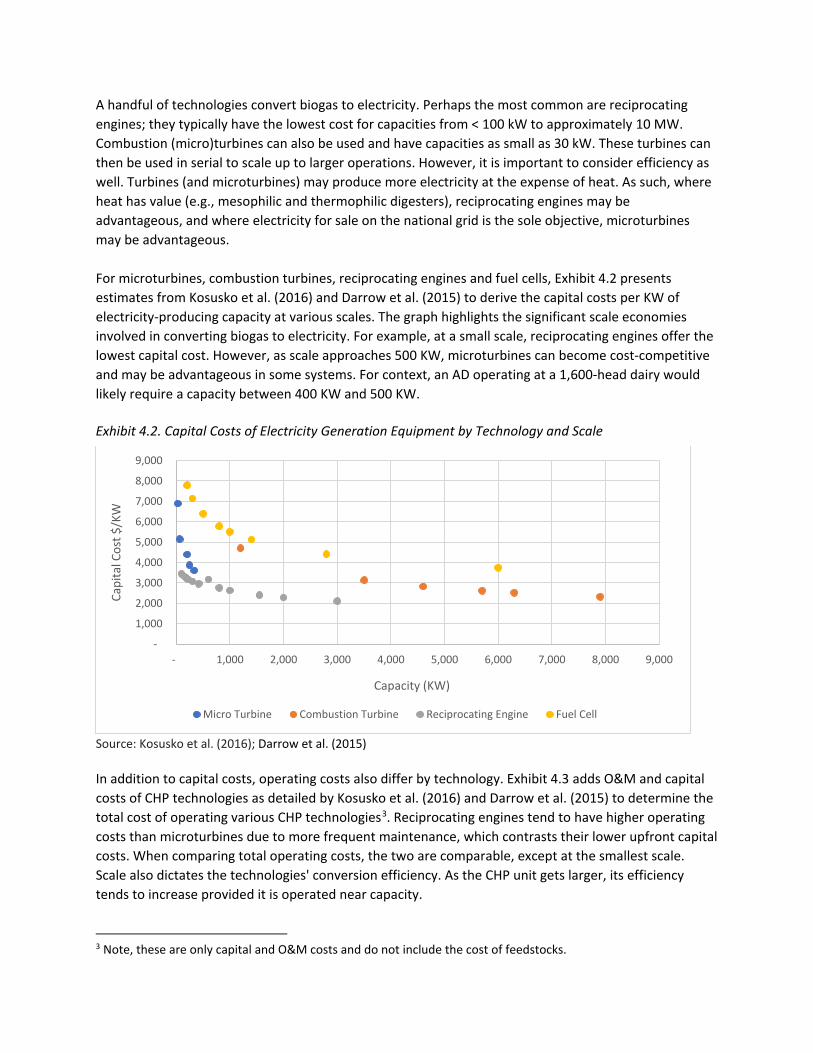
A handful of technologies convert biogas to electricity. Perhaps the most common are reciprocating engines; they typically have the lowest cost for capacities from < 100 kW to approximately 10 MW. Combustion (micro)turbines can also be used and have capacities as small as 30 kW. These turbines can then be used in serial to scale up to larger operations. However, it is important to consider efficiency as well. Turbines (and microturbines) may produce more electricity at the expense of heat. As such, where heat has value (e.g., mesophilic and thermophilic digesters), reciprocating engines may be advantageous, and where electricity for sale on the national grid is the sole objective, microturbines may be advantageous. For microturbines, combustion turbines, reciprocating engines and fuel cells, Exhibit 4.2 presents estimates from Kosusko et al. (2016) and Darrow et al. (2015) to derive the capital costs per KW of electricity-producing capacity at various scales. The graph highlights the significant scale economies involved in converting biogas to electricity. For example, at a small scale, reciprocating engines offer the lowest capital cost. However, as scale approaches 500 KW, microturbines can become cost-competitive and may be advantageous in some systems. For context, an AD operating at a 1,600-head dairy would likely require a capacity between 400 KW and 500 KW. Exhibit 4.2. Capital Costs of Electricity Generation Equipment by Technology and Scale
Source: Kosusko et al. (2016); Darrow et al. (2015) In addition to capital costs, operating costs also differ by technology. Exhibit 4.3 adds O&M and capital costs of CHP technologies as detailed by Kosusko et al. (2016) and Darrow et al. (2015) to determine the total cost of operating various CHP technologies3. Reciprocating engines tend to have higher operating costs than microturbines due to more frequent maintenance, which contrasts their lower upfront capital costs. When comparing total operating costs, the two are comparable, except at the smallest scale. Scale also dictates the technologies' conversion efficiency. As the CHP unit gets larger, its efficiency tends to increase provided it is operated near capacity.
3 Note, these are only capital and O&M costs and do not include the cost of feedstocks.
-
1,000
2,000
3,000
4,000
5,000
6,000
7,000
8,000
9,000
- 1,000 2,000 3,000 4,000 5,000 6,000 7,000 8,000 9,000
Capi
tal C
ost $
/KW
Capacity (KW)
Micro Turbine Combustion Turbine Reciprocating Engine Fuel Cell

Exhibit 4.3. Electricity Production Cost (Capital, O&M) Without Feedstock, $/KWh
Source: Kosusko et al. (2016); Darrow et al. (2015) Production Costs The following sections detail costs for producing biogas and electricity, upgrading biogas to biomethane and separating solids. Biogas A number of studies have evaluated biogas production costs from agricultural feedstocks. These studies take different approaches, and they range in the type of feedstock, operation and location. To provide a complete picture of the biogas production cost literature, it is instructive to synthesize a sample of these studies into a common form. Studies looking at biogas produced from manure have generally found that the gas cost exceeds $5 per MMBtu. Exhibit 4.4 summarizes the literature. Beddoes et al. (2007) found production costs averaged from $4 to $7.22 per MMBtu, depending on the type of manure and reactor. Other studies noted somewhat higher production costs — averaging from $6.70 to $17.40. Differences between the low and high estimates are largely associated with operation size, but other factors also affect costs. Even at the low range, biogas is not likely to compete effectively against natural gas. In most studies, biogas production costs exceed the prevailing natural gas price, but biogas is not a natural gas equivalent. Biogas has only 60% the energy content of natural gas and contains impurities, requiring some degree of upgrading and compression.
0
0.02
0.04
0.06
0.08
0.1
0.12
0.14
0.16
0.18
0 1000 2000 3000 4000 5000 6000 7000 8000 9000
$/KW
H
Capacity (KW)
Micro Turbine Combustion Turbine Reciprocating Engine Fuel Cell
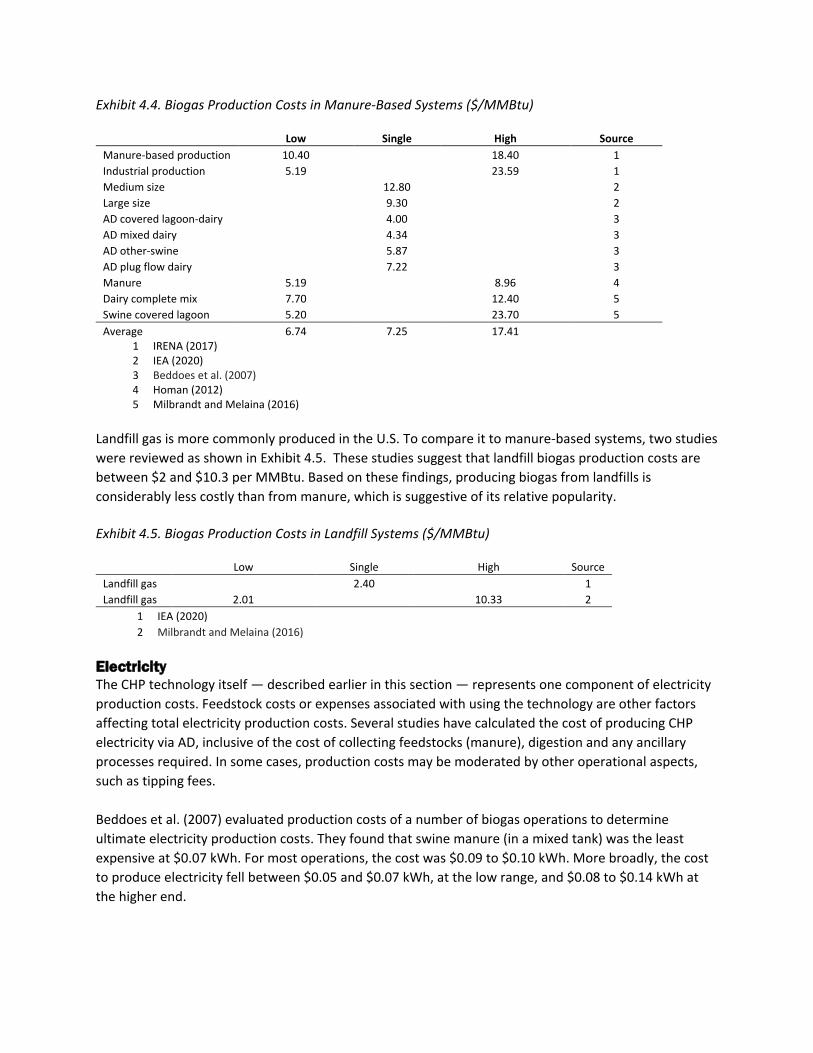
Exhibit 4.4. Biogas Production Costs in Manure-Based Systems ($/MMBtu)
Low Single High Source Manure-based production 10.40 18.40 1 Industrial production 5.19 23.59 1 Medium size 12.80 2 Large size 9.30 2 AD covered lagoon-dairy 4.00 3 AD mixed dairy 4.34 3 AD other-swine 5.87 3 AD plug flow dairy 7.22 3 Manure 5.19 8.96 4 Dairy complete mix 7.70 12.40 5 Swine covered lagoon 5.20 23.70 5 Average 6.74 7.25 17.41
1 IRENA (2017) 2 IEA (2020) 3 Beddoes et al. (2007) 4 Homan (2012)
5 Milbrandt and Melaina (2016) Landfill gas is more commonly produced in the U.S. To compare it to manure-based systems, two studies were reviewed as shown in Exhibit 4.5. These studies suggest that landfill biogas production costs are between $2 and $10.3 per MMBtu. Based on these findings, producing biogas from landfills is considerably less costly than from manure, which is suggestive of its relative popularity. Exhibit 4.5. Biogas Production Costs in Landfill Systems ($/MMBtu)
Low Single High Source Landfill gas 2.40 1 Landfill gas 2.01 10.33 2
1 IEA (2020) 2 Milbrandt and Melaina (2016)
Electricity The CHP technology itself — described earlier in this section — represents one component of electricity production costs. Feedstock costs or expenses associated with using the technology are other factors affecting total electricity production costs. Several studies have calculated the cost of producing CHP electricity via AD, inclusive of the cost of collecting feedstocks (manure), digestion and any ancillary processes required. In some cases, production costs may be moderated by other operational aspects, such as tipping fees. Beddoes et al. (2007) evaluated production costs of a number of biogas operations to determine ultimate electricity production costs. They found that swine manure (in a mixed tank) was the least expensive at $0.07 kWh. For most operations, the cost was $0.09 to $0.10 kWh. More broadly, the cost to produce electricity fell between $0.05 and $0.07 kWh, at the low range, and $0.08 to $0.14 kWh at the higher end.
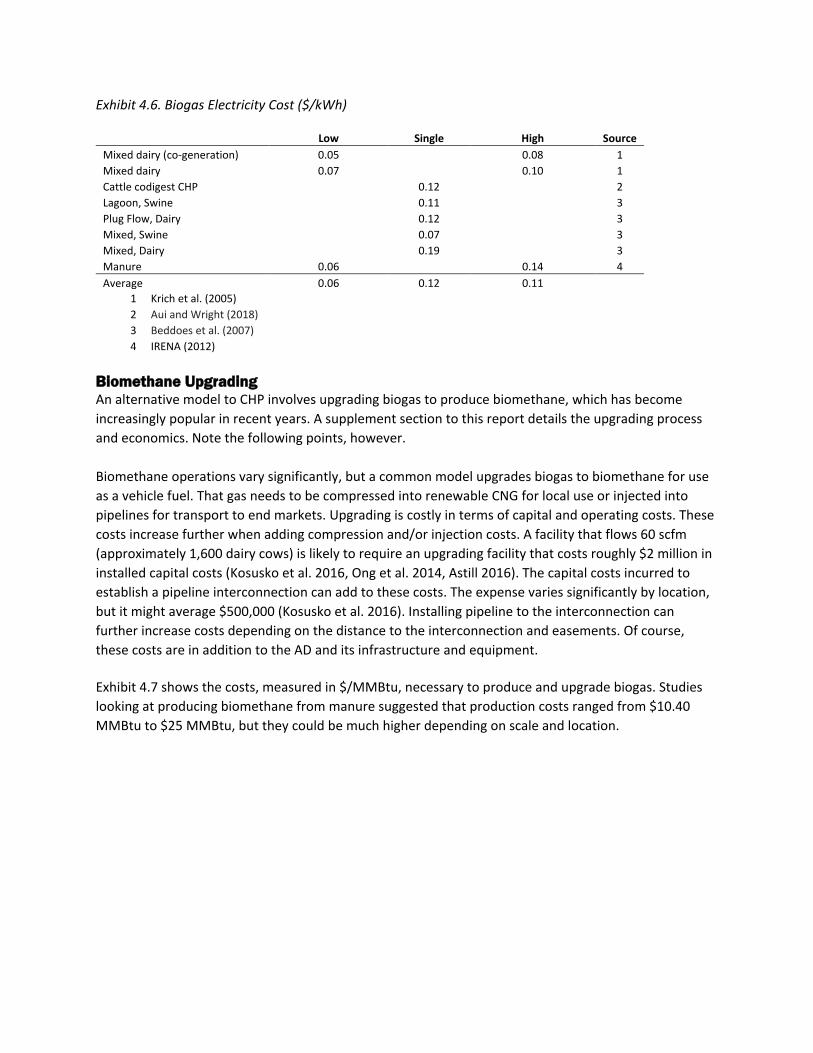
Exhibit 4.6. Biogas Electricity Cost ($/kWh)
Low Single High Source Mixed dairy (co-generation) 0.05 0.08 1 Mixed dairy 0.07 0.10 1 Cattle codigest CHP 0.12 2 Lagoon, Swine 0.11 3 Plug Flow, Dairy 0.12 3 Mixed, Swine 0.07 3 Mixed, Dairy 0.19 3 Manure 0.06 0.14 4 Average 0.06 0.12 0.11
1 Krich et al. (2005) 2 Aui and Wright (2018) 3 Beddoes et al. (2007) 4 IRENA (2012)
Biomethane Upgrading An alternative model to CHP involves upgrading biogas to produce biomethane, which has become increasingly popular in recent years. A supplement section to this report details the upgrading process and economics. Note the following points, however. Biomethane operations vary significantly, but a common model upgrades biogas to biomethane for use as a vehicle fuel. That gas needs to be compressed into renewable CNG for local use or injected into pipelines for transport to end markets. Upgrading is costly in terms of capital and operating costs. These costs increase further when adding compression and/or injection costs. A facility that flows 60 scfm (approximately 1,600 dairy cows) is likely to require an upgrading facility that costs roughly $2 million in installed capital costs (Kosusko et al. 2016, Ong et al. 2014, Astill 2016). The capital costs incurred to establish a pipeline interconnection can add to these costs. The expense varies significantly by location, but it might average $500,000 (Kosusko et al. 2016). Installing pipeline to the interconnection can further increase costs depending on the distance to the interconnection and easements. Of course, these costs are in addition to the AD and its infrastructure and equipment. Exhibit 4.7 shows the costs, measured in $/MMBtu, necessary to produce and upgrade biogas. Studies looking at producing biomethane from manure suggested that production costs ranged from $10.40 MMBtu to $25 MMBtu, but they could be much higher depending on scale and location.
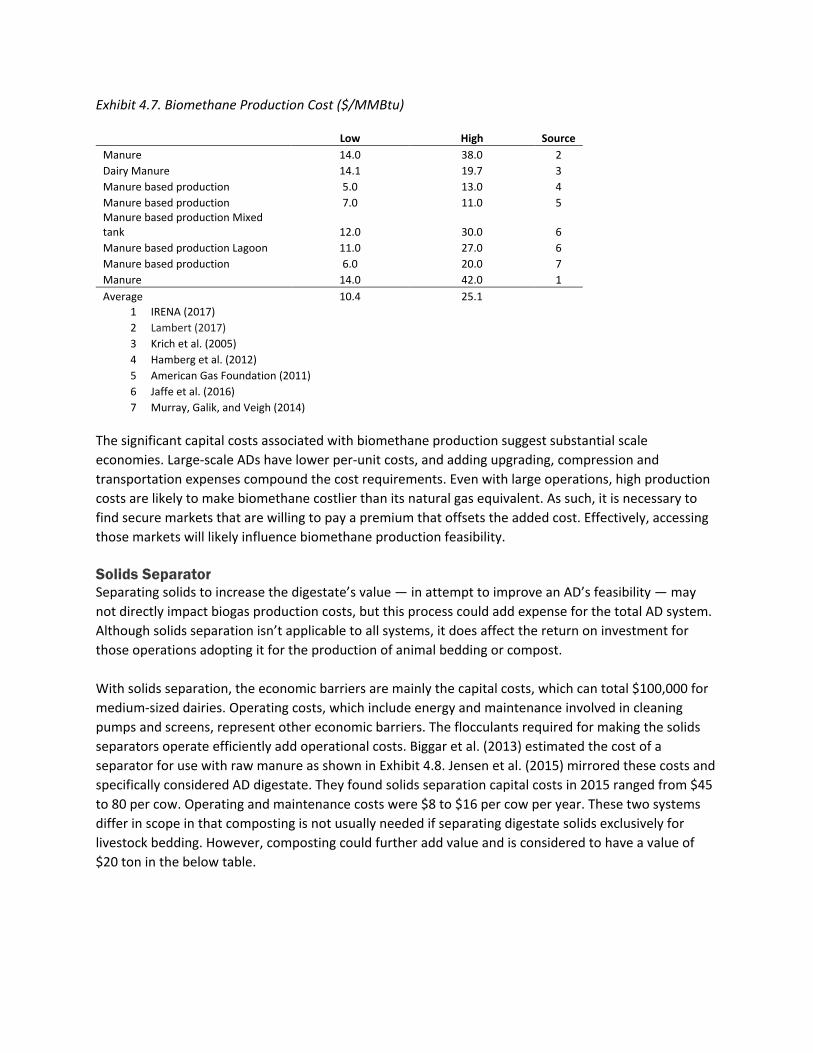
Exhibit 4.7. Biomethane Production Cost ($/MMBtu)
Low High Source Manure 14.0 38.0 2 Dairy Manure 14.1 19.7 3 Manure based production 5.0 13.0 4 Manure based production 7.0 11.0 5 Manure based production Mixed tank 12.0 30.0 6 Manure based production Lagoon 11.0 27.0 6 Manure based production 6.0 20.0 7 Manure 14.0 42.0 1 Average 10.4 25.1
1 IRENA (2017) 2 Lambert (2017) 3 Krich et al. (2005) 4 Hamberg et al. (2012) 5 American Gas Foundation (2011) 6 Jaffe et al. (2016) 7 Murray, Galik, and Veigh (2014)
The significant capital costs associated with biomethane production suggest substantial scale economies. Large-scale ADs have lower per-unit costs, and adding upgrading, compression and transportation expenses compound the cost requirements. Even with large operations, high production costs are likely to make biomethane costlier than its natural gas equivalent. As such, it is necessary to find secure markets that are willing to pay a premium that offsets the added cost. Effectively, accessing those markets will likely influence biomethane production feasibility. Solids Separator Separating solids to increase the digestate’s value — in attempt to improve an AD’s feasibility — may not directly impact biogas production costs, but this process could add expense for the total AD system. Although solids separation isn’t applicable to all systems, it does affect the return on investment for those operations adopting it for the production of animal bedding or compost. With solids separation, the economic barriers are mainly the capital costs, which can total $100,000 for medium-sized dairies. Operating costs, which include energy and maintenance involved in cleaning pumps and screens, represent other economic barriers. The flocculants required for making the solids separators operate efficiently add operational costs. Biggar et al. (2013) estimated the cost of a separator for use with raw manure as shown in Exhibit 4.8. Jensen et al. (2015) mirrored these costs and specifically considered AD digestate. They found solids separation capital costs in 2015 ranged from $45 to 80 per cow. Operating and maintenance costs were $8 to $16 per cow per year. These two systems differ in scope in that composting is not usually needed if separating digestate solids exclusively for livestock bedding. However, composting could further add value and is considered to have a value of $20 ton in the below table.

Exhibit 4.8. Solids Separator Cost
Number of cows 1,000 4,000 Capital Cost for Solids Separation $167,000 $202,000 Annual Operating Cost for Solids Separation $12,680 $46,080 Capital Cost for Windrow Composting Equipment $100,000 $350,000 Annual Operating Cost for Compost Production $12,000 $46,000 Finished Compost Quantity (tons/day) 8 33 Annual Value Finished Compost ($/yr) $60,415 $241,659
Source: Biggar et al. (2013) Transportation Costs and Centralization Although not a focus of the analysis, transportation is a consideration as biogas production inputs and outputs are costly to transport. Strategies for minimizing these costs vary significantly across various AD operations and affect an operation’s configuration and feasibility. Because transportation costs likely vary dramatically across all AD operations, the following section addresses them at a high level. Transporting Various Feedstocks For the most part, expect that ADs receive free feedstocks (e.g. manure), with some feedstocks generating tipping fees (e.g. food and industrial waste). ADs, especially larger operations and those producing biomethane, may choose to source feedstocks from off-site. Examples include adding biomass to optimize AD operation and increase yields or sourcing manure from multiple farms. A number of projects have considered sourcing feedstocks, including biomass (e.g., miscanthus) and crop residues (e.g., corn stover), that are not freely available. Although such feedstocks are not likely to be costly, they are likely to add transportation and handling costs to get them to the digester in a usable form. Facilities must weigh the value these feedstocks offer relative to their total costs, inclusive of transportation, handling, storage and conditioning. Usack et al. (2018) and Bishop and Shumway (2009) considered co-digestion and found that co-digesting high-yielding feedstocks (i.e., food waste) could increase biogas production feasibility. Co-digestion allowed for better capacity utilization or larger digester scale economies. It could also lower digestate application costs if the feedstock can be more completely digested than manure. Most importantly, biogas yield could increase and generate greater electricity revenue. These benefits represent the value of co-digestion and the “ceiling” for total feedstock transportation costs. The benefit, then, is largely associated with feedstock yield (plus tipping fees) minus transportation and handling costs. Biomass crops are another interesting example as they could affect yield and capacity utilization, though they are less likely to generate tipping fees or impact digestate production. Brechbill and Tyner (2008) considered costs of delivering such biomass to a nearby biofuel facility in Indiana. They found that biomass transportation costs were moderate ($3.92 per ton for 10 miles), but total biomass production and delivery costs were much higher. They found corn stover would cost $38.47 per dry ton to harvest and deliver within a 10-mile distance; that equates to $2.53 MMBtu. Switchgrass cost even more at $56.18 per dry ton delivered within a 10-mile radius ($3.87 per MMBtu). Ruth et al. (2013) echoed these costs and extended the analysis to energy crops and woody biomass — all had significant costs for a bioenergy facility to reimburse. Such costs likely suggest that biomass would only be attractive in situations where costs could be minimized or the value of the biogas was sufficiently high.

Manure volume and weight make transportation costs high. Those costs negatively impact the manure’s value when collecting feedstock across farms in an area. Because manure hauling is relatively costly, it may make sense to economize, which has led to considering pipelines to minimize sourcing costs (Ghafoori et al. 2007) and digestate transportation (Ghafoori and Flynn 2007). Transporting biomass via pipeline offers a significant economy of scale — a scale factor less than 0.5. Truck transport, however, has no economy of scale as more material simply requires more truck trips with no variation in transport unit costs. This can make pipelines beneficial for large-scale transport over longer distances (Pootakham and Kumar 2010). Pipeline economics are further influenced by the type of manure and digestate processing. As dilution increases and solids concentration drops, pumping costs decline. More dilute digestate, however, requires a larger diameter pipeline and additional capital investment. Centralization Scale economies are a key factor in AD success. To this end, biogas operations may collaborate and adopt centralization strategies to increase their scale. A few models are likely relevant for Missouri.
1) The first is a large AD sourcing feedstock from multiple producers. Trucking or piping manure from several farms into a central facility serves as an example. Digestate could be returned to the operations for land spreading, or it could be handled differently. (This approach resembles the business model proposed by GESS International. See Chapter 5.)
2) Second, a number of operations could independently produce biogas and collaborate to sell the biogas. Most likely, this would involve a number of livestock operations transporting biogas to a central refinery and selling it as CNG or injecting it into a pipeline. (This approach resembles that of Roeslein International and Smithfield Farms. See Chapter 5.)
3) Configurations could also exist where separate businesses market and handle AD feedstocks, products and co-products. However, this is not necessarily a strategy to create scale economies nor does it necessarily address transportation costs.
Ghafoori et al. (2007) found that an operation would need to be quite large (90,000 beef cattle) to justify a pipe that would deliver manure to a central location. However, this size drops significantly (21,000 head) if installing a two-way pipe to return digestate for land spreading. Of course, the closer the operations, the smaller the minimum size required. It is also possible to transport biogas via a low-pressure pipeline. Prasodio et al. (2013) analyzed various biogas production and distribution configurations. Two configurations evaluated electricity production. The first had all biogas and electricity produced individually on each farm. The second involved on-farm production and distribution of the raw (dehumidified) biogas to a centralized electricity generator. A similar set of configurations were evaluated for biomethane production for pipeline injection. One involved each farm producing biogas, upgrading the gas to pipeline standards, pressurizing the gas and piping it to an injection station. The second had each farm piping the raw biogas to a centralized upgrading facility. Centralization raised electricity production costs, but the savings for biomethane production were large — by half or more.

Leveraging economies of scale provides much of the justification for centralization. The scale economies of electricity generation were found to be much smaller than that of biomethane upgrading and injection. Thus, centralization provides essentially no cost savings, and establishing an inter-farm pipeline network entails significant costs. In contrast, centralizing biomethane production allows for sharing the extremely high capital costs incurred for biogas upgrading and pipeline injection (or compression). Simply, pipelines can be less expensive than upgrading and injection equipment. Exhibit 4.9 compares electricity and biomethane production costs in centralized and on-farm configurations. Exhibit 4.9. Electricity and Biomethane Production Costs in Centralized vs. On-Farm Configurations
$/kWh $/MMBtu On-Farm Electricity 0.175
Centralized Electricity 0.206-0.313
On-Farm Biomethane 0.262-0.882 36.42-122.6 Centralized Biomethane 0.116-0.184 16.09-25.58
Source: Prasodjo et al. (2013) Feasibility Analysis The following section investigates general AD feasibility using various methods. Comparing benefits (i.e., revenues) to costs is the basis of feasibility analysis. Benefits (B) – cost (C) is the relationship of the (future) value of gross benefit to the (future) value of gross cost. However, the benefits (B) minus costs (C) omits discounting. Discounting translates future value into present value by applying a discount factor that reflects the diminishing value of the same amount of money as one moves further into the future. Computing net present value (NPV) applies discounting to the cost and benefit calculation results. NPV measures the difference between the present value of a
project’s benefit and the present value of the project’s cost. The calculation is as follows: NPV= 𝐵𝐵(𝑛𝑛)−𝐶𝐶(𝑛𝑛)(1+𝑟𝑟)𝑛𝑛
where r is the discount rate and n is the number of years. The decision rule for NPV is to accept the project where NPV is greater than 1 and reject otherwise. By contrast, the internal rate of return (IRR) estimates the profitability of potential investments. To do this, the firm estimates a project’s future cash flows and discounts them into present value using a discount rate that represents the project's cost of capital and its risk. Next, all of the investment's future positive cash flows are reduced into one present value number. Subtracting this number from the initial cash outlay required for the investment provides the net present value of the investment. More broadly, the IRR is the discount rate that makes the NPV of a project zero. The decision rule is to accept the project if the IRR is greater than or equal to the relevant discount rate; otherwise, reject. Feasibility of Producing Commodity Energy First, to assess biogas production feasibility, it is helpful to compare the costs of producing biogas with the price of other energy (e.g., natural gas) on an energy equivalence. Where biogas could be produced at a lower cost, production may be feasible. Exhibit 4.10 represents a biogas facility that produces an arbitrary 50 million ft3 of biogas per year with total operating costs of $4.50 per 1000ft3 ($7.50 MMBtu) of biogas. At its simplest, the table shows the energy equivalent value of various fuels. For example, if biogas cost $4.50 per 1000ft3, a buyer would be equally willing to pay $7.77 per 1000ft3 for natural gas
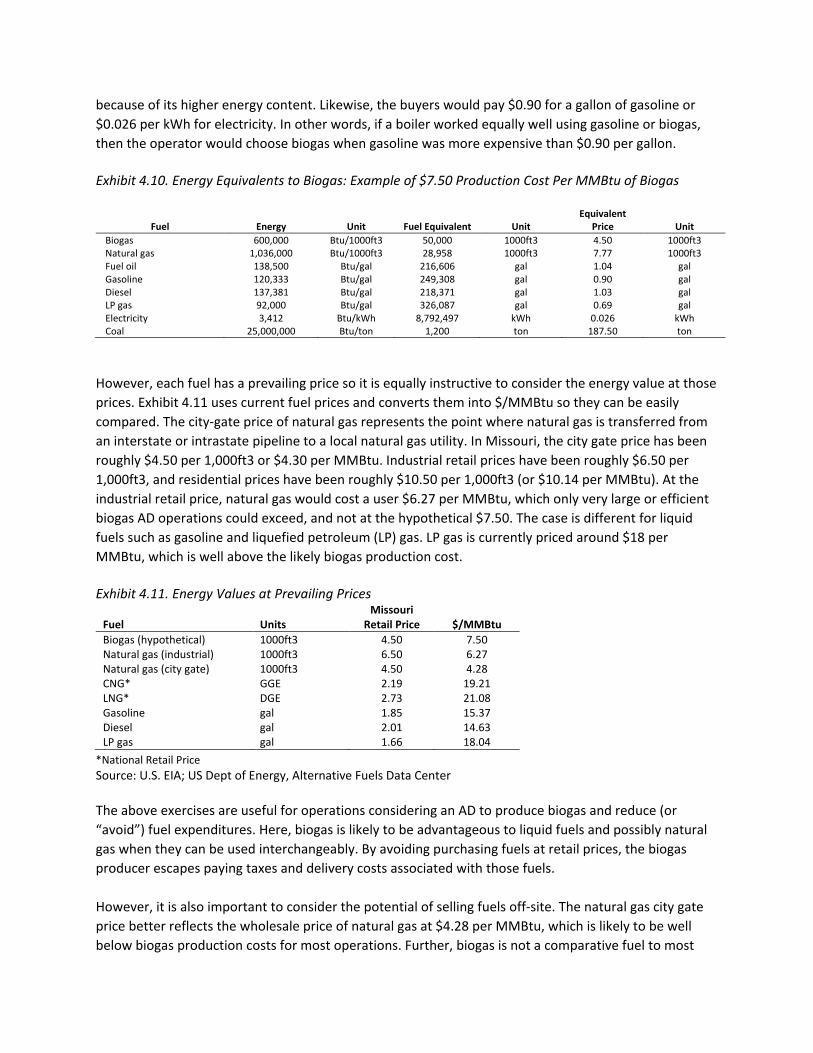
because of its higher energy content. Likewise, the buyers would pay $0.90 for a gallon of gasoline or $0.026 per kWh for electricity. In other words, if a boiler worked equally well using gasoline or biogas, then the operator would choose biogas when gasoline was more expensive than $0.90 per gallon. Exhibit 4.10. Energy Equivalents to Biogas: Example of $7.50 Production Cost Per MMBtu of Biogas
Fuel Energy Unit Fuel Equivalent Unit Equivalent
Price Unit Biogas 600,000 Btu/1000ft3 50,000 1000ft3 4.50 1000ft3 Natural gas 1,036,000 Btu/1000ft3 28,958 1000ft3 7.77 1000ft3 Fuel oil 138,500 Btu/gal 216,606 gal 1.04 gal Gasoline 120,333 Btu/gal 249,308 gal 0.90 gal Diesel 137,381 Btu/gal 218,371 gal 1.03 gal LP gas 92,000 Btu/gal 326,087 gal 0.69 gal Electricity 3,412 Btu/kWh 8,792,497 kWh 0.026 kWh Coal 25,000,000 Btu/ton 1,200 ton 187.50 ton
However, each fuel has a prevailing price so it is equally instructive to consider the energy value at those prices. Exhibit 4.11 uses current fuel prices and converts them into $/MMBtu so they can be easily compared. The city-gate price of natural gas represents the point where natural gas is transferred from an interstate or intrastate pipeline to a local natural gas utility. In Missouri, the city gate price has been roughly $4.50 per 1,000ft3 or $4.30 per MMBtu. Industrial retail prices have been roughly $6.50 per 1,000ft3, and residential prices have been roughly $10.50 per 1,000ft3 (or $10.14 per MMBtu). At the industrial retail price, natural gas would cost a user $6.27 per MMBtu, which only very large or efficient biogas AD operations could exceed, and not at the hypothetical $7.50. The case is different for liquid fuels such as gasoline and liquefied petroleum (LP) gas. LP gas is currently priced around $18 per MMBtu, which is well above the likely biogas production cost. Exhibit 4.11. Energy Values at Prevailing Prices
Fuel Units Missouri
Retail Price $/MMBtu Biogas (hypothetical) 1000ft3 4.50 7.50 Natural gas (industrial) 1000ft3 6.50 6.27 Natural gas (city gate) 1000ft3 4.50 4.28 CNG* GGE 2.19 19.21 LNG* DGE 2.73 21.08 Gasoline gal 1.85 15.37 Diesel gal 2.01 14.63 LP gas gal 1.66 18.04
*National Retail Price Source: U.S. EIA; US Dept of Energy, Alternative Fuels Data Center The above exercises are useful for operations considering an AD to produce biogas and reduce (or “avoid”) fuel expenditures. Here, biogas is likely to be advantageous to liquid fuels and possibly natural gas when they can be used interchangeably. By avoiding purchasing fuels at retail prices, the biogas producer escapes paying taxes and delivery costs associated with those fuels. However, it is also important to consider the potential of selling fuels off-site. The natural gas city gate price better reflects the wholesale price of natural gas at $4.28 per MMBtu, which is likely to be well below biogas production costs for most operations. Further, biogas is not a comparative fuel to most

users and would need to be upgraded and compressed; both activities add costs. Making biogas comparable to the other liquid fuels would require further upgrading, compression, transportation and taxes. After adding these, the biomethane would most closely compete against CNG or LNG. National retail prices of CNG and LNG are $19.21 and $21.08 per MMBtu, respectively, and the “wholesale” price available to the biogas facility would be well below that. Because sale prices are likely to vary, Exhibit 4.12 calculates the breakeven price at various biogas/biomethane production costs. If it costs $20 per MMBtu to produce (upgraded biogas) biomethane, then the breakeven sale price would need to be $20.70 per 1,000ft3. This is well above prevailing natural gas prices, even retail prices (e.g., industrial and residential are between $6.50 and $10 per MMBtu). If compressed biomethane (CNG) could be produced for $20 MMBtu, then the breakeven price would be $2.58. Exhibit 4.12. Natural Gas Energy Equivalents to Biogas at Various Production Costs
Biogas Production Costs$/MMBtu Biogas $/1,000ft3 Natural gas
$/1,000ft3 CNG ($/GGE) LNG ($/DGE) 3.00 1.86 3.11 0.39 0.44 4.50 2.80 4.66 0.58 0.66 5.00 3.11 5.18 0.65 0.73 6.00 3.73 6.22 0.78 0.88 7.00 4.35 7.25 0.90 1.03 8.00 4.97 8.29 1.03 1.17 9.00 5.59 9.32 1.16 1.32 10.00 6.22 10.36 1.29 1.47
15.00 9.32 15.54 1.94 2.20 20.00 12.43 20.72 2.58 2.94 25.00 15.54 25.90 3.23 3.67 30.00 18.65 31.08 3.88 4.41 35.00 21.76 36.26 4.52 5.14 40.00 24.86 41.44 5.17 5.87
Comparing production costs to prevailing prices also applies to electricity production. The reviewed cost studies suggest that electricity production costs for biogas operations are $0.05 to $0.07 kWh at the low range and $.08 to $.14 kWh at the higher end. These costs can be compared to prevailing retail prices in Missouri. Residential prices average $0.113 kWh for residential consumers and $0.072 for industrial consumers. Where net metering is used, the “avoided cost” rate paid by the utility is significantly lower — often between $0.029 and $0.053 per kWh. Feasibility Assessment from Literature The above cost-based assessment is limited in many ways. For one, it does not consider the differences in the operations’ configurations and revenue streams, which could impact feasibility potential. To identify practices that may improve AD feasibility, the following literature review summarizes AD projects described in commercial feasibility studies of proposed projects, academic studies, governmental projects and industry studies. Each study focuses on unique aspects of AD and reports feasibility in various ways. Most commonly, however, feasibility is reported as NPV. In general, the feasibility study review offers a collection of insights including the following.
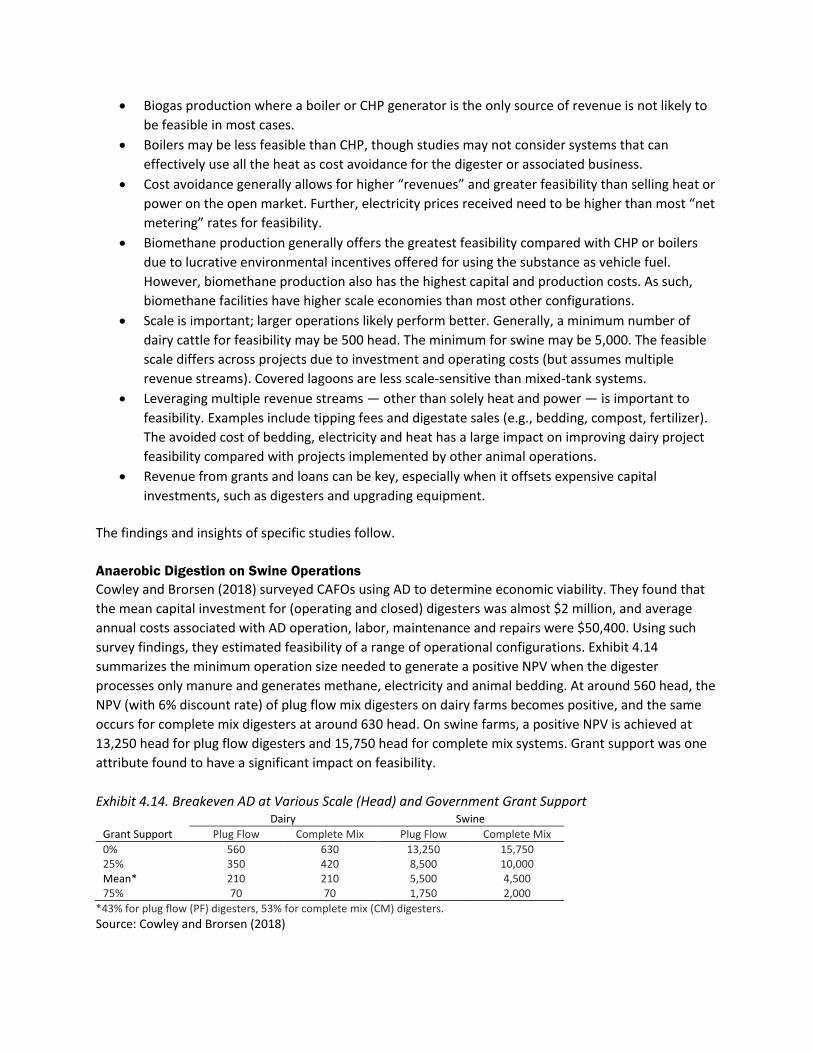
• Biogas production where a boiler or CHP generator is the only source of revenue is not likely to be feasible in most cases.
• Boilers may be less feasible than CHP, though studies may not consider systems that can effectively use all the heat as cost avoidance for the digester or associated business.
• Cost avoidance generally allows for higher “revenues” and greater feasibility than selling heat or power on the open market. Further, electricity prices received need to be higher than most “net metering” rates for feasibility.
• Biomethane production generally offers the greatest feasibility compared with CHP or boilers due to lucrative environmental incentives offered for using the substance as vehicle fuel. However, biomethane production also has the highest capital and production costs. As such, biomethane facilities have higher scale economies than most other configurations.
• Scale is important; larger operations likely perform better. Generally, a minimum number of dairy cattle for feasibility may be 500 head. The minimum for swine may be 5,000. The feasible scale differs across projects due to investment and operating costs (but assumes multiple revenue streams). Covered lagoons are less scale-sensitive than mixed-tank systems.
• Leveraging multiple revenue streams — other than solely heat and power — is important to feasibility. Examples include tipping fees and digestate sales (e.g., bedding, compost, fertilizer). The avoided cost of bedding, electricity and heat has a large impact on improving dairy project feasibility compared with projects implemented by other animal operations.
• Revenue from grants and loans can be key, especially when it offsets expensive capital investments, such as digesters and upgrading equipment.
The findings and insights of specific studies follow. Anaerobic Digestion on Swine Operations Cowley and Brorsen (2018) surveyed CAFOs using AD to determine economic viability. They found that the mean capital investment for (operating and closed) digesters was almost $2 million, and average annual costs associated with AD operation, labor, maintenance and repairs were $50,400. Using such survey findings, they estimated feasibility of a range of operational configurations. Exhibit 4.14 summarizes the minimum operation size needed to generate a positive NPV when the digester processes only manure and generates methane, electricity and animal bedding. At around 560 head, the NPV (with 6% discount rate) of plug flow mix digesters on dairy farms becomes positive, and the same occurs for complete mix digesters at around 630 head. On swine farms, a positive NPV is achieved at 13,250 head for plug flow digesters and 15,750 head for complete mix systems. Grant support was one attribute found to have a significant impact on feasibility.
Exhibit 4.14. Breakeven AD at Various Scale (Head) and Government Grant Support Dairy Swine Grant Support Plug Flow Complete Mix Plug Flow Complete Mix 0% 560 630 13,250 15,750 25% 350 420 8,500 10,000 Mean* 210 210 5,500 4,500 75% 70 70 1,750 2,000
*43% for plug flow (PF) digesters, 53% for complete mix (CM) digesters. Source: Cowley and Brorsen (2018)
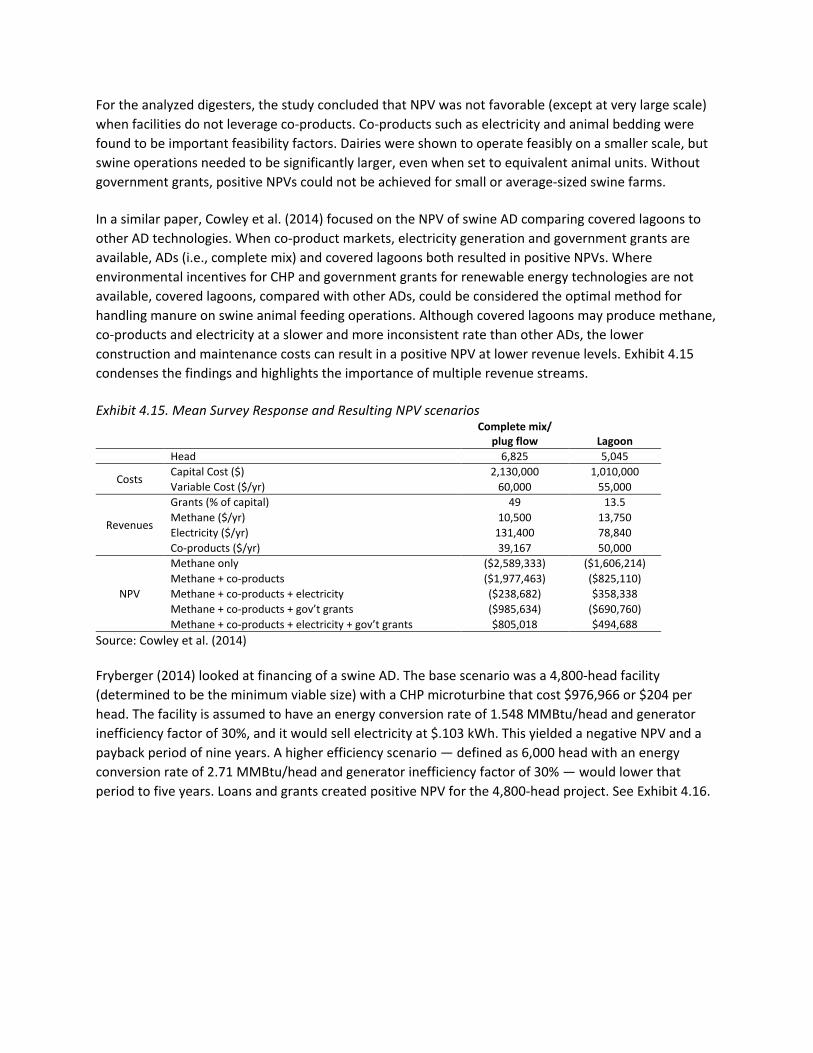
For the analyzed digesters, the study concluded that NPV was not favorable (except at very large scale) when facilities do not leverage co-products. Co-products such as electricity and animal bedding were found to be important feasibility factors. Dairies were shown to operate feasibly on a smaller scale, but swine operations needed to be significantly larger, even when set to equivalent animal units. Without government grants, positive NPVs could not be achieved for small or average-sized swine farms. In a similar paper, Cowley et al. (2014) focused on the NPV of swine AD comparing covered lagoons to other AD technologies. When co-product markets, electricity generation and government grants are available, ADs (i.e., complete mix) and covered lagoons both resulted in positive NPVs. Where environmental incentives for CHP and government grants for renewable energy technologies are not available, covered lagoons, compared with other ADs, could be considered the optimal method for handling manure on swine animal feeding operations. Although covered lagoons may produce methane, co-products and electricity at a slower and more inconsistent rate than other ADs, the lower construction and maintenance costs can result in a positive NPV at lower revenue levels. Exhibit 4.15 condenses the findings and highlights the importance of multiple revenue streams. Exhibit 4.15. Mean Survey Response and Resulting NPV scenarios
Complete mix/
plug flow Lagoon Head 6,825 5,045
Costs Capital Cost ($) 2,130,000 1,010,000 Variable Cost ($/yr) 60,000 55,000
Revenues
Grants (% of capital) 49 13.5 Methane ($/yr) 10,500 13,750 Electricity ($/yr) 131,400 78,840 Co-products ($/yr) 39,167 50,000
NPV
Methane only ($2,589,333) ($1,606,214) Methane + co-products ($1,977,463) ($825,110) Methane + co-products + electricity ($238,682) $358,338 Methane + co-products + gov’t grants ($985,634) ($690,760) Methane + co-products + electricity + gov’t grants $805,018 $494,688
Source: Cowley et al. (2014)
Fryberger (2014) looked at financing of a swine AD. The base scenario was a 4,800-head facility (determined to be the minimum viable size) with a CHP microturbine that cost $976,966 or $204 per head. The facility is assumed to have an energy conversion rate of 1.548 MMBtu/head and generator inefficiency factor of 30%, and it would sell electricity at $.103 kWh. This yielded a negative NPV and a payback period of nine years. A higher efficiency scenario — defined as 6,000 head with an energy conversion rate of 2.71 MMBtu/head and generator inefficiency factor of 30% — would lower that period to five years. Loans and grants created positive NPV for the 4,800-head project. See Exhibit 4.16.

Exhibit 4.16. Swine Biogas Project (4,800 head, CHP) Financials
No Intervention Loan Grant Loan & Grant Electricity Price
Premium Price per kWh $ 10.30 $ 10.30 $ 10.30 $ 10.30 $ 14.30 Grant $ 450,000 $ 320,000 Loan Size $ 415,800 $ 415,800 Equity Required $ 977,000 $ 651,200 $ 527,000 $ 241,200 $ 977,000 Payback Year 9 9 12 10 7 ROI 20yr 6% 8% 15% 23% 10% NPV, 20 yr, 7% $ (46,200) $ 27,300 $ 253,600 $ 240,400 $ 179,000
Source: Fryberger (2014) Anaerobic Digestion at Dairies Bishop and Shumway (2009), Stokes et al. (2008) and Lazarus and Rudstrom (2007) all evaluated the feasibility of ADs at dairy operations with 500 and 800 animal units (350 and 560 head). Each found that AD was not likely to be feasible at that scale when revenue came from biogas or electricity (CHP). However, Bishop and Shumway emphasized that modifying the system could create positive returns. Notably, they found that tipping fees for co-digestion, fiber separation and carbon credits could all dramatically increase feasibility. Exhibit 4.13 shows findings for a selection of operational configurations. Exhibit 4.13. Bishop and Shumway Model AD Scenarios
Scenario number NPV ($) IRR (%) 1. 500 cows, electricity @ $0.05/kWh + $0.02/kWh tax credit, fiber for bedding, r=4%, 40yr depreciation -644,556 - 2. (Scenario) 1 with grants @ 38% of digester cost -202,073 2 3. 2 with manure trucked in from 250 cows, 30-year depreciation -727,607 - 4. 3 with substrates, 20-year depreciation -404,597 -3.3 5. 4 with tipping fees for substrates 1,094,948 17.1 6. 5 with selling excess fiber at $13.50 per cubic yard 1,185,416 18.1 7. Base Digester: 6 with credits @ 50% commission 1,375,371 20 11. 7 with no power generation 319,750 9.3 12. 7 with 1,300 cows, no substrates 1,270,566 19.3 13. 7 with sale of all fiber at $13.50 per cubic yard 1,424,067 20.7 14. 7 with sale of all fiber at $20 per cubic yard 1,623,366 22.7 15. 7 with 25% commission on carbon credits 1,470,349 20.9 16. 7 with credits at ECX price of $20.48, 50% commission 2,164,889 27.4
Source: Bishop and Shumway (2009) Astill and Shumway (2016) examined the economic feasibility of AD at dairy farms. The configurations considered included co-digestion, CNG, CHP output, fiber separation, nutrient separation and water recovery. They found that AD setups without co-digestion are only economically feasible under limited conditions. NPV was greatest for ADs producing CNG. They estimated NPV for AD with CNG and environmental credits was $1.8 million and $39.7 million for dairies with 1,600 cows and 15,000 cows, respectively. For these firm sizes, co-digestion contributed $4.8 million and $47.3 million, respectively, to estimated NPV. Nutrient separation and water recovery both decreased NPV. Camarillo et al. (2012) looked at the economic sustainability of a 710 kW CHP digester located on a dairy farm in California using a flush water system. This facility used a complete mix anaerobic digester, co-digestates were used as additional digester feedstocks (i.e., whey, waste feed, plant biomass), and the power plant operated under strict regulatory requirements for stack gas emissions. Electricity was produced and sold wholesale, and cost savings resulted from using waste heat to offset propane demand. In its most basic form, the facility was not feasible, but feasibility improved by modifying

assumptions, such as running at full CHP capacity. Energy cost avoidance and grants and financing all enhanced feasibility significantly. Klavon et al. (2013) evaluated AD feasibility on smaller scale dairy operations to determine a feasible scale. Among revenue streams, digested solids for bedding generated the highest revenue followed by biogas use for heating or electrical generation and CO2 credits. They found that ADs on 250-cow operations were not economically viable unless 50% cost sharing was possible. Giesy et al. (2005) looked at the feasibility of various AD technologies for three relatively small Florida dairies that intended to produce electricity. To break even, they found the electricity retail value would need to be roughly $0.12 kWh or higher. In this case, that price is a dairy’s avoided cost of electricity. Leuer et al. (2008) analyzed the effect of net metering, carbon credits and solids separation on AD feasibility for Pennsylvania dairies. They considered farms ranging from 500 cows to 2,000 cows. Results indicate that net metering, carbon credits and solids separation increased a digester’s expected NPV. In general, they only found feasibility for large farms (1,000+ cows) that use separated solids as bedding. Benavidez et al. (2019) modeled dairy AD in Texas to demonstrate feasibility. Under the assumptions of the study, digester profitability was not possible due to low prices received when selling electricity to the grid, highly variable investment costs and low government support. Key and Sneeringer (2011) evaluated how carbon offset markets impact dairy AD feasibility. They calculate revenues as electricity expenditures avoided, electricity sales and carbon offset sales ($13/ton). Digester construction at dairy operations with 500 head to 1,000 head is estimated to cost between $366,000 and $652,000, and annual maintenance costs are estimated to range between $7,000 and $28,000. This yields an NPV of $333 per head on a 1,500-head operation with a lagoon manure system. A smaller 1,000-head dairy would have an NPV of $239 per head. Without carbon offset revenue, ADs are not generally found to be feasible. Usack et al. (2018) investigated the role of co-digestion on AD at New York dairies. They looked at a range of potential feedstocks for co-digestion to determine how environmental and economic conditions change. They found that co-digestion can lead to positive NPV when tipping fees are associated with the feedstocks. Without tipping fees, NPV improves with increased co-digestions but is not positive. Because tipping fees have a larger impact than biogas yield, feedstocks that offer higher tipping fees tend to be more profitable for the digester.
Lauer et al. (2018) assessed the economic viability of using dairy-cow manure to producer biogas for either CHP or upgrading to biomethane. In addition to revenues/savings from biogas, digestate was used for bedding and helped reduced manure transportation costs. They found that biogas can generate a positive NPV in dairy operations with more than 3,000 animals. On operations of up to 3,600 cows, CHP was the optimal choice. Above that threshold, biomethane was advantageous.
Feasibility of Food Waste AD A number of studies have evaluated food waste AD. Moriarty (2013) studied the cost of operating a food waste AD in Louisiana. The study found that capital costs were likely to be $561 per ton and O&M costs at $48 per ton given the relatively small scale of 7,000 tons of food waste. Revenues included tipping fees at $20 per ton and an electricity rate at $0.078/kWh. NPV was -$6.7 million due to low energy and landfill prices and high costs. Franchetti and Dellinger (2014) considered residential and commercial food waste collected in Toledo, Ohio, as feedstock for a standalone AD. The city generated approximately 270,000 pounds of food waste per day assuming a 75% participation rate and 90% food recovery rate. Assumptions for the baseline facility were no government support, $35 tipping fees and utilizing all biogas for electricity production. Given these assumptions, the facility was not feasible. Factors found to be potentially beneficial were implementing feed-in-tariffs and directing more biogas toward CNG production. Tillamook County, Washington, conducted a feasibility study (Tetra Tech 2011) to evaluate the following food waste co-digestion scenarios:
• Scenario 1: 3,000 cows and 1,700 tons of food waste coupled with CHP; • Scenario 2: 6,000 cows and food waste coupled with CHP; and • Scenario 3: 6,000 cows and food waste coupled with CNG generation and use.
Scenario 1 was not a financially viable, and Scenario 2 was cost-neutral. Scenario 3 cost $15MM but had the highest projected returns due to the CNG fuel’s value and RIN values for fuel sold. This scenario produced an estimated $636,000 in annual revenue, a 13% IRR and a project lifespan NPV of $37MM. Note, these financials do not include government grants or loans. Sheffler (2018) evaluated a co-digestion AD built for municipal and university wastes. Capital investment totaled $6,228,681 for the RNG alternative and $7,719,081 for the CHP alternative. Annual operation and maintenance costs were estimated at $158,792 for the RNG facility and $138,670 for the CHP facility. The CHP option generated $114,026 in energy cost savings, and the biomethane system generated $163,807 in natural gas savings. The waste management savings were $201,625 and generated annual fertilizer sale value of approximately $47,000. This resulted in a non-feasible 16.92-year payback for the RNG alternative and a 26.71-year payback for the CHP alternative. Feasibility: Simulation Model The cost and revenue data described above provide general information to contextualize biogas production and assess biogas feasibility. However, the analysis is limiting in that it does not clearly assess feasibility for entire systems. Further, literature review studies are difficult to adapt and compare to current situations. In order to operationalize the data collected, a simulation model that considers multiple facility configurations is used to compare and contrast how an operation might perform. Modeling the economics of a proposed biogas facility starts with the “Anaerobic Digester System Enterprise Budget Calculator” developed by Gregory Astill and Richard Shumway from Washington State and USDA ERS. Access the current model at: csanr.wsu.edu/anaerobic-digestion-systems/enterprise-budget-calculator The model’s general parameters and assumptions are detailed in the following publications:
• Astill, G. M., & Shumway, C. R. (2016). Profits from pollutants: economic feasibility of integrated anaerobic digester systems. Working Paper Series-School of Economic Sciences, Washington State University, (2016-5).
• Astill, G. M., & Shumway, C. R. (2016). Profits from pollutants: economic feasibility of integrated anaerobic digester and nutrient management systems. Journal of environmental management, 184, 353-362.
Using this model has a number of benefits. It provides detailed accounting of multiple biogas production and marketing opportunities. It has transparency as its mechanics and assumptions can be viewed by the public. Further, any operation with interest in biogas production can utilize and tailor the model to its needs. Similarly, this paper updates the model assumptions to reflect the current market, geography, technology and feedstock desired. The model considers a reference AD operation to assess various biogas production options. The most typical agricultural biogas facility in the U.S. uses dairy manure in a mixed tank digester to produce biogas to operate a CHP generator. It is an appropriate case as most feedstocks are, or can be made, suitable for digestion via a mixed tank AD. Further, the mixed tank system allows for various operational configurations (including co-digestion) to investigate the impact on profitability. For the base case, a 1,600-cow dairy is considered. This would be a large dairy, especially for Missouri, and would roughly equate to a 5,700-head swine operation or 286,000 broiler chickens in terms of USDA NRCS animal unit equivalents. However, this is well smaller than the average AD in operation across the U.S., according to the AgSTAR database. (See Exhibit 5.8). The most basic operation considered produces biogas for CHP electricity generation. All electricity is sold at prevailing rates, and heat is assumed to be used for the anaerobic digester and is not otherwise valued. Value is assigned to improved fertilizer usability and reduced transportation costs. NPV communicates feasibility. Assumptions Astill and Shumway (2016) base digester capital costs on Juergens and Powell (2014), which mirror the capital costs outlined above. For the baseline, a flush dairy is considered. It requires a pre-digestion collection pit for thickening the effluent. The flush dairy is used here to make the system more relevant to hog operations that might use a mixed tank digester. General capital costs total $45/MMBtu output or $903 per wet cow equivalent (WCE), which is consistent with the literature. Astill and Shumway (2016) estimate annual digester operation and maintenance to be $10 per m3 effluent for all operation sizes. If the digester accepts off-farm organics, then it generates tipping fee revenue of $20 per ton. Astill and Shumway (2016) also base CHP costs from Juergens and Powell (2014). This results in capital costs of $1,871 per kw at the base case. These costs assume 80% capacity utilization and no gas cleanup. Annual operating costs for CHP are $175,000 or $0.035. Here, capital costs are marginally below the levels listed in the preceding literature review, but higher operating costs result in similar total costs. Revenues are based on the generator transforming methane into electricity 92% of the year and losing 8% due to parasitic load. In the base case, electricity price is $0.07 per kWh to approximate Missouri’s average industrial electricity price, which is the AD operator’s avoided electricity cost. The cost for the liquid-solid separator is $40 per WCE, and the annual operating cost per ton of fiber is $5. This fiber can replace bedding at an avoided price of $86 per ton or sell for $45 per ton as compost. In a separate process, the fiber is sold for $140 per ton as a peat moss replacement following the cost assumptions of Astill and Shumway (2016).
Costs of manure transportation and application, co-digestion, fiber separation, nutrient separation and water recovery are also considered. All technologies except co-digestion reduce hauling costs, and co-digestion increases those costs. For corn, the nitrogen application rate is 200 pounds per acre with manure effluent incorporated via injection. Waste effluent applied per acre depends on the concentration of N and varies by technology system. AD increases N concentration by reducing volatile solids in the effluent; co-digesting organics decreases N concentration by adding water; fiber separation, P solids separation, ammonium sulfate removal and water recovery decrease N concentration by removing N. Hauling distances increase with operation size and range from 2.9 miles and 4.6 miles for the base case. For all fields, application via liquid injection is expected to cost $13.50 per 1,000 gallons. Simulation Results The base case where only electricity is sold is never profitable, even at large scales. Annual revenues from the avoided cost of electricity at $0.07kWh ($191,000) and manure handling costs do not offset the operation expense. In fact, the base case has an NPV of $-2,977,000 over 10 years and $-2,785,000 over 20 years. In order improve the economics, facilities must earn higher prices or leverage additional revenue sources. Exhibit 4.17 shares a selection of options. It first shows how each option changes NPV relative to the base case. Stacking the options determines feasibility of an operation that effectively leverages multiple opportunities. The options were considered at three prevailing electricity prices: $0.05, $0.07 and $0.11 kWh. The low price reflects a contract rate with a utility to fulfill its renewable obligations. The $0.07 kWh rate reflects the industrial retail electricity price or the avoided cost for the biogas operation. The $0.11 kWh reflects an optimistic situation that prices electricity for its environmental benefit (e.g., renewable energy or carbon credits). Comparing this base case to a number of other options determines how feasibility is impacted. As identified by Cowley and Brorsen (2018) and Cowley et. al (2014), grants commonly displace a portion of the capital expenses of an agricultural AD operation with typical rates in the upper 40% range. To evaluate the effect, grants that displace 25%, 40% and 50% of capital expense are considered. Both the 25% and 50% have a significant impact on NPV; the 50% grant more than halves the negative NPV of the base case. A production tax credit indicative of the prevailing federal rate of 1.3 cents/kWh had a small impact by raising the NPV by a few hundred thousand dollars. Producing and utilizing bedding, which is valued at $86 per ton, had a significant positive effect on NPV. Likewise, producing high-value fiber increased feasibility, despite the added drying costs. Depending on the value of electricity, co-digestion had the largest impact by generating tipping fees and, to a lesser extent, increasing electricity production. This scenario assumed an optimal condition where the digester receives highly digestible food waste equivalent to 10% of the total adjusted feedstock volume in the digester. In other words, the amount of manure accepted remains the same, but (19 tons of) food wastes are added. That change necessitated a larger digester as well as collection and pre-processing equipment. This feedstock has the potential of accounting for 33% of total methane production and tipping fees of $20 per ton.

Exhibit 4.17. Technology Option Scenarios NPV @ 20 years
Electricity Price ($/kWh) 0.05 0.07 0.11
Base (CHP) (3,525,634) (2,785,099) (1,304,029)
Base+Grants @25% (2,710,345) (1,969,810) (488,740)
Base+Grants @50% (1,895,057) (1,154,522) 326,548
Base+PTC (3,044,286) (2,303,751) (822,681)
Base+Bedding (1,528,705) (989,344) 692,900
Base+High value fiber (1,373,155) (632,621) 848,450
Base+Co-digestion (1,708,770) (595,328) 1,631,557
Base+Grants @40%+Bedding+PTC 282,175 1,022,710 2,503,780
Base+Grants @40 %+HVF+PTC 504,581 1,245,116 2,726,187
Base+Co-d+Grants @40%+Bedding+PTC 2,523,651 3,637,093 5,863,978
Base+Co-d+Grants @40%+HVF+PTC 2,746,057 3,859,499 6,086,384
Individually, each of these options positively affected NPV but did not make the facility feasible, except at the highest electricity price. However, these options are not exclusive of each other. When stacked, they can generate feasibility at more moderate electricity rates. The scenario that utilizes grants, production tax credits and bedding likely is the most representative of typical AD operations currently operating. Accordingly, it is important to focus some attention on this case. Missouri lacks clear high demand for animal bedding, so the $86 avoided cost is likely optimistic. Further, it is commonly assumed that dairy operations that do benefit from digestate solids for bedding likely only use half. They must sell the remainder — often at a reduced price. As such, it is instructive to consider the effect of the separated solids (bedding) price on feasibility. Exhibit 4.18 compares several scenarios. If separated solids sold at $42 ton, then it would be comparable to compost, which might be an attractive option to some. At the low energy price, a higher share of revenues needs to come from other sources — namely, digestate. The separated fiber needs to generate more than $70 per ton, which is unlikely for compost. At $0.07 kWh, the needed price of digestate decreases to around $40, which makes selling digestate as a “compost alternative” a possibility. At $0.11 kWh, the digestate market is less important; the focus swings more toward electricity sales. Exhibit 4.18. Sensitivity of Electricity and Fiber Prices: Scenario: Base + Grants @40% + Bedding + PTC
Fiber Electricity $25 ton $50 ton $75 ton $100 ton
$0.05 kWh (1,038,904) (497,478) 43,948 585,374
$0.07 kWh (298,369) 243,057 784,483 1,325,909
$0.11 kWh 1,182,701 1,724,127 2,265,553 2,806,979 Co-digesting organics has the potential to significantly increase NPV. See Exhibit 4.19. However, note an important tradeoff in producing electricity vs. digestate. Co-digesting food waste decreases digestate output and increases biogas (electricity) output. An operation that sells electricity for a higher price is likely to get more value from co-digestion than an operation that sells electricity for a low price. The converse is true for an operation’s digestate sales.

Exhibit 4.19. Sensitivity of Electricity and Fiber Prices: Scenario: Base + Co-digest+ Grants @40% + Bedding + PTC
Fiber Electricity $0 ton $50 ton $100 ton
$0.05 kWh 661,146 1,743,997 2,826,849
$0.07 kWh 1,774,588 2,857,440 3,940,292
$0.11 kWh 4,001,473 5,084,325 6,167,177 The model suggests a number of issues. First, though smaller operations are less feasible than larger ones, feasibility is largely a function of maximizing value from multiple income streams. When considering an AD investment, strong markets for digestate and electricity and grant support are necessary to offset investment costs. Because electricity is the main product, facilities must find a market for it that pays more than the commodity value. The main strategy is to use CHP to avoid retail electricity expenses, but other more lucrative arrangements may be available. Co-digestion, when possible, can benefit operations. Adding no-cost grasses, crop residue and especially food waste can increase yields and increase NPV; however, this benefit is moderate, especially where electricity prices are low. Tipping fees associated with co-digestion have the potential to generate a more significant impact if facilities can efficiently use the feedstock without incurring higher sorting, screening and digester maintenance costs. As discussed in this report’s supplement section, biogas upgrading can be an attractive option to CHP, especially for larger operations that sell the biomethane for vehicle fuel and qualify for environmental incentives. Non-Pecuniary Biomethane Benefits The feasibility analysis conducted above considers only monetary benefits. Non-pecuniary benefits associated with anaerobic digestion can also offer meaningful value to society at large (e.g., greenhouse gas emissions) or more directly to the digester operator. Benefits absorbed more broadly by society may benefit the AD operator in a number of ways including goodwill, brand image, environmental or social incentive payments, reduced disease or increase crop yields. These non-pecuniary benefits may support AD adoption for reasons other than financial rationale. Greenhouse Gas Emissions Reductions Research has shown that processing manure using anaerobic digestion can significantly reduce GHG emissions. Methane naturally produced by animal manure can be harvested and kept from escaping into the environment. This creates a low-impact — often negative-impact — fuel in terms of GHG (Paolini et al. 2018; CARB). Co-digesting organic waste that otherwise would go to landfills also reduces emissions. Odor Reduction Manure is commonly stored long-term (six months or more) to reduce the chance of water pollution. Long-term storage of raw (untreated) manure releases offensive odor, especially when the stored manure is agitated prior to emptying and applied to cropland. This can create conflicts with other economic development opportunities in rural areas. However, digested manure can be stored and recycled to the farm’s land base with far less odorous emissions (Zhu 2000). Less odor offers more flexibility in managing manure storage and application. This flexibility allows nutrients to be more efficiently recycled without impacting non-farm rural life.

In surveys (e.g., Cornell Pro-Dairy case studies), many AD operators cite odor reduction as a key consideration — often a factor listed ahead of tangible financial considerations — that affected them adding an AD into their livestock operations. Conservation of Crop Nutrients Anaerobic digestion does not consume key nutrients such as nitrogen (N), phosphorus (P) or potassium (K). Appropriately recycling these nutrients by applying them to crops — instead of disposing feedstocks (i.e., in a landfill) and purchasing fertilizer — saves money and the energy needed to produce fertilizers. Improvement in Crop Utilization of Manure Nutrients Applying manure when plant growth is minimal may lead to nutrient loss. Digester effluent can be stored long-term without significant odor problems. Doing such would allow farmers to apply nutrients to even sensitive crops in an agronomic, timely fashion and reduce the potential for surface water or groundwater contamination. Additionally, the forms of N and P nutrients in digestate are more available to crops than the forms present in raw manure. A digester decomposes organic materials and converts approximately half or more of the organic nitrogen into NH3 (Moller and Muller 2012). NH3 is more readily available for plant uptake and growth. However, it is also subject to significant losses through ammonia volatilization and must be managed carefully. Further, the optimal ratio of N, P and K to meet crop nutrient demand often differs from a feedstock’s (e.g., manure) composition; however, AD provides allows for partitioning nutrients (and moisture) for more efficient land application. Water Quality Improvement Improved land application of manure and sludge allows for better crop utilization and reduced nutrient pollution. Further, AD facilitates wastewater treatment from municipal sources. Residual organic matter is chemically stable, nearly odorless and contains significantly lower pathogen levels (Shen et al. 2015). Pathogen Reduction Anaerobic digestion kills many pathogens found in raw manure slurry. See Exhibit 4.20. Research has shown a 99.9% reduction of indicator organisms — those commonly used to evaluate a system’s performance related to killing pathogens — is possible. Digesters heated to mesophilic and thermophilic levels are very effective in denaturing weed seeds and reducing pathogens. Covered lagoon digesters, which operate at ambient temperatures, have a more modest effect on weed seeds and pathogens.
Exhibit 4.20. Pathogen and Nematode Survival Times in Digestate and Raw Slurry
Biogas System Raw Slurry
70oC 53oC 35oC 18-21oC 6-16oC Pathogen (seconds) (hours) (days) (weeks) (weeks) Salmonella T. 6 0.7 2.4 2 5.9 Salmonella D. 6 0.6 2.1 Coliform bacteria 20 0.6 3.1 2.1 9.3 Staphilococcus Aureus 8 0.5 0.9 0.9 7.1 Mycobacterium Para TB 8 0.7 6 Strep faecalis (FS) 3.92 mins 1 2 Group D Streptocococci 20 7.1 5.7 21.4 M.Bovis (TB) 90 22 Larvae of nematodes <0.6 <.7 <2.4 <2 <5.9
Source: Lukehurst et al. (2010)

Farm Diversification and Employment In some cases, farms may benefit from diversifying their operations. Diversification benefits include decreased farm impact of shifting commodity prices. A farm might also be able to produce a share of its energy needs and consequently lower its costs. At the same time, the AD could create jobs at the farm or community level. Waste Reduction Disposal costs for many substrates are high, and the substrates are not fully utilized for their energy and nutrient values. Society’s goal to eliminate organics from landfills motivates organic treatment and recycling. Treating these organics then recycling the nutrients (e.g., to the land) is a better option than incorporating waste into landfills or sewage treatment plants. Feasibility: Failure Rates An entirely different approach to assessing economic feasibility involves examining failure rates for on-farm anaerobic digestion. The failure rate for conventional farm anaerobic digesters from 1970 to the mid-1990s was about 80% (Lusk and Moser 1996). Between 1985 and 1995, the failure rate dropped to 20% (Lusk 1998). Simpler digester design, enhanced digester reliability, lower capital costs and significantly higher electricity and gas prices contributed to the failure rate decline. To gauge more recent failure rates, this analysis used the AgSTAR database, which showed that 283 biogas facilities had started (through 2019) and had 81 closed. Exhibit 4.21 shows the year digesters opened and when digesters closed. Although these data, especially the closure data, are not likely to be complete, the analysis is instructive. During the entire period, the data would imply a 23% failure rate. However, this overstates the situation. As shown, many closures were older facilities that may have been due for retirement. Figure 4.22 shows that many older digesters were closed, and relatively few newer digesters have closed. If only digesters built in the past 15 years are considered, then the failure rate of digesters in the AgSTAR database was 16%. As expected, this failure rate is, on average, decreasing. This suggests that biogas production can have feasible outcomes. Exhibit 4.21. Count of Digesters Opening and Closing by Year Exhibit 4.22. Count of Digester Opening and Closing by Year of Opening
Exhibit 4.21 Exhibit 4.22
Source: U.S. EPA AgSTAR. Livestock Anaerobic Digester Database
05
10152025303540
2005
2006
2007
2008
2009
2010
2011
2012
2013
2014
2015
2016
2017
2018
2019
Operations Closed Operations Opened
05
10152025303540
2005
2006
2007
2008
2009
2010
2011
2012
2013
2014
2015
2016
2017
2018
2019
Operations Opened Operations Closed
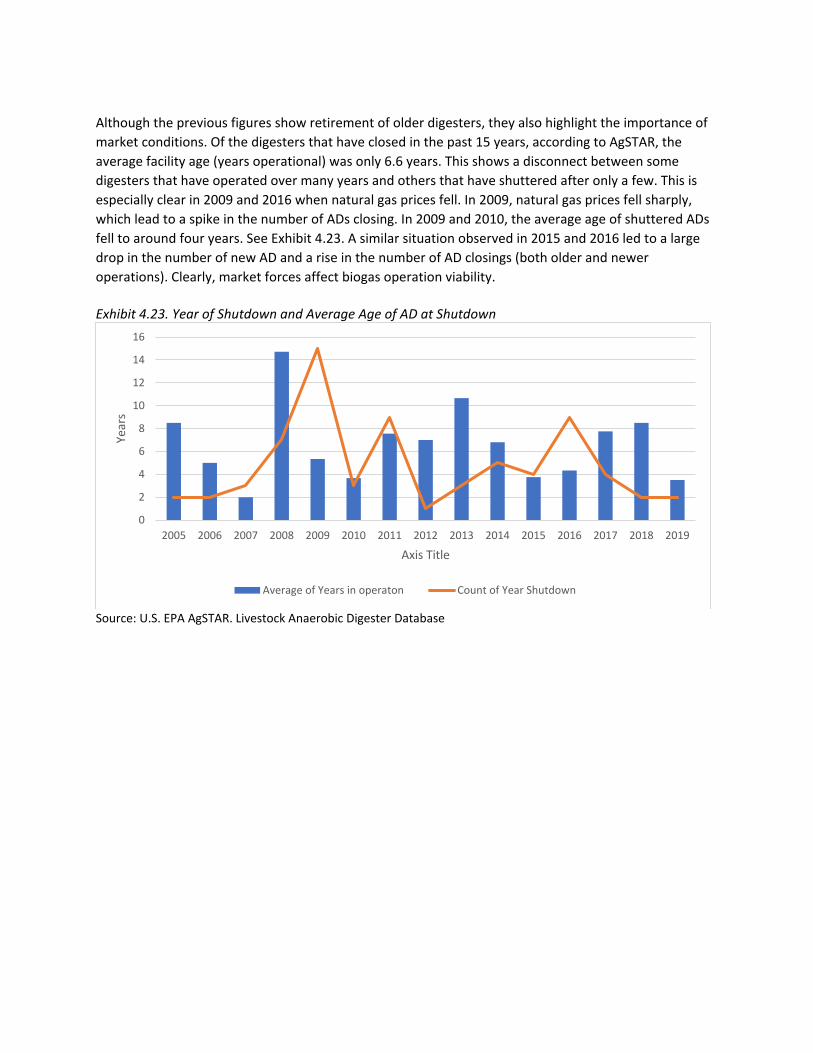
Although the previous figures show retirement of older digesters, they also highlight the importance of market conditions. Of the digesters that have closed in the past 15 years, according to AgSTAR, the average facility age (years operational) was only 6.6 years. This shows a disconnect between some digesters that have operated over many years and others that have shuttered after only a few. This is especially clear in 2009 and 2016 when natural gas prices fell. In 2009, natural gas prices fell sharply, which lead to a spike in the number of ADs closing. In 2009 and 2010, the average age of shuttered ADs fell to around four years. See Exhibit 4.23. A similar situation observed in 2015 and 2016 led to a large drop in the number of new AD and a rise in the number of AD closings (both older and newer operations). Clearly, market forces affect biogas operation viability. Exhibit 4.23. Year of Shutdown and Average Age of AD at Shutdown
Source: U.S. EPA AgSTAR. Livestock Anaerobic Digester Database
0
2
4
6
8
10
12
14
16
2005 2006 2007 2008 2009 2010 2011 2012 2013 2014 2015 2016 2017 2018 2019
Year
s
Axis Title
Average of Years in operaton Count of Year Shutdown
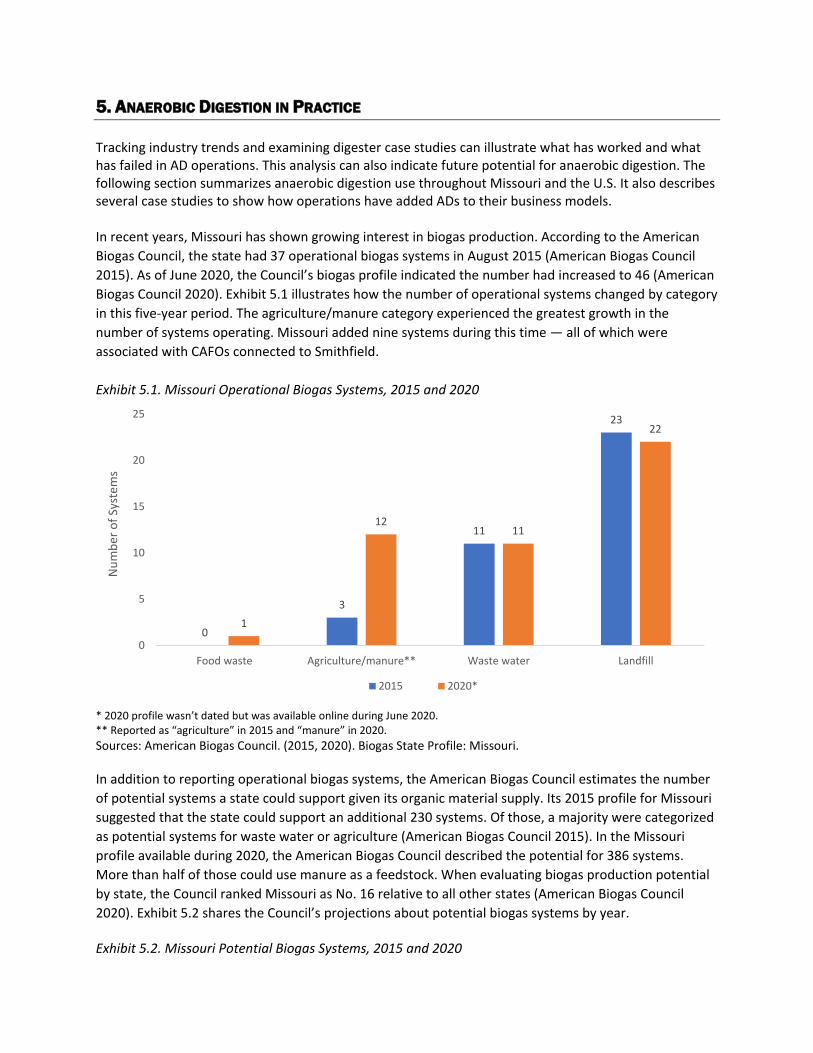
5. ANAEROBIC DIGESTION IN PRACTICE Tracking industry trends and examining digester case studies can illustrate what has worked and what has failed in AD operations. This analysis can also indicate future potential for anaerobic digestion. The following section summarizes anaerobic digestion use throughout Missouri and the U.S. It also describes several case studies to show how operations have added ADs to their business models. In recent years, Missouri has shown growing interest in biogas production. According to the American Biogas Council, the state had 37 operational biogas systems in August 2015 (American Biogas Council 2015). As of June 2020, the Council’s biogas profile indicated the number had increased to 46 (American Biogas Council 2020). Exhibit 5.1 illustrates how the number of operational systems changed by category in this five-year period. The agriculture/manure category experienced the greatest growth in the number of systems operating. Missouri added nine systems during this time — all of which were associated with CAFOs connected to Smithfield. Exhibit 5.1. Missouri Operational Biogas Systems, 2015 and 2020
* 2020 profile wasn’t dated but was available online during June 2020. ** Reported as “agriculture” in 2015 and “manure” in 2020. Sources: American Biogas Council. (2015, 2020). Biogas State Profile: Missouri. In addition to reporting operational biogas systems, the American Biogas Council estimates the number of potential systems a state could support given its organic material supply. Its 2015 profile for Missouri suggested that the state could support an additional 230 systems. Of those, a majority were categorized as potential systems for waste water or agriculture (American Biogas Council 2015). In the Missouri profile available during 2020, the American Biogas Council described the potential for 386 systems. More than half of those could use manure as a feedstock. When evaluating biogas production potential by state, the Council ranked Missouri as No. 16 relative to all other states (American Biogas Council 2020). Exhibit 5.2 shares the Council’s projections about potential biogas systems by year. Exhibit 5.2. Missouri Potential Biogas Systems, 2015 and 2020
0
3
11
23
1
1211
22
0
5
10
15
20
25
Food waste Agriculture/manure** Waste water Landfill
Num
ber o
f Sys
tem
s
2015 2020*

* 2020 profile wasn’t dated but was available online during June 2020. ** Reported as “agriculture” in 2015 and “manure” in 2020. Source: American Biogas Council. (2015, 2020). Biogas State Profile: Missouri. The following sections focus on providing examples of farms and businesses that have used anaerobic digestion as a tool to manage waste streams. Livestock Facility Projects For facilities that produce biogas from livestock manure, Exhibit 5.3 shows the most valuable product produced by a respective digester when it began operating. For example, if the digester has a CHP generator, then electricity is the assumed primary product. These data suggest that electricity was the most popular product until about 2017. At that point, new facilities began to increasingly produce renewable natural gas to use as vehicle fuel. This trend toward producing renewable CNG motivates the majority of new construction planning. A moderate number of new facilities still produce electricity, but the lower biogas value uses (e.g., flare, boiler) have been eliminated in recent years.
Exhibit 5.3. Livestock Digester Projects by Start Date and Product Type
Source: U.S. EPA AgSTAR. Livestock Anaerobic Digester Database
13
89
116
1238
225
116
70
50
100
150
200
250
Food waste Agriculture/manure** Waste water Landfill
Num
ber o
f Sys
tem
s
2015 2020*
0
5
10
15
20
25
30
35
1998
1999
2000
2001
2002
2003
2004
2005
2006
2007
2008
2009
2010
2011
2012
2013
2014
2015
2016
2017
2018
2019
2020
Proj
ects
Boiler/Furnace fuel CNG Electricity Flared Full-time

Agricultural digestion is not homogenous. Various agricultural systems and technology solutions are available. The types of digesters used have changed gradually. Prior to the turn of the century, plug flow reactors were quite popular, but they have seemingly fallen out of favor. From 2003 to 2013, plug flow and mixed plug flow digesters continued to be popular but lost market share to complete mix reactors. See Exhibit 5.4. In the past few years, complete mix digesters have been popular, but the majority of new facilities have been associated with covered lagoons. Exhibit 5.4. Livestock Digester Type
Source: U.S. EPA AgSTAR. Livestock Anaerobic Digester Database Historically, covered lagoons had been somewhat uncommon. Lagoons have always been an economical approach to biogas production, but they’ve had low yields, especially in areas outside the southern U.S. Accordingly, much of the investment in lagoons has been for California dairies. They ultimately produce RNG to supply California with vehicle fuel. Lagoons have also been adopted to utilize swine manure. In Missouri, projects with lagoons are being built to use swine manure. — at what is normally perceived as the edge of suitable climate. As Exhibit 5.5 shows, dairy manure continues to be the main feedstock, though swine manure has been used at an increasing rate. Exhibit 5.5. Livestock Digesters by Type of Livestock
Source: U.S. EPA AgSTAR. Livestock Anaerobic Digester Database
0
5
10
15
20
25
30
35
1979
1985
1986
1994
1997
1998
1999
2000
2001
2002
2003
2004
2005
2006
2007
2008
2009
2010
2011
2012
2013
2014
2015
2016
2017
2018
2019
2020
Complete Mix Covered Lagoon Mixed Plug Flow Plug Flow Other
0
5
10
15
20
25
30
35
1979
1985
1986
1994
1997
1998
1999
2000
2001
2002
2003
2004
2005
2006
2007
2008
2009
2010
2011
2012
2013
2014
2015
2016
2017
2018
2019
2020
Num
ber o
f Dig
este
rs
Cattle Dairy Poultry Swine Mix

Parsing the AgSTAR data by animal and digester type provides finer detail on the operations that tend to use certain digester technologies. According to this analysis — see Exhibit 5.6 — dairies predominantly used plug flow and complete mix digesters from 1979 to 2019. With poultry, complete mix digesters were most common. Swine facilities most often used covered lagoons and complete mix digesters. Exhibit 5.6. Share of Digesters by Animal Type, 1979-2019
Dairy Poultry Swine Plug Flow 40% 29% 7% Covered Lagoon 21% 0% 57% Complete Mix 32% 43% 27% IBR/Fixed Film 3% 0% 2% Other 4% 29% 7% Total 100% 100% 100%
Source: U.S. EPA AgSTAR. Livestock Anaerobic Digester Database The AgSTAR data also indicate how digester type varies by geography. Exhibit 5.7 presents the analysis for top states and orders them roughly from cooler states to warmer states; the most popular digester type by state is denoted in bold formatting. Covered lagoons were predominantly used in warmer states from 1979 to 2019. Missouri, North Carolina and California facilities were most likely to use covered lagoons. States with cooler climates tended to use plug flow or complete mix digesters. Exhibit 5.7. Share of Digesters by Top States, 1979-2019
State Covered Lagoon Plug Flow
Complete Mix
IBR/Fixed Film Other Total
WI 2% 58% 33% 0% 7% 100% VT 0% 75% 25% 0% 0% 100% MA 0% 13% 88% 0% 0% 100% MI 0% 13% 88% 0% 0% 100% NY 20% 33% 47% 0% 0% 100% PA 3% 27% 64% 3% 3% 100% IN 0% 80% 20% 0% 0% 100% MO 83% 0% 8% 8% 0% 100% NC 43% 7% 21% 0% 29% 100% CA 95% 3% 3% 0% 0% 100% WA 0% 78% 11% 0% 11% 100%
Source: U.S. EPA AgSTAR. Livestock Anaerobic Digester Database Average digester size varies by the type of animal manure and time period. Exhibit 5.8 averages operation sizes in five-year periods from 2000 to 2019. Cattle operations used AD technology relatively infrequently. When they have added digester operations, they tended to be large with 5,000 head on average. Dairy operations grew consistently larger and in the most recent period, they averaged more than 4,000 head. Poultry operations infrequently used AD, and single projects heavily influenced the average number of birds per digester. For the 20-year period, the average poultry operation had more than 300,000 birds. Swine operations with AD hovered around 30,000 head between 2010 and 2019. Although the database shows large disparities between small and large operations, operations installing digesters tend to be relatively large CAFOs.

Exhibit 5.8. Average Number of Livestock per Digester, 2000-2019 Cattle Dairy Poultry Swine 2000-2004 1,487 65,417 2005-2009 4,500 2,109 735,000 17,279 2010-2014 5,655 2,795 111,833 28,521 2015-2019 4,210 80,000 32,903 Total Period 5,193 2,650 314,250 36,732
Source: U.S. EPA AgSTAR. Livestock Anaerobic Digester Database Livestock Case Examples Many case studies and surveys have evaluated agricultural biogas producers. Case studies can help to detail facilities from a design perspective. This approach is instructive for farm operations considering biogas production. It is useful to showcase how a given facility chose equipment and configured itself to efficiently operate given its inherent constraints and opportunities. Exhibit 5.9 shows a small sample of the livestock-based biogas cases studies collected as part of Cornell University’s PRO-Dairy Program (https://prodairy.cals.cornell.edu/environmental-systems/anaerobic-digestion/case-studies/). Exhibit 5.9. Livestock Manure Case Examples
Case 1 Case 2 Case 3 Case 4 Case 5 Case 6
Digester type Complete mix Plug Flow Hybrid Plug-
Flow Complete Mix Plug Flow Complete
mix
Date commissioned 2015 2012 2014 2010 2010 2010
Influent
Raw manure, food waste, milk
waste water Raw Manure Raw Manure
Raw manure, permeate, waste
milk Raw manure,
whey permeate Raw
Manure
Stall bedding material Separated solids Separated solids Sand Separated solids Separated solids Separated
solids
Number of cows 1,750 1,270 3,360 2,000 2,300 390
Cover material Flexible
membrane Concrete hard-top Flexible
membrane Flexible
membrane Concrete hard-
top Flexible
membrane
Temperature °F 100-104°F 100 100 96-100 96-100 100 Total loading rate (gal. per day) 48,500 30,000 75,000 40,000 6,300
Hydraulic retention time (d) 27.5 20 20 17 24 28
Liquid-solid separation Yes Yes Yes screw press screw press Yes
Cleaning H2S, De-water H2S, De-water H2S, De-water
Biogas utilization Guascor 500 kW
CHP Guascor 225 kW; biogas fired boiler
Guascor 502 kW CHP
Guascor 380-kW Generator
476-kW Guascor Generator
100-kW engine genset
Carbon credits Yes No Yes No No No
Co-products Cow bedding Net metered
electricity, bedding Net metered
electricity
Net metered electricity, bedding,
bedding retail
Net metered electricity,
bedding
Net metered
electricity, bedding
Reasons for investment Environmental,
Economic Environmental, Odor, Spreading
Grants, economics,
bedding electricty and bedding costs
Capital Cost $3.5m $1.8m $1.8m $1.3m $1.6m 1) Oliver and Gooch (2016) Anaerobic Digestion at Noblehurst Farms, Inc.: Case Study 2) Oliver and Gooch (2016) Anaerobic Digestion at Twin Birch Farm: Case Study

3) Oliver and Gooch (2016) Anaerobic Digestion at Spruce Haven Farm, LLC: Case Study 4) Boerman, Pronto and Gooch (2014) Anaerobic Digester at Zuber Farms: Case Study 5) Boerman, Pronto and Gooch (2014) Anaerobic Digester at Lamb Farms: Case Study 6) Boerman, Pronto and Gooch (2014) Anaerobic Digestion at Wagner Farms: Case Study
The collected case studies suggest a number of similarities among operations. First, note that the above list describes only dairies, which represent the vast majority of livestock digesters. Dairies with digesters often have similar processes. In addition to digesting manure, they often leverage dairy product waste streams (e.g., milk waste) to increase biogas yield. Virtually all employ a system that dewaters the digestate and uses it for livestock bedding. Many operations list access to bedding as a major motivation to investing in a digester. Most systems use a CHP genset. The heat facilitates the digester, and the farm or dairy may use the electricity and sell the excess (e.g., net metering). Most systems have some form of H2S removal, though the sophistication varies significantly. These systems also have significant variations. Interestingly, operations had significantly different motivations for investing in digesters. Many claimed environmental benefits were most important. The operator captures some of such benefits. For example, pathogen reduction can protect herd health, especially when using digestate as bedding. Nutrient loading can improve manure spreading economics. Odor control can decrease neighbor concerns. The second most commonly cited rationale for digester investment was cost avoidance — in particular, reducing costs for electricity, bedding and spreading. Availability of grants and incentives was another important driver affecting investment decisions. Some but not all operations received environmental incentives (e.g., RINs). Grants and subsidized loans to construct facilities were common. Less common were operating incentives. Although some operations diversified feedstock streams by using dairy wastes, some were more innovative in marketing co-products. Some received tipping fees, which likely bolstered profitability. On-farm bedding was commonly used, and in a few cases, facilities dried bedding into a saleable product. When sold off-farm, bedding commonly sold for $20 per ton. Operation size varied. Although it is hard to generalize from few examples, a representative size might be 1,000 lactating cows leading to a manure loading rate of 40,000 gallons per day. For a facility that handles manure from 1,000 lactating cows, the total capital cost was around $1,000,000. However, cost varied considerably by operation type. Note, though farms owned and operated a majority of digesters, it is increasingly common for a third party to own or manage the digester. This can occur in a number of configurations. One common approach is for the digester builder or contractor to own or operate the facility. In other cases, the biogas purchaser may own or operate the digester. In addition to existing operations, a number of large projects have been announced recently that are telling of the industry’s direction. They include the following:
• In western New York, Brightmark is involved in a dairy biogas project. It will partner with six farms to extract methane from 265,000 gallons of dairy manure per day and convert it into RNG and other products. Beginning in early 2021, the project is anticipated to produce about 305,000 MMBtu of renewable natural gas each year. Previously, the anaerobic digesters on these farms produced electricity; the investment will enable facilities to clean the methane gas and convert
it into RNG. The gas is expected to be injected into a local interstate gas pipeline (Brightmark Energy 2020).
• Aemetis Biogas LLC is constructing a biogas upgrading facility in California to convert dairy biogas to renewable natural gas. The Aemetis Central Dairy Digester and Pipeline Project is designed to capture methane gas emitted from dairy manure lagoons, pre-treat the biogas at each dairy to remove harmful components and transport the methane via pipeline to the central facility. There, the gas will be upgraded. Aemetis Biogas is currently developing more than a dozen anaerobic digesters at local dairies, and it has plans to expand (Voegele 2020).
• Brightmark also signed a manure supply agreement with two South Dakota dairy companies to capture methane produced by nearly 12,000 dairy cows and convert it into renewable natural gas. This project is anticipated to produce 217,000 MMBtu of renewable natural gas each year (Brightmark Energy 2020).
• In central Florida, Brightmark has partnered with four dairy farms to build and operate three anaerobic digesters that will convert 230,000 tons of dairy manure per year from 9,900 cows into renewable natural gas. After the project is complete, the digesters will generate an estimated 171,000 MMBtu of renewable natural gas each year. The gas will be delivered into the local interstate gas pipeline system (Brightmark Energy 2020).
• Four New York dairies and Brightmark announced a partnership in 2019; a fifth farm was expected to be added to the partnership later. With anaerobic digesters, these farms produced their own electricity and sold excess power to the grid. Brightmark’s involvement would enable the digester systems to undergo refurbishing and produce RNG using gas upgrading equipment. One of the farms would serve as an RNG collection point and then inject the gas into the Empire pipeline. Annual RNG production would total roughly 260,000 MMBtu (Waste Today 2019).
• California Bioenergy LLC and Bloom Energy are collaborating to convert biogas from dairy waste into renewable electricity via fuel cell. This electricity intends to power electric vehicles throughout California (California Bioenergy 2019).
• To convert methane from U.S. dairy farms into renewable natural gas, Dominion Energy and Vanguard Renewables have committed $200 million. Multiple projects are under development in Georgia, Nevada, Colorado, New Mexico and Utah. Additional projects are planned nationwide. Dominion Energy will own the projects and market the RNG, and Vanguard Renewables’ subsidiary Clean Energy Investment USA dba Vanguard Renewables Ag will design, develop and operate the projects (Dominion Energy 2019).
• Threemile Canyon Farms and Equilibrium opened a facility located near Boardman, Oregon, that uses manure from 33,000 dairy cows to feed an anaerobic digester. A biogas clean-up system injects renewable natural gas into the natural gas grid. The $55 million project began injecting RNG into the grid in July 2019, and the RNG is used as transportation fuel in California (Iogen 2019).
Missouri Cases In Missouri, several projects, motivated at least in part by environmental incentives, have emerged. Roeslein Alternative Energy and Green Energy Sustainable Solutions Inc. (GESS) will operate more than a dozen large-scale biogas production facilities across the state. Exhibit 5.10 summarizes these biogas digester projects, which have a number of commonalities. They all will co-digest animal manure with agricultural residue or grasses. These large-scale projects all will upgrade gas, presumably for use in vehicle fuel. In some cases, they will inject the upgraded gas into the natural gas pipeline.

Exhibit 5.10. Missouri Livestock Biogas Digester Inventory
Project Name City Technology Stage Year Livestock Head Hampton Feed Lot Digester Triplet IBR Operational 2012 Cattle 2,500 Missouri University Campus Digester Columbia Complete Mix Operational 2014 Swine 20 Roeslein Alternative Energy Unionville Covered Lagoon Construction 2019
Swine & Biomass
31,795 Roeslein Alternative Energy Princeton Covered Lagoon Construction 2019 44,160 Roeslein Alternative Energy King City Covered Lagoon Construction 2019 32,000 Roeslein Alternative Energy Harris Covered Lagoon Operational 2017 14,150 Roeslein Alternative Energy Albany Covered Lagoon Operational 2016 28,800 Roeslein Alternative Energy Mercer Covered Lagoon Construction 2019 60,000 Roeslein Alternative Energy Browning Covered Lagoon Operational 2014 24,700 Roeslein Alternative Energy Browning Covered Lagoon Construction 2018 24,700 Roeslein Alternative Energy Green City Covered Lagoon Operational 2017 21,000 Roeslein Alternative Energy Unionville Covered Lagoon Construction 2018 79,500 GESS Mexico Planned 2020
Cattle/ Swine & Biomass
GESS Laddonia Planned 2020 GESS Vandalia Planned 2020 GESS Tripplett Planned 2020 GESS Tuscumbia Planned 2020
Source: U.S. EPA AgSTAR (2019), Authors Hampton Feedlot In Triplett, Missouri, a 210,000-gallon anaerobic digester capable of handling manure from 2,400 cattle — a $4 million investment — has operated at the Hampton Feedlot (Greer 2011). Hampton Alternative Energy Products, which Hampton Feedlot Inc. wholly owns, has run the digester. Within Missouri, the Hampton digester was the first intended to process waste from beef cattle (Missouri Department of Economic Development – Division of Energy, Inova Energy Group and Elevate Energy 2015). The facility first started adding manure to the digester during December 2011 (Rich 2015). The digester, produced by Andigen LLC, was built to have a modular design and induced blanket reactors to treat manure in the mesophilic range (Greer 2011). It has six steel tanks (Missouri Department of Economic Development – Division of Energy, Inova Energy Group and Elevate Energy 2015). The facility had noted plans to co-digest manure with other waste streams (Greer 2011). However, in June 2020, the AgSTAR database maintained by U.S. EPA indicated the facility did not co-digest feedstocks at the time (U.S. Environmental Protection Agency 2020). For the Hampton Feedlot, the digester worked as a possible manure management option because of the feedlot’s design. At Hampton’s facility, slatted floors in four confinement barns covered pits for collecting manure. Manure not collected in the pits and processed using the digester would be applied to land. To achieve the appropriate moisture level, the facility would add liquid from its lagoon. By diverting about half of the feedlot’s manure production to the digester, the feedlot would reduce the strain on the facility’s lagoon and keep the lagoon in good condition (Greer 2011). A 2015 story in the High Plains Journal noted the lagoon’s condition had improved (Rich 2015). The Hampton digester produces biogas and solids (Greer 2011). A 300 kWh generator uses the biogas to power its operations and produce electricity. The operations have sold electricity it didn’t need to Kansas City Power and Light (Missouri Department of Economic Development – Division of Energy, Inova Energy Group and Elevate Energy 2015). According to the AgSTAR database, the facility annually produces more than 4.4 million kWh of electric power from waste generated by 2,500 cattle (U.S. Environmental Protection Agency 2020).
Drying and bagging the solids would yield a soil amendment. To dry the solids and kill pathogens, Hampton would use waste heat generated by the digester (Greer 2011). The temperature used is warmer than 165 degrees. During 2014, Hampton began marketing a fertilizer made from the dried solids. Branded as Nature’s E.N.V., the fertilizer received approval from the Organic Materials Review Institute to work as an organic fertilizer (Rich 2015). It also received USDA Certified Biobased designation (Missouri Grown USA). Nature’s E.N.V. formed as a Hampton Feedlot and Hampton Alternative Energy subsidiary (OECD and USDA 2015). At its Triplett facility, Hampton sells the product. It has also shared plans to distribute the product at retail (Missouri Grown USA). To minimize the amount of liquid added to the lagoon, the facility also considered developing a liquid fertilizer (Rich 2015) Several funding sources supported Hampton’s work with adding and operating the digester. Those include a Rural Energy for America Guaranteed Loan from USDA Rural Development, Business and Industry Guaranteed Loan from USDA Rural Development, Value-Added Producer Grant from USDA Rural Development (OECD and USDA 2015) and Value-Added Grant from the Missouri Agricultural and Small Business Development Authority (Greer 2011). Roeslein Alternative Energy and Smithfield Foods Roeslein Alternative Energy and Smithfield Foods operate the primary biogas sites in Missouri that use livestock manure as a feedstock. They began collaborating in 2014 and committed $100 million to northern Missouri projects related to biogas (Smithfield Foods 2014). Other estimates suggest the project cost would total $120 million (U.S. Environmental Protection Agency 2018). A February 2020 announcement suggested another $45 million investment in the project (Smithfield 2020). The project concept involves installing Roeslein anaerobic digesters at Smithfield finishing facilities. To make use of the existing lagoons at these facilities, the effort would involve covering lagoons with an impermeable synthetic material made from 80-mil high-density polyethylene and low-density polyethylene (Smithfield Foods 2014 and U.S. Environmental Protection Agency 2018). The four-acre lagoons could contain roughly 15 million gallons of manure (Rich 2016). Of the gases captured beneath the coverings, an estimated 65% would be methane (Alumbaugh 2019). Ultimately, the project has had plans to cover 88 lagoons for biogas collection, and doing so would yield more than 2.2 billion cubic feet of renewable natural gas annually to distribute via pipeline (U.S. Environmental Protection Agency 2018). In 2016, 41 of the lagoons had covers (Rich 2016). Per million Btus, the gas’ value would range from $18 to $20 (Alumbaugh 2019). The Smithfield-Roeslein partnership has been described as the largest U.S. project intended to generate renewable natural gas from hog manure (U.S. Environmental Protection Agency 2018). Through the project, nine Missouri swine operations are converting to renewable natural gas production (U.S. Environmental Protection Agency 2018). With the $45 million investment announced in February 2020, 85% of the Missouri-located Smithfield finishing spaces would have the capability to produce renewable natural gas. For Smithfield, expanding renewable natural gas production will move it closer to its goal of a 25% drop in greenhouse gas emissions by 2025 (Smithfield 2020). Reporting from Successful Farming in 2018 shared that Smithfield intends to have equipped nearly all of its Missouri company-owned hog finishing facilities to generate renewable natural gas in the following 10 years (Freese 2018).

Monarch Bioenergy formed in 2019 as a Smithfield-Roeslein joint venture focused on the manure-to-energy projects (Gray 2020). Located in Albany, Missouri, Ruckman Farm was the first of Smithfield’s facilities in Missouri to cover lagoons into operations capable of generating biogas and producing renewable natural gas. With its nine covered lagoons, Ruckman Farm creates enough biogas to equal 1.9 million gallons of diesel per year. To collect the manure, scrapers move material from the buildings to the lagoons. The digestion process yields biogas, which a pressure swing adsorption facility transforms into renewable natural gas. The farm has a pipeline interconnection that makes it possible to inject the renewable natural gas into the American Natural Resources transmission system. Element Markets buys the renewable natural gas, which is used as vehicle fuel in California (U.S. Environmental Protection Agency 2018 and Houghton 2017). Element Markets in particular works with fleet vehicles (BioCycle 2017). Private equity provided by Rudi Roeslein, CEO of St. Louis-based Roeslein and Associates and the Roeslein Alternative Energy founder, funded the Ruckman Farm project (U.S. Environmental Protection Agency 2018 and Houghton 2017). Digestate produced at Ruckman Farm is left in lagoons (American Biogas Council). The impermeable lagoon covers catch rain, which is treated like stormwater and may be used to water the facility’s hogs (U.S. Environmental Protection Agency 2018). At the Valley View Farm site near Greencastle, Missouri — another one of Smithfield’s hog finishing facilities — six of the 14 covered lagoons had access to the methane purification system, according to a Successful Farming report in November 2018. The other eight lagoons were flaring at the time. The Valley View digester has membrane technology, and it operates modular systems (Freese 2018). Exhibit 5.11 shares more information from the Argonne National Laboratory database about the Ruckman Farm and Valley View projects and one other in Missouri with biogas upgrading capabilities. Exhibit 5.11. Roeslein Biogas Upgrading Facilities
Project Name
Farm Type County
Start Date
Operational 2018?
Digester Type
Project Description
Popu
latio
n Fe
edin
g Di
gest
er
SCFD
raw
gas t
o pr
ojec
t
SCFD
Upg
rade
d ga
s
MMBt
u/yr
GGE
/yr
Roeslein Locust Ridge
Swine Sullivan 2016 YES Covered Lagoon
Part of nine-farm project
encompassing 88 manure lagoons.
Roeslein will develop,
install, own and operate
processing to capture, purify
and sell the biogas (Guild
PSA upgrading
technology).
14,150 54,795 91,324 30,000 267,394
Roeslein Ruckman Swine Gentry 2016 YES Covered
Lagoon
79,200 (based
on 2017)
109,589 182,648 60,000 534,788
Roeslein Valley View
Swine Sullivan 2017 YES Covered Lagoon
52,800 (based
on 2017)
136,986 228,311 75,000 668,485
Source: Mintz and Voss (2019)

Operations associated with Roeslein and Smithfield have certified three pathways for carbon intensity with the California Air Resources Board. Exhibit 5.12 describes the pathways. In summary, the gas generated from swine manure enters the national pipeline in Missouri. From there, it is used in California as CNG or liquified in Arizona and trucked into California for final use. The other pathway involves digester sites trucking RNG or LNG from the farm to the pipeline injection point. These pathways yield carbon intensities as low as -372. The Smithfield-Roeslein effort has also opened opportunities to provide a natural gas supply to local communities. During August 2019, Smithfield announced that it had constructed a low-pressure natural gas transmission line to the Milan, Missouri, natural gas pipeline from one of its farms (Smithfield 2019). Exhibit 5.12. Roeslein (via Element Markets Renewable Energy LLC): Low Carbon Fuel Standard Pathway Description
App # Feedstock Fuel Type
Certified CI
Certification Date Facility (ID) Pathway Description
B001101 Swine Manure CNG -372.35 4/10/2019
Ruckman Farm RNG pipelined to Los Angeles, California
B001102 Swine Manure LNG -360.37 4/10/2019
Ruckman Farm
RNG pipelined to liquefaction facility in Topock, Arizona; delivered by truck to California
B001103 Swine Manure LCN -356.83 4/10/2019
Ruckman Farm
RNG pipelined to liquefaction facility in Topock, Arizona; delivered by truck to and regasified in California
B000901 Swine Manure CNG -323.83 1/31/2020
Locust Ridge Farm
RNG transported by truck to pipeline injection point; delivered via pipeline to Los Angeles, California
B000902 Swine Manure LCN -308.93 1/31/2020
Locust Ridge Farm
RNG transported by truck to pipeline injection point; delivered via pipeline to liquefaction facility in Topock, AZ delivered by truck to and re-gasified in CA
B000903 Swine Manure LNG -312.47 12/31/2019
Locust Ridge Farm
LNG transported by truck to pipeline injection point; delivered via pipeline to liquefaction facility in Topock, Arizona; delivered by truck to California
B001001 Swine Manure CNG -345.68 1/31/2020
Valley View Farm
RNG transported by truck to pipeline injection point; delivered via pipeline to Los Angeles, California
B001002 Swine Manure LNG -334.41 1/31/2020
Valley View Farm
RNG transported by truck to pipeline injection point; delivered via pipeline to liquefaction facility in Topock, Arizona; delivered by truck to California
B001003 Swine Manure LCN -330.87 1/31/2020
Valley View Farm
RNG transported by truck to pipeline injection point; delivered via pipeline to liquefaction facility in Topock, AZ; delivered by truck to and re-gasified in CA
Source: CARB ww3.arb.ca.gov/fuels/lcfs/fuelpathways/pathwaytable.htm Converting hog operations to use anaerobic digesters represents the first step in the multiphase project pursued by Roeslein and Smithfield. The second phase will involve growing prairie grass and harvesting it as another feedstock (U.S. Environmental Protection Agency 2018). The facilities would treat the prairie grass like silage (Freese 2018). Integrating the prairie grass biomass into the plan would help to control seasonal variation in biogas production. Plus, it would help Roeslein to achieve its 30-year, 30-million-acre native prairie restoration goal (Houghton 2017). To study how to use grasses in alternative fuel production, the project formed a partnership with The Nature Conservancy. At the Dunn Ranch, 1,000 acres were dedicated for research purposes (BioCycle 2017). Per acre, the native grass would supply 4 tons to 10 tons of biomass, according to Iowa State University research (Alumbaugh 2019). Providing monarch butterfly habitat has been another initiative of importance to Smithfield. In Missouri, it increased pollinator habitat area during 2018 by nearly 1,000 acres. The Valley View facility is one
location with pollinator habitat acreage at its site. Seeded to a forb-legume mix of 25 species, the pollinator habitat intends to support pollinators throughout the growing season (Freese 2018). Green Energy Sustainable Solutions Based in Raleigh, North Carolina, Green Energy Sustainable Solutions (GESS) has a global presence. During June 2019, it had more than 350 projects total (Dumas 2019). GESS recently made several large investments in the U.S. biogas marketplace. During a May 2019 briefing held by the American Biogas Council and the Environmental and Energy Study Institute, GESS International stated it had 20 biogas plant locations prepared for 2019 construction. Another 20 projects were still in the development stage. The company’s investments follow a similar strategy across a number of locations. Annually, each plant accepts an estimated 270,000 tons of waste — manure and green residues — to produce 550,000 MMBtu of RNG. These facilities cost roughly $40 million each, and each would create 16 permanent jobs (Environmental and Energy Study Institute and American Biogas Council 2019). Farms working with GESS International have three potential revenue streams. First, GESS International leases the acreage needed to construct and operate the biogas plants. Second, the farms may sell manure — predominantly swine or dairy manure — to the plants. Third, the farms may supply green biomass to the facilities (Environmental and Energy Study Institute and American Biogas Council 2019). Missouri, Idaho and North Carolina represent biogas facility target markets for GESS International (Environmental and Energy Study Institute and American Biogas Council 2019). GESS has plans to build five digesters in Missouri. Audrain County would have three plants, and Chariton and Miller counties would each have one plant (Nelson 2019). East Central Missouri Biogas, an entity composed of hog farmers from Audrain County, has partnered with GESS on some projects (Dunlap 2019a) and owns a portion of those facilities. The group has also sought investors (Dunlap 2019b). For the facilities near Laddonia, GESS has said plant capacity would total 170,000 tons of animal waste and 80,000 tons of biomass per facility. Manure will be piped to storage tanks from farms within a 5-mile radius of a given facility. Farms located farther from the biogas facilities could use tankers to transport manure to the digesters (Dunlap 2019b). Potential biomass feedstocks include corn silage (Dunlap 2019a), ethanol plant byproducts and energy crops — namely, sorghum and triticale. Facilities would press the ethanol byproducts and biomass to extract water. Facilities would then store the extracted water in a retention pond, and the water would be available for irrigation. The plants would depend on solar power as a major energy source (Dunlap 2019b). Annually, each plant’s methane output would total an estimated 550,000 MMbtu (Engineering News-Record 2019). After injecting the biogas into the national pipeline, it will travel to markets in California and Oregon. Producers may use the digestate as an organic fertilizer (Dunlap 2019b). Construction on the Missouri facilities was slated to begin during fall 2019 and conclude by the end of 2020. Developing these five projects would require nearly $185 million in investment (Nelson 2019). In Idaho, GESS planned to operate digesters at dairy farms, which would benefit from capturing revenue from the manure produced by their animals (Dumas 2019). Construction of two North Carolina facilities — one in Stantonsburg and another in Monroe — was slated to begin in early 2019 and conclude during 2020. Each plant intended to use swine manure and green biomass as feedstock material (GESS

International 2018). A planned facility in Orrum, North Carolina, listed poultry waste as a feedstock that it would process at a plant equipped with four digesters. The Orrum facility also intended to process swine waste and green biomass (Futch 2018).
Digesters Processing Food Waste Digesting food waste represents an opportunity for biogas operations. Food manufacturers may employ dedicated digesters to handle their waste streams. Farms and other biogas operations, such as those operated by water resource recovery facilities (WRRFs), can co-digest food waste. The U.S. EPA has worked to survey digesters that use food waste as a feedstock material. The surveys, conducted annually from 2017 to 2019, sought to learn about practices followed by three categories of digesters that process food waste: stand-alone digesters, on-farm digesters or wastewater treatment digesters that co-digest food waste. The agency has released findings from the 2017 and 2018 surveys. The 2017 survey captured data for 2015, and the 2018 survey captured data for 2016 and 2018. The following section reviews key survey findings. Based on 131 survey responses, total food waste processing capacity in 2018 for all three digester types was nearly 24 million tons per year. On average, each stand-alone digester processed 459,000 tons of food waste per year. In contrast, on-farm digesters processed 16,000 tons of food waste on average in addition to other feedstocks (i.e., manure). Survey respondents also reported biogas production. Production reported by 119 respondents totaled 40,304 standard cubic feet per minute (SCFM), equivalent to 126 megawatts (MW) installed capacity and 939 million kilowatt-hours (kWh) generated per year See Exhibit 5.13. This implies the average digester produced 339 SCFM of biogas. WRRFs had the largest average production at 384 SCFM. Exhibit 5.13. Digester Biogas Production and Processing Capacity, 2016
Digester Type SCFM MW kWh/yr (million)
Stand-alone digesters n=40 10,498 33 246 On-farm co-digesters n=12 4,053 13 97 Co-digestion systems at WRRFs n-=67 25,753 80 596 Total n=119 40,304 126 939
Source: Pennington (2019) In terms of how food waste digesters used the biogas produced, the majority of those responding to the 2018 survey used biogas in CHP. See Exhibit 5.14. For stand-alone and on-farm digesters, the second most common biogas use was selling electricity to the grid. Boilers for heat were less popular, though wastewater treatment facilities often used them to heat their thermophilic, high-rate AD. Few operations produced RNG.

Exhibit 5.14. Food Waste Biogas Uses, 2018
Stand-Alone Digesters
(n=43)
On-Farm Co-Digesters
(n=16)
Co-Digestion Systems at
WRRFs (n=70) Produce heat and electricity (CHP) 60% 81% 76% Fuel boilers and furnaces to heat digesters 9% 25% 60% Fuel boilers and furnaces to heat other spaces 30% 25% 33% Produce electricity (sold to grid) 40% 69% 16% Produce electricity used behind the meter (including net metering) 30% 50% 21% Produce mechanical power - 6% 4% Compressed to vehicle fuels: used for company fleet/personal vehicles 7% - - Compressed to vehicle fuels: sold to customers 5% - - Renewable natural gas (inject to pipeline) - - 3%
Source: Pennington (2019) In the survey, facilities also indicated whether they had gas cleaning systems. Such systems were utilized at 78% of stand-alone food waste digesters that answered the question compared with 56% of on-farm co-digesters and 69% of digesters at WRRFs. Systems most commonly removed moisture and sulfur from biogas. See Exhibit 5.15. This is likely accomplished by allowing the liquid to condense and removing the targeted particles from the biogas. Wastewater facilities commonly removed siloxanes, but other facilities did this less often as siloxanes are typically only a problem for landfill gas ADs. Although this survey doesn’t completely inventory industry practices, it is instructive. Based on these results, most biogas facilities do some type of biogas treatment to facilitate how the biogas is used. Exhibit 5.15. Biogas Cleaning Practices Used by ADs Processing Food Wastes, 2018
Stand-Alone Digesters On-Farm Co-Digesters Co-Digestion at WRRFs
Facilities % Removing Compound Facilities % Removing
Compound Facilities % Removing Compound
Sulfur 28 80% 6 67% 35 73% Moisture 23 66% 8 89% 43 90% Siloxanes 5 14% 1 11% 43 90% Carbon Dioxide 4 11% 1 11% 4 8% Hydrogen Sulfide 1 3% 1 11% 4 8% Compressed gas 1 3% 0 3 6% VOCs 1 3% 0 0
Source: Pennington (2019) Digestate use tended to vary by digester type. On-farm digesters used the digestate predominantly for animal bedding, and WRRFs predominantly dewatered the digestate for land application. Stand-alone operations were more likely to use the digestate in other means, such as composting for resale, but they also land-applied it. Liquid digestate usage also differed by operation type. See Exhibit 5.16. On-farm digesters land-applied the liquid, and WRRFs largely recirculated the liquid through the digester. Stand-alone digesters commonly discharged the liquid to a wastewater treatment facility or land-applied it.

Exhibit 5.16. Solid Digestate Uses, 2018
Stand-Alone
Digesters (n=44) On-Farm Co-
Digesters (n=16) Co-Digestion at WRRFs (n=71)
De-watered and land applied 23% 38% 58% Composted into a reusable/ salable product 36% 19% 11% Landfilled 9% 15% Other 32% 19% 13% Processed into animal bedding 63% Dried into a reusable/ salable product (e.g., fertilizer) 13% Land applied as is with no dewatering or drying 7% 14% Incinerated 1%
Source: Pennington (2019) Liquid Digestate Uses, 2018
Stand-Alone
Digesters (n=39) On-Farm Co-
Digesters (n=16) Co-Digestion at WRRFs (n=71)
Recirculated through digester 26% 44% 85% Reused as fertilizer via land application 44% 100% 10% Discharged to a wastewater treatment plant 51% Other 8% 15%
Source: Pennington (2019) Food waste digesters in the U.S. process a wide variety of feedstocks — some more common than others. Feedstock type used varies based on local availability, demand and type of digester accepting the feedstock. Exhibit 5.17 shows that beverage processing (e.g., beer), food processing and fruit/vegetable wastes were the most commonly used feedstocks by stand-alone digesters. Food processing industry waste; fats, oils and grease; and beverage processing waste were the top three feedstocks for both on-farm digesters and WRRFs. In terms of feedstock sources, 87% of stand-alone ADs responding to the 2018 survey received feedstock from food or beverage processors. Industrial, restaurants and food service, grocery stores and supermarkets, biodiesel production and fruit and vegetable farms were also main feedstock contributors to the stand-alone digesters. Exhibit 5.17. Feedstocks Used at Stand-Alone Facilities, 2018
Stand-Alone Facilities Processing
This Feedstock
Share of Stand-Alone Facilities Processing
This Feedstock Beverage processing industry waste 33 73% Food processing industry waste 26 58% Fruit/vegetative wastes 24 53% FOG 23 51% Food service waste, pre-& post-consumer 18 40% Retail food waste 17 38% Crude Glycerin 17 38% Source-separated commercial, institutional or residential organic wastes 14 31% Manure 8 18% Wastewater solids (sludge) 8 18% Rendering wastes 7 16% Crop residues 7 16% Other 5 11% Mixed yard waste 4 9%
Source: Pennington (2019)

Food Waste Case Examples In addition to the surveys conducted by EPA, a number of case studies exist about anaerobic digestion within the food industry. One informative study is Kramer (2011), which produced case studies of 12 facilities in the Upper Midwest. Each facility was a food manufacturer that used anaerobic digestion to treat the waste stream. The cases focus primarily on the operations’ equipment, configuration and operation. Exhibit 5.18 shares details of the respective cases. In the cases, anaerobic digestion’s primary objective was treating waste streams. Sometimes, AD facilitated an on-site treatment process, and in other instances, it was a pre-treatment to allow more economical release to wastewater treatment facilities. However, a large share of the operations used the gas for process heat via some type of boilers. It was also common to flare all the biogas. The companies that did this were also likely to be considering capturing the energy in some fashion. Digester type was largely determined by the type of feedstock used. The most common was UASB, which was optimal with highly liquid, homogenous feedstocks such as those at a brewery. Exhibit 5.18. Food Waste Case Study Overview
Company Digester Type Year
Installed Volume Use Role American Crystal Sugar Anaerobic contact process 1979 185220 MMBtu drum driers on-site Anheuser Busch Upflow anaerobic sludge blanket 1991 boiler for hot water on-site Kraft Foods Upflow anaerobic sludge blanket 2011 250 scfm CHP pre-treatment City Brewing Company Upflow anaerobic sludge blanket 1982 170 scfm CHP pre-treatment General Mills Complete Mix 1997 6-10 scfm boiler for hot water pre-treatment JBS, Green Bay Inc Anaerobic contact process 1987 315 scfm boiler pre-treatment Kraft Foods Mobilized film technology 2007 boiler pre-treatment Axium Foods Anaerobic contact process 1991 13-16 scfm flare on-site Farmland Foods Covered lagoon 2000 238 scfm flare pre-treatment Saputo Cheese USA Mixed, heated covered lagoon 2009 76 scfm boiler on-site Seneca Foods Corp Complete Mix 2007 198 scfm boiler on-site SunOpta Ingredients Upflow anaerobic sludge blanket 1990 100-300 scfm boiler pre-treatment
Source: Kramer (2011) Anheuser Busch As shown in the previous table, Anheuser Busch is one firm that processes food waste using a digester. Noted as one of the world’s largest anaerobic digester operators, Anheuser Busch has 10 breweries in the U.S. — 80% of the total number — that have adopted digesters (Mancl 2020). Using brewery wastewater as the feedstock, the firm creates methane through its Bio-Energy Recovery System (BERS), an anaerobic digestion process. The methane then heats brewery boilers (Kryzanowski 2010). According to a 2012 BioCycle conference agenda, the brewery’s St. Louis location has a BERS installation with a daily treatment capacity of 2.5 million gallons. The 800,000 cubic feet of methane produced each day decreases fuel use by 7.5% as the brewery’s powerhouse combusts the methane (BioCycle 2012). By separating solids from the wastewater, the St. Louis facility also yields another product that it sells to an Illinois horseradish producer (Gibson 2011). Perdue Farms and Bioenergy DevCo During late 2019, Perdue Farms and Bioenergy DevCo (BDC) announced a two-part agreement. First, BDC would purchase a Delaware composting facility from Perdue (Hurdle 2019). The Agri-Recycle facility — now rebranded as the Bioenergy Innovation Center (The National Provisioner 2020) — most recently

had annually composted roughly 30,000 tons of organic waste, including poultry processing byproducts and chicken litter (Hurdle 2019). Before operating the composting facility, Perdue Farms made dry pellet fertilizer. However, neither the compost nor pellets proved profitable (Wheeler 2019). Second, BDC would construct an anaerobic digester, and Perdue Farms agreed to supply feedstock material to the digester for 20 years. As much as a $60 million investment would support the transition to anaerobic digestion (Hurdle 2019). As of May 2020, construction had begun, and if the schedule stays on target, then the facility would operate by second-quarter 2021. Plans indicate the digester will have an annual processing capacity of 200,000 tons. It would co-digest poultry processing byproducts with other materials. Potential feedstocks include poultry dissolved air flotation, litter, hatchery waste and waste activated sludge. For Perdue Farms, it locked in disposal costs for the 20-year period (The National Provisioner 2020). In addition to Perdue directing feedstocks to the digester (Wheeler 2019), the facility would accept material from other nearby suppliers (Hurdle 2019). The digester will produce two primary products: methane and fertilizer (Wheeler 2019). In terms of gas production, estimates suggest annual output of 350,000 MMBtu (The National Provisioner 2020). Possible uses for the methane include directing it through a pipeline and using it as a vehicle fuel (Wheeler 2019). The digester would address a handful of concerns in the Delmarva area. First, processing facilities tend to store plant waste in open tanks or lagoons. However, this approach can yield odor and upset neighbors. An anaerobic digester would resolve odor concerns. Second, at some point, Maryland may implement limits on field-applied phosphorus-rich manure. Such provisions would intend to minimize nutrient contamination in waterways, including the Chesapeake Bay (Wheeler 2019). Ar-Joy Farms Located in Cochranville, Pennsylvania, Ar-Joy Farms’ anaerobic digester illustrates how a farm can process multiple feedstocks and produce energy as a strategy to diversify. The dairy, which has 750 cows, operates a mixed plug flow digester (U.S. Environmental Protection Agency 2020). Situated near a populated area, the dairy had expansion limitations (Poelman 2018). The digester offered a revenue-generating alternative to increasing the number of cows milked (Redling 2018). Ar-Joy Farms started the digester project in 2017 (Poelman 2018). For some time, the farm had worked with its local utility, state funding agencies and neighbors to consider the project (Daily Local News 2018). Using a digester system from DVO Inc., the dairy produces its own power. The biogas fuels a 300-kW genset. The farm then sells unused energy to the local utility (Redling 2018). Manure produced by the dairy’s cows serves as a feedstock for the digester, but the facility also accepts and processes other forms of waste. For example, three times a week, the farm incorporates potato chip waste into the digester’s feedstock mix (Redling 2018). Local restaurants also divert used frying oil to the digester for processing (Daily Local News 2018). In addition to generating power, the digester yields two other products with value for the farm. Solids removed from the feedstock mass serve as a bedding for the cows. Before the farm had the digested solids available, it used sand bedding. The farm applies liquid removed from the feedstock as a crop fertilizer. A lagoon holds the liquid until it’s needed (Redling 2018).

Landfill Gas Projects The vast majority of RNG originates from landfills, not agricultural or industrial digesters. Although some projects have captured biogas for decades, the number of projects began increasing significantly in the early 2000s. It dropped beginning in 2014 due in large part to losing federal tax incentives. Sliding natural gas prices likely exacerbated the situation. Other biogas operations were similarly affected. Historically, electricity represented the main product produced by landfill gas projects — see Exhibit 5.19 — though direct heat also was used. Oftentimes, a co-located industry would use the direct heat. In recent years, however, a large share of operations coming on-line have produced RNG as the primary product. This shift toward RNG is an important trend echoed across the broader biogas industry. Exhibit 5.19. Landfill Projects by Start Date and Product Type
Source: U.S. EPA, LMOP database Although this report doesn’t directly consider landfill gas, this approach can serve as a model for biogas production in Missouri because a number of landfill gas-producing operations exist. It is especially interesting to note how the value of the biogas is utilized by the end user. Exhibit 5.20 describes Missouri projects producing biogas from landfill gas.
01020304050607080
1982
1984
1986
1988
1990
1992
1994
1996
1998
2000
2002
2004
2006
2008
2010
2012
2014
2016
2018
Proj
ects
Electricity Heat RNG
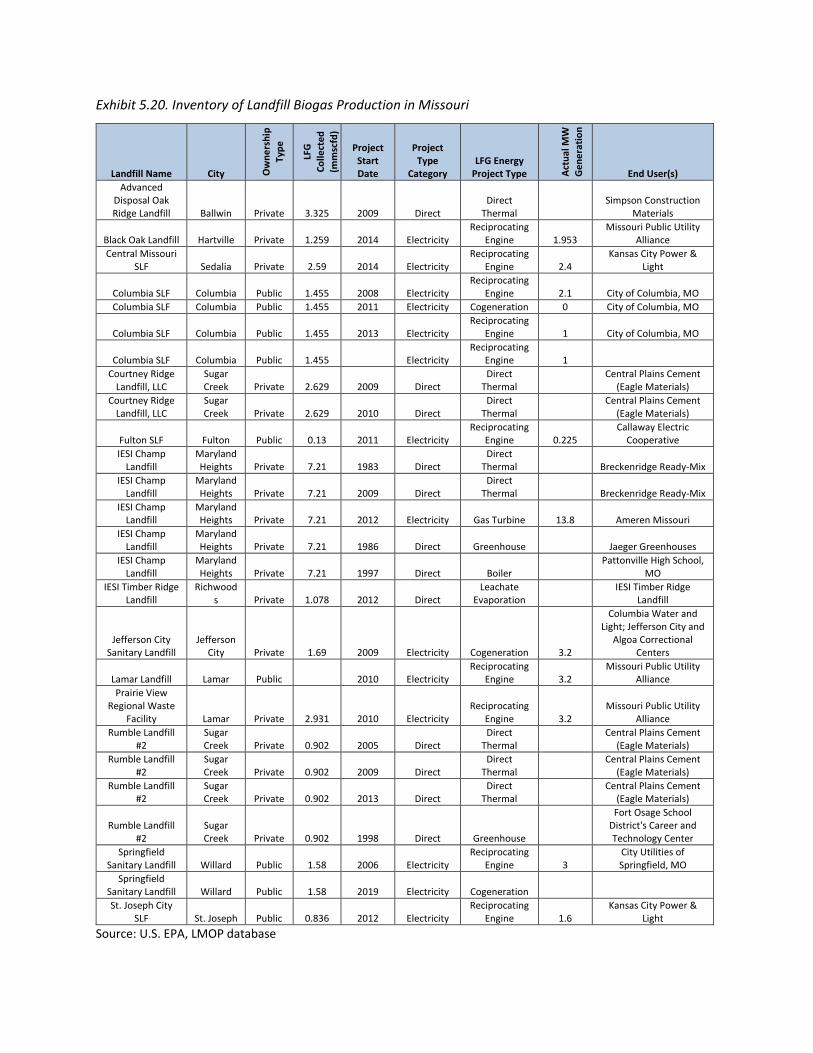
Exhibit 5.20. Inventory of Landfill Biogas Production in Missouri
Landfill Name City Ow
ners
hip
Type
LFG
Co
llect
ed
(mm
scfd
)
Project Start Date
Project Type
Category LFG Energy
Project Type Actu
al M
W
Gen
erat
ion
End User(s) Advanced
Disposal Oak Ridge Landfill Ballwin Private 3.325 2009 Direct
Direct Thermal
Simpson Construction Materials
Black Oak Landfill Hartville Private 1.259 2014 Electricity Reciprocating
Engine 1.953 Missouri Public Utility
Alliance Central Missouri
SLF Sedalia Private 2.59 2014 Electricity Reciprocating
Engine 2.4 Kansas City Power &
Light
Columbia SLF Columbia Public 1.455 2008 Electricity Reciprocating
Engine 2.1 City of Columbia, MO Columbia SLF Columbia Public 1.455 2011 Electricity Cogeneration 0 City of Columbia, MO
Columbia SLF Columbia Public 1.455 2013 Electricity Reciprocating
Engine 1 City of Columbia, MO
Columbia SLF Columbia Public 1.455 Electricity Reciprocating
Engine 1 Courtney Ridge
Landfill, LLC Sugar Creek Private 2.629 2009 Direct
Direct Thermal
Central Plains Cement (Eagle Materials)
Courtney Ridge Landfill, LLC
Sugar Creek Private 2.629 2010 Direct
Direct Thermal
Central Plains Cement (Eagle Materials)
Fulton SLF Fulton Public 0.13 2011 Electricity Reciprocating
Engine 0.225 Callaway Electric
Cooperative IESI Champ
Landfill Maryland Heights Private 7.21 1983 Direct
Direct Thermal Breckenridge Ready-Mix
IESI Champ Landfill
Maryland Heights Private 7.21 2009 Direct
Direct Thermal Breckenridge Ready-Mix
IESI Champ Landfill
Maryland Heights Private 7.21 2012 Electricity Gas Turbine 13.8 Ameren Missouri
IESI Champ Landfill
Maryland Heights Private 7.21 1986 Direct Greenhouse Jaeger Greenhouses
IESI Champ Landfill
Maryland Heights Private 7.21 1997 Direct Boiler
Pattonville High School, MO
IESI Timber Ridge Landfill
Richwoods Private 1.078 2012 Direct
Leachate Evaporation
IESI Timber Ridge Landfill
Jefferson City Sanitary Landfill
Jefferson City Private 1.69 2009 Electricity Cogeneration 3.2
Columbia Water and Light; Jefferson City and
Algoa Correctional Centers
Lamar Landfill Lamar Public 2010 Electricity Reciprocating
Engine 3.2 Missouri Public Utility
Alliance Prairie View
Regional Waste Facility Lamar Private 2.931 2010 Electricity
Reciprocating Engine 3.2
Missouri Public Utility Alliance
Rumble Landfill #2
Sugar Creek Private 0.902 2005 Direct
Direct Thermal
Central Plains Cement (Eagle Materials)
Rumble Landfill #2
Sugar Creek Private 0.902 2009 Direct
Direct Thermal
Central Plains Cement (Eagle Materials)
Rumble Landfill #2
Sugar Creek Private 0.902 2013 Direct
Direct Thermal
Central Plains Cement (Eagle Materials)
Rumble Landfill #2
Sugar Creek Private 0.902 1998 Direct Greenhouse
Fort Osage School District's Career and Technology Center
Springfield Sanitary Landfill Willard Public 1.58 2006 Electricity
Reciprocating Engine 3
City Utilities of Springfield, MO
Springfield Sanitary Landfill Willard Public 1.58 2019 Electricity Cogeneration St. Joseph City
SLF St. Joseph Public 0.836 2012 Electricity Reciprocating
Engine 1.6 Kansas City Power &
Light Source: U.S. EPA, LMOP database
6. CONCLUSIONS For decades, biogas has been produced in the U.S. More than 2,000 facilities in the U.S. now produce biogas (American Biogas Council). However, biogas use for energy remains fairly limited. Much of the current production originates in facilities that generate or treat waste as part of their normal business (i.e., landfills, wastewater treatment plants, animal manure handling). Some facilities view converting this waste to biogas as a viable alternative to manage waste (e.g., increasing waste-stream efficiency, reducing runoff, controlling odor) and sometimes supply energy. Increasingly, biogas is touted for its energy value. This comes at a somewhat surprising time. Traditionally, biogas replaced natural gas or electricity. However, the natural gas market has faced an oversupply and low prices. Thus, in most cases, its production costs have not positioned biogas well to compete with natural gas. Further, because of natural gas’ low cost, it is not clear that biogas can be used to produce electricity profitably in all cases. As such, energy market signals alone have not been sufficient to spur widespread adoption. Instead, recent biogas industry growth has largely been associated with producing upgraded and compressed (or liquified) biomethane for vehicle fuel purposes. Federal and state policy incentives motivated much of the interest. These policies generally intend to reduce greenhouse gas emissions. However, technologies with impactful reductions have not materialized as anticipated. Biogas represents one of the more promising technologies. Thus, it is responsible for more than 98% of the most valuable D3 RINS created to date (U.S. Environmental Protection Agency 2020). This hints at a meaningful market niche for biogas. Although it does not directly compete with commodity natural gas on cost, it does have unique value associated with its low carbon emissions relative to other fuels. Incentives for biogas other than those directing the substance’s use in vehicle fuels (i.e., electricity) have not been as significant or impactful4. Partly, the electricity industry’s rapid transition from coal to natural gas as well as wind and solar has limited interest in this area. As a number of applicable technologies have been available, the need for biogas incentives is not as significant. Disproportionate emphasis on vehicle fuels is likely to have an interesting effect on the biogas industry. Producing vehicle fuels from biogas has large scale economies due to costly and complicated production, upgrading, transportation and marketing activities. This suggests that the marketplace is likely to be served by larger entities with more resources to overcome the challenges. Alternatively, new supply chains where farmers or other biogas producers sell manure or produce raw biogas to sell to upgrading and compression facilities may be attractive and more common. Because electricity production has much smaller economies of scale and more accessible transportation (via national grid) incentives (like those with vehicle fuels), it could be more impactful for smaller producers. Interestingly, RFS RINs and LCFS incentives for biogas electricity used by vehicles have been described and approved and may provide a future opportunity.
4 A number of federal policies (e.g., production tax credits) encourage producing electricity from biogas, but these have comparatively mild impact on producers’ returns.
On the other hand, this focus on biogas solely as a fuel source diminishes its value for many potential adopters. Biogas offers a number of potential value streams. If those can be leveraged together, then they may offer considerable net benefits. Biogas creates an opportunity to better utilize waste streams and offer ancillary benefits such as bedding, higher value (or reduced cost) effluent, reduced odors, environmental benefits and so forth. The fuel source can, in many cases, largely subsidize the other benefits. For those select operations that can capture that combined value — many WWTPs and large dairies have done this — biogas’ feasibility is evident. In summary, the following represent important dimensions to biogas production’s economic success.
1) Environmental incentives associated with producing biogas are driving much of the current market’s growth. Biogas competes well in these markets due to its performance in reducing carbon emissions at reasonable cost. Currently, most of this market is associated with vehicle fuels (e.g., Renewable Fuel Standard, Low Carbon Fuel Standard). Participating in this market requires costly additional gas upgrading, transportation and marketing.
2) Biogas facilities require significant capital outlays, so scale economies are important. A) Small-scale operations are not likely feasible. B) Costs and scale economies are significantly greater for operations upgrading biogas to
biomethane. 3) Producing biogas for (CHP) electricity may be viable, but the viability depends highly on the
situation and ability to derive value from other attributes of AD. A) The feedstock or waste stream should be cheap or free and consistently available. B) Preferably, feedstock use will decrease waste disposal costs or attract a tipping fee. C) The operation can use the biogas to produce its own energy and avoid retail energy prices
(and associated taxes, distribution and mark-up). D) Alternatively, if the operation has an energy surplus, then it can contract with a utility or
company to purchase electricity at a rate above the wholesale price. E) The operation can take advantage of a technology’s ancillary benefits. These include odor
reduction and environmental benefits. F) The operation can extract full value from waste streams. It must be able to effectively use or
sell co-products, especially digestate and nutrient slurry. G) The operation can access favorable economic support (e.g., grants, tax credits, incentives).

REFERENCES Al Seadi, T. (2008). Biogas Handbook. University of Southern Denmark. Esbjerg, Denmark. Available at: https://www.lemvigbiogas.com/BiogasHandbook.pdf Alexander, R. (2012). Digestate Utilization in the US. Biocycle 53(1). Alumbaugh, J. (2019). Pig Project Fuels Alternative Energy. Progressive Farmer. Accessed June 4, 2020, at https://www.dtnpf.com/agriculture/web/ag/news/article/2019/11/20/anaerobic-digester-shows-hog-farming. American Biogas Council (2020). Roeslein Alternative Energy – Ruckman Farm Digester. American Biogas Council. Accessed June 9, 2020, at https://americanbiogascouncil.org/resources/biogas-projects/. American Biogas Council (2015). Biogas State Profile: Missouri. American Biogas Council. Accessed June 5, 2020, at https://americanbiogascouncil.org/wp-content/uploads/2019/02/ABCBiogasStateProfile_MO.pdf. American Biogas Council. Missouri Biogas State Profile. American Biogas Council. Accessed June 5, 2020, at https://americanbiogascouncil.org/wp-content/uploads/2020/01/Missouri-1.pdf. American Biogas Council. Project Database. Accessed June 5, 2020, at https://americanbiogascouncil.org/resources/biogas-projects/ Accessed 4/30/2020. American Biogas Council (2019). Biogas Market Snapshot. Accessed June 5, 2020, at https://americanbiogascouncil.org/biogas-market-snapshot/ Angelidaki, I., Treu, L., Tsapekos, P., Luo, G., Campanaro, S., Wenzel, H., & Kougias, P. G. (2018). Biogas upgrading and utilization: Current status and perspectives. Biotechnology advances, 36(2), 452-466. Astals, S., Batstone, D. J., Mata-Alvarez, J., & Jensen, P. D. (2014). Identification of synergistic impacts during anaerobic co-digestion of organic wastes. Bioresource technology, 169, 421-427. Astill, G. M., & Shumway, C. R. (2016). Profits from pollutants: Economic feasibility of integrated anaerobic digester and nutrient management systems. Journal of environmental management, 184, 353-362. Augelletti, R., Conti, M., & Annesini, M. C. (2017). Pressure swing adsorption for biogas upgrading. A new process configuration for the separation of biomethane and carbon dioxide. Journal of Cleaner Production, 140, 1390-1398. Aui, A., & Wright, M. M. (2018). Life Cycle Cost Analysis of the Operations of Anaerobic Digesters in Iowa. Available at: http://iowabiogasmodel.us/Anaerobic_Digestion_LCA_Final_Report.pdf Bachmann, N., la Cour Jansen, J., Bochmann, G., & Montpart, N. (2015). Sustainable biogas production in municipal wastewater treatment plants. Massongex, Switzerland: IEA Bioenergy. Banks, C. (2004). Final Activity Report on Renewable energy from crops and agrowastes (Project No. SES6-CT-2004-502824). Tech. Rep. Available at: http://www.cropgen.soton.ac.uk/deliverables/CROPGEN_PFAR2007.pdf. Bauer, F. C. Hulteberg, T. Persson, D. Tamm (2013). Biogas upgrading – review of commercial technologies SGC Rapp., 270. Bauer, A., Mayr, H., Hopfner-Sixt, K., & Amon, T. (2009). Detailed monitoring of two biogas plants and mechanical solid-liquid separation of fermentation residues. Journal of biotechnology, 142(1), 56–63.
Beddoes, J. C., Bracmort, K. S., Burns, R. T., & Lazarus, W. F. (2007). An analysis of energy production costs from anaerobic digestion systems on US livestock production facilities. USDA NRCS Technical Note. Benavidez, J. R., Thayer, A. W., & Anderson, D. P. (2019). Poo Power: Revisiting Biogas Generation Potential on Dairy Farms in Texas. Journal of Agricultural and Applied Economics, 51(4), 682-700. Biggar, S., Man, D., Moffroid, K., Pape, D., Riley-Gilbert, M., Steele, R., & Thompson, V. (2013). Greenhouse gas mitigation options and costs for agricultural land and animal production within the United States. ICF International, Department of Agriculture Climate Change Program Office: Washington, DC, USA. BioCycle. (2012). 12th Annual Conference on Renewable Energy From Organics Recycling. BioCycle. Accessed June 3, 2020, at http://www.biocyclerefor.com/2012/docs/BioCycleREFOR12_Agenda.pdf. BioCycle. (2017). Anaerobic Digest. BioCycle. Accessed June 4, 2020, at https://www.biocycle.net/2017/09/07/anaerobic-digest-76/. Bishop, C. P., & Shumway, C. R. (2009). The economics of dairy anaerobic digestion with coproduct marketing. Review of Agricultural Economics, 31(3), 394-410. Black & Veatch (2015). Biogas Conditioning and Upgrading Technologies, Technical Characterization and Economic Evaluation. Commissioned by SoCalGas. Boone D. and R. Mah, “Transitional Bacteria,” in D. Chynoweth and R. Isaacson, ed., Anaerobic Digestion of Biomass, (London: Elsevier Applied Science, 1987), pp. 35-48. Brechbill, S. C., & Tyner, W. E. (2008). The Economics of Biomass Collection, Transportation, and Supply to Indiana Cellulosic and Electric Utility Facilities. Purdue University Dept (pp. 08-03). of Agricultural Economics Working Paper. Brightmark Energy (2020). Brightmark to expand New York dairy biogas project. Biomass Magazine. Available at: http://biomassmagazine.com/articles/16829/brightmark-to-expand-new-york-dairy-biogas-project
Brightmark Energy (2020). Brightmark to build dairy RNG project in South Dakota. Biomass Magazine. Available at: http://biomassmagazine.com/articles/16799/brightmark-to-build-dairy-rng-project-in-south-dakota
Brightmark Energy (2020). Brightmark Energy announces Florida RNG project. Biomass Magazine. Available at: http://biomassmagazine.com/articles/16757/brightmark-energy-announces-florida-rng-project Burke, D. A. (2001). Dairy waste anaerobic digestion handbook: options for recovering beneficial products from dairy manure. Environmental Energy Company: Olympia, WA. Buzby, J. C., Farah-Wells, H., & Hyman, J. (2014). The estimated amount, value, and calories of postharvest food losses at the retail and consumer levels in the United States. USDA-ERS Economic Information Bulletin, (121). Caldwell, E. (2008). From digester to backyard deck: turning manure fibers into construction material. Ag Nutrient Management. Available at: http://progressivedairy.com/anm/features/2008/0608/0608_caldwell.html California Air Resources Board (CARB). Low Carbon Fuel Standard. Available at: https://ww2.arb.ca.gov/our-work/programs/low-carbon-fuel-standard/about California Air Resources Board. LCFS Pathway Certified Carbon Intensities. Available at: ww2.arb.ca.gov/resources/documents/lcfs-pathway-certified-carbon-intensities

California Bioenergy LLC (2019). CalBio, Bloom Energy to generate electricity from dairy waste. Biomass Magazine. Available at: http://biomassmagazine.com/articles/16527/calbio-bloom-energy-to-generate-electricity-from-dairy-waste
Camarillo, M. K., Stringfellow, W. T., Jue, M. B., & Hanlon, J. S. (2012). Economic sustainability of a biomass energy project located at a dairy in California, USA. Energy Policy, 48, 790-798. Chen, Eli. (2019). Access To Pig Manure-Powered Energy Grows In Northern Missouri. St. Louis Public Radio. Accessed June 4, 2020, at https://news.stlpublicradio.org/post/access-pig-manure-powered-energy-grows-northern-missouri#stream/0. Chen, X. Y., Vinh-Thang, H., Ramirez, A. A., Rodrigue, D., & Kaliaguine, S. (2015). Membrane gas separation technologies for biogas upgrading. Rsc Advances, 5(31), 24399-24448. Chiumenti, A., da Borso, F., & Limina, S. (2018). Dry anaerobic digestion of cow manure and agricultural products in a full-scale plant: Efficiency and comparison with wet fermentation. Waste Management, 71, 704-710. Ciborowski, P. (2001). Anaerobic digestion of livestock manure for pollution control and energy production: A feasibility assessment. Report, USEPA Grant CX, 825639-01. Coppedge, B., Coppedge, G., Evans, D., Jensen, J., Kanoa, E., Scanlan, K., ... & Frear, C. (2012). Renewable natural gas and nutrient recovery feasibility for deruyter dairy. Olympia: WA: Washington State Department of Commerce. Cornell Waste Management Institute. Substrate Composition Table. Available at: http://compost.css.cornell.edu/calc/lignin.noframes.html Cowley, C., & Brorsen, B. W. (2018). Anaerobic digester production and cost functions. Ecological economics, 152, 347-357. Cowley, C., Brorsen, B. W., & Hamilton, D. (2014). Economic Feasibility of Anaerobic Digesters with Swine Operations (No. 329-2016-13340). Cowley, C., & Brorsen, B. W. (2018). The hurdles to greater adoption of anaerobic digesters. Agricultural and Resource Economics Review, 47(1), 132-157. Cropgen database Available at: http://www.cropgen.soton.ac.uk/deliverables.htm Cucchiella, F., D'Adamo, I., Gastaldi, M., Miliacca, M., (2018). A profitability analysis of small-scale plants for biomethane injection into the gas grid. J. Clean. Prod. 184, 179e187. Available at: http://www.advancesincleanerproduction.net/sixth/files/sessoes/5A/4/cucchiella_et_al_academic_02.pdf Daily Local News. (2018). County officials mark 30th anniversary of agricultural awards. Daily Local News. Accessed July 14, 2020, at https://www.dailylocal.com/news/local/county-officials-mark-30th-anniversary-of-agricultural-awards/article_a881da76-d07e-11e8-86b0-0b1f437a8964.html Darrow, K., Tidball, R., Wang, J., & Hampson, A. (2017). Catalog of CHP technologies. US Environmental Protection Agency and the US Department of Energy, 23. Available at: https://www.epa.gov/sites/production/files/2015-07/documents/catalog_of_chp_technologies.pdf DeVuyst, E. A., Pryor, S. W., Lardy, G., Eide, W., & Wiederholt, R. (2011). Cattle, ethanol, and biogas: Does closing the loop make economic sense? Agricultural Systems, 104(8), 609-614.
Dominion Energy (2019). Dominion Energy, Vanguard Renewables partner on dairy RNG. Biomass Magazine. Available at: http://biomassmagazine.com/articles/16666/dominion-energy-vanguard-renewables-partner-on-dairy-rng
Drosg, B., Fuchs, W., Seadi, T. A., Madsen, M., & Linke, B. (2015). Nutrient Rcovery by Biogas Digestate Processing. Available at: http://task37.ieabioenergy.com/files/daten-redaktion/download/Technical%20Brochures/NUTRIENT_RECOVERY_RZ_web1.pdf Dumas, Carol Ryan. (2019). Biogas project planned on six Idaho dairies. Capital Press. Accessed June 10, 2020, at https://www.capitalpress.com/ag_sectors/dairy/biogas-project-planned-on-six-idaho-dairies/article_a8d52aa0-86f9-11e9-8cae-4754ed364e9c.html. Dunlap, Charles. (2019a). Audrain County group partners with green energy company. Columbia Tribune. Accessed June 10, 2020, at https://www.columbiatribune.com/news/20190317/audrain-county-group-partners-with-green-energy-company. Dunlap, Charles. (2019b). Biogas group plans to hold investor meeting Monday. Mexico Ledger. Accessed June 10, 2020, at https://www.mexicoledger.com/news/20190402/biogas-group-plans-to-hold-investor-meeting-monday. Electrigaz (2011). Biogas plant costing report: Economic Study on Renewable Natural Gas Production and Injection Costs in the Natural Gas Distribution Grid in Ontario, Prepared for Union Gas. Environmental Research & Education Foundation (EREF). (2019). Analysis of MSW Landfill Tipping Fees: April 2019. Available at: https://erefdn.org/product/analysis-msw-landfill-tipping-fees-2/ Envocare Ltd. (2007). Liquefied Petroleum Gas (LPG), Liquefied Natural Gas (LNG) and Compressed Natural Gas (CNG). Environmental and Energy Study Institute (EESI) and American Biogas Council. (2019). Biogas: Pro-Economy and Pro-Climate: Growth in All Shades of Green. Environmental and Energy Study Institute. Accessed July 9, 2020, at: https://www.youtube.com/watch?v=8laTkhw1kyg. Engineering News-Record. (2019). Industry Leads for the Week of April 8, 2019. Engineering News-Record. Accessed June 10, 2020, at https://www.enr.com/articles/46615-industry-leads-for-the-week-of-april-8-2019. Eriksson, L., & Runevad, D. (2016). Evaluating digestate processing methods at Linköping biogas plant: A resource efficient perspective. Available at: https://www.diva-portal.org/smash/get/diva2:943238/FULLTEXT01.pdf Faulhaber, C. R., Raman, D. R., & Burns, R. T. (2012). An engineering-economic model for analyzing dairy plug-flow anaerobic digesters: cost structures and policy implications. Transactions of the ASABE, 55(1), 201-209. Ferguson, T., and R. Mah, 1987) Methanogenic Bacteria, in D. Chynoweth and R. Isaacson, ed., Anaerobic Digestion of Biomass, (London: Elsevier Applied Science, 1987), pp. 47-63. Fishbeck, Thompson, Carr & Huber, Inc. (2017). Ann Arbor Biodigester Feasibility Study. Available at: https://www.a2gov.org/departments/systems-planning/planning-areas/climate-sustainability/SiteAssets/Pages/Sustainability/Ann%20Arbor%20Biodigester%20FS.PDF Franchetti, M., & Dellinger, A. (2014). Economic feasibility of a municipal food waste collection and energy generation model. Energy Technology & Policy, 1(1), 52-58.

Freese, Betsy. (2018). Butterflies and Biogas a Focus of Smithfield Foods. Successful Farming. Accessed June 4, 2020, at https://www.agriculture.com/news/livestock/butterflies-and-biogas-focus-of-smithfield-foods-hog-farms-in-missouri. Fricke, K., Santen, H., Wallmann, R., Hüttner, A., & Dichtl, N. (2007). Operating problems in anaerobic digestion plants resulting from nitrogen in MSW. Waste Management, 27(1), 30-43. Fryberger, C. (2014) Waste Not, Want Not Financing Swine Biogas Projects in Eastern North Carolina. Available at: https://ncgrowth.unc.edu/wp-content/uploads/2014/06/FinancingSwineBiogasInEasternNC.pdf Fuchs, W., & Drosg, B. (2013). Assessment of the state of the art of technologies for the processing of digestate residue from anaerobic digesters. Water science and technology, 67(9), 1984-1993. Futch, Michael. (2018). Biogas plant planned for Robeson County. The Fayetteville Observer. Accessed June 10, 2020, at https://www.fayobserver.com/news/20181018/biogas-plant-planned-for-robeson-county. GESS International. (2018). GESS International breaks ground on North Carolina biogas plants. GESS International. Accessed June 10, 2020, at http://biomassmagazine.com/articles/15768/gess-international-breaks-ground-on-north-carolina-biogas-plants Ghafoori, E., & Flynn, P. C. (2007). Optimizing the logistics of anaerobic digestion of manure. In Applied Biochemistry and Biotecnology (pp. 625-637). Humana Press. Ghafoori, E., Flynn, P & Feddes, J. (2007). Pipeline vs. Truck Transport of Beef Cattle Manure. Biomass and Bioenergy. 31. 168-175. Gibson, Lisa. (2011). Biomass tour showcases three different biomass systems. Biomass Magazine. Accessed June 3, 2020, at http://biomassmagazine.com/articles/5495/biomass-tour-showcases-three-different-biomass-systems. Giesy, R., Wilkie, A. C., De Vries, A., & Nordstedt, R. A. (2005). Economic feasibility of anaerobic digestion to produce electricity on Florida dairy farms. UF (University of Florida), IFAS Extension, AN, 159. Gorrie, P. (2014). Building a biogas highway in the U.S. BioCycle 55(3): 36-41. Gray, B. (2020). ‘Manure-to-energy’ projects on Missouri’s pig farms attract fresh $45 million investment. St. Louis Post-Dispatch. Accessed June 9, 2020, at https://www.stltoday.com/business/local/manure-to-energy-projects-on-missouri-pig-farms-attract-fresh/article_67ae9792-f9fe-5f68-ae50-63e82d2b5bd8.html. Greene, P. (2018) Basics Of Biogas Upgrading BioCycle January , Vol. 59, No. 1, p. 52 Green Car Congress (2020). UPS enters into RNG supply agreements with Kinetrex and TruStar; up to 80M gallon equivalents. Available at: https://www.greencarcongress.com/2020/02/20200205-ups.html Greer, D. (2011). Beef Cattle Feedlot Rolls Out Anaerobic Digester. BioCycle. Gutser, R., Ebertseder, T., Weber, A., Schraml, M., & Schmidhalter, U. (2005). Short-term and residual availability of nitrogen after long term application of organic fertilizers on arable land. Journal Plant Nutrition and Soil Science, 168, 439-446. Hamberg, K., Furseth, D., Wegrzyn, J., LaRusso, A., Chahbazpour, D., Richardson, G., Carr, B., et al. (2012). Renewable Natural Gas for Transportation: An Overview of the Feedstock Capacity, Economics, and GHG Emission Reduction Benefits of RNG as a Low-Carbon Fuel. A White Paper for the National Petroleum Council–Future Transportation Fuels Study. Available at: https://www.npc.org/FTF_Topic_papers/22-RNG.pdf
Hartmann, H., & Ahring, B. K. (2006). Strategies for the anaerobic digestion of the organic fraction of municipal solid waste: an overview. Water science and technology, 53(8), 7-22. Hockstad, L., & Hanel, L. (2018). Inventory of US greenhouse gas emissions and sinks (No. cdiac: EPA-EMISSIONS). Environmental System Science Data Infrastructure for a Virtual Ecosystem. Homan, E. (2012) Biogas From Manure. Extension Report. Penn State -Extension. Available at: https://extension.psu.edu/biogas-from-manure Houghton, D. (2017). Gas Natural. The Furrow. Accessed June 9, 2020, at https://www.johndeerefurrow.com/2017/05/05/gas-natural/. Hurdle, J. (2019). Chicken waste conversion project may ease ground water contamination. Delaware Public Radio. Accessed June 3, 2020, at https://www.delawarepublic.org/post/chicken-waste-conversion-project-may-ease-ground-water-contamination. International Energy Agency (IEA) (2019). Task 37 Report. Available at: https://task37.ieabioenergy.com/plant-list.html International Energy Agency (IEA) (2020). Outlook for biogas and biomethane: Prospects for organic growth, IEA, Paris. https://www.iea.org/reports/outlook-for-biogas-and-biomethane-prospects-for-organic-growth International Renewable Energy Agency (IRENA) (2019), Renewable capacity statistics 2019. Available at: https://www.irena.org/publications/2019/Mar/Renewable-Capacity-Statistics-2019 Iogen Corp. (2019). Iogen: Dairy manure RNG project begins operations in Oregon. Biomass Magazine. Available at: http://biomassmagazine.com/articles/16645/iogen-dairy-manure-rng-project-begins-operations-in-oregon Jaffe, A. M., Dominguez-Faus, R., Parker, N., Scheitrum, D., Wilcock, J., & Miller, M. (2016). The Feasibility of Renewable Natural Gas as a Large-Scale, Low Carbon Substitute. California Air Resources Board Final Draft Report Contract, (13-307). Jensen, J., C. Frear, J. Ma, C. Kruger, R. Hummel, and G. Yorgey. (2015). Digested Fiber Solids: Developing Technologies for Adding Value. Extension Bulletin (unpublished). Washington State University-Extension. Available at: http://pubs.cahnrs.wsu.edu/publications/wp-content/uploads/sites/2/publications/FS235E.pdf Juergens, K., & Powell, E. (2014). Digester Economics Breakout. Unpublished Excel Spreadsheet. Andgar Corporation: Ferndale, Washington. Kacprzak, A., Krzystek, L., & Ledakowicz, S. (2010). Co-digestion of agricultural and industrial wastes. Chemical Papers, 64(2), 127-131. Key, N., Sneeringer, S. (2011). Carbon prices and the adoption of methane digesters on dairy and hog farms. United States Department of Agriculture Economic Research Service Economic Brief Number 16 Kim, J. K., Oh, B. R., Chun, Y. N., & Kim, S. W. (2006). Effects of temperature and hydraulic retention time on anaerobic digestion of food waste. Journal of Bioscience and bioengineering, 102(4), 328-332. Klavon, K. H., Lansing, S. A., Mulbry, W., Moss, A. R., & Felton, G. (2013). Economic analysis of small-scale agricultural digesters in the United States. biomass and bioenergy, 54, 36-45.
Kosusko, M., Williams, R., Ely, C., & Martynowicz, T. (2016). Evaluating the Air Quality, Climate & Economic Impacts of Biogas. Management Technologies. Kothari, R., Pandey, A. K., Kumar, S., Tyagi, V. V., & Tyagi, S. K. (2014). Different aspects of dry anaerobic digestion for bio-energy: An overview. Renewable and sustainable energy reviews, 39, 174-195. Kramer, J., (2011) Great Lakes Region Food Industry Biogas Casebook. Energy Center of Wisconsin Report 261-1. Available at: auri2019.pounce.com/wp-content/assets/legacy/research/GL%20Food%20Industry%20Biogas%20Casebook%20March%202011.pdf Kratzeisen, M., Starcevic, N., Martinov, M., Maurer, C., & Müller, J. (2010). Applicability of biogas digestate as solid fuel. Fuel, 89(9), 2544-2548. Krich, K., Augenstein, D., Batmale, J. P., Benemann, J., Rutledge, B., & Salour, D. (2005). Biomethane from dairy waste: a sourcebook for the production and use of renewable natural gas in California. Western United Dairymen. Krom, L. (2011). Biomethane Production Facility Pipeline Interconnection in Wisconsin. Report to Wisconsin Distributed Resources Collaborative, Inc. Available at: https://www.wisconsindr.org/library/RNG/WI%20Biomethane%20Interconnection%20Issues%20-%20Final%20Phase%201%20-%20June%202011.pdf Kruger, C., Chen, S., MacConnell, C., Harrison, J., Shumway, R., Zhang, T., ... & Bowers, K. (2008). High-quality fiber and fertilizer as co-products from anaerobic digestion. Journal of soil and water conservation, 63(1), 12A-13A. Kryzanowski, T. (2010). Bud goes for bio-energy. enerG. Accessed June 3, 2020, at https://www.altenerg.com/back_issues/index.php-content_id=336.htm. Labatut, R. A., Angenent, L. T., & Scott, N. R. (2014). Conventional mesophilic vs. thermophilic anaerobic digestion: a trade-off between performance and stability?. Water research, 53, 249-258. Lambert, M. (2017). Biogas: a significant contribution to decarbonising gas markets. Energy Insight, 15. Lauer, M., Hansen, J. K., Lamers, P., & Thrän, D. (2018). Making money from waste: The economic viability of producing biogas and biomethane in the Idaho dairy industry. Applied Energy, 222, 621-636. Lazarus, W. F., & Rudstrom, M. (2007). The economics of anaerobic digester operation on a Minnesota dairy farm. Review of Agricultural Economics, 29(2), 349-364. Leuer, E. R., Hyde, J., & Richard, T. L. (2008). Investing in methane digesters on Pennsylvania dairy farms: Implication of scale economies and environmental programs. Agricultural and Resource Economics Review, 37(1203-2016-95249), 188-203. Ludington, D., & Weeks, S. (2008). The Characterization of Sulfur Flows in Farm Digesters at Eight Farms”. Project report for the New York State Energy Research and Development Authority under Project agreement 9443-1. Lukehurst, C., Frost, P., and Al Seadi, T. (2010). Utilisation of Digestate from Biogas Plants as Biofertiliser." IEA Bioenergy. Lusk, P. (1998) Methane recovery from animal manures: a current opportunities casebook. 3rd Edition. NREL/SR–25145. Golden, CO: National Renewable Energy Laboratory.

Lusk, P., & Moser, M. (1996) Anaerobic Digestion-Yesterday, Today and Tomorrow. in P. Chartier, et al., Biomass for Energy and Environment, Vol. 1, (Oxford, UK: Pergamon, 1996), pp. 284-289. MacConnell, C., Frear, C., & Liao, W. (2010). Pretreatment of AD-treated fibrous solids for value-added container media market. CSANR Research Report 2010–001. Available at: http://csanr.wsu.edu/wp-content/uploads/2013/02/CSANR2010-001.Ch06.Pdf. Mancl, K. (2020). Brewing Biogas in the U.S. and China. China-U.S. Focus. Accessed June 1, 2020, at https://www.chinausfocus.com/energy-environment/brewing-biogas-in-the-us-and-china. Mata-Alvarez, J., Dosta, J., Romero-Güiza, M. S., Fonoll, X., Peces, M., & Astals, S. (2014). A critical review on anaerobic co-digestion achievements between 2010 and 2013. Renewable and sustainable energy reviews, 36, 412-427. Milbrandt, A. (2005). Geographic perspective on the current biomass resource availability in the United States (No. NREL/TP-560-39181). National Renewable Energy Lab.(NREL), Golden, CO (United States). Milbrandt, A., Bush, B., & Melaina, M. (2016). Biogas and Hydrogen Systems Market Assessment (No. NREL/TP-6A20-63596). National Renewable Energy Lab. (NREL), Golden, CO (United States). Mintz, M. and P. Voss. (2019). Database of Renewable Natural Gas (RNG) Projects: 2019 Update, Argonne National Laboratory, October 2019, Available at: https://www.anl.gov/es/reference/renewable-natural-gas-database Missouri Grown USA. Hampton Alternative Energy Products LLC/Hampton Feed Lot Inc. Missouri Grown USA. Accessed June 5, 2020, at https://missourigrownusa.com/members/10686. Missouri Public Service Commission (2019). Map of Missouri Electric Service Areas. Available at: https://psc.mo.gov/CMSInternetData/Electric/Missouri%20Electric%20Service%20Area%20Map%2011-8-19.pdf Missouri Public Service Commission (2018). Map of Missouri Natural Gas Pipelines. Available at: https://psc.mo.gov/CMSInternetData/Gas/Missouri%20Natural%20Gas%20Pipeline%20Map%207-12-2018.pdf Missouri Department of Economic Development – Division of Energy, Inova Energy Group and Elevate Energy. (2015). Missouri Comprehensive State Energy Plan. Missouri Department of Economic Development – Division of Energy, Inova Energy Group and Elevate Energy. Accessed June 5, 2020, at https://www.elevateenergy.org/wp/wp-content/uploads/MO-Statewide-Energy-Plan.pdf. Missouri Department of Natural Resources (MODNR). (2018). Certified Non-Solar Renewable Energy Generation Facilities. Available at: https://energy.mo.gov/sites/energy/files/List%20of%20Certified%20Non%20Solar%20RE%20Generation%20Facilities_October%202017.pdf Missouri Department of Natural Resources (MODNR). Animal Feeding Operations Map https://modnr.maps.arcgis.com/apps/webappviewer/index.html?id=cf630b020a17452fb30994cb4b36f003 Möller, K., & Müller, T. (2012). Effects of anaerobic digestion on digestate nutrient availability and crop growth: a review. Engineering in Life Sciences, 12(3), 242-257. Moriarty, K. (2013). Feasibility Study of Anaerobic Digestion of Food Waste in St. Bernard, Louisiana. A Study Prepared in Partnership with the Environmental Protection Agency for the RE-Powering America's Land Initiative: Siting Renewable Energy on Potentially Contaminated Land and Mine Sites (No. NREL/TP-7A30-57082). National Renewable Energy Lab.(NREL), Golden, CO (United States).

Murray, B. C., Galik, C. S., & Vegh, T. (2014). Biogas in the United States: An assessment of market potential in a carbon-constrained future. Nicholas Institute for Environmental Policy Solutions, Duke University. Mustafi N.N., Agarwal A.K. (2020) Biogas for Transport Sector: Current Status, Barriers, and Path Forward for Large-Scale Adaptation. In: Singh A., Sharma Y., Mustafi N., Agarwal A. (eds) Alternative Fuels and Their Utilization Strategies in Internal Combustion Engines. Energy, Environment, and Sustainability. Springer, Singapore Myhre, G., Shindell, D., Bréon, F. M., Collins, W., Fuglestvedt, J., Huang, J., ... & Nakajima, T. (2013). Anthropogenic and natural radiative forcing. Climate change 2013: The physical science basis. Contribution of Working Group I to the Fifth Assessment Report of the Intergovernmental Panel on Climate Change, 659–740. National Provisioner. (2020). Waste or Commodity? Turning Processing Byproducts into Energy and Healthy Soils with Anaerobic Digestion. The National Provisioner. Accessed June 4, 2020, at https://www.provisioneronline.com/events/1001-waste-or-commodity-turning-processing-byproducts-into-energy-and-healthy-soils-with-anaerobic-digestion. Nelson, Alisa. (2019). North Carolina company works to build five biogas plants in Missouri. Missourinet. Accessed June 10, 2020, at https://www.missourinet.com/2019/06/28/north-carolina-company-works-to-build-five-biogas-plants-in-missouri/. Noyola, A., Morgan-Sagastume, J. M., & Lopez-Hernandez, J. E. (2006). Treatment of biogas produced in anaerobic reactors for domestic wastewater: odor control and energy/resource recovery. Reviews in environmental science and bio/technology, 5(1), 93-114. Natural Resources Conservation Service (NRCS) (2017). Anaerobic digester – Ambient temperature. Conservation Practice Standard, Code 366. National Renewable Energy Laboratory (NREL) (2013). Energy Analysis: Biogas Potential in the United States https://www.nrel.gov/docs/fy14osti/60178.pdf. Ong, M. D., Williams, R. B., & Kaffka, S. R. (2014). Comparative assessment of technology options for biogas clean-up. Public Interest Energy Research (PIER) Program, Draft Interim Project report. California Biomass Collaborative. University of California, Davis. Available at: https://fdocuments.in/document/comparative-assessment-of-technology-options-for-biogas-clean-up.html Oregon, E. C. (2009). Dairy manure anaerobic digester feasibility study report. Prepared for: Volbeda Dairy, Albany, Oregon, USA. Available at: https://www.build-a-biogas-plant.com/PDF/VolbedaFeasiblityStudy.pdf Oregon Department of Environmental Quality. Clean Fuels Program Regulations. Available at: https://www.oregon.gov/deq/aq/programs/Pages/Clean-Fuels-Regulations.aspx Organisation for Economic Cooperation and Development (OECD) and U.S. Department of Agriculture. (2015). Exhibit Summary – National Prosperity through Modern Rural Policy – 10th OECD Rural Development Conference. Organisation for Econnomic Cooperation and Development and U.S. Department of Agriculture. Accessed June 5, 2020, at https://www.oecd.org/rural/rural-development-conference/documents/Exhibitor-show-summary.pdf. Ouzt, El. (2018) Why North Carolina’s poultry industry isn’t creating biogas like hog farms are. Energy News Network. Available at: https://energynews.us/2018/11/13/southeast/why-north-carolinas-poultry-industry-isnt-creating-biogas-like-hog-farms-are/ Paolini, V., Petracchini, F., Segreto, M., Tomassetti, L., Naja, N., & Cecinato, A. (2018). Environmental impact of biogas: A short review of current knowledge. Journal of Environmental Science and Health, Part A, 53(10), 899-906.

Pennington, M. (2018). Anaerobic Digestion Facilities Processing Food Waste in the United States in 2016. Survey Results. EPA. Available at: https://www.epa.gov/anaerobic-digestion/anaerobic-digestion-facilities-processing-food-waste-united-states-survey Poelman, A. (2018). A Glass of Milk with Marilyn Hershey. Cowsmopolitan. Accessed July 14, 2020, at https://www.cowsmo.com/articles/glass-milk-marilyn-hershey/. Pohl, M., Mumme, J., Heeg, K., & Nettmann, E. (2012). Thermo-and mesophilic anaerobic digestion of wheat straw by the upflow anaerobic solid-state (UASS) process. Bioresource Technology, 124, 321-327. Pootakham, T., & Kumar, A. (2010). A comparison of pipeline versus truck transport of bio-oil. Bioresource technology, 101(1), 414-421. Prasodjo, D., Vujic, T., Cooley, D., Yeh, K., & Lee, M. Y. (2013). A spatial-economic optimization study of swine waste-derived biogas infrastructure design in North Carolina. Nicholas Institute for Environmental Policy Solutions and Duke Carbon Offsets Initiative. Duke University, Durham, NC. Redling, A. (2018). DVO commissions first anaerobic digester installation in Pennsylvania. Waste Today. Accessed July 14, 2020, at https://www.wastetodaymagazine.com/article/ar-joy-farm-anaerobic-digester-installation/. Rich, D. (2015). Harvesting manure. High Plains Journal. Accessed June 5, 2020, at https://www.hpj.com/journal_exclusive/harvesting-manure/article_0dac5a34-9ae9-57b2-93e5-66ae39c09a15.html. Rich, D. (2016). Project to convert manure into energy celebrates milestone. High Plains Journal. Accessed June 10, 2020, at https://www.hpj.com/ag_news/project-to-convert-manure-into-energy-celebrates-milestone/article_023db093-4321-56f9-a08f-73ef93d5e10d.html. Richard, T. (1996). The effect of lignin on biodegradability. Cornell Composting, Cornel Waste Management Institute, http://compost.css.cornell.edu/lignin.table.html, http://compost.css.cornell.edu/calc/lignin.noframes.html Rivard, C. J., Bordeaux, F., Henson, J. M., & Smith, P. H. (1988). Effects of addition of soluble oxidants on the thermophilic anaerobic digestion of biomass to methane. Applied biochemistry and biotechnology, 17(1-3), 245-262. Ruth, M.; Mai, T.; Newes, E.; Aden, A.; Warner, E.; Uriarte, C; Inman, D.; Simpkins, T.; Argo, A. (2013). Projected Biomass Utilization for Fuels and Power in a Mature Market. Transportation Energy Futures Series. Prepared for the U.S. Department of Energy by National Renewable Energy Laboratory, Golden, CO. DOE/GO-102013-3707. 153 pp. Rynk, R., Van de Kamp, M., Willson, G. B., Singley, M. E., Richard, T. L., Kolega, J. J., ... & Hoitink, H. A. (1992). On-Farm Composting Handbook (NRAES 54). Northeast Regional Agricultural Engineering Service (NRAES). Sayara, T., & Sánchez, A. (2019). A review on anaerobic digestion of lignocellulosic wastes: Pretreatments and operational conditions. Applied Sciences, 9(21), 4655. Scarlat, N., Dallemand, J. F., & Fahl, F. (2018). Biogas: Developments and perspectives in Europe. Renewable energy, 129, 457-472. Shah, F. A., Mahmood, Q., Rashid, N., Pervez, A., Raja, I. A., & Shah, M. M. (2015). Co-digestion, pretreatment and digester design for enhanced methanogenesis. Renewable and Sustainable Energy Reviews, 42, 627-642.

Shaw, G. T. W., Liu, A. C., Weng, C. Y., Chou, C. Y., & Wang, D. (2017). Inferring microbial interactions in thermophilic and mesophilic anaerobic digestion of hog waste. PloS one, 12(7), e0181395. Sheffler, K. (2018) Anaerobic Digestion and Biogas Production Feasibility Study. Available at: https://www.uidaho.edu/-/media/UIdaho-Responsive/Files/current-students/sustainability/Reports/anaerobic-digestion-and-biogas-production-feasibility-study.pdf?la=en&hash=B6DAF1722FDE3F4B8AEB7D6C06AE31DE3255014B Shen, Y., Linville, J. L., Urgun-Demirtas, M., Mintz, M. M., & Snyder, S. W. (2015). An overview of biogas production and utilization at full-scale wastewater treatment plants (WWTPs) in the United States: challenges and opportunities towards energy-neutral WWTPs. Renewable and Sustainable Energy Reviews, 50, 346-362. Smithfield Foods. (2014). Major Project to Deliver New Energy Source, Environmental Benefits. Smithfield Foods. Accessed June 9, 2020, at https://www.globenewswire.com/news-release/2014/01/08/601044/10063278/en/Major-Project-to-Deliver-New-Energy-Source-Environmental-Benefits.html. Smithfield Foods. (2019). Smithfield Foods’ “Manure-to-Energy” Project to Inject Renewable Natural Gas Directly to Milan, Missouri Distribution System. Smithfield Foods. Accessed June 9, 2020, at https://www.globenewswire.com/news-release/2019/08/05/1896948/0/en/Smithfield-Foods-Manure-to-Energy-Project-to-Inject-Renewable-Natural-Gas-Directly-to-Milan-Missouri-Distribution-System.html. Smithfield Foods. (2020). Smithfield Foods, Inc. and Roeslein Alternative Energy Continue Development of Manure-to-Energy Projects in Missouri. Smithfield Foods. Accessed June 10, 2020, at https://www.globenewswire.com/news-release/2020/02/20/1987897/0/en/Smithfield-Foods-Inc-and-Roeslein-Alternative-Energy-Continue-Development-of-Manure-to-Energy-Projects-in-Missouri.html Spelter H, Winandy J and Zauche T. (2008). Anaerobically digested bovine biofiber as a source of fiber for particleboard manufacturing: an economic analysis. Bioresources 3(4), 1256-1266. Spiegal, S., Kleinman, P. J., Endale, D. M., Bryant, R. B., Dell, C., Goslee, S., ... & McCarty, G. (2020). Manuresheds: Advancing nutrient recycling in US agriculture. Agricultural Systems, 182, 102813. Stokes, J. R., Rajagopalan, R. M., & Stefanou, S. E. (2008). Investment in a methane digester: An application of capital budgeting and real options. Review of agricultural economics, 30(4), 664-676. Tetra Tech, Inc. (2011) Tillamook County Bioenergy Feasibility Study Report. Available at: https://www.co.tillamook.or.us/gov/SolidWaste/(1)Documents/TillamookBioenergyFSFinalReport(03-12).pdf U.S. Bureau of Economic Analysis, Total Gross Domestic Product for Missouri [MONGSP], retrieved from FRED, Federal Reserve Bank of St. Louis. Available at: https://fred.stlouisfed.org/series/MONGSP U.S. Census Bureau, House Heating Fuel, Table B25040, (2018) ACS 1-Year Estimates Detailed Tables, Missouri USDA (2008) The Food, Conservation, and Energy Act of 2008. Available at: https://www.gpo.gov/fdsys/pkg/BILLS-110hr2419enr/pdf/BILLS-110hr2419enr.pdf U.S. Census Bureau. 2019 National and State Population Estimates. Available at: https://www.census.gov/newsroom/press-kits/2019/national-state-estimates.html U.S. Census Bureau. County Business Patterns. Available at: https://www.census.gov/data/datasets/2016/econ/cbp/2016-cbp.html
U.S. Department of Agriculture-Farm Service Administration (2011). Conservation Reserve Program - Haying and Grazing of Acreage Fact Sheet. Available at: https://www.fsa.usda.gov/Internet/FSA_File/crphayinggrazing2011.pdf U.S. Department of Agriculture, Commodity Credit Corporation, Federal Register (2003). 2002 Farm Bill—Conservation Reserve Program—Long-Term Policy; Interim Rule. Vol. 68, No. 89, May 2003. U.S. Department of Agriculture, Economic Research Service. Commodity Costs and Returns. Available at: https://www.ers.usda.gov/data-products/commodity-costs-and-returns/ U.S. Department of Agriculture, Economic Research Service. Fertilizer Use and Price. Available at: https://www.ers.usda.gov/data-products/fertilizer-use-and-price/ U.S. Department of Agriculture, Economic Research Service. State Fact Sheet: Missouri. Available at: https://data.ers.usda.gov/reports.aspx?StateFIPS=29&StateName=Missouri&ID=17854#.Uxn-8j9dV8EU.S. U.S. Department of Agriculture, Forest Service (2012) Timber Product Output Database. Available at: https://www.fia.fs.fed.us/program-features/tpo/ U.S. Department of Agriculture, National Agricultural Statistics Service. Quick Stats. U.S. Department of Agriculture, National Resources Conservation Service. Comprehensive Nutrient Management Plan. Available at: https://www.nrcs.usda.gov/wps/portal/nrcs/main/national/plantsanimals/livestock/afo/#:~:text=A%20CAFO%20is%20an%20AFO,confined%20on%20site%20for%20more U.S. Department of Energy, Alternative Fuels Data Center. Natural Gas Basics. Available at: https://afdc.energy.gov/fuels/natural_gas_basics.html U.S. Department of Energy, Alternative Fuels Data Center. Natural Gas Locations. Available at: https://afdc.energy.gov/fuels/natural_gas_locations.html#/find/nearest?fuel=CNG U.S. Environmental Protection Agency, Landfill Methane Outreach Program (2019) Basic Information about Landfill Gas. Available at: https://www.epa.gov/lmop/basic-information-about-landfill-gas U.S. Environmental Protection Agency, Landfill Methane Outreach Program (2017) Landfill Gas Energy Project Development Handbook. Available at: https://www.epa.gov/lmop/landfill-gas-energy-project-development-handbook-files#file-305219 U.S. Environmental Protection Agency, Landfill Methane Outreach Program. Landfill Gas Energy Project Database. Available at: https://www.epa.gov/lmop/landfill-gas-energy-project-data U.S. Environmental Protection Agency. Types of Anaerobic Digesters. Available at: https://www.epa.gov/anaerobic-digestion/types-anaerobic-digesters#WRRFdigesters U.S. Environmental Protection Agency (2019). Advancing Sustainable Materials Management: 2017 Fact Sheet. Available at: https://www.epa.gov/facts-and-figures-about-materials-waste-and-recycling/advancing-sustainable-materials-management U.S. Environmental Protection Agency. (2018). Project Profile: Ruckman Farm. U.S. Environmental Protection Agency. Accessed June 4, 2020, at https://www.epa.gov/sites/production/files/2018-05/documents/agstar_profile_ruckman_2018.pdf.

U.S. Environmental Protection Agency (2020). AgSTAR Livestock Anaerobic Digester Database. U.S. Environmental Protection Agency. Accessed June 5, 2020, at https://www.epa.gov/agstar/livestock-anaerobic-digester-database. U.S. Environmental Protection Agency (2019). Anaerobic Digestion Facilities Processing Food Waste in the United States (2016): Survey Results. EPA/903/S-19/001. Available at: https://www.epa.gov/anaerobic-digestion/anaerobic-digestion-facilities-processing-food-waste-united-states-survey U.S. Energy Information Administration (2009) EIA’s 2009 Residential Energy Consumption Survey: Available at: eia.gov/consumption/residential/reports/2009/state_briefs/pdf/mo.pdf U.S. Energy Information Administration. State Profile: Missouri. Available at: eia.gov/state/?sid=MO U.S. Energy Information Administration. State Energy Data System. Available at: https://www.eia.gov/state/seds/ U.S. Energy Information Administration (2020). Annual Energy Outlook 2020. Available at: https://www.eia.gov/outlooks/aeo/ U.S. Environmental Protection Agency. Landfill Methane Outreach Program. Database. Available at: https://www.epa.gov/lmop/landfill-gas-energy-project-data-and-landfill-technical-data U.S. Geological Survey (2020) 2020 Peat Report. Available at: https://pubs.usgs.gov/periodicals/mcs2020/mcs2020-peat.pdf Usack, J. G., Van Doren, L. G., Posmanik, R., Labatut, R. A., Tester, J. W., & Angenent, L. T. (2018). An evaluation of anaerobic co-digestion implementation on New York State dairy farms using an environmental and economic life-cycle framework. Applied Energy, 211, 28-40. Value Ag LLC. (2012). Biomass Co-Products Marketing Study. Vaneeckhaute, C., Lebuf, V., Michels, E., Belia, E., Vanrolleghem, P. A., Tack Filip, M. G., et al. (2017). Nutrient recovery from digestate: systematic technology review and product classification. Waste Biomass Valor 8, 21–40. Voegele, E. (2020). Aemetis provide updates of RNG, cellulosic ethanol projects. Biomass Magazine Available at: http://biomassmagazine.com/articles/16886/aemetis-provide-updates-of-rng-cellulosic-ethanol-projects Waste Today. (2019). Brightmark Energy partners with dairy farms to produce biogas. Waste Today. Accessed July 14, 2020, https://www.wastetodaymagazine.com/article/brightmark-energy-partners-dairy-farms-biogas-anaerobic-digester/. Wang, Q., Thompson, E., Parsons, R., Rogers, G., & Dunn, D. (2011). Economic feasibility of converting cow manure to electricity: a case study of the CVPS cow power program in Vermont. Journal of dairy science, 94(10), 4937-4949. Wellinger, A. & Lindberg, A. (1999). Biogas upgrading and utilisation. IEA Bioenergy. Task 24: Energy from biological conversion of organic waste. Wheeler, T. (2019). Maryland firm plans chicken litter recycling plant at Perdue’s Sussex facility. Bay Journal News Service. Accessed June 3, 2020, at https://www.delmarvanow.com/story/news/local/maryland/2019/12/02/md-firm-plans-chicken-litter-recycling-plant-perdues-sussex-facility/4295944002/. Zhen, M., Zhang, Y., Hu, D., Fan, J., & Zeng, G. (2018). A review on removal of siloxanes from biogas: with a special focus on volatile methylsiloxanes. Environmental Science and Pollution Research, 25(31), 30847-30862.

Zhu, J. (2000). A review of microbiology in swine manure odor control. Agriculture, Ecosystems & Environment, 78(2), 93-106.

SUPPLEMENTAL MATERIALS This supplemental section provides more detail in two main areas: the AD process and the process of upgrading biogas to biomethane for vehicle fuel. Although upgrading biogas to biomethane is still a relatively new market, it represents a significant area of interest for biogas investment. In Missouri, a several projects plan to market biomethane as a vehicle fuel. Accordingly, understanding this process and its economics may be of interest. Anaerobic Digestion Process Biochemistry Biogas production involves four distinct chemical and biological processes: hydrolysis, acidogenesis, acetogenesis and methanogenesis. These processes do not differ in wet or dry digestion systems (Kothari et al. 2014). Exhibit S1 summarizes the digestion processes. Four sets of bacteria are involved: hydrolytic, acidogenic, acetogenic and methanogenic. Each corresponds to one of the four stages of anaerobic digestion. Of these, methanogenic bacteria and acetogenic bacteria cannot live in the presence of oxygen. Acidogenic and hydrolytic bacteria are capable of living under both aerobic and anaerobic conditions. Hydrolysis is, theoretically, anaerobic digestion’s first step. During this step, complex organic matter (polymers), including carbohydrates, proteins, fats and nucleic acids, are decomposed into smaller units (mono- and oligomers), such as glucose, glycerol, purines and pyridines. Specialized microbes produce a number of specific enzymes, which catalyze decomposition. During acidogenesis, acidogenic bacteria transform the hydrolysis products into short-chain volatile fatty acids, alcohol, ketones, carbon dioxide and hydrogen. Some of the major acidogenesis-stage products are acetic acid, propionic acid, formic acid, butyric acid, lactic acid, ethanol and methanol. From these products, carbon dioxide, hydrogen and acetic acid skip the third stage — acetogenesis — and are used directly by methanogenic bacteria in the final stage to make biogas, methane and carbon dioxide. Acetogenesis depends on the digesting material’s hydrogen concentration. At low hydrogen levels, which are maintained by a healthy population of methanogenic bacteria, acetogenesis is unhindered. It continues converting proprionic acid into acetate and other volatile fatty acids (VFA). However, at higher hydrogen levels, the acetogens cease to operate as efficiently. This negatively affects methanogenic activity and ultimately the entire anaerobic digestion process (Boone and Mah 1987). Methanogenesis occurs as methanogenic bacteria utilize the products of prior anaerobic digestion stages to produce CH4 and CO2. During methanogenesis, acetate is cleaved, and the resulting methyl group (CH3) is reduced to form CH4 and CO2. The CO2 produced during acetogenesis and acidogenesis is reduced to CH4 using hydrogen. Energy is gained from electron transfer during the reduction of CO2 and the methyl group of the cleaved acetate molecule (Ferguson and Mah 1987). Of the CH4 produced in the final methanogenic stage, about 70% derive from acetate catabolism. The remainder result from reducing CO2 (Ferguson and Mah 1987). A small amount results from the catabolism of formate and methanol produced during acidogenesis.
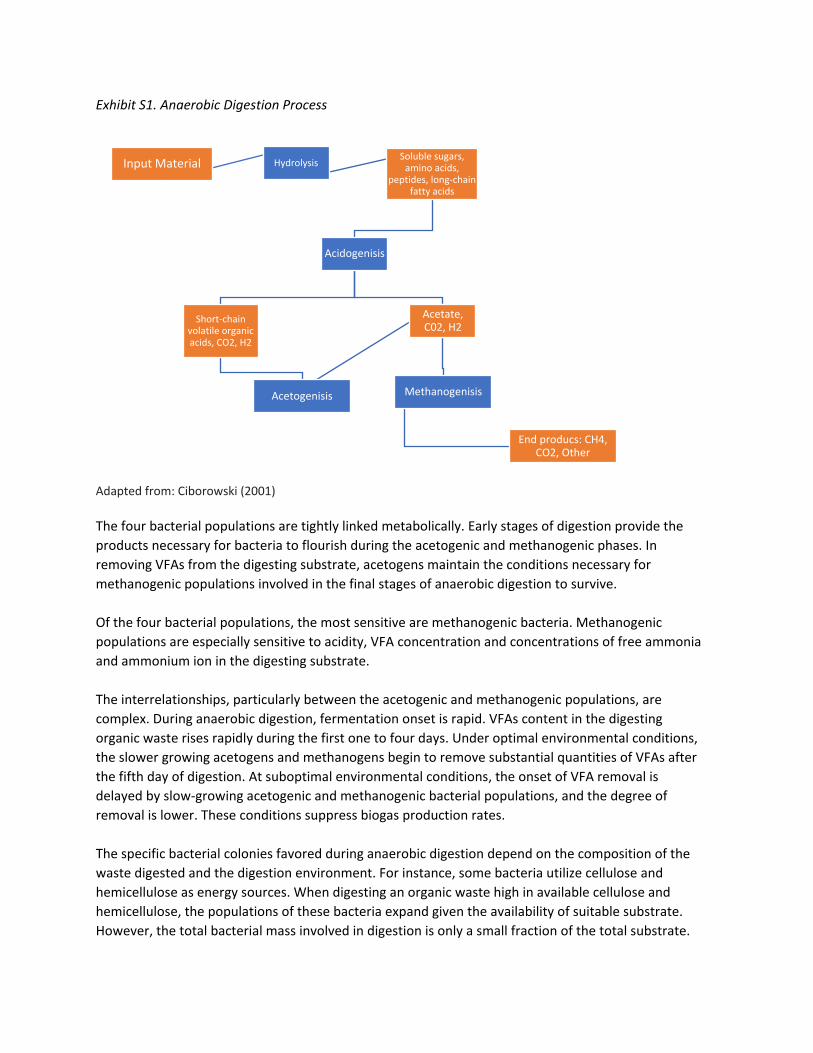
Exhibit S1. Anaerobic Digestion Process
Adapted from: Ciborowski (2001) The four bacterial populations are tightly linked metabolically. Early stages of digestion provide the products necessary for bacteria to flourish during the acetogenic and methanogenic phases. In removing VFAs from the digesting substrate, acetogens maintain the conditions necessary for methanogenic populations involved in the final stages of anaerobic digestion to survive. Of the four bacterial populations, the most sensitive are methanogenic bacteria. Methanogenic populations are especially sensitive to acidity, VFA concentration and concentrations of free ammonia and ammonium ion in the digesting substrate. The interrelationships, particularly between the acetogenic and methanogenic populations, are complex. During anaerobic digestion, fermentation onset is rapid. VFAs content in the digesting organic waste rises rapidly during the first one to four days. Under optimal environmental conditions, the slower growing acetogens and methanogens begin to remove substantial quantities of VFAs after the fifth day of digestion. At suboptimal environmental conditions, the onset of VFA removal is delayed by slow-growing acetogenic and methanogenic bacterial populations, and the degree of removal is lower. These conditions suppress biogas production rates. The specific bacterial colonies favored during anaerobic digestion depend on the composition of the waste digested and the digestion environment. For instance, some bacteria utilize cellulose and hemicellulose as energy sources. When digesting an organic waste high in available cellulose and hemicellulose, the populations of these bacteria expand given the availability of suitable substrate. However, the total bacterial mass involved in digestion is only a small fraction of the total substrate.
Input Material Hydrolysis Soluble sugars, amino acids,
peptides, long-chain fatty acids
Acidogenisis
Short-chain volatile organic acids, CO2, H2
Acetogenisis
Acetate, C02, H2
Methanogenisis
End producs: CH4, CO2, Other
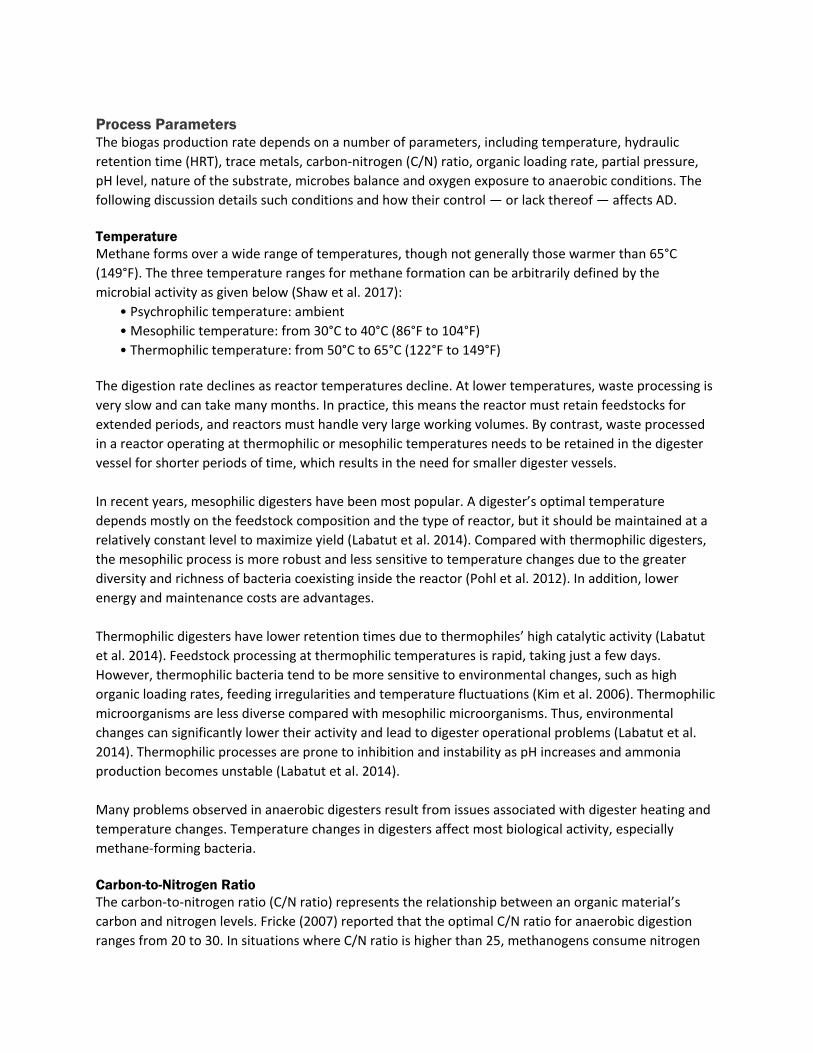
Process Parameters The biogas production rate depends on a number of parameters, including temperature, hydraulic retention time (HRT), trace metals, carbon-nitrogen (C/N) ratio, organic loading rate, partial pressure, pH level, nature of the substrate, microbes balance and oxygen exposure to anaerobic conditions. The following discussion details such conditions and how their control — or lack thereof — affects AD. Temperature Methane forms over a wide range of temperatures, though not generally those warmer than 65°C (149°F). The three temperature ranges for methane formation can be arbitrarily defined by the microbial activity as given below (Shaw et al. 2017):
• Psychrophilic temperature: ambient • Mesophilic temperature: from 30°C to 40°C (86°F to 104°F) • Thermophilic temperature: from 50°C to 65°C (122°F to 149°F)
The digestion rate declines as reactor temperatures decline. At lower temperatures, waste processing is very slow and can take many months. In practice, this means the reactor must retain feedstocks for extended periods, and reactors must handle very large working volumes. By contrast, waste processed in a reactor operating at thermophilic or mesophilic temperatures needs to be retained in the digester vessel for shorter periods of time, which results in the need for smaller digester vessels. In recent years, mesophilic digesters have been most popular. A digester’s optimal temperature depends mostly on the feedstock composition and the type of reactor, but it should be maintained at a relatively constant level to maximize yield (Labatut et al. 2014). Compared with thermophilic digesters, the mesophilic process is more robust and less sensitive to temperature changes due to the greater diversity and richness of bacteria coexisting inside the reactor (Pohl et al. 2012). In addition, lower energy and maintenance costs are advantages. Thermophilic digesters have lower retention times due to thermophiles’ high catalytic activity (Labatut et al. 2014). Feedstock processing at thermophilic temperatures is rapid, taking just a few days. However, thermophilic bacteria tend to be more sensitive to environmental changes, such as high organic loading rates, feeding irregularities and temperature fluctuations (Kim et al. 2006). Thermophilic microorganisms are less diverse compared with mesophilic microorganisms. Thus, environmental changes can significantly lower their activity and lead to digester operational problems (Labatut et al. 2014). Thermophilic processes are prone to inhibition and instability as pH increases and ammonia production becomes unstable (Labatut et al. 2014). Many problems observed in anaerobic digesters result from issues associated with digester heating and temperature changes. Temperature changes in digesters affect most biological activity, especially methane-forming bacteria. Carbon-to-Nitrogen Ratio The carbon-to-nitrogen ratio (C/N ratio) represents the relationship between an organic material’s carbon and nitrogen levels. Fricke (2007) reported that the optimal C/N ratio for anaerobic digestion ranges from 20 to 30. In situations where C/N ratio is higher than 25, methanogens consume nitrogen
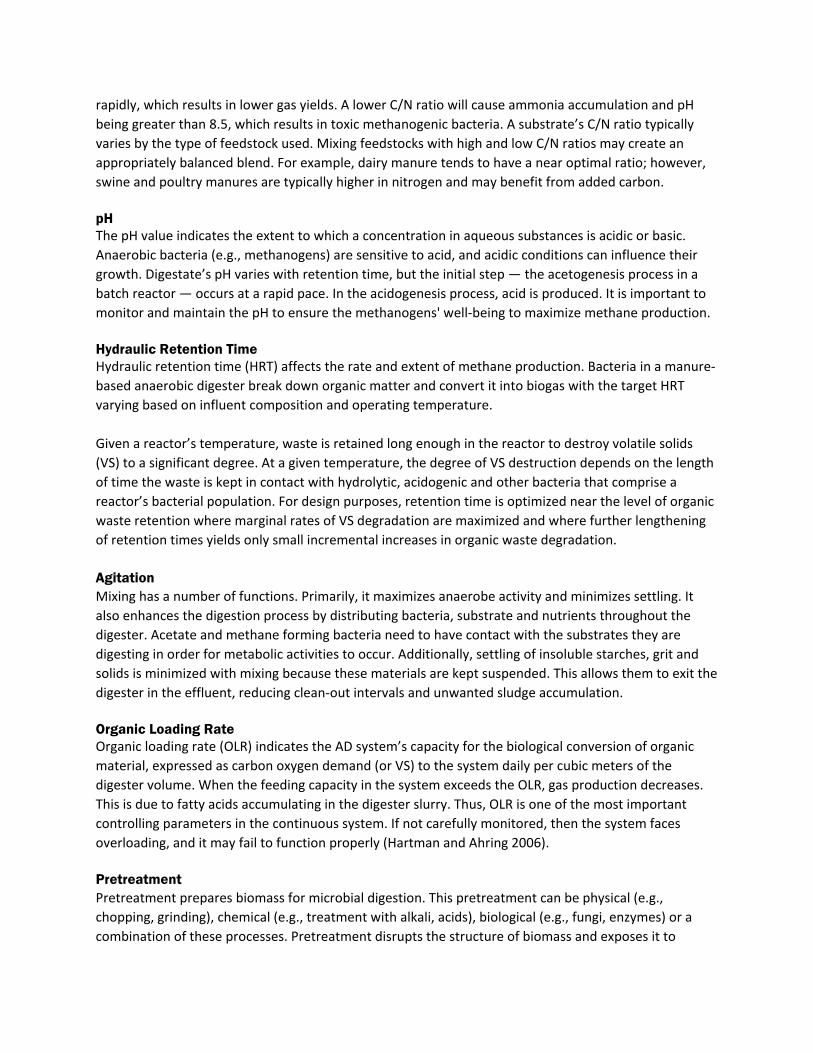
rapidly, which results in lower gas yields. A lower C/N ratio will cause ammonia accumulation and pH being greater than 8.5, which results in toxic methanogenic bacteria. A substrate’s C/N ratio typically varies by the type of feedstock used. Mixing feedstocks with high and low C/N ratios may create an appropriately balanced blend. For example, dairy manure tends to have a near optimal ratio; however, swine and poultry manures are typically higher in nitrogen and may benefit from added carbon. pH The pH value indicates the extent to which a concentration in aqueous substances is acidic or basic. Anaerobic bacteria (e.g., methanogens) are sensitive to acid, and acidic conditions can influence their growth. Digestate’s pH varies with retention time, but the initial step — the acetogenesis process in a batch reactor — occurs at a rapid pace. In the acidogenesis process, acid is produced. It is important to monitor and maintain the pH to ensure the methanogens' well-being to maximize methane production. Hydraulic Retention Time Hydraulic retention time (HRT) affects the rate and extent of methane production. Bacteria in a manure-based anaerobic digester break down organic matter and convert it into biogas with the target HRT varying based on influent composition and operating temperature. Given a reactor’s temperature, waste is retained long enough in the reactor to destroy volatile solids (VS) to a significant degree. At a given temperature, the degree of VS destruction depends on the length of time the waste is kept in contact with hydrolytic, acidogenic and other bacteria that comprise a reactor’s bacterial population. For design purposes, retention time is optimized near the level of organic waste retention where marginal rates of VS degradation are maximized and where further lengthening of retention times yields only small incremental increases in organic waste degradation. Agitation Mixing has a number of functions. Primarily, it maximizes anaerobe activity and minimizes settling. It also enhances the digestion process by distributing bacteria, substrate and nutrients throughout the digester. Acetate and methane forming bacteria need to have contact with the substrates they are digesting in order for metabolic activities to occur. Additionally, settling of insoluble starches, grit and solids is minimized with mixing because these materials are kept suspended. This allows them to exit the digester in the effluent, reducing clean-out intervals and unwanted sludge accumulation. Organic Loading Rate Organic loading rate (OLR) indicates the AD system’s capacity for the biological conversion of organic material, expressed as carbon oxygen demand (or VS) to the system daily per cubic meters of the digester volume. When the feeding capacity in the system exceeds the OLR, gas production decreases. This is due to fatty acids accumulating in the digester slurry. Thus, OLR is one of the most important controlling parameters in the continuous system. If not carefully monitored, then the system faces overloading, and it may fail to function properly (Hartman and Ahring 2006). Pretreatment Pretreatment prepares biomass for microbial digestion. This pretreatment can be physical (e.g., chopping, grinding), chemical (e.g., treatment with alkali, acids), biological (e.g., fungi, enzymes) or a combination of these processes. Pretreatment disrupts the structure of biomass and exposes it to
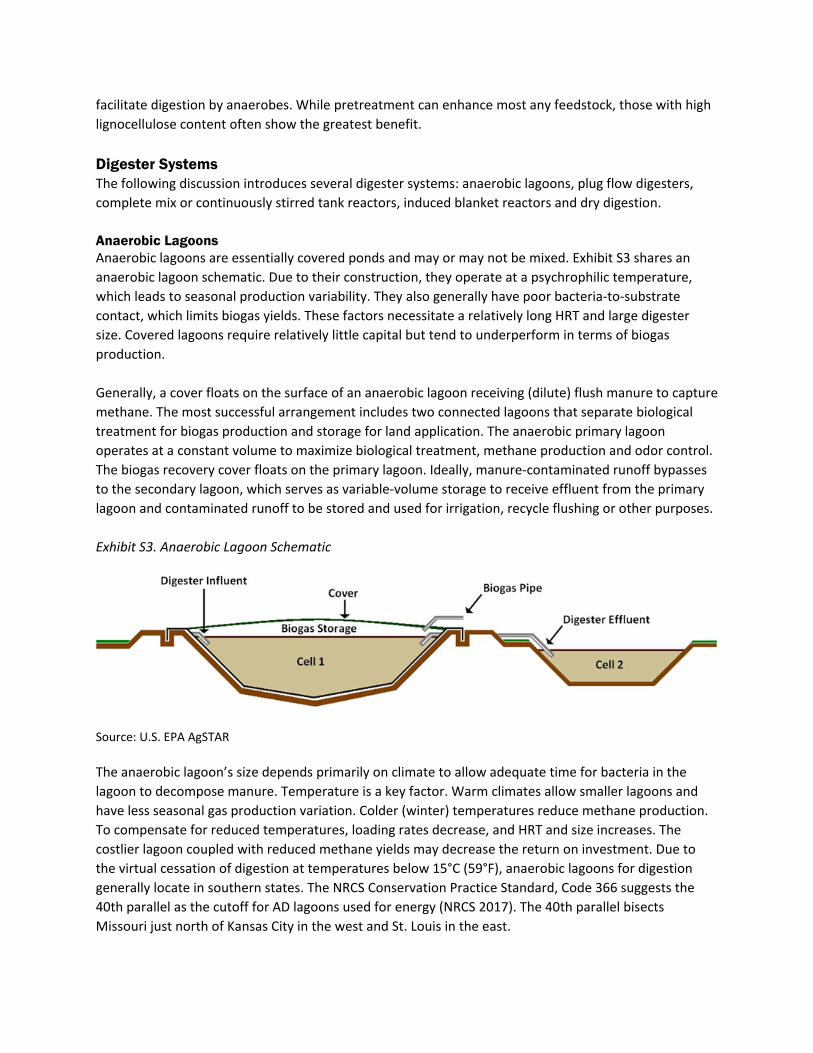
facilitate digestion by anaerobes. While pretreatment can enhance most any feedstock, those with high lignocellulose content often show the greatest benefit. Digester Systems The following discussion introduces several digester systems: anaerobic lagoons, plug flow digesters, complete mix or continuously stirred tank reactors, induced blanket reactors and dry digestion. Anaerobic Lagoons Anaerobic lagoons are essentially covered ponds and may or may not be mixed. Exhibit S3 shares an anaerobic lagoon schematic. Due to their construction, they operate at a psychrophilic temperature, which leads to seasonal production variability. They also generally have poor bacteria-to-substrate contact, which limits biogas yields. These factors necessitate a relatively long HRT and large digester size. Covered lagoons require relatively little capital but tend to underperform in terms of biogas production. Generally, a cover floats on the surface of an anaerobic lagoon receiving (dilute) flush manure to capture methane. The most successful arrangement includes two connected lagoons that separate biological treatment for biogas production and storage for land application. The anaerobic primary lagoon operates at a constant volume to maximize biological treatment, methane production and odor control. The biogas recovery cover floats on the primary lagoon. Ideally, manure-contaminated runoff bypasses to the secondary lagoon, which serves as variable-volume storage to receive effluent from the primary lagoon and contaminated runoff to be stored and used for irrigation, recycle flushing or other purposes. Exhibit S3. Anaerobic Lagoon Schematic
Source: U.S. EPA AgSTAR The anaerobic lagoon’s size depends primarily on climate to allow adequate time for bacteria in the lagoon to decompose manure. Temperature is a key factor. Warm climates allow smaller lagoons and have less seasonal gas production variation. Colder (winter) temperatures reduce methane production. To compensate for reduced temperatures, loading rates decrease, and HRT and size increases. The costlier lagoon coupled with reduced methane yields may decrease the return on investment. Due to the virtual cessation of digestion at temperatures below 15°C (59°F), anaerobic lagoons for digestion generally locate in southern states. The NRCS Conservation Practice Standard, Code 366 suggests the 40th parallel as the cutoff for AD lagoons used for energy (NRCS 2017). The 40th parallel bisects Missouri just north of Kansas City in the west and St. Louis in the east.

Plug-Flow Digesters Plug-flow digesters are horizontal reactors. Feedstocks enter on one end, and effluent exits the other. As feedstock is added at one end, an equal proportion is removed from the other side in roughly equal volumes. Substrate moves through the reactor in a cohesive unit (plug) that is not typically mixed. Exhibit S4 shares a schematic of the plug-flow digester design. A plug-flow digester system generally includes a mix tank, digester tank with heat exchanger and biogas recovery system, effluent storage structure and biogas utilization system. Although different designs are available, a plug-flow digester is commonly a heated, in-ground concrete, concrete block or lined rectangular tank. The digester can be covered by a fixed rigid top, a flexible inflatable top or a floating cover to collect and direct biogas to the gas utilization system. The expandable, floating roof allows for biogas storage in the digester as opposed to a separate biogas holder. Plug-flow digesters have moderate capital and operational costs as well as moderate methane yields. Sand and silt can settle in the digester and motivate periodic system cleaning, which causes downtime. Numerous plug-flow digester variations exist to either improve efficiency or operating conditions. Plug-flow digesters have a narrow solids range to avoid stratification or obstruction. A mix tank is commonly used to homogenize solids concentration to between 11% and 13%, though some designs make a lower solids content possible (Oregon, E.C. 2009). A plug-flow digester will function with an HRT from 12 days to 80 days. However, an HRT between 15 days and 30 days is most commonly used to produce an economically optimal methane yield. Exhibit S4. Plug-Flow Digester Schematic
Source: American Biogas Council americanbiogascouncil.org/resources/types-of-biogas-systems/ Complete Mix or Continuously Stirred Tank Reactor A complete mix or continuously stirred tank reactor (CTSR) is a heated, above-ground or in-ground tank. Its components generally include a mix tank; digester tank with mixing, heating and biogas recovery systems; effluent storage structure; and biogas utilization system. The mix tank allows the system to accommodate a wide range of feedstocks as it serves to homogenize the feedstock to predefined standards, such as water content. The feedstock is typically mixed to 3% to 10% solids content prior to introduction into the complete-mix digesters. The digestion tank is covered by a fixed solid top, a flexible inflatable top or a floating cover to collect, store and direct biogas to the gas recovery system. Exhibit S5 shares a schematic of this digester design. A complete-mix digester is fed hourly to daily, displacing an equal amount of manure from the outlet.

CTSR digesters periodically or continuously mix substrate by mechanical hydraulic or gas injection to minimize settling and maximize bacteria-to-substrate contact. They can operate at mesophilic or thermophilic temperatures to allow for a wide range of operating configurations, HRT and biogas yields. Because AD influent is constantly mixed with contents already undergoing digestion, the AD contents at any given point have been in the tank for various lengths of time. Therefore, undigested manure may exit the digester prematurely, and well-digested manure may remain in the vessel in excess of the design HRT. This limits the feedstock’s methane yield potential. Despite the mixing and care to separate undesired solids from influent solids, sludge does build up in the digester. Sludge accumulation may require sludge removal every eight years to 10 years and necessitate totally shutting down the process. Restarting and restabilizing the process can take weeks and require purchased fuel to heat the reactor. Exhibit S5. Complete Mix or Continuously Stirred Tank Reactor Schematic
Source: American Biogas Council https://americanbiogascouncil.org/resources/types-of-biogas-systems/ Induced Blanket Reactor (IBR) An induced blanket reactor (IBR) is a high-rate, thermophilic system with short HRT. These digesters suspend anaerobes in a constant upward flow of liquid. Flow is adjusted to allow smaller particles to wash out and larger ones to remain in the digester. Microorganisms form biofilms around the larger particles, so anaerobes stay in the digester. Effluent is generally recycled to provide the steady upward flow. The technology consists of above-ground tanks with high height-to-diameter ratios. Tanks are designed as flow-through systems with influent entering at the bottom and effluent exiting at the top. Another common type of suspended media digester is the upflow anaerobic sludge blanket (UASB) digester. The main difference between these two systems is that UASB digesters are better suited for dilute waste streams (<3% total suspended solids). The IBR digester works best with more concentrated wastes (6% to 12% TS). Dry Digestion In addition to digesters commonly associated with manure and slurry, dry digestion has potential application in a few circumstances. As the name implies, the material must be sufficiently dry to be stackable. Usually, 15% TS or greater is considered dry anaerobic digestion (Chiumenti et al. 2017).

Feedstocks commonly used with dry digesters may include yard wastes, poultry litter and food waste.
The process involves piling feedstock into a chamber and then sealing the chamber. The chamber may resemble a garage that allows a front loader to add and remove the feedstock. Once in the digester, the door is sealed, and the moisture of the feedstock is monitored and maintained with sprinklers. Biogas is allowed to vent via pipes. The stacked feedstock digests until gas production slows to a predetermined rate. At which point, the feedstock is removed and replaced. Exhibit S6 shares a schematic. Dry anaerobic digestion saves energy and water. It does not require adding significant water to the substrate, meaning that it does not require dewatering or (as much) energy to dry the digestate. Unlike in wet digestion, the substrate in dry digestion does not need stirring or pumping through pipes, which sometimes can have blockages. Despite its advantages, the process can show inhabitation problems due to the large inoculum requirements, long retention time and accumulation of volatile fatty acids. Exhibit S6. Dry Digester System Schematic
Source: American Biogas Council americanbiogascouncil.org/resources/types-of-biogas-systems/
Digester Outputs Biogas operations described above produce two main products: biogas and digestate. Biogas An AD’s main product is biogas, which is generally 60% to 65% methane (CH4) and 35% to 40% carbon dioxide (CO2) in its raw form. Minor constituents are hydrogen sulfide (H2S), nitrogen (N2) and hydrogen (H2). It also includes traces of oxygen (O2), carbon monoxide (CO), ammonia (NH3), argon (Ar2) and other volatile organic compounds (VOC). The composition will depend on the feedstock, physical-chemical conditions in the digester (e.g., pH, alkalinity, temperature) and presence of other anions such as sulfates and nitrates. Exhibit S7 shows likely biogas composition for some feedstocks. Exhibit S7. Composition of Biogas Generated by Select Feedstocks
Components Household waste
Wastewater treatment plants
sludge
Agricultural wastes
Waste of agrifood industry
CH4 % vol 50-60 60-75 60-75 68 CO2 % vol 38-34 33-19 33-19 26 N2 % vol 5-0 1-0 1-0 - O2 % vol 1-0 < 0.5 < 0.5 - H2O % vol 6 (40°C) 6 (40°C) 6 (40°C) 6 (40°C) Total % vol 100 100 100 100 H2S mg/m3 100 - 900 1000 - 4000 3000 – 10 000 400 NH3 mg/m3 - - 50 - 100 - Aromatic mg/m3 0 - 200 - - -
Source: biogas-renewable-energy.info/biogas_composition.html

The concentration of CH4 in biogas can vary due to factors including temperature, influent feed rate, livestock feed rations and substances introduced with the influent. In the case of manure-based AD, methane concentration measured at 12 farms in New York ranged from 55% to 65% (Ludington and Weeks 2008), and the industry standard assumption for CH4 content of biogas is 60%. Biogas contaminants are often removed as they have negative impacts on biogas use and performance. CO2 is the major impurity. It lowers the biogas’ energy content. Water and H2S both have corrosive effects on equipment. In some cases, facilities may have trouble with siloxanes that tend to have abrasive properties that affect engines burning the biogas. Biogas Precleaning In most biogas operations, some initial biogas cleaning will be necessary before it can be utilized. Precleaning varies dramatically across operations and is affected by 1) the feedstock used, 2) the type of anaerobic digester, 3) the biogas use and 4) the type of cleaning technology employed. For example, gas from landfills and covered lagoons can have elevated nitrogen (N2) and oxygen (O2) levels while landfills and WWTP digesters may require siloxane management. However, boilers and some gas turbines may operate effectively with moderate levels of these contaminates. Likewise, some biogas-upgrading technologies may work with wet gas and will inherently remove certain contaminants. As such, pre-treating biogas depends highly on the situation. The following sections describe the main contaminants relevant to precleaning. Note, however, that the end product remains biogas with roughly 60% methane. Further upgrading is needed for the biogas to perform comparably to natural gas. Water Because biogas from digesters is normally collected from headspace above a very moist substrate, the gas is usually saturated with water vapor. The amount of water vapor depends on temperature and pressure. Biogas typically contains 10% water vapor by volume at 110°F, 5% by volume at 90°F and 1% by volume at 40°F (Krich et al. 2005). The water can react with H2S or CO2 to form corrosive agents, so its removal may be necessary to lengthen equipment life. Removing water may also help to eliminate water-soluble contaminants such as H2S and ammonia. Reducing the moisture increases the proportion of the gas that is methane, so it also increases energy content. To remove moisture from biogas, the simplest method is a passive strategy that uses the temperature differential of the biogas leaving the digester and the biogas piped underground. The ground cools the biogas piping material, which results in some of the moisture contained in the saturated biogas to condense to liquid. A condensate trap at the end or low point of the biogas pipe collects condensed moisture. Refrigeration can offer more control. Typically, a refrigeration system cools ethylene glycol, which circulates through a heat exchanger to cool the biogas below the dew point, which is roughly 52°F when saturated. Cooling the biogas from 37.7°C (100°F) to below the dew point can remove up to 75% of the water (Krich et al. 2005). H2S In addition to posing a hazard to human and animal health, biogas containing H2S is highly corrosive and negatively affects equipment. Even in low concentrations, H2S can corrode pipelines and equipment and
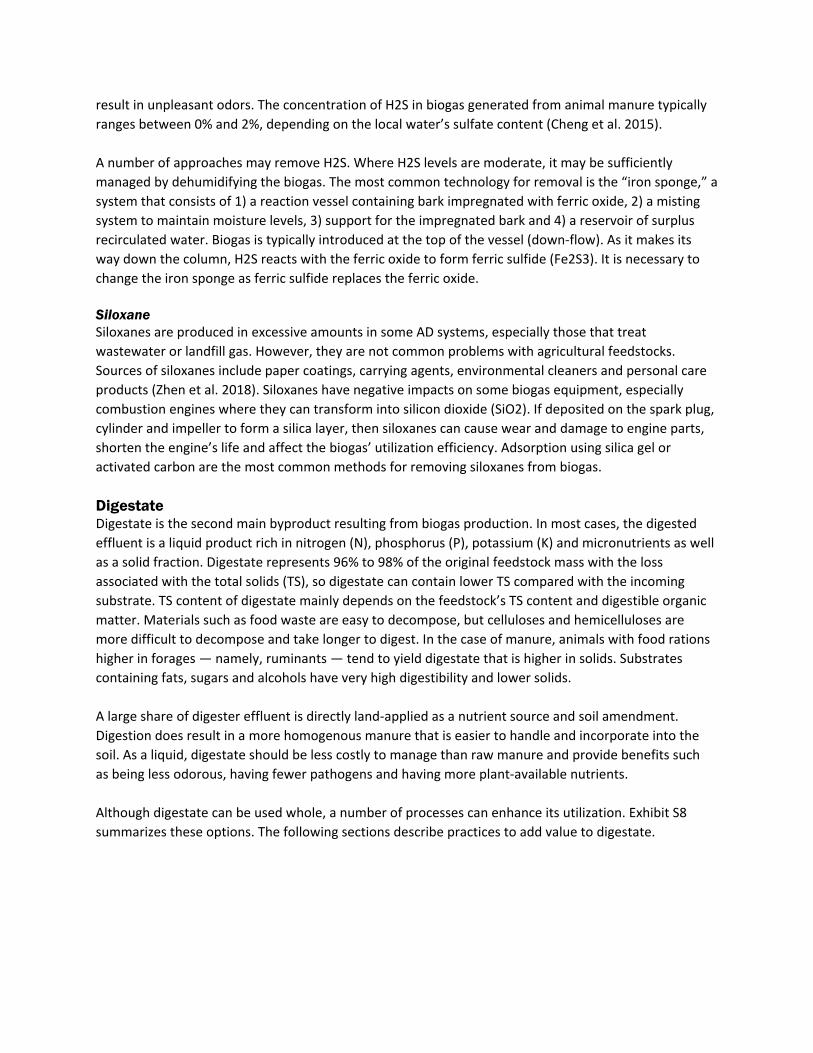
result in unpleasant odors. The concentration of H2S in biogas generated from animal manure typically ranges between 0% and 2%, depending on the local water’s sulfate content (Cheng et al. 2015). A number of approaches may remove H2S. Where H2S levels are moderate, it may be sufficiently managed by dehumidifying the biogas. The most common technology for removal is the “iron sponge,” a system that consists of 1) a reaction vessel containing bark impregnated with ferric oxide, 2) a misting system to maintain moisture levels, 3) support for the impregnated bark and 4) a reservoir of surplus recirculated water. Biogas is typically introduced at the top of the vessel (down-flow). As it makes its way down the column, H2S reacts with the ferric oxide to form ferric sulfide (Fe2S3). It is necessary to change the iron sponge as ferric sulfide replaces the ferric oxide. Siloxane Siloxanes are produced in excessive amounts in some AD systems, especially those that treat wastewater or landfill gas. However, they are not common problems with agricultural feedstocks. Sources of siloxanes include paper coatings, carrying agents, environmental cleaners and personal care products (Zhen et al. 2018). Siloxanes have negative impacts on some biogas equipment, especially combustion engines where they can transform into silicon dioxide (SiO2). If deposited on the spark plug, cylinder and impeller to form a silica layer, then siloxanes can cause wear and damage to engine parts, shorten the engine’s life and affect the biogas’ utilization efficiency. Adsorption using silica gel or activated carbon are the most common methods for removing siloxanes from biogas. Digestate Digestate is the second main byproduct resulting from biogas production. In most cases, the digested effluent is a liquid product rich in nitrogen (N), phosphorus (P), potassium (K) and micronutrients as well as a solid fraction. Digestate represents 96% to 98% of the original feedstock mass with the loss associated with the total solids (TS), so digestate can contain lower TS compared with the incoming substrate. TS content of digestate mainly depends on the feedstock’s TS content and digestible organic matter. Materials such as food waste are easy to decompose, but celluloses and hemicelluloses are more difficult to decompose and take longer to digest. In the case of manure, animals with food rations higher in forages — namely, ruminants — tend to yield digestate that is higher in solids. Substrates containing fats, sugars and alcohols have very high digestibility and lower solids. A large share of digester effluent is directly land-applied as a nutrient source and soil amendment. Digestion does result in a more homogenous manure that is easier to handle and incorporate into the soil. As a liquid, digestate should be less costly to manage than raw manure and provide benefits such as being less odorous, having fewer pathogens and having more plant-available nutrients. Although digestate can be used whole, a number of processes can enhance its utilization. Exhibit S8 summarizes these options. The following sections describe practices to add value to digestate.
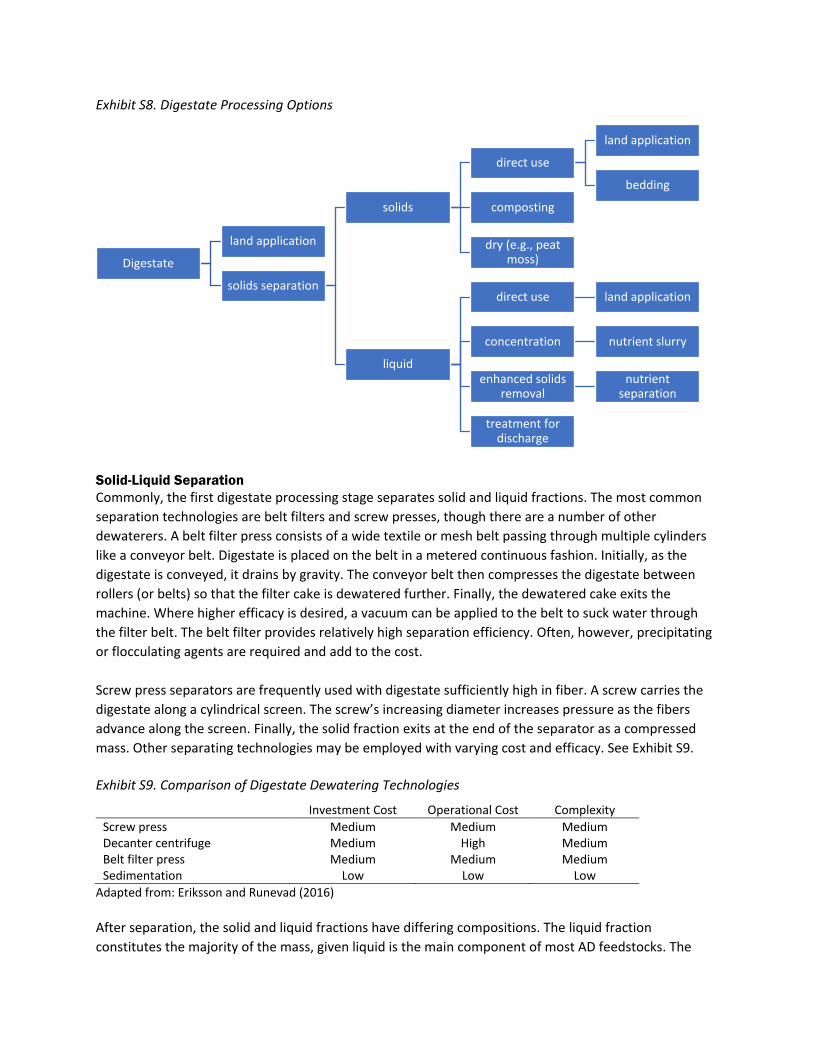
Exhibit S8. Digestate Processing Options
Solid-Liquid Separation Commonly, the first digestate processing stage separates solid and liquid fractions. The most common separation technologies are belt filters and screw presses, though there are a number of other dewaterers. A belt filter press consists of a wide textile or mesh belt passing through multiple cylinders like a conveyor belt. Digestate is placed on the belt in a metered continuous fashion. Initially, as the digestate is conveyed, it drains by gravity. The conveyor belt then compresses the digestate between rollers (or belts) so that the filter cake is dewatered further. Finally, the dewatered cake exits the machine. Where higher efficacy is desired, a vacuum can be applied to the belt to suck water through the filter belt. The belt filter provides relatively high separation efficiency. Often, however, precipitating or flocculating agents are required and add to the cost. Screw press separators are frequently used with digestate sufficiently high in fiber. A screw carries the digestate along a cylindrical screen. The screw’s increasing diameter increases pressure as the fibers advance along the screen. Finally, the solid fraction exits at the end of the separator as a compressed mass. Other separating technologies may be employed with varying cost and efficacy. See Exhibit S9. Exhibit S9. Comparison of Digestate Dewatering Technologies
Investment Cost Operational Cost Complexity Screw press Medium Medium Medium Decanter centrifuge Medium High Medium Belt filter press Medium Medium Medium Sedimentation Low Low Low
Adapted from: Eriksson and Runevad (2016) After separation, the solid and liquid fractions have differing compositions. The liquid fraction constitutes the majority of the mass, given liquid is the main component of most AD feedstocks. The
Digestate
land application
solids separation
solids
direct use
land application
bedding
composting
dry (e.g., peat moss)
liquid
direct use land application
concentration nutrient slurry
enhanced solids removal
nutrient separation
treatment for discharge

solid fraction may only be 10% to 20% of the total mass. The solids portion is likely to contain less than 30% total solids. The liquid portion’s solids content may be 3% to 5% (Drosg et al. 2015), though this varies significantly. The liquid fraction holds the majority of the nitrogen and potassium. A larger share of phosphorous may stay with the solid fraction (Bauer 2009). See Exhibit S10. The nature of the remaining solids in the digestate can also vary due to AD technology. For example, AD lagoons that allow solids to settle may result in a predominantly liquid digestate. Further, digestate solids may be retained in the lagoon for a time sufficient to allow them to turn to sludge. Conversely, in AD with a shorter HRT, a portion of the solids may be more fibrous. Exhibit S10. Liquid and Solid Fraction Principal Constituents After Separation
Liquid Fraction Solid Fraction Mass 80-90% 10-20% TS 40-50% 50-60% TN 65-75% 20-30% NH4-N 70-80% 20-30% P 35-45% 55-65% K 70-80% 20-30%
Source: Bauer et al. (2009) Processing Solids The separated solid fraction may be applied directly to agricultural land; reducing the water content considerably lowers transport costs. It is also frequently used as livestock bedding that offers reduced pathogen load, dust suppression and suitability for composting after use. Another advantage is that the solid fraction can be stored under much simpler conditions. However, in most cases, this fraction still contains biodegradable material, and microbial activity can still occur. Drying or composting would further stabilize solids and transform them into a marketable product. In general, composting the solid fraction increases the nutrient concentration but also may result in nitrogen loss. If electrical power is produced at the biogas plant — for example, in a CHP unit — then excess heat can be utilized for drying. The techniques shown in Exhibit S11 may be used to dry whole digestate or just the solid fraction.
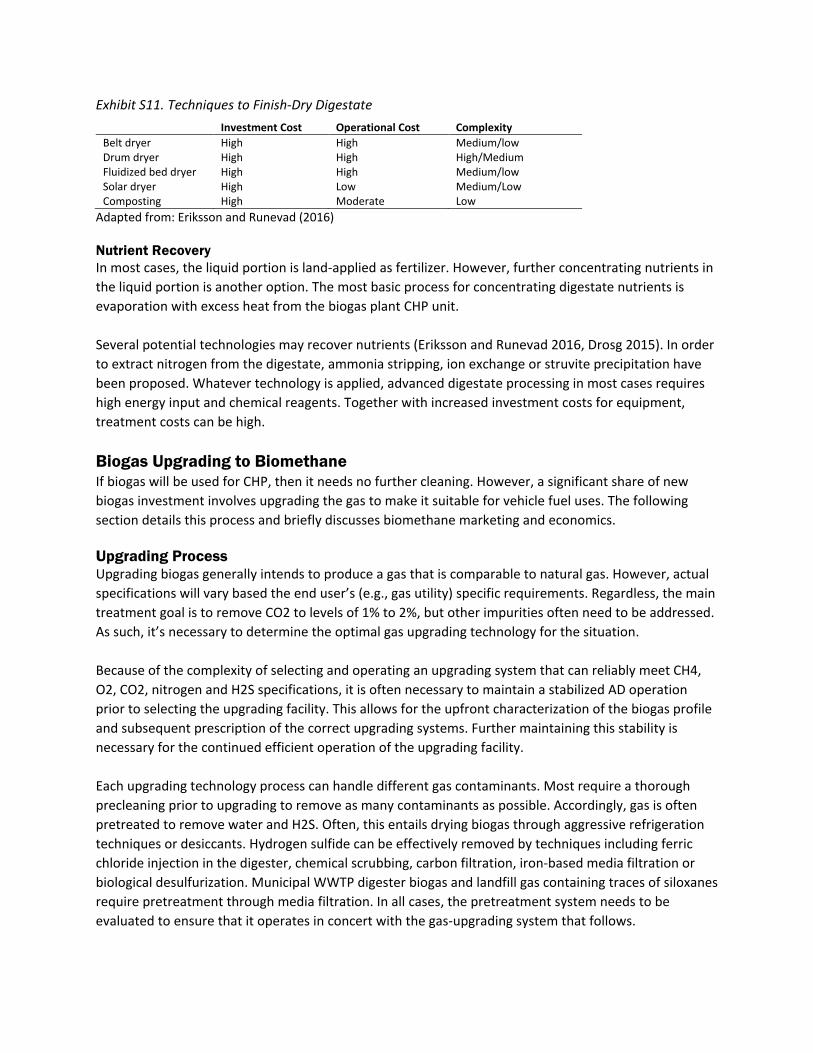
Exhibit S11. Techniques to Finish-Dry Digestate
Investment Cost Operational Cost Complexity Belt dryer High High Medium/low Drum dryer High High High/Medium Fluidized bed dryer High High Medium/low Solar dryer High Low Medium/Low Composting High Moderate Low
Adapted from: Eriksson and Runevad (2016) Nutrient Recovery In most cases, the liquid portion is land-applied as fertilizer. However, further concentrating nutrients in the liquid portion is another option. The most basic process for concentrating digestate nutrients is evaporation with excess heat from the biogas plant CHP unit. Several potential technologies may recover nutrients (Eriksson and Runevad 2016, Drosg 2015). In order to extract nitrogen from the digestate, ammonia stripping, ion exchange or struvite precipitation have been proposed. Whatever technology is applied, advanced digestate processing in most cases requires high energy input and chemical reagents. Together with increased investment costs for equipment, treatment costs can be high. Biogas Upgrading to Biomethane If biogas will be used for CHP, then it needs no further cleaning. However, a significant share of new biogas investment involves upgrading the gas to make it suitable for vehicle fuel uses. The following section details this process and briefly discusses biomethane marketing and economics. Upgrading Process Upgrading biogas generally intends to produce a gas that is comparable to natural gas. However, actual specifications will vary based the end user’s (e.g., gas utility) specific requirements. Regardless, the main treatment goal is to remove CO2 to levels of 1% to 2%, but other impurities often need to be addressed. As such, it’s necessary to determine the optimal gas upgrading technology for the situation. Because of the complexity of selecting and operating an upgrading system that can reliably meet CH4, O2, CO2, nitrogen and H2S specifications, it is often necessary to maintain a stabilized AD operation prior to selecting the upgrading facility. This allows for the upfront characterization of the biogas profile and subsequent prescription of the correct upgrading systems. Further maintaining this stability is necessary for the continued efficient operation of the upgrading facility. Each upgrading technology process can handle different gas contaminants. Most require a thorough precleaning prior to upgrading to remove as many contaminants as possible. Accordingly, gas is often pretreated to remove water and H2S. Often, this entails drying biogas through aggressive refrigeration techniques or desiccants. Hydrogen sulfide can be effectively removed by techniques including ferric chloride injection in the digester, chemical scrubbing, carbon filtration, iron-based media filtration or biological desulfurization. Municipal WWTP digester biogas and landfill gas containing traces of siloxanes require pretreatment through media filtration. In all cases, the pretreatment system needs to be evaluated to ensure that it operates in concert with the gas-upgrading system that follows.

Four main technologies create biomethane from biogas: membrane separation, pressure-swing adsorption (PSA), amine scrubbing and water scrubbing. In Europe where biogas upgrading is comparatively established, water scrubbing is most common followed by chemical scrubbing, membrane separation and PSA (Angelidaki, Treu et al. 2018). Of the recent biomethane-upgrading facilities for livestock operations in the U.S., PSA systems are most common (Mintz and Voss 2019). Exhibit S12 summarizes attributes of the main upgrading technologies. The PSA and membrane systems are somewhat similar as both are “dry” upgrading systems that involve physically separating CO2 and CH4 molecules based on molecule size, driving pressure and ionic charge. Water wash and amine systems are similar in that they are both “wet” upgrading systems and involve separating the CO2 from the CH4 by solubilizing the CO2 in a liquid solution while allowing the CH4 to pass. All benefit from some form of pre-treatment and further polishing steps to clean N2 and O2. There is a trade-off between higher operating costs and higher upfront capital costs. Water costs — or heat in the case of amine scrubbing — can be significant. The processes vary significantly in yield and purity. Exhibit S12. Summary of Biomethane Upgrading Technologies
PSA Membrane
separation Water
scrubbing Physical
scrubbing
Chemical (Amine)
absorption Consumption for raw biogas (kWh/Nm3) 0.23–0.30 0.18–0.20 0.25–0.3 0.2–0.3 0.05–0.15
Consumption for clean biogas (kWh/Nm3) 0.29–1.00 0.14–0.26 0.3–0.9 0.4 0.05–0.25
Heat consumption (kWh/Nm3) None None None < 0.2 0.5–0.75 Heat demand (°C) 55–80 100–180 Cost Medium High Medium Medium High CH4 losses (%) < 4 < 0.6 < 2 2–4 < 0.1 CH4 recovery (%) 96–98 96–98 96–98 96–98 96–99
Pre-purification Yes (H2O) Recommended (H2S, H2O)
Recommended (H2S)
Recommended (H2S) Yes
H2S co-removal Possible Possible Yes Possible Contaminant N2 and O2 co-removal Possible Partial No No No Operation pressure (bar) 3–10 5–8 4–10 4–8 Atmospheric Pressure at outlet (bar) 4–5 4.-6 7–10 1.3–7.5 4–5 Process Dry Dry Wet Wet Wet
Adapted from: Angelidaki, Treu et al. (2018) Compressing and Liquifying Biomethane In order for biomethane to be transported and used, it must be compressed. Compression and liquification allow for energy to concentrate into smaller volumes, which make transportation cheaper and increase energy content for the end user. Exhibit S13 compares biogas to nongaseous fuels. Upgraded biomethane has 45 MJ/Kg, and methane is 50 MJ/kg. This equates to biomethane having 90% of the energy per volume to methane. Gasoline also has 45 MJ/Kg — the same as biomethane. However, on a volume basis, it has 927.6 MJ per unit of volume compared with methane. In other words, a tank of methane would have to be 927.6 times larger than a tank of gasoline to carry the same amount of energy. Compressing the gas can reduce this discrepancy. Compressing biomethane to 200 psi would make it an equal volume to 78 gallons of diesel fuel. Further compression to 2,000 psi would make it equal to 8.4 gallons. Further compression yields higher concentration, and liquefaction brings the volume difference well less than 2 (Envirocare 2007).

Exhibit S13. Biogas Compared with Nongaseous Fuels
MJ/kg MBtu/nm3 Volumetric Equivalence Methane 50 0.034 1 Purified biogas (90%) 45 0.0306 0.9 Biogas (60%) 30 0.0203 0.6 Propane 46.4 0.08617 2.5 Ethanol 26.9 20.2872 596.1 Gasoline 45 31.5684 927.6 Diesel 42.1 32.706 961
Source: Noyola et al. (2006)
The national gas grid is composed of a system of pipes that connect production to ultimate demand. Generally, gathering lines bring the gas from the production area to facilities for refinement and transmission. From there, the gas goes into large transmission pipelines (typically 6 inches to 48 inches in diameter) that move gas long distances around the country, often at high pressures. Transmission lines feed distribution lines, which deliver lower pressure natural gas to homes and businesses. Natural gas moves through these pipelines as a result of a series of compressors creating pressure differentials. That is, the gas flows from an area of high pressure to an area of relatively lower pressure. The “city gate” is where a transmission system feeds into a lower pressure distribution system that directs natural gas to homes and businesses. At the city gate, the gas pressure is reduced, and it is normally the location where odorant — typically, mercaptan — is added to gas to detect leaks. Although transmission pipelines may operate at pressures more than 1,000 psi, distribution systems operate at much lower pressures. Some gas mains (2 inches to 24 inches in diameter) may operate up to 200 psi, but the small service lines that deliver gas to individual homes are typically well less than 10 psi. Once biogas is conditioned and upgraded, it can be injected into the pipelines. The location of the interconnection, however, is critical. Two principle concerns are nearby pipeline capacity to accept biomethane and its pressure. Injection into transmission lines would likely have no concerns with capacity but would require significant cost of compressing biomethane to pipeline pressures. Conversely, lower pressure utility pipeline networks may be closer, but they typically have less connected demand available. Of the annual costs of operating a pipeline interconnection, compression energy and maintenance costs can account for one-half to two-thirds of total operating costs, depending on final delivery pressure required. Siting projects to access lower pressure pipelines for injection can result in total operating cost savings of 5% to 15% (Black and Veatch 2015). Compressing methane for pipeline injection occurs at moderate pressures. CNG, on the other hand, is usually around 3,600 psi. It is primarily used as an alternative vehicle fuel, which contains about 24,000 Btu/gallon compared with approximately 120,000 for gasoline and 140,000 for diesel fuel. Consequently, despite the energy densification, CNG vehicles have larger fuel tanks and a more limited driving range than traditional vehicles (U.S. DOE AFDC). The cost to compress gas to high pressures can be significant. Compression to 2,000 psi requires nearly 14 kWh per 1,000 ft3 of biomethane. If the biogas is upgraded to 97% methane and the heat rate is 12,000 Btu/kWh, energy needed for compression is 17% of the gas’ energy content (Krich et al. 2005).

Liquefied biomethane (LBM) offers a number of advantages to CNG in that it can be used more directly in existing transportation fleets and its higher energy density could overcome the volume, range and weight limitations of CNG. To obtain this volume reduction, the gas has to be liquefied through refrigeration by cooling the gas to approximately -162 °C (-256°F). At that point, liquefied natural gas (LNG) is a noncorrosive liquid that is clear and colorless like water but weighs about half as much. The LNG liquid form occupies a volume 600 times smaller than the same (energy) amount of natural gas and is reasonably close to methanol (U.S. DOE, AFDC). LNG must be kept at cold temperatures. It is stored in double-walled, vacuum-insulated pressure vessels. After liquefaction, the LBM is stored in large cryogenic insulated tanks before it is transported by road tanker to the dispensing point. As with other biogas upgrading options, a number of constraints affect converting biogas to LBM. First, the biogas needs to be meticulously purified. Even slight impurities (i.e., H2O or CO2) can cause significant problems during the liquefaction process (e.g., deposits on heat exchange surfaces, pipe clogging). However, the main obstacle is LNG's high production cost, scale economies and need for storage in expensive cryogenic tanks. As such, the fuel's commercial use has been limited. Biomethane Distribution and Marketing Biomethane distribution is likely an important consideration. Where biomethane cannot access local markets or natural gas pipelines, over-the-road transportation of compressed biomethane is possible. However, given the costs associated with over-the-road transportation and the probable need for additional compression at the point of consumption, it is not likely to be a cost-effective solution for significant distances, especially without financial incentives. This suggests that biomethane needs to be produced at, or piped to, the region where it is to be consumed. The Midwest has potential markets where biomethane can be compressed and sold directly to end users as a vehicular fuel. As of 2020, nearly 1,000 public compressed natural gas (CNG) fueling stations are available in the U.S. Approximately 70 liquefied natural gas (LNG) fueling stations are available, mostly in areas that service the long-haul trucking industry (U.S. DOE AFDC). Missouri has 20 CNG filling stations, and eight of those are available to the public. In addition, it has one operating LNG station. These stations operate in populated areas, especially in Kansas City and St. Louis, and mostly support municipal fleets. Exhibit S14 maps these locations.

Exhibit S14. CNG Fueling Stations in Missouri
Source: U.S. DOE. Alternative Fuels Data Center Using natural gas for vehicle fuels has been ongoing for decades. Its use waned somewhat as ethanol became a popular vehicle fuel in the early 2000s. As natural gas prices began to fall in the 2010s, CNG demand resurged and grew to more than 50 billion ft3 in 2019. In recent years, demand for the fuel increasingly competes with the growing market for electric vehicles (EIA). Biomethane remains an attractive fuel, especially for larger fleets, and it has had new investment in recent years. For example, United Parcel Service (UPS) contracted with Kinetrex Energy to supply UPS with up to 52.5 million GGEs of RNG to use in its tractor-trailer vehicles throughout the Midwest (e.g., Chicago, Columbus, Indianapolis, St. Louis, Toledo). Kinetrex was set to obtain the biomethane from its Indy High BTU plant, a landfill on the south side of Indianapolis developed with EDL Energy and the South Side Landfill, when completed in March 2020 (Green Car Congress 2020). Pipeline Accessing a natural gas pipeline can be difficult. Because private or municipal gas utilities typically own natural gas pipelines, the biomethane producer must negotiate an agreement with the pipeline owner to supply biomethane into pipelines. This is likely an extended process to ensure the injection site does not cause problems for the gas company or its consumers. Not only can poor-quality gas have a negative impact on equipment, but numerous safety and capacity planning objectives also must be met. Due in part to these concerns, a system of monitoring and controlling the interconnections is likely necessary. The main components include at least the following: 1) methane separation unit, 2) three-way valve to divert gas either to the gas analyzer instrument or a flare, 3) gas analyzer instrument, 4) buffer tank, 5) compressor, 6) gas cooler, 7) gas pressure regulator and overpressure relief, 8) flowmeter, 9) calorimeter, 10) moisture meter, 11) odorization injection system, 12) gas sampling port,

13) main disconnect valve, 14) gas meter, 15) system controller and 16) communication link. The point of interconnection is the point where the gas provider’s pipeline system connects to the biomethane producer’s pipes and where any transfer of gas between the biomethane producer and the gas provider’s pipeline system takes place. The point of interconnection is usually at the gas meter. Another prerequisite for an agreement with the gas company would be to ensure that biomethane injected into the natural gas pipeline network meets the local gas utility’s pipeline gas quality (e.g., gas composition) standards. For biomethane to work with natural gas pipeline operations, the American Biogas Council advocates the use of the same specifications as conventional natural gas. Given these vary considerably within the continental U.S., the Council developed the gas purity specifications in Exhibit S15 for renewable natural gas projects injecting into gas distribution systems. Exhibit S15. American Biogas Council Recommended Biomethane Standards for Pipeline Injection
Physical Property Units Lower Limit Upper Limit Heating Value Btu/ft3 960 1100 Carbon Dioxide mol %
2
Oxygen mol %
0.4 Total Inerts mol %
5
Hydrogen Sulfide gr./100 ft3
1/4 Total Sulfur gr./100 ft3
1
Water lbs/mmSft3
7 Siloxanes ppm(v)
1
Hydrocarbon Dew Point Fahrenheit
-40 Temperature Fahrenheit 50 120 Dust, Particulate
commercially free*
Biologicals
commercially free* Heavy Metals commercially free*
Source: American Biogas Council Natural Gas Infrastructure in Missouri Missouri has about a dozen interstate natural gas pipelines. Natural gas enters the state from the west and south, mostly by way of Kansas, Nebraska and Arkansas. Much of that natural gas is sent to Illinois and Iowa for delivery to Midwest markets and beyond. The eastern and western sections of the Rockies Express Pipeline (REX), one of the nation's largest and longest natural gas pipelines, connect in northern Missouri. The REX pipeline's western section originates in Colorado and brings Rocky Mountain natural gas east. The pipeline's eastern section is bidirectional and can bring natural gas produced from shale areas in Ohio and Pennsylvania to Missouri. The main Missouri markets include the Kansas City metropolitan area served by the Southern Star Central Gas Pipeline Company (formerly Williams Gas Pipeline Central), KM Interstate Gas Transmission Company and Panhandle Eastern Pipeline Company. The St. Louis area is served by the Centerpoint Mississippi River Transmission Company and Southern Star Central Pipeline Company systems. Gas Pipeline Company of America, Ozark Gas Transmission, Texas Eastern Transmission, ANR Pipeline Company, Tallgrass Interstate Gas Transmission and MoGas Pipeline serve other parts of the state. Exhibit S16 shows the natural gas pipelines throughout the state.
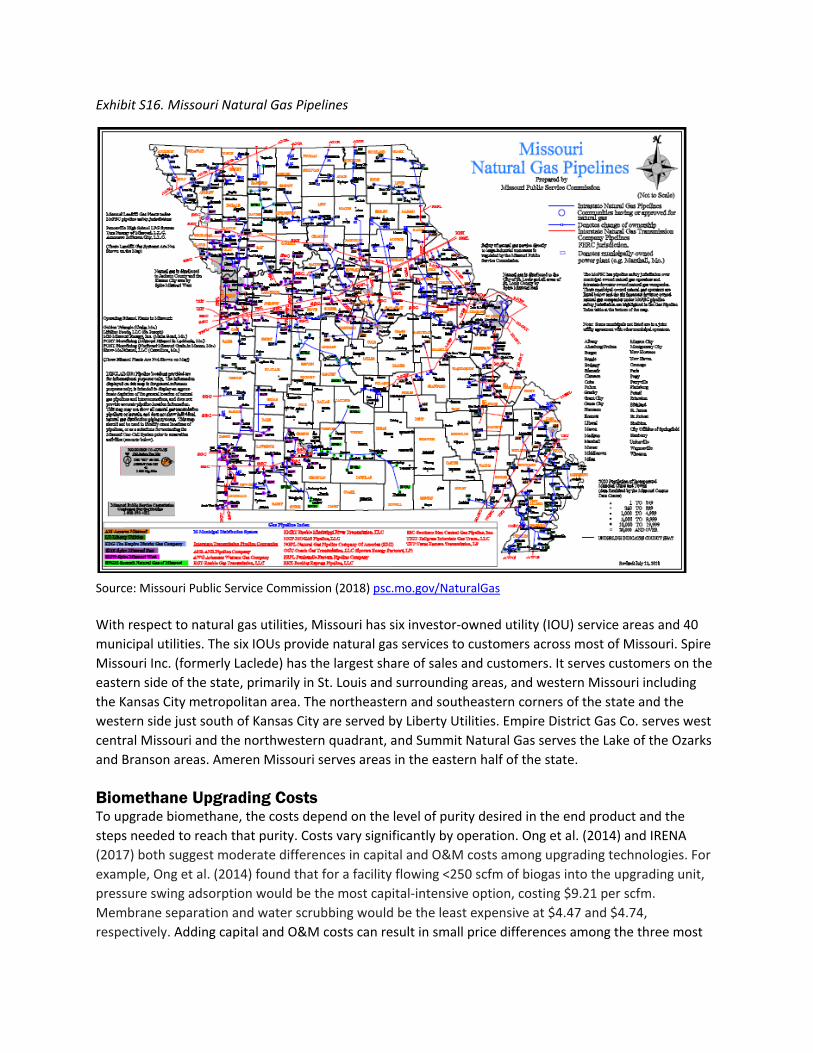
Exhibit S16. Missouri Natural Gas Pipelines
Source: Missouri Public Service Commission (2018) psc.mo.gov/NaturalGas
With respect to natural gas utilities, Missouri has six investor-owned utility (IOU) service areas and 40 municipal utilities. The six IOUs provide natural gas services to customers across most of Missouri. Spire Missouri Inc. (formerly Laclede) has the largest share of sales and customers. It serves customers on the eastern side of the state, primarily in St. Louis and surrounding areas, and western Missouri including the Kansas City metropolitan area. The northeastern and southeastern corners of the state and the western side just south of Kansas City are served by Liberty Utilities. Empire District Gas Co. serves west central Missouri and the northwestern quadrant, and Summit Natural Gas serves the Lake of the Ozarks and Branson areas. Ameren Missouri serves areas in the eastern half of the state. Biomethane Upgrading Costs To upgrade biomethane, the costs depend on the level of purity desired in the end product and the steps needed to reach that purity. Costs vary significantly by operation. Ong et al. (2014) and IRENA (2017) both suggest moderate differences in capital and O&M costs among upgrading technologies. For example, Ong et al. (2014) found that for a facility flowing <250 scfm of biogas into the upgrading unit, pressure swing adsorption would be the most capital-intensive option, costing $9.21 per scfm. Membrane separation and water scrubbing would be the least expensive at $4.47 and $4.74, respectively. Adding capital and O&M costs can result in small price differences among the three most

common upgrading technologies at low biomethane product output. At higher output rates, economies of scale further equalize differences in capital and O&M costs. See Exhibit S17. Unfortunately, the exhibit does not effectively communicate the cost at scale of relevance to most agricultural ADs. A 1,600-dairy-cow AD is likely to flow roughly 60 scfm at which capital costs per MMBtu are likely to be much higher than the exhibit shows. Exhibit S17. Capital and O&M Costs of Biomethane Upgrading
Sources: Ong, Williams and Kaffka (2014); IRENA (2017) Two primary pathways describe upgraded biomethane transportation and use: compressed into CNG or injected into a pipeline. Each pathway has unique costs and obstacles. Compression into CNG The first pathway involves cleaning, separating and compressing biogas into CNG. Here, the biogas is upgraded, compressed and stored for a short time until it can be transferred to trucks and transported to vehicular fuel users. Kosusko et al. (2016) evaluated some CNG systems in the context of producing biomethane from biogas in California. They found that methane recovery from biogas was 70% at the low to moderate production level, which increased to 85% at larger scales. This led to moderate capital costs for upgrading and compression — $1.27 million for a biogas facility flowing 50 scfm (approximate size of a 1,400-dairy-cow AD operation). See Exhibit S18. O&M costs are relatively high as upgrading and compression require considerable resources. Estimated biomethane upgrading and compression costs ranged from $18.30/MMBtu at the 50 scfm scale to about $4/MMBtu at a very large scale.
$0.00
$2.00
$4.00
$6.00
$8.00
$10.00
$12.00
$14.00
155 310 620 930 1240
$/M
MBt
u
Biogas Input (scfm)
PSA Water Scrubber Amine Scrubber Membrane

Exhibit S18. RNG Upgrading and Compression Costs
Input Flow
(SCFM, 60% CH4
Product RNG MMBtu/h
Total Capital
($)
Total Capital
($/MMBtu output/y
Annualized Capital ($/y)
O&M (CNG + Flare)
($/y) $/MMBtu (output)
50 1.3 1,270,000 116 111,000 91,000 $18.30 100 2.5 1,620,000 77 141,000 142,000 $12.79 200 5 2,190,000 52 191,000 221,000 $9.34
1600 49 7,050,000 17 615,000 1,110,000 $4.02 Source: Kosusko et al. (2016) Pipeline Injection Kosusko et al. (2016) also evaluated the costs of a membrane separation system used in California for pipeline injection. See Exhibit S19. They estimated that larger systems would retain 90% of the gas. For a biogas facility that flows roughly 73 scfm of biogas (approximate size of a 1,900 WCE AD operation), the upgrading capital would be roughly $2.2 million. This cost is higher than the RNG facility given the gas is upgraded to a higher level to meet California pipeline standards, the higher flow rate and methane capture rate. Other capital costs are associated with injection and compression. Those totaled $561,000 — a number adjusted to reflect the national average. In total, capital costs exceeded $2.7 million. O&M costs were $227,000 per year, the annual costs totaled $465,000 for a 73 scfm biogas facility. Exhibit S19. RNG Upgrading and Pipeline Injection Costs
Input Flow (SCFM,
60% CH4)
Product Methane
(MMBtu/h)
Upgrading Installed Capital
Injection, piping,
compression* Total
Capital
Annual Capital
Expense ($/y)
O&M - Upgrading
($/y)
O&M - Injection
($/y) Annual ($/Y)
Total Production
Cost ($/MMBtu)
72.7 2.6 2,180,000 561,440 2,741,440 238,779 218,200 8,220 465,199 20 265.6 9.2 4,860,000 730,800 5,590,800 486,959 619,100 9,740 1,115,799 14 621.5 21.5 8,460,000 1,571,800 10,031,800 873,770 1,185,000 21,660 2,080,430 11 2071 72.3 13,500,000 2,030,000 15,530,000 1,352,663 3,222,000 22,740 4,597,403 7
*Costs adapted to reflect national conditions Adapted from: Kosusko et al. (2016) When comparing the two systems considered by Kosusko et al. (2016), the RCNG facility is significantly less costly than the pipeline injection system. For the biogas facility generating 60 scfm of biogas per MMBtu, the cost would be $17/MMBtu for CNG and $22/MMBtu for pipeline injected gas. This $7.5/MMBtu cost difference would need to be offset by lower transportation costs to the end user or a higher price commanded by the pipeline gas. Note, these costs do not include biogas production costs. These cost findings were compared to the literature more broadly. Averaging across the reviewed studies would suggest that upgrading at a small scale would cost roughly $12 to $16.50 per MMBtu. Upgrading needs to be matched with compression or pipeline injection distribution. The reviewed studies — summarized in Exhibit S20 — suggest that these costs could approach $25 per MMBtu at the smaller scale for pipeline injection and just less than $20 for compression to CNG.
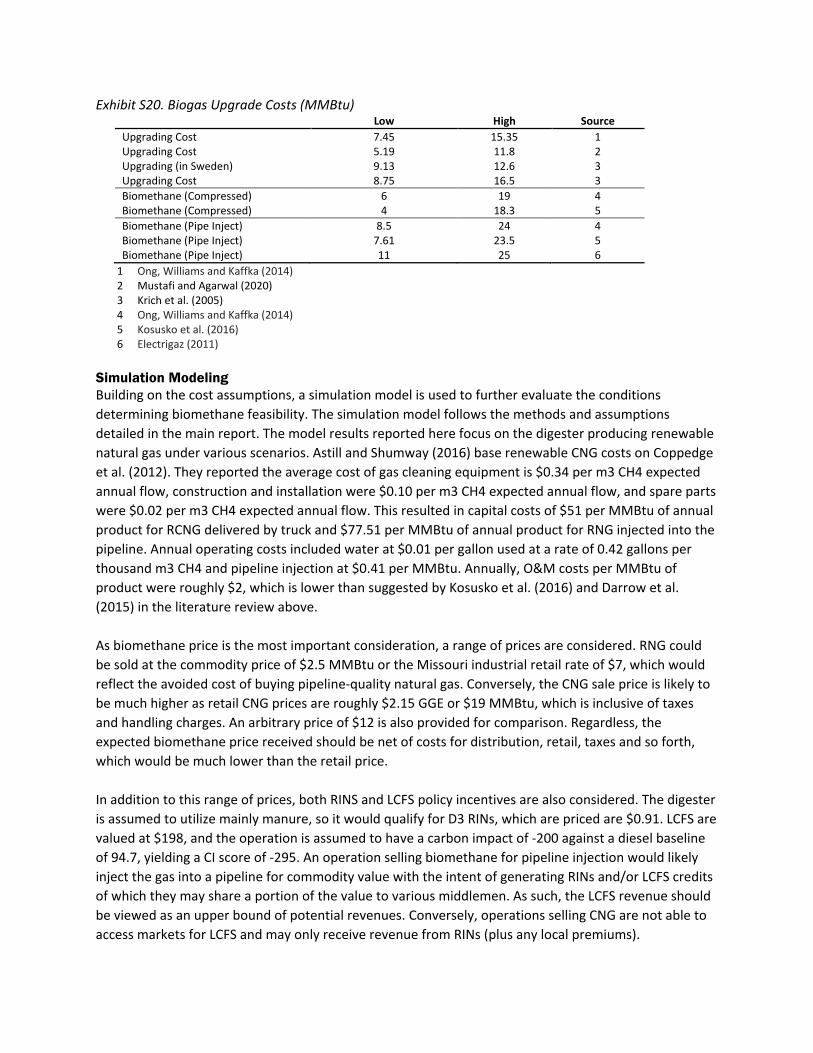
Exhibit S20. Biogas Upgrade Costs (MMBtu) Low High Source Upgrading Cost 7.45 15.35 1 Upgrading Cost 5.19 11.8 2 Upgrading (in Sweden) 9.13 12.6 3 Upgrading Cost 8.75 16.5 3 Biomethane (Compressed) 6 19 4 Biomethane (Compressed) 4 18.3 5 Biomethane (Pipe Inject) 8.5 24 4 Biomethane (Pipe Inject) 7.61 23.5 5 Biomethane (Pipe Inject) 11 25 6
1 Ong, Williams and Kaffka (2014) 2 Mustafi and Agarwal (2020) 3 Krich et al. (2005) 4 Ong, Williams and Kaffka (2014) 5 Kosusko et al. (2016) 6 Electrigaz (2011)
Simulation Modeling Building on the cost assumptions, a simulation model is used to further evaluate the conditions determining biomethane feasibility. The simulation model follows the methods and assumptions detailed in the main report. The model results reported here focus on the digester producing renewable natural gas under various scenarios. Astill and Shumway (2016) base renewable CNG costs on Coppedge et al. (2012). They reported the average cost of gas cleaning equipment is $0.34 per m3 CH4 expected annual flow, construction and installation were $0.10 per m3 CH4 expected annual flow, and spare parts were $0.02 per m3 CH4 expected annual flow. This resulted in capital costs of $51 per MMBtu of annual product for RCNG delivered by truck and $77.51 per MMBtu of annual product for RNG injected into the pipeline. Annual operating costs included water at $0.01 per gallon used at a rate of 0.42 gallons per thousand m3 CH4 and pipeline injection at $0.41 per MMBtu. Annually, O&M costs per MMBtu of product were roughly $2, which is lower than suggested by Kosusko et al. (2016) and Darrow et al. (2015) in the literature review above. As biomethane price is the most important consideration, a range of prices are considered. RNG could be sold at the commodity price of $2.5 MMBtu or the Missouri industrial retail rate of $7, which would reflect the avoided cost of buying pipeline-quality natural gas. Conversely, the CNG sale price is likely to be much higher as retail CNG prices are roughly $2.15 GGE or $19 MMBtu, which is inclusive of taxes and handling charges. An arbitrary price of $12 is also provided for comparison. Regardless, the expected biomethane price received should be net of costs for distribution, retail, taxes and so forth, which would be much lower than the retail price. In addition to this range of prices, both RINS and LCFS policy incentives are also considered. The digester is assumed to utilize mainly manure, so it would qualify for D3 RINs, which are priced are $0.91. LCFS are valued at $198, and the operation is assumed to have a carbon impact of -200 against a diesel baseline of 94.7, yielding a CI score of -295. An operation selling biomethane for pipeline injection would likely inject the gas into a pipeline for commodity value with the intent of generating RINs and/or LCFS credits of which they may share a portion of the value to various middlemen. As such, the LCFS revenue should be viewed as an upper bound of potential revenues. Conversely, operations selling CNG are not able to access markets for LCFS and may only receive revenue from RINs (plus any local premiums).

Exhibit S21 shows that with no other revenue, producing CNG is not feasible below $13 MMBtu, and pipeline-injected biomethane would require a higher price — roughly $16 — to break even. When grants cover 40% of the capital costs and operations sell digestate solids as bedding, facilities become feasible at around $7 MMBtu. When the value of RINs is added to CNG, the operation is feasible even at low natural gas prices. LCFS credits’ large potential value makes the operation feasible at any price, though it is important to emphasize that a significant share of the value would need to be shared with other supply chain participants and feasibility assessment would require further consideration. Exhibit S21. Biomethane Upgrading Scenarios (NPV) at various prices (MMBtu)
$2.5MMBtu $7MMBtu $12MMBtu $19MMBtu Base CNG (4,803,450) (2,797,396) (568,447) 2,552,081 Base Pipeline Inject (6,051,918) (4,045,864) (1,816,915) 1,303,613 Base CNG + Grants @40% + Bedding (1,525,541) 480,513 2,709,461 5,829,989 Base PI + Grants @40% + Bedding (2,221,701) (215,647) 2,013,301 5,133,830 Base CNG + Grants @40% + Bedding + RINS 2,875,034 4,881,088 7,110,037 10,230,565 Base PI + Grants @40% + Bedding + LCFS 20,376,360 22,382,414
The simulation model results suggest that biomethane production can be feasible. Because production is more complicated and the costs are higher, it is necessary to generate more revenue. Grants and digestate sales are important, but negotiated gas prices that account for the environmental value of the gas or environmental credits are paramount. Industry Use of Biogas Upgrading Argonne National Laboratory developed and maintains a comprehensive database called the “Renewable Natural Gas Database” (Mintz and Voss 2019). It lists projects that upgrade gas for pipeline injection or vehicle fuel uses, and it offers insight into the landscape of biogas upgrading. See Exhibit S22. In 2017, 61 facilities operated, and the number grew to 89 in first-quarter 2019. Growth can be expected to continue as 31 facilities were under construction and 82 were in the planning stage at the end of Q1 2019. The majority of existing operations are associated with landfills and wastewater treatment. However, given the projects in the construction and planning phase, most upcoming growth is expected to come from farms. Exhibit S22. Projects Upgrading Biogas by Type and Status (as of end Q1 2019)
Operational Under
Construction Planned Shut Down
and Cancelled
Total Confirmed
Projects Landfills 58 8 14 9 89 Farms 11 21 63 12 107 Food Waste 7 2 5 10 24 Wastewater Treatment 13 0 0 7 20 Other 0 0 0 0 0 Q1 2019 Total 89 31 82 38 240 2017 Total 61 25 26 32 144
Source: Mintz and Voss (2019)

Of the operational biogas-upgrading facilities, the average size in 2017 was 496,000 MMBtu per year. Average size grew to 519,000 MMBtu per year in first-quarter 2019. See Exhibit S23. Landfills tended to be the largest operations and overshadowed farm-based operations, which averaged 177,000 MMBtu per year. That is equivalent to an operation utilizing manure from roughly 8,600 dairy cows. These facilities’ large size suggests significant scale economies are necessary to participate and compete. As noted in previous sections, this growth is largely motivated by environmental incentives associated with renewable and low-carbon vehicle fuels. These incentives have led to investment by companies with the financial resources and expertise to participate in this market. Exhibit S23. Operational Projects Upgrading Biogas by Capability (as of end Q1 2019)
Projects MMBtu/yr GGE/yr Average
MMBtu/yr Average GGE/yr
Landfills 58 40,319,184 359,370,231 695,158 6,196,038 Farms 11 1,944,770 17,333,996 176,797 1,575,818 Food Waste 7 1,944,770 17,333,996 277,824 2,476,285 Wastewater Treatment 13 1,947,925 17,362,110 149,840 1,335,547 Q1 2019 Total 89 46,156,649 411,400,332 518,614 4,622,476 2017 Total 61 29,733,964 265,022,761 495,566 4,417,046
Source: Mintz and Voss (2019) Conclusion The above simulation, literature review and industry trends all suggest that biogas upgrading can lead to profitable outcomes. However, the biomethane marketplace is still new and developing. A number of large businesses are investing in Missouri and other parts of the U.S. and pursuing a number of market opportunities focused on selling gas at premium prices — or benefitting from environmental incentives — for vehicle fuel use. Examples of potential markets include corporations and governments that have signaled commitments to using more natural gas and biomethane (i.e., CNG, LNG) in their fleets. Servicing these markets generally necessitates significant size. AD and upgrading have significant scale economies. Upgrading technologies can equal or exceed the digestion cost and are more sensitive to scale. Biomethane producers can also expect added costs for management and coordination as entering the vehicle fuel market adds complexity (e.g., regulation, market coordination). To effectively navigate these factors, relatively large corporate entities often partner with renewable energy companies. As the biomethane market matures, increased competition will likely increase the biomethane supply and moderate premiums. The point where that happens depends on biogas demand and more specifically social interest in environmental benefits. If, for example, the EPA decided to more aggressively pursue filling the cellulosic biofuel volumes set forth in the original EISA targets, then firms could have a large market opportunity. Biomethane appears to be well-positioned to take advantage of this market as there are few competing fuels. Similarly, more states may adopt a low-carbon fuel standard like that in California. However, renewable biomethane’s future is uncertain and speculative. In order for biogas businesses to enter the market, they need feedstocks. Aside from landfill gas, manure often is recognized as the second most attractive feedstock. Already, large corporate farms produce biogas from their (contracted or owned) CAFOs. Others have entered arrangements with farmers in a specific area to access their manure or partner with them to produce biogas to supply a

corporate upgrading facility. In this way, farmers may become involved in biogas production without navigating the entire bio-fuel supply chain. Regardless of who owns the assets, increasing biomethane production offers the potential of increased value from agricultural production in the local economy.


