Report Number: 02/2012 APPLIED RENEWABLE ENERGY TECHNOLOGY, PROJECT COURSE Mid-term REPORT ON: BIOGAS SUPPLY CHAIN DYNAMICS October 15, 2012 Department of Energy Technology Royal Institute of Technology Stockholm, Sweden
Transcript
Report Number: 02/2012
APPLIED RENEWABLE ENERGY TECHNOLOGY, PROJECT COURSE
Mid-term REPORT ON:
BIOGAS SUPPLY CHAIN DYNAMICS
October 15, 2012
Department of Energy Technology Royal Institute of Technology
Stockholm, Sweden
Dept. of Energy Technology Div. of Energy and Climate Studies Prof: Prof. Seksan Udomsri
Title: BIOGAS SUPPLY CHAIN DYNAMICS Author: Bisrat Girma 850509-T192 Demeke Desta 860617-T612 Solomon Teklemichael 810609-T377 Thewodros Nigusse 850610-R032
Report nr: Mid-Term Report
Project: Applied Renewable Energy Technology Pages:22 Drawings: Supervisor at KTH: Dr. Alessandro Sanches Pereira Date: October 15, 2012 Appendices: Overall responsible at KTH: Prof. Seksan Udomsri
Approved at KTH by: Prof. Seksan Udomsri Signature: Overall responsible at industry:
Industrial partners:
Approved by industrial partners: Signature: Abstract
Keywords: Distribution List
Name/Company Copies Name/Company Copies
I
TABLE OF CONTENTS
TABLE OF CONTENTS .................................................................................................................................. 1 INDEX OF TABLES ............................................................................................................................................. II INDEX OF FIGURES .......................................................................................................................................... III NOMENCLATURE ............................................................................................................................................. IV
CHAPTER ONE ....................................................................................................................... 1
1.1 BACKGROUND ....................................................................................................................................... 1 1.2 STATEMENT OF THE PROBLEM .............................................................................................................. 4 1.3 SCOPE OF THE PROJECT ................................................................................................................ 4 1.4 OBJECTIVE ............................................................................................................................................ 5 1.5 METHODOLOGY .................................................................................................................................... 5
CHAPTER TWO ...................................................................................................................... 6
2. BIOGAS SUPPLY CHAIN STRUCTURAL MODEL AND ITS BOUNDARY ............. 6
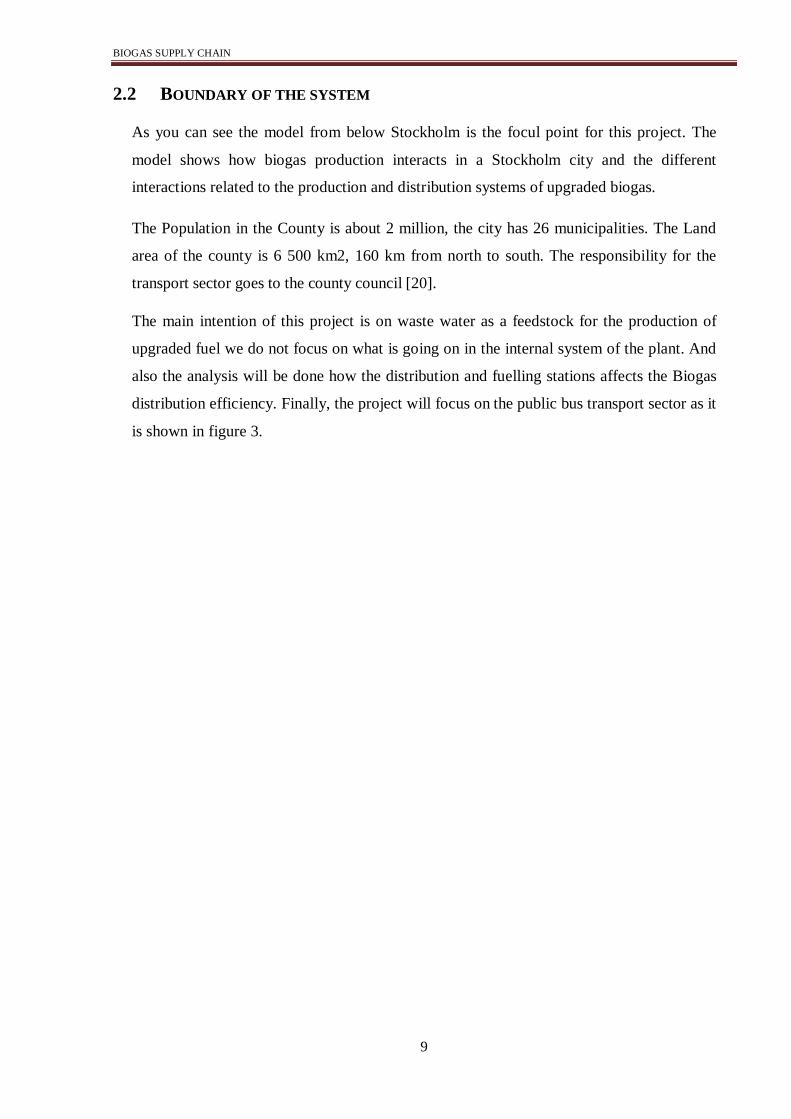
2.1 BIOGAS SUPPLY CHAIN STRUCTURAL MODEL ....................................................................................... 6 2.2 BOUNDARY OF THE SYSTEM .................................................................................................................. 9
CHAPTER THREE ................................................................................................................ 13
3. STOCKHOLM CITY EXISTING CONDITIONS ........................................................ 13
3.1. DATA’S FOR TWO WASTE WATER TREATMENT PLANTS IN STOCKHOLM CITY ........... 13 3.1.1. HENRIKSDAL BIOGAS PLANT ............................................................................................... 13 3.1.2. KÄPPALA BIOGAS PLANT ...................................................................................................... 13
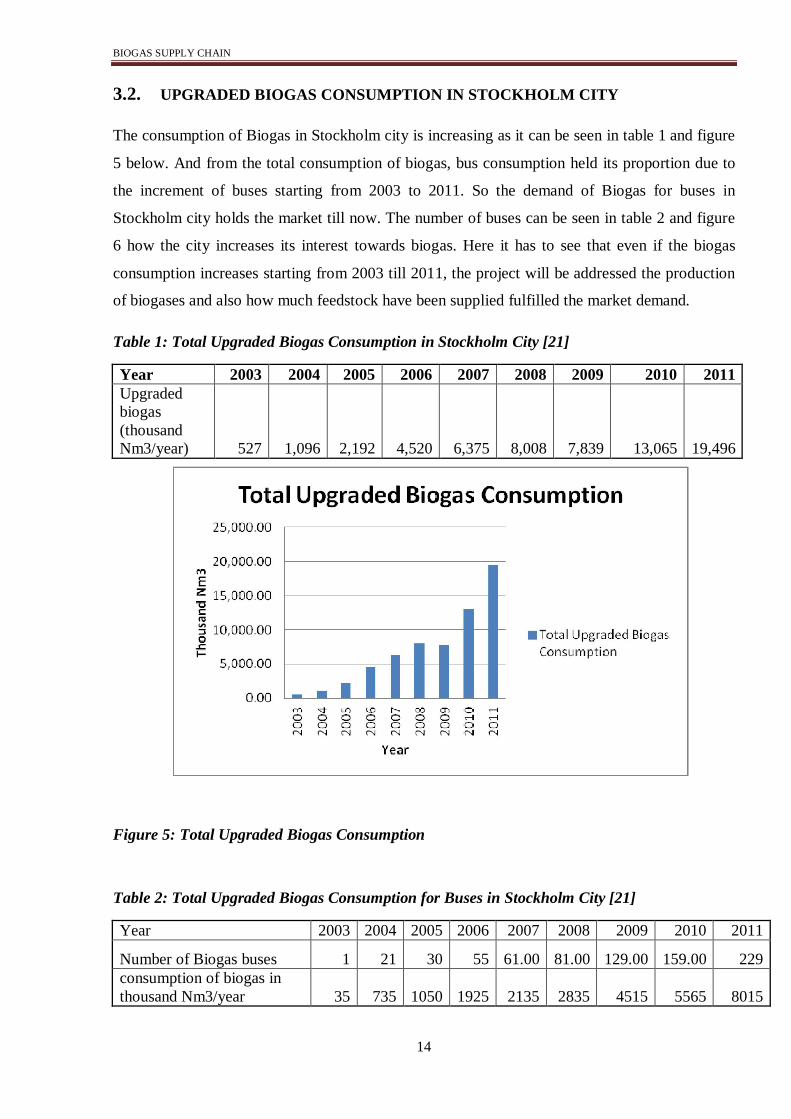
3.2. UPGRADED BIOGAS CONSUMPTION IN STOCKHOLM CITY ................................................ 14
Table 1: Total Upgraded Biogas Consumption in Stockholm City [21] .................................................. 14 Table 2: Total Upgraded Biogas Consumption for Buses in Stockholm City [21] ................................... 14
III
INDEX OF FIGURES
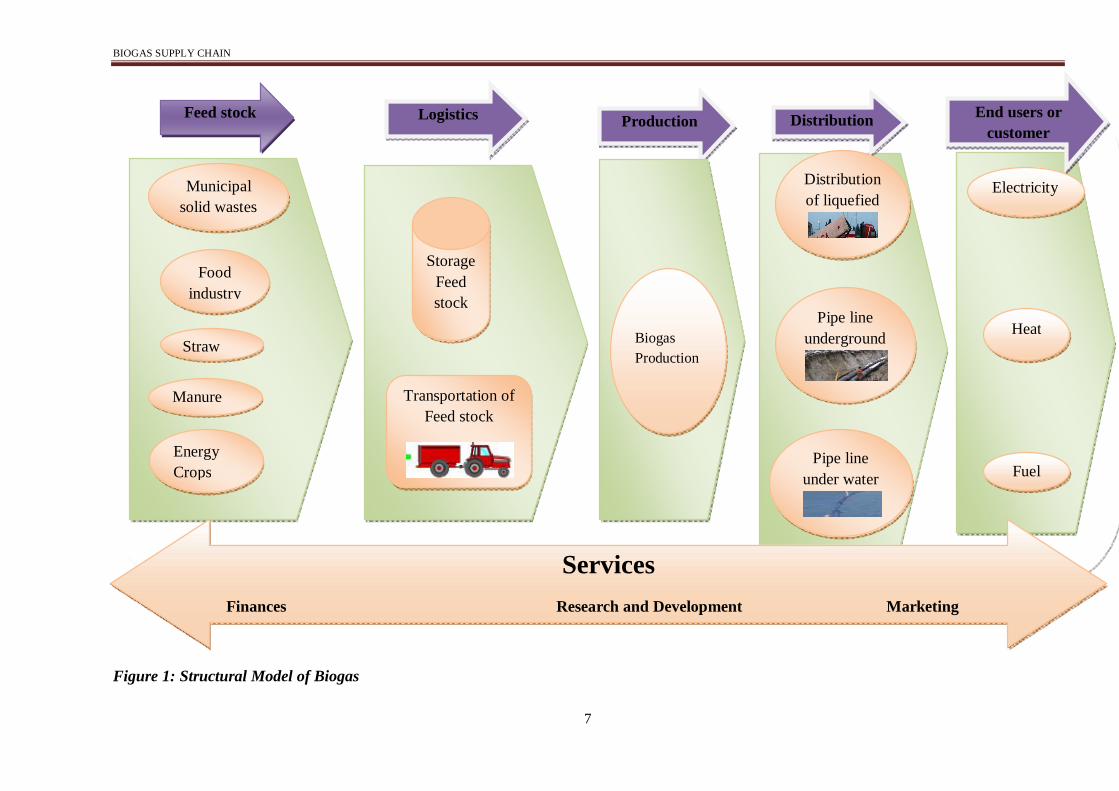
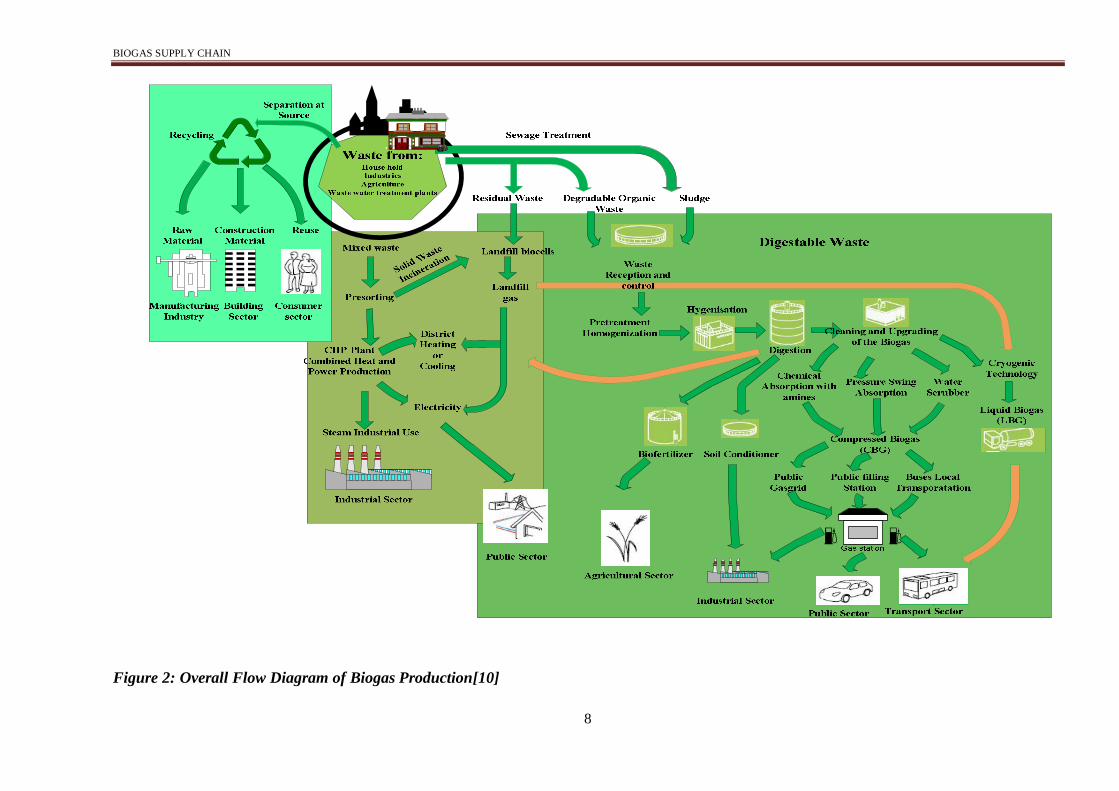
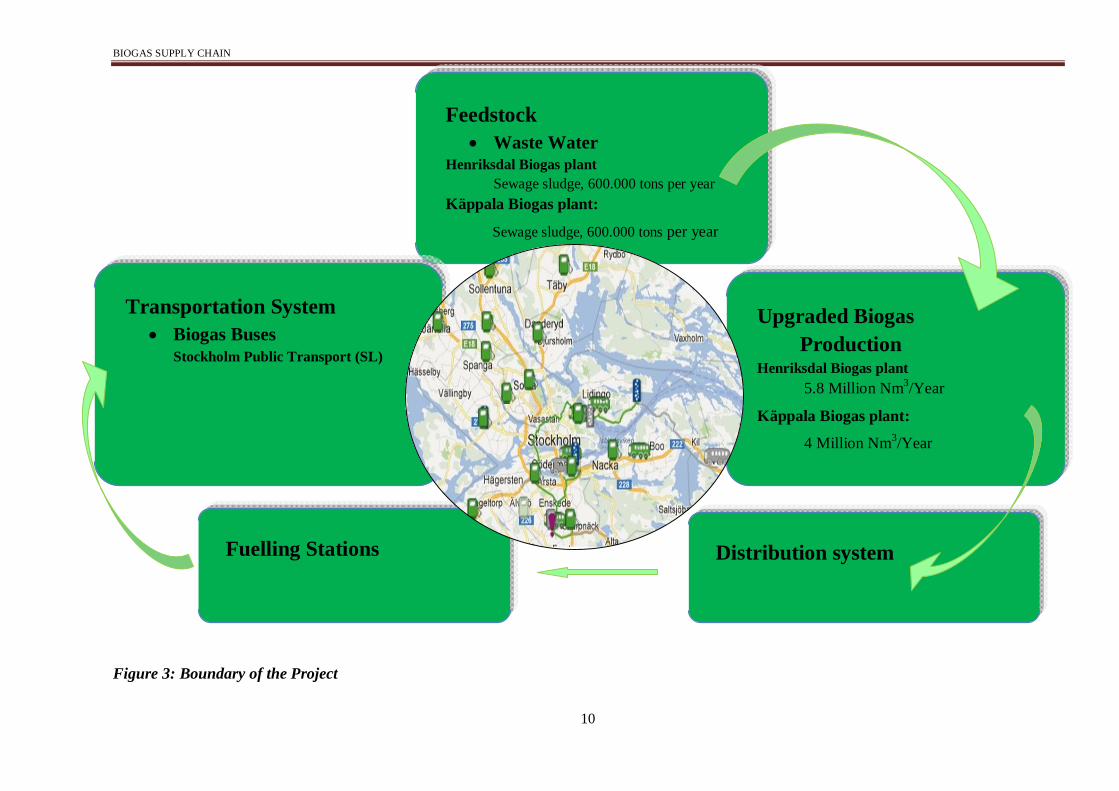
Figure 1: Structural Model of Biogas ...................................................................................................... 7 Figure 2: Overall Flow Diagram of Biogas Production ........................................................................... 8 Figure 3: Boundary of the Project ......................................................................................................... 10 Figure 4: Location of Henriksdal WWTP Biogas Production Plant and Söderhallen Bus Depot ............ 11 Figure 5: Total Upgraded Biogas Consumption .................................................................................... 14 Figure 6: Biogas Consumption by Buses ............................................................................................... 15
IV
NOMENCLATURE
WWTP Waste Water Treatment Plant
1
CHAPTER ONE 1. INTRODUCTION
1.1 BACKGROUND
In the long term, Energy supply must be secured in a sustainable way. At the same time, the
consumption of fossil fuels have to decrease, the reason behind is due to a limited and uncertain
future supply of fossil fuel and undesirable effects on our environment. So there is no question to
develop renewable energy sources in order to meet environmental and climate related targets,
reduce emissions of greenhouse gases, reduce the dependence of oil and secure the supplies of
future energy. It is known that the EU renewable energy directive mentioned that 20 % of the
final energy consumption has to be provided by renewable sources by 2020. According to a
study of the European Environmental Agency the potential from agricultural is still largely
unexploited and this sector is expected to have the highest growth rates in the coming years.
Biomass currently used as a renewable energy in Europe and Bioenergy will play a key role in
achieving the ambitious targets approved by the renewable energy directive [12].
One of the EU countries, Sweden, Bioenergy has been used to reach the targeted energy
directives. Traditionally, heating has been the primary application for bioenergy, but the markets
for electricity generation from biomass and biofuels for transport have developed strongly. The
use of biofuels for transport is widespread in Sweden, where biofuels such as biodiesel, ethanol
and biogas are relatively available and many cars have flexible-fuel technology.
Here in this project, it will be considered how the biogas supply chain plays its part. Basically,
Sweden uses four types of plants. These are Waste Water Treatment Plant (WMMP), co-
digestion plants, farm-based plants, and industrial plants. Not all produced biogas is used as
vehicle fuel, although it is the single largest area of utilization today (44% WWTP, 25% Co-
digestion plants, 1% farm-based plants, 8% industrial plants and 22% landfills) [6].In the past
decade, Sweden has experienced a great market expansion due to both production and sales of
biogas as vehicle fuel. Between year 2010 and 2011, the sales of biogas increased by 27% and
approximately 121 million Nm3 gas were sold in year 2011 as a vehicle fuel, constituting to 62%
of biogas (remaining 38% were natural gas) [6].
At present, Biogas is upgraded to natural gas quality. And it is sold both as pure biogas and in
admixtures with natural gas. In southern Sweden, the existing natural gas network offers an
option for the users to purchase pure biogas. This option requires careful metering and reporting
of delivered and consumed quantities of biogas to the system. Recently, distribution of upgraded
biogas has increasingly been provided by parties other than the producers. Gas can be distributed
BIOGAS SUPPLY CHAIN
2
either by road tanker or by pipe [6]. In many case, biogas pumps at petrol stations are owned by
the producer or distributor of the gas. Today, Sweden has 107 public outlets for motor fuel gas
[3]. However, there are substantial differences between the density of the network in different
parts of the country, with most of the gas refueling stations being in the south of the country and
in the major urban areas [2].
Stockholm is the capital city of Sweden with 850,000 inhabitants; if the whole of Stockholm
County is included, the number of inhabitants is more than 2 million. The Stockholm site
comprises the cities of Stockholm, Linköping and Västerås and the following partners: the City
of Stockholm, Stockholm Vatten AB (SVAB), AGA Gas AB, Svensk äxtkraft (Västerås) and
Svensk Biogas (Linköping). Biogas as vehicle fuel is produced and used in the transport sector in
all of these cities today.
Stockholm Water Company AB is a municipally owned company which is owned by Stockholm
Stadshus AB (98%) and by Huddinge municipality (2 %). Stockholm Water Company produces
and supplies drinking water for just over 1 million people in Stockholm and Huddinge and a
further nine neighbouring municipalities. Wastewater from Stockholm, Huddinge and six
neighbouring municipalities is treated by the two plants operated by Stockholm Water Company
(Henriksdal and Bromma), in which a total of approximately 135 million cubic meters of
wastewater are treated each year [13].
In the City of Stockholm, the main substrate for biogas production is sewage sludge, in Västerås
mainly municipal organic household waste and crops are used, and in Linköping the main
substrates are slaughterhouse waste and other industrial organic wastes.
In the City of Stockholm, biogas or CBG (Compressed Biogas) has been used as fuel since 1996.
The municipality of Stockholm was the pioneer introducing biogas driven cars in Sweden. This
was later followed by the introduction of city biogas buses, trucks, vans, taxis and company cars,
thus further increasing the demand for biogas. However, in year 2006 the sale of biogas for
vehicle fuel in Sweden increased by 47 percent and constituted the eleventh year in a row of
increased sale, which meant the demand, exceeded the supply [14].
There are several reasons that explain the increased interest of biogas cars in the City of
Stockholm. The municipality has introduced free parking in the city for clean vehicles and
BIOGAS SUPPLY CHAIN
3
biogas fuel is cheaper than petrol. Also the City of Stockholm has actively communicated the
advantages of clean vehicles to the citizens [20].
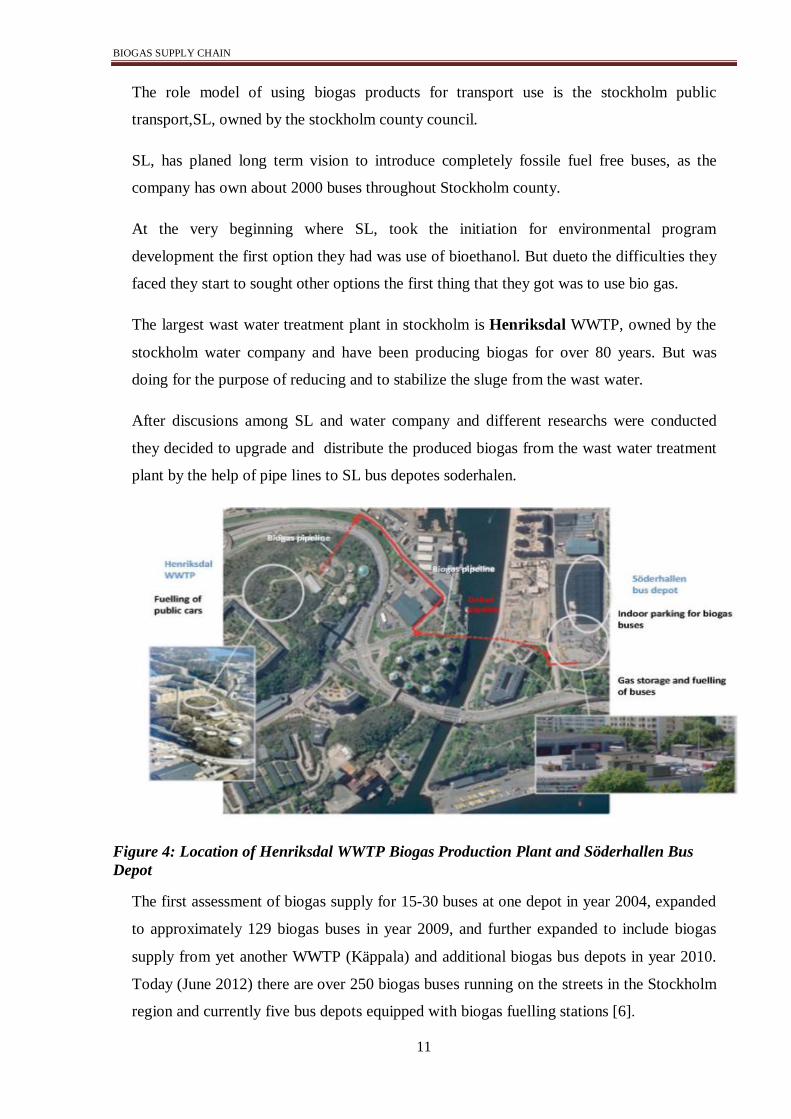
In order to meet the supply demands in Stockholm CBG is transported from Linköping and
Västerås where the production of CBG is higher than the local consumption. So far CBG is only
produced in the wastewater treatment plants Henriksdal and Bromma, both owned by Stockholm
Vatten AB. The produced gas is upgraded at each WWTP and distributed either through gas pipe
to bus depot or by trucks with swap body units to gas filling stations [6][7].
In year 2004, it was tried to implement 15 to 30 Biogas buses at one depot and during 2009 it has
expanded to supply approximately 100 biogas buses and further expanded to include biogas
supply from another Waste Water Treatment Plant (Käppala) and additional biogas bus depots in
the year 2010 [6][7].
In the City of Stockholm, in the year 2010 13 million Nm3 (126 GWh) biogas and 4.5 Million
Nm3 (48 GWh) natural gas was consumed as a vehicle fuel; where the main consumer is
Stockholm Public Transport (SL)[1]. From the above mentioned production plants, Henriksdal
WWTP is the largest one. Annually with a capacity of up to 100 GWh has also planned to
construct a large-scale biogas plant for anaerobic digestion of energy crops and industrial food
by-products South of Stockholm City. Even if a large annual production, the supply for biogas is
less than the demand. Therefore, it must be imported some of its biogas from other regions and
use natural gas as a back-up. Due to the increasing biogas demand, it will be necessary to
investigate other biogas production sources and the biogas potential, both in Stockholm and a
greater area including the neighboring regions. In 2009, Researchers made a forecast till year
2020 on the production, distribution and demand of biogas as vehicle fuel for Stockholm City
and neighboring Cities of Uppsala, Västmanland, Södermanland, Örebro and Östergötland. And
it was based on current Waste Water Treatment Plant with biogas production, existing and
planned expansions and new biogas production plants in the region, and an increased source
separation of food waste from households as a contributor of good biogas substrate [6]. The
projection of demand was in turn based on decisions and visionary plans to expand biogas bus
fleets, taxis, company cars and estimations of interest within the private sector [1][7].
Investments in public transport have a considerable impact. Public transport has a market share
to and from the city centre of 75 per cent during the rush hour periods. Over the entire day, an
average of 66 per cent of all passenger transport is by public transport. Only 5.3 per cent of all
greenhouse gas emissions within the transport sector come from public transport. Investments in
biofuels to power buses have led to further reductions in emissions [9] [11].
BIOGAS SUPPLY CHAIN
4
Altogether, greenhouse gas emissions in the transport sector are expected to increase by 14,000
tonnes by 2015 compared with the year 2009. The growth is a result of increased passenger
transport mileage, but is at the same time compensated by an increase in the number of clean
vehicles [9].
1.2 STATEMENT OF THE PROBLEM
1. Market issues
The high initial investment cost for production and distribution of biogas and
needs for a change of tax system that favors the use of biogas for buses.
2. Less availability of fuel stations
Few fuel stations make many potential buyers and users hesitate to buy.
3. Production problem and low availability of fuel pumps can undermine the support for
biogas as a fuel.
4. Problems to get more buses to use biogas as a fuel on the market
1.3 SCOPE OF THE PROJECT Our project will focus on the biogas production potential specifically the fuel produced from
biogas within the Stockholm city and also it will asses an analysis of biogas usage development
and distribution system. The project also addresses one of the largest biogas consumers in
Sweden, especially Stockholm Public Transport (SL) and their collaborative
partners/stakeholders. Today 250 biogas buses operate in Stockholm County, the most densely
populated region in Sweden, with slightly over 2 million inhabitants [7].
In 2010, fuel shortage once again occurred in Stockholm as well as across Sweden. Usage
increased by 70% in Stockholm alone. However, filling stations, supplies, and pumps did not
match the increase in demand. Drivers often complained of driving long distances before finding
a filling station, receiving poor supplies, and event experiencing malfunctioning pumps [19].
While the gas industry hold a partial responsibility for the failure to meet the increased demand,
the government also need to establish clear set goals for a national strategy to modulate the gas
supply situation [6][20].
The report aims to document and investigate biogas share of transport sector in Stockholm city.
Through this investigation, further knowledge about the process is expected to be gained and
passed on to internal and external interested parties. The report is expected to investigate results
from the biogas consumption of Stockholm transportation system and to discuss operating
BIOGAS SUPPLY CHAIN
5
scenarios on the basis of results achieved. In addition, the aim of the report is to share operating
experience with various operators within the biogas arena.
This also will give an emphasis on the flow of materials from the feedstock up to the final
product. The project will give a recommendation and/or suggestion based on the current
situations how it continues the use of biogas in the coming years within the target of Sweden
Government and European Union.
1.4 OBJECTIVE
The main focus of this project is to identify key stakeholders and bottlenecks within the biogas supply chains in Stockholm city.
Specific objective
Selecting a biogas supply chain
To map its flows To identify key stakeholders To analyze interaction To identify policy instruments
1.5 METHODOLOGY
The methods to be employed to achieve the objectives of the project are:
Literature review Data collection for the analysis: In this part important data and information will be
gathered from other thesis, journals, sight survey in different companies and related web sites.
Data analysis: using available tools (Excel, LEAP, etc) Discuss the obtained result Conclusion and recommendation
6
CHAPTER TWO 2. BIOGAS SUPPLY CHAIN STRUCTURAL MODEL AND ITS BOUNDARY
2.1 BIOGAS SUPPLY CHAIN STRUCTURAL MODEL
Biogas is produced by the process of anaerobic digestion (it is an oxygen free process and the
places that will be used to process are: in the earth, peat land, human & animal bowels and sea
bottoms) mainly by using microorganisms to break down organic material and producing
methane and carbon dioxide. And there are a wide range of organic material that can be use to
produce Biogas like sewage sludge at Waste Water Treatment Plant (WWTP), energy crops and
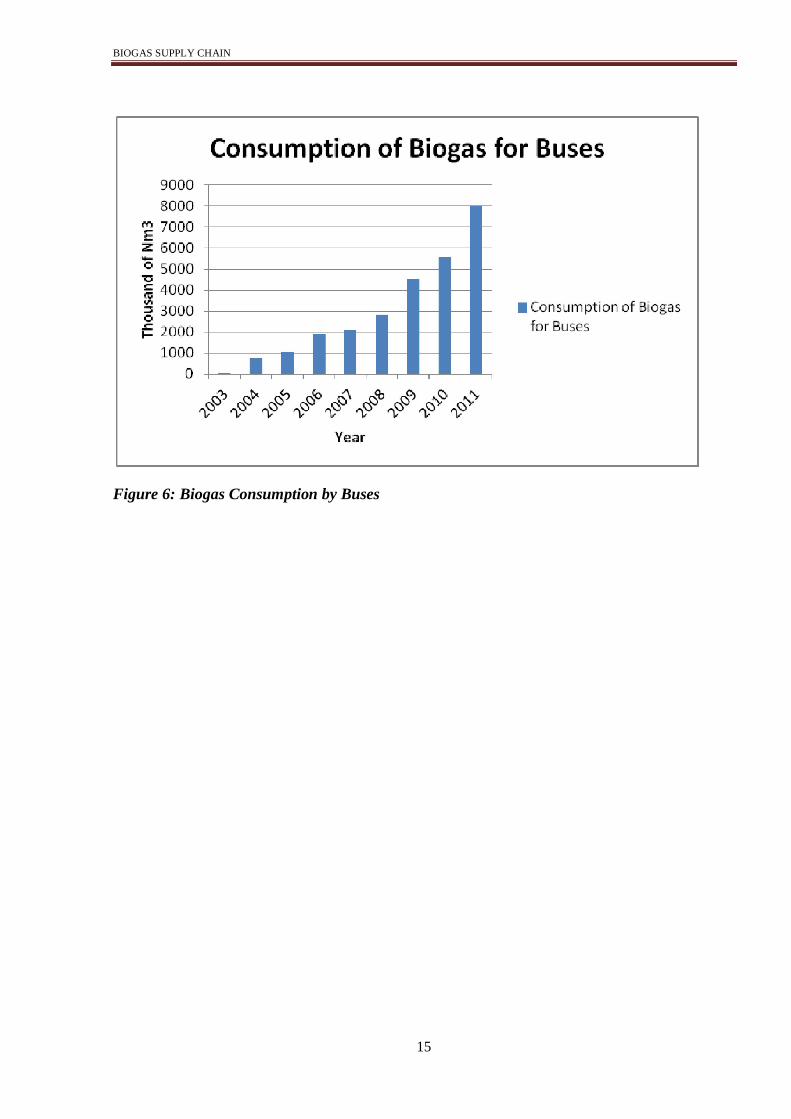
Table 2: Total Upgraded Biogas Consumption for Buses in Stockholm City [21]
Year 2003 2004 2005 2006 2007 2008 2009 2010 2011
Number of Biogas buses 1 21 30 55 61.00 81.00 129.00 159.00 229 consumption of biogas in thousand Nm3/year 35 735 1050 1925 2135 2835 4515 5565 8015
BIOGAS SUPPLY CHAIN
15
Figure 6: Biogas Consumption by Buses
BIOGAS SUPPLY CHAIN
16
REFERENCES
1. Production and Use of Biogas in 2008, www.energimyndigheten.se. 2. www.spi.se 3. http://www.energimyndigheten.se/en/Press/News/New-publication-Energy-in-Sweden-2011/ 4. http://www.tmr.sll.se/Global/Dokument/publ/2010/2010_r_energy_future_of_the_stockholm_region_2010-2050.pdf 5. http://www.investsweden.se/Global/Global/Downloads/Publications/Cleantech/Swedish-biogas-case-studies.pdf 6. http://www.balticbiogasbus.eu/web/Upload/Supply_of_biogas/Act_4_6/Production%20and%20supply%20of%20biogas%20in%20the%20Stockholm%20region.pdf 7. http://www-fa.upc.es/personals/fluids/oriol/ale/eolss.pdf 8. http://www.syntecingenierie.fr/media/uploads/newsletters_adherents/nl_433_14_06_2012_liens/rethink-cities-01_06-12.pdf 9. D2.15_Biogasmax_Henriksdal2000-2005 10. Energy in Sweden 2011, Swedish Energy Agency 11. Stockholm Action Plan For Climate And Energy 2010-2020, http://www.stockholm.se/PageFiles/97459/StockholmActionPlanForClimateAndEnergy2010-2020.pdf 12. EEA 2006 “How much bioenergy can Europe produce without harming the environment?” 13. http://www.stadshusab.se/Menu/Ekonomi+och+styrning/%C3%85rsredovisningar/%C3%85R+2010_eng+Stadshus+AB.pdf 14. http://www.biogasmax.eu/media/d2_10_biogasmax_iwes_rev_final_nov2010__022386900_0944_26012011.pdf 15. Swedish Gas Technology Centre Ltd (SGC)
16. Katarina Jonerholm, Sweco Environment AB, Production and supply of biogas in the
Stockholm region.
17. http://www.balticbiogasbus.eu/web/Upload/doc/Kaunas_201009/4%20SL%20Lennart%20Hallgren.pdf 18. Ida Örtegren, Christine Schnabel (WSP)(2009), Biogas as vehicle fuel - Market Expansion to 2020 Air Quality, Stockholm, 19. http://www.greendesignetc.net/Transportation_11/Transportation_Ye_Hanlu_Paper.pdf 20. http://www.e-energymarket.com/news/single-news/article/hitting-the-gas.html 21. http://www.biogasost.se/KartaStatistik/Gasfordon/Stockholm.aspx