Page 1
1
Hyposalinity tolerance in the coccolithophorid Emiliania huxleyi under the 1
influence of ocean acidification involves enhanced photosynthetic performance 2
3
Running head: Hyposalinity tolerance of E. huxleyi under OA 4
5
JiekaiXu1, John Beardall2, Kunshan Gao1,3* 6
7
1State Key Laboratory of Marine Environmental Science, College of Ocean and 8
Earth Sciences, Xiamen University, Xiamen 361102, China 9
2School of Biological Sciences, Monash University, Clayton, VIC. 3800, Australia 10
3Laboratory for Marine Ecology and Environmental Science, Qingdao National 11
Laboratory for Marine Science and Technology, Qingdao 266071, China 12
13
14
*Corresponding author e-mail: [email protected] (Kunshan Gao)15
Biogeosciences Discuss., https://doi.org/10.5194/bg-2019-4Manuscript under review for journal BiogeosciencesDiscussion started: 15 February 2019c© Author(s) 2019. CC BY 4.0 License.
Page 2
2
Abstract 16
While seawater acidification induced by elevated CO2 is known to impact 17
coccolithophores, the effects in combination with decreased salinity caused by sea ice 18
melting and/or hydrological events have not been documented. Here we show the 19
combined effects of seawater acidification and reduced salinity on growth, 20
photosynthesis and calcification of Emiliania huxleyi grown at 2 CO2 concentrations 21
(low CO2 LC�400 µatm; high CO2 HC�1000 µatm) and 3 levels of salinity (25, 30 22
and 35‰). A decrease of salinity from 35 to 25‰ increased growth rate, cell size and 23
effective photochemical efficiency under both LC or HC. Calcification rates were 24
relatively insensitive to combined effects of salinity and OA treatment but were 25
highest under 35‰ and HC conditions, with higher ratios of calcification to 26
photosynthesis (C:P) in the cells grown under 35‰ compared with those grown at 27
25‰. In addition, elevated dissolved inorganic carbon (DIC) concentration at the 28
salinity of 35‰ stimulated its calcification. In contrast, photosynthetic carbon fixation 29
increased almost linearly with decreasing salinity, regardless of the pCO2 treatments. 30
When subjected to short-term exposure to high light, the low-salinity-grown cells 31
showed the highest photochemical effective quantum yield with the highest repair rate, 32
though HC treatment enhanced PSII damage rate. Our results suggest Emiliania 33
huxleyi can tolerate low salinity plus acidification conditions by up-regulating its 34
photosynthetic performance together with a relatively insensitive calcification 35
response, which may help it better adapt to future ocean global environmental 36
changes, especially in the coastal areas of high latitudes. 37
Biogeosciences Discuss., https://doi.org/10.5194/bg-2019-4Manuscript under review for journal BiogeosciencesDiscussion started: 15 February 2019c© Author(s) 2019. CC BY 4.0 License.
Page 3
3
Keywords: calcification, coccolithophore, CO2, Emiliania huxleyi, ocean acidification, 38
photosynthesis, salinity. 39
40
1 Introduction 41
Since the Industrial Revolution, atmospheric pCO2 levels have increased by 42
approximately 40%, mainly due to anthropogenic emissions of CO2 (Howes et al., 43
2015), and the oceans have absorbed about one third of the fossil fuel CO2 (Sabine et 44
al., 2004), leading to increases in the concentration of pCO2, HCO3- and H+, along 45
with a decrease in the concentration of CO32- and the saturation state of calcium 46
carbonate, a process known as Ocean Acidification (OA). The pH of surface waters of 47
the global ocean has already decreased by 0.1 units and will be further decreased by 48
another 0.4 units by the end of this century under a “business-as-usual” scenario 49
(Gattuso et al., 2015). 50
At the same time, climate change also results in global warming, another critical 51
issue which has an important influence on organisms, with unforeseen consequences 52
for marine biogeochemical cycling and ecosystem functioning (Taucher and Oschlies, 53
2011). It is predicted that the global mean temperature will increase by 2~5 ̊C by 2100 54
(Gattuso et al., 2015). With warmer air and increasing ocean temperature, sea ice 55
coverage has been declining, leading to a decrease in salinity, especially in coastal 56
areas at high latitudes (Dickson et al., 2002; Ishii et al., 2006; Massom and 57
Stammerjohn, 2010). Blindheim et al. (2000) and Albretsen et al. (2011) have 58
reported a sharp decline in salinity in coastal areas of the Norwegian Sea during the 59
Biogeosciences Discuss., https://doi.org/10.5194/bg-2019-4Manuscript under review for journal BiogeosciencesDiscussion started: 15 February 2019c© Author(s) 2019. CC BY 4.0 License.
Page 4
4
last few decades, which in some locations has been more than 0.5‰ in the last 10 60
years. On the other hand, rainfall or hydrological changes associated with climate 61
change can also alter surface seawater salinity. As projected climate change processes 62
are thought to amplify OA in the oceans of high latitude, organisms in the waters at 63
high latitude are thought to be more vulnerable to rapid chemical changes (Chierici 64
and Fransson, 2009; Qi et al., 2017).It is therefore of general interest to explore how 65
marine photosynthetic organisms respond to changes in surface ocean carbonate 66
chemistry and salinity that are potentially altered by both decreased salinity and rising 67
CO2 concentration. 68
Coccolithophores, one of the most important calcifying primary producer groups, 69
play a key role in the global carbon cycle, contributing about 10% to total organic 70
carbon fixation (Poulton et al., 2007) and 50% to CaCO3 found in pelagic sediments 71
(Broecker and Clark, 2009). The globally most abundant coccolithophore species is 72
Emiliania huxleyi, which forms extensive blooms (Moore et al., 2012). With respect 73
to E. huxleyi’s distinct sensitivity to OA, there have already been a number of studies 74
that documented its morphological, physiological and molecular responses to OA 75
(Paasche, 2001; Raven and Crawfurd, 2012). Riebesell et al. (2000) reported negative 76
effects of OA on morphology, calcification and growth on E. huxleyi, while 77
Iglesias-Rodriguez et al. (2008) reported higher particulate inorganic and organic 78
carbon (PIC, POC) per cell under elevated pCO2. Nevertheless, both studies showed 79
decreased calcification rates under elevated pCO2 (Riebesell et al., 2008). Hoppe et al. 80
(2011) showed that the PIC production of two E. huxleyi strains was both negatively 81
Biogeosciences Discuss., https://doi.org/10.5194/bg-2019-4Manuscript under review for journal BiogeosciencesDiscussion started: 15 February 2019c© Author(s) 2019. CC BY 4.0 License.
Page 5
5
affected by higher pCO2, although marked differences of responses to OA did exist 82
among strains (Langer et al., 2009). Other environmental drivers are known to interact 83
with OA to affect E. huxleyi (Gao et al., 2012; Boyd et al. 2018). For instance, 84
exposure to UV radiation or high light exacerbated impacts of OA on calcification 85
(Feng et al., 2008; Gao et al., 2009). On the other hand, a recent study demonstrated 86
that high levels of sunlight counteracted the negative effects of OA on calcification of 87
E. huxleyi when the cells were grown under incident fluctuating solar radiation (Jin et 88
al., 2017). Over 150 to 1000 generations, lower PIC: POC ratios were still observed in 89
coccolithophorid species (Müller et al., 2010; Lohbeck, 2012; Tong et al. 2018). 90
Decreased PIC:POC ratio in another coccolithophorid Gephyrocapsa oceanica 91
adapted to OA over 1000 generations persisted when cells were transferred back to 92
the low pCO2 treatment, indicating an adaptive evolution (Tong et al. 2018). In brief, 93
it is generally accepted that OA decreases the calcification, and discrepancies exist 94
when OA impacts on E. huxleyi in combination with other factors or under multiple 95
drivers. 96
Decreased salinity may interact with OA to affect E. huxleyi, though it is known 97
as a euryhaline species (Birkenes et al., 1952; Paasche et al., 1996). While some E. 98
huxleyi strains can survive at a salinity as low as 15‰ (Brand, 1984), its calcification 99
is strongly depressed, with malformed coccoliths (Saruwatari et al., 2015). 100
Observations from sediment cores also showed that coccolith morphology was 101
dependent on salinity (Fielding et al., 2009), and salinity can affect the hydrogen 102
isotopic composition of long chain alkenones synthesized by E. huxleyi (Schouten et 103
Biogeosciences Discuss., https://doi.org/10.5194/bg-2019-4Manuscript under review for journal BiogeosciencesDiscussion started: 15 February 2019c© Author(s) 2019. CC BY 4.0 License.
Page 6
6
al., 2006). However, to the best of our knowledge, the combined effects of reduced 104
salinity and lowered pH on E. huxleyi have not yet been documented, except for one 105
investigation that addressed the combined effects of desalination and OA on a natural 106
community of Baltic Sea pelagic microplankton dominated by the cyanobacterium 107
Aphanizomenon sp. (Wulff et al., 2016). In this study, we show that Emiliania huxleyi 108
can tolerate hyposalinity even when grown under OA conditions. 109
110
2 Materials and methods 111
2.1 Cultures and experimental setup 112
Emiliania huxleyi PML B92/11 was originally obtained from coastal waters off 113
Bergen, Norway. This strain calcifies, but after having being maintained in laboratory 114
culture for about 10 years, its calcification capacity has decreased (see Results below). 115
Sterilized seawater was enriched with Aquil medium (Sunda et al., 2005). 116
Monospecific cultures (without aeration) were maintained at 15 ̊C and illuminated by 117
cool white fluorescent light at an intensity of 200 µmol photons m-2 s-1, under a 12:12 118
h light and dark cycle. We used low biomass density batch cultures in the sealed 119
polycarbonate bottles where E. huxleyi was inoculated for about 400 cells ml-1 at the 120
beginning and cell concentrations were less than 60,000 cells ml-1 when parameters 121
were measured so that there was no significant change of the carbonate chemistry in 122
the culture medium (Laroche et al., 2010) and the cultures were still in the exponential 123
phase after 4~5 days’ incubation without dilution (Zondervan et al., 2002). The 124
culture medium was equilibrated with filtered (0.22µm, Whatman) ambient air of low 125
Biogeosciences Discuss., https://doi.org/10.5194/bg-2019-4Manuscript under review for journal BiogeosciencesDiscussion started: 15 February 2019c© Author(s) 2019. CC BY 4.0 License.
Page 7
7
(400 µatm) or elevated (1000 µatm) CO2 concentrations prior to inoculation. We set 126
three levels of salinity (25‰, 30‰, 35‰): 35‰ is the salinity of our artificial 127
seawater (Harrison, 2005) and 30‰ ~ is close to the salinity of the strain’s original 128
environment (the influence of Norwegian coastal current) (Mork, 1981). The lowest 129
level served as an extreme that is within the range of values occurring frequently in 130
coastal and estuarine environments (Brand, 1984; Li et al., 2011). Reduced salinity 131
was obtained by diluting prepared artificial seawater with Milli - Q water before 132
sterilization, nutrient addition and aeration. After taking samples for carbonate 133
chemistry measurements (see the following section), the seawater with target pCO2 134
was divided carefully into three 500 ml polycarbonate bottles before inoculation. 135
There were thus triplicate independent cultures for each treatment where the volume 136
of each was 480 ml or so. Prior to the end of the experiment, we took samples again 137
for carbonate chemistry measurements. Samples for measurements of physiological 138
parameters were all taken about 2.5 h after the onset of the light period on the last day 139
of incubation when cells grew under each treatment for about 14 generations. Before 140
inoculation, exponential growing cells were pre-acclimated to experimental 141
conditions for at least 7 generations, then experimental cultures were run for another 142
6~8 generations in the mid exponential phase with gentle shaking twice a day. 143
144
2.2 Carbonate chemistry sampling and measurements 145
pH was measured by a pH meter (Orion 2 STAR,Thermo Scientific) calibrated 146
with standard National Bureau of Standards (NBS) buffers. Samples for total 147
Biogeosciences Discuss., https://doi.org/10.5194/bg-2019-4Manuscript under review for journal BiogeosciencesDiscussion started: 15 February 2019c© Author(s) 2019. CC BY 4.0 License.
Page 8
8
alkalinity (TA) measurements were filtered (~0.7 µm), poisoned with a saturated 148
HgCl2 solution (0.5‰ final concentration), and stored at 4 ̊C. TA was measured in 149
triplicate (each of 3 replicate cultures) and determined by Gran acidimetric titration 150
with a TA analyzer (AS-Alk1+, Apollo SciTech). Certified reference materials (A. 151
Dickson, LaJolla, California) from the Scripps Institution of Oceanography were used 152
to assure the accuracy of the TA measurement. TA and pH data were applied to 153
CO2SYS software (Lewis et al., 1998) to calculate other carbonate chemistry 154
parameters (Tables 1 & 2). 155
156
2.3 Specific growth rate and mean cell size determination 157
Cell concentration and mean cell size were measured by a Coulter Particle Count 158
and Size Analyzer (Z2, Beckman Coulter). Specific growth rate was calculated 159
according to the equation: µ=�lnN1 - lnN0�/�t1 - t0�, in which N1 and N0 represent 160
cell concentrations at t1 and t0, where t0 represents the beginning and t1 the end day of 161
the cultures. The period of (t1 - t0) fell within the exponential growth phase as 162
described above. 163
164
2.4 Chlorophyll and carotenoid contents 165
Cells for determination of pigment content were filtered onto GF/F filters (25 166
mm, Whatman) and then extracted overnight in absolute methanol at 4 ̊C in darkness 167
(Li et al. 2017). After centrifugation (5000 g for 10 min), the absorption values of the 168
sample supernatants were analyzed by a UV–VIS spectrophotometer (DU800, 169
Biogeosciences Discuss., https://doi.org/10.5194/bg-2019-4Manuscript under review for journal BiogeosciencesDiscussion started: 15 February 2019c© Author(s) 2019. CC BY 4.0 License.
Page 9
9
Beckman Coulter). The concentrations of chlorophylls a and c were calculated 170
according to (Ritchie, 2006): 171
Chl a (µg ml-1) = 13.2654* (A665 – A750) – 2.6839 * (A632– A750); 172
Chl c (µg ml-1) = -6.0138 *(A665 – A750) + 28.8191* (A632 – A750). 173
Carotenoid concentration was determined by the equation given by Strickland 174
and Parsons (1972): 175
Carotenoid (µg ml-1) = 7.6 *((A480 – A750) – 1.49 * (A510– A750)); 176
where Ax indicates the absorbance at a wavelength x. The pigment content per cell 177
was calculated by taking the dilution factor and cell concentration into account. 178
179
2.5 Chlorophyll a fluorescence 180
The photochemical parameters were determined using a Multiple Excitation 181
Wavelengths Chlorophyll Fluorescence Analyzer (Multi-color-PAM, Walz). 182
Maximum and effective photochemical quantum yields were determined according to 183
the equations of Genty et al. (1989): maximum photochemical quantum yield (Fv / Fm) 184
= (Fm - F0) / Fm , for dark-adapted (10 min) samples; effective photochemical quantum 185
yield ФPSII (F'v / F'm) = (F'm – Ft) / F'm for light-adapted samples, where Fm and F'm 186
indicate maximum chlorophyll fluorescence of dark and growth-light-adapted samples, 187
respectively; F0 is the minimum chlorophyll fluorescence of dark-treated cells; and Ft 188
is the steady-state chlorophyll fluorescence of light exposed samples. ФPSII was 189
measured under actinic light intensity (~240 µmol photons m-2 s-1) similar to the 190
culture light level. The saturation pulse was set at 5000 µmol photons m-2 s-1, and 191
Biogeosciences Discuss., https://doi.org/10.5194/bg-2019-4Manuscript under review for journal BiogeosciencesDiscussion started: 15 February 2019c© Author(s) 2019. CC BY 4.0 License.
Page 10
10
lasted for 0.8 s. 192
Another experiment was carried out on the last day of incubations, investigating 193
the response of cells under each treatment to high light exposure. Samples were 194
placed in 35 ml quartz tubes wrapped with Ultraphan film 395 (UV Opak, Digefra), 195
receiving irradiances above 395 nm (PAR). The transmission details of this cut-off 196
foil and quartz tubes are available elsewhere (Gao et al., 2007). The tubes for 197
fluorescence measurements were placed under a solar simulator (Sol 1200W; Dr. 198
Hönle, Martinsried, Germany). The cells were exposed to PAR of 800 µmol photons 199
m−2 s−1 for 48 min at 15 ̊C (growth temperature) while maintaining the tubes in a 200
circulating water bath for temperature control (CTP-3000, Eyela). During the 201
exposures, measurements of fluorescence parameters were carried out (see above). 202
Aliquots of 2.5 ml of sample from each tube (total of 18 tubes, that is, triplicate per 203
each treatment) were taken every 3-10 min during exposure, and immediately 204
measured (without any dark adaptation) to get the instant maximum fluorescence F'm 205
and the steady state fluorescence Ft of the light adapted cells, and ФPSII was calculated 206
as described above. The rates of high light-induced damage to PSII (k, min-1) and the 207
corresponding repair rates (r, min-1) were estimated according to Beardall et al. (2014), 208
applying the Kok model that assumes simultaneous operation of the damage and 209
recovery during the photoinhibitory exposures, and calculated as follows: ,: 210
Pn/P0 = r / (r +k) + k / (r+k)*exp (- (r + k) *t); 211
where Pn and P0 represent effective quantum yield values at time t (minutes) and 212
time zero, respectively. 213
Biogeosciences Discuss., https://doi.org/10.5194/bg-2019-4Manuscript under review for journal BiogeosciencesDiscussion started: 15 February 2019c© Author(s) 2019. CC BY 4.0 License.
Page 11
11
2.6 Determination of photosynthetic and calcification rates 214
On the last day of the cultures, the cells were collected in the middle of the 215
photoperiod, dispensed into borosilicate bottles (20 ml) and inoculated with 5 µCi 216
(0.185 MBq) of labelled sodium bicarbonate (Amersham). After 2 h of incubation 217
under the same environment as the cultures, samples were immediately filtered under 218
dim light onto Whatman GF/F glass fiber filters (25 mm), rinsed with unlabeled 219
medium, placed in 20 mL scintillation vials, and then dried (60 ̊C, 5 h) before 220
counting in a liquid scintillation counter (Beckman, LS6500) with 5 ml scintillation 221
cocktail (Perkin Elmer). In parallel, another filter with the cells was fumed with HCl 222
overnight to expel non-fixed 14C for measurement of photosynthetic 14C fixation. The 223
rate of calcification of E. huxleyi was estimated as the difference between the total and 224
the photosynthetic carbon fixation (Paasche, 1963; Gao et al., 2009). Two samples for 225
calcification (30‰ HC�35‰ LC) were lost during measurements, so are not reported 226
in the results. 227
2.7 Statistical analyses 228
Data were analyzed by using SPSS software. Before performing parametric tests, 229
data were tested for homogeneity of variance (Levene test) and normality (Shapiro - 230
Wilk test). The two-way ANOVA with pCO2 (two levels) and salinity (three levels) 231
classed as factors in the model was used at a significance level of p < 0.05. When p 232
value was under 0.05, the post hoc Duncan test was used to determine differences 233
between treatments. Data were reported as mean ± SD. 234
235
Biogeosciences Discuss., https://doi.org/10.5194/bg-2019-4Manuscript under review for journal BiogeosciencesDiscussion started: 15 February 2019c© Author(s) 2019. CC BY 4.0 License.
Page 12
12
3 Results 236
3.1 Specific growth rate and cell size 237
No interactive effects were found, but individual effects of salinity and pCO2 238
were observed (two-way ANOVA, F(2,12) = 1.580, p = 0.246; salinity F(2,12) = 5.574, p 239
= 0.019; pCO2 F(1,12) = 66.545, p < 0.001). 240
There were significant differences in growth rate between 25‰ and 35‰ 241
(one-way ANOVA, p < 0.05) under both LC and HC with significant differences also 242
found between 30‰ and 35‰ under LC (one-way ANOVA, p = 0.022), while no 243
significant difference was found in growth rate between 25‰ and 30‰ (Fig. 1a, 244
one-way ANOVA, p = 0.434, p = 0.053). Under LC, compared to 35‰, treatments 245
with salinity levels of 25‰ or 30‰ enhanced growth rate by 10% (p = 0.009) and 8% 246
(p = 0.022), respectively. Under HC, 25‰ and 30‰ enhanced growth rate by 9% (p = 247
0.037) and 10% (p = 0.103). For all salinity treatments, OA treatment decreased the 248
growth rate by 19% (p = 0.001), 16% (p = 0.020) and 18% (p = 0.003) compared to 249
that of LC-grown cells under 25‰, 30‰ and 35‰, respectively. 250
Cell size ranged from 4.20 µm to 4.88 µm. Mean cell sizes were largest in the 25‰ 251
treatment and smallest at 30‰ under both LC and HC (Fig. 1b). OA decreased cell 252
size under all salinity treatments. 253
254
3.2 Pigment content 255
Significant interaction effects and effects of salinity and pCO2, respectively on 256
chlorophyll a content of cells were observed (two-way ANOVA, F(2,12) = 55.102, p < 257
Biogeosciences Discuss., https://doi.org/10.5194/bg-2019-4Manuscript under review for journal BiogeosciencesDiscussion started: 15 February 2019c© Author(s) 2019. CC BY 4.0 License.
Page 13
13
0.001; salinity F(2,12) = 42.433, p < 0.001; pCO2 F(1,12) = 48.006, p < 0.001). Growth at 258
25‰ increased chlorophyll a content of cells, which was 72% (p < 0.001) higher than 259
at 30‰ and 1.8 times higher (p < 0.001) than at 35‰ under HC (Fig. 2a). Under LC, 260
there were no significant differences between 25‰ and 35‰ (one-way ANOVA, p = 261
0.698), 30‰ and 35‰ (one-way ANOVA, p = 0.055) while 30‰ increased the 262
chlorophyll a content of cells by 19% (p = 0.032) relative to 25‰. In the 25‰ 263
treatment, HC increased the chlorophyll a content of cells by 28% (p = 0.040) relative 264
to that of LC cells. However, chlorophyll a content was higher in the LC treatment 265
than HC under both 30‰ and 35‰. LC increased chlorophyll a content by 60% (p < 266
0.001) compared to HC under 30‰ and it was 1.28 times higher (p < 0.001) than in 267
the HC treatment under 35‰. 268
The trend of carotenoid content of cells was same as for chlorophyll a (Fig. 2c) 269
that the value was higher in the LC treatment than at HC under 30‰ and 35‰, 270
although there was no significant difference between LC and HC under 25‰ 271
(one-way ANOVA, p = 0.144). There were also no significant differences among the 272
three salinity treatments under LC (one-way ANOVA, F(2,6) = 1.620, p = 0.274). Under 273
HC, the carotenoid content increased at the low salinity, by 43% (p < 0.001) and 1.39 274
times (p < 0.001) in the 25‰ treatment relative to 30‰ and 35‰, respectively. 275
There were significant differences between cells grown at 25‰ and 35‰, and 276
between 30‰ and 35‰ for chlorophyll c content under both LC (one-way ANOVA, p 277
= 0.011, p = 0.005) and HC (one-way ANOVA, p < 0.001), while no significant 278
difference was found between cells grown at 25‰ and 30‰ (Fig. 2b, one-way 279
Biogeosciences Discuss., https://doi.org/10.5194/bg-2019-4Manuscript under review for journal BiogeosciencesDiscussion started: 15 February 2019c© Author(s) 2019. CC BY 4.0 License.
Page 14
14
ANOVA, p = 0.420, p = 0.212). Among the three salinity levels, only in the 35‰ 280
treatment could a higher chlorophyll c content under LC than HC be observed. 281
282
3.3 Chlorophyll a fluorescence 283
The maximal photochemical quantum yields varied little among all treatments, 284
ranging from 0.53 ± 0.01 to 0.55 ± 0.02 (Fig. 3a). Elevated pCO2 scarcely influenced 285
effective photochemical quantum yields under all salinity treatments (Fig. 3b). The 286
only exception was that ФPSII in HC cells decreased by 17% (p = 0.001) relative to 287
that of LC cells under 25‰. Under LC, 25‰ stimulated ФPSII by 31% (p = 0.003) and 288
17% (p = 0.026) compared to cells in 30‰ and 35‰, respectively. Under HC, there 289
was a significant difference only between cells at 25‰ and 35‰ (one-way ANOVA, p 290
< 0.05) among the three salinity treatments, where growth at 25‰ increased ФPSII by 291
13% (p = 0.039) relative to the 35‰ treatment (Fig. 3b). 292
293
3.4 Photosynthesis and calcification 294
Regardless of pCO2 levels, photosynthetic carbon fixation decreased with 295
increasing salinity (Fig. 4a). Cells grown under 25‰ had a photosynthesis rate 1.8 296
times higher than in 35‰ under LC (one-way ANOVA, p < 0.001) and 2.7 times 297
higher (p < 0.001) than under HC. OA generally decreased photosynthetic carbon 298
fixation with the only exception being that no significant difference was found 299
between LC and HC under 30‰ (one-way ANOVA, p = 0.158) although the mean 300
value of the former was still 30% higher (Fig. 4a). 301
Biogeosciences Discuss., https://doi.org/10.5194/bg-2019-4Manuscript under review for journal BiogeosciencesDiscussion started: 15 February 2019c© Author(s) 2019. CC BY 4.0 License.
Page 15
15
The calcification rates ranged from 0.03 ± 0.01 to 0.08 ± 0.02 pg C cell-1 h-1. No 302
significant differences were found among all salinity treatments under LC (one-way 303
ANOVA, F(2,5) = 1.775, p = 0.262). In contrast, growth at 35‰ stimulated the 304
calcification rates of cells by 75% (p = 0.042) and by 1.3 times (p = 0.013) compared 305
to values in cells grown at 25‰ and 30‰, respectively under HC. An effect of OA 306
was not found under the 35‰ treatment while it decreased calcification rates by 50% 307
under 25‰ (p = 0.044) and 30‰, although there were no significant differences 308
between LC and HC under the 30‰ treatment (one-way ANOVA, p = 0.170). No 309
significant interaction effects of salinity and pCO2 on the calcification rates were 310
found, though individual effects of salinity and pCO2 were significant (two-way 311
ANOVA, F(2,10) = 3.621, p = 0.066; salinity F(2,10) = 4.138, p = 0.049; pCO2 F (1,10) = 312
7.977, p = 0.018). 313
Significant interaction effects and individual effects of salinity and pCO2 were 314
found in the ratio of calcification (C) to photosynthesis (P) (two-way ANOVA, F(2,10) 315
= 11.286, p = 0.003; salinity F(2,10) = 37.050, p < 0.001; pCO2 F(1,10) = 5.028, p = 316
0.049). Seawater acidification and high salinity acted synergistically to stimulate the 317
C:P ratio, thus resulting in the highest value under the 35‰ HC treatment. Salinity 318
seemed to play a more important role as no significant differences between LC and 319
HC were found with the only exception being under 35‰ where OA increased the 320
ratio by 103% (p = 0.027). With increasing salinity, the C:P ratio increased regardless 321
of pCO2 levels. Under LC, the C:P value of cells grown under 35‰ was 1.2 times (p 322
= 0.044) and 70% higher (p = 0.108) than at 25‰ and 30‰ respectively, with the 323
Biogeosciences Discuss., https://doi.org/10.5194/bg-2019-4Manuscript under review for journal BiogeosciencesDiscussion started: 15 February 2019c© Author(s) 2019. CC BY 4.0 License.
Page 16
16
equivalent values being 4.9 times (p = 0.001) and 3.9 times (p = 0.001) higher under 324
HC. 325
326
3.5 Photochemical responses 327
When exposed to high light (800µmol photons m−2 s−1), the effective 328
photochemical quantum yield ФPSII decreased significantly during the first 0–15 min 329
of exposure in all salinity/pCO2 treatments (Fig. 5); after this period, ФPSII remained 330
more or less constant. Regardless of pCO2 levels, the samples grown under 25‰ had 331
a smaller decrease in ФPSII. 332
This trend was especially clear under LC (Fig. 5a). During the whole exposure 333
process, the ФPSII value of the cells under the 25‰ treatment was highest, with the 334
lowest value reached being ca. 0.21 after 48 min exposure, which was 4.4 (one-way 335
ANOVA, p = 0.004) and 80% (p = 0.045) higher than that of cells from 30‰ and 35‰ 336
treatments, respectively. In contrast, ФPSII of the 30‰ treatment was always lowest 337
during the whole exposure process. 338
In the HC-grown cells, ФPSII declined much faster compared to that in the 339
LC-grown cells except that at some time points, the value of ФPSII was higher in 340
HC-grown cells under the 30‰ treatment (Fig. 5b). No significant differences in ФPSII 341
among three salinity treatments were found during the whole exposure (Fig. 5b). The 342
only exception was that the 25‰ treatment showed higher values of ФPSII by 131% 343
(one-way ANOVA, p = 0.033) and 108% (p = 0.060), respectively, relative to that of 344
the 30‰ and 35‰ treatments at 6 min from the start of the exposure. Nonetheless, 345
Biogeosciences Discuss., https://doi.org/10.5194/bg-2019-4Manuscript under review for journal BiogeosciencesDiscussion started: 15 February 2019c© Author(s) 2019. CC BY 4.0 License.
Page 17
17
ФPSII of the 25‰ treatment was still highest during the whole exposure process, with 346
the lowest value reached being ca. 0.1. 347
After cells were exposed to short-term, acute exposures to elevated levels of 348
visible solar radiation, there was a significant difference in repair rates among the 349
three salinity treatments under LC (Fig. 6a). The highest r values were observed under 350
the 25‰ treatment, which were 4.5 times (one-way ANOVA, p = 0.007) and 83% 351
higher (p = 0.045) than those of 30‰ and 35‰ treatments while no significant 352
differences were observed under HC (p = 0.141). No significant differences in 353
damage rates were observed under HC among three salinity treatments (p = 0.122) 354
(Fig. 6b). While under LC, k values was highest in the 30‰ treatment and reached 355
about 0.4 min-1, a value which was 1.4 times (p = 0.001) and 90% higher (p = 0.003) 356
than those of 30‰ and 35‰ treatments, respectively. 357
From the ratio of r/k, it is clear that under LC, cells grown at the salinity of 25‰ 358
showed the best ability to cope with the high light stress but appeared to do worst 359
under 30‰ (Fig. 6c). In contrast, the performance of cells grown under different 360
salinity treatments showed no significant differences under HC (p = 0.392). 361
362
4 Discussion 363
Large populations of E. huxleyi are observed every summer in Norwegian coastal 364
waters (Holligan et al., 1993; Wal et al., 1995). Considering that E. huxleyi is an 365
essentially oceanic species with an offshore center of distribution (Winter et al., 1994), 366
its success in Norwegian coastal waters is noteworthy. Paasche et al. (1996) inferred 367
Biogeosciences Discuss., https://doi.org/10.5194/bg-2019-4Manuscript under review for journal BiogeosciencesDiscussion started: 15 February 2019c© Author(s) 2019. CC BY 4.0 License.
Page 18
18
that E. huxleyi may have developed distinct ecotypes in Scandinavian coastal waters. 368
By coincidence, the strain in our study (PML B92/11) was originally obtained from 369
coastal waters off Bergen, Norway. Here, although we cannot provide genetic data, 370
instead we focus on its physiological performance under changing levels of salinity 371
(25‰ ~ 35‰) and carbonate chemistry induced with elevated CO2 (1000 µatm). We 372
found that a reduction in salinity to 25‰ increased growth rate, effective 373
photochemical efficiency and photosynthetic carbon fixation even under ocean 374
acidification (OA) conditions, and its calcification rates were highest under 35‰ and 375
OA conditions. The tolerance of reduced salinity under OA could be attributed to its 376
increased light capturing capability due to increased cellular photosynthetic pigments 377
and enhanced light use efficiency and photo-repair in photosystem II. Discussion in 378
details are as follows: 379
E. huxleyi (PML B92/11) cells had a higher growth rate under reduced salinity 380
(25‰) when grown under ambient level of pCO2 (LC, Fig. 1a). This result is 381
consistent with previous studies (Brand, 1984; Schouten et al., 2006), showing that 382
strains isolated from coastal regions grew more rapidly under 25‰ than 33‰. Brand 383
(1984) suggested that the last deglaciation was a possible selection time for coastal 384
populations adapted for lower salinity. In the present study, since big differences in 385
seawater carbonate chemistry exist between 25‰ and 35‰ (Table 2), increased CO2 386
availability by about 39% might be the key reason (Fig. 1). 387
Strains that have different calcifying capacities have different DIC transport 388
abilities (Elzenga et al., 2000; Paasche, 2001). After a long time in laboratory culture, 389
Biogeosciences Discuss., https://doi.org/10.5194/bg-2019-4Manuscript under review for journal BiogeosciencesDiscussion started: 15 February 2019c© Author(s) 2019. CC BY 4.0 License.
Page 19
19
the capacity to calcify of the strain used in this work has declined: the value of 390
calcification rates (0.03 ± 0.01 to 0.08 ± 0.02 pg C cell-1 h-1) determined here is lower 391
compared to the values of 0.29-0.46 pg C cell-1 h-1 reported by another study with the 392
same strain used (Sett et al., 2014). It’s reported that low–calcifying strains are less 393
efficient in utilizing bicarbonate for assimilation (Nimer and Merrett, 1992; Rost et al., 394
2003). Thus, growth of this strain might largely rely on the availability of CO2. At 25‰ 395
in the present work, cells’ growth was increased by 9-10% as there was more 396
dissolved CO2 in cultures compared to treatments under 30‰ and 35‰. Although 397
enhanced growth rate of E. huxleyi (NZEH, AC472 and NIES 837) under elevated 398
CO2 concentrations has been reported before (Shi et al., 2009; Fiorini et al., 2011; 399
Fukuda et al. 2014), in the present study, the growth of E. huxleyi was lowered by 400
16-19% under HC condition regardless of the salinity levels compared to LC-grown 401
cells, which suggests that increased acidity under OA could have stressed the cells 402
(Fig. 1a). Seawater acidification as a result of increased pCO2 has also been shown to 403
inhibit growth rate of E. huxleyi in other studies (Nimer et al., 1994; Hoppe et al., 404
2011). 405
The photosynthetic rates, in accordance with the growth rate, increased with 406
decreased salinity under both LC and HC (Fig. 4a). Such a relationship in 407
photosynthesis was more obvious than in the specific growth rate (Figs 1&4). Since 408
mitochondrial respiration rate of E. huxleyi is enhanced under elevated CO2 409
concentrations (Jin et al., 2015), the balance between photosynthesis and respiration 410
can reasonably be reflected in the growth response (Fig. 1a). The complexities of 411
Biogeosciences Discuss., https://doi.org/10.5194/bg-2019-4Manuscript under review for journal BiogeosciencesDiscussion started: 15 February 2019c© Author(s) 2019. CC BY 4.0 License.
Page 20
20
inorganic carbon use of E. huxleyi, especially in relation to which species of inorganic 412
carbon (CO2 or HCO3� or both) is the primary source for photosynthesis, remain 413
controversial (Sekino et al., 1994; Bach et al., 2011; Monteiro et al., 2016). Recently, 414
CO2 has been suggested to be the main inorganic carbon source for photosynthesis in 415
calcifying strains of E. huxleyi (Bach et al., 2013; Stojkovic et al., 2013). Therefore, 416
reduced salinity with the increased availability of CO2 would have resulted in higher 417
photosynthetic rates. In this study, cells grown under 25‰ exhibited photosynthesis 418
rates about 2 times higher than in 35‰ (Fig. 4a), while differences of [CO2] between 419
25‰ and 35‰ media were much smaller (Table 2). The reason behind this can be 420
associated with the function of CCMs, which makes the discrepancies in intracellular 421
[CO2] far larger than those of the surrounding medium (Rost et al., 2003; Schulz et al., 422
2007), although the CCMs of E. huxleyi are supposed to be low (Rost and Riebesell, 423
2004). Furthermore, a higher photosynthesis under reduced salinity (25‰ and 30‰) 424
implies the process of osmoregulation that the cells need to release more organic 425
osmolytes into the medium to cope with hypo-osmotic stress, as many organic 426
osmolytes are typically photosynthetic products (Kirst, 1990). 427
In our study, cells grown under HC conditions had lower photosynthesis rates 428
irrespective of salinity treatments (Fig 4a). The negative effects of low pH (� 7.7) 429
could have offset the positive effects of increasing [CO2] (about twice that of LC 430
medium, Table 2) as previous studies show that higher intracellular [H+] would 431
directly result in a decreased pH in the stroma of the chloroplast, which then led to 432
reduced CO2 fixation (Werdan et al., 1975; Coleman et al., 1981; Suffrian et al., 2011). 433
Biogeosciences Discuss., https://doi.org/10.5194/bg-2019-4Manuscript under review for journal BiogeosciencesDiscussion started: 15 February 2019c© Author(s) 2019. CC BY 4.0 License.
Page 21
21
In addition, HC treatment might down-regulate the efficiency of CCMs, thus resulting 434
in lower intracellular [CO2] and reduced photosynthetic rate compared to LC, as 435
reflected in a diatom (Liu et al. 2017). 436
Calcification rates of E. huxleyi are known to be sensitive to changes in seawater 437
carbonate chemistry. As HCO3� is the main substrate for calcification (Buitenhuis et 438
al., 1999; Paasche, 2001), the increasing calcification rates of cells grown under HC 439
with increasing salinity in our study (Fig. 4b) could be the result of increased [HCO3-] 440
concentration (Tables 1&2). However, there were no significant differences in 441
calcification rates among three salinity treatments under LC with even a slightly 442
higher value at 25‰ (Fig. 4b), which is consistent with Beaufort et al. (2011), who 443
also showed weak correlation between calcification and salinity. Under LC, the 444
highest effective photochemical quantum yield values and r:k ratios were observed 445
under 25‰ among the three salinity treatments after an exposure to high light (Figs. 446
5a & 6c), suggesting a relative thick coccolith layer (Xu and Gao, 2012), which was 447
in accordance with the 14C results as described above (Fig. 4b). Nimer and Merrett 448
(1993) proposed that the optimum pH for calcification was 7.8, a value just close to 449
the pH of our medium under 25‰ and LC condition (Table 2), although the strains 450
they used were different from that in our study. Sikes and Wilbur (1982) demonstrated 451
that, when salinity was reduced from 34.5‰ to 19.5‰, the percentage of calcified 452
cells increased in the medium. Therefore, the existence of a coccosphere may help to 453
regulate osmotic pressure and impart on cells a greater tolerance to low salinity, which 454
could partially explain the abundant coccoliths found in the sloped sediments of 455
Biogeosciences Discuss., https://doi.org/10.5194/bg-2019-4Manuscript under review for journal BiogeosciencesDiscussion started: 15 February 2019c© Author(s) 2019. CC BY 4.0 License.
Page 22
22
Mississippi continental shelf (Doyle and Sparks, 1980) and the burst of 456
coccolithophore blooms in the Gulf of Mexico with a large amount of freshwater 457
input from the Mississippi River (O'Connor et al., 2016). Taylor et al. (2011) 458
identified a plasma membrane H+ channel that played an important role in pH 459
homeostasis in coccolithophores. Both rectifying H+ channels and rectifying Cl- 460
channels worked together to sustain H+ efflux. In our study, the lower concentration of 461
Cl- associated with the reduced salinity in the 25‰ medium implies that Cl- efflux 462
was easier to carry out and assist H+ removal to keep the intracellular pH stable, 463
which could ultimately have promoted calcification. 464
We also found that the difference in calcification rate between LC and HC cells 465
gradually reversed with increasing salinity (Fig. 4b). Calcification rates of E. huxleyi 466
(PMLB 92/11) at high pCO2 appeared to be dependent on pH (Bach et al., 2011). 467
Indeed, we suggest such reversal was due to changes in the proportion of [HCO3�] 468
and pH in the milieu. Specifically, calcification would generate quantities of H+ that 469
must be rapidly removed to prevent cytoplasmic acidification. Under LC, it was easier 470
for the cells to remove H+ (Mackinder et al., 2010), while under HC the concentration 471
of [HCO3�], the substrate (bicarbonate ions) for calcification, was higher (Tables 1 & 472
2). The proportion of [HCO3�] in terms of total inorganic carbon increased with 473
increasing salinity (Table 2) and thus led to a slightly higher calcification rate under 474
35‰ and HC conditions (Fig. 4b), which is consistent with the result reported by 475
Fukuda et al. (2014). This finding helped to enhance our understanding as to why 476
coccolithophores were able to thrive in the early Mesozoic era, a time that was 477
Biogeosciences Discuss., https://doi.org/10.5194/bg-2019-4Manuscript under review for journal BiogeosciencesDiscussion started: 15 February 2019c© Author(s) 2019. CC BY 4.0 License.
Page 23
23
characterized by relatively low sea water pH (as low as pH 7.7) and high DIC 478
concentrations (Ridgwell, 2005). 479
Cell diameters of E. huxleyi measured here are a combination of both the 480
thickness of the coccolith layer and the size of protoplast. The highest value of the cell 481
diameter under LC was observed in 25‰ treatment (Fig. 1b), which was because the 482
cells grown at salinity 25‰ had the highest photosynthesis rate and a relatively high 483
calcification rate (Figs. 4a & 4b). As for the smaller diameters at salinity 35‰, this 484
could be a result of a more pronounced decrease in organic carbon fixation than the 485
increase in calcification along with increased salinity (Fig. 4a & 4b). 486
From the ratio of calcification to photosynthesis (C:P), we could see different 487
strategies cells adopted when they grew under different carbonate chemistry 488
conditions. A quite low value for this parameter (< 0.2) under 25‰ and 30‰ 489
regardless of pCO2 (Fig. 4c) indicates that organic carbon production was prioritized 490
over inorganic carbon production at the DIC levels. In contrast, the C:P ratio was far 491
higher (> 0.3) under 35‰ (Fig. 4c), suggesting that cells would “invest” more 492
inorganic carbon to secrete coccoliths if the DIC supply was increased (Tables 1 & 2). 493
The results of an additional experiment (for details see supplementary materials) 494
clearly provided evidence for such behavior: when the salinity was set at 25‰ with 495
elevated DIC concentration, its C:P ratio significantly increased (Fig. S1). This result 496
agreed with previous findings (Bach et al., 2013) with qRT-PCR analysis, showing 497
that some genes with putative roles in DIC, Ca2+ and H+ transport (AEL1, CAX3 and 498
ATPVc’/c) may play a dual role, supporting calcification under ambient conditions but 499
Biogeosciences Discuss., https://doi.org/10.5194/bg-2019-4Manuscript under review for journal BiogeosciencesDiscussion started: 15 February 2019c© Author(s) 2019. CC BY 4.0 License.
Page 24
24
switching to support photosynthesis when DIC becomes limiting. 500
Our results suggest that E. huxleyi PML B92/11 has the ability to acclimate to 501
different levels of salinity + pCO2, explaining its success in coastal waters, an 502
environment characterized by acute changes in pCO2 and salinity. Tyrrell et al. (2007) 503
reported that E. huxleyi could only survive in natural waters with salinity above 11. 504
We found that when salinity was further decreased to 15‰, cells of this strain could 505
hardly survive, with non-measurable growth (data not shown). Since sensitivity of 506
different strains of E. huxleyi to ocean acidification differs substantially (Langer et al. 507
2009), combined effects of OA and salinity would therefore be different in different 508
regieons or under different hydrological processes. 509
Under the future scenario of ocean acidification with decreased salinity, the 510
tolerance ability of E. huxleyi showed in this study will increase its competitiveness 511
and help it better adapt to future global environmental changes, especially in the 512
coastal areas of high latitude. A potential niche extension of E. huxleyi then would 513
influence the distribution of other phytoplankton and have profound consequences for 514
the ocean’s carbon cycle. Thus, further studies that could better mimic the future 515
scenario are needed. 516
517
Acknowledgements 518
We would like to thank Dr. John Beardall for his advice on the manuscript. This study 519
was supported by the National Natural Science Foundation (41430967, 41720104005), 520
and the NSFC - Shandong Joint Fund for Marine Ecology and Environmental 521
Biogeosciences Discuss., https://doi.org/10.5194/bg-2019-4Manuscript under review for journal BiogeosciencesDiscussion started: 15 February 2019c© Author(s) 2019. CC BY 4.0 License.
Page 25
25
Sciences (No. U1606404). We are grateful to Liping Wu and Xiaowen Jiang for their 522
help with the experiments.523
Biogeosciences Discuss., https://doi.org/10.5194/bg-2019-4Manuscript under review for journal BiogeosciencesDiscussion started: 15 February 2019c© Author(s) 2019. CC BY 4.0 License.
Page 26
26
References 524
Albretsen, J., Aure, J., Sætre, R., and Danielssen, D. S.: Climatic variability in the 525
Skagerrak and coastal waters of Norway, ICES J Mar Sci., 69, 758-763, doi: 526
10.1093/icesjms/fsr187, 2011. 527
Bach, L. T., Riebesell, U., and Schulz, K. G.: Distinguishing between the effects of 528
ocean acidification and ocean carbonation in the coccolithophore Emiliania 529
huxleyi, Limnol. Oceanogr., 56, 2040-2050, doi: 10.4319/lo.2011.56.6.2040, 530
2011. 531
Bach, L. T., Mackinder, L. C., Schulz, K. G., Wheeler, G., Schroeder, D. C., and 532
Brownlee, C., et al.: Dissecting the impact of CO2 and pH on the mechanisms of 533
photosynthesis and calcification in the coccolithophore Emiliania huxleyi, New 534
Phytol., 199, 121-34, doi: 10.1111/nph.12225, 2013. 535
Beaufort, L., Probert, I., De, G. T., Bendif, E. M., Ruizpino, D., and Metzl, N., et al.: 536
Sensitivity of coccolithophores to carbonate chemistry and ocean 537
acidification, Nature 476, 80-3. doi: 10.1038/nature10295, 2011. 538
Beardall, J., Stojkovic, S., and Gao, K.: Interactive effects of nutrient supply and other 539
environmental factors on the sensitivity of marine primary producers to 540
ultraviolet radiation: implications for the impacts of global change, Aquat Biol., 541
22, 5-23, doi: 10.3354/ab00582, 2014. 542
Birkenes, E., and Braarud, T.: Phytoplankton in the Oslo Fjord during a 'Coccolithus 543
huxleyi-summer'. Avh. norske Vidensk. Akad. Mat.-Nat. Kl, 2, 1952. 544
Blindheim, J., Borovkov, V., Hansen, B., Malmberg, S. A., Turrell, W. R., and 545
Biogeosciences Discuss., https://doi.org/10.5194/bg-2019-4Manuscript under review for journal BiogeosciencesDiscussion started: 15 February 2019c© Author(s) 2019. CC BY 4.0 License.
Page 27
27
Østerhus, S.: Upper layer cooling and freshening in the Norwegian sea in relation 546
to atmospheric forcing, Deep-Sea Res. I 47, 655-680, doi: 547
10.1016/S0967-0637(99)00070-9, 2000. 548
Boyd PW, Collins S, Dupont S, et al : Experimental strategies to assess the biological 549
ramifications of multiple drivers of global ocean change—A review, Glob 550
Change Biol., 24, 2239–2261. doi:10.1111/gcb.14102, 2018. 551
Brand, L. E.: The salinity tolerance of forty-six marine phytoplankton isolates, 552
Estuarine, Coastal Shelf Sci. 18, 543-556. doi: 10.1016/0272-7714(84)90089553
-1,1984. 554
Broecker, W., and Clark, E.: Ratio of coccolith CaCO3 to foraminifera CaCO3 in late 555
Holocene deep sea sediments, Paleoceanography 24, 235-236, doi: 556
10.1029/2009PA00173, 2009. 557
Buitenhuis, E. T., Baar, H. J. W. D., and Veldhuis, M. J. W.: Photosynthesis and 558
calcification by Emiliania huxleyi (Prymnesiophyceae) as a function of inorganic 559
carbon species, J. Phycol., 35, 949-959. doi: 560
10.1046/j.1529-8817.1999.3550949.x, 1999. 561
Chierici, M., & Fransson, A.: Calcium carbonate saturation in the surface water of the 562
Arctic ocean: undersaturation in freshwater influenced shelves, Biogeosciences 6, 563
2421-2431, doi: 10.5194/bg-6-2421-2009, 2009. 564
Coleman, J. R., & Colman, B.: Inorganic carbon accumulation and photosynthesis in a 565
blue-green alga as a function of external pH, Plant Physiol., 67, 917-921. doi: 566
10.1104/pp.67.5.917, 1981. 567
Biogeosciences Discuss., https://doi.org/10.5194/bg-2019-4Manuscript under review for journal BiogeosciencesDiscussion started: 15 February 2019c© Author(s) 2019. CC BY 4.0 License.
Page 28
28
Dickson, B., Yashayaev, I., Meincke, J., Turrell, B., Dye, S., and Holfort, J.: Rapid 568
freshening of the deep North Atlantic ocean over the past four decades, Nature 569
416: 832-837, doi: 10.1038/416832a, 2002. 570
Doyle, L. J., and Sparks, T. N.: Sediments of the Mississippi, Alabama, and Florida 571
(MAFLA) continental shelf, J Sediment Res., 50, 905-195, 572
doi:10.1306/212F7B1C-2B24-11D7-8648000102C1865D, 1980. 573
Elzenga, J. T. M., Prins, H., & Stefels, J.: The role of extracellular carbonic anhydrase 574
activity in inorganic carbon utilization of Phaeocystis globosa 575
(Prymnesiophyceae): a comparison with other marine algae using the isotopic 576
disequilibrium technique, Limnol. Oceanogr., 45, 372-380, doi: 577
10.4319/lo.2000.45.2.0372, 2000. 578
Feng, Y., Warner, M. E., Zhang, Y., Sun, J., Fu, F. X., Rose, J. M., et al.: Interactive 579
effects of increased pCO2, temperature and irradiance on the marine 580
coccolithophore Emiliania huxleyi (Prymnesiophyceae), Eur. J. Phycol., 43, 581
87-98. doi:10.1080/09670260701664674, 2008. 582
Fielding, S. R., Herrle, J. O., Bollmann, J., Worden, R. H., and Montagnesd, D. J. S.: 583
Assessing the applicability of Emiliania huxleyi coccolith morphology as a 584
sea-surface salinity proxy, Limnol. Oceanogr., 54, 1475-1480, doi: 585
10.4319/lo.2009.54.5.1475, 2009. 586
Fiorini, S., Middelburg, J. J., and Gattuso, J. P.: Testing the effects of elevated pCO2 587
on coccolithophores (Prymnesiophyceae): comparison between haploid and 588
diploid life stages, J. Phycol., 47, 1281-1291. doi: 589
Biogeosciences Discuss., https://doi.org/10.5194/bg-2019-4Manuscript under review for journal BiogeosciencesDiscussion started: 15 February 2019c© Author(s) 2019. CC BY 4.0 License.
Page 29
29
10.1111/j.1529-8817.2011.01080.x, 2011. 590
Fukuda, S. Y., Suzuki, Y., and Shiraiwa, Y.: Difference in physiological responses of 591
growth, photosynthesis and calcification of the coccolithophore Emiliania 592
huxleyi to acidification by acid and CO2 enrichment, Photosynth Res., 121, 593
299-309. doi:10.1007/s11120-014-9976-9, 2014. 594
Gao, K., Guan, W., and Helbling, E. W.: Effects of solar ultraviolet radiation on 595
photosynthesis of the marine red tide alga Heterosigma akashiwo 596
(Raphidophyceae), Photochem. Photobiol., 86, 140-148. doi: 597
10.1016/j.jphotobiol.2006.05.007,2007. 598
Gao, K., Ruan, Z., Villafañe, V. E., Gattuso, J. P., and Helbling, E. W.: Ocean 599
acidification exacerbates the effect of UV radiation on the calcifying 600
phytoplankter Emiliania huxleyi, Limnol. Oceanogr., 54,1855–1862, doi: 601
10.4319/lo.2009.54.6.1855, 2009. 602
Gao, K., Helbling, E. W., D-P, H., and Hutchins, D. A.: Responses of marine primary 603
producers to interactions between ocean acidification, solar radiation, and 604
warming, Mar. Ecol. Prog. Ser., 470, 167-189, doi: 10.3354/meps10043, 2012. 605
Gattuso, J. P., Magnan, A., Billé, R., Cheung, W. W., Howes, E. L., and Joos, F., et al.: 606
Contrasting futures for ocean and society from different anthropogenic CO₂ 607
emissions scenarios, Science 349, aac4722, doi: 10.1126/science.aac4722, 2015. 608
Genty, B., Briantais, J. M., and Baker, N. R.: The relationship between the quantum 609
yield of photosynthetic electron transport and quenching of chlorophyll 610
fluorescence, Biochim. Biophys. Acta 990, 87-92, doi: 611
Biogeosciences Discuss., https://doi.org/10.5194/bg-2019-4Manuscript under review for journal BiogeosciencesDiscussion started: 15 February 2019c© Author(s) 2019. CC BY 4.0 License.
Page 30
30
10.1016/S0304-4165(89)80016-9, 1989. 612
Harrison, P. J. and J.A. Berges.: “Marine Culture Media,” In Algal Culturing 613
Techniques. R. Andersen (Academic Press), 21-34, 2005. 614
Holligan, P. M., Groom, S. B., & Harbour, D. S.: What controls the distribution of the 615
coccolithophore, Emiliania huxleyi, in the North sea?, Fish. Oceanogr., 2, 175–616
183. doi: 10.1111/j.1365-2419.1993.tb00133.x, 1993. 617
Hoppe, C. J. M., Langer, G., and Rost, B.: Emiliania huxleyi, shows identical 618
responses to elevated pCO2 in TA and DIC manipulations, Journal of 619
Experimental Mar. Biol., 406, 54-62. doi: 10.1016/j.jembe.2011.06.008, 2011. 620
Howes, E., Joos, F., Eakin, C. M., and Gattuso, J. P.: An updated synthesis of the 621
observed and projected impacts of climate change on the chemical, physical and 622
biological processes in the oceans, Fron Mari Sci., 2, 36, doi: 623
10.3389/fmars.2015.00036, 2015. 624
Iglesias-Rodriguez, M. D., Halloran, P. R., Rickaby, R. E. M., Hall, I. R., 625
Colmenero-Hidalgo, E., and Gittins, J. R., et al.: Phytoplankton Calcification in a 626
High-CO₂ world, Science 320, 336-340, doi: 10.1126/science.1154122, 2008. 627
Ishii, M., Kimoto, M., Sakamoto, K., and Iwasaki, S. I.: Steric sea level changes 628
estimated from historical ocean subsurface temperature and salinity analyses, J. 629
Oceanogr 62, 155-170. doi: 10.1007/s10872-006-0041-y, 2006. 630
Jin, P., Wang, T., Liu, N., Dupont, S., Beardall, J., and Boyd, P. W., et al.: Ocean 631
acidification increases the accumulation of toxic phenolic compounds across 632
trophic levels, Nat Commun., 6, 8714. doi: 10.1038/ncomms9714, 2015. 633
Biogeosciences Discuss., https://doi.org/10.5194/bg-2019-4Manuscript under review for journal BiogeosciencesDiscussion started: 15 February 2019c© Author(s) 2019. CC BY 4.0 License.
Page 31
31
Jin, P., Ding, J., Xing, T., Riebesell, U., & Gao, K.: High levels of solar radiation 634
offset impacts of ocean acidification on calcifying and non-calcifying strains of 635
Emiliania huxleyi, Mar. Ecol. Prog. Ser., 568, 47-58. doi: 10.3354/meps12042, 636
2017. 637
Kirst, G. O.: Salinity Tolerance of Eukaryotic Marine Algae. Annu. Rev. Plant Physiol. 638
Plant Mol. Biol., 41, 21-53, doi: 10.1146/annurev.pp.41.060190.000321, 1990. 639
Langer, G., Nehrke, G., Probert, I., Ly, J., and Ziveri, P.: Strain-specific responses of 640
Emiliania huxleyi to changing seawater carbonate chemistry. Biogeosciences 6, 641
2637-2646, doi: 10.5194/bg-6-2637-2009, 2009. 642
LaRoche, J., Rost, B., and Engel, A.: Bioassays, batch culture and chemostat 643
experimentation. In Approaches and tools to manipulate the carbonate 644
chemistry., Guide to Best Practices for Ocean Acidification Research and Data 645
Reporting. Riebesell U., Fabry VJ, Hansson L., Gattuso J. P., 81-94, 2010. 646
Lewis, E., Wallace, D., and Allison, L. J.: Program developed for CO2 system 647
calculations. ORNL/CDIAC-105, Oak Ridge, Tennessee, U.S.: Carbon Dioxide 648
Information Analysis Center, Oak Ridge National Laboratory, Department of 649
Energy, 1998. 650
Li, G., Gao, K., Yuan, D., Zheng, Y., and Yang, G.: Relationship of photosynthetic 651
carbon fixation with environmental changes in the Jiulong River estuary of the 652
South China Sea, with special reference to the effects of solar UV radiation, 653
Marine Pollut Bull., 62, 1852-1858. doi: 10.1016/j.marpolbul.2011.02.050, 2011. 654
Li, F., Beardall, J., Collins, S., and Gao, K.: Decreased photosynthesis and growth 655
Biogeosciences Discuss., https://doi.org/10.5194/bg-2019-4Manuscript under review for journal BiogeosciencesDiscussion started: 15 February 2019c© Author(s) 2019. CC BY 4.0 License.
Page 32
32
with reduced respiration in the model diatom Phaeodactylum tricornutum grown 656
under elevated CO2 over 1800 generations, Global Change Biol., 23, 127-137. 657
doi: 10.1111/gcb.13501, 2017. 658
Liu, N., Beardall, J., and Gao, K.: Elevated CO2 and associated seawater chemistry do 659
not benefit a model diatom grown with increased availability of light, Aquat 660
Microb Ecol., 79, 137-147. doi: 10.3354/ame01820, 2017. 661
Lohbeck, K. T., Riebesell, U., and Reusch, T. B. H.: Adaptive evolution of a key 662
phytoplankton species to ocean acidification, Nat Geosci., 5, 346-351. doi: 663
10.1038/ngeo1441, 2012. 664
Mackinder, L., Wheeler, G., Schroeder, D., Riebesell, U., and Brownlee, C.: 665
Molecular mechanisms underlying calcification in coccolithophores, 666
Geomicrobiol. J., 27, 585-595. doi: 10.1080/01490451003703014, 2010. 667
Massom, R. A., and Stammerjohn, S. E.: Antarctic sea ice change and variability – 668
Physical and ecological implications, Polar Sci., 4, 149-186, doi : 669
10.1016/j.polar.2010.05.001, 2010. 670
Monteiro, F. M., Bach, L. T., Brownlee, C., Bown, P., Rickaby, R. E., Poulton, A. J., et 671
al: Why marine phytoplankton calcify, Sci. Adv., 2(7), e1501822, doi: 672
10.1126/sciadv.1501822, 2016. 673
Moore, T. S., Dowell, M. D., & Franz, B. A.: Detection of coccolithophore blooms in 674
ocean color satellite imagery: A generalized approach for use with multiple 675
sensors, Remote Sens of Environ., 117, 249-263, doi: 10.1016/j.rse.2011.10.001, 676
2012. 677
Biogeosciences Discuss., https://doi.org/10.5194/bg-2019-4Manuscript under review for journal BiogeosciencesDiscussion started: 15 February 2019c© Author(s) 2019. CC BY 4.0 License.
Page 33
33
Mork, M.: Circulation Phenomena and Frontal Dynamics of the Norwegian coastal 678
current, Philos. Trans. R. Soc., London 302, 635-647, doi: 679
10.1098/rsta.1981.0188, 1981. 680
Müller, M., Schulz, K., and Riebesell, U.: Effects of long-term high CO2 exposure on 681
two species of coccolithophores, Biogeosciences 7, 1109-1116. doi: 682
10.5194/bg-7-1109-2010, 2010. 683
Nimer, N. A., and Merrett, M. J.: Calcification and utilization of inorganic carbon by 684
the coccolithophorid Emiliania huxleyi Lohmann, New Phytol., 121, 173-177, 685
doi: 10.1111/j.1469-8137.1992.tb01102.x, 1992. 686
Nimer, N. A., and Merrett, M. J.: Calcification rate in Emiliania huxleyi Lohmann in 687
response to light, nitrate and availability of inorganic carbon, New Phytol., 123, 688
673-677. doi : 10.1111/j.1469-8137.1993.tb03776.x, 1993. 689
Nimer, N. A., Brownlee, C., and Merrett, M. J.: Carbon dioxide availability, 690
intracellular pH and growth rate of the coccolithophore Emiliania huxleyi, Mar. 691
Ecol. Prog., 109, 257-262. doi: 10.3354/meps109257, 1994. 692
O'Connor, B. S., Muller-Karger, F. E., Nero, R. W., Hu, C., and Peebles, E. B.: The 693
role of Mississippi River discharge in offshore phytoplankton blooming in the 694
northeastern Gulf of Mexico during August 2010, Remote Sens Environ., 173, 695
133-144, doi: 10.1016/j.rse.2015.11.004, 2016. 696
Paasche, E.: The Adaptation of the Carbon�14 Method for the Measurement of 697
Coccolith Production in Coccolithus huxleyi, Physiol. Plant., 16, 186-200. doi: 698
10.1111/j.1399-3054.1963.tb08302.x, 1963. 699
Biogeosciences Discuss., https://doi.org/10.5194/bg-2019-4Manuscript under review for journal BiogeosciencesDiscussion started: 15 February 2019c© Author(s) 2019. CC BY 4.0 License.
Page 34
34
Paasche, E., Brubak, S., Skattebøl, S., Young, J. R., and Green, J. C.: Growth and 700
calcification in the coccolithophorid Emiliania huxleyi (Haptophyceae) at low 701
salinities, Phycologia., 35, 394-403. doi: 10.2216/i0031-8884-35-5-394.1, 1996. 702
Paasche, E.: A review of the coccolithophorid Emiliania huxleyi (Prymnesiophyceae), 703
with particular reference to growth, coccolith formation, and 704
calcification-photosynthesis interactions, Phycologia., 40, 503-529, doi: 705
10.2216/i0031-8884-40-6-503.1, 2001. 706
Poulton, A. J., Adey, T. R., Balch, W. M., and Holligan, P. M.: Relating 707
coccolithophore calcification rates to phytoplankton community dynamics: 708
Regional differences and implications for carbon export, Deep-Sea Res. II, 54, 709
538-557. doi: 10.1016/j.dsr2.2006.12.003, 2007. 710
Qi, D., Chen, L., Chen, B., Gao, Z., Zhong, W., and Feely, R. A., et al.: Increase in 711
acidifying water in the western Arctic ocean. Nat Clim Change, 7, 195-199. doi: 712
10.1038/nclimate3228, 2017. 713
Raven, J., and Crawfurd, K.: Environmental controls on coccolithophore 714
calcification, Mar. Ecol. Prog., 470, 137-166. doi: 10.3354/meps09993, 2012. 715
Ridgwell, A.: A Mid Mesozoic Revolution in the regulation of ocean chemistry. Mar. 716
Geol., 217, 339-357, doi: 10.1016/j.margeo.2004.10.036, 2005. 717
Riebesell, U., Zondervan, I., Rost, B., Tortell, P. D., Zeebe, R. E., and Morel, F. M.: 718
Reduced calcification of marine plankton in response to increased atmospheric 719
CO2, Nature 407, 364-367, doi: 10.1038/35030078, 2000. 720
Riebesell, U., Bellerby, R. G., Engel, A., Fabry, V. J., Hutchins, D. A., Reusch, T. B., 721
Biogeosciences Discuss., https://doi.org/10.5194/bg-2019-4Manuscript under review for journal BiogeosciencesDiscussion started: 15 February 2019c© Author(s) 2019. CC BY 4.0 License.
Page 35
35
et al.: Comment on “Phytoplankton Calcification in a High-CO2 722
World” , Science 322, 1466, doi: 10.1126/science.1161096, 2008. 723
Ritchie, R. J.: Consistent sets of Spectrophotometric Chlorophyll Equations for 724
Acetone, Methanol and Ethanol solvents, Photosynth Res., 89, 27-41. doi: 725
10.1007/s11120-006-9065-9, 2006. 726
Rost, B., Riebesell, U., Burkhardt, S., and Sültemeyer, D.: Carbon acquisition of 727
bloom� forming marine phytoplankton. Limnol, Oceanogr., 48, 55-67, doi: 728
10.4319/lo.2003.48.1.0055, 2003. 729
Rost, B., and Riebesell, U.: Coccolithophores and the biological pump: responses to 730
environmental changes, In Thierstein HR, Young JR (eds), 731
Coccolithophores—From Molecular Processes to Global Impact, Berlin: 732
Springer 76-99, 2004. 733
Sabine, C. L., Feely, R. A., Gruber, N., Key, R. M., Lee, K., and Bullister, J. L., et al.: 734
The Oceanic Sink for Anthropogenic CO2, Science 305, 367-371. doi: 735
10.1126/science.1097403, 2004. 736
Saruwatari, K., Satoh, M., Harada, N., Suzuki, I., and Shiraiwa, Y.: Change in 737
coccolith morphology by responding to temperature and salinity in 738
coccolithophore Emiliania huxleyi (Haptophyta) isolated from the Bering and 739
Chukchi seas, Biogeosci Discuss., 12, 17751-17780, doi: 740
10.5194/bgd-12-17751-201, 2015. 741
Schouten, S., Ossebaar, J., Schreiber, K., Kienhuis, M. V. M., Langer, G., and 742
Benthien, A., et al.: The effect of temperature, salinity and growth rate on the 743
Biogeosciences Discuss., https://doi.org/10.5194/bg-2019-4Manuscript under review for journal BiogeosciencesDiscussion started: 15 February 2019c© Author(s) 2019. CC BY 4.0 License.
Page 36
36
stable hydrogen isotopic composition of long chain alkenones produced by 744
Emiliania huxleyi and Gephyrocapsa oceanica. Biogeosci Discuss., 2, 745
1681-1695, doi: 10.5194/bg-3-113-2006, 2006. 746
Schulz, K. G., Rost, B., Burkhardt, S., Riebesell, U., Thoms, S., and Wolf-Gladrow, D. 747
A.: The effect of iron availability on the regulation of inorganic carbon 748
acquisition in the coccolithophore Emiliania huxleyi and the significance of 749
cellular compartmentation for stable carbon isotope fractionation. Geochim, 750
Cosmochim, Acta 71, 5301-5312. doi: 10.1016/j.gca.2007.09.012, 2007. 751
Sekino, K., and Shiraiwa, Y.: Accumulation and utilization of dissolved inorganic 752
carbon by a marine unicellular coccolithophorid, Emiliania huxleyi, Plant 753
Physiol., 35, 353-361. doi: 10.1093/oxfordjournals.pcp.a078603, 1994. 754
Sett, S., Bach, L. T., Kai, G. S., Kochklavsen, S., Lebrato, M., & Riebesell, U.: 755
Temperature modulates coccolithophorid sensitivity of growth, photosynthesis 756
and calcification to increasing seawater pCO2, Plos One 9, e88308, doi: 757
10.1371/journal.pone.0088308, 2014. 758
Shi, D., Xu, Y., and Morel, F. M. M.: Effects of the pH/pCO2 control method on 759
medium chemistry and phytoplankton growth, Biogeosciences 6, 1199-1207. 760
doi: 10.5194/bg-6-1199-2009, 2009. 761
Sikes, C. S., and Wilbur, K. M.: Functions of coccolith formation, Limnol. Oceanogr., 762
27, 18-26. doi: 10.4319/lo.1982.27.1.0018, 1982. 763
Stojkovic, S., Beardall, J., and Matear, R.: CO2-concentrating mechanisms in three 764
southern hemisphere strains of Emiliania huxleyi, J. Phycol., 49, 670-679, doi: 765
Biogeosciences Discuss., https://doi.org/10.5194/bg-2019-4Manuscript under review for journal BiogeosciencesDiscussion started: 15 February 2019c© Author(s) 2019. CC BY 4.0 License.
Page 37
37
10.1111/jpy.12074, 2013. 766
Strickland, J. D. H., and Parsons, T. R.: A practical handbook of seawater 767
analysis. Bulletin, 167,1972. 768
Suffrian, K., Schulz, K. G., Gutowska, M. A., Riebesell, U., and Bleich, M.: Cellular 769
pH measurements in Emiliania huxleyi reveal pronounced membrane proton 770
permeability, New Phytol., 190, 595-608, doi: 771
10.1111/j.1469-8137.2010.03633.x, 2011. 772
Sunda, W. G., Price, N. M., and Morel, F. M.: Trace metal ion buffers and their use in 773
culture studies, in Algal culturing techniques, Robert A. Andersen (Academic 774
Press), 4, 35-63, 2005. 775
Taucher, J., & Oschlies, A.: Can we predict the direction of marine primary 776
production change under global warming? Geophys. Res. Lett., 38, 104-113. doi: 777
10.1029/2010GL045934, 2011. 778
Taylor, A. R., Chrachri, A., Wheeler, G., Goddard, H., & Brownlee, C.: A 779
Voltage-Gated H+ Channel Underlying pH Homeostasis in Calcifying 780
Coccolithophores, Plos Biology 9, e1001085, doi: 10.1371/journal.pbio.1001085, 781
2011. 782
Tyrrell, T., Schneider, B., Charalampopoulou, A., and Riebesell, U.: Coccolithophores 783
and calcite saturation state in the Baltic and Black seas, Biogeosciences, 5, 784
485-494. doi: 10.5194/bgd-4-3581-2007, 2007. 785
Wal, P. V. D., Kempers, R. S., and Veldhuis, M.: Production and downward flux of 786
organic matter and calcite in a North sea bloom of the coccolithophore Emiliania 787
Biogeosciences Discuss., https://doi.org/10.5194/bg-2019-4Manuscript under review for journal BiogeosciencesDiscussion started: 15 February 2019c© Author(s) 2019. CC BY 4.0 License.
Page 38
38
huxleyi, Mar. Ecol. Prog., 126, 247-265. doi: 10.3354/meps126247, 1995. 788
Werdan, K., Heldt, H. W., and Milovancev, M: The role of pH in the regulation of 789
carbon fixation in the chloroplast stroma. Studies on CO2 fixation in the light and 790
dark, Biochim. Biophys. Acta 396, 276-292, doi: 791
10.1016/0005-2728(75)90041-9, 1975. 792
Winter, A., Jordan, R. W., and Roth, P. H.: “Biogeography of coccolithophores in 793
ocean waters,” in Coccolithophores. Amos Winter and William G. Siesser (eds) , 794
Cambridge University Press, UK, p161-177, 1994. 795
Wulff, A., Karlberg, M., Olofsson, M., Torstensson, A., Riemann, L., and Steinhoff, F., 796
et al.: Climate-driven change in a Baltic sea summer microplanktonic community 797
– desalination play a more important role than ocean acidification, Biogeosci 798
Discuss., 1-32, doi: 10.5194/bg-2016-383, 2016. 799
Xu, K., and Gao, K.: Reduced calcification decreases photoprotective capability in the 800
coccolithophorid Emiliania huxleyi, Plant Physiol., 53, 1267-1274, doi: 801
10.1093/pcp/pcs066, 2012. 802
Zondervan, I., Rost, B., and Riebesell, U.: Effect of CO2 concentration on the 803
PIC/POC ratio in the coccolithophore Emiliania huxleyi grown under 804
light-limiting conditions and different daylengths, J. Exp. Mar. Biol. Ecol., 272, 805
55-70, doi: 10.1016/S0022-0981(02)00037-0, 2002806
Biogeosciences Discuss., https://doi.org/10.5194/bg-2019-4Manuscript under review for journal BiogeosciencesDiscussion started: 15 February 2019c© Author(s) 2019. CC BY 4.0 License.
Page 39
39
Figure captions 807
Figure 1. Specific growth rates (a) and cell diameters (b) of Emiliania huxleyi at three 808
salinities (LC, open circles; HC, solid squares). The dashed line is the linear 809
regression result of the growth rates under LC (y= -0.01142x + 1.43055, R2 = 0.88). 810
Values are means ± SD of triplicate cultures. Symbols with different lowercase letters 811
indicate significant differences (p < 0.05) among different treatments. 812
813
Figure 2. Chl a (a), Chl c (b) and Carotenoids (c) contents of Emiliania huxleyi at 814
three salinities (LC, open circles; HC, solid squares). Two dashed lines are the linear 815
regression results of the chlorophyll a and carotenoids contents under HC respectively. 816
( y= -0.00562x + 0.23105, R2 = 0.94; y= -0.00681x + 0.28755, R2 = 0.99). Values are 817
means ± SD of triplicate cultures. Symbols with different lowercase letters indicate 818
significant differences (p < 0.05) among different treatments. 819
820
Figure 3. Maximum (a) and effective photochemical quantum yields (b) of Emiliania 821
huxleyi at three salinities (LC, open circles; HC, solid squares). Values are means ± 822
SD of triplicate cultures. Symbols with different lowercase letters indicate significant 823
differences (p < 0.05) among different treatments. 824
825
Figure 4. Photosynthetic rates (a), calcification rates (b) at 6 h after the onset of light 826
and calcification to photosynthesis ratio—C: P (c) of three salinities (LC, open circles; 827
HC, solid squares). The dash-dotted line and solid line are the linear regression results 828
Biogeosciences Discuss., https://doi.org/10.5194/bg-2019-4Manuscript under review for journal BiogeosciencesDiscussion started: 15 February 2019c© Author(s) 2019. CC BY 4.0 License.
Page 40
40
of the photosynthetic rates under LC and HC, respectively (y= -0.03624x + 1.49612, 829
R2 = 0.89; y= -0.03173x + 1.22979, R2 = 0.99). Values are means ± SD of triplicate 830
cultures. Symbols with different lowercase letters indicate significant differences (p < 831
0.05) among different treatments. 832
833
Figure 5. Changes in effective photochemical quantum yield of cells grown under 834
ambient (400 µatm, LC, a) and elevated CO2 (1000 µatm, HC, b) when exposed to 835
solar radiation for 48 min (800 µmol photons m−2 s−1) under three salinity treatments: 836
25‰ (open triangles), 30‰ (half solid circles) and 35‰ (solid squares). Values are 837
means ± SD of triplicate cultures. Asterisks represent significant differences (p < 0.05) 838
among three salinity treatments. 839
840
Figure 6. Rate of Repair r (a), damage k (b) and the ratio of repair:damage (c) after 841
exposure to solar radiation for 48 min (800 µmol photons m−2 s−1) under different 842
treatments (LC, open circles; HC, solid squares). Values are means ± SD of triplicate 843
cultures. Symbols with different lowercase letters indicate significant differences (p < 844
0.05) among different treatment845
Biogeosciences Discuss., https://doi.org/10.5194/bg-2019-4Manuscript under review for journal BiogeosciencesDiscussion started: 15 February 2019c© Author(s) 2019. CC BY 4.0 License.
Page 41
41
Tabl
e 1.
Car
bona
te c
hem
istry
par
amet
ers
of c
ultu
re m
edia
bef
ore
inoc
ulat
ion
(alre
ady
equi
libra
ted
with
the
am
bien
t or
elev
ated
CO
2 le
vels
). 84
6
Valu
es a
re m
eans
± S
D o
f trip
licat
e cu
lture
s. 84
7
Trea
tmen
t PH
NB
S
TA
(µm
ol k
g-1)
DIC
(µm
ol k
g-1)
HC
O3-
(µm
ol k
g-1)
CO
32-
(µm
ol k
g-1)
CO
2
(µm
ol k
g-1)
pCO
2
(ppm
)
25‰
LC
8.
01 ±
0.0
1 14
80.2
5 ±
8.64
13
61.0
7 ±
10.2
0 12
74.6
2 ±
10.5
0 74
.20
± 0.
60
12.2
1 ±
0.30
38
8.24
± 9
.44
25‰
HC
7.
61 ±
0.0
1 15
10.5
2 ±
23.7
4 14
79.5
9 ±
25.1
5 14
12.8
4 ±
24.0
2 33
.52
± 0.
02
33.2
3 ±
1.11
10
35.8
4 ±
33.9
7
30‰
LC
8.
07 ±
0.0
1 17
35.0
8 ±
8.33
15
55.2
0 ±
10.4
8 14
32.1
5 ±
11.1
6 11
2.05
± 0
.95
11.0
0 ±
0.26
36
0.24
± 8
.62
30‰
HC
7.
68 ±
0.0
1 17
87.4
0 ±
19.0
6 17
25.0
8 ±
20.6
3 16
41.8
0 ±
19.9
7 52
.33
± 0.
21
30.9
5 ±
0.88
99
8.16
± 2
7.98
35‰
LC
8.
09 ±
0.0
1 19
77.9
5 ±
0.64
17
49.5
0 ±
3.86
15
94.0
3 ±
5.49
14
4.05
± 1
.85
11.4
2 ±
0.22
38
4.45
± 7
.53
35‰
HC
7.
71 ±
0.0
1 20
19.1
3 ±
0.66
19
31.7
5 ±
2.83
18
31.3
0 ±
3.26
68
.99
± 1.
00
31.4
6 ±
0.57
10
45.5
3 ±
18.4
9
84
8
84
9
85
0
Biogeosciences Discuss., https://doi.org/10.5194/bg-2019-4Manuscript under review for journal BiogeosciencesDiscussion started: 15 February 2019c© Author(s) 2019. CC BY 4.0 License.
Page 42
42
Tabl
e 2.
Car
bona
te c
hem
istry
par
amet
ers o
f cul
ture
med
ia o
n th
e la
st d
ay o
f inc
ubat
ion.
Val
ues a
re m
eans
± S
D o
f trip
licat
e cu
lture
s. 85
1
Trea
tmen
t PH
NB
S TA
D
IC
HC
O3-
CO
32-
CO
2
(µm
ol k
g-1)
(µm
ol k
g-1)
(µm
ol k
g-1)
(µm
ol k
g-1)
(µm
ol k
g-1)
25‰
LC
7.
80 ±
0.0
2 14
31.0
4 ±
87.9
4 13
62.0
3 ±
81.8
9 12
94.7
8 ±
76.6
9 47
.55
± 4.
96
19.7
0 ±
0.27
25‰
HC
7.
64 ±
0.0
2 14
87.4
2 ±
15.3
4 14
51.5
3 ±
15.5
4 13
85.8
9 ±
14.8
7 34
.85
± 1.
38
30.7
9 ±
1.32
30‰
LC
7.
96 ±
0.0
1 17
04.1
4 ±
107.
22
1564
.82
± 99
.62
1461
.77
± 91
.74
88.5
4 ±
7.72
14
.51
± 0.
80
30‰
HC
7.
65 ±
0.0
2 17
43.8
0 ±
21.7
8 16
91.4
9 ±
27.1
0 16
11.2
2 ±
26.5
2 47
.04
± 2.
01
33.2
3 ±
2.44
35‰
LC
8.
00 ±
0.0
7 19
69.4
7 ±
7.73
17
75.2
5 ±
21.2
9 16
36.8
7 ±
35.5
4 12
4.21
± 1
6.66
14
.18
± 2.
39
35‰
HC
7.
72 ±
0.0
1 20
02.7
1 ±
3.20
19
09.9
5 ±
7.89
18
09.0
4 ±
8.87
71
.11
± 2.
16
29.8
1 ±
1.19
85
2
85
3
85
4
Biogeosciences Discuss., https://doi.org/10.5194/bg-2019-4Manuscript under review for journal BiogeosciencesDiscussion started: 15 February 2019c© Author(s) 2019. CC BY 4.0 License.
Page 43
43
Biogeosciences Discuss., https://doi.org/10.5194/bg-2019-4Manuscript under review for journal BiogeosciencesDiscussion started: 15 February 2019c© Author(s) 2019. CC BY 4.0 License.
Page 44
44
Biogeosciences Discuss., https://doi.org/10.5194/bg-2019-4Manuscript under review for journal BiogeosciencesDiscussion started: 15 February 2019c© Author(s) 2019. CC BY 4.0 License.
Page 45
45
Biogeosciences Discuss., https://doi.org/10.5194/bg-2019-4Manuscript under review for journal BiogeosciencesDiscussion started: 15 February 2019c© Author(s) 2019. CC BY 4.0 License.
Page 46
46
Biogeosciences Discuss., https://doi.org/10.5194/bg-2019-4Manuscript under review for journal BiogeosciencesDiscussion started: 15 February 2019c© Author(s) 2019. CC BY 4.0 License.
Page 47
47
Biogeosciences Discuss., https://doi.org/10.5194/bg-2019-4Manuscript under review for journal BiogeosciencesDiscussion started: 15 February 2019c© Author(s) 2019. CC BY 4.0 License.
Page 48
48
Biogeosciences Discuss., https://doi.org/10.5194/bg-2019-4Manuscript under review for journal BiogeosciencesDiscussion started: 15 February 2019c© Author(s) 2019. CC BY 4.0 License.


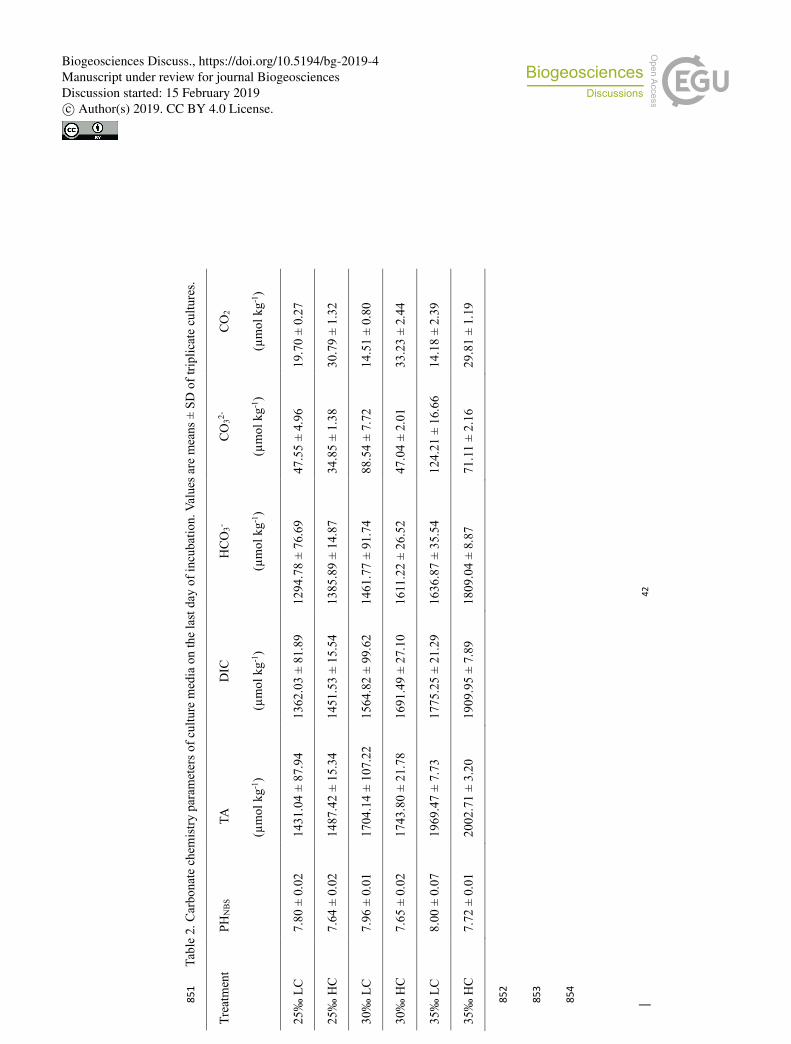


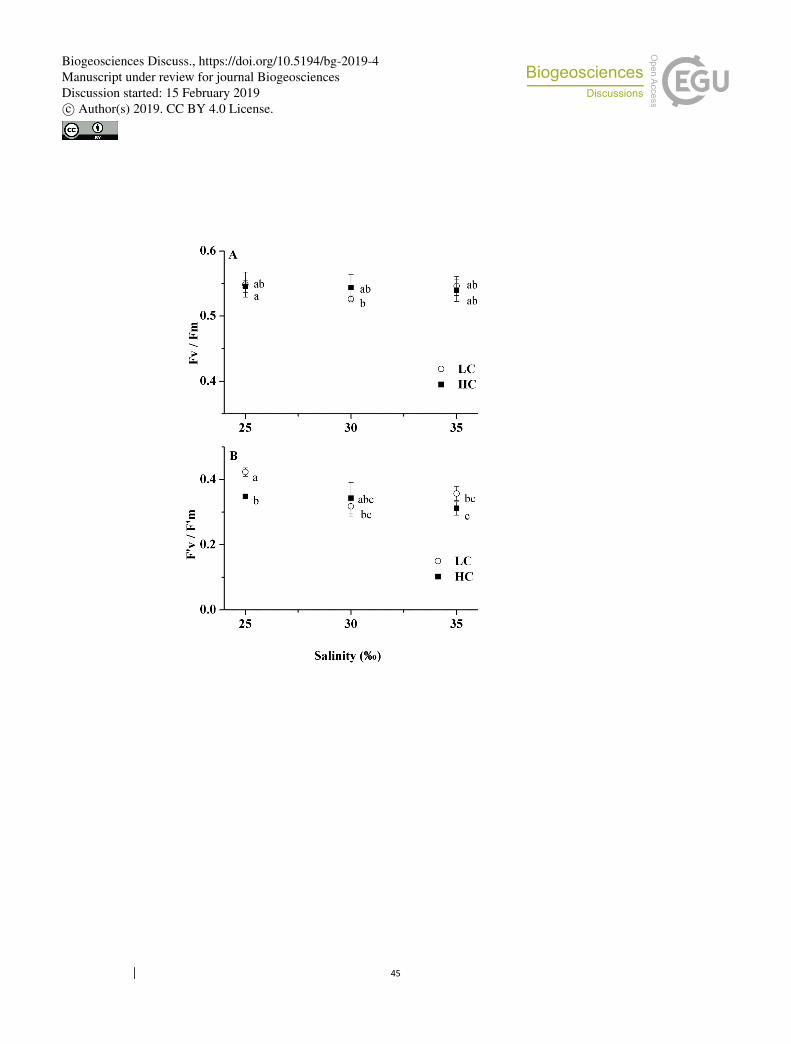

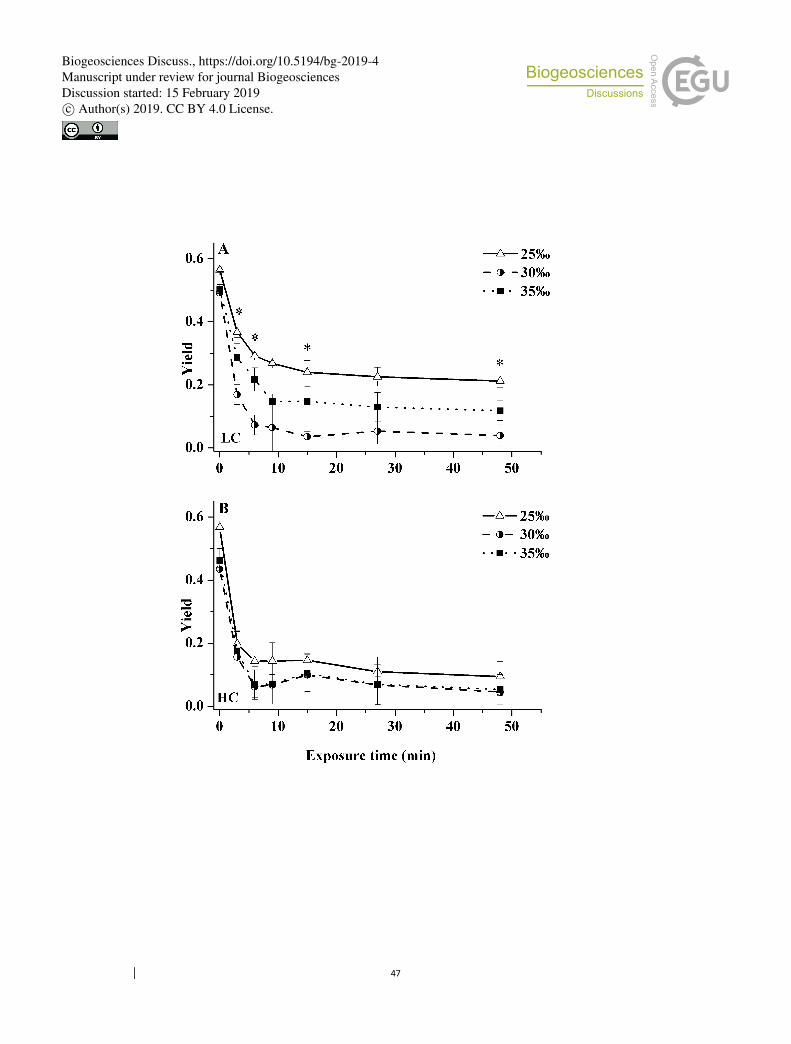


![20140714114906[Ingles] Industria Oceanica e Polo Naval [Flip]](https://static.documents.pub/doc/80x56/563db9df550346aa9aa0b0db/20140714114906ingles-industria-oceanica-e-polo-naval-flip.jpg)


![Ocean Acidification and Its Potential Effects on … where K ∗ sp is the stoichiometric solubility prod-uct for CaCO3 and [Ca2+] and [CO2− 3] are the in situ ... Gephyrocapsa oceanica](https://static.documents.pub/doc/80x56/5cd770c388c993ad7c8c1bf2/ocean-acidification-and-its-potential-effects-on-where-k-sp-is-the-stoichiometric.jpg)
