Page | 1 Bioinformatics and Computer Science Lab Rotation Supervisor: Prof. Ivo F. Sbalzarini & Dr. Sylvain Reboux Submitted by: Saumya Gupta Master Computational Biology and Bioinformatics 10-939-320
Transcript
Page | 1
Bioinformatics and Computer Science Lab
Rotation
Supervisor:
Prof. Ivo F. Sbalzarini & Dr. Sylvain Reboux
Submitted by:
Saumya Gupta
Master Computational Biology and Bioinformatics
10-939-320
Page | 2
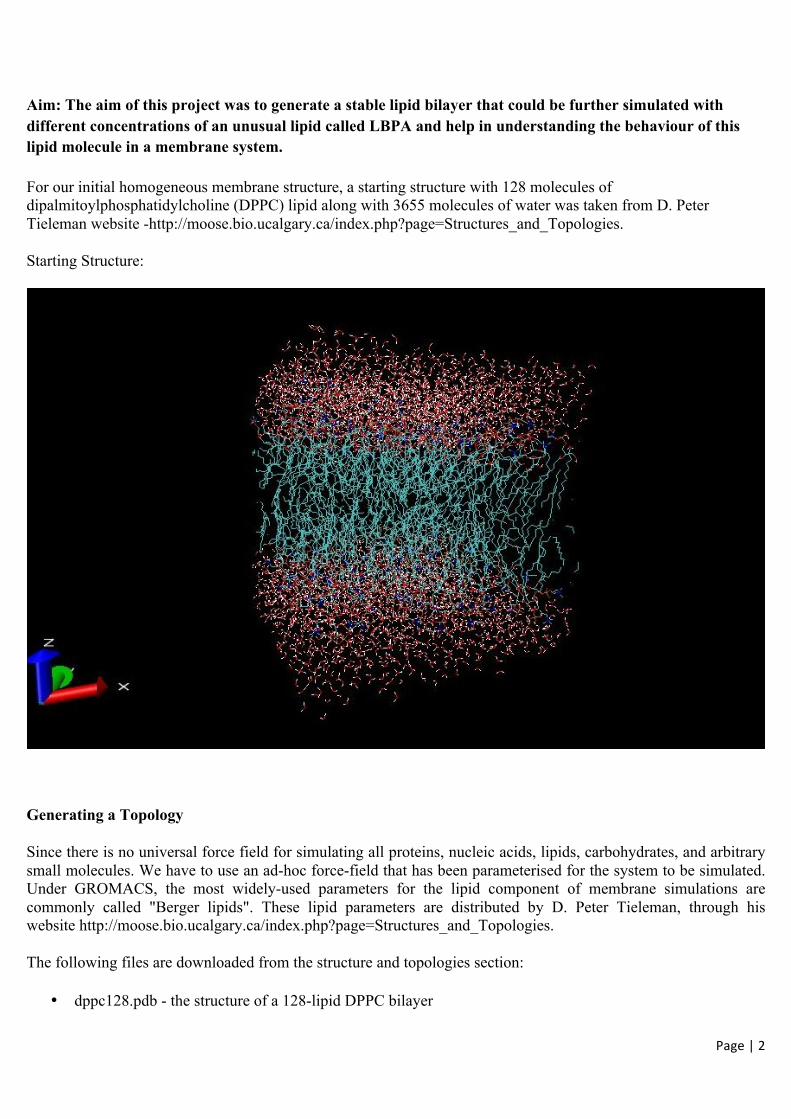
Aim: The aim of this project was to generate a stable lipid bilayer that could be further simulated with different concentrations of an unusual lipid called LBPA and help in understanding the behaviour of this lipid molecule in a membrane system.
For our initial homogeneous membrane structure, a starting structure with 128 molecules of dipalmitoylphosphatidylcholine (DPPC) lipid along with 3655 molecules of water was taken from D. Peter Tieleman website -http://moose.bio.ucalgary.ca/index.php?page=Structures_and_Topologies.
Starting Structure:
Generating a Topology
Since there is no universal force field for simulating all proteins, nucleic acids, lipids, carbohydrates, and arbitrary small molecules. We have to use an ad-hoc force-field that has been parameterised for the system to be simulated. Under GROMACS, the most widely-used parameters for the lipid component of membrane simulations are commonly called "Berger lipids". These lipid parameters are distributed by D. Peter Tieleman, through his website http://moose.bio.ucalgary.ca/index.php?page=Structures_and_Topologies.
The following files are downloaded from the structure and topologies section:
• dppc128.pdb - the structure of a 128-lipid DPPC bilayer
Page | 3
• dppc.itp - the moleculetype definition for DPPC • lipid.itp - Berger lipid parameters
Essentially, lipid.itp contains all the atom types, nonbonded parameters, and bonded parameters for a large class of lipids but we cannot simply #include "lipid.itp" within our topology, since it is at the same level (precedence) as forcefield.itp.
To use the parameters in lipid.itp, we made some changes to our pre-packaged gromos53a6.ff/forcefield.itp by making a separate copy of “gromos53a6.ff” in our working directory. It consists of following the files:
Then, the entries in the [atomtypes] (with atomic numbers), [nonbond_params], and [pairtypes] sections from lipid.itp were copied and pasted into the appropriate headings within ffnonbonded.itp.
In the [nonbond_params] section, non-bonded interactions involving atom type HW are also present; since these are all zero, they can be either deleted or otherwise renamed to H to be consistent with the GROMOS96 53A6 naming convention avoiding error from grompp.
Similarly the contents of the [ dihedraltypes ] were appended to the corresponding section of ffbonded.itp.
Lastly, the topology file was written for our system including all the needed files for the forcefield parameters. It is as follows:
; topology for a pure DPPC bilayer with 128 lipids and 3655 SPC water ; molecules #include "gromos53a6_lipid.ff/forcefield.itp" #include "dppc.itp" ;Include water topologies #include "gromos53a6_lipid.ff/spc.itp" ; Include ion topologies #include "gromos53a6_lipid.ff/ions.itp" [ system ] ; name Pure DPPC bilayer with 128 lipids and 3655 water molecules [ molecules ]
Page | 4
; name number DPPC 128 SOL 3655 Energy Minimization:
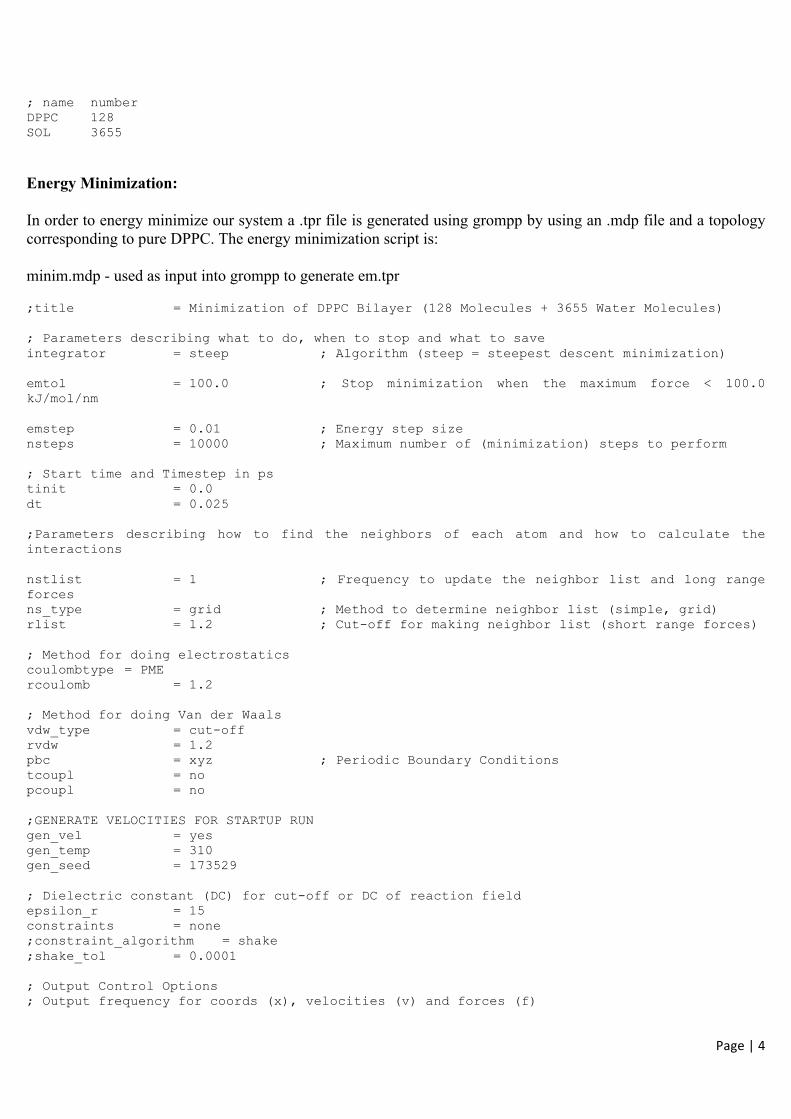
In order to energy minimize our system a .tpr file is generated using grompp by using an .mdp file and a topology corresponding to pure DPPC. The energy minimization script is:
minim.mdp - used as input into grompp to generate em.tpr ;title = Minimization of DPPC Bilayer (128 Molecules + 3655 Water Molecules) ; Parameters describing what to do, when to stop and what to save integrator = steep ; Algorithm (steep = steepest descent minimization) emtol = 100.0 ; Stop minimization when the maximum force < 100.0 kJ/mol/nm emstep = 0.01 ; Energy step size nsteps = 10000 ; Maximum number of (minimization) steps to perform ; Start time and Timestep in ps tinit = 0.0 dt = 0.025 ;Parameters describing how to find the neighbors of each atom and how to calculate the interactions nstlist = 1 ; Frequency to update the neighbor list and long range forces ns_type = grid ; Method to determine neighbor list (simple, grid) rlist = 1.2 ; Cut-off for making neighbor list (short range forces) ; Method for doing electrostatics coulombtype = PME rcoulomb = 1.2 ; Method for doing Van der Waals vdw_type = cut-off rvdw = 1.2 pbc = xyz ; Periodic Boundary Conditions tcoupl = no pcoupl = no ;GENERATE VELOCITIES FOR STARTUP RUN gen_vel = yes gen_temp = 310 gen_seed = 173529 ; Dielectric constant (DC) for cut-off or DC of reaction field epsilon_r = 15 constraints = none ;constraint_algorithm = shake ;shake_tol = 0.0001 ; Output Control Options ; Output frequency for coords (x), velocities (v) and forces (f)
Page | 5
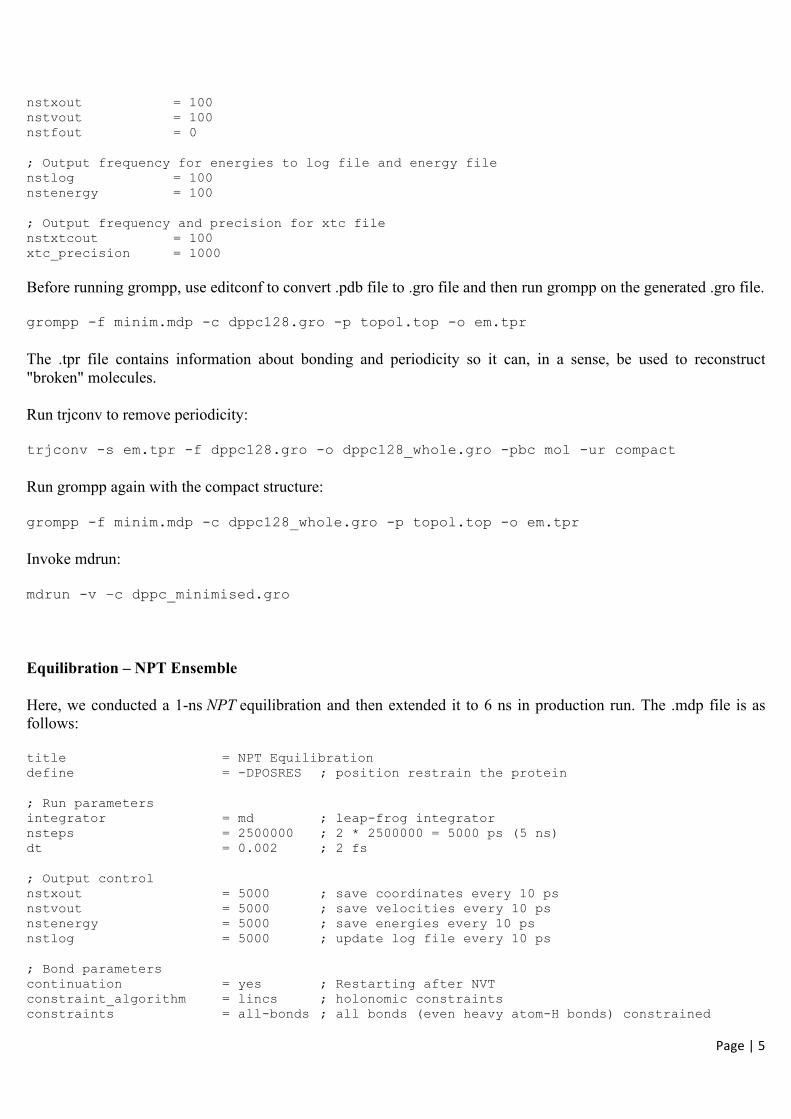
nstxout = 100 nstvout = 100 nstfout = 0 ; Output frequency for energies to log file and energy file nstlog = 100 nstenergy = 100 ; Output frequency and precision for xtc file nstxtcout = 100 xtc_precision = 1000 Before running grompp, use editconf to convert .pdb file to .gro file and then run grompp on the generated .gro file. grompp -f minim.mdp -c dppc128.gro -p topol.top -o em.tpr
The .tpr file contains information about bonding and periodicity so it can, in a sense, be used to reconstruct "broken" molecules.
Here, we conducted a 1-ns NPT equilibration and then extended it to 6 ns in production run. The .mdp file is as follows:
title = NPT Equilibration define = -DPOSRES ; position restrain the protein ; Run parameters integrator = md ; leap-frog integrator nsteps = 2500000 ; 2 * 2500000 = 5000 ps (5 ns) dt = 0.002 ; 2 fs ; Output control nstxout = 5000 ; save coordinates every 10 ps nstvout = 5000 ; save velocities every 10 ps nstenergy = 5000 ; save energies every 10 ps nstlog = 5000 ; update log file every 10 ps ; Bond parameters continuation = yes ; Restarting after NVT constraint_algorithm = lincs ; holonomic constraints constraints = all-bonds ; all bonds (even heavy atom-H bonds) constrained
Page | 6
lincs_iter = 1 ; accuracy of LINCS lincs_order = 4 ; also related to accuracy ; Neighborsearching ns_type = grid ; search neighboring grid cells nstlist = 5 rlist = 1.2 ; short-range neighborlist cutoff (in nm) rcoulomb = 1.2 ; short-range electrostatic cutoff (in nm) rvdw = 1.2 ; short-range van der Waals cutoff (in nm) ; Electrostatics Coulombtype = PME ; Particle Mesh Ewald for long-range electrostatics pme_order = 4 ; cubic interpolation fourierspacing = 0.16 ; grid spacing for FFT ; Temperature coupling is on tcoupl = Nose-Hoover; More accurate thermostat tc-grps = DPPC SOL tau_t = 0.5 0.5 ; time constant, in ps ref_t = 323 323 ; reference temperature, one for each group, in K ; Pressure coupling is on pcoupl = Parrinello-Rahman; Pressure coupling on in NPT pcoupltype = semiisotropic tau_p = 5.0 ; time constant, in ps ref_p = 1.0 1.0 ; reference pressure, x-y, z (in bar) compressibility = 4.5e-5 4.5e-5 ; isothermal compressibility ; Periodic boundary conditions pbc = xyz ; 3-D PBC ; Dispersion correction DispCorr = EnerPres ; account for cut-off vdW scheme ; Velocity generation gen_vel = no ; Velocity generation is off ; COM motion removal ; These options remove motion of the bilayer relative to the solvent/ions nstcomm = 1 comm-mode = Linear comm-grps = DPPC SOL
There are a few options in this .mdp file specific to bilayer simulations:
• tcoupl = Nose-Hoover: The Nosé-Hoover thermostat is used because it produces a correct kinetic ensemble and allows for fluctuations that produce more natural dynamics.
• pcoupltype = semiisotropic: A bilayer should be allowed to deform in the x-y plane independently of the z-axis.
• There are now two values specified for both compressibility and ref_p, corresponding to values for the x-y and zdimensions, respectively.
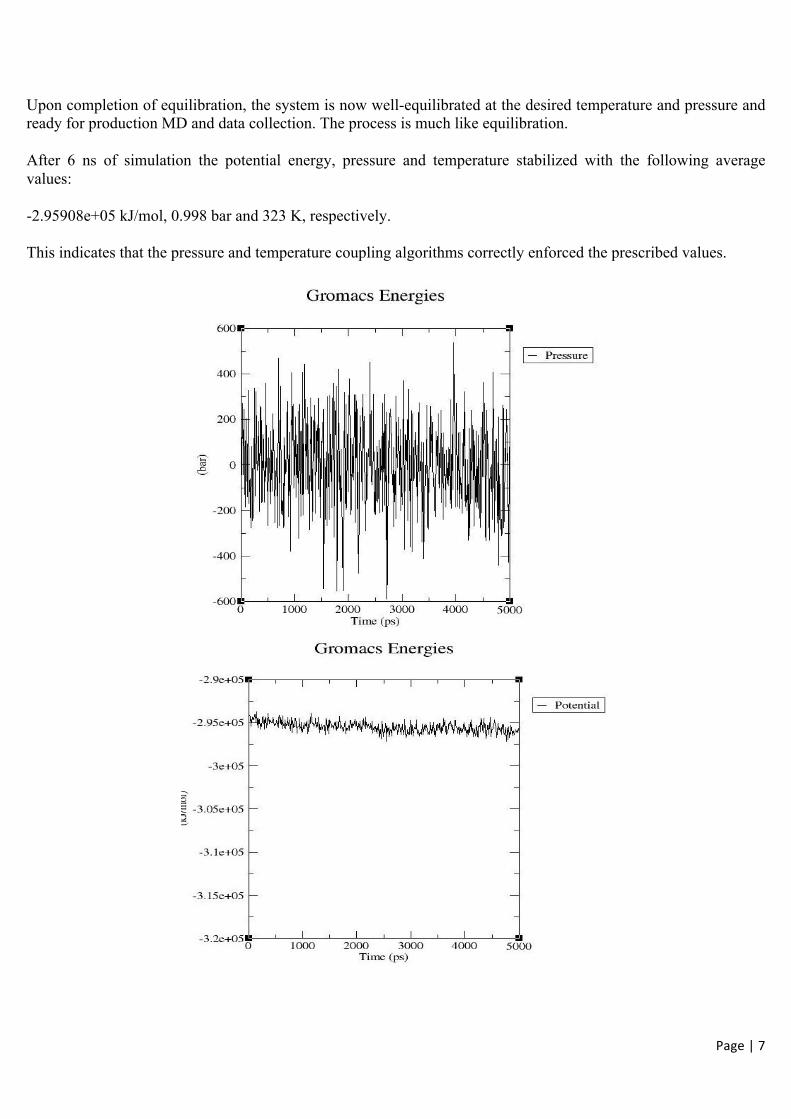
Upon completion of equilibration, the system is now well-equilibrated at the desired temperature and pressure and ready for production MD and data collection. The process is much like equilibration.
After 6 ns of simulation the potential energy, pressure and temperature stabilized with the following average values:
-2.95908e+05 kJ/mol, 0.998 bar and 323 K, respectively.
This indicates that the pressure and temperature coupling algorithms correctly enforced the prescribed values.
Page | 8
The final structure of the bilayer after simulations with X and Y Periodic images:
Analysis of the membrane simulations:
There are several types of analyses that are particularly useful for membrane protein systems like:
1. Deuterium order parameters of the acyl chains 2. Area per lipid headgroup 3. Bilayer thickness (vertical dimension) 4. Packing Parameter
1. Deuterium Order Parameters
For deuterium order parameter analysis, an index group that contains only the carbons along the lipid acyl chains is needed.
To measure deuterium order parameters with the normal to the bilayer along the z-axis, g_order is used:
g_order -s topol.tpr -n sn1.ndx -d z -od deuter_sn1.xvg
Page | 9
Deuterium order parameters can be helpful in verifying whether or not the membrane entered a gel phase during the simulation. The magnitude of SCD quantifies the degree of reorientation which occurs on the NMR time scale, i.e. how ordered the molecules are, and their average orientation with respect to the bilayer normal. Typical values of SCD for fluid phase lipid bilayers range from 0.2 at the top of the fatty acid chains to near zero in the terminal methyl groups [1]. The graph shown also plots the values ranging from 0.2 to 0 with some higher fluctuations i.e the layer entered the gel phase at some points.
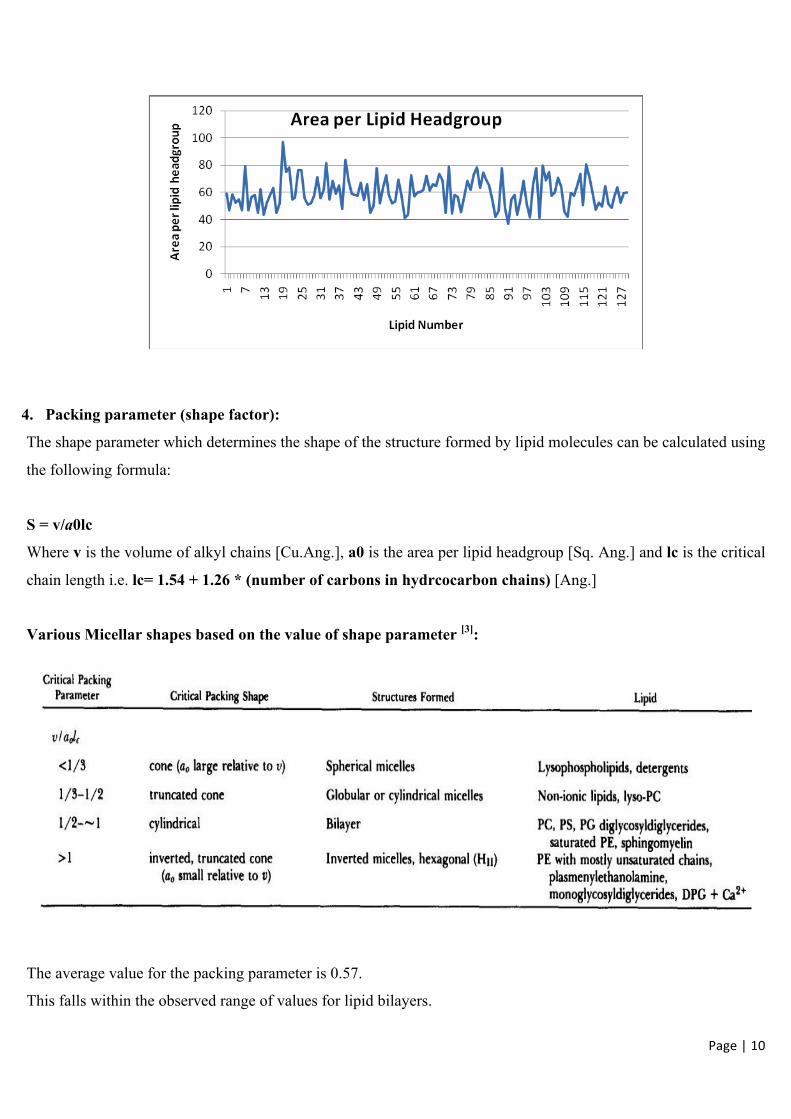
2. & 3. Area per Lipid Headgroup and Bilayer Thickness
There is no GROMACS tool capable of calculating area per lipid headgroup. We calculate it using GRIDMAT-MD.
Analyzing area per lipid headgroup is important so as to verify that your membrane did not inappropriately enter a gel phase during the simulation.
The average value for the area per lipid = 59.97 Å2
This falls within the estimated range of 58-71 Å2 and obtained from various combinations of NMR, neutron, X-ray, and gravimetric measurements for DPPC bilayers [1].
The average value for thickness of the bilayer = 3.89 nm
This nearly corresponds to the experimental value of 3.83 nm obtained for DPPC bilayers [2].
The bilayer thickness has been calculated using a 20x20 grid with a total of 400 iterations and the area per lipid headgroup for a total of 128 lipid molecules using a 200x200 grid.
Page | 10
4. Packing parameter (shape factor):
The shape parameter which determines the shape of the structure formed by lipid molecules can be calculated using
the following formula:
S = v/a0lc
Where v is the volume of alkyl chains [Cu.Ang.], a0 is the area per lipid headgroup [Sq. Ang.] and lc is the critical
chain length i.e. lc= 1.54 + 1.26 * (number of carbons in hydrcocarbon chains) [Ang.]
Various Micellar shapes based on the value of shape parameter [3]:
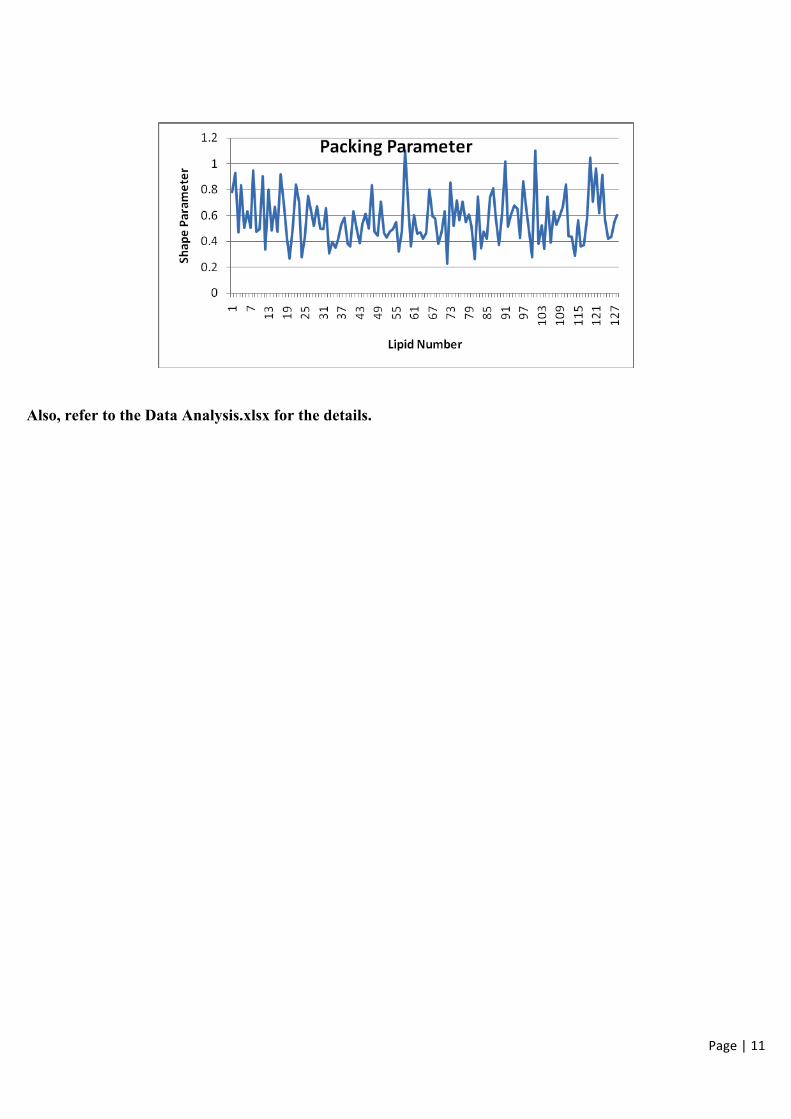
The average value for the packing parameter is 0.57.
This falls within the observed range of values for lipid bilayers.
Page | 11
Also, refer to the Data Analysis.xlsx for the details.
Page | 12
Discussion
In this study, we successfully analysed the dynamics of a lipid bilayer simulated using the molecular dynamic
software package GROMACS. We analysed the trajectories for various parameters such as thickness, area per lipid
headgroup and shape parameter for an individual lipid.
Motions with a range of time constants are present in lipid bilayers, making their theoretical study particularly
challenging. Whereas individual motions such as conformational changes occur on a time scale of tens to hundreds
of picoseconds, the complete rotation of a phospholipid molecule around its long axis requires a few nanoseconds,
and tens of nanoseconds are needed to observe lateral diffusion. Events such as the flip-flop of a lipid molecule
from one leaflet to the opposite one even take place on a typical time scale of minutes to hours.
These simulations can be easily extended to longer times scales (Microseconds) for better understanding and also
exploring other motions of lipids. They can also be performed at different temperatures and hydration numbers in
order to see the effect on the bilayer properties.
The computationally determined observations were within experimental observations thus validating the
computational approach to generate the bilayer and to study its dynamic properties.
Future Work (Suggestions):
The current work could be used as a base to see the comparisons of various parameters of different types of
bilayers at different temperatures and pressures.
It will also be interesting to see the transitions of bilayer from liquid crystalline to gel phase during simulation
when run for considerably large time scales. The transitions to different states may also differ with varying
temperatures and pressures.
The effect of LBPA molecule can also be seen by analysing the change in different parameters at different
concentrations of LBPA. There is a need to formulate a forcefield for LBPA which can be merged with the
Gromacs forcefield. Also, the packing parameter can be very useful in knowing the deviation of the shape of a lipid
from its original as the simulation proceeds and how the neighbouring lipids behave differently as compared to the
distant lipid molecules.
Page | 13
References
[1] Scott E. Feller, Richard M. Venable and Richard W. Pastor Computer Simulation of a DPPC Phospholipid
Bilayer: Structural Changes as a Function of Molecular Surface Area Langmuir 1997, 13: 6555-6561
[2] Rong Chen, David Poger and Alan E. Mark Effect of High Pressure on Fully Hydrated DPPC and POPC
Bilayers J. Phys. Chem. B 2011, 115: 1038–1044
[3] Howard Goldfine Bacterial membranes and lipid packing theory Journal of Lipid Research 1984, 25: 1501
[4] Jeffery B. Klauda, Bernard R. Brooks, and Richard W. Pastor Dynamical Motions of Lipids and a Finite Size
Effect in Simulations of Bilayers J Chem Phys. 2006, 125(14): 144710
[5] Allen, W. J., Lemkul, J. A., and Bevan, D. R. GridMAT-MD: A Grid-based Membrane Analysis Tool for Use
with Molecular Dynamics J. Comput. Chem. 2009, 30 (12): 1952-1958
[6] D. van der Spoel, E. Lindahl, B. Hess, A. R. van Buuren, E. Apol, P. J. Meulenhoff, D. P. Tieleman, A. L. T.
M. Sijbers, K. A. Feenstra, R. van Drunen and H. J. C. Berendsen, Gromacs User Manual version 4.5.4,