+ All Categories
Home > Documents > Bioinspired of Micro-fluidic systems Reach Symposium-2008 Shantanu Bhattacharya Assistant Professor...

Bioinspired of Micro-fluidic systems Reach Symposium-2008 Shantanu Bhattacharya Assistant Professor...

Date post: 25-Dec-2015
Category:
Upload: adela-margaretmargaret-anderson
View: 219 times
Download: 1 times
Share this document with a friend
Popular Tags:
34
Bioinspired of Micro- fluidic systems Reach Symposium-2008 Shantanu Bhattacharya Assistant Professor Department of Mechanical Engineering Indian Institute of Technology Kanpur [email protected] Tel: 0512-259-6056
Transcript

Bioinspired of Micro-fluidic systems Reach Symposium-2008

Shantanu BhattacharyaAssistant Professor

Department of Mechanical EngineeringIndian Institute of Technology Kanpur

[email protected]: 0512-259-6056

• Quite often Nature works at Maximum Achievement at minimum effort level.

• The field of Bio-mimetics is the abstraction of a good design from nature.

• The field of Bio-mimetics started from Giovanni Borelli’s seminal De Motu Animalum of 1680.

The field of Bio-mimetics

Blood Capillaries and Micro-fluidics•The capillaries are the smallest blood vessels that distribute oxygenated blood.

•Inspired by the micro-circulation inside the capillaries and its uses one can think of Micro-fluidics

Properties of Micro flows

•Surface effects become prominent with high surface area to volume ratio.

•Low thermal mass and high heat transfer.

•Low value of Reynolds number and thus laminar flows which only result in diffusional mixing.

•Re is usually less than 100 and often less than 0.1 in micro-devices

Micro-fluidics

Materials in Micro-fluidic devices• Silicon and microelectronic materials• Glass, QuartzAlternate Biochip materials• Polymers– Poly (dimethylsiloxane) (PDMS)– Poly (methyl methacrylate) (PMMA)– Teflon, etc.• Biological Entities– Cells, Proteins, DNA– Frontier of BioMEMS !

Microfluidic device fabrication in Silicon

NEMS/ MEMS silicon fabrication•Conventional and new semiconductor manufacturing techniques are used.

•Etching, Deposition, Photolithography, Oxidation, Epitaxy etc.

•Deep RIE, Thick plating etc.Bulk and surface micromachining.

Device fabrication using polymers

Micro-channel Arrays using Controlled

Etching

1- Dimensional 2- Dimensional 3- Dimensional Cross-sectional View

Real image of micro-channels

after swelling in solvent

Ref: Sharma et. al., Science, 2007

Micro-fluidics and Microsystems

Relationship with the Biological world

•Systems made up of very small components.(micron to nanometer scale)

•Relatively high applicability to the field of life science, biotechnology and medicine.

•That’s why they scale with some of the biological entities.

•Focus of micro-system research is shifting to micro fluidic systems.

Ref :Stephen D. Centuria, Microsystem Design, Kluwer Academic Publishers, Boston / Dordrecht / London

Lectures, from NanoHUB, Purdue University, West Lafayette, Indiana

Bottom up

Content of presentation

• Mimicking Biological architectures for certain engineering end goals.

• Mimicking Biological principles for certain engineering end goals.

• Micro-fluidics and Bio-sensing

•A micro-separation device is realized

•Whole blood enters the device through a 70 microns channel.

•Margination happens and leukocyte distribution is affected .

Bitensky et.al., 2005, Anal. Chem. 77, 933-937

Micro-fluidic Sample Preparator

Microfluidic tectonics: A comprehensive construction platform for microfluidic systems

Beebe et. al., 2000, PNAS, Vol. 97, pp. 13488-13493.

•There are a lot of passive valves in our veins , allowing the fluid flow in only one direction.

•Hydrogel is used to realize a valve which swells and de-swells in different pH’s

Characteristics of bacterial pumps in microfluidic systems

•The growth of flagellum in flagellated bacteria like E. Coli or Serratia Marcescens is a function of glucose conc.

•Flagellated bacteria are used in microchannels to paddle fluids at various flow rates.

Fig. 1 Fig. 2 Fig. 3Kim et.al., NSTI-Nanotech 2005, Vol.1

Nanoscale DNA coulter Counter

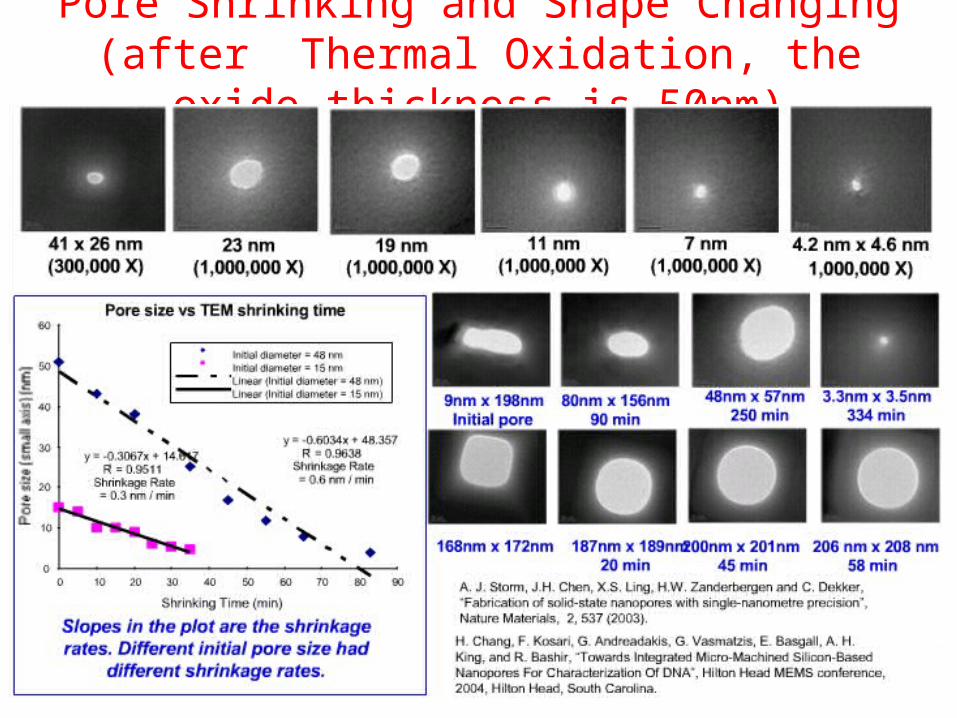
Pore Shrinking and Shape Changing (after Thermal Oxidation, the oxide thickness is 50nm)

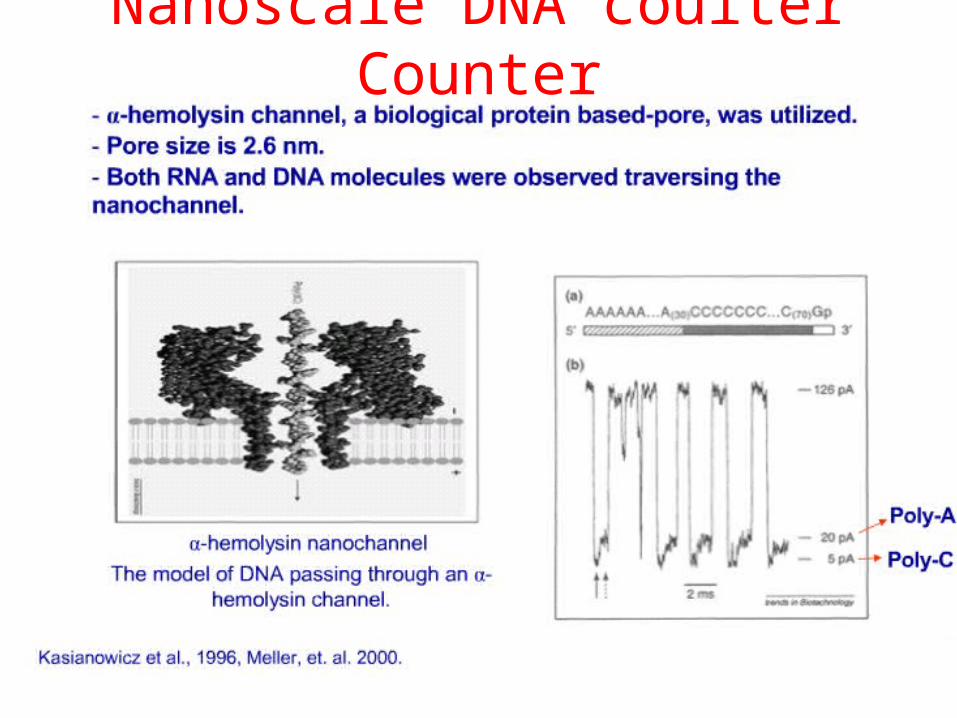
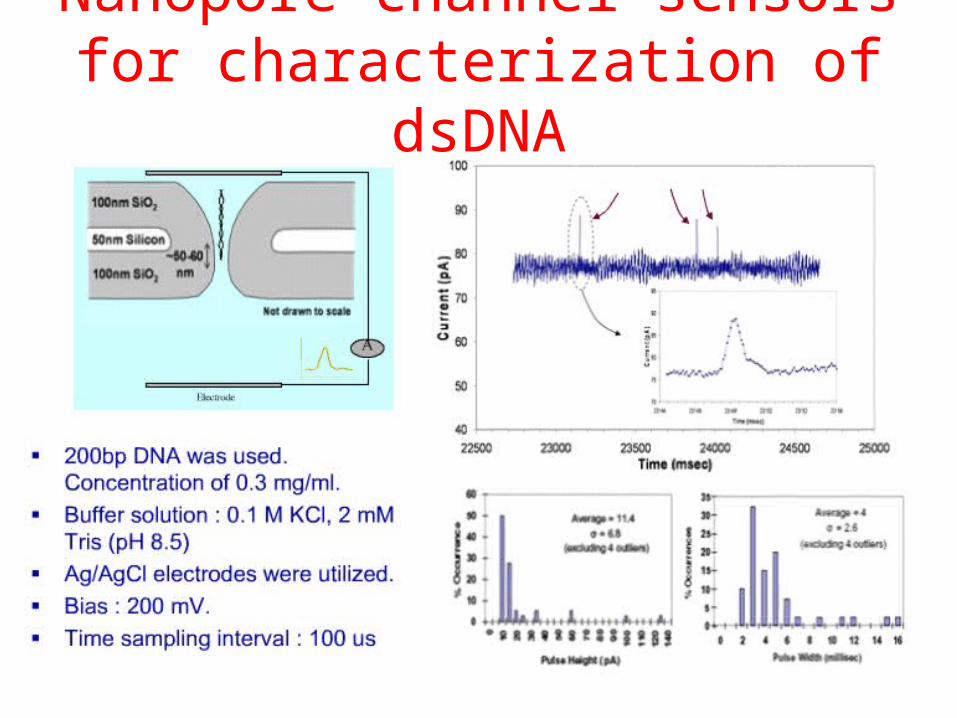
Nanopore channel sensors for characterization of dsDNA

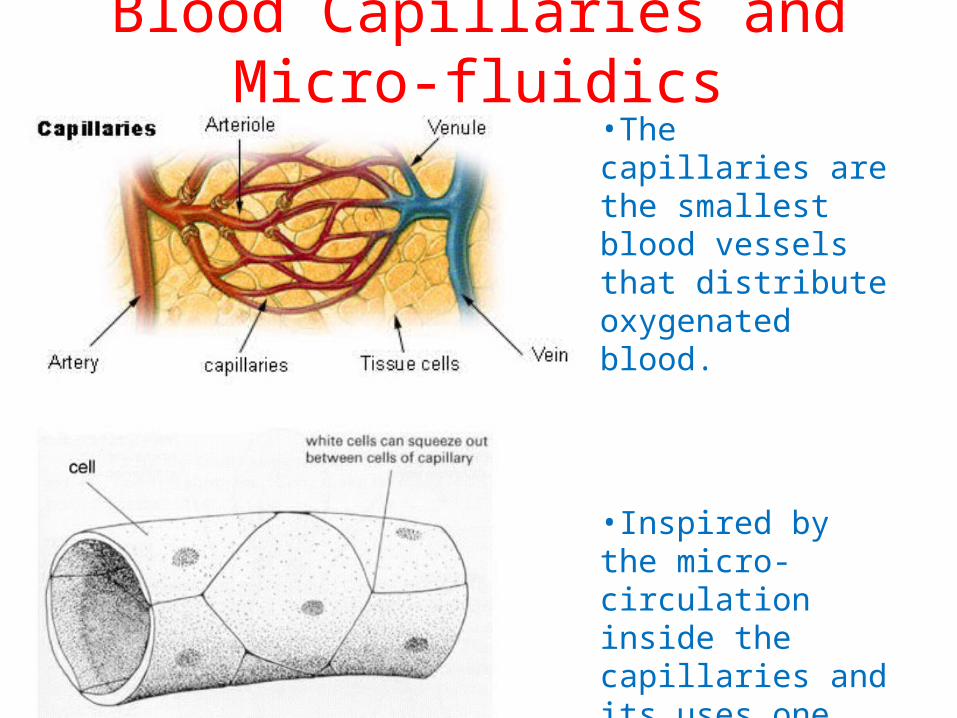
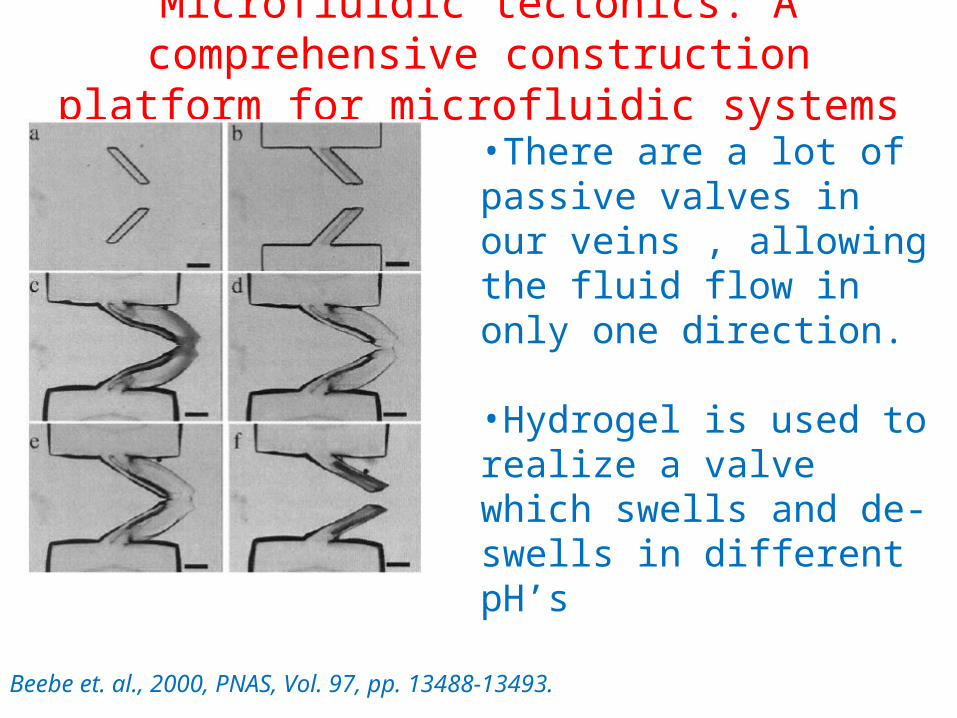
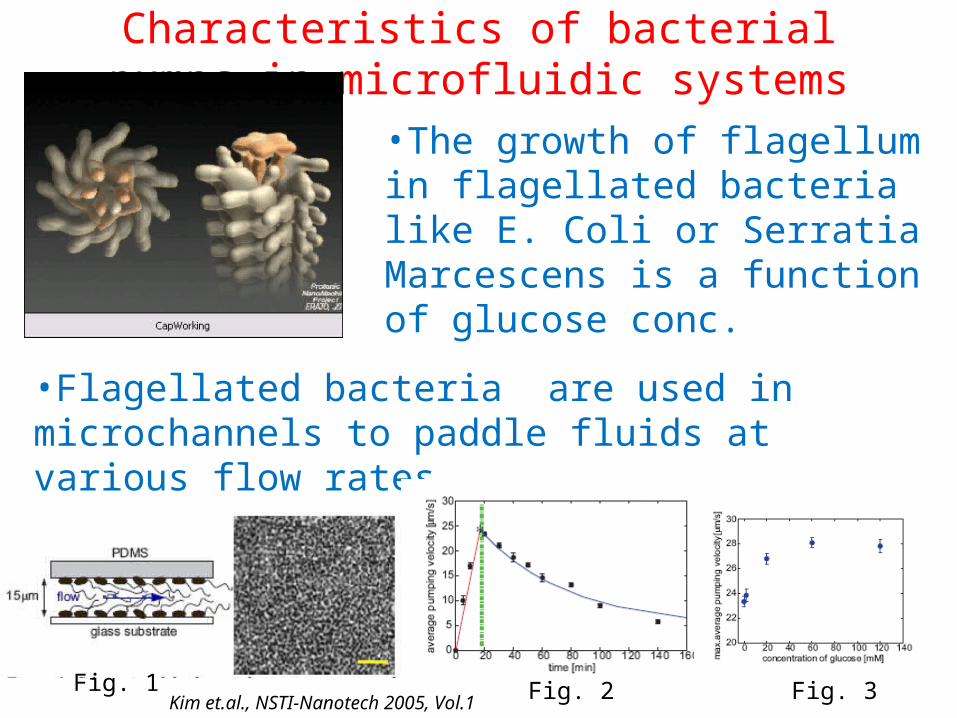
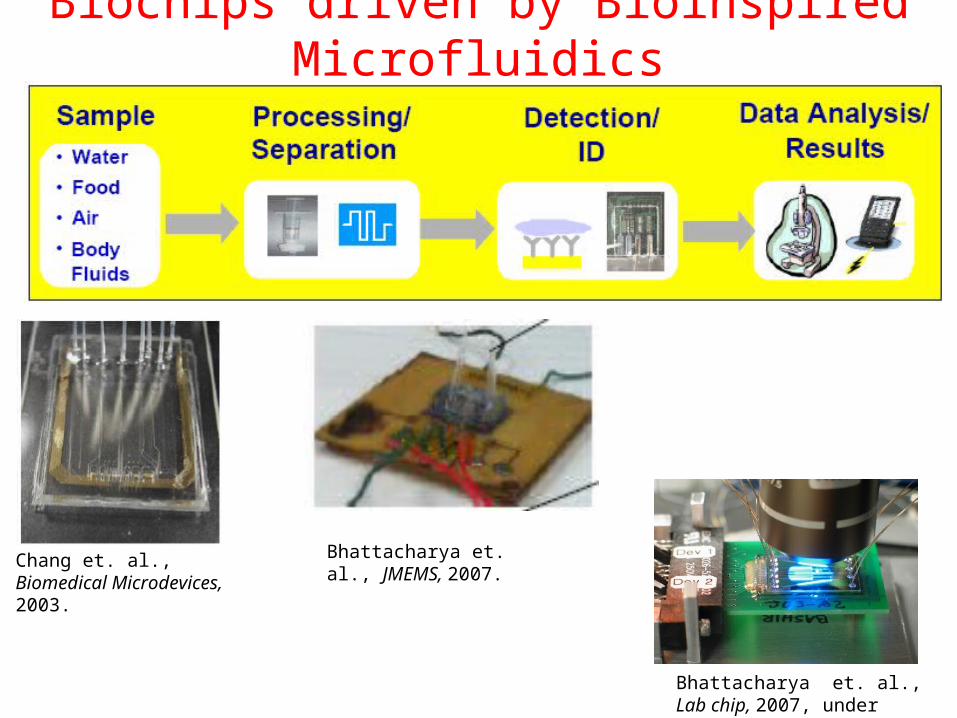
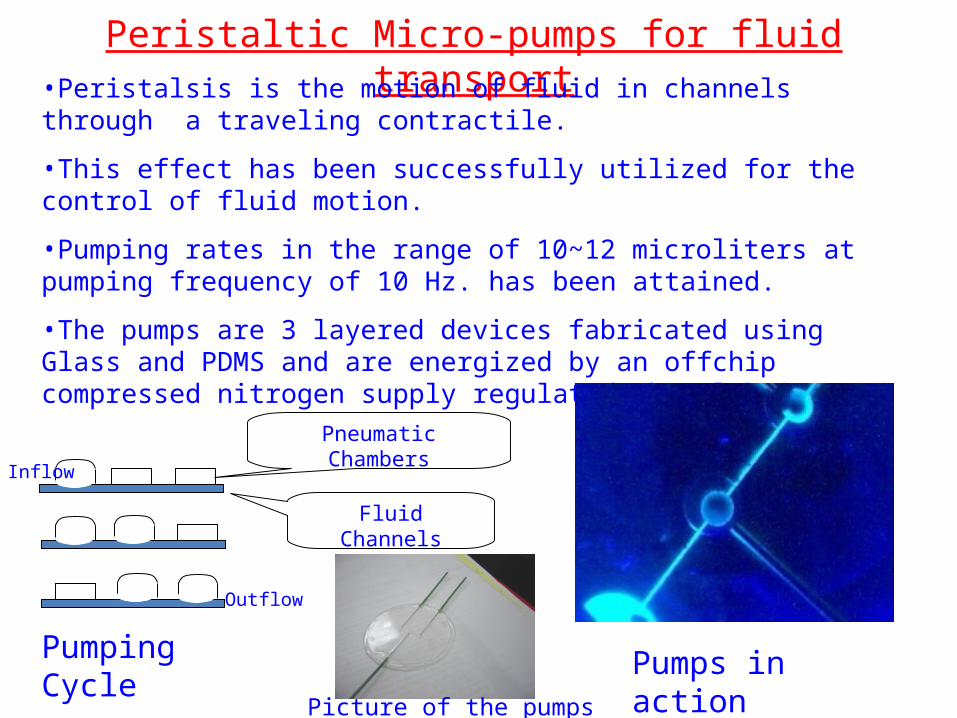
Biochips driven by Bioinspired Microfluidics

Chang et. al., Biomedical Microdevices, 2003.

Bhattacharya et. al., JMEMS, 2007.

Bhattacharya et. al., Lab chip, 2007, under review.

Lab on a chip for Viral detection

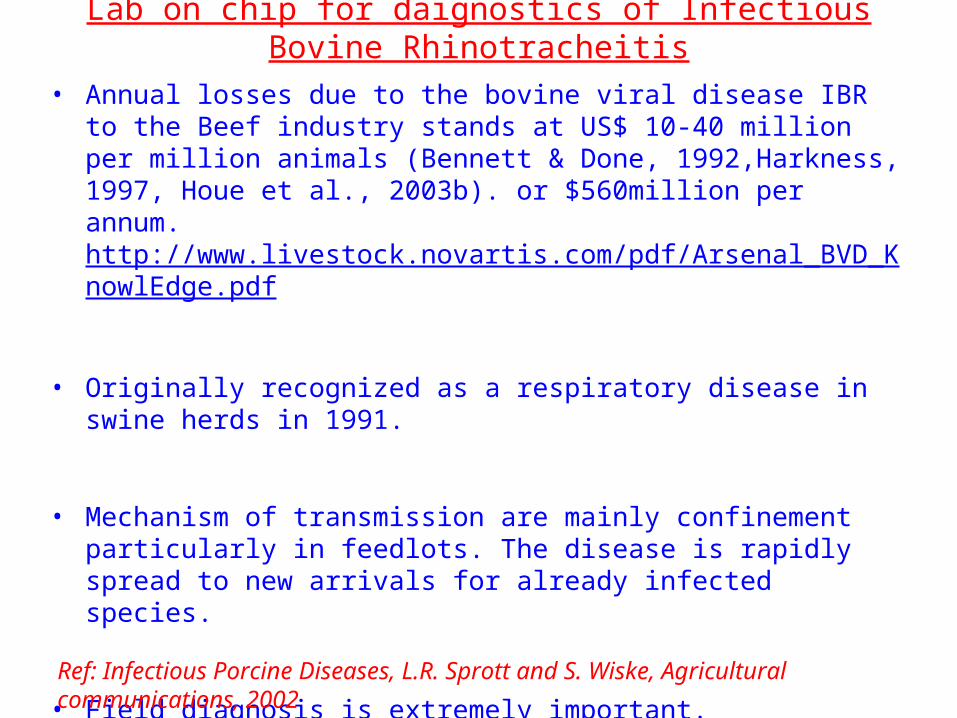
Lab on chip for daignostics of Infectious Bovine Rhinotracheitis

• Annual losses due to the bovine viral disease IBR to the Beef industry stands at US$ 10-40 million per million animals (Bennett & Done, 1992,Harkness, 1997, Houe et al., 2003b). or $560million per annum. http://www.livestock.novartis.com/pdf/Arsenal_BVD_KnowlEdge.pdf

• Originally recognized as a respiratory disease in swine herds in 1991.

• Mechanism of transmission are mainly confinement particularly in feedlots. The disease is rapidly spread to new arrivals for already infected species.

• Field diagnosis is extremely important.Detection is carried out using PCR based assay in laboratories which is

time consuming.

Ref: Infectious Porcine Diseases, L.R. Sprott and S. Wiske, Agricultural communications, 2002

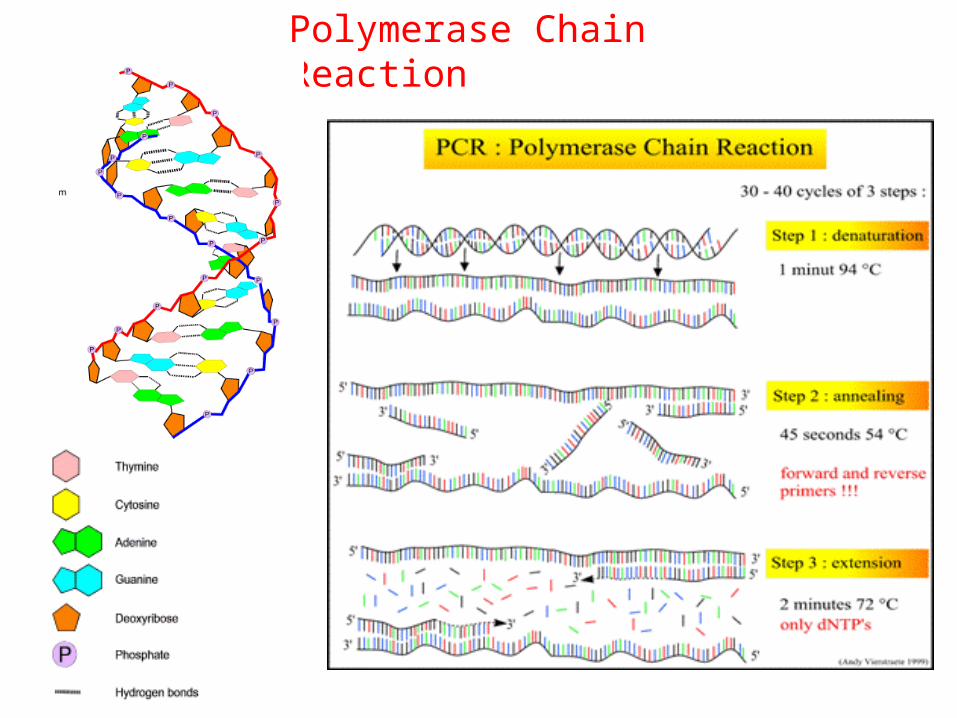
Polymerase Chain Reaction

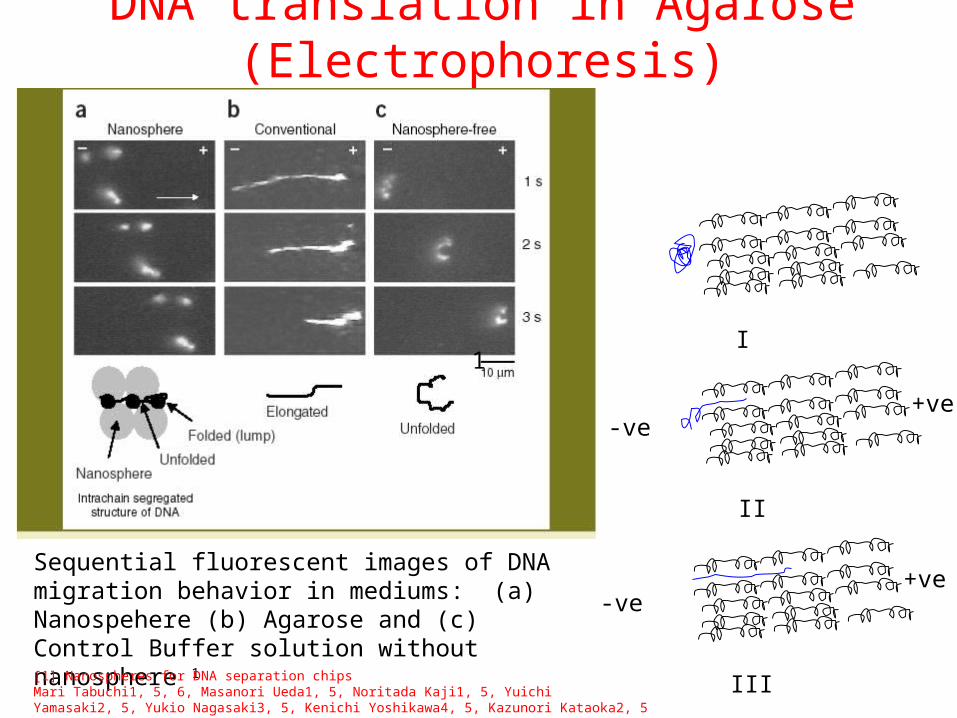
DNA translation in Agarose (Electrophoresis)

I

II

-ve+ve

III

-ve+ve

Sequential fluorescent images of DNA migration behavior in mediums: (a) Nanospehere (b) Agarose and (c) Control Buffer solution without nanosphere 1

1

[1] Nanospheres for DNA separation chipsMari Tabuchi1, 5, 6, Masanori Ueda1, 5, Noritada Kaji1, 5, Yuichi Yamasaki2, 5, Yukio Nagasaki3, 5, Kenichi Yoshikawa4, 5, Kazunori Kataoka2, 5 & Yoshinobu Baba1, 5, 6, 7 , NATURE

Equipment in a PCR laboratory

Glove box for preparing the PCR Mix

PCR thermal Cycler

Gel electrophoresis of DNA

Imaging of Fluorescence DNA Extraction from

tissue samples

DAQ system hooked to spectrometer will

provide the spatial data for the differential

intensities

Computer with DAQ card

Lab-view Operated Solenoid

valve

Spectrometer

Electrodes for Gel

electrophoresis

Heaters for PCR Optical Fibers

from Assay

Micro channel filled with agarose

gel

Reference Solid Core Waveguide for

background subtraction

Non fluorescing reference channel for background

subtraction

LED

Solid Core Waveguides placed along target DNA regions

Compressed air bottle

Plan View

Spectrometer

Syringe for injecting PCR mix

and sample

Front Elevation View

Lab on Chip Design for the Analyzer

Peristaltic Micro-pumps for fluid transport•Peristalsis is the motion of fluid in channels through a traveling contractile.

•This effect has been successfully utilized for the control of fluid motion.

•Pumping rates in the range of 10~12 microliters at pumping frequency of 10 Hz. has been attained.

•The pumps are 3 layered devices fabricated using Glass and PDMS and are energized by an offchip compressed nitrogen supply regulated thru labview.

Outflow

Inflow

Pneumatic Chambers

Fluid Channels

Pumping Cycle Pumps in action Picture of the pumps

Peristaltic Pumps in action

Working PCR Chip for IBR isolates

0 2000 4000 6000 800020

30

40

50

60

70

80

90

100

110

Te

mp

era

ture

(d

eg

.)

Time (secs)

Labview output of temperature vs. time of IBR cycle

4000 4020 4040 4060 4080 4100 4120 4140 4160 4180 420020

30

40

50

60

70

80

90

100

110

Tem

per

atu

re (

deg

.)

Time (secs)

One full thermal cycle

Amplified Extract from chip

Amplified Sample from Conventional M/c

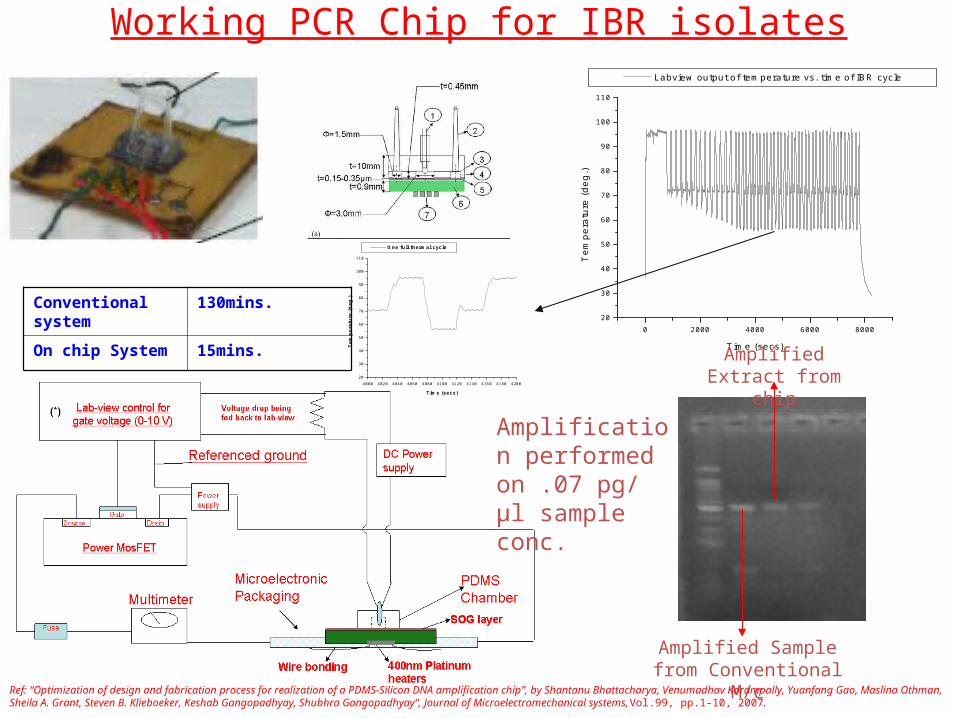
Amplification performed on .07 pg/ μl sample conc.

Ref: “Optimization of design and fabrication process for realization of a PDMS-Silicon DNA amplification chip”, by Shantanu Bhattacharya, Venumadhav Korampally, Yuanfang Gao, Maslina Othman, Sheila A. Grant, Steven B. Klieboeker, Keshab Gangopadhyay, Shubhra Gangopadhyay”, Journal of Microelectromechanical systems,Vol.99, pp.1-10, 2007.

Conventional system

130mins.

On chip System 15mins.

Capillary Electrophoresis: Sample and Capillary Loading

2 Basic Capillary Designs

Sample loading sequence in Gel filled channels

A B

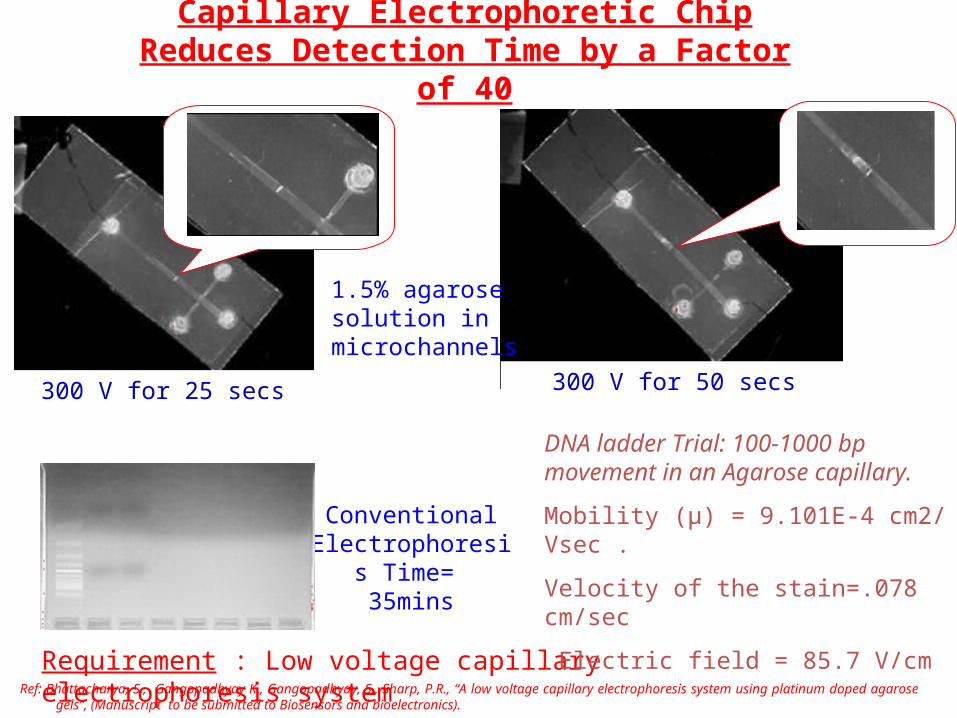
Capillary Electrophoretic Chip Reduces Detection Time by a Factor of 40

300 V for 25 secs 300 V for 50 secs

1.5% agarose solution in microchannels

Requirement : Low voltage capillary electrophoresis system

Conventional Electrophoresis Time= 35mins

DNA ladder Trial: 100-1000 bp movement in an Agarose capillary.

Mobility (μ) = 9.101E-4 cm2/ Vsec .

Velocity of the stain=.078 cm/sec

Electric field = 85.7 V/cm

Ref: Bhattacharya, S., Gangopadhyay K., Gangopadhyay, S., Sharp, P.R., “A low voltage capillary electrophoresis system using platinum doped agarose gels”, (Manuscript to be submitted to Biosensors and bioelectronics).

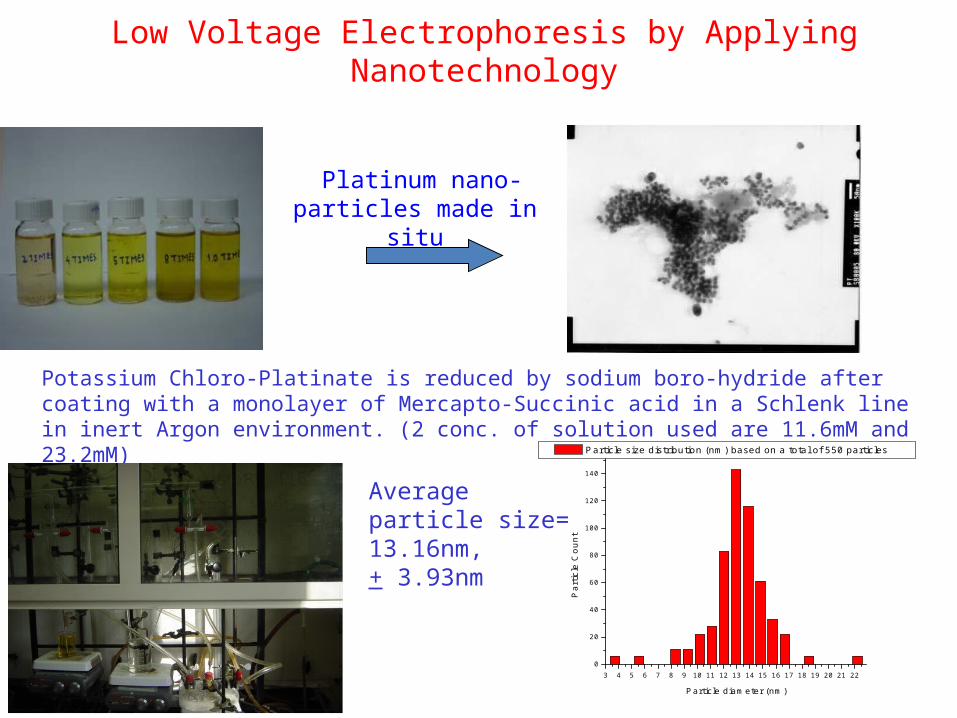
Low Voltage Electrophoresis by Applying Nanotechnology

Platinum nano-particles made in situ

Potassium Chloro-Platinate is reduced by sodium boro-hydride after coating with a monolayer of Mercapto-Succinic acid in a Schlenk line in inert Argon environment. (2 conc. of solution used are 11.6mM and 23.2mM)

3 4 5 6 7 8 9 10 11 12 13 14 15 16 17 18 19 20 21 220

20

40

60

80

100

120

140

Pa

rtic

le C

ou

nt

Particle diameter (nm)

Particle size distribution (nm) based on a total of 550 particles

Average particle size= 13.16nm, + 3.93nm

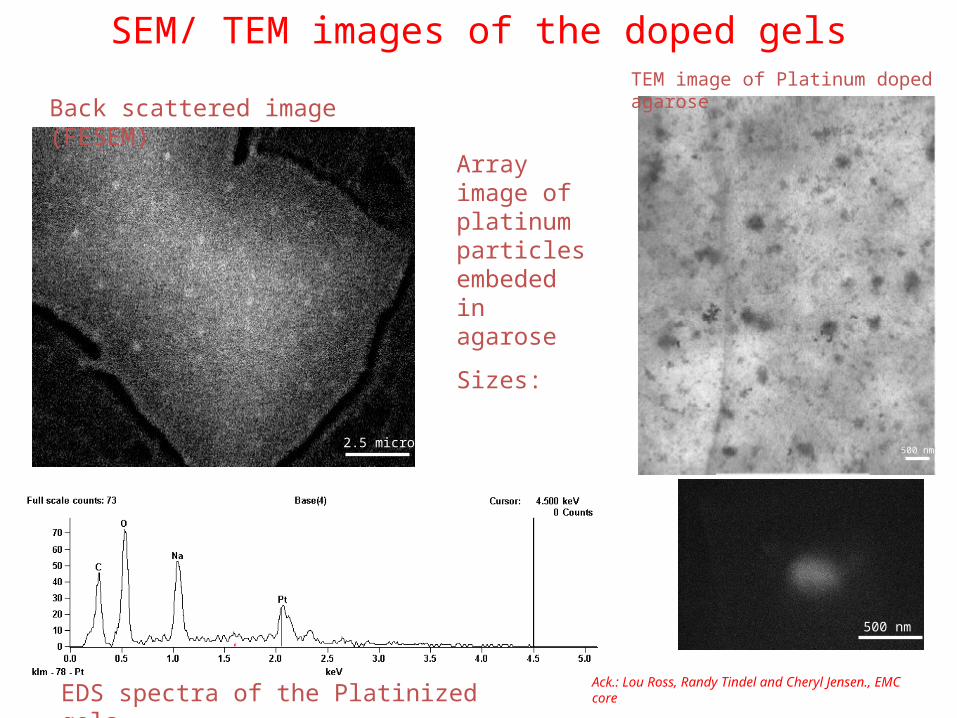
SEM/ TEM images of the doped gels

EDS spectra of the Platinized gels

Array image of platinum particles embeded in agarose

Sizes:

2.5 microns

500 nm

500 nm

Back scattered image (FESEM)TEM image of Platinum doped agarose

Ack.: Lou Ross, Randy Tindel and Cheryl Jensen., EMC core

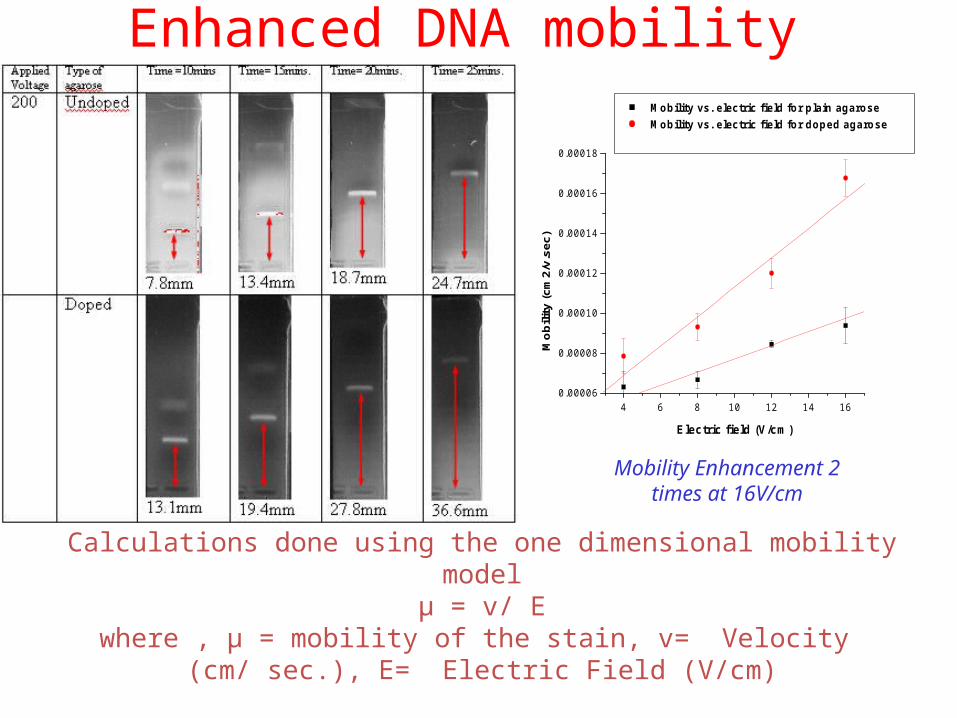
Enhanced DNA mobility

4 6 8 10 12 14 160.00006

0.00008

0.00010

0.00012

0.00014

0.00016

0.00018

Mob

ility

(cm

2/v.

sec)

Electric field (V/cm)

Mobility vs. electric field for plain agarose Mobility vs. electric field for doped agarose

Calculations done using the one dimensional mobility modelµ = v/ E

where , µ = mobility of the stain, v= Velocity (cm/ sec.), E= Electric Field (V/cm)

Mobility Enhancement 2 times at 16V/cm

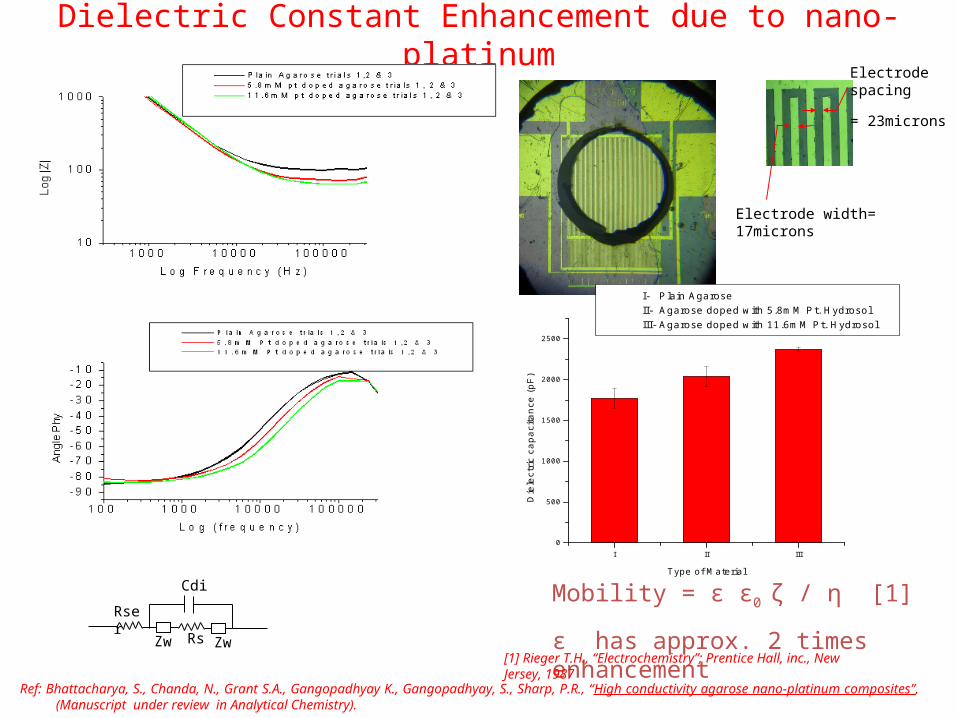
Dielectric Constant Enhancement due to nano-platinum

Mobility = ε ε0 ζ / η [1]

ε has approx. 2 times enhancement

Ref: Bhattacharya, S., Chanda, N., Grant S.A., Gangopadhyay K., Gangopadhyay, S., Sharp, P.R., “High conductivity agarose nano-platinum composites”, (Manuscript under review in Analytical Chemistry).

[1] Rieger T.H., “Electrochemistry”; Prentice Hall, inc., New Jersey, 1987

Electrode spacing

= 23microns

Electrode width= 17microns

Rs

Cdi

ZwZw

Rser

I II III0

500

1000

1500

2000

2500

Die

lect

ric

cap

aci

tan

ce (

pF

)

Type of Material

I- Plain Agarose II- Agarose doped with 5.8mM Pt. Hydrosol III- Agarose doped with 11.6mM Pt. Hydrosol

Summary and conclusions

• Bio-inspired Micro-fluidic technology is widely applied for biomimetics and biosensing.

• Lab-on-Chip is a direct spinoff of this technology and is used for providing point of care diagnostics.

• There is huge market potential for these technologies for the numerous applications.

ACKNOWLEDGEMENTS

• Dr. Sheila Grant, Dr. Shubhra Gangopadhyay , Dr. Keshab Gangopadhyay, Dr. Steve Klieboeker, Dr. Lela Riley, Dr. Xudong Fan (University of Missouri, Columbia).

• Dr. Rashid Bashir, Dr. Arun Bhunia, Dr. Michael Ladisch. (Purdue University, Indiana).

• Dr. P. Panigrahi, Dr. Bikram Basu, Dr. Bishakh Bhattacharya (IIT- Kanpur).

Collaborators and Advisors:

Funding Agencies:

•NSF (Curriculum Research Curriculum Development).•NPB (National Pork Board).•NIH (Mutant Mouse).•USDA (Center for food safety engineering).•Initiation Grant (IIT-Kanpur, DORD)


Recommended