Page 1
Biological and Filtration Performance Research on Cheese Whey
Treatment by Lab-scale Anaerobic Membrane Reactor (AnMBR)
Master of Science Thesis in the Master’s Program Environmental Measurement and
Assessment
Xiaofei Wang
Department of Civil and Environmental Engineering
Division of Water Environment Technology
CHALMERS UNIVERSITY OF TECHNOLOGY
Göteborg, Sweden, 2012
Master’s thesis 2012:159
Page 3
MASTER’S THESIS 2012:159
MASTER OF SCIENCE THESIS IN THE MASTER’S PROGRAMME
ENVIRONMENTAL MEASUREMENT AND ASSESSMENT
Biological and Filtration Performance Research on Cheese
Whey Treatment by Lab-scale Anaerobic Membrane
Reactor (AnMBR)
Xiaofei Wang
SUPERVISOR
RecepKaanDereli, Delft University of Technology, the Netherlands
Aurélie Grélot, Biothane Systems International, the Netherlands
EXAMINER
Britt-Marie Wilén, Chalmers University of Technology, Sweden
Department of Civil and Environmental Engineering
CHALMERS UNIVERSITY OF TECHNOLOGY
Göteborg, Sweden, 2012
Master’s thesis 2012:159
Page 4
Biological and Filtration Performance Research on Cheese Whey Treatment by Lab-
scale Anearobic Membrane Reactor (AnMBR)
Xiaofei Wang
©Xiaofei Wang, 2012
Department of Civil and Environmental Engineering
Chalmers University of Technology
SE-412 96 Göteborg
Sweden
Telephone: +46(0)31-7721000
Page 5
i
Abstract
Nowadays, with the development of dairy industry, the production of cheese whey has a
dramatically increase as well. Even though cheese whey is the raw material of various
products, small or medium cheese manufactures cannot afford the high cost of the
valorization technologies. It is necessary to find a proper way to treat whey efficiently.
For this kind of easily degradable wastewater with high organic load, anaerobic
treatment is the optimum method.
This thesis investigated the possibility of a new method, anaerobic membrane bioreactor
(AnMBR), to treat cheese whey through a lab-scale reactor. For economical concern,
digested municipal sludge was used as the inoculums. The highest VLR applied in this
study was 4.5 kg COD/m3·day with a maximal flux at 18 LMH. And the average COD
removal efficiency was 96%. The poor methanogenic activity of municipal sludge
seemed to limit the biological performance. The addition of crushed granular sludge
was proven not to be efficient in the activity improvements. The further experiment
showed that nitrogen was the limiting element for biomass growth. Inorganic
precipitation was the crucial cause of membrane fouling. The cleaning process with
stronger acid or longer soaking time should be applied to improve the cleaning
efficiency.
Key words: whey, AnMBR, VLR, COD, flux, filtration, fouling
Page 7
iii
Content 1. Introduction ............................................................................................................... 1
2. Aim and Scope .......................................................................................................... 6
3. Materials & Methods ................................................................................................. 6
3.1 Lab-scale Reactor construction ....................................................................... 6
3.2 Experimental Methods and Procedures ........................................................... 8
3.2.1 Sample preparation for Extracellular Polymeric Substances (EPS) and
Soluble Microbial Products (SMP) ................................................................ 10
3.2.2 Protocol of the Capillary Suction Time (CST) ................................... 10
3.2.3 Protocol for the Amicon cell to measure SCR and filterability .......... 12
3.2.4 Specific Cake resistance: .................................................................... 13
3.2.5 Supernatant filterability: ..................................................................... 14
3.2.6 Membrane cleaning protocol .............................................................. 15
3.3 Reactor Operation ......................................................................................... 15
3.3.1 Equipment calibration......................................................................... 15
3.3.2 Membrane preparation ........................................................................ 15
3.3.3 Operational parameter set up .............................................................. 15
3.3.4 Overall operation ................................................................................ 16
3.4 Characterization of whey .............................................................................. 17
3.5 Inoculums Characterization .......................................................................... 18
4. Results and discussion ............................................................................................. 19
4.1 Biological performance ................................................................................. 19
4.2 Filtration Performance .................................................................................. 27
4.2.1 Membrane Performance ..................................................................... 27
4.2.2 Sludge Filtration Characterization ...................................................... 31
4.2.3 Membrane cleaning ............................................................................ 36
4.2.4 Membrane autopsy ............................................................................. 38
5. Conclusion ............................................................................................................... 41
Reference: ....................................................................................................................... 42
Page 9
1
1. Introduction Whey, a by-product of cheese-making process, is the liquid remaining after the
precipitation and removal of fat and casein (Siso 1996). According to the investigation
in 2008, over 180 billion kilograms liquid whey was produced globally,about 70% of
which was produced in Europe and US (Affertsholt 2009). Figure 1 shows the
production process of semi-hard cheeses, which could represent almost all types of
cheese manufacturing. Whey basically represents 85–95% of milk volume and 55% of
milk nutrients (Siso 1996). About 93-94% of cheese whey is water. The major nutrients
in whey are lactose (4.5-6.0%), soluble proteins (0.6-1.1%), minerals (0.8-1.0%), lactic
acid (0.05-0.9%) and fats (0.06-0.5%)(Prazeres, Carvalho et al. 2012). More than 50%
of whey salts are NaCl and KCl and the rest are calcium salts (mainly phosphate) (Siso
1996). The composition of whey varies depending on the different cheese milk. Gouda
cheese whey is an example to represent the nutrients composition in most cheese whey
Table 1.
According to the processing techniques of casein removal from liquid milk, whey could
be separated into two types, sweet whey and acid whey. Sweet whey is produced at
approximately pH 6.5 based on rennet-induced coagulation of casein, and almost all the
whey products available on the market are of this type. The process to produce acid
whey relies on fermentation or addition of organic or mineral acids to coagulate the
casein at pH <5. Fresh cheese and most industrial casein are of this type(Kennedy,
Panesar et al. 2007). The typical compositions of these two types of whey are shown
inTable 2. Compared with sweet whey, acid whey generally has lower protein content
and higher salinity.
Figure 1 Flow sheet for the manufacture of semi-hard cheese (Wit 2001)
Table 1 Approximate composition of Gouda cheese whey (Wit 2001)
Page 10
2
Table 2 Typical composition of sweet and acid whey(Kennedy, Panesar et al. 2007)
In the past, the most common way to treat cheese whey was to discharge it directly to
receiving waters or to dispose it by land application without any pre-treatment.
However, these methods threatened the environment since the cheese whey could cause
an excess of oxygen consumption, impermeabilization, eutrophication, toxicity,
etc.(Prazeres, Carvalho et al. 2012). Then, for environmental and recycle concern,
cheese whey was used as the liquid base of animal feed. However, the connection of
cheese factories and pig farms broke down due to some unknown reasons (Malaspina,
Cellamare et al. 1996). Another alternative to reduce the impact of whey was to treat it
together with domestic wastewater. But it failed since the unique composition of whey
impaired the efficiency and stability of microorganisms of municipal wastewater
treatment (Prazeres, Carvalho et al. 2012).
It is necessary to find an efficient way for the treatment of whey. Today, there are
basically three main stream options (Prazeres, Carvalho et al. 2012). The first one relies
on valorization technologies. It is possible to recover many voluble products from whey
through valorization, such as condensed or powdered whey, whey protein concentrate,
lactose and its derivatives and single cell protein, however, many small to medium scale
factories do not have the economical power or market dimension to apply these
technologies (Malaspina, Cellamare et al. 1996; Siso 1996; Prazeres, Carvalho et al.
2012). The second choice is based on the application of physicochemical treatments,
Page 11
3
such as thermal precipitation, electrochemical coagulation, acid precipitation,
membrane separation, protein precipitation with coagulant/flocculant agents, etc. By
these methods, contaminant load such as organic matter, suspended solids and turbidity
can be reduced. Valuable products like proteins and lactose can also be recovered (Siso
1996; Souza, Bergamasco et al. 2010; Prazeres, Carvalho et al. 2012). The third option
is the application of biological treatment methods. Some valorization technologies are
also based on biological methods, for instance, lactose hydrolysis (Kosaric and Asher
1985), fermentation to ethanol (Sansonetti, Curcio et al. 2009) and anaerobic digestion
(Prazeres, Carvalho et al. 2012).
When considered as a wastewater source, the cheese whey is a very concentrated
effluent characterized by high COD (60–80 g/L) and BOD (30–50 g/L), low pH (4 – 5)
and bicarbonate alkalinity (~50 meq l-1
). The whey is highly biodegradable (~99%) and
the main portion of the COD can be attributed to lactose content inherited from the milk
(Malaspina, Cellamare et al. 1996; Siso 1996). Hence, biological treatments are the best
options for this kind of substrate(Prazeres, Carvalho et al. 2012). Aerobic processes,
such as activated sludge, trickling filterswere proven to be not very effective since the
organic load of whey was too high. Even after dilution, there were still other difficulties
like extensive energy requirement, oxygen transfer limitations, and large amount of
sludge production(Prazeres, Carvalho et al. 2012). In comparison to aerobic treatment,
anaerobic processes are more effective for easily biodegradable wastewater with high
organic load. Less amount of sludge is produced and no energy is required for oxygen
supply. In addition, the products of anaerobic treatment, methane rich biogas, can also
be applied as an energy source(Saddoud, Hassairi et al. 2007; Chen, Cheng et al. 2008).
Prazeres (2012)made a review of the main parameters of anaerobic digestion processes
applied to whey (Table 3). Among these processes, UASB and UAF reactors are the
most common used reactor types. They provided higher than 95% COD removal
efficiency and comparatively high methane yield (>0.28 m3kg
-1COD). Anaerobic
upflow fixed film loop reactor (AUFFLR), anaerobic semicontinuous digester with
flocculant addition (ASDFA), downflow-upflow hybrid reactor (DUHR) and two-stage
mixed anaerobic membrane digester (TSMAMD) could also achieve high COD removal
efficiency (>95%) with raw cheese whey as the influent. On the contrary, anaerobic
upflow fixed film reactor (AUFFR), two-stage unmixed anaerobic digester(TSUAD),
anaerobic rotating biological contact reactor (ARBC), and contact process (CP)did
notshow acceptable efficiency even with the influent of diluted cheese whey. Despite
anaerobic processes were proven with the possibility to get satisfying treatment results,
some authors stated that the high COD concentration, low bicarbonate alkalinity and
rapid acidification were limitations for stable reactor operation and effective anaerobic
digestion(Malaspina, Cellamare et al. 1996; Saddoud, Hassairi et al. 2007).
For wastewater with high organic load like cheese whey, biomass retention is an
essential factor determining the treatment efficiency. Membrane bioreactors (MBR) can
achieve high biomass retention by applying membrane separation technologies. The
four key separation processes are reverse osmosis (RO), nanofiltration (NF), ultra
filtration (UF) and microfiltration (MF) (Jeison, Días et al. 2008; Judd 2011). Thus, for
cheese whey treatment, anaerobic membrane bioreactor (AnMBR) can be an alternative
option.
Page 12
4
Generally, there are two types of membrane operation. The first one is “dead-end”
filtration. The feed flows against the membrane surface, and all the feed flow is
converted to permeate product. Another type is called “cross-flow” filtration. The feed
flow goes on parallel to the membrane. Only part of it is transferred to permeate. For
dead-end filtration process, it is easy to form thick cake layers on the membrane.
Regular backwash is needed to sustain a stable permeability. In comparison, cross-flow
process works better for continuous filtration (Judd 2011).
Figure 2 Dead-end (a) and cross-flow (b) membrane operation(Judd 2011)
Based on these membrane operations, there are two types of membrane bioreactors
distinct by the position of the membrane (Figure 3). The first one is side-stream MBR,
with a membrane module outside the bioreactor. Sludge is circulated in a recirculation
loop through the membrane module. Another one is submerged MBR, with a membrane
module immersed in the sludge inside the bioreactor. Compared with submerged MBR,
the side-stream MBR requires more energy to sustain the designated cross-flow velocity
and higher operational trans-membrane pressure. Indeed, the high levels of membrane
surface shear of side-stream MBR ensure operation with higher permeate flux under
anaerobic conditions. In addition, the cleaning and regular check of MBR module is
much easier than the other one since the side-stream position is more convenient to
remove. (Jeison 2007; Judd 2011; Skouteris, Hermosilla et al. 2012)
Figure 3 Side-stream MBR (1) and submerged MBR (2) (Skouteris, Hermosilla et al. 2012)
Page 13
5
Table 3 Bibliographic compilation: anaerobic digestion of cheese whey(Prazeres, Carvalho et al. 2012)
AUFFLR: Anaerobic upflow fixed film loop reactorASDFA: Anaerobic Semicontinuous digester with flocculant addition
UASB: Up-flow anaerobic sludge blanket DUHR: Downflow-upflow hybrid reactor
TSUAD: Two-stage unmixed anaerobic digester ARBC: Anaerobic rotating biological contact reactor
CP: Contact processASBR: Anaerobic sequencing batch reactor
TSMAMD: Two-stage mixed anaerobic membrane digesterUAF: Up-flow anaerobic filter
AUFFR: Anaerobic upflow fixed film reactor
Page 14
6
2. Aim and Scope Since cheese whey is a concentrated wastewater source, it is meaningful to find a cheap
way to treat it efficiently. Anaerobic membrane bioreactor (AnMBR) is considered as
analternative anaerobic technology for the treatment of whey. The aim of this thesis is to
operate an AnMBR for whey treatment, and try to optimize membrane performance and
treatment efficiency. In this study, the digested sewage sludge was used as inoculum to
start-up the AnMBR reactor for economical concerns since inoculation of full scale reactors
requires a high amount of sludge and digested sewage sludge is the most abundant
anaerobic sludge that can be found very cheap and easily.
The lab-scale cross-flow AnMBR reactor was operated for 6 months. Throughout this
period biological treatment performance and membrane performance were followed with
regular experiments performed twice a week. All the experiments were conducted in the
Research & Development Laboratory of Biothane System International in the Netherlands.
The period of thesis work was from Jan, 2012 to Jun, 2012.
3. Materials & Methods
3.1 Lab-scale Reactor construction The lab-scale reactor consists of 3 main units (Grélot, Dereli et al. 2012): a continuously
mixed feed vessel kept at 4-5 °C in a fridge, a 10L anaerobic reactor with continuous
stirring, and a side-stream tubular cross-flow ultrafiltration membrane with a length and
diameter of 69.5cm and 5.2mm, respectively. The membrane used in the study is a
hydrophilic tubular polyvinylidene fluoride (PVDF) membrane cast on a polyester carrier
supplied by Norit X-flow. The properties of the membrane are given in Table 4. The
membrane was operated in continuous filtration mode. The anaerobicreactor was operated
under mesosphilic conditions (37 ˚C± 0.5). In order to keep membrane fluxes at a high
level, permeate is partially recycled back to the reactor, and an overflow line is constructed
to make sure the reactor volume is kept at 10L. All the sensors and pumps in the AnMBR
system could be monitored and controlled through a PLC system and a computer program
developed with Labview Software running on a standard PC. The pH in the reactor was
controlled with a stand-alone controller (HACH LANGE SC 1000) and two KNF pumps
for acid and caustic. The detailed technical properties of the equipment (pumps, gas meters,
etc.) used in the lab-scale reactor set up are given in Table 5.
Page 15
7
Figure 4 Lab-scale reactor units(Grélot, Dereli et al. 2012)
Table 4 Membrane and module properties
Parameter Unit Membrane (F 4385) Remarks
Clean water flux L/m2.h.100
kPa
>1000 RO-water at 25 0C
Transmembrane pressure kPa -100 .. + 500 -
Mean pore size nm 30 -
pH - 2 - 10 at 25 C
Chlorine exposure ppm.h 250000 at 25 0C
Temperature 0C 1 - 70 pH 7 and 100
kPa
Membrane material -
Polyvinylidene
fluoride
-
Carrier material -
Polyester woven/non-
woven
-
Structure - Asymmetric -
Hydrophobicity - Hydrophilic -
Membrane geometry - Tubular -
Inner diameter mm 5.2 -
Length cm 69.5 -
Membrane area m2 0.0114 -
Page 16
8
Table 5 Parameters of equipments in this study
Equipment Type Manufacture Description
Feed Pump 120U Watson-
Marlow
Perisaltic pump 120U/DV manual;
control with digital display; 114DV
pumphead; 90-264V; 110mm x 196mm
x 112mm (w x d x h); 0.1rmp to 200rpm;
0.002mL/min to 170mL/min
Permeate
Suction Pump
120U Watson-
Marlow
Recirculation
(Cross-flow)
Pump
520 U Watson-
Marlow
Peristaltic pump; 230V 50/60Hz; 158mm
x 276mm; 4μL to 3.5L;
0.1 to 220rpm; accuracy 0.1%;
analogue/manual
Acid & Caustic
Pumps
KNF
Heater
(water bath)
SAHARA PPO
S5P Heated
Bath Circulator
(152-3058)
Thermo
Scientific
SC100-S5P heating circulator; Ambient
+13 to 100°C; 115V/60Hz; 5L
Pressure meter
(sensor)
ATM -600 to 800 mbars
Gas meter Wet tipping
gas meter
pH controller SC 1000
Controller
HACH
LANGE
Consisted of a display module (model
LXV402) and one or more probe
modules (model LVX400); Ambient -20
to +55°C
3.2 Experimental Methods and Procedures Daily biogas production, pH, and membrane feed, permeate and trans-membrane pressures
were recorded online. Feed flow, permeate flow and methane content of biogas were
checked manually every day. Frequent analyses (once or twice per week) were performed
to check the characteristics (Total and Volatile Suspended Solids, TS/VS, COD, soluble
COD, pH, alkalinity, TKN, NH4+-N, TP, PO4
3--P) and protein (BCA method),
polysaccharides (Dubois method)of the raw wastewater, permeate and sludge according to
Standard Methods(APHA 2005). Other parameters were also measured as indicators of
anaerobic treatment stability and membrane performance, such as volatile fatty acids
(VFAs), cations, anions, protein and polysaccharides. In addition, filterability, capillary
suction time (CST), specific cake resistance (SCR) and particle size distribution were
checked as well to evaluate the sludge filterability. The experimental plan of the study is
shown in Table 6.
Page 17
9
Table 6 Experimental plan
Parameter Feed Sludge Sludge
Supernatant
Permeate Frequency Method
TCOD X* X X 2 per week Standard
Methods
SCOD (0.45µm) X 2 per week Standard
Methods
TKN X X 1 per week Standard
Methods
NH4+-N X X 1 per week Standard
Methods
TSS/VSS X 2 per week Standard
Methods
TS/VS X X 2 per week Standard
Methods
VFA (0.45µm) X* X X 2 per week GC
PO43-
-P (0.45µm) X X 2 per week HPLC
TP X X 1 per week Standard
Methods
Cations (0.45µm) X X 1 per week HPLC
Anions (0.45µm) X X 1 per week HPLC
PH X X 2 per week pH meter
(Standard
Methods)
Alkalinity X X 1 per week Standard
Methods
Proteins
(0.45µm)
X** X X 1 per week BCA
Polysaccharides
(0.45µm)
X** X X 1 per week Dubois
Capillary suction
time (CST)
X 1 per week Triton
Specific cake
resistance (SCR)
X 1 per
fortnight
Amicon
Cell
Filterability X 1 per
fortnight
Amicon
Cell
Specific
methanogenic
activity
X 1 per
fortnight
Pressure
*TCOD and VFA of feed sample from feed vessel connected to the reactor were measured once per
week to make sure there was no big change of the feed components. All the parameters were
measured aftera new batch of feed was prepared.
** In proteins and polysaccharides measurements, sludge samples were used to measure total
proteins and polysaccharides, and samples from supernatant and permeate are for soluble ones.
Page 18
10
When trans-membrane pressure (TMP) increased up to400mbar, to get better performance,
membrane cleaning was conducted by flushing the membrane with tap water and chemical
cleaning afterwards.Critical flux was measured periodically in order to operate the
membrane with an optimized flux. Critical flux measurements were also carried out several
times at the beginning to evaluate the optimum operating flux under different cross-flow
velocities.
Except for the parameters following standard methods and those measured by GC and
HPLC, the others were performed according to the protocols prepared by the research
engineers of the company. Details of these protocols are explained in the following sections.
3.2.1 Sample preparation for Extracellular Polymeric Substances (EPS) and Soluble
Microbial Products (SMP)
The measurements of both protein(BCA Method) and polysaccharides(Dubois Method)
according to standard methodsare for EPS and SMP. Details of the conversion from protein
and polysaccharides to EPS and SMP are presented in Section 4.2.2. Only the preparation
protocol is described in this part.
Sample preparation for EPS:
One sample of anaerobic sludge is first heated at 100 °C for 1hour and 15minutes;
The supernatant of the anaerobic sludge samples is then separated from solid phase
by centrifugation at 14000 rpm for 10 min at 16 °C;
The supernatant must then be passed through a rough filter;
Pass the supernatant through the 0,45 µm filter;
Measure the sample for protein and polysaccharides following the protocol of each
one.
Sample preparation for SMP:
The supernatant of the anaerobic sludge samples is then separated from solid phase
by centrifugation at 14000 rpm for 10 min at 16 °C;
The supernatant must then be passed through a rough filter;
Pass the supernatant through the 0,45 µm filter;
Measure the sample for protein and polysaccharides following the protocol of each
one.
3.2.2 Protocol of the Capillary Suction Time (CST)
The CST equipment is a practical method for the determination of sludge dewaterability,
providing a rapid comparison of the effects of different agents and dosages in waste water.
The rate at which the filtrate passes through the paper filter is influenced by the
characteristics of the sludge. The Capillary Suction Time (CST) is calculated by the time
that the water from the sample takes to travel from one electrode to another.
Page 19
11
The equipment is formed by, the reader apparatus, two different cells, the filter support and
the upper plate (Figure 5).
Figure 5 CST equipment (model CST), reader apparatus, two different cells, the filter support, the upper plate,
one sample, paper filter and 2ml pipette tips
Procedure to assemble and operate the CST equipment:
The equipment should be disconnected (inOff signal)
Connect the signal reader to the upper plate (with the electrodes)
Put the filter in the paper filter support. Take care to put the filter on the right side
(weaving part on the filter support)
Assemble the upper plate on top of the filter, with the electrodes down touching the
paper filter
Put the chosen cell in the upper plate, making sure that is touching the paper filter
completely
Pour the sample into the cell (should be totally full and present a meniscus, see
picture 9)
Turn the switch to ON
Depending on the type of sample the measurement will take more or less time, a
beep signals when the filtrate reaches the first electrode and also when the second
set of electrodes is reached.
Page 20
12
After the measurement, the equipment should be clean, the filter support (if
necessary), the upper plate, and the cell, so the filter used in the next measurement
will not be contaminated.
3.2.3 Protocol for the Amicon cell to measure SCR and filterability
The Amicon Filtration Cell is commonly used for filterability tests and specific cake
resistance. A gas pressure is applied directly to the cell. The solids are retained inside the
cell, while the permeate passes through the filter and out of the cell. The maximum
operating conditions are:
Pressure: 75 psi
Volume: 50ml
Temperature: Although brief exposure to higher temperatures is possible, do not
operate cell continuously above 85°C (185°F).
The Amicon cell is composed by the following components: clamp, permeate line, filter
holder, base of the cell, cap, O-ring, cell body and finally the stirrer (Figure 6).
Figure 6Amicon cell components, stand, magnetic stirrer, pressure valve and 0.22µm filters
Procedure to assemble and operate the Amicon cell:
Place the filter in the holder; place O-ring on top of the filter. Gently push O-ring
down to seal the filter against the bottom of the holder. Apply the O-ring gently to
avoid scratches and contamination, in filterability tests a 0.22 µm pore size filter
is recommended, for specific cake resistance is preferable to use 0,7 µm filter. Connect the line to the filter holder and clamp it.
Page 21
13
Fit the filter holder into the cell body and screw the base of the cell firmly.
Place the stirrer into cell body (depending on the analysis). When properly installed,
the arms of the stirrer will be held by the inside ridge on top of the cell body.
Introduce sample into cell.
Push cap down into the cell body, with the gas inlet oriented to the opposite side of
the permeate line.
Set pressure-relief valve to horizontal (open) position, see picture 8.
Slide cell into retaining stand, it will ensure the proper position of the Amicon cell
and prevents the rotation of the cell while measuring.
Attach gas pressure line, for filterability tests the recommended Pressure is 0,5
mbar.
Place cell on magnetic stirring table.
Turn on stirring table and adjust stirring rate to level 5. Stir the sample solution for
20 min before beginning the measurements (in filterability tests).
Turn pressure-relief valve to vertical (closed) position see picture 9, the cap moves
upward, forming a secure lock with retaining stand once the system is pressurized.
Unclamp the permeate line.
When finished, turn off the pressure and stirring table.
Release the pressure inside the cell by slowly turning pressure-relief knob to
horizontal position. Push cap down, then slide cell out of the retaining stand.
Use a twisting motion to remove cell cap and the magnetic stirrer assembly. Always
remove the cell top with the pressure-relief valve set to the horizontal (open)
position.
Pour out the solution.
Disassemble the cell, wash all components with a mild detergent/water solution, and
then rinse thoroughly. Leave the cell disassembled until it is necessary to use it
again.
3.2.4 Specific Cake resistance:
Measurement procedure:
Data acquisition frequency for the test is15 sat minimum.
The test takes 30 minutes
Prepare the sample:
Measure the temperature of the sample before beginning the test, and the TSS
concentration
Use preferably a minimum amount of 30/40 ml of final volume to do the test.
Dilute the sample to 10 g/L adding permeate.
Notes: Do not mount the stirrer part of the Amicon cell for specific cake resistance tests.
Always adjust the pressure before beginning the test.
Data treatment:(Jeison 2007)
In the filtration process, the relation of flux and cake and membrane resistance follows
equations Eq1~Eq3:
Page 22
14
Eq1
J- Flux; A- membrane area; V- permeate volume; t- time; η: permeate viscosity, RM-
apparent membrane resistance; RC- cake resistance.
In a dead end filtration like this, RC is related to specific cake resistance (α) directly:
Eq2
C- Solids concentration.
Combine the 2 equations and another equation would be obtained assuming that the flux is
constant:
Eq3
The specific resistance could be gotten as the slop of TMP against permeate volume. The
volume is recorded by on-line scale under the amicon cell.
3.2.5 Supernatant filterability:
Measurement procedure:
Preparation of the supernatant
Collect the sample and centrifuge it.
Optimal conditions: 14000 RPM
70ml of sample=2tubes=nearly 30ml of supernatant (this result depends on the type
of sludge)
Use preferably a minimum amount of 20 ml of sample to do the test.
Data acquisition frequency for the test is 15 s.
The test takes 10 minutes.
Do not forget to mount the stirrer part of the Amicon cell for filterability.
Always adjust the pressure before beginning the test.
MEASURE THE COD CONCENTRATION OF THE SUPERNATANT BEFORE
THE TEST.
Data treatment:
The accumulated weight of supernatant filtered is recorded by on-line scale under the
amicon cell. The filtration flow rate is calculated as ml/ min
The filterability measurement corresponds to obtained stable filtration flow rate and the
specific filterability is this filtration flow rate divided by the COD concentration of the
supernatant.
Page 23
15
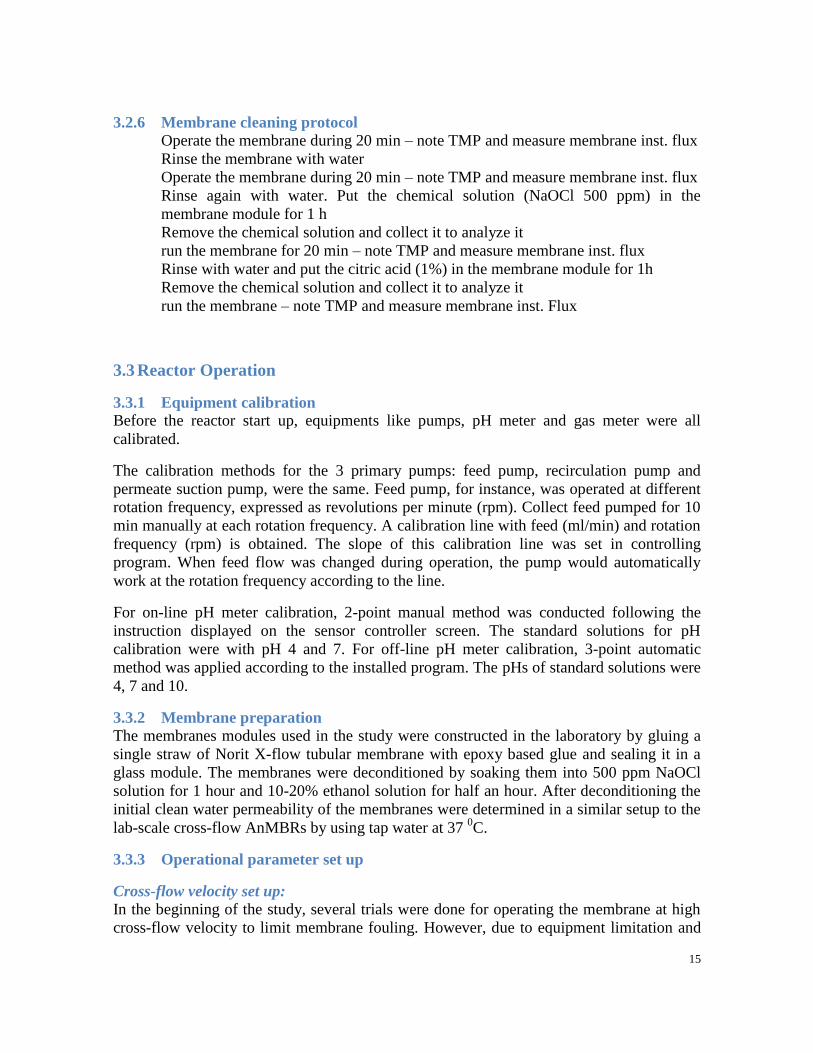
3.2.6 Membrane cleaning protocol
Operate the membrane during 20 min – note TMP and measure membrane inst. flux
Rinse the membrane with water
Operate the membrane during 20 min – note TMP and measure membrane inst. flux
Rinse again with water. Put the chemical solution (NaOCl 500 ppm) in the
membrane module for 1 h
Remove the chemical solution and collect it to analyze it
run the membrane for 20 min – note TMP and measure membrane inst. flux
Rinse with water and put the citric acid (1%) in the membrane module for 1h
Remove the chemical solution and collect it to analyze it
run the membrane – note TMP and measure membrane inst. Flux
3.3 Reactor Operation
3.3.1 Equipment calibration
Before the reactor start up, equipments like pumps, pH meter and gas meter were all
calibrated.
The calibration methods for the 3 primary pumps: feed pump, recirculation pump and
permeate suction pump, were the same. Feed pump, for instance, was operated at different
rotation frequency, expressed as revolutions per minute (rpm). Collect feed pumped for 10
min manually at each rotation frequency. A calibration line with feed (ml/min) and rotation
frequency (rpm) is obtained. The slope of this calibration line was set in controlling
program. When feed flow was changed during operation, the pump would automatically
work at the rotation frequency according to the line.
For on-line pH meter calibration, 2-point manual method was conducted following the
instruction displayed on the sensor controller screen. The standard solutions for pH
calibration were with pH 4 and 7. For off-line pH meter calibration, 3-point automatic
method was applied according to the installed program. The pHs of standard solutions were
4, 7 and 10.
3.3.2 Membrane preparation
The membranes modules used in the study were constructed in the laboratory by gluing a
single straw of Norit X-flow tubular membrane with epoxy based glue and sealing it in a
glass module. The membranes were deconditioned by soaking them into 500 ppm NaOCl
solution for 1 hour and 10-20% ethanol solution for half an hour. After deconditioning the
initial clean water permeability of the membranes were determined in a similar setup to the
lab-scale cross-flow AnMBRs by using tap water at 37 0C.
3.3.3 Operational parameter set up
Cross-flow velocity set up:
In the beginning of the study, several trials were done for operating the membrane at high
cross-flow velocity to limit membrane fouling. However, due to equipment limitation and
Page 24
16
very high pressure fluctuation at high velocities, a high cross flow velocity such as 2 m/s
could not be maintained in this study.This is mainly due to the peristaltic pump used as the
cross-flow pump which was causing a high pressure fluctuation. In order to limit the
pressure variation, several options such as pressure dampener and buffering bottles (Figure
7) were tried out. The maximum cross flow velocities (CFVs) that could be applied were
1.5 m/s and 1 m/sfor a short period of time. However, in the end all the attempts had failed.
Therefore, due to equipment limitations a cross-flow velocity of 0.5 m/s was chosen for
long term sustainable operation.
Figure 7 Buffering system (A: pressure dampener; B: buffering bottle)
Permeate flux set up:
Higher permeate flux is preferable to operate the reactor at shorter hydraulic retention
time.However, when the permeate flux is set too high, the membrane could be fouled
rapidly. Critical flux measurements were conducted to determine highest operational flux
that leads to lowest membrane fouling. The operational flux was set under critical flux. The
permeate flux was set as 10 LMH at the beginning of the operation. The operational flux
was changed in accordance to the critical flux experiments conducted during long term
study. The details will beexplained in the Section “Critical flux”.
Sludge retention time (SRT) set up:
Anaerobic digestion needs longer sludge (solid) retention time than aerobic biodegradation
(Prazeres, Carvalho et al. 2012). In the first phase of the experiment, SRT was set as 50
days. However, after 22 days of continuous operation, very poor reactor performance
indicated by high VFA concentrations was obtained which may be due to low activity of
the seed sludge or due to inappropriate SRT for this wastewater type. Therefore at day 45,
daily sludge extraction was ceased to operate the reactor at high (infinite) sludge age. As a
result, no sludge was extracted except for sampling to measure regular parameters. The
anticipated sludge retention time would be 300 days under this situation.
3.3.4 Overall operation
The whole experiment was divided into several phases according to the actions taken in
reactor operation.
Page 25
17
The 1st phase, from day 0 to day 57, after the adjustment of cross-flow velocity and
permeate flux, the sludge retention time (SRT) was set as 50 days. The 2nd
phase, from day
58 to day 85, 644mL crushed granular sludge with high methanogenic activity from a full
scale EGSB treating lactose based wastewaterwas added to boost the activity of biomass in
reactor. At the same time, to keep as much biomass as possible in the reactor, nosludge
wasextracted except for samples for regular measurements. The 3rd
phase, from day 86 to
day 114, another batch of 800ml crushed granular sludge was added into the reactor since
VFA concentrations were still high (>1000 mgCOD/L) at VLR around 4 kg COD/m3.day in
the previous phase. The operation conditions are shown in Table 7.
Table 7 Operation condition of 3 phases
Operation condition Unit Phase 1
(day 0-57)
Phase 2
(day 58-85)
Phase 3
(day 86-114)
SRT days 50 - -
HRT days 17 8 6
VLR kg COD/m3.day 2.1±1.0 3.4±1,0 4.5±0,6
F:M kg COD/kg
VSS.day
0.53±0.1 0.47±0.12 0.30±0.09
Temperature 0C 37 37 37
CFV m/s 0.5 0.5 0.5
Flux* LMH 5 18 10
*day 17-62 with flux 5 LMH, day 63-99 with flux 18 LMH, day 100-114 with flux 10
LMH.
3.4 Characterization of whey The whey used as the feed in this study was obtained from a cheese production facility. The
characterization of the whey used in the study was similar to the whey treated in a full scale
AnMBR plant (Table 8).
Table 8Feed characterization
parameters unit Whey from full-scale
plant
Whey used in this
study
TCOD mg/L 27860 26180±1290
SCOD mg/L 26440 25690±720
TKN mg/L 370 130±7
SKN mg/L 290 120±20
NH4+-N mg/L 50 25±7
TSS mg/L 1620 620±220
VSS mg/L 2120 560±170
TS mg/L 14780 26060±630
VS mg/L 11340 21750±530
VFA mg/L 630 260±90
Page 26
18
TP mg/L 340 360±20
PO42-
- P mg/L 360 220±80
SO42-
mg/L 250 60±20
Cl- mg/L 1950 2080±310
Ca2+
mg/L 740 580±80
Mg2+
mg/L 720 80±10
K+ mg/L 1130 840±200
Na+ mg/L 480±60
pH - 3.4 5.1±0.3
Soluble protein mg/L 1250 1440±300
Total protein mg/L 1630±380
Soluble
polysaccharide
mg/L 1420 11130±1240
Total
polysaccharide
mg/L 10770±690
3.5 Inoculums Characterization The digested municipal sludge is from Delft wastewater treatment plant, the Netherlands.
Before putting the sludge in to the lab-scale reactor the sludge was screened through a 0.6
mm mesh filter to remove any fibers and large particles that may clog the tubes. 8.5L
sludge was put into the reactor at the very beginning as the inoculums. Because of the poor
activity of municipal sludge, 2 batches of crushed granular sludge with high methanogenic
activity were added into the anaerobic reactor to enhance the activity of biomass during the
operation. Details of the addition were stated in the section “Reactor operation”. The
characteristics of the inoculums are listed in Table 9.
Table 9 Characteristics of inoculums
Parameter Unit Inoculum
TCOD mg/L 34900
TSS mg/L 30480
VSS mg/L 20900
TS mg/L 32900
VS mg/L 21180
Soluble proteins mg/L 328
Soluble polysaccharides mg/L 106
CST s 550
Specific cake resistance 1012
m/kg 500
Filtrability mL/min 0.27
Acetic Activity g CH4-COD/g VSS.day 0.19
Propionic Activity g CH4-COD/g VSS.day 0.06
Butytic Activity g CH4-COD/g VSS.day 0.23
Page 27
19
4. Results and discussion
4.1 Biological performance Volumetric loading rate (VLR) and sludge loading rate (F: M ratio) applied during the
operation period are shown in Figure 8. The reactor was started up with a relatively low
organic loading rate (1 kg COD/m3.day) to acclimatize the sludge to wastewater. After 1
week, the VLR was gradually increased up to 4 kg COD/m3.day. However, VFA started to
build up in the reactor at this VLR and the load was first decreased to 3 kg COD/m3.day
then to 1.5 kg COD/m3.day.Accordingly, acetic acid concentrations decreased and
propionic acid concentrations were stable. A second attempt to increase the VLR to 3 kg
COD/m3.day resulted in a sharp increase of propionic acid. The effluent COD which was
mainly propionic acid reached up to3500mg/L which corresponds to 87%COD removal
efficiency.The average VLR in the 1st phase was 2.1 kg COD/m
3.day which was very low
compared to those VLRs reported by other authors for the anaerobic treatment of whey
shown in Table 3. At this point, several measures were undertaken to improve reactor
performance. First, daily sludge discharge was stopped to retain more biomass in the
reactor to improve degradation capacity. Secondly, to immediately boost biomass activity
and sludge concentration, highly active crushed granular sludge was added (65 g as VSS)
into the reactor. After adding extra sludge and stopping regular sludge extraction, the VLR
was started to increase gradually. This time VLR could be increased up to 4 kg
COD/m3.day without any VFA accumulation. However, at a slightly higher VLR than that
the VFA concentrations started to increase once again. The average VLR in 2nd
phase was
calculated as 3.4 kg COD/m3.day. In order to test, whether the active biomass concentration
was limiting the biological performance a second portion of crushed granular sludge was
added (112g as VSS) to the reactor and the VSS concentration was boosted up to 33 g/L. In
the 3rd
phase of the study, VLR was kept in between 4-5 kg COD/m3day; however a stable
reactor performance could not be achieved. Although the acetic acid concentrations were
generally low (<100 mg COD/L), the propionate tend to accumulate and fluctuate wildly in
the reactor.
During the operation,it was found out that the nitrogen concentration measured as ammonia
in permeate was very low. This brought the idea that nitrogen limitation may be the real
reason of instable reactor performance. In order to investigate the effect of nitrogen on the
biological performance the nitrogen concentration in the reactor was booted to 112 mg/L by
manually adding NH4Cl as shots in two consecutive days (day 94 and 95). The result was
quite remarkable since the VFA concentration in reactor decreased to zero next day after
the second addition of nitrogen. However, this performance boost was not permanent and
the VFA concentrations started to increase after the nitrogen addition was ceased. However,
this result was quite interesting since nitrogen limitation is generally not pronounced for
anaerobic process due to the small growth yield of anaerobic bacteria. Nitrogen and
phosphorus are the two essential macro-nutrients for biomass growth. Therefore, the
bacteria, which have a higher cell yield and specific growth rate, have an important
advantage over the other bacteria when competing for nutrients in a nitrogen limited
environment. In this specific case, acid producing bacteria which are converting lactose in
whey into propionate had an advantage for nitrogen due to their faster metabolism and
Page 28
20
growth yield over the propionate utilizing bacteria which are known as the most sensitive
and slow growing microorganisms in an anaerobic consortium. Therefore, the acidogens
were consuming most of the nitrogen fed to the reactor and limiting the growth of slow
growing microorganisms. The poor and unstable performance of AnMBR in this study may
be explained by this phenomenon. All in all, the reactor could not be operated with VLR
higher than 5 kg COD/m3.day by only increasing the active biomass concentration in the
reactor.
Compared to VLR, F:M ratio was more stable. Even though VLR increased after adding
extra sludge, VSS was also higher due to the addition. The average SLR was calculated as
0.14±0.04 kg COD/kg VSS.day.
Figure 10 shows the variation of VFAconcentrations together with VLR in reactor. In the
initial phase of the study both acetic and propionic acids accumulated in the reactor when
VLR was increased. However, in the longer operation period propionic acid was the main
VFA building up in the reactor. The butyric acid concentrations were always low during the
whole operation time.The results indicate that propionate conversion plays a key role and it
determines the stability of the reactor for whey treatment. The low activity or the
concentration of syntrophic bacteria may be the reason for instable bioprocessand reactor
performance.
Figure 8 Volumetric and sludge loading rates change with time
0,0
0,2
0,4
0,6
0,8
1,0
1,2
0
1
2
3
4
5
6
7
0 20 40 60 80 100 120
Slu
dg
e L
oad
ing
Rate
(kg
CO
D/k
g V
SS
.day
)
VL
R (
kg
CO
D/m
3.d
ay
)
Time (day)
VLR F:M
Page 29
21
Figure 9 VLR, permeate COD and permeate VFA COD change with time
Figure 10 VLR and VFA concentrations in reactor
The TS-VS and TSS-VSS concentrations in the reactors are presented in Figure 11and
Figure 12. The solids concentrations increased by adding crushed granular sludge. The
average solids concentrations at different operation phases are given in Table 10. The
VS/TS and VSS/TSS ratios were around 60% and 70%, respectively, during the whole
operation time andtheyincreased slightly by adding crushed granular sludge.
0
1 000
2 000
3 000
4 000
5 000
6 000
7 000
8 000
9 000
10 000
0
1
2
3
4
5
6
7
0 20 40 60 80 100 120
CO
D c
on
cen
trati
on
(m
g/L
)
VL
R (
kg
CO
D/m
3.d
ay
)
Time (day)
VLR Permeate COD VFA COD in Permeate
0
500
1000
1500
2000
2500
0,0
1,0
2,0
3,0
4,0
5,0
6,0
7,0
0 20 40 60 80 100 120
VF
A C
on
cen
trati
on
in
slu
dg
e (m
g
CO
D/L
)
VL
R (
kg
CO
D/m
3.d
ay
)
Time (day)
VLR Acetic acid Propionic acid Butyric acid
Page 30
22
Figure 11 TSS and VSS concentrations in reactor
Figure 12 TS and VS concentrations in reactor
0%
10%
20%
30%
40%
50%
60%
70%
80%
10 000
20 000
30 000
40 000
50 000
60 000
70 000
80 000
0 20 40 60 80 100 120
VS
S/T
SS
Rati
o
Con
cen
trati
on
(m
g/L
)
Time (day)
TSS VSS VSS/TSS
0%
10%
20%
30%
40%
50%
60%
70%
80%
10 000
20 000
30 000
40 000
50 000
60 000
70 000
80 000
0 20 40 60 80 100 120
VS
/TS
Rati
o
Con
cen
trati
on
(m
g/L
)
Time (day)
TS VS VS/TS
Page 31
23
Table 10 Average concentrations and standard deviation of solids of different phases
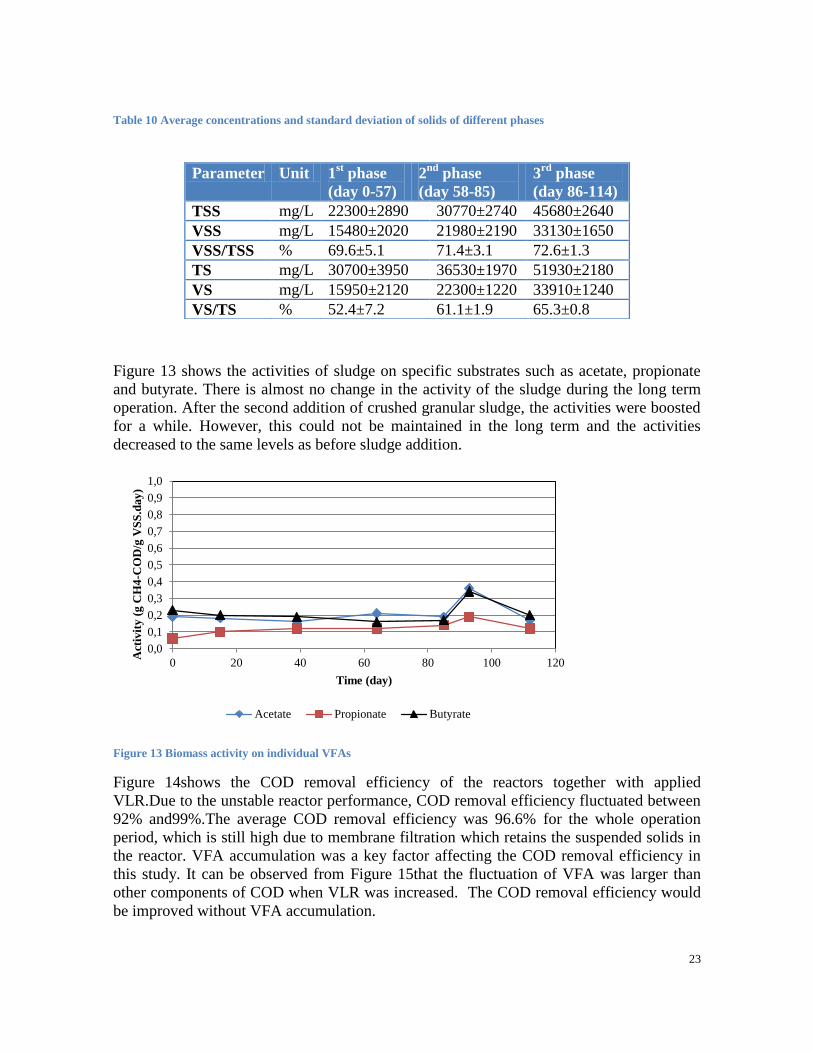
Figure 13 shows the activities of sludge on specific substrates such as acetate, propionate
and butyrate. There is almost no change in the activity of the sludge during the long term
operation. After the second addition of crushed granular sludge, the activities were boosted
for a while. However, this could not be maintained in the long term and the activities
decreased to the same levels as before sludge addition.
Figure 13 Biomass activity on individual VFAs
Figure 14shows the COD removal efficiency of the reactors together with applied
VLR.Due to the unstable reactor performance, COD removal efficiency fluctuated between
92% and99%.The average COD removal efficiency was 96.6% for the whole operation
period, which is still high due to membrane filtration which retains the suspended solids in
the reactor. VFA accumulation was a key factor affecting the COD removal efficiency in
this study. It can be observed from Figure 15that the fluctuation of VFA was larger than
other components of COD when VLR was increased. The COD removal efficiency would
be improved without VFA accumulation.
0,0
0,1
0,2
0,3
0,4
0,5
0,6
0,7
0,8
0,9
1,0
0 20 40 60 80 100 120
Act
ivit
y (
g C
H4
-CO
D/g
VS
S.d
ay
)
Time (day)
Acetate Propionate Butyrate
Parameter Unit 1st phase
(day 0-57)
2nd
phase
(day 58-85)
3rd
phase
(day 86-114)
TSS mg/L 22300±2890 30770±2740 45680±2640
VSS mg/L 15480±2020 21980±2190 33130±1650
VSS/TSS % 69.6±5.1 71.4±3.1 72.6±1.3
TS mg/L 30700±3950 36530±1970 51930±2180
VS mg/L 15950±2120 22300±1220 33910±1240
VS/TS % 52.4±7.2 61.1±1.9 65.3±0.8
Page 32
24
Figure 14 VLR and COD removal efficiency
Figure 15 COD and VFA concentrations in permeate and COD removal efficiency
As expected, the methane production followed the same trend with the applied organic load
(Figure 16). Figure 17 illustrates the fractions of COD present in different streams such as
80%
82%
84%
86%
88%
90%
92%
94%
96%
98%
100%
0
1
2
3
4
5
6
7
0 20 40 60 80 100 120
CO
D r
emoval
(%)
VL
R (
kg
CO
D/m
3.d
ay
)
Time (day)
VLR COD removal efficiency
0,4
0,5
0,6
0,7
0,8
0,9
1
0
500
1 000
1 500
2 000
2 500
3 000
3 500
4 000
4 500
0 20 40 60 80 100 120
Rem
ov
al
effi
cien
cy (
%)
Co
nce
ntr
ati
on
(m
g/L
)
Time (day)
COD concentration (mg/L)
VFA concentration (mg COD/L)
Difference of COD and VFA concentration (mg/L)
Removal efficiency based on permeate COD
Removal efficiency based on COD and VFA difference
Page 33
25
permeate, wasted sludge, and generated methane gas. The digestion efficiencies in the
reactors were calculated asEq4:
Eq4
The average digestion efficiencies of the 3 phases were calculated as 87%, 91% and 96%
respectively. In general, the digestion efficiencyhasimprovedby enlarging sludge retention
time (stop sludge extraction) and adding sludge with high methanogenic activity. On the
other hand, due to unstable reactor performance the digestion efficiency was sometimes
higher than 100%. This situation occurred mainly when VFA accumulated in the
reactorandfeed flow was reduced to let the biomass convert the accumulated VFA. At this
time, even though the influent was very low, the digestion of those accumulated VFA in
reactor was still going on and this resulted in the production of moremethane than expected
for the subsequent day. Based on the formula above, the digestion efficiency could be
higher than reality sometimes. Those high values were omitted out when getting the
average values.
Figure 16 VLR and methane generation
0
5
10
15
20
25
0
1
2
3
4
5
6
7
0 20 40 60 80 100 120
Met
han
e fl
ow
(m
3/d
ay)
VL
R (
kg C
OD
/m3.d
ay)
Time (day)
VLR Methane flow
Page 34
26
Figure 17 Fractions of COD in different streams
Table 11 COD mass balance (average+standard deviation)
Stream
Phase 1(day 0-57) Phase 2(day 58-85) Phase 3(day 86-114)
g COD/day % g COD/day % g COD/day %
Influent 22.9±5.8 100 38.1±8.9 100 47.1±3.2 100
Permeate 1.1±0.5 4.8±1.6 0.9±0.6 2.2±1.6 1.6±0.8 3.3±1.7
Wasted
sludge
4.6±1.1 21.2±7.8 3.6±1.9 9.4±4.5 5.3±3.8 11.3±8.2
Biogas 19.5±2.3 87.5±17.2 34.4±7.0 91.1±9.7 45.3±6.6 95.6±8.7
The COD mass balance results of the 3 phases are shown in Table 11.The average
conversion rate from whey wastewater to biogas increased greatly from 87.5% to 95.6%.
Table 12 Biological performance in the reactor
Parameter Unit Phase 1
(day 0-
57)
Phase 2
(day 58-
85)
Phase 3
(day 86-
114)
VLR kg COD/m3.d 2.1±1.0 3,4±1,0 4.5±0,6
F/M ratio kg COD/kg VSS.d 0.15±0.04 0.17±0.05 0.14±0.02
TSS in reactor g/L 22.3±2.9 30.8±2.7 45.7±2.6
VSS in reactor g/L 15.5±2.0 22.0±2.2 33.1±1.6
Permeate COD mg/L 1570±975 699±508 1011±477
COD removal
efficiency based on
permeate quality
% 95.7±2.1 97.6±1.6 96.5±1.7
0,0
10,0
20,0
30,0
40,0
50,0
60,0
70,0
80,0
0 20 40 60 80 100 120
CO
D (
g/d
ay)
Time (day)
Permeate Wasted Sludge
Methane Permeate+Wasted Sludge+CH4
Page 35
27
Methane production L/d 12.0±3.6 22.1±6.4 29.4±5.0
Digestion efficiency
based on influent COD
% 87±17 91±10 96±9
Methane yield m3 CH4/kg CODremoved 0.36±0.08 0.44±0.22 0.37±0.07
Sludge yield g VSS/ g COD fed 0.11±0.06 0.05±0.05 0.08±0.06
The overall biological performance of the 3 phases is presented in Table 12. To sum up, the
volumetric loading rate could be slightly increased with the addition of extra sludge, but the
biological performance of the reactor was not satisfying. The VLR achieved in this study
was significantly low compared with the successful operations achieved by other authors
with VLR higher than 10 kg COD/m3.d (Table 3).The average methane yield about 0.4m
3
CH4/kg CODremoved is at a high level compared with other authors’ results (Table 3), which
means that the conversion of COD to CH4 was efficient. However, the average permeate
COD was relatively high due to the frequent VFA accumulation.
The poor methenogenic bacteria activity of municipal sludge which was used as inocculum
may be one of the reasons of the poor biological performance of the reactor in this
experiment. The addition of extra sludge could only increase the amount of biomass but not
boost the individual activity. Although it is preferable to have higher sludge concentration
in the reactor for better biological treatment performance, the sludge concentration had to
be decreased due to the limitation of the cross-flow pump for pumping high concentration
sludge (>40 g TSS/L). Therefore, 2.7L of sludge in the reactor was replaced with permeate
to reduce solids concentration at the end of phase 3.
In anaerobic digestion, nitrogen is an important element for microorganism growth. The
ration of carbon, nitrogen and phosphorus should be 500/5/1(Prazeres, Carvalho et al.
2012). Almost no ammonia could be observed in the effluent which is an indication of all
the nitrogen fed to the reactor was either used for biomass growth or inorganic precipitation
reactions such as struvite formation. However, the pH in the reactor was generally around
6.7 which was obviously not the optimum pH for struvite precipitation. Therefore the loss
of a significant part of nitrogen with chemical precipitation is unlikely in this study,
however this must be proven by conducting elemental mass balance calculations. The lack
of nitrogen might be a limitation for biomass growth and treatment efficiency in this
experiment. A continuous experiment following this one with increased nitrogen
concentrations in the feed showed that adding nitrogen could improvereactor stability and
biological performance. However, the results of that complementary experiment were not
presented in this thesis.
4.2 Filtration Performance
4.2.1 Membrane Performance
According to the TMP changes with time (Figure 18), the whole operation period could be
easily divided into 3 phases, which are exactly the same as those separated according to the
Page 36
28
different actions taken in the reactor operation. At the end of the 2nd
and 3rd
phases,
membrane was chemically cleaned with NaHOCl and citric acid, which was presented as a
sharp drop of TMP in Figure 18.
In the 1st phase, a backwash was done to clean the cake layer accumulated on membrane in
order to decrease the high TMP on day 24.The TMP dropped for a short term and then
increased even more rapidly. This phenomenon indicated that the membrane was fouled
due to the unstable operation such as changing the flux and CFV frequently to optimize at
the beginning of the reactor. On day 28, the membrane was cleaned with chemicals. The
flux was set to 5 L/m2.h and the TMP was stable till the end of this phase. The details of
chemical cleaning were explained in Section3.2.6.
After stopping regular sludge extraction, the 1st batch of crushed granular sludge with high
methanogenic activity was added to the reactor. After the addition of extra sludge the
critical flux was checked and it was measured as 22 L/m2.h. This may be due to change of
sludge particle size due to the addition of crushed granular sludge which still contains
larger particles compared to the sludge inside the reactor. Therefore, the operational flux
was set to 18 L/m2.h accordingly in continuous filtration mode (Figure 18). The trend of
TMP change is exactly as expected from a continuous filtration process, such as a linear
increase of TMP followed by an exponential TMP jump. The increase of TMP indicated
that cake layer accumulated on membrane and became compactedwith filtration time,
eventually causing membrane fouling. After chemical cleaning, irreversible fouling was
removed with oxidation of organic foulants by chlorine and dissolving of inorganic foulants
at low pH of citric acid solution. Hence, TMP dropped to a very low level, which was only
a little bit higher than that after the 1stchemical cleaning. One cause of this difference could
be that this cleaning process was incomplete; another one, which is more credible, could be
explained as the irrecoverable fouling which inevitably occurs on the long term operation
and cannot be recovered or removed by any means.
The 3rd
phase, characterized by a decrease of flux and huge increase of TMP, is also shown
in Figure 18. Due to the operation at a flux as high as 18 L/m2.h, membrane was easier to
be fouled compared to operation at low fluxespecially with a relatively low cross-flow
velocity which actually provides the shear force to prevent the deposition of the particles on
the membrane. Another chemical membrane cleaning was conducted on day 99 and the
operational flux was reduced to 10 LMH according to a new critical flux measurement.
However, theseactionscould not stop TMP from increasing. Moreover, the sludge
recirculation system in the membrane loop was not stable and easily blocked, and peristaltic
pump tubes sticked together. The increase of suspended solids concentration and sludge
viscosity after adding a new batch of granular sludge was supposed to be the main reason of
these problems. Therefore, TSS concentration in the reactor was reduced manually in the
next phase.
Page 37
29
Figure 18TMP, flux and instant flux change during operation
The conversion of permeate flux (J) from the operation temperature 37 °Cto normal
temperature 20 °C (J20) depending on the viscosity followsEq5. Permeability, which is
described as flux per unit pressure (Eq6), could be converted to the normal temperature
according to the same principle. The filtration resistance is correlated to the permeability
(Eq7). After deconditioning the membrane with 500 ppm NaOCl solution, the initial tap
water permeability of the membrane was measured as 101.4 L/m2.h.bar and the membrane
resistance was calculated as 3.54*1012
m-1
at 20 °C. The change of permeability and
resistance are illustrated in Figure 19, respectively.
(Fan, Zhou et al. 2006)Eq5
(Jeison 2007)Eq6
(Jeison 2007)Eq7
η represents the permeate viscosity, which was regarded the same as pure water viscosity,
1.002 mPa.Sat 20°C.
Page 38
30
Figure 19 Permeability and resistance during operation
Table 13 Critical flux and operational flux
Day CFV
(m/s)
TSS
(mg/l)
Critical
flux
(LMH)
Operational
flux
(LMH)
0 1 19600 10 10
0 0.5 21000 6 5
10 0.5 24500 8 5
45 0.5 29300 22 18
77 0.5 32100 30 18
91 0.5 41800 22 18
100 0.5 48200 14 10
112 0.5 48400 10 10
114 0.5 47200 14 10
Critical flux, firstly presented by Vandevivere(1999), is the key to identify the appropriate
operatingflux for MBRs. In this study critical flux was measured according to flux step
method(clech 2003)to determine the operational permeate flux. The criteria set to determine
the critical flux was dP/dt<1 mbar min-1
.The results of critical flux experiments and
operational flux are shown in Table 13. The improvement of critical flux after 45th
day may
be due to the modification of sludge characteristics after crushed granular sludgeaddition
0,0
10,0
20,0
30,0
40,0
50,0
60,0
70,0
0
20
40
60
80
100
120
140
160
180
200
18 28 38 48 58 68 78 88 98 108 118
Res
ista
nce
(*10^
12m
-1)
Per
mea
bil
ity (
L/m
2.h
.bar)
time (day)
Permeability at 20 ℃ (L/m2.h.bar) Resistance at 20 ℃ (*10^12m-1)
Page 39
31
and the recovery of membrane permeability after chemical cleaning. Moreover, the
significant decrease of critical flux on day 100 may be caused by the addition of NH4Cl on
day 94 and 95. As mentioned in Section 4.1, the acidogenic bacteria grow faster compared
to methanogens in the system and these single cell organisms can play a role in membrane
fouling due to cake compaction. Jeison (2007)showed that acidogenic bacteria grew as
individual cells with high density through microscopy observations, which could be a great
problem causing poor filtration performance and low operational fluxes. Additionally, the
high level of TSS concentration in the 3rd
phase could also affect membrane filtration.
Consequently, both the sludge quantity and quality may be effective on membrane fouling.
4.2.2 Sludge Filtration Characterization
In addition to reactor operation and membrane performance following, the changes in
sludge filterability were regularly monitored with additional parameters. Sludge supernatant
filterability, capillary suction time (CST) and specific cake resistance (SCR) are measured
to identify the sludge filterability under standard conditions. The trends of these parameters
are shown in Figure 20, Figure 22 and Figure 23. The results from day 0 to 44 may not be
representative since the reactor was unstable during the starting-up period.
The supernatant filterability provides information about the fouling propensity of soluble
organic material such as SMP and colloidal particles in the sludge supernatant. From Figure
20 and Figure 21, it can be observed that supernatant filterability improved with the
increase of SMP and decrease of colloidal COD (CCOD). The trend with CCOD was
indeed in accordance with the expectations. However, the relation between SMP and
filterability was somehow unexpected. In literature it is generally reported that the
filterability was reduced with the accumulation of SMP inside the reactor(Pan, Su et al.
2010).
Figure 20 supernatant filterability and SMP
0
10
20
30
40
50
60
0,00
0,05
0,10
0,15
0,20
0,25
0,30
0,35
0,40
0,45
0,50
0 20 40 60 80 100 120
Co
nce
ntr
ati
on
(m
g/g
VS
S)
Su
per
na
tan
t F
ilte
rab
ilit
y (
mL
/min
)
Time (day)
Supernatant Filterability SMP
Page 40
32
Figure 21 Supernatant filterability and CCOD
CST has been an indicator of sludge dewaterability since 1967 (Huisman and Kesteren
1998). In Figure 22, CST decreased with little fluctuation from day 44 to day 93. This trend
may due to the increase of solids by adding crushed granular sludge. However, after the
second addition of extra sludge, CST increased with TSS increase. Especially after the
addition of NH4Cl on day 94 and 95, CST was observed to increase by more than 100
seconds. It seems that the addition of ammonia and too high concentrations of TSS (>40 g/l)
made sludge dewaterability worse.
Figure 22capillary suction time (CST) and TSS
0
100
200
300
400
500
600
700
800
900
0,00
0,05
0,10
0,15
0,20
0,25
0,30
0,35
0,40
0,45
0,50
0 20 40 60 80 100 120
CC
OD
(m
g/l
)
Su
per
na
tan
t F
ilte
rab
ilit
y (
mL
/min
)
Time (day)
Supernatant Filterability CCOD
0
10 000
20 000
30 000
40 000
50 000
60 000
0
100
200
300
400
500
600
700
0 20 40 60 80 100 120
TS
S (
mg
/l)
CS
T (
s)
Time (day)
Sludge TSS
Page 41
33
Cake layer formation is generally regarded as the most important fouling mechanism in
AnMBRs (Jeison 2007). Therefore, SCR parameter gives an indication about the quality of
cake accumulating on the membrane surface. According to the SCR calculations Eq1to Eq3,
it could be concluded that a lower SCR means a compact and less porous cake layer formed
with small size particles whereas a higher SCR indicates a cake layer with high porosity. In
the first 2 phases, except for the unstable condition at the very beginning, SCR decreased
greatly. In the 3rd
phase, SCR didn’t change much. The SCR in fact is directly related to the
sludge quality in terms of particle size. The decreasing trend of SCR in this study is
remarkable and somehow contradictory to the results reported by other authors which
indicate that the mean particle size in AnMBR reactors decreases during long term
operation due to the shear rate applied with pumps or gas recirculation(Jeison 2007). On the
other hand the cross-flow velocity applied in this study was relatively lower compared to
the other studies.
Figure 23specific cake resistance (SCR) change with time
In general, sludge filtration characteristics improved in phase 1 and phase 2, but reduced
after the second addition of crushed granular sludge in phase 3. In the first two phases,
sludge in the reactor was adapting to whey wastewater. The amount of biomass and the size
of flocs increased with the addition of new sludge, hence the sludge got easier to filter.
However, after the second addition, as shown in Table 10, solids concentrations were too
high, which is not good for filterability. After the addition of NH4Cl sludge filterability
decreased.
Extracellular polymeric substances (EPS) are located at or outside the cell surface, which
can sustain a cooperative and commutative surrounding for microorganisms to
survive(Laspidou and Rittmann 2002). The main components of EPS are polysaccharides,
proteins, nucleic acids, and humic substances (Drews, Leeb et al. 2006). Soluble microbial
products (SMP) are soluble components released by cells, which could be a major part of
COD in the effluent (Laspidou and Rittmann 2002). SMP contain polysaccharides, proteins,
humic and fulvic acids, nucleic acids, amino acids(BARKER and STUCKEY 1999). There
are two independent mechanisms of SMP production: erosion of floc-associated EPS and
decay of active cells(Menniti and Morgenroth 2010).
0
100
200
300
400
500
600
0 20 40 60 80 100 120Sp
ecif
ic c
ak
e re
sist
an
ce (
x
10
12 m
/kg
)
Time (day)
Page 42
34
Laspidou et al.(2002) presented a critical review of the relationships among EPS, SMP and
active and inert biomass based on the different or even contradictory opinions by former
researchers. In this review, a unified model was sketched (Figure 24).
Figure 24 Schematic representation of the unified model for active biomass, EPS, SMP, and inert biomass
(Laspidou and Rittmann 2002)
In this study, for simplification, only proteins and polysaccharides were measured to
indicate the concentration of SMP and EPS. Eq8,Eq9 andEq10 show the conversion.
Eq8
Eq9
Eq10
For SMP measurement, 5 samples were tested in the first phase and 2 samples in the
following phases. And for EPS, 2 samples were checked in each phase. The concentrations
of SMP, bound EPS, together with VLR are shown in Figure 25 and Figure 26. Soluble
polysaccharides concentration was very low (<10 mg/g VSS) during the whole study. The
variation of SMP was mainly due to changes in soluble protein concentrations. During the
unstable first phase, SMP increased due to soluble protein accumulation. But in the second
and third phases, SMP concentration showed a trend of decreasing even though VLR
increased. On the other hand, bound EPS increased gentlely. Bound polysaccharides
accumulated faster than bound protein in the reactor. After the addition of NH4Cl on day 94
and 95, bound EPS showed a sharp increase. Maybe the boost of microorganism growth led
to this result.
Mikkelsen (2002) stated that bound EPS accumulation was good for the stability of sludge
floc structure thereby the dewaterability and filterability, meanwhile, some other authors
Page 43
35
found it in the opposite way(Drews, Leeb et al. 2006). Houghton (2001) found optimum
levels of EPS to get maximum sludge dewaterability at 10 mg EPS/g SS for digested sludge.
However, from the results of this study, there is no direct connection of EPS, SMP and
filterability.
Both EPS and SMP are important substances related membrane fouling (Drews, Leeb et al.
2006), The effects of EPS and SMP on membrane fouling are always on debate. Lin (2010)
found that SMP and EPS might act as “glue” to form an apparent slime layer, which could
prompt fouling. Charfi (2012)stated that bound EPS have a positive effect on flocculation.
When large flocs are accumulating, surface fouling of membrane would occur. On the other
hand, when bound EPS concentration is low, the dispersed microorganisms could enter
membrane pores and lead to pore constriction fouling.
Figure 25SMP concentrationin sludge and VLR
0,0
1,0
2,0
3,0
4,0
5,0
6,0
7,0
0
10
20
30
40
50
60
0 20 40 60 80 100 120V
LR
(k
g C
OD
/m3
.da
y)
Co
nce
ntr
ati
on
(m
g/g
VS
S)
Time (day)
Soluble protein Soluble polysaccharides SMP VLR
Page 44
36
Figure 26BoundEPS concentration in sludge and VLR
4.2.3 Membrane cleaning
Membrane cleaning was done when the membrane fouled indicated with a high TMP, and
when new operation was conducted, which needed a clean membrane to get more
representative results. In this study, membrane was cleaned 4 times: once in phase 1 and 2
and twice in phase 3 (Figure 27). The cleaning solutions, water, NaOCl (500ppm) and citric
acid (1%) were used successively to remove cake layer, organic and inorganic deposits,
respectively. After the whole cleaning procedure, the membrane permeability increased to
varying degrees. On day 77 and 99, the membrane was operated at higher permeate fluxes
(Table 14), hence, the permeability before cleaning were comparatively higher. During the
first 3 cleaning process, permeability increased higher by water rinsing than by NaOCl
cleaning. However, the 4th
one showed the opposite trend. This result indicates that cake
layer played more important role than organic depositin membrane fouling in the first 3
cases, and the opposite in the last one. In all processes except for the 3rd
one, citric acid
removed a high amount of inorganic fouling.Except for the cleaning efficiency, sludge
property determined the permeability as well. The highest permeability shown in Figure 27
may be due to the high sludge supernatant filterability (Table 14) on that day. Overall, the
permeability at 114th
day was the worst. It indicated that more irrecoverable fouling was
formed. The membrane resistance trend in Figure 28 shows the same result gotten from
permeability measurements. The high resistance during the first cleaning may be due to the
poor sludge filterability, and the high values of the last time may due to the irrecoverable
fouling of membrane.
0,0
1,0
2,0
3,0
4,0
5,0
6,0
7,0
0
10
20
30
40
50
60
70
80
90
0 20 40 60 80 100 120
VL
R (
kg
CO
D/m
3.d
ay
)
Co
nce
ntr
ati
on
(m
g/g
VS
S)
Time (day)
Bound protein Bound polysaccharides Bound EPS VLR
Page 45
37
Figure 27 Permeability change in membrane cleaning
Figure 28 Membrane resistance change in membrane cleaning
Table 14 TMP, flux and permeability and membrane resistance in membrane cleaning
Procedure Parameter Unit Day
28 77 99 114
before
cleaning
TMP mbar 496 380 220 786
instant flux L/h.m2 4.9 18.1 11.1 8.1
permeability (at 20 oC)
L/h.m2.bar 6 31 33 7
resistance (at 20 oC) *10
12 m
-1 56 11 11 53
0
20
40
60
80
100
120
140
160
180
day 28 day 77 day 99 day 114
per
mea
bil
ity
(a
t 2
0 o
C)(
L/h
.m2
.ba
r)
before cleaning after water rinsing after NaOCl after citric acid
0
10
20
30
40
50
60
day 28 day 77 day 99 day 114
resi
sta
nce
(a
t 2
0 o
C)(
*1
01
2 m
-1)
before cleaning after water rinsing after NaOCl after citric acid
Page 46
38
after water
rinsing
TMP mbar 180 235 130 660
instant flux L/h.m2 4.9 18.1 11.4 8.7
permeability (at 20 oC)
L/h.m2.bar 18 51 58 9
resistance (at 20 oC) *10
12 m
-1 20 7 6 42
after NaOCl TMP mbar 134 220 150 340
instant flux L/h.m2 5.0 18.1 11.1 9.5
permeability (at 20 oC)
L/h.m2.bar 25 54 49 18
resistance (at 20 oC) *10
12 m
-1 15 7 7 20
after citric
acid
TMP mbar 53 75 120 155
instant flux L/h.m2 5.0 18.1 11.4 10.3
permeability (at 20 oC)
L/h.m2.bar 62 159 62 44
resistance (at 20 oC) *10
12 m
-1 6 2 6 8
supernatant filterability mL/min 0.22 0.45 0.31 0.3
One ICP analysis was conducted on the collected NaOCl solution and citric acid after
cleaning on day 99. The membrane was severe fouled on day 99. From the permeability
change shown in Figure 27, the membrane could not be recovered totally by cleaning.
Hence the results of ICP analyses (Table 15) are not representative for the exact
concentrations of inorganic foulants. But they are indicators of foulants composition.
Ferrum and Calcium precipitation were the major causes of fouling according to the
difference concentrations in NaOCl solution and citric acid. The high amount of Sodium
was from the cleaning solution itself after NaOCl cleaning.
Table 15 ICP analyses of cleaning solutions
Sample Unit Fe Ca K Mg Mn Cu Zn Al S Total
P
Na
NaOCl
solution
mg/l 0.31 6.7 43.9 1.4 <0.002 0.09 0.01 0.02 0.8 1.3 205
Citric
acid
mg/l 34.7 23 46.8 2 0.02 0.38 0.12 0.16 <
0.6
9.4 93.5
4.2.4 Membrane autopsy
Since the membrane was heavily fouled after the experiment, the membrane samples after
each cleaning process were sent to have SEM (Scanning Electron Microscopy) and EDX
(Energy Dispersive X-ray) analyses to investigate the reasons of fouling.
The 5 samples sent for SEM analysis are list in Table 16 and the autopsy pictures of them
are shown in Figure 29 to Figure 33. The fluffy layer upon the dark black layer shown in
Figure 29 is the so-called cake layer in this study. It was easily removed by water rinsing,
Page 47
39
since this layer is totally disappeared in Figure 30. The dark black layer
appeared in each figure may be a density and compacted layer which caused fouling of
membrane. This layer cannot be removed by water, NaOCl and citric acid. The cracks in
Figure 31, Figure 32 and Figure 33 were due to the drying process before
this analysis. Some crystals shown in Figure 31 were the inorganic precipitates like
Ca3(PO4)2 and CaCO3, which could not be removed by NaOCl but could be removed by
citric acid since no such crystals appearing in Figure 32. Those white
spots in Figure 33 may be precipitates that cannot be removed by both NaOCl and citric
acid, like Fe2S3 and CuS. This deduction will be explained in the following EDX analysis
section.
Table 16 Membrane samples for SEM analysis
Sample 1 Membrane with cake layer before membrane cleaning
Sample 2 Membrane without cake layer after rinsing with water
Sample 3 Membrane after NaOCl
Sample 4 Membrane after 1% citric acid and soaking for 1 hour
Sample 5 Membrane after NaOCl and then 1% ciric acid
Figure 29 Membrane with cake layer Figure 30 Membrane without cake layer after water rinsing
Figure 31 Membrane after NaOCl Figure 32 Membrane after 1% citric acid soak for 1hour
Page 48
40
Figure 33 Membrane after NaOCl and 1% citric acid
To make a better interpretation of the membrane fouling, the cross sections of a fouled
membrane and a new one were both analyzed by SEM. The comparison of them is shown
in Figure 34. It is obvious that the membrane was totally blocked after this experiment.
There were some crystals even observed in the supporting material of this membrane.
(a) (b)
Figure 34The cross section of membrane: (a) fouled membrane; (b) new membrane
The EDX analysis provided the elemental composition of the membrane surface. In this
case, the elemental composition of fouling can be identified. The results of EDX analysis
are shown in Table 17. The order of samples is the same as that of SEM analysis inTable
16.For all the values of elementals, the uneven distribution should be taken into
consideration. It is reasonable to have distinctive values since the detective points were
random. Fluorine was detected in sample 2,4,5, which indicated that the dense dark black
layer was very thin and had not a clear boundary with the membrane, since the only source
of fluorine is the PVDF membrane itself.Almost no Calcium and Phosphorus was
detectedin sample 4 and 5 after soaking in citric acid. Hence, Calcium precipitation like
Ca3(PO4)2 and CaCO3 could be easily removed by citric acid in this case. Ferrum, Copper
and Sulfur appeared in all the five samples. Both NaOCl and citric acid could not remove
them. The obstinate precipitation could be Fe2S3 and CuS.
Page 49
41
Table 17 Elemental composition of fouling by EDX analysis
Parameter C N O F Mn S Ca P Fe K Cu
Sample 1 55 - 25 - 5 4 4 4 4 - 5
Sample 2 27 - 11 43 - 5 2 - 6 - 7
Sample 3 22 - 26 - - 7 20 11 7 - 8
Sample 4 27 - - 42 - 9 1 - 9 - 12
Sample 5 29 - - 44 - 8 - - 7 - 12
New membrane
inner surface
68 6 3 23 - - - - - - -
The results from SEM and EDX analyses showed that the membrane was fouled by
inorganic precipitation. 1% citric acid was effective at Calcium precipitation removal but
cannot remove Fe2S3 and CuS. To improve the cleaning efficiency, higher percentage of
citric acid or more strong acid should be applied. To prolong the soaking time could also be
an alternative.
5. Conclusion This study investigated a new method, anaerobic membrane bioreactor, to treat cheese
whey.In this operation, the highest VLR applied was 4.5 kg COD/m3.day, and the highest flux
could be achieved was 18 LMH. The average COD removal efficiency is as high as 96%.
Compared with other anaerobic cheese whey treatment conducted by other people, this
result is not satisfying. The main reason was the poor activity of municipal sludge. Adding
crushed granular sludge was proven to be not efficient to boost the biomass activity. In
addition, the high concentration of TSS that brought by this addition made membrane
filtration worse. An alternative to improve the sludge quality could be adding nitrogen
source. The following experiment after this study showed nitrogen was the limiting
elemental of biomass growth. And it was also proved that a higher VLR could be applied
after increase the nitrogen concentration of whey.
Inorganic precipitation was the main cause of fouling. The cleaning process cannot remove
the dense layer on the membrane. Stronger acid or longer soaking time could be applied to
improve the cleaning protocol for better results. On the other hand, the sources and
distribution of inorganic elementals were not very clear. Mass balance of these elementals
should have been done for better interpretation.
Even though this study was not a completed one ending with the optimum biological and
filtration performance, it was worthwhile to explore the alternatives to treat cheese whey in
a more efficient and economical way.
Page 50
42
Reference: Affertsholt, T. (2009). International Whey Market Overview. 2009 ADPI/ABI Annual Conference.
APHA (2005). Standard Methods for Examination of Water and Wastewater. Washington DC, American Public Health Association.
BARKER, D. J. and D. C. STUCKEY (1999). "A REVIEW OF SOLUBLE MICROBIAL PRODUCTS (SMP)
IN WASTEWATER TREATMENT SYSTEMS." Water Research33: 3063-3082.
Charfi, A., N. Ben Amar, et al. (2012). "Analysis of fouling mechanisms in anaerobic membrane bioreactors." Water Research46(8): 2637-2650.
Chen, Y., J. J. Cheng, et al. (2008). "Inhibition of anaerobic digestion process: A review." Bioresource Technology99(10): 4044-4064.
clech, P. L. (2003). "Critical flux determination by the flux-step method in a submerged membrane bioreactor." Journal of Membrane Science227: 81-93.
Drews, A., C.-H. Leeb, et al. (2006). "Membrane fouling – a review on the role of EPS " Desalination200: 186-188.
Fan, F., H. Zhou, et al. (2006). "Identification of wastewater sludge characteristics to predict critical flux for membrane bioreactor processes." Water Research40(2): 205-212.
Grélot, A., R. K. Dereli, et al. (2012). Influence of SRT on performance of Anaerobic MBRs treating thin stillage.
Houghton, J., J. Quarmby, et al. (2001). "Municipal wastewater sludge dewaterability and the presence of microbial extracellular polymer." Water Science & Technology44(2-3): 373-379.
Huisman, M. and W. G. M. v. Kesteren (1998). "Consolidation theory applied to the capillary suction time (CST) apparatus." Water Science and Technology37(6-7): 117-124.
Jeison, D. (2007). ANAEROBIC MEMBRANE BIOREACTORS FOR WASTEWATER TREATMENT: FEASIBILITY AND POTENTIAL APPLICATIONS. Wageningen, The Netherlands, Wageningen University.
Page 51
43
Jeison, D., I. Días, et al. (2008). "Anaerobic membrane bioreactors: Are membranes really necessary?" Electronic Journal of Biotechnology11(4): 0-0.
Judd, S. (2011). The MBR Book. Principles and Applications of Membrane Bioreactors for Water and Wastewater Treatment. Oxford, UK, Elsevier.
Kennedy, J. F., P. S. Panesar, et al. (2007). "Bioutilisation of whey for lactic acid production." Food Chemistry105(1-14).
Kosaric, N. and Y. J. Asher (1985). "The utilization of cheese whey and its components." Advances in Biochemical Engineering/Biotechnology,32: 25-60.
Laspidou, C. S. and B. E. Rittmann (2002). "A unified theory for extracellular polymeric substances, soluble microbial products, and active and inert biomass." Water Research36: 2711-2720.
Lin, H. J., K. Xie, et al. (2010). "Factors affecting sludge cake formation in a submerged anaerobic membrane bioreactor." Journal of Membrane Science361(1-2): 126-134.
Malaspina, F., C. M. Cellamare, et al. (1996). "Anaerobic treatment of cheese whey with a downflow-upflow hybrid reactor." Bioresource Technology55: 131-139.
Menniti, A. and E. Morgenroth (2010). "Mechanisms of SMP production in membrane bioreactors: Choosing an appropriate mathematical model structure." Water Research44: 5240-5251.
Mikkelsen, L. H. and K. Keiding (2002). "Physico-chemical characteristics of full scale sewage sludges with implications to dewatering." Water Research36: 2451–2462.
Pan, J. R., Y.-C. Su, et al. (2010). "Effect of sludge characteristics on membrane fouling in membrane bioreactors." Journal of Membrane Science349(1-2): 287-294.
Prazeres, A. R., F. Carvalho, et al. (2012). "Cheese whey management: A review." Journal of Environmental Management110: 48-68.
Saddoud, A., I. Hassairi, et al. (2007). "Anaerobic membrane reactor with phase separation for the treatment of cheese whey." Bioresource Technology98(11): 2102-2108.
Page 52
44
Sansonetti, S., S. Curcio, et al. (2009). "Bio-ethanolproduction by fermentation of ricottacheesewhey as an effectivealternativenon-vegetable source." Biomass and Bioenergy33: 1687-1692.
Siso, M. I. G. (1996). "THE BIOTECHNOLOGICAL UTILIZATION OF CHEESE
WHEY: A REVIEW " Bioresource Technology57: 1-17.
Skouteris, G., D. Hermosilla, et al. (2012). "Anaerobic membrane bioreactors for wastewater treatment: A review." Chemical Engineering Journal198-199: 138-148.
Souza, R. R. d., R. Bergamasco, et al. (2010). "Recovery and purification of lactose from whey." chemical Engineering and Processing49: 1137-1143.
Vandevivere, P. (1999). "New and Broader Applications of Anaerobic Digestion." Critical Reviews in Environmental Science and Technology29(2): 151-173.
Wit, J. N. d. (2001). Lecturer's Handbook on Whey and Whey Products. 14, Rue Montoyer, 1000 Brussels, Belgium, European Whey Products Association (EWPA).