Page 1
N15/4/BIOLO/SP3/ENG/TZ0/XX
BiologyStandard levelPaper 3
Friday 6 November 2015 (afternoon)Candidate session number
1 hour
Instructions to candidates
• Write your session number in the boxes above.• Do not open this examination paper until instructed to do so.• Answer all of the questions from two of the options.• Write your answers in the boxes provided.• A calculator is required for this paper.• The maximum mark for this examination paper is [36 marks].
Option QuestionsOption A — Human nutrition and health 1 – 3Option B — Physiology of exercise 4 – 6Option C — Cells and energy 7 – 9Option D — Evolution 10 – 12Option E — Neurobiology and behaviour 13 – 15Option F — Microbes and biotechnology 16 – 18Option G — Ecology and conservation 19 – 21
© International Baccalaureate Organization 201531 pages8815 – 6006
32EP01
Page 2
– 2 – N15/4/BIOLO/SP3/ENG/TZ0/XX
Option A — Human nutrition and health
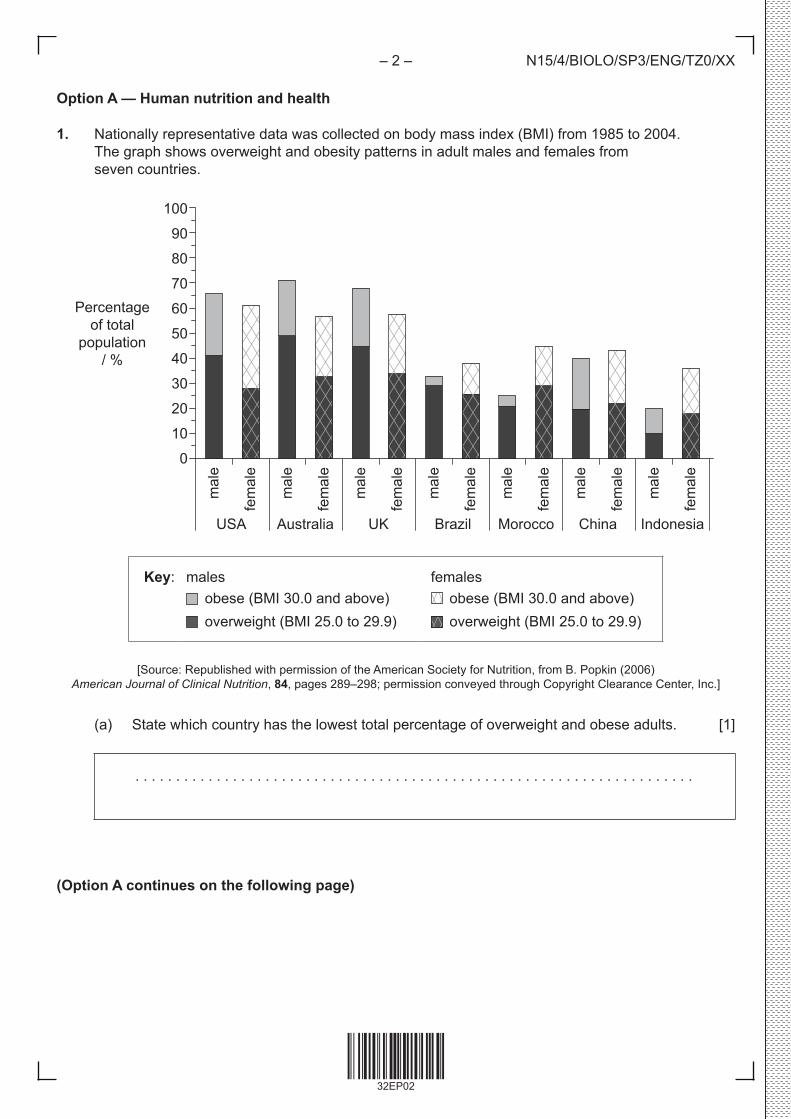
1. Nationally representative data was collected on body mass index (BMI) from 1985 to 2004. The graph shows overweight and obesity patterns in adult males and females from seven countries.
Percentage of total
population / %
100
90
80
70
60
50
40
30
20
10
0
m
ale
fem
ale
mal
e
fem
ale
mal
e
fem
ale
mal
e
fem
ale
mal
e
fem
ale
mal
e
fem
ale
mal
e
fem
ale
USA Australia UK Brazil Morocco China Indonesia
Key: males obese (BMI 30.0 and above) overweight (BMI 25.0 to 29.9)
females obese (BMI 30.0 and above) overweight (BMI 25.0 to 29.9)
[Source: Republished with permission of the American Society for Nutrition, from B. Popkin (2006) American Journal of Clinical Nutrition, 84, pages 289–298; permission conveyed through Copyright Clearance Center, Inc.]
(a) State which country has the lowest total percentage of overweight and obese adults. [1]
. . . . . . . . . . . . . . . . . . . . . . . . . . . . . . . . . . . . . . . . . . . . . . . . . . . . . . . . . . . . . . . . . . . . .
(Option A continues on the following page)
32EP02
Page 3
– 3 –
Turn over
N15/4/BIOLO/SP3/ENG/TZ0/XX
(Option A, question 1 continued)
(b) Distinguish between the levels of male obesity and female obesity. [2]
. . . . . . . . . . . . . . . . . . . . . . . . . . . . . . . . . . . . . . . . . . . . . . . . . . . . . . . . . . . . . . . . . . . . . . . . . . . . . . . . . . . . . . . . . . . . . . . . . . . . . . . . . . . . . . . . . . . . . . . . . . . . . . . . . . . . . . . . . . . . . . . . . . . . . . . . . . . . . . . . . . . . . . . . . . . . . . . . . . . . . . . . . . . . . . . . . . . . . . . . . . . . . . . . . . . . . . . . . . . . . . . . . . . . . . . . . . . . . . . . . . . . . . . . . . . . . . . . . . . . . . . . . . . . . . . . . . . .
(c) Compare the overweight and obesity patterns in Australia and Morocco. [2]
. . . . . . . . . . . . . . . . . . . . . . . . . . . . . . . . . . . . . . . . . . . . . . . . . . . . . . . . . . . . . . . . . . . . . . . . . . . . . . . . . . . . . . . . . . . . . . . . . . . . . . . . . . . . . . . . . . . . . . . . . . . . . . . . . . . . . . . . . . . . . . . . . . . . . . . . . . . . . . . . . . . . . . . . . . . . . . . . . . . . . . . . . . . . . . . . . . . . . . . . . . . . . . . . . . . . . . . . . . . . . . . . . . . . . . . . . . . . . . . . . . . . . . . . . . . . . . . . . . . . . . . . . . . . . . . . . . . .
(d) Suggest two possible reasons for the differences in BMI from the reported countries. [2]
1. . . . . . . . . . . . . . . . . . . . . . . . . . . . . . . . . . . . . . . . . . . . . . . . . . . . . . . . . . . . . . . . . . . . . . . . . . . . . . . . . . . . . . . . . . . . . . . . . . . . . . . . . . . . . . . . . . . . . . . . . . . . . . . . .
2. . . . . . . . . . . . . . . . . . . . . . . . . . . . . . . . . . . . . . . . . . . . . . . . . . . . . . . . . . . . . . . . . . . . . . . . . . . . . . . . . . . . . . . . . . . . . . . . . . . . . . . . . . . . . . . . . . . . . . . . . . . . . . . . .
(Option A continues on the following page)
32EP03
Page 4
– 4 – N15/4/BIOLO/SP3/ENG/TZ0/XX
(Option A continued)
2. (a) List two natural food sources of vitamin D in human diets. [1]
1. . . . . . . . . . . . . . . . . . . . . . . . . . . . . . . . . . . . . . . . . . . . . . . . . . . . . . . . . . . . . . . . .
2. . . . . . . . . . . . . . . . . . . . . . . . . . . . . . . . . . . . . . . . . . . . . . . . . . . . . . . . . . . . . . . . .
(b) DiscusshowtheriskofvitaminDdeficiencyfrominsufficientexposuretosunlightcanbe balanced against overexposure. [3]
. . . . . . . . . . . . . . . . . . . . . . . . . . . . . . . . . . . . . . . . . . . . . . . . . . . . . . . . . . . . . . . . . . . . . . . . . . . . . . . . . . . . . . . . . . . . . . . . . . . . . . . . . . . . . . . . . . . . . . . . . . . . . . . . . . . . . . . . . . . . . . . . . . . . . . . . . . . . . . . . . . . . . . . . . . . . . . . . . . . . . . . . . . . . . . . . . . . . . . . . . . . . . . . . . . . . . . . . . . . . . . . . . . . . . . . . . . . . . . . . . . . . . . . . . . . . . . . . . . . . . . . . . . . . . . . . . . . . . . . . . . . . . . . . . . . . . . . . . . . . . . . . . . . . . . . . . . . . . . . . . . . . . . . . . . . . . . . . . . . . . . . . . . . . . . . . . . . . . . . . . . . . . . . . . . . . . . . . . . . . . . . . . . . . . . . . . . . . . . . . . . . . . . . . . . . . . .
(Option A continues on the following page)
32EP04
Page 5
– 5 –
Turn over
N15/4/BIOLO/SP3/ENG/TZ0/XX
(Option A continued)
3. (a) Inthepast,foodcompanieshavepromotedartificialmilkoverbreastfeeding.Distinguishbetweenthecompositionofartificialmilkusedforbottle-feedingbabies and human milk. [2]
. . . . . . . . . . . . . . . . . . . . . . . . . . . . . . . . . . . . . . . . . . . . . . . . . . . . . . . . . . . . . . . . . . . . . . . . . . . . . . . . . . . . . . . . . . . . . . . . . . . . . . . . . . . . . . . . . . . . . . . . . . . . . . . . . . . . . . . . . . . . . . . . . . . . . . . . . . . . . . . . . . . . . . . . . . . . . . . . . . . . . . . . . . . . . . . . . . . . . . . . . . . . . . . . . . . . . . . . . . . . . . . . . . . . . . . . . . . . . . . . . . . . . . . . . . . . . . . . . . . . . . . . . . . . . . . . . . . . . . . . . . . . . . . . . . . . . . . . . . . . . . . . . . . . . . . . . . . . . . . . . . . . . . . . . . . . . . . . . . . . . . . . . . . . . . . . . . . . . . . . . . . . . . . . . . . . . . . . . . . . . . . . . . . . . . . . . . . . . . . . . . . . . . . . . . . . . .
(b) Explain the possible health consequences of a high fat diet. [3]
. . . . . . . . . . . . . . . . . . . . . . . . . . . . . . . . . . . . . . . . . . . . . . . . . . . . . . . . . . . . . . . . . . . . . . . . . . . . . . . . . . . . . . . . . . . . . . . . . . . . . . . . . . . . . . . . . . . . . . . . . . . . . . . . . . . . . . . . . . . . . . . . . . . . . . . . . . . . . . . . . . . . . . . . . . . . . . . . . . . . . . . . . . . . . . . . . . . . . . . . . . . . . . . . . . . . . . . . . . . . . . . . . . . . . . . . . . . . . . . . . . . . . . . . . . . . . . . . . . . . . . . . . . . . . . . . . . . . . . . . . . . . . . . . . . . . . . . . . . . . . . . . . . . . . . . . . . . . . . . . . . . . . . . . . . . . . . . . . . . . . . . . . . . . . . . . . . . . . . . . . . . . . . . . . . . . . . . . . . . . . . . . . . . . . . . . . . . . . . . . . . . . . . . . . . . . . .
(c) The recommended intake of vitamin C was determined by experiments involving humans and small mammals. Outline the role of animal testing in determining the recommended levels of vitamin C. [2]
. . . . . . . . . . . . . . . . . . . . . . . . . . . . . . . . . . . . . . . . . . . . . . . . . . . . . . . . . . . . . . . . . . . . . . . . . . . . . . . . . . . . . . . . . . . . . . . . . . . . . . . . . . . . . . . . . . . . . . . . . . . . . . . . . . . . . . . . . . . . . . . . . . . . . . . . . . . . . . . . . . . . . . . . . . . . . . . . . . . . . . . . . . . . . . . . . . . . . . . . . . . . . . . . . . . . . . . . . . . . . . . . . . . . . . . . . . . . . . . . . . . . . . . . . . . . . . . . . . . . . . . . . . . . . . . . . . . .
End of Option A
32EP05
Page 6
– 6 – N15/4/BIOLO/SP3/ENG/TZ0/XX
Option B — Physiology of exercise
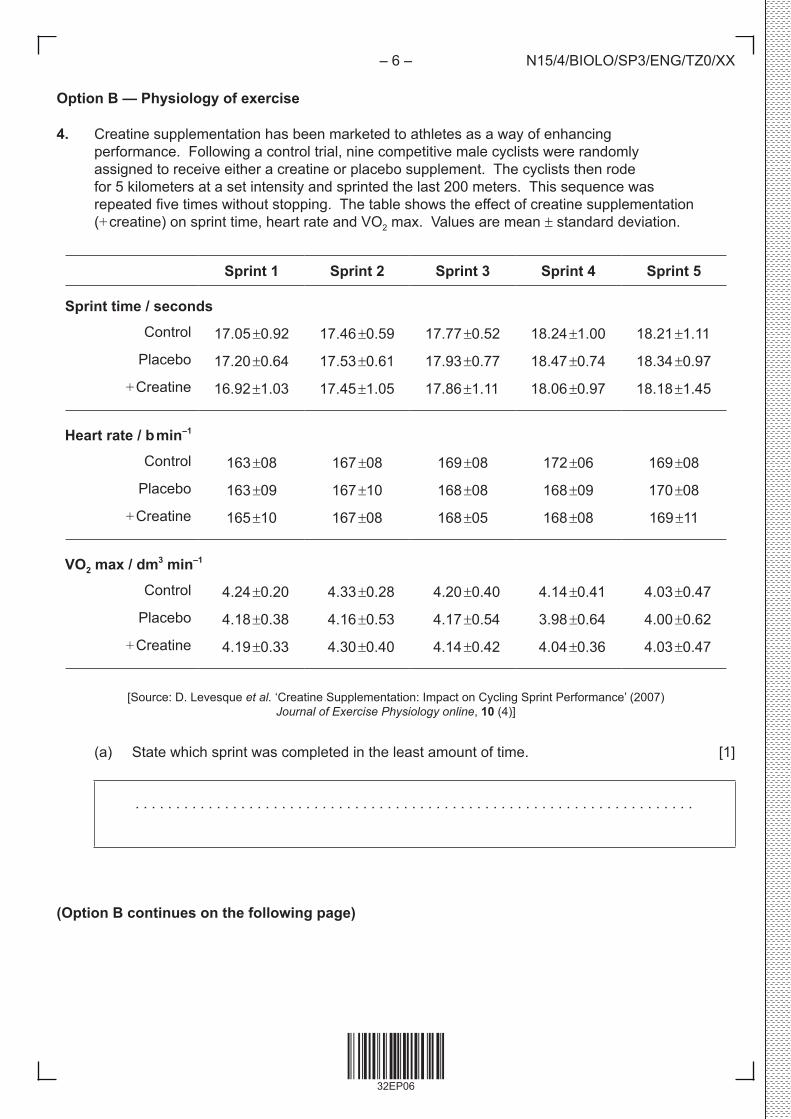
4. Creatine supplementation has been marketed to athletes as a way of enhancing performance. Following a control trial, nine competitive male cyclists were randomly assigned to receive either a creatine or placebo supplement. The cyclists then rode for 5 kilometers at a set intensity and sprinted the last 200 meters. This sequence was repeatedfivetimeswithoutstopping.Thetableshowstheeffectofcreatinesupplementation(+ creatine) on sprint time, heart rate and VO2 max. Values are mean standard deviation.
Sprint 1 Sprint 2 Sprint 3 Sprint 4 Sprint 5
Sprint time / seconds
Control 17.05 0.92 17.46 0.59 17.77 0.52 18.24 1.00 18.21 1.11
Placebo 17.20 0.64 17.53 0.61 17.93 0.77 18.47 0.74 18.34 0.97
+ Creatine 16.92 1.03 17.45 1.05 17.86 1.11 18.06 0.97 18.18 1.45
Heart rate / b min–1
Control 163 08 167 08 169 08 172 06 169 08
Placebo 163 09 167 10 168 08 168 09 170 08
+ Creatine 165 10 167 08 168 05 168 08 169 11
VO2 max / dm3 min–1
Control 4.24 0.20 4.33 0.28 4.20 0.40 4.14 0.41 4.03 0.47
Placebo 4.18 0.38 4.16 0.53 4.17 0.54 3.98 0.64 4.00 0.62
+ Creatine 4.19 0.33 4.30 0.40 4.14 0.42 4.04 0.36 4.03 0.47
[Source: D. Levesque et al. ‘Creatine Supplementation: Impact on Cycling Sprint Performance’ (2007) Journal of Exercise Physiology online, 10 (4)]
(a) State which sprint was completed in the least amount of time. [1]
. . . . . . . . . . . . . . . . . . . . . . . . . . . . . . . . . . . . . . . . . . . . . . . . . . . . . . . . . . . . . . . . . . . . .
(Option B continues on the following page)
32EP06
Page 7
– 7 –
Turn over
N15/4/BIOLO/SP3/ENG/TZ0/XX
(Option B, question 4 continued)
(b) Calculate the difference in VO2 max between the control mean and + creatine in sprint 4, giving the units. [1]
. . . . . . . . . . . . . . . . . . . . . . . . . . . . . . . . . . . . . . . . . . . . . . . . . . . . . . . . . . . . . . . . . . . . .
(c) Outline the effect of placebo and + creatine treatments on heart rate during the trials. [2]
. . . . . . . . . . . . . . . . . . . . . . . . . . . . . . . . . . . . . . . . . . . . . . . . . . . . . . . . . . . . . . . . . . . . . . . . . . . . . . . . . . . . . . . . . . . . . . . . . . . . . . . . . . . . . . . . . . . . . . . . . . . . . . . . . . . . . . . . . . . . . . . . . . . . . . . . . . . . . . . . . . . . . . . . . . . . . . . . . . . . . . . . . . . . . . . . . . . . . . . . . . . . . . . . . . . . . . . . . . . . . . . . . . . . . . . . . . . . . . . . . . . . . . . . . . . . . . . . . . . . . . . . . . . . . . . . . . . .
(d) DefineVO2 max. [1]
. . . . . . . . . . . . . . . . . . . . . . . . . . . . . . . . . . . . . . . . . . . . . . . . . . . . . . . . . . . . . . . . . . . . . . . . . . . . . . . . . . . . . . . . . . . . . . . . . . . . . . . . . . . . . . . . . . . . . . . . . . . . . . . . . . . . . . . . . .
(e) Evaluate the data regarding the hypothesis that creatine supplementation enhances athletic performance. [2]
. . . . . . . . . . . . . . . . . . . . . . . . . . . . . . . . . . . . . . . . . . . . . . . . . . . . . . . . . . . . . . . . . . . . . . . . . . . . . . . . . . . . . . . . . . . . . . . . . . . . . . . . . . . . . . . . . . . . . . . . . . . . . . . . . . . . . . . . . . . . . . . . . . . . . . . . . . . . . . . . . . . . . . . . . . . . . . . . . . . . . . . . . . . . . . . . . . . . . . . . . . . . . . . . . . . . . . . . . . . . . . . . . . . . . . . . . . . . . . . . . . . . . . . . . . . . . . . . . . . . . . . . . . . . . . . . . . . .
(Option B continues on the following page)
32EP07
Page 8
– 8 – N15/4/BIOLO/SP3/ENG/TZ0/XX
(Option B continued)
5. (a) Draw a labelled diagram showing the arrangement of proteins in a sarcomere. [3]
(b) Distinguishbetweenfastmusclefibresandslowmusclefibres. [2]
. . . . . . . . . . . . . . . . . . . . . . . . . . . . . . . . . . . . . . . . . . . . . . . . . . . . . . . . . . . . . . . . . . . . . . . . . . . . . . . . . . . . . . . . . . . . . . . . . . . . . . . . . . . . . . . . . . . . . . . . . . . . . . . . . . . . . . . . . . . . . . . . . . . . . . . . . . . . . . . . . . . . . . . . . . . . . . . . . . . . . . . . . . . . . . . . . . . . . . . . . . . . . . . . . . . . . . . . . . . . . . . . . . . . . . . . . . . . . . . . . . . . . . . . . . . . . . . . . . . . . . . . . . . . . . . . . . . .
(Option B continues on the following page)
32EP08
Page 9
– 9 –
Turn over
N15/4/BIOLO/SP3/ENG/TZ0/XX
(Option B continued)
6. (a) OutlinethemethodofATPproductionusedbymusclefibresduringexerciseofvaryingintensity and duration. [3]
. . . . . . . . . . . . . . . . . . . . . . . . . . . . . . . . . . . . . . . . . . . . . . . . . . . . . . . . . . . . . . . . . . . . . . . . . . . . . . . . . . . . . . . . . . . . . . . . . . . . . . . . . . . . . . . . . . . . . . . . . . . . . . . . . . . . . . . . . . . . . . . . . . . . . . . . . . . . . . . . . . . . . . . . . . . . . . . . . . . . . . . . . . . . . . . . . . . . . . . . . . . . . . . . . . . . . . . . . . . . . . . . . . . . . . . . . . . . . . . . . . . . . . . . . . . . . . . . . . . . . . . . . . . . . . . . . . . . . . . . . . . . . . . . . . . . . . . . . . . . . . . . . . . . . . . . . . . . . . . . . . . . . . . . . . . . . . . . . . . . . . . . . . . . . . . . . . . . . . . . . . . . . . . . . . . . . . . . . . . . . . . . . . . . . . . . . . . . . . . . . . . . . . . . . . . . . .
(b) Discussthepossiblebenefitsofwarm-uproutines. [3]
. . . . . . . . . . . . . . . . . . . . . . . . . . . . . . . . . . . . . . . . . . . . . . . . . . . . . . . . . . . . . . . . . . . . . . . . . . . . . . . . . . . . . . . . . . . . . . . . . . . . . . . . . . . . . . . . . . . . . . . . . . . . . . . . . . . . . . . . . . . . . . . . . . . . . . . . . . . . . . . . . . . . . . . . . . . . . . . . . . . . . . . . . . . . . . . . . . . . . . . . . . . . . . . . . . . . . . . . . . . . . . . . . . . . . . . . . . . . . . . . . . . . . . . . . . . . . . . . . . . . . . . . . . . . . . . . . . . . . . . . . . . . . . . . . . . . . . . . . . . . . . . . . . . . . . . . . . . . . . . . . . . . . . . . . . . . . . . . . . . . . . . . . . . . . . . . . . . . . . . . . . . . . . . . . . . . . . . . . . . . . . . . . . . . . . . . . . . . . . . . . . . . . . . . . . . . . .
End of Option B
32EP09
Page 10
– 10 – N15/4/BIOLO/SP3/ENG/TZ0/XX
Option C — Cells and energy
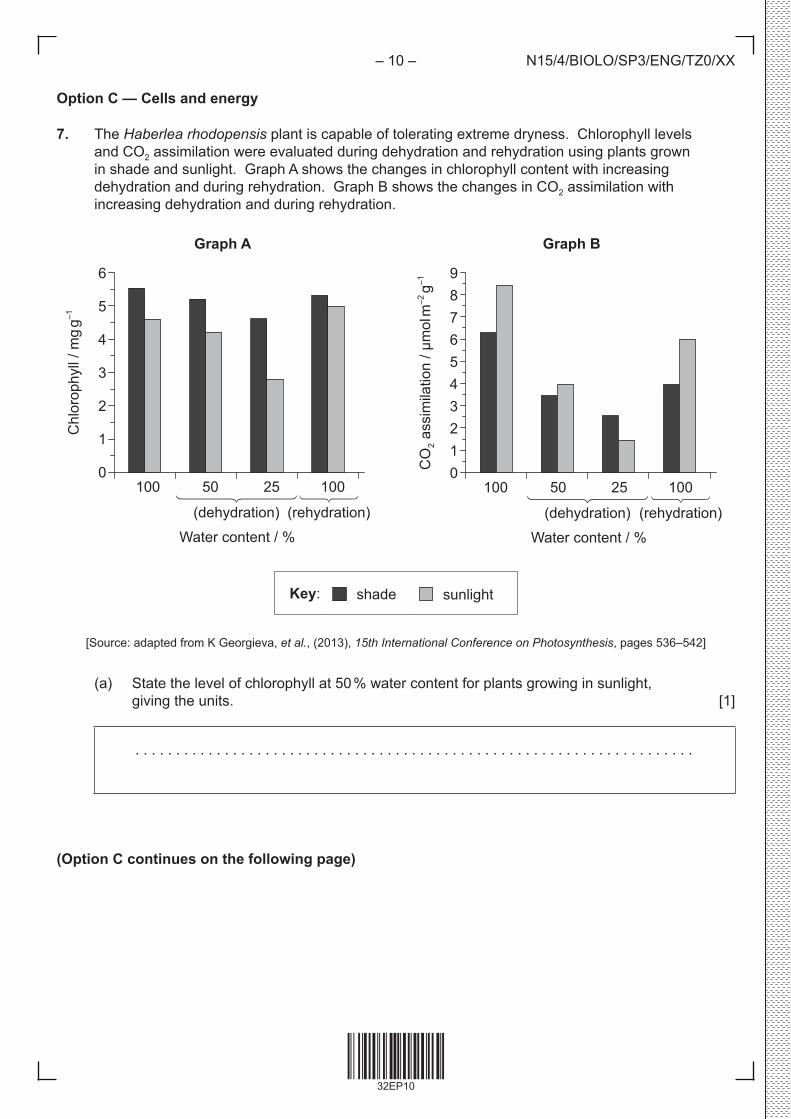
7. The Haberlea rhodopensis plant is capable of tolerating extreme dryness. Chlorophyll levels and CO2 assimilation were evaluated during dehydration and rehydration using plants grown in shade and sunlight. Graph A shows the changes in chlorophyll content with increasing dehydration and during rehydration. Graph B shows the changes in CO2 assimilation with increasing dehydration and during rehydration.
Graph A Graph B
Chl
orop
hyll
/ mg
g–1
6
5
4
3
2
1
0 100 50 25 100 (dehydration) (rehydration)
Water content / %
CO
2 ass
imila
tion
/ µm
ol m
–2 g
–1
9876543210
100 50 25 100 (dehydration) (rehydration)
Water content / %
Key: shade sunlight
[Source: adapted from K Georgieva, et al., (2013), 15th International Conference on Photosynthesis, pages 536–542]
(a) State the level of chlorophyll at 50 % water content for plants growing in sunlight, giving the units. [1]
. . . . . . . . . . . . . . . . . . . . . . . . . . . . . . . . . . . . . . . . . . . . . . . . . . . . . . . . . . . . . . . . . . . . .
(Option C continues on the following page)
32EP10
Page 11
– 11 –
Turn over
N15/4/BIOLO/SP3/ENG/TZ0/XX
(Option C, question 7 continued)
(b) Outline the effect of sunlight and shade on CO2 assimilation during dehydration. [2]
. . . . . . . . . . . . . . . . . . . . . . . . . . . . . . . . . . . . . . . . . . . . . . . . . . . . . . . . . . . . . . . . . . . . . . . . . . . . . . . . . . . . . . . . . . . . . . . . . . . . . . . . . . . . . . . . . . . . . . . . . . . . . . . . . . . . . . . . . . . . . . . . . . . . . . . . . . . . . . . . . . . . . . . . . . . . . . . . . . . . . . . . . . . . . . . . . . . . . . . . . . . . . . . . . . . . . . . . . . . . . . . . . . . . . . . . . . . . . . . . . . . . . . . . . . . . . . . . . . . . . . . . . . . . . . . . . . . .
(c) Compare the effect of rehydration on chlorophyll levels in plants grown in shade and sunlight. [2]
. . . . . . . . . . . . . . . . . . . . . . . . . . . . . . . . . . . . . . . . . . . . . . . . . . . . . . . . . . . . . . . . . . . . . . . . . . . . . . . . . . . . . . . . . . . . . . . . . . . . . . . . . . . . . . . . . . . . . . . . . . . . . . . . . . . . . . . . . . . . . . . . . . . . . . . . . . . . . . . . . . . . . . . . . . . . . . . . . . . . . . . . . . . . . . . . . . . . . . . . . . . . . . . . . . . . . . . . . . . . . . . . . . . . . . . . . . . . . . . . . . . . . . . . . . . . . . . . . . . . . . . . . . . . . . . . . . . .
(d) Using the data, deduce, with a reason, two stages of photosynthesis that may be limited during dehydration in a plant. [2]
. . . . . . . . . . . . . . . . . . . . . . . . . . . . . . . . . . . . . . . . . . . . . . . . . . . . . . . . . . . . . . . . . . . . . . . . . . . . . . . . . . . . . . . . . . . . . . . . . . . . . . . . . . . . . . . . . . . . . . . . . . . . . . . . . . . . . . . . . . . . . . . . . . . . . . . . . . . . . . . . . . . . . . . . . . . . . . . . . . . . . . . . . . . . . . . . . . . . . . . . . . . . . . . . . . . . . . . . . . . . . . . . . . . . . . . . . . . . . . . . . . . . . . . . . . . . . . . . . . . . . . . . . . . . . . . . . . . .
(Option C continues on the following page)
32EP11
Page 12
– 12 – N15/4/BIOLO/SP3/ENG/TZ0/XX
(Option C continued)
8. (a) State onedifferenceinfunctionbetweenfibrousproteinsandglobularproteins. [1]
. . . . . . . . . . . . . . . . . . . . . . . . . . . . . . . . . . . . . . . . . . . . . . . . . . . . . . . . . . . . . . . . . . . . . . . . . . . . . . . . . . . . . . . . . . . . . . . . . . . . . . . . . . . . . . . . . . . . . . . . . . . . . . . . . . . . . . . . . .
(b) Describetheinduced-fitmodelofenzymeaction. [3]
. . . . . . . . . . . . . . . . . . . . . . . . . . . . . . . . . . . . . . . . . . . . . . . . . . . . . . . . . . . . . . . . . . . . . . . . . . . . . . . . . . . . . . . . . . . . . . . . . . . . . . . . . . . . . . . . . . . . . . . . . . . . . . . . . . . . . . . . . . . . . . . . . . . . . . . . . . . . . . . . . . . . . . . . . . . . . . . . . . . . . . . . . . . . . . . . . . . . . . . . . . . . . . . . . . . . . . . . . . . . . . . . . . . . . . . . . . . . . . . . . . . . . . . . . . . . . . . . . . . . . . . . . . . . . . . . . . . . . . . . . . . . . . . . . . . . . . . . . . . . . . . . . . . . . . . . . . . . . . . . . . . . . . . . . . . . . . . . . . . . . . . . . . . . . . . . . . . . . . . . . . . . . . . . . . . . . . . . . . . . . . . . . . . . . . . . . . . . . . . . . . . . . . . . . . . . . .
(Option C continues on the following page)
32EP12
Page 13
– 13 –
Turn over
N15/4/BIOLO/SP3/ENG/TZ0/XX
(Option C continued)
9. (a) Draw a labelled diagram showing the structure of a chloroplast. [3]
(b) Explain how energy is released and used to make ATP by electron carriers in the electron transport chain during aerobic respiration. [4]
. . . . . . . . . . . . . . . . . . . . . . . . . . . . . . . . . . . . . . . . . . . . . . . . . . . . . . . . . . . . . . . . . . . . . . . . . . . . . . . . . . . . . . . . . . . . . . . . . . . . . . . . . . . . . . . . . . . . . . . . . . . . . . . . . . . . . . . . . . . . . . . . . . . . . . . . . . . . . . . . . . . . . . . . . . . . . . . . . . . . . . . . . . . . . . . . . . . . . . . . . . . . . . . . . . . . . . . . . . . . . . . . . . . . . . . . . . . . . . . . . . . . . . . . . . . . . . . . . . . . . . . . . . . . . . . . . . . . . . . . . . . . . . . . . . . . . . . . . . . . . . . . . . . . . . . . . . . . . . . . . . . . . . . . . . . . . . . . . . . . . . . . . . . . . . . . . . . . . . . . . . . . . . . . . . . . . . . . . . . . . . . . . . . . . . . . . . . . . . . . . . . . . . . . . . . . . . . . . . . . . . . . . . . . . . . . . . . . . . . . . . . . . . . . . . . . . . . . . . . . . . . . . . . . . . . . . . . . . . . . . . . . . . . . . . . . . . . . . . . . . . . . . . . . . . . . . . . . . . . . . . . . . . . . . . . . . . . . . . . . . . . . . . . . . . . .
End of Option C
32EP13
Page 14
– 14 – N15/4/BIOLO/SP3/ENG/TZ0/XX
Option D — Evolution
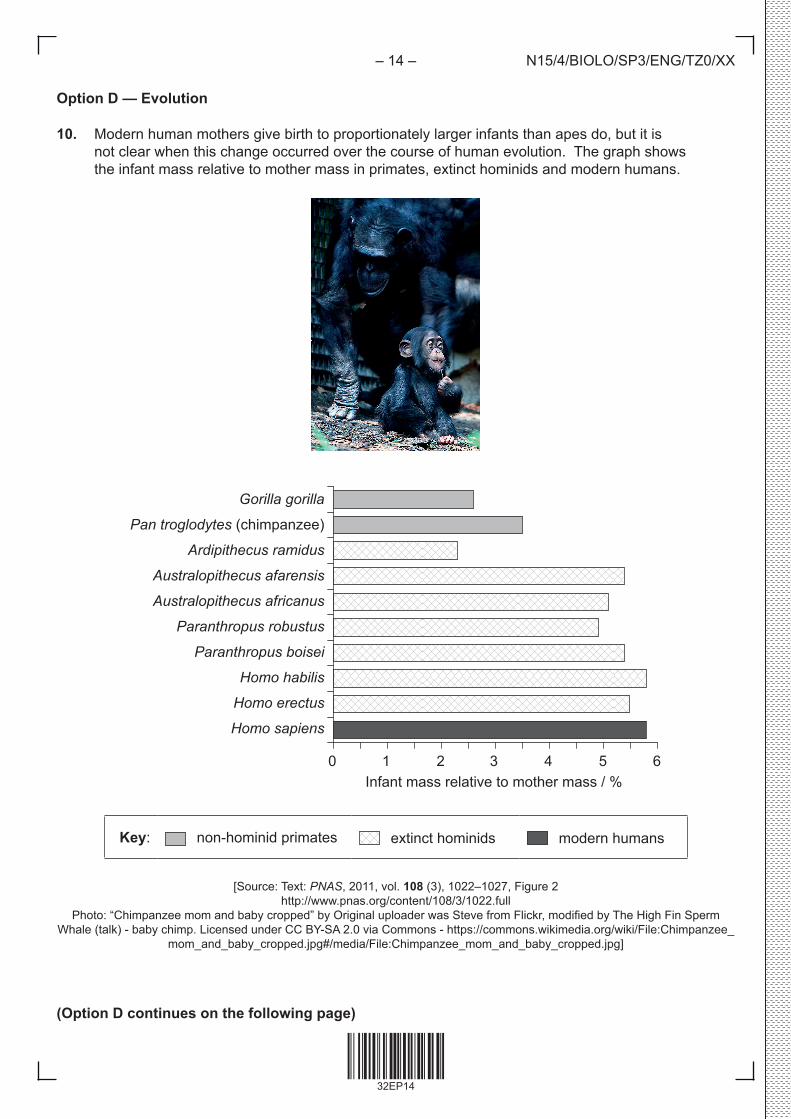
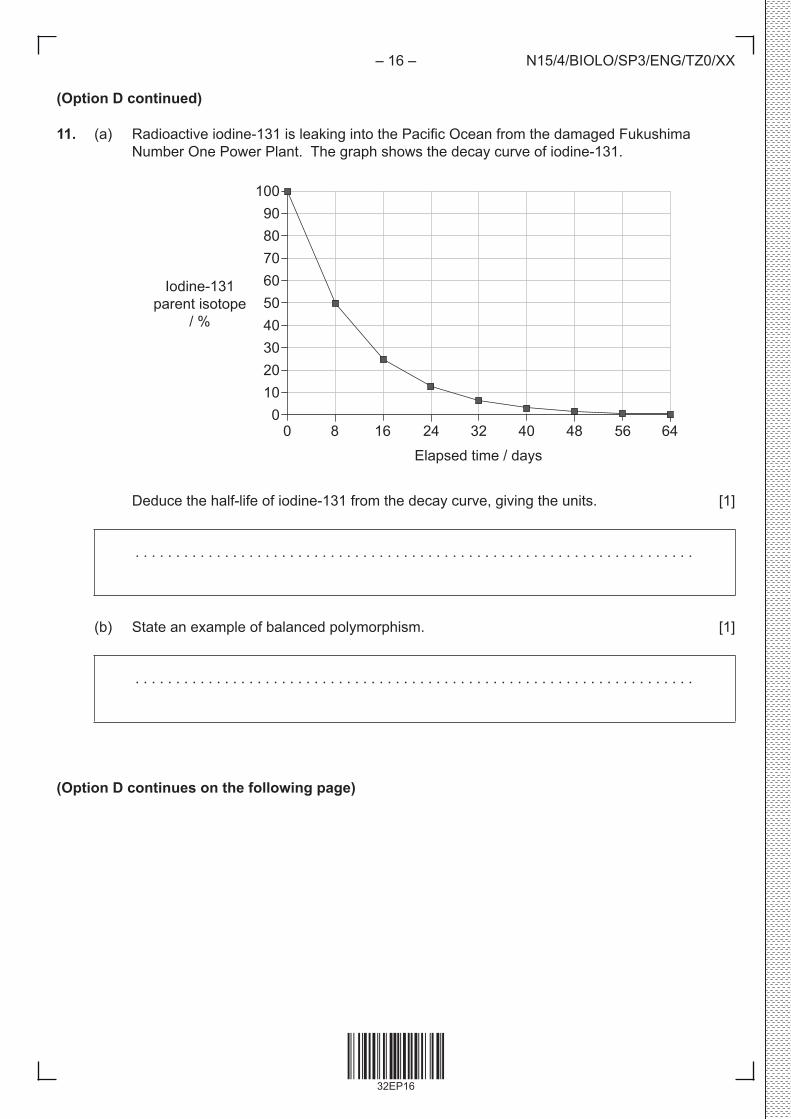
10. Modern human mothers give birth to proportionately larger infants than apes do, but it is not clear when this change occurred over the course of human evolution. The graph shows the infant mass relative to mother mass in primates, extinct hominids and modern humans.
Gorilla gorilla
Pan troglodytes (chimpanzee)
Ardipithecus ramidus
Australopithecus afarensis
Australopithecus africanus
Paranthropus robustus
Paranthropus boisei
Homo habilis
Homo erectus
Homo sapiens
0 1 2 3 4 5 6 Infant mass relative to mother mass / %
Key: non-hominidprimates extinct hominids modern humans
[Source: Text: PNAS, 2011, vol. 108 (3), 1022–1027, Figure 2http://www.pnas.org/content/108/3/1022.full
Photo:“Chimpanzeemomandbabycropped”byOriginaluploaderwasStevefromFlickr,modifiedbyTheHighFinSpermWhale(talk)-babychimp.LicensedunderCCBY-SA2.0viaCommons-https://commons.wikimedia.org/wiki/File:Chimpanzee_
mom_and_baby_cropped.jpg#/media/File:Chimpanzee_mom_and_baby_cropped.jpg]
(Option D continues on the following page)
32EP14
Page 15
– 15 –
Turn over
N15/4/BIOLO/SP3/ENG/TZ0/XX
(Option D, question 10 continued)
(a) State the infant mass relative to mother mass of Homo sapiens. [1]
. . . . . . . . . . . . . . . . . . . . . %
(b) Outline the difference in infant mass relative to mother mass in extinct hominids and modern humans. [1]
. . . . . . . . . . . . . . . . . . . . . . . . . . . . . . . . . . . . . . . . . . . . . . . . . . . . . . . . . . . . . . . . . . . . . . . . . . . . . . . . . . . . . . . . . . . . . . . . . . . . . . . . . . . . . . . . . . . . . . . . . . . . . . . . . . . . . . . . . .
(c) Suggest a hypothesis, based on evidence in the data, for when the shift to giving birth to larger infants occurred in the evolution of humans. [2]
. . . . . . . . . . . . . . . . . . . . . . . . . . . . . . . . . . . . . . . . . . . . . . . . . . . . . . . . . . . . . . . . . . . . . . . . . . . . . . . . . . . . . . . . . . . . . . . . . . . . . . . . . . . . . . . . . . . . . . . . . . . . . . . . . . . . . . . . . . . . . . . . . . . . . . . . . . . . . . . . . . . . . . . . . . . . . . . . . . . . . . . . . . . . . . . . . . . . . . . . . . . . . . . . . . . . . . . . . . . . . . . . . . . . . . . . . . . . . . . . . . . . . . . . . . . . . . . . . . . . . . . . . . . . . . . . . . . .
(d) Suggest one disadvantage of infants being born with a relatively large size in humans. [1]
. . . . . . . . . . . . . . . . . . . . . . . . . . . . . . . . . . . . . . . . . . . . . . . . . . . . . . . . . . . . . . . . . . . . . . . . . . . . . . . . . . . . . . . . . . . . . . . . . . . . . . . . . . . . . . . . . . . . . . . . . . . . . . . . . . . . . . . . . .
(Option D continues on the following page)
32EP15
Page 16
– 16 – N15/4/BIOLO/SP3/ENG/TZ0/XX
(Option D continued)
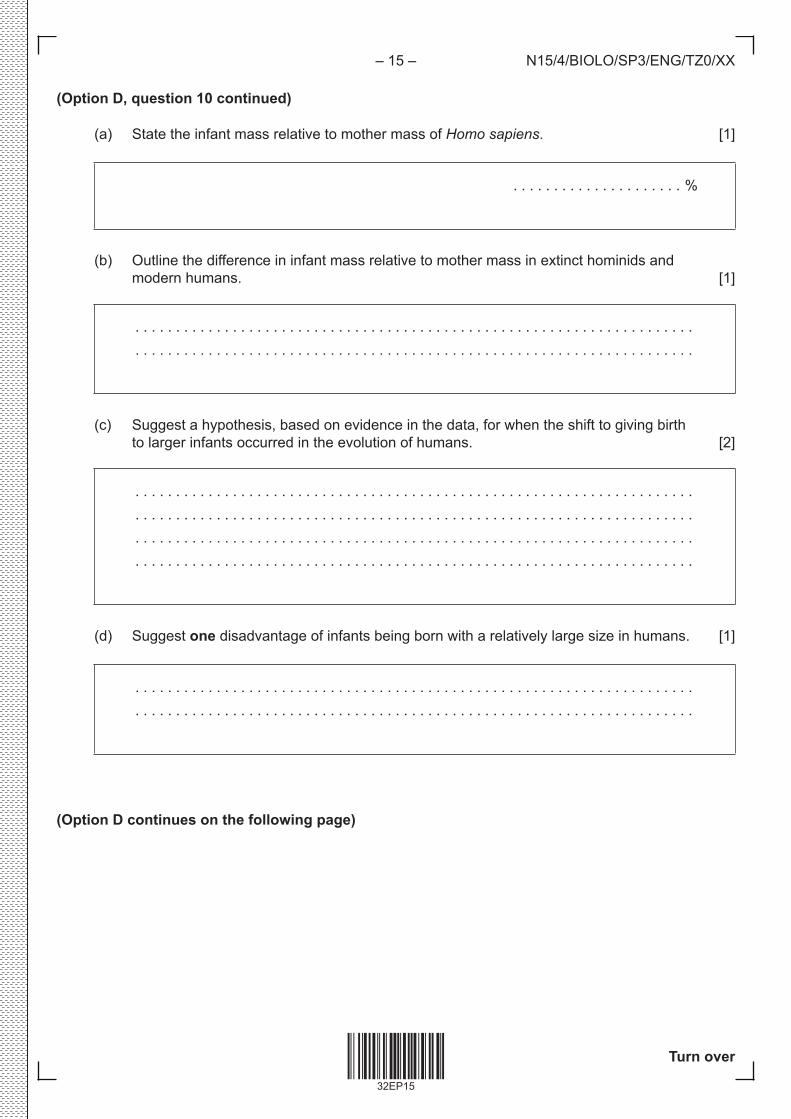
11. (a) Radioactiveiodine-131isleakingintothePacificOceanfromthedamagedFukushimaNumber One Power Plant. Thegraphshowsthedecaycurveofiodine-131.
Iodine-131parent isotope
/ %
1009080706050403020100
0 8 16 24 32 40 48 56 64
Elapsed time / days
Deducethehalf-lifeofiodine-131fromthedecaycurve,givingtheunits. [1]
. . . . . . . . . . . . . . . . . . . . . . . . . . . . . . . . . . . . . . . . . . . . . . . . . . . . . . . . . . . . . . . . . . . . .
(b) State an example of balanced polymorphism. [1]
. . . . . . . . . . . . . . . . . . . . . . . . . . . . . . . . . . . . . . . . . . . . . . . . . . . . . . . . . . . . . . . . . . . . .
(Option D continues on the following page)
32EP16
Page 17
– 17 –
Turn over
N15/4/BIOLO/SP3/ENG/TZ0/XX
(Option D, question 11 continued)
(c) Compare convergent and divergent evolution. [3]
. . . . . . . . . . . . . . . . . . . . . . . . . . . . . . . . . . . . . . . . . . . . . . . . . . . . . . . . . . . . . . . . . . . . . . . . . . . . . . . . . . . . . . . . . . . . . . . . . . . . . . . . . . . . . . . . . . . . . . . . . . . . . . . . . . . . . . . . . . . . . . . . . . . . . . . . . . . . . . . . . . . . . . . . . . . . . . . . . . . . . . . . . . . . . . . . . . . . . . . . . . . . . . . . . . . . . . . . . . . . . . . . . . . . . . . . . . . . . . . . . . . . . . . . . . . . . . . . . . . . . . . . . . . . . . . . . . . . . . . . . . . . . . . . . . . . . . . . . . . . . . . . . . . . . . . . . . . . . . . . . . . . . . . . . . . . . . . . . . . . . . . . . . . . . . . . . . . . . . . . . . . . . . . . . . . . . . . . . . . . . . . . . . . . . . . . . . . . . . . . . . . . . . . . . . . . . .
(Option D continues on the following page)
32EP17
Page 18
– 18 – N15/4/BIOLO/SP3/ENG/TZ0/XX
(Option D continued)
12. (a) There is evidence that prokaryotes were responsible for changes in the atmospheric gases 3.5 billion years ago. Outline the role of bacteria in producing anoxygen-richatmosphere. [3]
. . . . . . . . . . . . . . . . . . . . . . . . . . . . . . . . . . . . . . . . . . . . . . . . . . . . . . . . . . . . . . . . . . . . . . . . . . . . . . . . . . . . . . . . . . . . . . . . . . . . . . . . . . . . . . . . . . . . . . . . . . . . . . . . . . . . . . . . . . . . . . . . . . . . . . . . . . . . . . . . . . . . . . . . . . . . . . . . . . . . . . . . . . . . . . . . . . . . . . . . . . . . . . . . . . . . . . . . . . . . . . . . . . . . . . . . . . . . . . . . . . . . . . . . . . . . . . . . . . . . . . . . . . . . . . . . . . . . . . . . . . . . . . . . . . . . . . . . . . . . . . . . . . . . . . . . . . . . . . . . . . . . . . . . . . . . . . . . . . . . . . . . . . . . . . . . . . . . . . . . . . . . . . . . . . . . . . . . . . . . . . . . . . . . . . . . . . . . . . . . . . . . . . . . . . . . . .
(b) Discuss the evidence supporting the endosymbiotic theory for the origin of eukaryotes. [3]
. . . . . . . . . . . . . . . . . . . . . . . . . . . . . . . . . . . . . . . . . . . . . . . . . . . . . . . . . . . . . . . . . . . . . . . . . . . . . . . . . . . . . . . . . . . . . . . . . . . . . . . . . . . . . . . . . . . . . . . . . . . . . . . . . . . . . . . . . . . . . . . . . . . . . . . . . . . . . . . . . . . . . . . . . . . . . . . . . . . . . . . . . . . . . . . . . . . . . . . . . . . . . . . . . . . . . . . . . . . . . . . . . . . . . . . . . . . . . . . . . . . . . . . . . . . . . . . . . . . . . . . . . . . . . . . . . . . . . . . . . . . . . . . . . . . . . . . . . . . . . . . . . . . . . . . . . . . . . . . . . . . . . . . . . . . . . . . . . . . . . . . . . . . . . . . . . . . . . . . . . . . . . . . . . . . . . . . . . . . . . . . . . . . . . . . . . . . . . . . . . . . . . . . . . . . . . .
(c) Gaining popularity in the early 21st century, the Paleolithic diet recommends following a similardiettotheancienthunter-gatherers.Outlinethecorrelationbetweenthechangein diet and increase in brain size during hominid evolution. [2]
. . . . . . . . . . . . . . . . . . . . . . . . . . . . . . . . . . . . . . . . . . . . . . . . . . . . . . . . . . . . . . . . . . . . . . . . . . . . . . . . . . . . . . . . . . . . . . . . . . . . . . . . . . . . . . . . . . . . . . . . . . . . . . . . . . . . . . . . . . . . . . . . . . . . . . . . . . . . . . . . . . . . . . . . . . . . . . . . . . . . . . . . . . . . . . . . . . . . . . . . . . . . . . . . . . . . . . . . . . . . . . . . . . . . . . . . . . . . . . . . . . . . . . . . . . . . . . . . . . . . . . . . . . . . . . . . . . . . . . . . . . . . . . . . . . . . . . . . . . . . . . . . . . . . . . . . . . . . . . . . . . . . . . . . . . . . . . . . . . . . . . . . . . . . . . . . . . . . . . . . . . . . . . . . . . . . . . . . . . . . . . . . . . . . . . . . . . . . . . . . . . . . . . . . . . . . . .
End of Option D
32EP18
Page 19
– 19 –
Turn over
N15/4/BIOLO/SP3/ENG/TZ0/XX
Please do not write on this page.
Answers written on this page will not be marked.
32EP19
Page 20
– 20 – N15/4/BIOLO/SP3/ENG/TZ0/XX
Option E — Neurobiology and behaviour
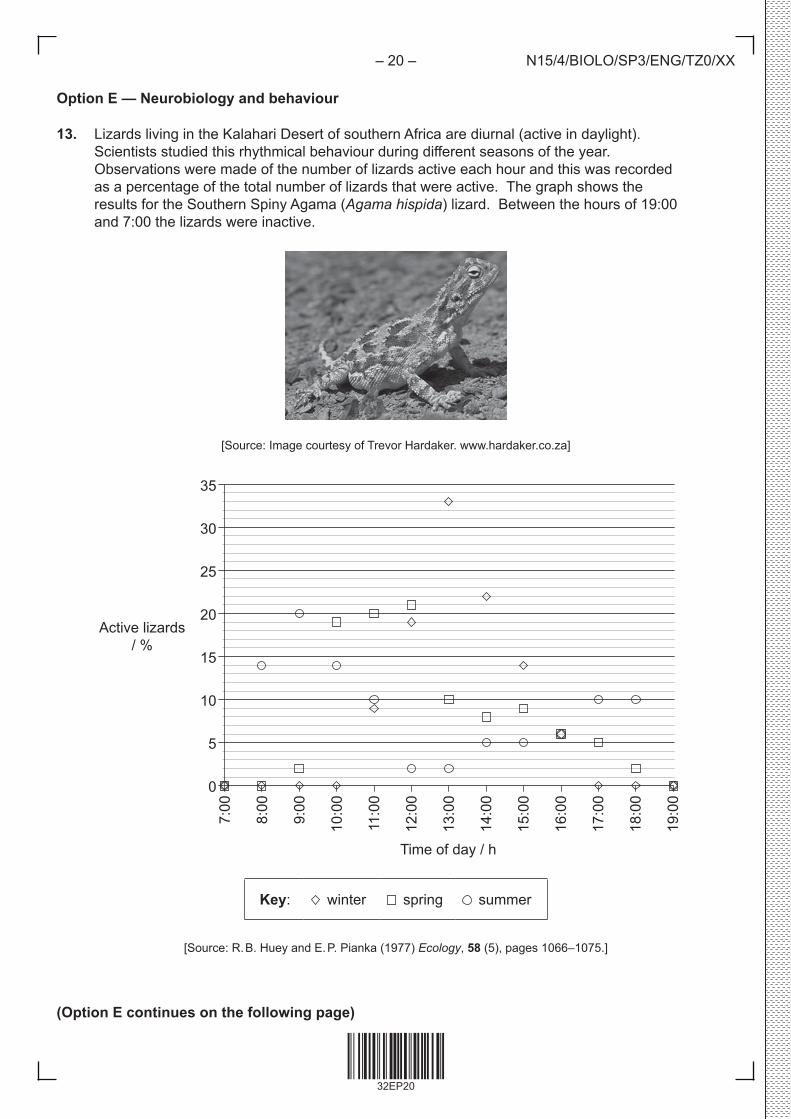
13. Lizards living in the Kalahari Desert of southern Africa are diurnal (active in daylight). Scientists studied this rhythmical behaviour during different seasons of the year. Observations were made of the number of lizards active each hour and this was recorded as a percentage of the total number of lizards that were active. The graph shows the results for the Southern Spiny Agama (Agama hispida) lizard. Between the hours of 19:00 and 7:00 the lizards were inactive.
[Source:ImagecourtesyofTrevorHardaker.www.hardaker.co.za]
Active lizards / %
35
30
25
20
15
10
5
0
7:00
8:00
9:00
10:0
0
11:0
0
12:0
0
13:0
0
14:0
0
15:0
0
16:0
0
17:0
0
18:0
0
19:0
0
Time of day / h
Key: winter spring summer
[Source:R.B.HueyandE.P.Pianka(1977)Ecology, 58 (5), pages 1066–1075.]
(Option E continues on the following page)
32EP20
Page 21
– 21 –
Turn over
N15/4/BIOLO/SP3/ENG/TZ0/XX
(Option E, question 13 continued)
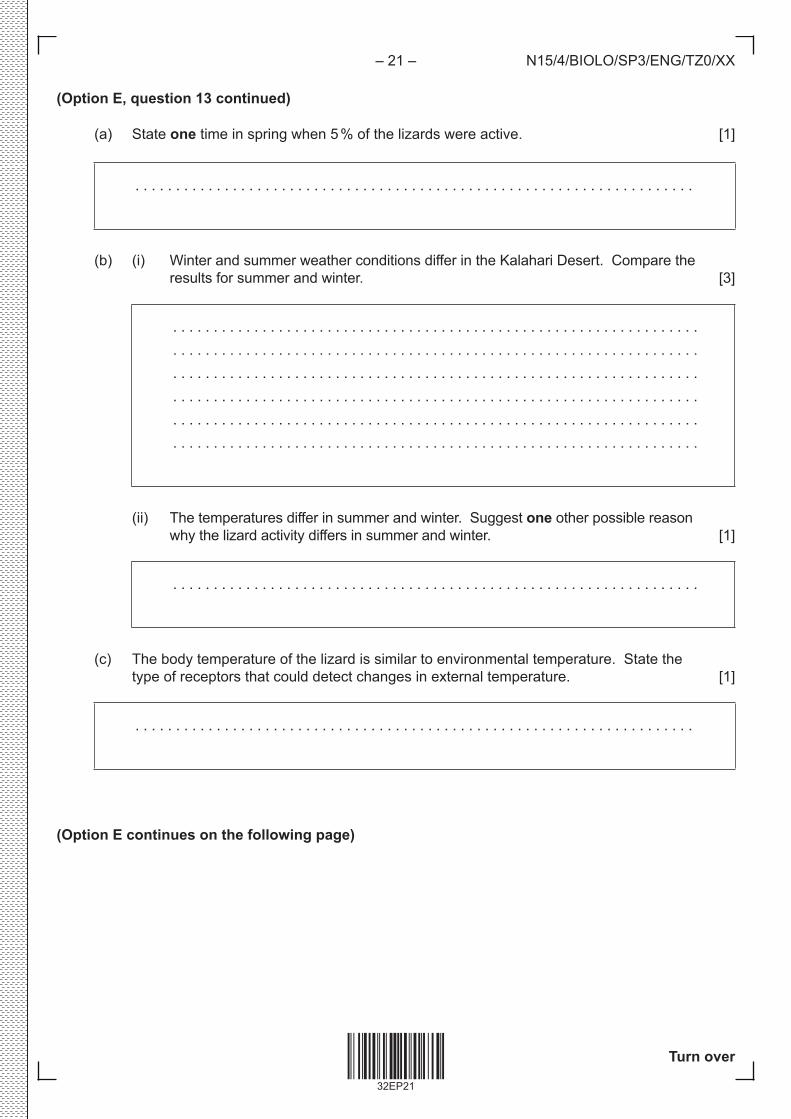
(a) State one time in spring when 5 % of the lizards were active. [1]
. . . . . . . . . . . . . . . . . . . . . . . . . . . . . . . . . . . . . . . . . . . . . . . . . . . . . . . . . . . . . . . . . . . . .
(b) (i) Winter and summer weather conditions differ in the Kalahari Desert. Compare the results for summer and winter. [3]
. . . . . . . . . . . . . . . . . . . . . . . . . . . . . . . . . . . . . . . . . . . . . . . . . . . . . . . . . . . . . . . . . . . . . . . . . . . . . . . . . . . . . . . . . . . . . . . . . . . . . . . . . . . . . . . . . . . . . . . . . . . . . . . . . . . . . . . . . . . . . . . . . . . . . . . . . . . . . . . . . . . . . . . . . . . . . . . . . . . . . . . . . . . . . . . . . . . . . . . . . . . . . . . . . . . . . . . . . . . . . . . . . . . . . . . . . . . . . . . . . . . . . . . . . . . . . . . . . . . . . . . . . . . . . . . . . . . . . . . . . . . . . . . . . . . . . . . . . . . . . . . . . . . . . . . . . . . . . . . . . . . . . . . . . . . . . . . . . . . . . . . . . . . . . . . . . . . . . . . . . . . . . . . . . . . . . . . . . . . . . . . . . . . . . .
(ii) The temperatures differ in summer and winter. Suggest one other possible reason why the lizard activity differs in summer and winter. [1]
. . . . . . . . . . . . . . . . . . . . . . . . . . . . . . . . . . . . . . . . . . . . . . . . . . . . . . . . . . . . . . . . .
(c) The body temperature of the lizard is similar to environmental temperature. State the type of receptors that could detect changes in external temperature. [1]
. . . . . . . . . . . . . . . . . . . . . . . . . . . . . . . . . . . . . . . . . . . . . . . . . . . . . . . . . . . . . . . . . . . . .
(Option E continues on the following page)
32EP21
Page 22
– 22 – N15/4/BIOLO/SP3/ENG/TZ0/XX
(Option E continued)
14. (a) Drawalabelleddiagramofareflexarcforapainwithdrawalreflex. [4]
(b) Distinguish between innate behaviour and learned behaviour. [3]
. . . . . . . . . . . . . . . . . . . . . . . . . . . . . . . . . . . . . . . . . . . . . . . . . . . . . . . . . . . . . . . . . . . . . . . . . . . . . . . . . . . . . . . . . . . . . . . . . . . . . . . . . . . . . . . . . . . . . . . . . . . . . . . . . . . . . . . . . . . . . . . . . . . . . . . . . . . . . . . . . . . . . . . . . . . . . . . . . . . . . . . . . . . . . . . . . . . . . . . . . . . . . . . . . . . . . . . . . . . . . . . . . . . . . . . . . . . . . . . . . . . . . . . . . . . . . . . . . . . . . . . . . . . . . . . . . . . . . . . . . . . . . . . . . . . . . . . . . . . . . . . . . . . . . . . . . . . . . . . . . . . . . . . . . . . . . . . . . . . . . . . . . . . . . . . . . . . . . . . . . . . . . . . . . . . . . . . . . . . . . . . . . . . . . . . . . . . . . . . . . . . . . . . . . . . . . .
(Option E continues on the following page)
32EP22
Page 23
– 23 –
Turn over
N15/4/BIOLO/SP3/ENG/TZ0/XX
(Option E continued)
15. (a) Identify the type of retinal cells that function best in dim light. [1]
. . . . . . . . . . . . . . . . . . . . . . . . . . . . . . . . . . . . . . . . . . . . . . . . . . . . . . . . . . . . . . . . . . . . .
(b) Explain how cocaine affects synaptic transmission at synapses in the brain. [3]
. . . . . . . . . . . . . . . . . . . . . . . . . . . . . . . . . . . . . . . . . . . . . . . . . . . . . . . . . . . . . . . . . . . . . . . . . . . . . . . . . . . . . . . . . . . . . . . . . . . . . . . . . . . . . . . . . . . . . . . . . . . . . . . . . . . . . . . . . . . . . . . . . . . . . . . . . . . . . . . . . . . . . . . . . . . . . . . . . . . . . . . . . . . . . . . . . . . . . . . . . . . . . . . . . . . . . . . . . . . . . . . . . . . . . . . . . . . . . . . . . . . . . . . . . . . . . . . . . . . . . . . . . . . . . . . . . . . . . . . . . . . . . . . . . . . . . . . . . . . . . . . . . . . . . . . . . . . . . . . . . . . . . . . . . . . . . . . . . . . . . . . . . . . . . . . . . . . . . . . . . . . . . . . . . . . . . . . . . . . . . . . . . . . . . . . . . . . . . . . . . . . . . . . . . . . . . .
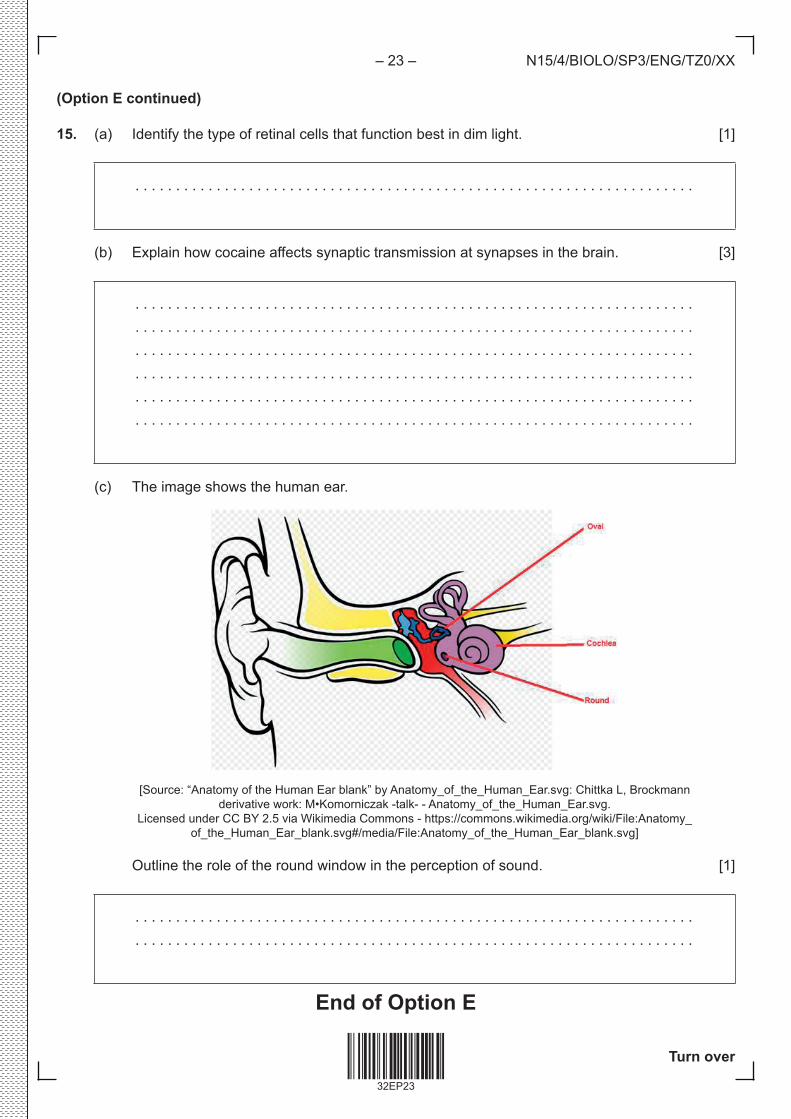
(c) The image shows the human ear.
[Source:“AnatomyoftheHumanEarblank”byAnatomy_of_the_Human_Ear.svg:ChittkaL,Brockmannderivativework:M•Komorniczak-talk--Anatomy_of_the_Human_Ear.svg.
LicensedunderCCBY2.5viaWikimediaCommons-https://commons.wikimedia.org/wiki/File:Anatomy_of_the_Human_Ear_blank.svg#/media/File:Anatomy_of_the_Human_Ear_blank.svg]
Outline the role of the round window in the perception of sound. [1]
. . . . . . . . . . . . . . . . . . . . . . . . . . . . . . . . . . . . . . . . . . . . . . . . . . . . . . . . . . . . . . . . . . . . . . . . . . . . . . . . . . . . . . . . . . . . . . . . . . . . . . . . . . . . . . . . . . . . . . . . . . . . . . . . . . . . . . . . . .
End of Option E
32EP23
Page 24
– 24 – N15/4/BIOLO/SP3/ENG/TZ0/XX
Option F — Microbes and biotechnology
16. DataonmicrobialresistancetothefluoroquinolonefamilyofantibioticswascollectedinUS hospitals. The graph shows the relationship between Pseudomonas aeruginosa, otherGram-negativebacteriaandtheuseoffluoroquinolonefrom1993to2000.
(a) State the percentage of P. aeruginosathatwereresistanttofluoroquinolonein1996. [1]
. . . . . . . . . . . . . . . . . . . . . . . . . . . . . . . . . . . . . . . . . . . . . . . . . . . . . . . . . . . . . . . . . . . . .
(Option F continues on the following page)
Graph removed for copyright reasons
32EP24
Page 25
– 25 –
Turn over
N15/4/BIOLO/SP3/ENG/TZ0/XX
(Option F, question 16 continued)
(b) ComparethetrendsinfluoroquinoloneuseandresistancetofluoroquinoloneinotherGram-negativebacteriabetween1993and2000. [2]
. . . . . . . . . . . . . . . . . . . . . . . . . . . . . . . . . . . . . . . . . . . . . . . . . . . . . . . . . . . . . . . . . . . . . . . . . . . . . . . . . . . . . . . . . . . . . . . . . . . . . . . . . . . . . . . . . . . . . . . . . . . . . . . . . . . . . . . . . . . . . . . . . . . . . . . . . . . . . . . . . . . . . . . . . . . . . . . . . . . . . . . . . . . . . . . . . . . . . . . . . . . . . . . . . . . . . . . . . . . . . . . . . . . . . . . . . . . . . . . . . . . . . . . . . . . . . . . . . . . . . . . . . . . . . . . . . . . .
(c) Predict the results if data from the same hospitals were collected for P. aeruginosa resistance in 2001. [1]
. . . . . . . . . . . . . . . . . . . . . . . . . . . . . . . . . . . . . . . . . . . . . . . . . . . . . . . . . . . . . . . . . . . . . . . . . . . . . . . . . . . . . . . . . . . . . . . . . . . . . . . . . . . . . . . . . . . . . . . . . . . . . . . . . . . . . . . . . .
(d) Discuss the implications of the data in the graph for the health of patients. [3]
. . . . . . . . . . . . . . . . . . . . . . . . . . . . . . . . . . . . . . . . . . . . . . . . . . . . . . . . . . . . . . . . . . . . . . . . . . . . . . . . . . . . . . . . . . . . . . . . . . . . . . . . . . . . . . . . . . . . . . . . . . . . . . . . . . . . . . . . . . . . . . . . . . . . . . . . . . . . . . . . . . . . . . . . . . . . . . . . . . . . . . . . . . . . . . . . . . . . . . . . . . . . . . . . . . . . . . . . . . . . . . . . . . . . . . . . . . . . . . . . . . . . . . . . . . . . . . . . . . . . . . . . . . . . . . . . . . . . . . . . . . . . . . . . . . . . . . . . . . . . . . . . . . . . . . . . . . . . . . . . . . . . . . . . . . . . . . . . . . . . . . . . . . . . . . . . . . . . . . . . . . . . . . . . . . . . . . . . . . . . . . . . . . . . . . . . . . . . . . . . . . . . . . . . . . . . . .
(Option F continues on the following page)
32EP25
Page 26
– 26 – N15/4/BIOLO/SP3/ENG/TZ0/XX
(Option F continued)
17. (a) Distinguish between the characteristics of eubacteria and eukaryotes. [3]
. . . . . . . . . . . . . . . . . . . . . . . . . . . . . . . . . . . . . . . . . . . . . . . . . . . . . . . . . . . . . . . . . . . . . . . . . . . . . . . . . . . . . . . . . . . . . . . . . . . . . . . . . . . . . . . . . . . . . . . . . . . . . . . . . . . . . . . . . . . . . . . . . . . . . . . . . . . . . . . . . . . . . . . . . . . . . . . . . . . . . . . . . . . . . . . . . . . . . . . . . . . . . . . . . . . . . . . . . . . . . . . . . . . . . . . . . . . . . . . . . . . . . . . . . . . . . . . . . . . . . . . . . . . . . . . . . . . . . . . . . . . . . . . . . . . . . . . . . . . . . . . . . . . . . . . . . . . . . . . . . . . . . . . . . . . . . . . . . . . . . . . . . . . . . . . . . . . . . . . . . . . . . . . . . . . . . . . . . . . . . . . . . . . . . . . . . . . . . . . . . . . . . . . . . . . . . .
(b) Outlinetheprocessofnitrogenfixationbyanamedfree-livingbacterium. [2]
. . . . . . . . . . . . . . . . . . . . . . . . . . . . . . . . . . . . . . . . . . . . . . . . . . . . . . . . . . . . . . . . . . . . . . . . . . . . . . . . . . . . . . . . . . . . . . . . . . . . . . . . . . . . . . . . . . . . . . . . . . . . . . . . . . . . . . . . . . . . . . . . . . . . . . . . . . . . . . . . . . . . . . . . . . . . . . . . . . . . . . . . . . . . . . . . . . . . . . . . . . . . . . . . . . . . . . . . . . . . . . . . . . . . . . . . . . . . . . . . . . . . . . . . . . . . . . . . . . . . . . . . . . . . . . . . . . . . . . . . . . . . . . . . . . . . . . . . . . . . . . . . . . . . . . . . . . . . . . . . . . . . . . . . . . . . . . . . . . . . . . . . . . . . . . . . . . . . . . . . . . . . . . . . . . . . . . . . . . . . . . . . . . . . . . . . . . . . . . . . . . . . . . . . . . . . . .
(Option F continues on the following page)
32EP26
Page 27
– 27 –
Turn over
N15/4/BIOLO/SP3/ENG/TZ0/XX
(Option F continued)
18. (a) Improper food preparation can lead to food poisoning. State one recommended treatment for a named example of food poisoning. [2]
. . . . . . . . . . . . . . . . . . . . . . . . . . . . . . . . . . . . . . . . . . . . . . . . . . . . . . . . . . . . . . . . . . . . . . . . . . . . . . . . . . . . . . . . . . . . . . . . . . . . . . . . . . . . . . . . . . . . . . . . . . . . . . . . . . . . . . . . . . . . . . . . . . . . . . . . . . . . . . . . . . . . . . . . . . . . . . . . . . . . . . . . . . . . . . . . . . . . . . . . . . . . . . . . . . . . . . . . . . . . . . . . . . . . . . . . . . . . . . . . . . . . . . . . . . . . . . . . . . . . . . . . . . . . . . . . . . . .
(b) Researchers are studying several ways to treat cancer using gene therapy. Discuss the risks of gene therapy. [4]
. . . . . . . . . . . . . . . . . . . . . . . . . . . . . . . . . . . . . . . . . . . . . . . . . . . . . . . . . . . . . . . . . . . . . . . . . . . . . . . . . . . . . . . . . . . . . . . . . . . . . . . . . . . . . . . . . . . . . . . . . . . . . . . . . . . . . . . . . . . . . . . . . . . . . . . . . . . . . . . . . . . . . . . . . . . . . . . . . . . . . . . . . . . . . . . . . . . . . . . . . . . . . . . . . . . . . . . . . . . . . . . . . . . . . . . . . . . . . . . . . . . . . . . . . . . . . . . . . . . . . . . . . . . . . . . . . . . . . . . . . . . . . . . . . . . . . . . . . . . . . . . . . . . . . . . . . . . . . . . . . . . . . . . . . . . . . . . . . . . . . . . . . . . . . . . . . . . . . . . . . . . . . . . . . . . . . . . . . . . . . . . . . . . . . . . . . . . . . . . . . . . . . . . . . . . . . . . . . . . . . . . . . . . . . . . . . . . . . . . . . . . . . . . . . . . . . . . . . . . . . . . . . . . . . . . . . . . . . . . . . . . . . . . . . . . . . . . . . . . . . . . . . . . . . . . . . . . . . . . . . . . . . . . . . . . . . . . . . . . . . . . . . . . . . . . .
End of Option F
32EP27
Page 28
– 28 – N15/4/BIOLO/SP3/ENG/TZ0/XX
Option G — Ecology and conservation
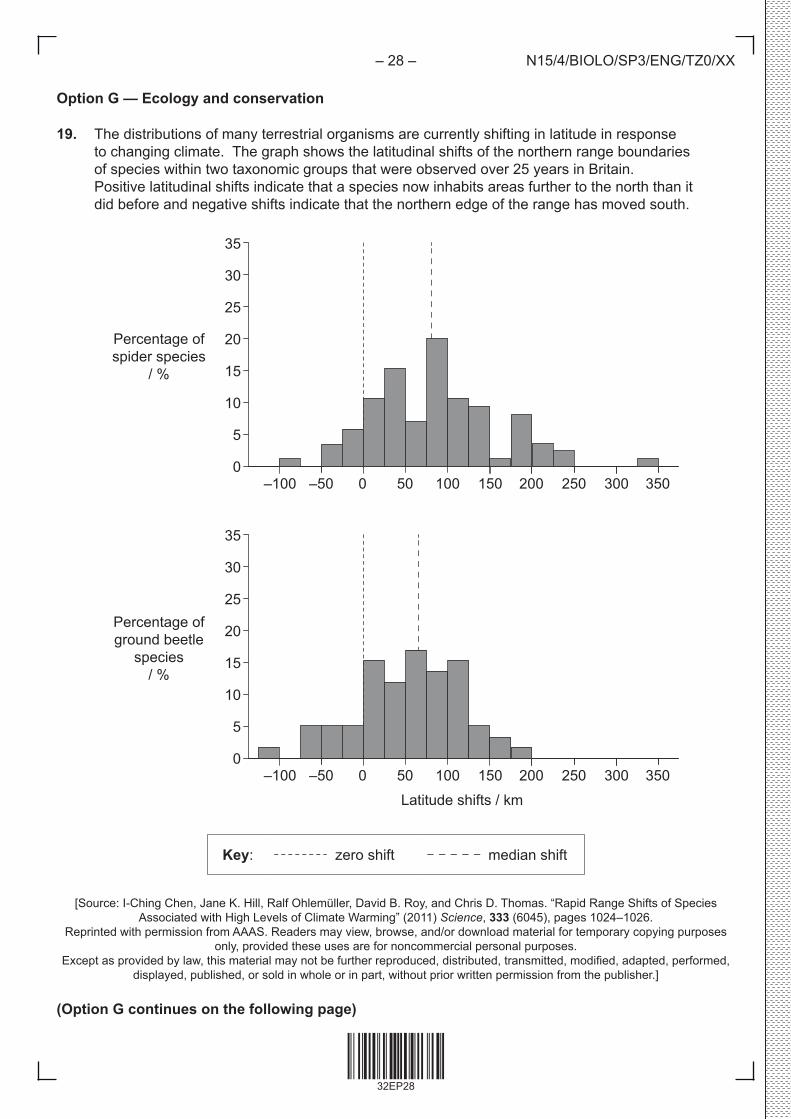
19. The distributions of many terrestrial organisms are currently shifting in latitude in response to changing climate. The graph shows the latitudinal shifts of the northern range boundaries of species within two taxonomic groups that were observed over 25 years in Britain. Positive latitudinal shifts indicate that a species now inhabits areas further to the north than it did before and negative shifts indicate that the northern edge of the range has moved south.
Percentage of spider species
/ %
35
30
25
20
15
10
5
0 –100 –50 0 50 100 150 200 250 300 350
Percentage of ground beetle
species/ %
35
30
25
20
15
10
5
0 –100 –50 0 50 100 150 200 250 300 350
Latitude shifts / km
Key: zero shift median shift
[Source:I-ChingChen,JaneK.Hill,RalfOhlemüller,DavidB.Roy,andChrisD.Thomas.“RapidRangeShiftsofSpeciesAssociatedwithHighLevelsofClimateWarming”(2011)Science, 333 (6045), pages 1024–1026.
Reprinted with permission from AAAS. Readers may view, browse, and/or download material for temporary copying purposes only, provided these uses are for noncommercial personal purposes.
Exceptasprovidedbylaw,thismaterialmaynotbefurtherreproduced,distributed,transmitted,modified,adapted,performed,displayed, published, or sold in whole or in part, without prior written permission from the publisher.]
(Option G continues on the following page)
32EP28
Page 29
– 29 –
Turn over
N15/4/BIOLO/SP3/ENG/TZ0/XX
(Option G, question 19 continued)
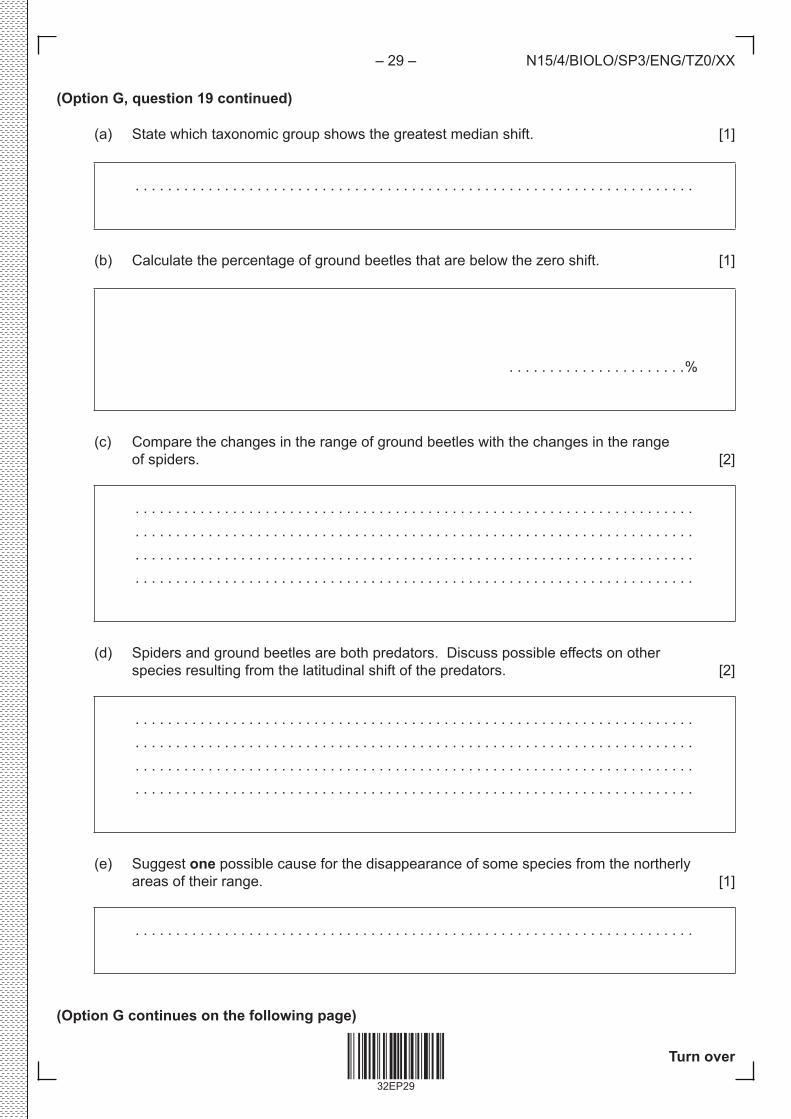
(a) State which taxonomic group shows the greatest median shift. [1]
. . . . . . . . . . . . . . . . . . . . . . . . . . . . . . . . . . . . . . . . . . . . . . . . . . . . . . . . . . . . . . . . . . . . .
(b) Calculate the percentage of ground beetles that are below the zero shift. [1]
. . . . . . . . . . . . . . . . . . . . . .%
(c) Compare the changes in the range of ground beetles with the changes in the range of spiders. [2]
. . . . . . . . . . . . . . . . . . . . . . . . . . . . . . . . . . . . . . . . . . . . . . . . . . . . . . . . . . . . . . . . . . . . . . . . . . . . . . . . . . . . . . . . . . . . . . . . . . . . . . . . . . . . . . . . . . . . . . . . . . . . . . . . . . . . . . . . . . . . . . . . . . . . . . . . . . . . . . . . . . . . . . . . . . . . . . . . . . . . . . . . . . . . . . . . . . . . . . . . . . . . . . . . . . . . . . . . . . . . . . . . . . . . . . . . . . . . . . . . . . . . . . . . . . . . . . . . . . . . . . . . . . . . . . . . . . . .
(d) Spiders and ground beetles are both predators. Discuss possible effects on other species resulting from the latitudinal shift of the predators. [2]
. . . . . . . . . . . . . . . . . . . . . . . . . . . . . . . . . . . . . . . . . . . . . . . . . . . . . . . . . . . . . . . . . . . . . . . . . . . . . . . . . . . . . . . . . . . . . . . . . . . . . . . . . . . . . . . . . . . . . . . . . . . . . . . . . . . . . . . . . . . . . . . . . . . . . . . . . . . . . . . . . . . . . . . . . . . . . . . . . . . . . . . . . . . . . . . . . . . . . . . . . . . . . . . . . . . . . . . . . . . . . . . . . . . . . . . . . . . . . . . . . . . . . . . . . . . . . . . . . . . . . . . . . . . . . . . . . . . .
(e) Suggest one possible cause for the disappearance of some species from the northerly areas of their range. [1]
. . . . . . . . . . . . . . . . . . . . . . . . . . . . . . . . . . . . . . . . . . . . . . . . . . . . . . . . . . . . . . . . . . . . .
(Option G continues on the following page)
32EP29
Page 30
– 30 – N15/4/BIOLO/SP3/ENG/TZ0/XX
(Option G continued)
20. (a) Definebiomass. [1]
. . . . . . . . . . . . . . . . . . . . . . . . . . . . . . . . . . . . . . . . . . . . . . . . . . . . . . . . . . . . . . . . . . . . . . . . . . . . . . . . . . . . . . . . . . . . . . . . . . . . . . . . . . . . . . . . . . . . . . . . . . . . . . . . . . . . . . . . . .
(b) Explain how living organisms can change the abiotic environment during primary succession. [3]
. . . . . . . . . . . . . . . . . . . . . . . . . . . . . . . . . . . . . . . . . . . . . . . . . . . . . . . . . . . . . . . . . . . . . . . . . . . . . . . . . . . . . . . . . . . . . . . . . . . . . . . . . . . . . . . . . . . . . . . . . . . . . . . . . . . . . . . . . . . . . . . . . . . . . . . . . . . . . . . . . . . . . . . . . . . . . . . . . . . . . . . . . . . . . . . . . . . . . . . . . . . . . . . . . . . . . . . . . . . . . . . . . . . . . . . . . . . . . . . . . . . . . . . . . . . . . . . . . . . . . . . . . . . . . . . . . . . . . . . . . . . . . . . . . . . . . . . . . . . . . . . . . . . . . . . . . . . . . . . . . . . . . . . . . . . . . . . . . . . . . . . . . . . . . . . . . . . . . . . . . . . . . . . . . . . . . . . . . . . . . . . . . . . . . . . . . . . . . . . . . . . . . . . . . . . . . .
(c) (i) Distinguish between the biosphere and biomes. [1]
. . . . . . . . . . . . . . . . . . . . . . . . . . . . . . . . . . . . . . . . . . . . . . . . . . . . . . . . . . . . . . . . . . . . . . . . . . . . . . . . . . . . . . . . . . . . . . . . . . . . . . . . . . . . . . . . . . . . . . . . . . . . . . . . . .
(ii) Outline the typical yearly temperatures and vegetation found in a named biome. [2]
. . . . . . . . . . . . . . . . . . . . . . . . . . . . . . . . . . . . . . . . . . . . . . . . . . . . . . . . . . . . . . . . . . . . . . . . . . . . . . . . . . . . . . . . . . . . . . . . . . . . . . . . . . . . . . . . . . . . . . . . . . . . . . . . . . . . . . . . . . . . . . . . . . . . . . . . . . . . . . . . . . . . . . . . . . . . . . . . . . . . . . . . . . . . . . . . . . . . . . . . . . . . . . . . . . . . . . . . . . . . . . . . . . . . . . . . . . . . . . . . . . . . . . . . . . . . . . . . . . . .
(Option G continues on the following page)
32EP30
Page 31
– 31 –
Turn over
N15/4/BIOLO/SP3/ENG/TZ0/XX
(Option G continued)
21. (a) State the process where pesticides such as DDT become more concentrated at each trophic level. [1]
. . . . . . . . . . . . . . . . . . . . . . . . . . . . . . . . . . . . . . . . . . . . . . . . . . . . . . . . . . . . . . . . . . . . .
(b) Explain what is meant by the niche concept. [3]
. . . . . . . . . . . . . . . . . . . . . . . . . . . . . . . . . . . . . . . . . . . . . . . . . . . . . . . . . . . . . . . . . . . . . . . . . . . . . . . . . . . . . . . . . . . . . . . . . . . . . . . . . . . . . . . . . . . . . . . . . . . . . . . . . . . . . . . . . . . . . . . . . . . . . . . . . . . . . . . . . . . . . . . . . . . . . . . . . . . . . . . . . . . . . . . . . . . . . . . . . . . . . . . . . . . . . . . . . . . . . . . . . . . . . . . . . . . . . . . . . . . . . . . . . . . . . . . . . . . . . . . . . . . . . . . . . . . . . . . . . . . . . . . . . . . . . . . . . . . . . . . . . . . . . . . . . . . . . . . . . . . . . . . . . . . . . . . . . . . . . . . . . . . . . . . . . . . . . . . . . . . . . . . . . . . . . . . . . . . . . . . . . . . . . . . . . . . . . . . . . . . . . . . . . . . . . .
End of Option G
32EP31
Page 32
Please do not write on this page.
Answers written on this page will not be marked.
32EP32