This journal is c The Royal Society of Chemistry 2013 Mol. BioSyst. Cite this: DOI: 10.1039/c3mb25554a Biomarkers of food intake and metabolite differences between plasma and red blood cell matrices; a human metabolomic profile approach† U ´ rsula Catala ´n, a Miguel-A ´ ngel Rodrı ´guez, b Maria-Rosa Ras, c Alba Macia ´, d Roger Mallol, b Maria Vinaixa, b Sara Ferna ´ndez-Castillejo, a Rosa-Maria Valls, a Anna Pedret, a Julian L Griffin, e Reza Salek, e Xavier Correig, b M a Jose ´ Motilva d and Rosa Sola `* a Untargeted metabolomic analyses of plasma and red blood cells (RBCs) can provide complementary information on biomarkers of food consumption. To assess blood collection differences in biomarkers, fasting blood was drawn from 10 healthy individuals using sodium citrate and lithium heparin as anticoagulants. Plasma and RBCs were separated into aqueous and lipid fractions to be analyzed using 1D and 2D 1 H NMR spectroscopy. Fatty acids were analyzed using gas chromatography-mass spectrometry (GC-MS). Polyphenols were extracted from plasma and RBCs by micro-elution solid-phase extraction and analyzed by ultra performance liquid chromatography coupled to tandem mass spectrometry (UPLC-MS/MS). 1 H NMR demonstrated higher aqueous metabolites such as glucose in plasma compared to RBCs, while RBCs contained higher ADP-ATP, creatine and acetone than plasma. Lipoproteins and their subclasses were higher in plasma than in RBCs. Percentages of saturated fatty acids (SFA) 16 : 0, 17 : 0, 20 : 0, 24 : 0 and polyunsaturated fatty acids (PUFA) 22 : 6 n-3 (docosahexaenoic acid) and 20 : 4 n-6 (arachidonic acid) were higher in RBCs than in plasma (p o 0.05), while SFA 14 : 0, monounsaturated fatty acids (MUFA) 14 : 1 n-5, 16 : 1 n-7, 17 : 1 n-7 and 18 : 1 n-9 and PUFA 18 : 3 n-3, 18 : 2 n-6, 18 : 3 n-6 and 20 : 3 n-6 were higher in plasma than in RBCs (p o 0.05). Polyphenols differed in plasma from those of RBCs. Biomarker concentrations were lower in sodium citrate compared to lithium heparin plasma. In conclusion, metabolomic profiles generated by NMR spectroscopy, GC-MS and UPLC-MS/MS analyses of RBCs versus plasma show complementary information on several specific molecular biomarkers that could be applied in nutritional assessment. 1. Introduction In human studies, the volume of blood that can be accessed from the individual for diagnostic and/or research purposes is limited and, since most analytes are measured in plasma or serum, the red blood cells (RBCs) are usually discarded. How- ever, RBCs could be an important source of nutritional infor- mation not previously accessed. 1 New dietary biomarkers measured in RBCs 2 may reflect longer-term markers of nutri- tional intake compared with plasma or urine and, as such, their measurement extends the emerging field of nutritional meta- bolomics. Analytical methods are being developed to describe metabolic profiles as indicators of dietary patterns, dietary changes or effectiveness of dietary interventions. 3 Traditional dietary assessment methods are indirect, are often unable to demonstrate effectiveness of dietary interventions and, as well, can obscure disease risk associations. 2 Traditionally, serum lipids have been studied in lipoproteins separated by ultracentrifugation, and subsequent analyses have focused on the distributions of several lipid species such as a Unitat de Recerca en Lı ´pids i Arteriosclerosi, Facultat de Medicina i Cie `ncies de la Salut, Universitat Rovira i Virgili, Hospital Universitari Sant Joan, IISPV, CIBERDEM, Spain. E-mail: [email protected]; Fax: +34 977 75 93 22; Tel: +34 977 75 93 69, +34 609 906 991 b Metabolomic Platform, CIBERDEM, Universitat Rovira i Virgili, IISPV, Tarragona, Spain c Servei de Recursos Cientı ´fics i Te `cnics, Unitat d’Ana `lisi Orga `nica, Universitat Rovira i Virgili, Tarragona, Spain d Departament de Tecnologia dels Aliments, XaRTA-TPV, Escola Te ´cnica Superior d’Enginyeria Agra ´ria, Universitat de Lleida, Spain e Department of Biochemistry, University of Cambridge, CB2 1GA, UK † Electronic supplementary information (ESI) available. See DOI: 10.1039/ c3mb25554a Received 4th December 2012, Accepted 21st February 2013 DOI: 10.1039/c3mb25554a www.rsc.org/molecularbiosystems Molecular BioSystems PAPER Downloaded by University of Missouri at Columbia on 17 March 2013 Published on 22 February 2013 on http://pubs.rsc.org | doi:10.1039/C3MB25554A View Article Online View Journal
Transcript
This journal is c The Royal Society of Chemistry 2013 Mol. BioSyst.
Cite this: DOI: 10.1039/c3mb25554a
Biomarkers of food intake and metabolite differencesbetween plasma and red blood cell matrices; a humanmetabolomic profile approach†
Ursula Catalan,a Miguel-Angel Rodrıguez,b Maria-Rosa Ras,c Alba Macia,d
Roger Mallol,b Maria Vinaixa,b Sara Fernandez-Castillejo,a Rosa-Maria Valls,a
Anna Pedret,a Julian L Griffin,e Reza Salek,e Xavier Correig,b Ma Jose Motilvad andRosa Sola*a
Untargeted metabolomic analyses of plasma and red blood cells (RBCs) can provide complementary
information on biomarkers of food consumption. To assess blood collection differences in biomarkers,
fasting blood was drawn from 10 healthy individuals using sodium citrate and lithium heparin as
anticoagulants. Plasma and RBCs were separated into aqueous and lipid fractions to be analyzed using
1D and 2D 1H NMR spectroscopy. Fatty acids were analyzed using gas chromatography-mass
spectrometry (GC-MS). Polyphenols were extracted from plasma and RBCs by micro-elution solid-phase
extraction and analyzed by ultra performance liquid chromatography coupled to tandem mass
spectrometry (UPLC-MS/MS). 1H NMR demonstrated higher aqueous metabolites such as glucose in
plasma compared to RBCs, while RBCs contained higher ADP-ATP, creatine and acetone than plasma.
Lipoproteins and their subclasses were higher in plasma than in RBCs. Percentages of saturated fatty
18 : 2 n-6, 18 : 3 n-6 and 20 : 3 n-6 were higher in plasma than in RBCs (p o 0.05). Polyphenols differed
in plasma from those of RBCs. Biomarker concentrations were lower in sodium citrate compared to
lithium heparin plasma. In conclusion, metabolomic profiles generated by NMR spectroscopy, GC-MS
and UPLC-MS/MS analyses of RBCs versus plasma show complementary information on several specific
molecular biomarkers that could be applied in nutritional assessment.
1. Introduction
In human studies, the volume of blood that can be accessedfrom the individual for diagnostic and/or research purposes is
limited and, since most analytes are measured in plasma orserum, the red blood cells (RBCs) are usually discarded. How-ever, RBCs could be an important source of nutritional infor-mation not previously accessed.1 New dietary biomarkersmeasured in RBCs2 may reflect longer-term markers of nutri-tional intake compared with plasma or urine and, as such, theirmeasurement extends the emerging field of nutritional meta-bolomics. Analytical methods are being developed to describemetabolic profiles as indicators of dietary patterns, dietarychanges or effectiveness of dietary interventions.3 Traditionaldietary assessment methods are indirect, are often unable todemonstrate effectiveness of dietary interventions and, as well,can obscure disease risk associations.2
Traditionally, serum lipids have been studied in lipoproteinsseparated by ultracentrifugation, and subsequent analyses havefocused on the distributions of several lipid species such as
a Unitat de Recerca en Lıpids i Arteriosclerosi, Facultat de Medicina i Ciencies de la
Salut, Universitat Rovira i Virgili, Hospital Universitari Sant Joan, IISPV,
Mol. BioSyst. This journal is c The Royal Society of Chemistry 2013
cholesterol, phospholipids and triglycerides within the lipo-protein classes. More recently, metabolomics have facilitatedthe study of the full spectrum of lipids and lipoproteins ingreater detail.4 Quantitative and/or qualitative measurementsof dietary fatty acids (FAs) are key nutritional factors in cardi-ovascular disease (CVD) evaluation and prevention. The FAprofile, as measured in RBCs, reflects the medium-term dietaryintake (a matter of weeks)5 while plasma FA levels reflectmore recent intake (a matter of days). As such, under certaincircumstances, the RBC profile may provide more valuableinformation.6–8 The FA composition of cell membranes isdependent on dietary fat intake as well as that from intermediatemetabolism.9 For example, blood concentrations of eicosapen-taenoic acid (EPA) and docosahexaenoic acid (DHA) n-3 areappropriate biomarkers of FAs from fish intake.10–12 RBC FA vs.plasma FA profiles could provide better insight into FA bio-markers of not only fish intake but also of dairy products. However,this hypothesis has not been explored systematically, to date.
Other molecules such as polyphenols reflect the food intakeof, mainly, fruits and vegetables. Foods rich in polyphenolshave protective effects against chronic diseases such as CVD.Polyphenols are bioactive compounds that display a range ofbiological activities, including anti-oxidant and anti-inflamma-tory properties,13 and can exert their effects on RBCs.14–17 Therehave been studies assessing the polyphenols associated withRBCs17–19 but, to the best of our knowledge, the individualbaseline types and concentrations of polyphenols of humanRBCs have not been evaluated.
The phenotype is sensitive to subtle, but pathogenicallyrelevant, factors such as nutrition.20 However, little is knownof the extent to which changes in the nutrient content of thehuman diet elicit changes in metabolic profiles and the resultantphenotype.21 Nutritional metabolomics and foodomic methodo-logies22 are emerging fields that could fill this knowledge gap.
Sensitive methods such as gas chromatography-mass spectro-metry (GC-MS), liquid chromatography-MS (LC-MS) andnuclear magnetic resonance (NMR) spectroscopy have beenused in metabolomics to detect and quantify biomarkers ofnutrient intake and/or dietary patterns as well as to assess therelationships between nutrition and the risk of disease.22 Thesehigh-throughput technologies have facilitated untargetedanalysis of variations in metabotype resulting from dietaryinterventions, with little a priori knowledge. This open-endedcapture of data gathers as many metabolites or nutritionalbiomarkers as possible and analyzes these data at the rawsignal level taking into account all nutritional information.Although untargeted approaches might open new perspectivesin nutritional studies, there are some families of metabolites onwhich these studies have been more traditionally focused. Mostof these compounds are expected to change, a priori, inresponse to dietary interventions. The combination of various‘omics’ technologies (systems biology) will greatly facilitate thediscovery of new biomarkers associated with specific nutrientsof dietary factors.23 The identification and optimization, inplasma or in RBCs, of biomarkers of dietary consumption canextend the evaluation of nutritional status.
Challenges associated with the use of metabolomics tech-nology in human nutritional research involve, among others,the standardization of sample collection.21 This becomesmandatory when large-scale human nutritional metabolomicsstudies are planned. Conversely, serum/plasma or other bio-fluid availability is also an issue in such studies which usuallyinvolve a larger number of determinations than nutritionalmetabolomics analysis.
Intrinsic changes could arise from blood sample collection(sodium citrate vs. lithium heparin as anticoagulants) and thesubsequent comparison between aqueous vs. organic phases oftwo different matrices such as plasma vs. RBCs. In the currentstudy, analyses of plasma and RBC samples obtained from bothanticoagulant tubes will be compared based on a battery ofuntargeted, and several targeted, measurements coveringdifferent families of compounds with potential interest in thefield of nutrition.
We hypothesized that an untargeted metabolomic approachto analyses in plasma and RBCs can provide complementaryinformation on biomarkers relating to food consumption; theoverall objective being to improve human nutritional studies inmaintaining health and helping prevent disease. Hence, theaims of the present study are to identify molecular and nutri-tional biomarkers and to standardize their analysis in healthyhuman subjects using plasma and RBC samples obtained fromblood collected into different anticoagulant tubes (sodiumcitrate vs. lithium heparin).
2. Methods and materials2.1. Ethics, subject recruitment and clinic visits
Eligible male volunteers (N = 10) between the ages of 20 and 70were recruited from our volunteer center database. They werenon-smokers with no major CVD risk factors and were notusing any medications and/or vitamin supplements.
Participants provided written informed consent prior toenrolment into the study. Eligibility or exclusion was assessedby the attending physician based on a review of the clinicalhistory, as well as physical and biochemical examination. Thescreening visit was to ensure that the participants were osten-sibly healthy without any known illness. The study wasapproved by the Clinical Research Ethical Committee (Institu-tional Review Board) of the Hospital Universitari Sant Joan deReus (Reference: 10-04-29/4assN1) where the participants wererecruited. The study protocol was in accordance with theDeclaration of Helsinki and good clinical practice guidelines.
2.2. Blood sample collection: plasma and RBCs
A fasting blood sample from each individual was collected intosodium citrate (B250 mL of 0.129 M sodium citrate in 2.7 mLtubes) and lithium heparin (68 IU; Anorsa, Hospitalet deLlobregat, Barcelona, Spain) tubes. The samples and techni-ques used for this study are summarized in Table S1 (ESI†). Thesamples were immediately centrifuged (2000 � g, 15 min, 4 1C)and then divided into separate aliquots of plasma and RBCs.Plasma aliquots were stored at�80 1C until analysis. RBCs were
This journal is c The Royal Society of Chemistry 2013 Mol. BioSyst.
washed three times with phosphate buffered saline (PBS;Invitrogen, Barcelona, Spain) and 1 mL of 1 mM butylatedhydroxy toluene (BHT; Sigma-Aldrich, Madrid, Spain)/100 mLof RBCs was added to prevent oxidation contamination, andthen stored in aliquots at �80 1C until analysis.
2.2.1. Biochemical parameters. A fasting blood sample wastaken and the serum was used for routine biochemical analysesto confirm that the volunteers were healthy. Total cholesterol(mmol L�1), triglycerides (mmol L�1), direct HDL (mmol L�1),apolipoprotein A1 (mg dL�1), apolipoprotein B100 (mg dL�1),glucose (mg dL�1), uric acid (mg dL�1), bilirubin (mg dL�1),creatinine (mg dL�1), urea (mg dL�1), glutamic oxaloacetictransaminase (U L�1), glutamic pyruvic transaminase (U L�1),gamma glutamyl transferase (U L�1) and alkaline phosphatase(U L�1) were determined by routine laboratory methods using aCobas Mira Plus autoanalyzer (Roche Diagnostic System,Madrid, Spain).
2.2.2. Plasma viscosity. Plasma samples (250 mL) fromsodium citrate and heparin tubes were weighed and the densitywas calculated. Plasma was then placed on an extra-low-chargecalibrated viscosimeter (Cannon Instrument Company, StateCollege, USA) and loaded on a Julabo ME-16G Visco Bath(Julabo Labortechnik GmbH, Seelbach, Germany) previouslywarmed to 37 1C. The time taken for the plasma to pass fromthe top to the bottom of the calibrated viscosimeter was measured(time measured in seconds; mean of triplicate measurements).Viscosity (mPa s) was calculated according to the formula:
Z = rtk
where k is the viscosimeter constant (0.004175), t is the mean ofthe time measurements (s), and r is the density (mg mL�1).
2.2.3. Extraction of aqueous and lipid fractions of plasmaand RBCs. A methanol–chloroform (Sigma-Aldrich, Alcobendas,Madrid, Spain) mixture (1000 mL) in a ratio of 2 : 1 (v/v) wasadded to 200 mL of each matrix sample (plasma and RBCs).Homogenates were derived by sonication for 15 min, afterwhich a 400 mL solution of chloroform : distilled water (1 : 1; v/v)was added and mixed thoroughly. The phases were separated(14 000 � g, 20 min) in a Multifuge 3L-R centrifuge (Thermo,Madrid, Spain). The upper aqueous phase was removed andflash-frozen at �196 1C in liquid nitrogen and then lyophilizedovernight to remove water. The samples were stored at �80 1Cuntil subsequent NMR measurements. The lower phase (lipidfraction) was allowed to dry in a fume hood overnight and thenstored at �80 1C.
2.2.4. Preparation of aqueous and lipid fractions for 1D1H NMR spectroscopy of plasma and RBCs. The dried aqueousplasma and RBC extracts were reconstituted in 600 mL of D2O(Eurisotop, Gif-Sur-Yvette, France) buffered in 40 mM disodiumphosphate (Sigma-Aldrich, Steinheim, Germany), 8 mM sodiumphosphate (Sigma-Aldrich, Steinheim, Germany) and 0.02% ofsodium azide (Sigma-Aldrich, Steinheim, Germany) containing1 mM of sodium (3-trimethylsilyl)-2,2,3,3-tetradeuteriopropionate(TSP; Cortecnet, Viosins Le Bretonneux, France) as a chemicalshift standard. The mixture was placed into 5 mm NMR tubes(Cortecnet, Viosins Le Bretonneux, France).
The dried organic extracts of plasma and RBCs were recon-stituted in 700 mL of a 2 : 1 (v/v) mixture of deuterated chloro-form and deuterated methanol (CDCl3: CD3OD; Eurisotop,Gif-Sur-Yvette, France) containing 0.01% (v/v) of trimethylsilyl(TMS; Cortecnet, Viosins Le Bretonneux, France) as a chemicalshift standard, and placed into 5 mm NMR tubes. The NMRtubes were maintained at 4 1C in the sample changer until thetime of analysis.
2.2.5. 1D and 2D 1H NMR spectroscopy of plasma and RBCs2.2.5.1. NMR analysis. All one- and two-dimensional
1H NMR spectra were obtained on a Bruker Avance III 600spectrometer operating at a proton frequency of 600.20 MHz(14.1 T) equipped with a 10 A GREAT 1/10 gradient amplifierunit using a 5-mm CP-TCI triple resonance (1H, 13C, 31P)pulse field gradient cryoprobes (Bruker, Cerdanyola del Valles,Spain).
2.2.5.2. 1D 1H NMR spectroscopy. For the 1D aqueous extractspectra of plasma or RBCs, one-dimensional (1D) NuclearOverhauser Effect Presaturation Spectroscopy (noesygppr1dBruker pulse, RD-901-t1-901-tm-901 ACQ) was carried out at300 K. Solvent pre-saturation with low irradiation power (15 Hz)was applied during the recycling delay and mixing time (tm =100 ms) to suppress residual water. The 901 pulse length wascalibrated for each sample and ranged from 8.77 ms to 9.22 ms.A total of 256 transients were collected across 12 kHz spectralwidth (20 ppm) into 64 k data points, and exponential linebroadening of 0.3 Hz was applied before Fourier transforma-tion. A recycling delay time of 5 s was applied between scans toensure correct quantification.
In the case of lipid extracts, a 901 pulse with a pre-saturationsequence (zgpr Bruker pulse) was used. We performedmeasurements at 287 K, shifting the residual water signal to4.65 ppm to allow for the quantification of the characteristicglycerol-backbone signals. In addition, residual water waspre-saturated during recycling delay (RD = 5 s) using a lowirradiation power (10 Hz). The 901 pulse length was calibratedfor each sample and varied from 7.30 ms to 7.59 ms. A total of256 free induction decays (FIDs) of 12 kHz of spectral width(20 ppm) were collected into 64 k data points, and exponentialline broadening of 0.3 Hz was applied before Fourier trans-formation.
All the frequency spectra were phased, baseline correctedand then calibrated (TMS or TSP, 0.0 ppm) using TopSpinsoftware (version 2.1, Bruker, Germany). Spectra were segmen-ted into 0.03 ppm chemical shift bins between 0.2 and 9.6 ppm(excluding water and TSP resonances) using a bucket size of0.03 ppm and the Intelligent Bucketing facility within ACD 1DNMR Manager software (version 12; Berks, England). Toaccount for the differences in sample volumes, each integratedregion was normalized to the total spectral area for all integralregions in that spectrum, excluding water and TSP resonances.Spectra were assigned by comparison with the assignment ofChenomx NMR Suite version 7.0 (Chenomx; Alberta, Canada)for target profiling analysis to determine the metabolites con-tributing to each bin.
Mol. BioSyst. This journal is c The Royal Society of Chemistry 2013
2.2.5.3. 2D 1H NMR spectroscopy. 2D diffusion-edited 1H NMRmeasurements were carried out according to Mallol et al.2011.24 Plasma samples (430 mL) from sodium citrate andlithium heparin tubes were transferred to 5 mm NMR tubeswith a double tube system. An internal reference tube (opticaldensity OD 2 mm, supported by a Teflon adapter) containing9.9 mmol L�1 TSP (reference substance) and 0.47 mmol L�1
MnSO4 in 99.9% D2O was placed coaxially into the NMR sampletube (OD 5 mm). This double tube system was kept at 4 1C inthe sample changer until the moment of analysis.
1H NMR spectra of plasma were recorded at 310 K to obtaina full signal from the mobile lipids in the lipoproteins and toavoid plasma degradation during the measurement.
For diffusion measurements of lipoproteins in plasma, thedouble-stimulated echo (DSTE) pulse program was used, withbipolar gradient pulses and a longitudinal eddy-current delay(LED; dstebpgp3s Bruker pulse sequence). A spectral window of18028.846 Hz was used, with an acquisition time of 1.82 s.During the experiment, the relaxation delay was 2 s, the FIDswere collected into 64 K complex data points, and 32 scans wereacquired for each sample. The gradient pulse strengthwas increased from 5% to 95% of the maximum strength of53.5 G cm�1 (0.535 T m�1) in 32 steps. A diffusion time of120 ms and bipolar half-sine-shaped gradient pulses of 6 mswere applied. All spectra were Fourier transformed, phasecorrected, baseline corrected, and referenced to the glucosesignal at 5.233 ppm. Diffusion coefficients were obtained usinga surface fitting approach, as described previously.24
Once the diffusion coefficients have been estimated, theStokes–Einstein equation can be applied to derive the radiusassociated with each function:
D ¼ kT6pZR
where k (J K�1) is the Boltzmann constant 1.38 � 10�23, T (K) isthe temperature, Z (Pa s) is the plasma viscosity (measured onplasma aliquots from sodium citrate and lithium heparinsamples) and R (Å) is the hydrodynamic radius.
2.2.6. Fatty acid profile in plasma and RBCs by GC-MS. TheD2O lipid aliquots (700 mL) from plasma and RBC samples usedfor 1D 1H NMR spectroscopy were evaporated to dryness in thesterile air-flow fume hood overnight and then derivatized.Dried samples were dissolved in 750 mL chloroform/methanol1 : 1 (v/v), vortex mixed for 30 s, sonicated for 10 min followedby the addition of 100 mL D27-tetradecanoic acid (200 mM inchloroform; Sigma-Aldrich, Madrid, Spain) as an internalstandard (IS). 125 mL of 10% boron trifluoride/methanol(Sigma-Aldrich, Madrid, Spain) was added and the vials wereincubated at 80 1C for 90 min. On cooling, 500 mL of distilledwater and 1000 mL hexane (Sigma-Aldrich, Madrid, Spain)were added and vortex mixed for 1 min. Two layers were formedand the aqueous top layer was aspirated and discarded.The lipid layer was evaporated to dryness in the fumehood overnight and 500 mL of hexane was added to the driedsamples before GC-MS analysis. Food Industry FAME Mix fromRestek (Teknokroma, Barcelona, Spain) was used for the
quantification of the fatty acid methyl ester (FAME) fromplasma and RBCs.
A 6890 gas chromatograph coupled to a 5973 mass spectro-meter (Agilent Technologies, Palo Alto, USA) was used for theFA separation and detection, with a FFAP capillary column withdimensions of 30 m � 0.25 mm � 0.25 mm (Agilent Techno-logies, Palo Alto, USA). Helium gas (99.999% pure) was used asthe carrier at a constant flow of 1.2 mL min�1. A sample volumeof 2 mL was injected in split mode, with a split ratio of 10 : 1. Theinlet temperature was of 250 1C. The GC oven temperatureprogram was as follows: 60 1C held for 2 min, then increased ata rate of 6 1C min�1 to a final temperature of 240 1C, which washeld for 13 min. Total run time per sample was 45 min.Transfer line temperature was of 280 1C. Source and quadru-pole temperatures were set at 230 1C and 150 1C, respectively,while the electron impact source was set at a voltage of 70 MeV.The mass spectrometer acquired data in scan mode over a 50 to650 m/z interval, after 2.1 min solvent delay. The compoundswere quantified using a target ion and identified using qualifierions and retention times. The chromatographic method wascalibrated daily by analyzing standard solutions at concentra-tions in the range of 3 to 120 mg L�1 of FAMEs, which wereprepared and analyzed under the same conditions as the plasmaand RBC samples. The calibration curves obtained by plottingthe analyte/IS peak abundance ratio and the correspondinganalyte/IS concentration ratio showed good linearity; determina-tion coefficients (r2) being higher than 0.999 for all compounds.
Sensitivity was evaluated by determining the limit of detec-tion (LOD) (S/N = 3) and the limit of quantification (LOQ),which was defined as 5 times the LOD. Method detection andquantification limits (MDL and MQL, respectively) were calcu-lated for the analysis of 200 mL of sample, following theprocedures described above. Values showed MDL in the rangefrom 0.02 to 1.6 mg L�1, while those for MQL were from 0.08 to8.7 mg L�1. Good method precision was observed for all thecompounds, with relative standard deviations (RSD) between1.2 and 8.3 (n = 3).
2.2.7. Micro-elution solid-phase extraction (l-SPE) of poly-phenols from plasma and RBCs. Polyphenols in the defrostedfasting human plasma and RBCs (from sodium citrate andlithium heparin samples) were extracted with solid-phaseextraction using micro-plates as the device format (m-SPE).Briefly, 400 mL of plasma and/or RBCs were vortex mixed andcentrifuged (2000 � g, 7 min, 4 1C) to sediment cellular debris.From plasma or RBC samples, 350 mL of supernatant wererecovered and to which 50 mL of internal standard (IS: Catechol;Sigma-Aldrich, St. Louis, MO, USA) + 300 mL of 4% phosphoricacid (H3PO4; Panreac, Barcelona, Spain) were added to eachsample and vortex mixed. Because of the matrix consistency ofRBCs, 500 mL H3PO4 was added and the cells were rupturedusing an S-150D Digital Sonifiers cell disruptor (Branson,Ultrasonidos, S.A.E., Barcelona, Spain). Then, a 1 : 7 mixture(RBC : H3PO4) was used as a final volume before performing thecorresponding polyphenol extraction. Micro-elution plates(Waters, Milford, USA) were packed with 2 mg OASIS HLB sorbent(Waters). The cartridges were initially conditioned using 250 mL
This journal is c The Royal Society of Chemistry 2013 Mol. BioSyst.
methanol and 250 mL of acidified Milli-Q water at pH 2 insequence, after which the plasma and RBC samples were loaded.
The plates were ‘‘cleaned-up’’ with sequential 100 mL milliQwater and 100 mL 5% methanol to eliminate any residualinterference/contamination in the sample. Finally, polyphenolcompounds retained on the column were eluted with 100 mLmethanol and injected directly into the UPLC-MS/MS.
2.2.8. UPLC-MS/MS detection of polyphenols from plasmaand RBCs. Polyphenols were analyzed by ultra performanceliquid chromatography coupled to tandem mass spectrometry(UPLC-MS/MS).
The UPLC system consisted of an AcQuity UPLCTM equippedwith a binary pump system (Waters; Milford, MA, USA) using anAcQuity UPLCTM BEH C18 column (1.7 mm, 100 mm � 2.1 mminternal diameter). During the analysis, the column was kept at30 1C and the flow rate was 0.4 mL min�1 using 0.2% acetic acidas solvent A and acetonitrile as solvent B. The elution com-menced with 5% eluent B for 5 min, then linearly increased to40% eluent B for 20 min, further increased to 100% eluent B for0.1 min, and kept isocratic for 1.9 min, then back to initialconditions in 0.1 min, and the re-equilibration for 1.9 min.
The UPLC system was coupled to a PDA detector AcQuityUPLCTM and a TQDTM mass spectrometer (Waters, Milford, MA,USA). The software used was MassLynx 4.1. Ionization wascarried out by electrospray (ESI) in negative mode and then inpositive mode.
The analyses were conducted in full-scan mode in order todetermine molecular weight. This was followed by daughterscan mode and in selected reaction monitoring (SRM) mode toevaluate the fragments generated. Ionization source para-meters were capillary voltage of 3.0 kV, source temperature of150 1C, and desolvation gas temperature of 400 1C with a flowrate of 800 L h�1. Nitrogen (99% purity, N2 LCMS nitrogengenerator; Claind, Como, Italy) and argon (Z99.99% purity,Aphagaz, Madrid, Spain) were used as the cone and collisiongases, respectively.
The SRM transitions and the individual cone voltage andcollision energy for each of the standard phenolic compoundswere evaluated by infusing 10 mg L�1 of each compound toobtain the best instrumentation conditions. In the daughterion scan experiments, tandem mass spectrometry (MS/MS) wasused, and the product ions were produced by collision-inducedfragmentation of selected precursor ions in the collision cell ofthe triple quadrupole mass spectrometer (MS). The mass wasthen analyzed with the instrument’s second analyzer.
The standard phenolic compounds 3-hydroxyphenylpropio-nic acid, o-, m- and p-hydroxyphenylacetic acid, hydroxybenzoicacid, phenylacetic acid and hydroxyflavanone were purchasedfrom Sigma-Aldrich (Madrid, Spain). Table S2 (ESI†) shows theSRM transitions, cone voltage and collision energy for differentcommercial phenolic compounds. Two transitions wereselected for quantification and confirmation purposes.
2.3. Statistical analysis
Data were expressed as the mean and SD (error bars). An F testwas used to determine the normality of variances of the two
sample types followed by the two-tailed t-test, assuming equalvariances. The t-test for related samples was used to comparedifferences between sodium citrate and lithium heparinsamples. The data were analyzed with the Statistical Packagefor the Social Sciences (SPSS) software (version 19.0). A value ofp o 0.05 was considered statistically significant.
Since multivariate data analysis plays an essential role inevaluating differences between metabolomes, thus enablingthe identification of metabolites relevant to a specific pheno-typic characteristic,25 we applied multivariate analyses usingSIMCA-P + 12.0 software (Umetrics AB, Umea, Sweden) with thedata having been mean-centered and Pareto-scaled prior toanalysis. Pareto scaling augments the representation of lowconcentration metabolites in statistical models by dividingeach integral region, or variable, by the square root of thestandard deviation of the variable, without increasing thecontribution of spectral noise to the model. Unit variance(UV) scaling ensures all metabolites identified contributeequally to the multivariate dataset.
Three different multivariate statistical techniques were usedwithin the SIMCA package: principal components analysis(PCA); projection to latent structures by partial least squaresdiscriminant analysis (PLS-DA); and orthogonal PLS-DA (OPLS-DA).PCA is an unsupervised technique that describes observations(e.g. spectra from plasma or from RBCs) in relation to one ormore latent variables, termed principal components (PCs)which, in turn, are linear combinations of the original variables(e.g. NMR buckets). PLS-DA and OPLS are supervised techni-ques separating observations based on the class-membership.In OPLS-DA, the objective is to remove the variation in themodel that is orthogonal to response. This can more easilyproduce interpretable models, where the 1st component repre-sents the major changes that distinguish the two groups. Thep-value was calculated using a Student’s t-test on the coeffi-cients to calculate the contribution to a given component madeby each variable.
2.3.1. Model validation. The parameters R2 and Q2 wereused to evaluate the performance of each model. The R2 scoreindicates how much of the total variation in the dataset isdescribed by a particular component and Rcum
2 indicates thevariation described by all the components in the model (scored0–1). Q2 is a measure of how accurately the model can predictthe class membership and, hence, is more relevant to super-vised approaches. Q2 estimates the predictive ability of themodel by leaving out observations from the model building,and then predicting their class membership or trend variable.Q2 > 0.08 is indicative of a model that is better than chance,while scores above 0.7 demonstrate a highly robust trend, orseparation. The validity and the degree-of-fit for the modelswere assessed by the criteria and validation routines built intothe SIMCA package.
3. Results
With 10 subjects in the study, blood distributed into 2 differentsample collection tubes (lithium heparin and sodium citrate),
Mol. BioSyst. This journal is c The Royal Society of Chemistry 2013
2 matrices (plasma and RBC) and 2 fractions (organic andaqueous), the total number of samples processed (10 � 2 �2 � 2) was 80.
3.1. Biochemical parameters
Table S3 (ESI†) summarizes the characteristics of the 10 healthymale volunteers. The mean (SD) age was 44 (11.5) years. Ofthese individuals, 40% were within the reference range withrespect to cholesterol concentrations (reference range:3.1–5.15 mmol L�1); 50% with respect to apolipoprotein B100(reference range: 70–105 mg dL�1); 70% with respect to HDL-c(reference value: >1.30 mmol L�1) and creatinine (referencerange: 0.6–1.30 mg dL�1); 80% with respect to bilirubin (refer-ence value: o1.1 mg dL�1). With respect to the rest of theparameters studied, between 90–100% of the participants werewithin the reference ranges.
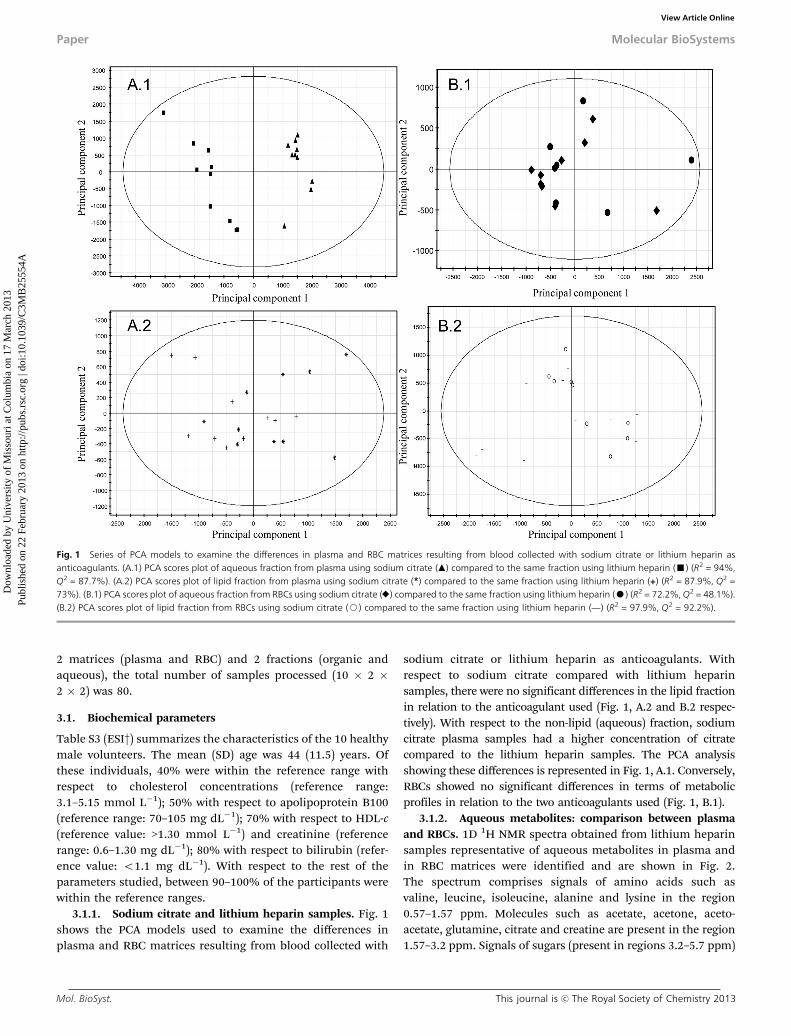
3.1.1. Sodium citrate and lithium heparin samples. Fig. 1shows the PCA models used to examine the differences inplasma and RBC matrices resulting from blood collected with
sodium citrate or lithium heparin as anticoagulants. Withrespect to sodium citrate compared with lithium heparinsamples, there were no significant differences in the lipid fractionin relation to the anticoagulant used (Fig. 1, A.2 and B.2 respec-tively). With respect to the non-lipid (aqueous) fraction, sodiumcitrate plasma samples had a higher concentration of citratecompared to the lithium heparin samples. The PCA analysisshowing these differences is represented in Fig. 1, A.1. Conversely,RBCs showed no significant differences in terms of metabolicprofiles in relation to the two anticoagulants used (Fig. 1, B.1).
3.1.2. Aqueous metabolites: comparison between plasmaand RBCs. 1D 1H NMR spectra obtained from lithium heparinsamples representative of aqueous metabolites in plasma andin RBC matrices were identified and are shown in Fig. 2.The spectrum comprises signals of amino acids such asvaline, leucine, isoleucine, alanine and lysine in the region0.57–1.57 ppm. Molecules such as acetate, acetone, aceto-acetate, glutamine, citrate and creatine are present in the region1.57–3.2 ppm. Signals of sugars (present in regions 3.2–5.7 ppm)
Fig. 1 Series of PCA models to examine the differences in plasma and RBC matrices resulting from blood collected with sodium citrate or lithium heparin asanticoagulants. (A.1) PCA scores plot of aqueous fraction from plasma using sodium citrate (m) compared to the same fraction using lithium heparin (’) (R2 = 94%,Q2 = 87.7%). (A.2) PCA scores plot of lipid fraction from plasma using sodium citrate (*) compared to the same fraction using lithium heparin (+) (R2 = 87.9%, Q2 =73%). (B.1) PCA scores plot of aqueous fraction from RBCs using sodium citrate (E) compared to the same fraction using lithium heparin (K) (R2 = 72.2%, Q2 = 48.1%).(B.2) PCA scores plot of lipid fraction from RBCs using sodium citrate (J) compared to the same fraction using lithium heparin (TT) (R2 = 97.9%, Q2 = 92.2%).
This journal is c The Royal Society of Chemistry 2013 Mol. BioSyst.
and also organic acids, such as tricarboxylic acid cycle inter-mediates and amino acids, are also present in the spectrum.Aromatic compounds resonate in the region 6.0–9.0 ppm and,in the case of the RBC samples, ADP-ATP molecules areobserved. In the multivariate data analysis, comparing the aqu-eous fraction from both matrices (plasma vs. RBC), 1D 1H NMRshowed higher concentrations of glucose in plasma than inRBCs and less ADP-ATP and creatine (R2 = 67.2%, Q2 = 80.3%).
3.1.3. Lipoprotein measurements. 1D 1H NMR spectro-scopy showed, on multivariate analysis, that the measurablelipoprotein content was higher in plasma samples than in RBCs(R2 = 70.6%, Q2 = 94.6%) in which the following organic
2D diffusion-edited 1H NMR spectra and their correspondingfunctions (F1–F7) from a representative plasma sample are shownin Fig. 4A. According to Mallol et al. 2011,24 seven Lorentzianfunctions (F1–F7) were chosen to fit the NMR spectra of bloodplasma. Function F1 from Mallol et al. 2011 used to fit the back-ground within the region 0.7–1 ppm was not represented here. So,functions F1–F7, corresponding to F2–F8, were used to fit themethyl region within the range 0.8–0.9 ppm. Spectra recorded at
Fig. 2 A typical 500 MHz 1D 1H NMR spectrum obtained from lithium heparin samples representative of aqueous metabolites in human plasma and in the RBCmatrix. (A) Representative spectrum of aqueous fraction from plasma sample. (B) Representative spectrum of aqueous fraction from the RBC sample. The majoraqueous metabolites identified are: 1: valine, leucine and isoleucine; 2: lactate; 3: alanine; 4: lysine; 5: acetate; 6: acetone; 7: acetoacetate; 8: glutamine; 9: citrate; 10:creatine; 11: glucose and amino acids; 12: b-glucose; 13: a-glucose; 14: tyrosine; 15: histidine; 16: phenylalanine; 17: pyridoxine; 18: hydroxibenzoate; 19: ADP-ATP.
Fig. 3 A typical 500-MHz 1H NMR spectrum of organic fraction from human plasma and RBCs. (A) Representative spectrum of organic fraction from plasma sample(lithium heparin). (B) Representative spectrum of organic fraction from the RBC sample (lithium heparin). The major organic metabolites identified are: 1: cholesterol;2: lipoproteins; 3: phosphatidyl ethanolamine; 4: phosphatidyl choline; 5: triglycerides; 6: phosphatidyl serine, ethanolamine and choline; 7: sphingomyelin;8: plasmalogen.
Mol. BioSyst. This journal is c The Royal Society of Chemistry 2013
low gradient strengths (o13%) were not used so as to avoidinterferences from low molecular weight metabolites. A repre-sentative comparison between plasma obtained from sodiumcitrate and lithium heparin anticoagulation is shown in Fig. 4B.
Tables 1 and 2 summarize the means (SD) of relative areas,diffusion coefficients, radii and the lipoprotein subclassescorresponding to the F1–F7 of plasma obtained with bothanticoagulants (sodium citrate and lithium heparin). Wedescribe the absolute areas and amplification informationprovided by Mallol et al.24 to compare both anticoagulants.Lipoprotein absolute areas, represented as the arbitrary unitmean (SD) of samples from sodium citrate and lithium heparintubes, were: F1 796 488.08 (16 426.53), p = (0.62); F2 715 802.28(89 997.08), p = (0.001); F3 577 744.98 (88 059.11), p = (0.01);
F4 512 310.34 (55 096.58), p = (0.13); F5 442 228.58 (73 839.13),p = (0.02); F6 353 005.90 (44 997.73), p = (0.01) and F7 187808.09 (24 434.51), p = (0.41). These values were related to thelipoprotein concentrations, and plasma from sodium citrateanticoagulation appears more diluted (p o 0.05) than theplasma from lithium heparin anticoagulation (F1 (2.87%), F2(16.33%), F3 (19.46%), F4 (14.13%), F5 (21.12%), F6 (16.54%)and F7 (16.85%)); albeit not in a homogeneous manner for each F.
However, when the absolute areas were converted to relativeareas (%), these differences resulting from the type of anti-coagulant ceased to be significant (Table 1).
According to the Stokes–Einstein equation, size and lipo-protein diffusion coefficients were related to plasma viscosity;sodium citrate plasma 1.17 (0.08; mPa s) vs. 1.25 (0.08; mPa s)for lithium heparin plasma, i.e. lipoproteins in sodium citrateplasma diffuse faster than lithium heparin plasma (p o 0.05).Conversely, the lipoprotein radii measurements showed nosignificant differences between citrate and heparin plasma,due to normalization for viscosity.
The lipoprotein areas and radii were directly related to eachother and both were inversely related to the diffusion coefficient.
Lipoprotein subclasses (Table 2) were defined according to thereference lipoprotein subclass radii established by Duell et al.26
3.1.4. Fatty acid comparison between plasma and RBCs.Plasma and RBC fatty acid concentrations and percentages aresummarized in Table 3. Plasma had more FAMEs than the RBCmatrix.
In RBCs, the percentages of the saturated fatty acids (SFA)16 : 0, 17 : 0, 20 : 0 and 24 : 0 and the polyunsaturated fatty acids(PUFA) 22 : 6 n-3 and 20 : 4 n-6 were higher than in plasma(p o 0.05). However in plasma, the percentage SFA 14 : 0,monounsaturated fatty acids (MUFA) 14 : 1 n-5, 16 : 1 n-7, 17 : 1n-7 and 18 : 1 n-9 and PUFA 18 : 3 n-3, 18 : 2 n-6, 18 : 3 n-6 and20 : 3 n-6 were higher than in RBCs (p o 0.05).
3.1.5. Plasma and RBC polyphenols. Plasma and RBCsobtained from sodium citrate and lithium heparin sampleshad similar chromatogram traces for the analyses of phenols.Plasma and RBC polyphenol peaks from lithium heparinsamples are shown in Fig. 5. Several polyphenols were
Fig. 4 (A) Example of 2D diffusion-edited 1H NMR global spectra and optimalfunctions used to fit the surface. (B) Spectrum from total plasma obtained usingsodium citrate and lithium heparin as anticoagulants.
Table 1 Means and standard deviations of relative areas (%) and diffusion coefficient (m2 s�1) of lipoprotein subclasses in plasmaa
Function
Relative areas (%) Diffusion coefficient (m2 s�1)
Sodium citrate Lithium heparin Mean (SD) p Sodium citrate Lithium heparin Mean (SD) p
a Plasma lipoprotein subclasses expressed as the relative areas and diffusion coefficients corresponding to plasma obtained from bothanticoagulants (sodium citrate and lithium heparin) determined by 2D diffusion-edited 1H NMR spectra and function (F1–F7). p values indicateddifferences between blood drawn using sodium citrate and lithium heparin as anticoagulants from n = 10 healthy individuals. Lipoprotein absoluteareas, represented as arbitrary unit mean (SD) of samples from sodium citrate and lithium heparin tubes, were: F1 796 488.08 (16 426.53), p = 0.62;F2 715 802.28 (89 997.80), p = 0.001; F3 577 744.98 (88 059.11), p = 0.01; F4 512 310.34 (55 096.58), p = 0.13; F5 442 228.58 (73.839.13), p = 0.02;F6 353 005.90 (44 997.73), p = 0.01 and F7 187 808.09 (24 434.51), p = 0.41.
This journal is c The Royal Society of Chemistry 2013 Mol. BioSyst.
identified in plasma (Fig. S1, ESI†). These included 3-hydroxy-phenylpropionic acid (peak 4), o-, m- and p-hydroxyphenyl-acetic acid (peak 6), hydroxybenzoic acid (peak 7), phenylaceticacid (peak 8) and hydroxyflavanone (peak 10). Further, unidenti-fiable peaks in plasma were at molecular weight 180 g mol�1
(peak 1 and 2), 204 g mol�1 (peak 2), 194 g mol�1 (peak 5) and254 g mol�1 (peak 9). In RBCs, the unidentifiable peaks were atmolecular weights of 346 g mol�1 (peak 11), 695 g mol�1 (peak 12),432 g mol�1 (peak 13) and 651 g mol�1 (peak 14).
4. Discussion and conclusion
Our data indicate that several specific molecular and nutri-tional biomarkers are associated with RBCs, the measurement
of which extends the data obtainable from their measurementin plasma alone in human studies.
The biological samples from the ostensibly-healthy subjectsin our study would be representative of a general populationand, as such, optimal for standardizing the metabolomicsprocedures for future human studies.
As an example of a robust metabolomic approach, the typeof anticoagulant used for blood sample collection (sodiumcitrate or lithium heparin) was, in general, of note in evaluatingparameters for measurement in plasma and RBCs with therange of techniques currently at our disposal.
Compared to lithium heparin plasma, there was an over-estimation in sodium citrate plasma of some aqueous metabo-lites found in human plasma and RBCs, such as citrate, since
Table 2 Means and standard deviations of radius (Å), reference ranges of lipoprotein subclass radii (Å) and lipoprotein subclass conventional terminologya
FunctionRadius (Å)Sodium citrate Lithium heparin Mean (SD) p
a Plasma lipoprotein subclasses expressed as radii corresponding to plasma obtained from both anticoagulants (sodium citrate and lithiumheparin) determined by 2D diffusion-edited 1H NMR spectra and its functions (F1–F7). p values indicated differences between blood drawn usingsodium citrate and lithium heparin as anticoagulants from n = 10 healthy individuals; Å = angstrom units = 10�10 m. Lipoprotein subclasses radiusreference range as described by Duell et al.
Table 3 Fatty acid composition in plasma and red blood cell (RBC) matricesa
Fatty acid Fatty acid
FAME mg mL�1 (SD) FAME % of total fatty acids (SD)
Mol. BioSyst. This journal is c The Royal Society of Chemistry 2013
this type of blood-collection tube dilutes the sample, i.e. thevolume of sodium citrate (B250 mL of 0.129 M sodium citratein a 2.7 mL blood sample collection tube) results in a ‘‘non-real’’ or ‘‘inaccurate’’ measurement of the parameters-of-interest. In contrast, when we examined the same samples inRBCs we did not observe differences because the method usedfor RBC isolation requires a series of washes which precludethese differences. We recommend using lithium heparin tubes(68 IU) for blood collection if plasma is the desired matrix foranalyte measurement using NMR, GC-MS and UPLC-MS/MS.Other metabolomic studies support the use of the lithiumheparin anticoagulant for NMR-based metabolic profilingstudies.27
As mentioned earlier, the volume of blood that can beaccessed from the human individual for diagnostic and/orresearch purposes is limited. Also, most analytes are measuredin plasma or serum, and the RBCs are usually discarded. Ouranalyses have shown that plasma and RBCs are differentmatrices which provide similar and complementary informa-tion. Depending on the parameter-of-interest, plasma and/orRBC matrices can be used independently.
We observed that the lipoprotein content was higher in theplasma sample than in RBCs and supports the classical conceptthat lipoproteins are transported in circulating plasma.28 How-ever, recent studies conducted by Bovenberg et al. suggested thepresence of other pools of lipoproteins attached, possibly, tothe endothelium or to other cells such as RBCs.29–31 Thesepostulations could open new applications for NMR analyses ofRBCs and their associated lipoprotein content in relation toseveral diseases such atherosclerosis and other lipid disorderswhere an alternative blood-cell-mediated lipoprotein transportsystem has been proposed. For example, the study by Boven-berg et al.30 concluded that a high binding of RBCs to apolipo-protein B could be protective against atherosclerosis.
From the point of view of absolute values (expressed as mg mL–1),plasma contains higher concentrations of any FA identifiedcompared to RBCs. However, the percentage values of FAsobtained from plasma and from RBCs give information on
the type of FA present in greater quantity in plasma vs. RBCs,and vice versa.
Regarding the percentages of FAs, our results showed thatRBCs are a particularly rich medium for the detection of SFA.These include palmitic acid (16 : 0), margaric acid (17 : 0),arachidic acid (20 : 0) and lignoceric acid (24 : 0), all of whichare widely distributed in dairy products (such as butter, ghee,whole milk, cream, fatty cheeses), in fatty meats and animalfats (such as lard), in vegetable oils (such as palm oil, palmkernel and coconut oil) and fat-rich snacks.32 In RBCs, PUFAsuch as DHA (22 : 6 n-3) and arachidonic acid (20 : 4 n-6) werehigher than in plasma, they are common FAs in vegetable oils(soybean oil, rapeseed oil, sunflower oil, and olive oil) and infatty fish, fish oil, nuts, seeds and products made from these,e.g. soft margarines, mayonnaise and other derived products.32
PUFA and arachidonic acid expressed as n-3/n-6 ratio areobjective indicators of PUFA status and may be related to hipfracture risk33 or progression in coronary atherosclerosis,34
inter alia. Moreover, RBCs indicate that the PUFA statusprovides some advantage compared with dietary questionnairesor interviews. Indeed, these biomarkers are quantitativemeasurements independent of memory and/or knowledge ofthe subjects and are less likely to be due to social desirabilitybias than dietary self-reporting.35 The concentrations of theseFAs were better detected in RBCs than in plasma, and could beused as biomarkers of the study participant’s consumption ofspecific food items over the previous weeks, or even months.36
Compared to RBCs, plasma was observed to have a highercontent of SFA such as myristic acid (14 : 0), or MUFA such asmyristoleic acid (14 : 1 n-5), palmitoleic acid (16 : 1 n-7), 17 : 1n-7 and oleic acid (18 : 1 n-9) as well as of PUFA such as alpha-linolenic acid (18 : 3 n-3), linoleic acid (18 : 2 n-6), gamma-linolenic acid (18 : 3 n-6) and 20 : 3 n-6.
We observed that the absolute quantities of FAs (expressedas mg mL–1) in plasma and RBCs better describe the dataobtained, while FA percentages make comparisons betweenspecimens easier. These raw data will be accessible for the nextgeneration of metabolomic software and bioinformatics analysistools. However, such tools can only be developed and optimizedif there are standardized methodologies37 such as we haveproposed.
In dietary studies in general, 3- to 7-day food records areconsidered to be the most accurate means of intake assess-ment. However, such methods are not feasible in large cohortstudies.38 Metabolic profiles, as our study proposes, wouldmore accurately reflect short- medium- and long-term dietaryintakes and, as such, would be more effective in evaluating, forexample, the health benefit claims of manufactured functionalfood products.
RBCs better reflect long-term dietary FA intake than plasma,as has been previously suggested. Since the biological half-lifeof RBCs is of the order of 120 days,39 the measurements inRBCs would reflect the mean FA status of the previous 3months.36 Depending on the FAs of interest and the studyobjectives, plasma and/or RBCs should be analyzed so as toprovide complementary information. For example, it has been
Fig. 5 A representative UPLC-DAD chromatogram (278 nm) obtained from theanalysis of polyphenols in: (A) plasma lithium heparin samples; (B) RBC lithiumheparin samples.
This journal is c The Royal Society of Chemistry 2013 Mol. BioSyst.
suggested that, in epidemiology/nutrition studies, FA composi-tion measured in RBCs is a viable alternative to adipose tissuebiopsy for determining long-term FA consumption.
In our study, polyphenols associated with RBCs weredetected in the fasting state, and were different from thosemeasured in the corresponding plasma. Thus, there is thepromising option that RBCs may provide a longer-term mea-sure of polyphenolic intake in nutrition studies. However, wewere unable to identify several peaks from the UPLC-MS/MSspectra; more detailed and accurate techniques for the identifi-cation of these metabolites are needed, and the informationadded to the current databases. Despite the power of thesetechniques to detect various constituents of biological samples,the main problem remains that of data analyses and proces-sing. In future studies, the key aspect for accurate and detailedcharacterization of specific metabolites in future studies is theavailability of accurate databases.40
The ultimate goals of these ‘omics’ studies are to identify themolecular signatures of dietary nutrients and non-nutrients,that could result in a specific ‘‘desirable’’ phenotype and,hence, to provide personalized nutritional recommendationsfor health maintenance as well as for disease prevention
There are two main limitations of our study. The firstlimitation is the small number of subjects studied. Our resultsare preliminary and focus mainly on the gross effects of bloodsample collection and the possible effects on the metabolomicapproach to a nutritional study. The second limitation is thelack of a database containing the assignments and identifi-cation of several polyphenol peaks in the spectra derived fromplasma and RBCs, as assessed by UPLC-MS/MS. Future studieswould require more accurate techniques for polyphenol detec-tion and identification.
These drawbacks limit the conclusions that could be drawn.However, the positive benefit of our study is the detailed insightinto measurements conducted in plasma and RBC matricesfrom different methods of blood anticoagulation. Our resultsindicate that the lithium heparin anticoagulant is to be pre-ferred. We have applied the combination of NMR spectroscopy,GC-MS and UPLC-MS/MS approaches in order to generatemetabolomic profiles in our human volunteers. Thus, RBCversus plasma measurements provide complementary meta-bolic information with respect to several specific molecularbiomarkers, which could be applied in nutritional assessments.
Acknowledgements
We thank Lluisa Iniesta and Miguel Querol for their enthusias-tic logistic support in the conduct of the study. The study wasfinanced, in part, by grants (AGL-2005-07881 and AGL2009-13517-C03-03) from the Spanish Ministry of Education andScience [Ministerio de Educacion y Ciencia] and the support ofCentre Tecnologic de Nutricio i Salut (CTNS), Reus, Spain. Thework was supported by the Spanish Ministry of Education andScience (mobility PhD fellowship TME2009-00409 of EDU/2933/2009). Also, we would like to thank the Griffin group fromCambridge for their support.
References
1 D. Darghouth, B. Koehl, C. Junot and P. H. Romeo, Transfus.Clin. Biol., 2010, 17, 148–150.
2 M. Jenab, N. Slimani, M. Bictash, P. Ferrari andS. A. Bingham, Hum. Genet., 2009, 125, 507–525.
3 A. Sengupta and M. Ghosh, Eur. J. Nutr., 2011, 50, 411–419.4 M. Oresic, Nutr., Metab. Cardiovasc. Dis., 2009, 19, 816–824.5 G. C. Shearer, J. V. Pottala, J. A. Spertus and W. S. Harris,
PLoS One, 2009, 4, e5444.6 J. Assies, F. Pouwer, A. Lok, R. J. Mocking, C. L. Bockting,
I. Visser, N. G. Abeling, M. Duran and A. H. Schene, PLoSOne, 2010, 5, e10635.
7 L. Hodson, C. M. Skeaff and B. A. Fielding, Prog. Lipid Res.,2008, 47, 348–380.
8 S. Caspar-Bauguil, J. Garcia, A. Galinier, B. Periquet,J. Ferrieres, S. Allenbach, N. Morin, P. Hericotte, R. Salvayreand M. Baudet, Arch Cardiovasc Dis., 2010, 103, 106–114.
9 B. J. Fuhrman, M. Barba, V. Krogh, A. Micheli, V. Pala,R. Lauria, V. Chajes, E. Riboli, S. Sieri, F. Berrino andP. Muti, Ann. Nutr. Metab., 2006, 50, 95–102.
10 K. Kuriki, K. Tajima and S. Tokudome, Lipids, 2006, 41,605–614.
11 L. Arab, J. Nutr., 2003, 133(suppl 3), 925S–932S.12 L. Arab and J. Akbar, Public Health Nutr., 2002, 5, 865–871.13 R. Gonzalez, I. Ballester, R. Lopez-Posadas, M. D. Suarez,
A. Zarzuelo, O. Martinez-Augustin and F. Sanchez deMedina, Crit. Rev. Food Sci. Nutr., 2011, 51, 331–362.
14 C. D. Hapner, P. Deuster and Y. Chen, Chem.–Biol. Interact.,2010, 186, 275–279.
15 S. I. Rizvi and K. B. Pandey, Pharmacol. Rep., 2010, 62,726–732.
16 F. Paiva-Martins, J. Fernandes, S. Rocha, H. Nascimento,R. Vitorino, F. Amado, F. Borges, L. Belo and A. Santos-Silva,Mol. Nutr. Food Res., 2009, 53, 609–616.
17 E. Koren, R. Kohen and I. Ginsburg, Exp. Biol. Med., 2010,235, 689–699.
18 M. Fiorani, A. Accorsi and O. Cantoni, Free Radical Res.,2003, 37, 1331–1338.
19 A. Maccaglia, C. Mallozzi and M. Minetti, Biochem. Biophys.Res. Commun., 2003, 305, 541–547.
20 E. M. Lenz, J. Bright, I. D. Wilson, A. Hughes, J. Morrisson,H. Lindberg and A. Lockton, J. Pharm. Biomed. Anal., 2004,36, 841–849.
21 M. J. Gibney, M. Walsh, L. Brennan, H. M. Roche,B. German and B. Van Ommen, Am. J. Clin. Nutr., 2005,82, 497–503.
22 F. Puiggros, R. Sola, C. Blade, M. J. Salvado and L. Arola,J. Chromatogr., A, 2011, 1218, 7399–7414.
23 X. Zhang, Y. Yap, D. Wei, G. Chen and F. Chen, Biotechnol.Adv., 2008, 26, 169–176.
24 R. Mallol, M. A. Rodriguez, M. Heras, M. Vinaixa,N. Canellas, J. Brezmes, N. Plana, L. Masana andX. Correig, Metabolomics, 2011, 7, 572–582.
25 M. M. Koek, R. H. Jellema, J. van der Greef, A. C. Tas andT. Hankemeier, Metabolomics, 2011, 7, 307–328.
Mol. BioSyst. This journal is c The Royal Society of Chemistry 2013
26 P. B. Duell, D. R. Illingworth and W. E. Connor, Endocrinologyand metabolism., Mc Graw-Hill, New York, 2001.
27 R. H. Barton, D. Waterman, F. W. Bonner, E. Holmes,R. Clarke, J. K. Nicholson and J. C. Lindon, Mol. Biosyst.,2010, 6, 215–224.
28 S. G. Young, Circulation, 1990, 82, 1574–1594.29 S. A. Bovenberg, A. Alipour, J. W. Elte, A. P. Rietveld,
J. W. Janssen, G. J. van de Geijn, T. N. Njo, R. van Mechelen,S. M. Hervas and M. C. Cabezas, Atheroscler. Suppl., 2010,11, 25–29.
30 S. A. Bovenberg, B. Klop, A. Alipour, S. Martinez-Hervas,A. Westzaan, G. J. van de Geijn, H. W. Janssen, T. Njo,E. Birnie, R. van Mechelen, A. P. Rietveld, J. W. Elte andM. Castro Cabezas, Eur. J. Clin. Invest., 2011, 42, 365–370.
31 C. Verseyden, S. Meijssen and M. C. Cabezas, J. Clin.Endocrinol. Metab., 2004, 89, 5021–5029.
32 C. Diekman, I. Elmadfa, B. Koletzko, P. Puska, R. Uauy andH. Zevenbergen, Ann. Nutr. Metab., 2009, 54(suppl 1), 39–40.
33 T. S. Orchard, S. W. Ing, B. Lu, M. A. Belury, K. Johnson,J. Wactawski-Wende and R. D. Jackson, J. Bone Miner. Res.,2012, 28, 505–515.
34 T. Nozue, S. Yamamoto, S. Tohyama, K. Fukui, S. Umezawa,Y. Onishi, T. Kunishima, A. Sato, T. Nozato, S. Miyake,Y. Takeyama, Y. Morino, T. Yamauchi, T. Muramatsu,K. Hibi, M. Terashima and I. Michishita, Am. J. cardiol.,2012, 109, 1247–1253.
35 M. B. Katan, J. P. Deslypere, A. P. van Birgelen, M. Pendersand M. Zegwaard, J. Lipid Res., 1997, 38, 2012–2022.
36 Q. Sun, J. Ma, H. Campos, S. E. Hankinson and F. B. Hu, Am.J. Clin. Nutr., 2007, 86, 74–81.
37 J. L. Griffin and C. Steinbeck, Genome Med., 2010, 2, 38.38 P. W. Siri-Tarino, Q. Sun, F. B. Hu and R. M. Krauss, Am. J.
Clin. Nutr., 2010, 91, 535–546.39 B. E. Bax, M. D. Bain, P. J. Talbot, E. J. Parker-Williams and
R. A. Chalmers, Clin. Sci., 1999, 96, 171–178.40 E. P. Go, J Neuroimmune Pharmacol., 2010, 5, 18–30.


![Systems Metabolomic Lecture[1]](https://static.documents.pub/doc/80x56/546af5e0b4af9f486b8b45b1/systems-metabolomic-lecture1.jpg)


