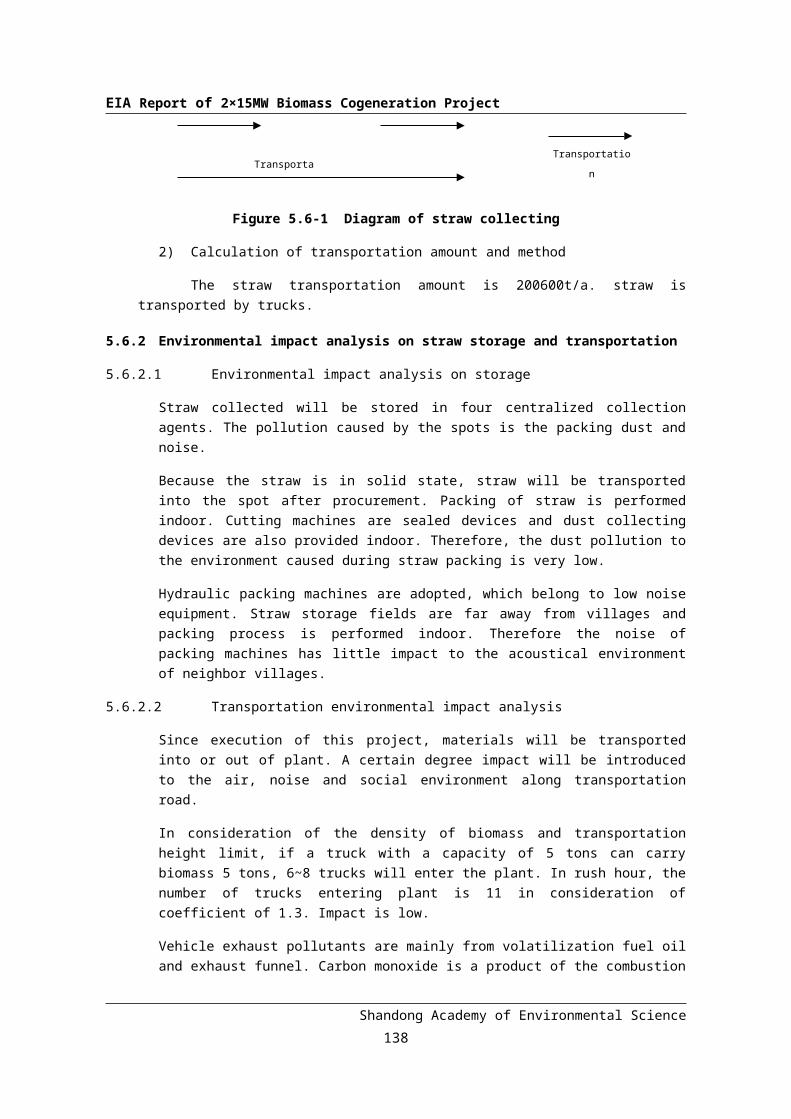
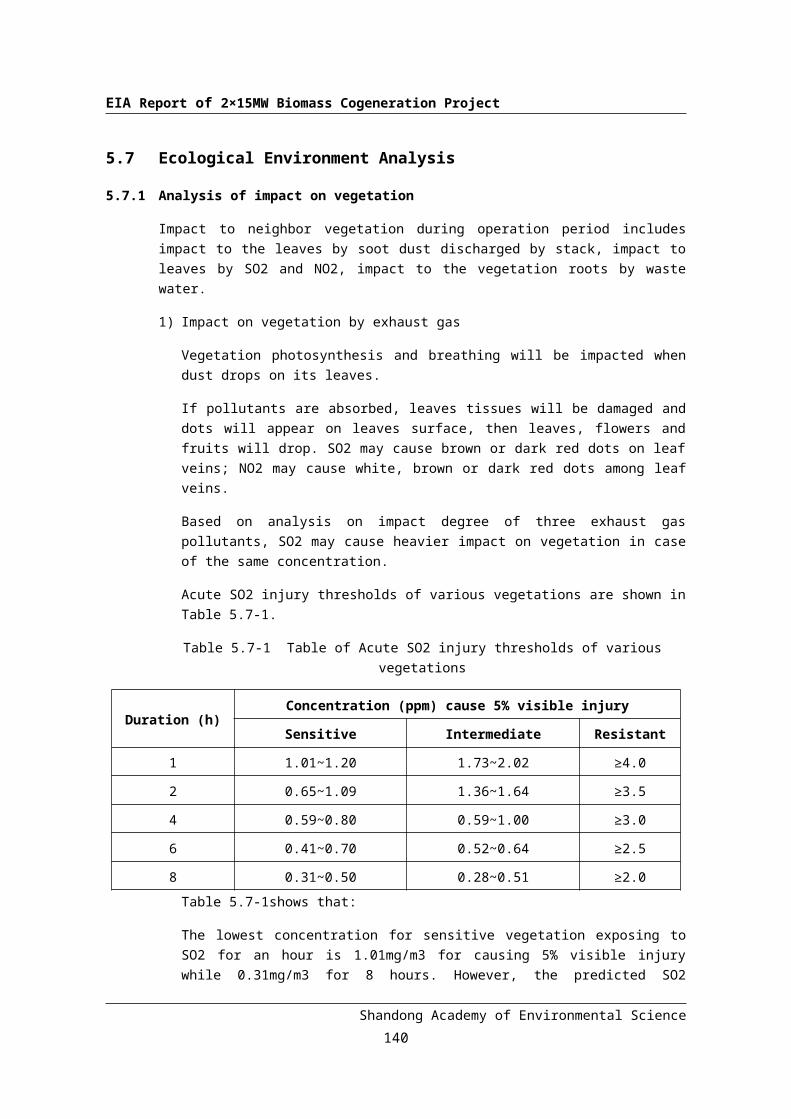
Anqiu Shengyuan Biomass Thermal Company Limited 2×15MW Biomass Cogeneration Project Environment Impact Assessment Report Project funded by the World Bank Loan Assessed by: Shandong Academy of Environmental Science EIA Certificate : Guo-huanping-zheng-jia-zi No.2402 E2488 V2
Transcript
Anqiu Shengyuan Biomass Thermal Company Limited2×15MW Biomass Cogeneration Project
Environment Impact Assessment Report
Project funded by the World Bank Loan
Assessed by: Shandong Academy of Environmental Science
On May 25,2007, Shandong Academy of Environmental Science, entrusted by Anqiu Shengyuan Thermal Power Company Limited, compiled Environmental Impact Assessment Report of 2×12MW Biomass Cogeneration Project proposed by Anqiu Shengyuan Thermal Power Company Limited; and on November 11, 2007, Reply of Approval(No.194 (2007) Lu-Huan-Shen) was made by Shandong Environmental Protection Bureau. On June 20, 2008, Shandong Environmental Protection Bureau issued another letter (No.406(2008)Lu-Huan-Han) and agreed on the change of legal person of the proposed project to Anqiu Shengyuan Biomass Thermal Power Company Limited to Anqiu Shengyuan Thermal Power Company Limited, Shandong Thermal Power Design Academy, and Jinan Haoyu Weiye Science and Trade Company Limited. On August 18, 2008, Shandong Development and Reform Commission issued a letter of approval for the establishment of Anqiu Shengyuan Biomass Thermal Power Company Limited.
As the project requires a loan from the World Bank, Anqiu Shengyuan Biomass Company Limited is required to modify the originally compiled Environment Impact Assessment (EIA) Report in accordance to requirements of the World Bank to get approval from the World Bank experts. Based on China Environment Impact Assessment Law, Regulations on Administration of Construction Project Environment Protection, and Circular on Strengthening Environment Impact Assessment Management of Projects funded by Loans from International Financial Organizations, the Academy was entrusted by Anqiu Shengyuan Biomass Thermal Power Company Limited to carry out the environment impact assessment of the project. The Academy, when being entrusted, re-compiled the report under the World Bank Environment Impact Assessment (EIA) Guidelines and completed the Environmental Impact Assessment (EIA) Report of 2*15MW Biomass Cogeneration Project proposed by Anqiu Shengyuan Biomass Thermal Power Company Limited (World Bank Version). As the proposed project has not undergone significant changes, the current conditions of environment quality and EIA data referred to in the new EIA report are in reference to the previous EIA report.
The new Environment Impact Assessment (EIA) report is based on the previous report approved by Shandong Environment Protection Bureau but with modifications of the structure and additional analysis made in accordance to the prevalent standard enacted and the World Bank requirements.
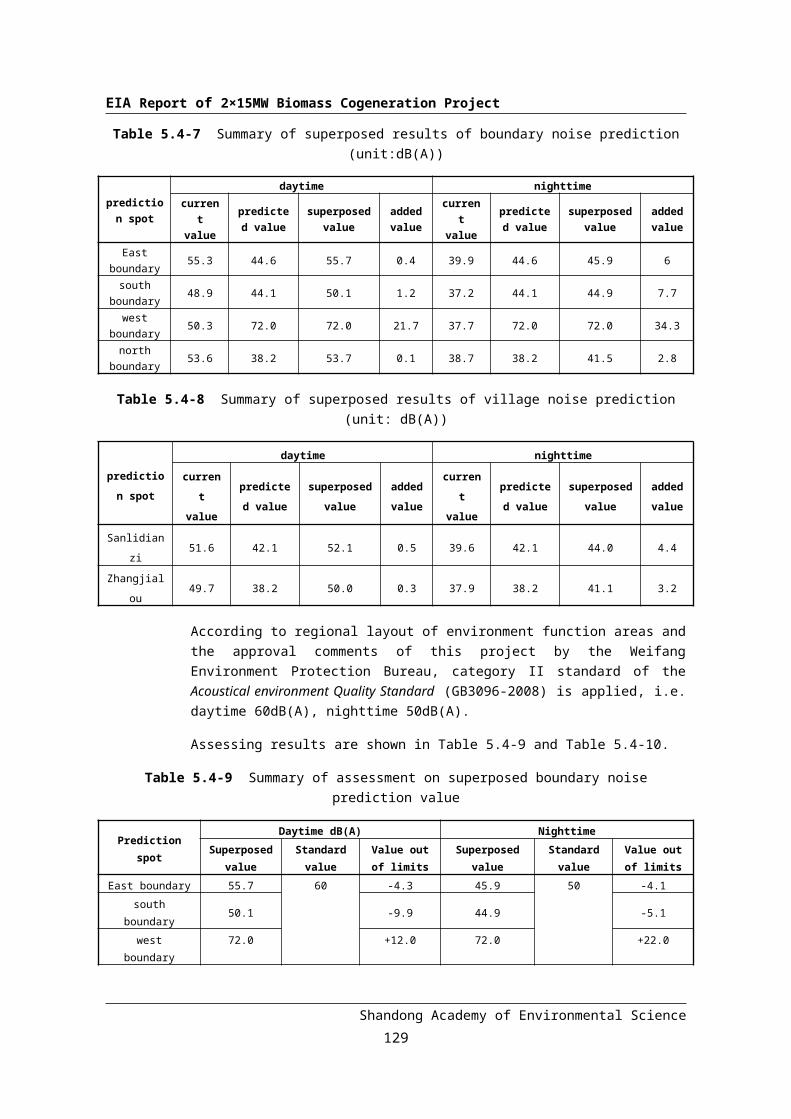
On August 19,2008, Acoustic Quality Standards (GB 3096-2008) were promulgated by the National Ministry of Environmental Protection to be effective on and from October 1, 2008.
Based on the requirements of the Acoustic Quality Standards, the environment impact assessment (EIA) has made modifications on the acoustic environment quality assessment results and the predicted overlapping assessment results. As the standard values remain unchanged, the acoustic environment impact assessment results remain the same.
Shandong Academy of Environmental Science
1
EIA Report of 2×15MW Biomass Cogeneration Project
On December 31,2008, EIA Technical Guideline-Atmospheric Environment (HJ/T2.2-2008)was promulgated by National Ministry of Environmental Protection to be effective on April 1,2009.
As the emission of atmospheric pollutants is not changed from the calculated amount in the original EIA report, and also as the proposed project is fueled by wheat and corn stalks with low sulfur content (0.06% and 0.07% respectively), plus the project is equipped with Bag-type dust collectors (dust removal efficiency of 99.9%), the pollutant emission density can satisfy the requirements of the 3rd time phrase in Thermal Power Plant Atmospheric Pollutant Emission Standards (Shandong Provincial Standard DB37/664-2007). Therefore, the environment impact assessment has not reassessed air impact in accordance to the prediction mode in HJ/T2.2-2008 but referred to the atmospheric prediction mode and air impact assessment results listed in the previous report.
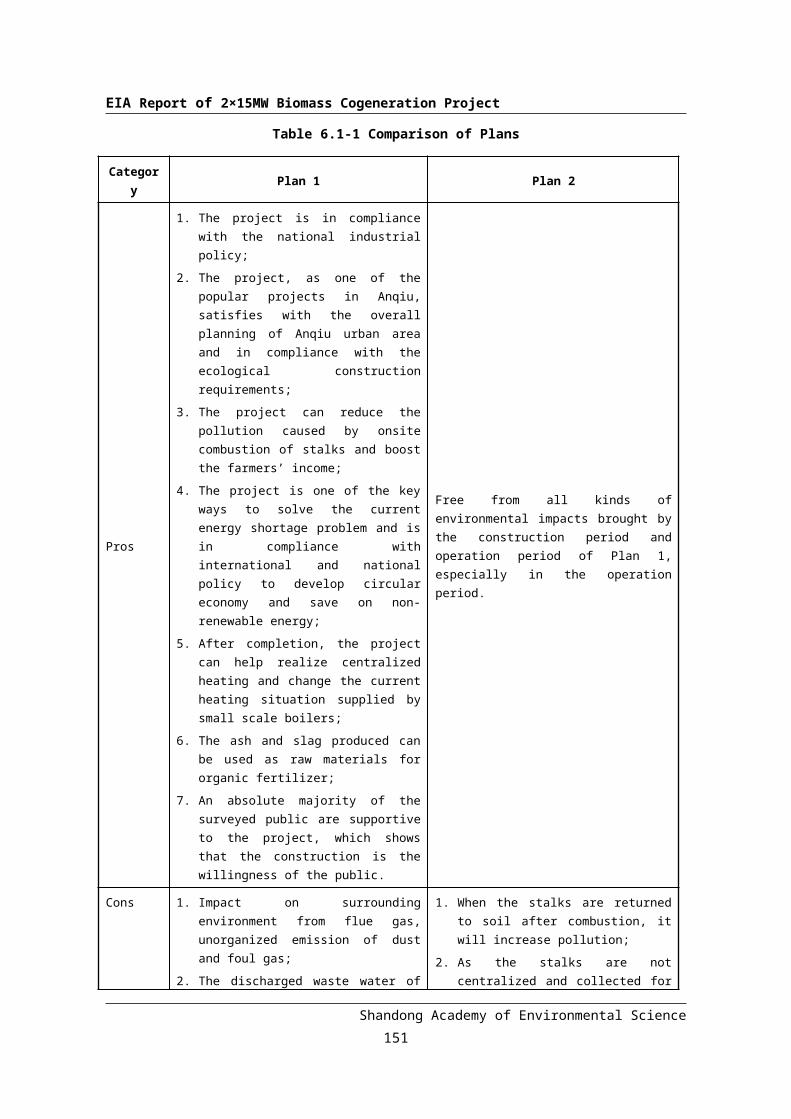
It has been two years since the previous environment impact assessment (EIA) report got approved. The previous designed thermal load of the project has changed as the project design has made changes. On the principle of shortest assessment period with guaranteed report quality, the new environment impact assessment (EIA) report has not made corresponding modifications to the thermal load and it is still based on the thermal load in the previous EIA report. Because the key project content has not been greatly changed, the new environment impact assessment report can still show the aim of the construction organization to build the cogeneration project and the assessment of alternatives to the atmospheric environment.
In order to satisfy the World Bank requirements, the construction organization has asked Shandong Engineering Consulting Institute to re-compile the feasibility study of the project and further optimize the layout of the project. The main buildings are located in the center of the site and the cooling tower in the west of the site. The new arrangement has further lowered the noise impact of the equipment and cooling tower to the sensitivity objects nearby. The new environment impact assessment is carried out based on the overall layout plan after the modification.
The proposed project, 2*15MW Biomass Cogeneration Project of Anqiu Shengyuan Biomass Thermal Company Limited, is located in the Southwest of Anqiu City and in the Xing’an Street Administration. The project will fully utilize the abundant stalks locally and change the biomass energy to electric power and heat power to protect the environment, save on energy and balance the local grid and thermal load.
Anqiu Shengyuan Biomass Cogeneration Co., Ltd. is jointly established by Shandong Thermal Power Design Institute, Anqiu Shengyuan Thermal Power Co., Ltd. and Jinan Haoyu Weiye Science and Technology Co., Ltd. They will be responsible for the construction, administration and management of the company as well as the payback of loans and the interests.
Shandong Thermal Power Design Institute, founded in 1993, is a comprehensive design institute incorporating consultation and design for sectors including power, construction, civil works as well as environmental friendly construction contracting. The scope of business is, within its qualification as stipulated, power engineering survey and design, construction design, equipment installation and commissioning, feasibility study of large scale power generation power plant, as well as sales
Shandong Academy of Environmental Science
2
EIA Report of 2×15MW Biomass Cogeneration Project
of whole set of equipments, technology development and transfer, new product research and development and promotion, personnel training, contracting business of environmental protection works and air purification works.
Shandong Thermal Power Design Institute is a knowledge intense institute with strong technical know-how and advanced engineering equipment. There are more than 100 technicians in 5 design rooms and 2 centers, covering generator, electrical, construction, structuring, thermal control, plumbing, coal transport, ash removal, chemical water, overall transport, environment protection, technical, budget, equipment, heat supply sections. There are advanced publishing equipment including scanning, photocopying, printing and book-making. The institute has established an electronic file system and digital and word processing center based on database and supported by computers to satisfy the requirements of site investigation, comprehensive data management, and office automation and computer file processing.
The institute has, based on the specialty on thermal power design, given initiative to the talents, taken an active role in the technical exploration and exchange in the power generation through waste, stalk, and steam turbines, as well as desulphurization. In order to emphasize on the environmental protection section, it has set up in November 2004 an environmental protection engineering center. In September 2005, in has set up an equipment service center serving as service platform to realize sustainable development of the institute and establish a platform for communication between equipment supplier and clients.
In order to satisfy the national demand for power design, the institute has established a branch office in Zhejiang, contracting work for Jiangsu and Zhejiang area. In order to strengthen the research and development capacity and enlarge horizontal collaboration, the institute has established Shandong Thermal Power Design Institute Shang Keda Thermal Power Research Office in Qingdao with Shandong University of Science and Technology.
The institute insists on quality principle of meticulous design for ultimate satisfaction and it has completed hundreds of cogeneration sets including Wendeng Thermal Power Plant, Wanjie Group Thermal Power Plant, Huatai Group Thermal Power Plant, Shifeng Group Thermal Power Plant, Yantai Binhai Power Plant, with a total capacity of 3000MW.
Since its establishment, it has set up a sustainable development strategy based on engineering design and extended service and its coordinating development and insists on strategic development, scientific management, so to make the provision of management and consultation service to thermal power companies as the leading industry with an aim to establish a new type of institute that is in line with international and intelligent service together with business.
In consideration the biomass resource and heat supply thermal load of Anqiu, Anqiu Shengyuan Biomass Thermal Power Company Limited proposes to invest RMB230.50million to establish 2*15MW extraction steamer and 2*75 sub high temperature and sub high pressure stalk combustion fluidized bed boilers with reserved land for expansion.
Establishing a biomass cogeneration project can turn biomass energy to electric power and thermal energy by turning waste into resources. Complete combustion of biomass can effectively
Shandong Academy of Environmental Science
3
EIA Report of 2×15MW Biomass Cogeneration Project
lower the emission of harmful pollutants and preserve ecological environment. The ash after combustion of biomass is a quality organic fertilizer, rich in calcium, magnesium, phosphorous and potassium. They can be used as raw materials for fertilizer production. Biomass cogeneration projects will bring great benefits to the society.
We wish to extend our gratitude to the guidance and support received in the report preparation from the World Bank experts, environmental protection authorities of all levels, Anqiu Municipal government, the project administrative authorities, and the construction companies.
Project Office
November 2009
Jinan
Shandong Academy of Environmental Science
4
EIA Report of 2×15MW Biomass Cogeneration Project
CONTENTS
Chapter 1 General Introduction..................................................................................................1
1.1 Basis of Preparation.......................................................................................................1
1.2 Assessment Aim and Guidelines....................................................................................8
1.3 Identification of Environmental Impact Factors and Selection of Assessment Factors. . .8
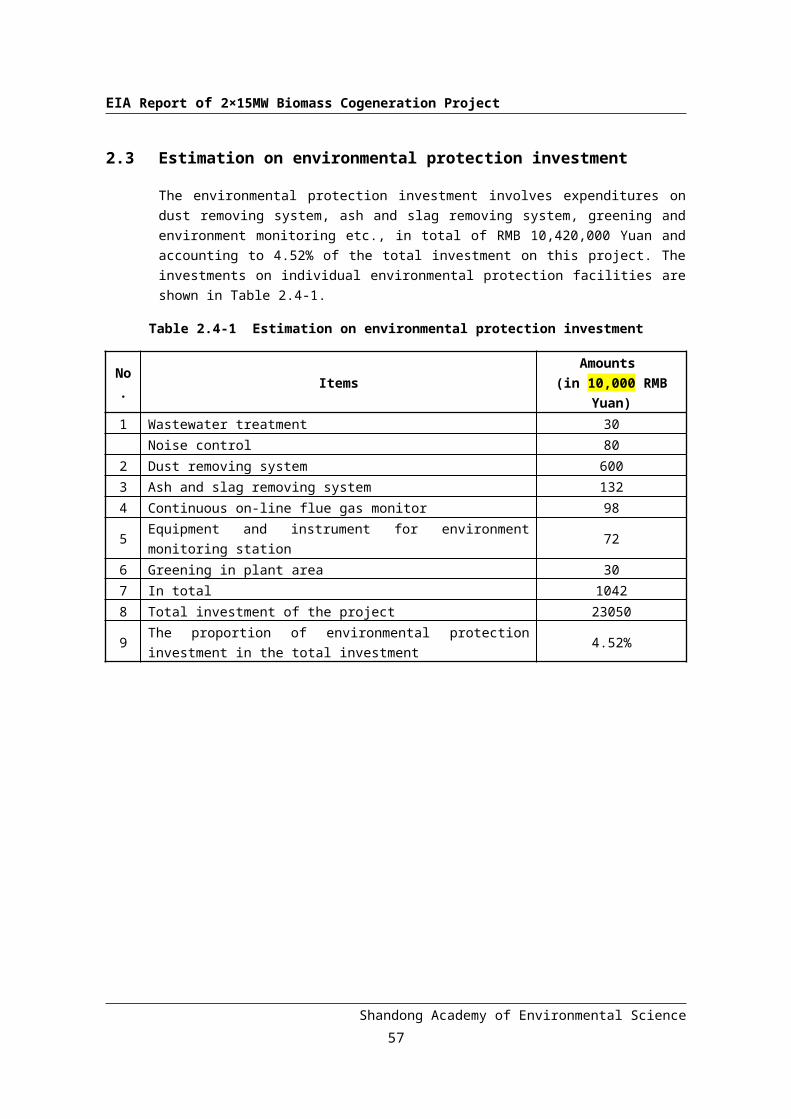
2.3 Estimation on environmental protection investment......................................................47
Chapter 3 Brief on Natural and Social Environment............................................................48
3.1 Brief on Natural Environment........................................................................................48
3.2 Brief on social environment..........................................................................................51
3.3 Ambient air quality........................................................................................................52
3.4 In Compliance With Relevant Plans and Industrial Policies..........................................55
Chapter 4 Environment Impact Analysis in Design and Construction Period...................59
4.1 Environment Impact Analysis in Design Period and the Prevention and Control Measures...................................................................................................................... 59
4.2 Environment Impact Analysis in Construction Period and the Prevention and Control Measures...................................................................................................................... 59
Chapter 5 Environmental Impact Analysis of Operation Period.........................................69
5.1 Environmental air impact prediction and assessment...................................................69
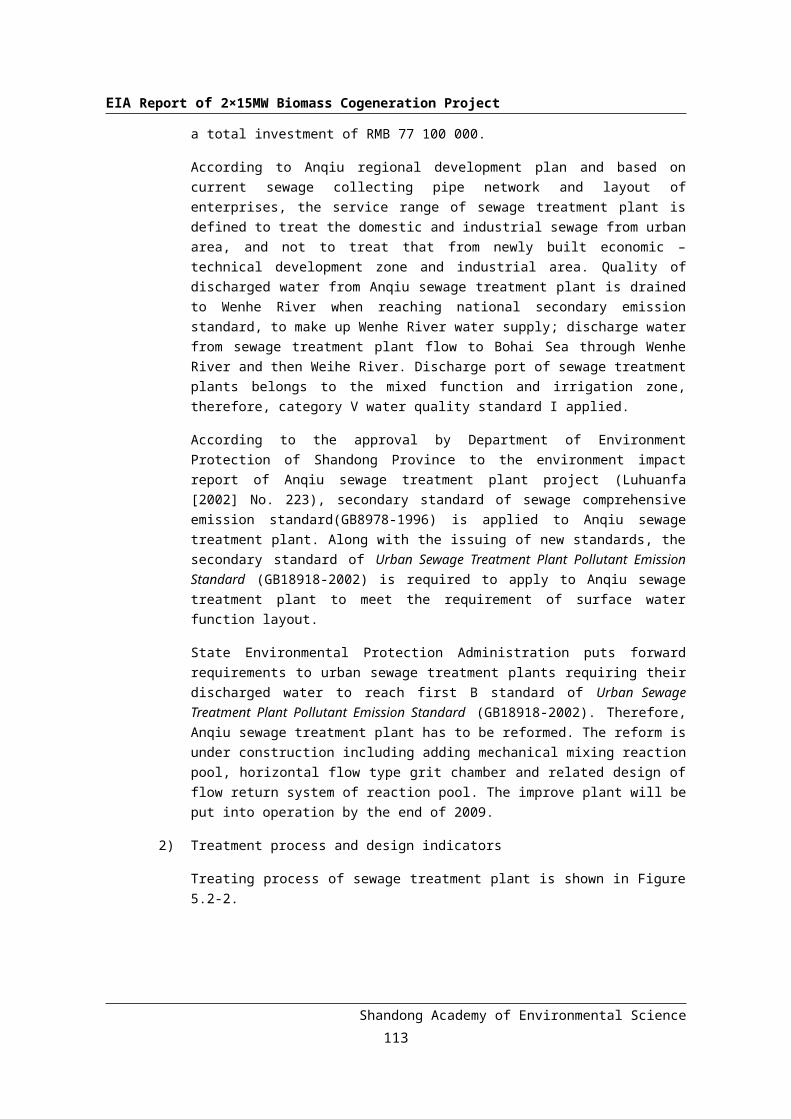
5.2 surface water environmental impact analysis...............................................................90
9.2 Prevention Measures and Suggestions......................................................................173
Appendix
Shandong Academy of Environmental Science
ii
EIA Report of 2×15MW Biomass Cogeneration Project
Chapter 1 General Introduction
1.1 Basis of Preparation
1.1.1 National laws, regulations and policies
1) Environmental Protection Law of the People’s Republic of China (December 26, 1998);
2) Law of the People’s Republic of China on Environmental Impact Assessment (October 28, 2002);
3) Law of the People’s Republic of China on the Prevention and Control of Air/Atmospheric Pollution (April 29, 2000);
4) Law of the People’s Republic of China on the Prevention and Control of Water Pollution (February 28,2008);
5) Law of the People’s Republic of China on the Prevention and Control of Environmental Pollution from Solid Wastes (December 29,2004);
6) Law of the People’s Republic of China on the Prevention and Control of Pollution from Environmental Noise (October 29,1996);
7) Law of the People’s Republic of China on Promoting Clean Production (June 29,2002)
8) Law of the People’s Republic of China on Energy Conservation (November 11,1997);
9) Electric Power Law of the People’s Republic of China (April 1,1996);
10) Renewable Energy Law of the People’s Republic of China (February 28,2005);
11) Regulations on the Administration of Construction Project Environmental Protection (Decree No.253 of the State Council of the People’s Republic of China, effective on November 29,1998)’
12) Decision on Implementing Scientific Development Outlook and Strengthening Environmental Protection by State Council (Guofa [2005] No.39 on December 3,2005);
13) Guofa [2007]No.64, Notice on Strengthening and Standardizing New Project
Shandong Academy of Environmental Science
1
EIA Report of 2×15MW Biomass Cogeneration Project
Management by State Council (November 17,2007);
14) Reply of the State Council Concerning Acid Rain Control Areas and Sulphur Dioxide Pollution Control Areas (Guohan [1998]No.5,on January 12,1998);
15) Notice on Strengthening City Water Supply, Water Conservation and Pollution Control by State Council (Guofa [2000]No.36, November 7,2000);
16) Guohan[2006]No.70, Reply on Control Plan of Major Pollutant Discharge during 11 th
5-year period by State Council (August 5,2006);
17) Notice on Printing and Issuing Guideline Catalogue for Development of Renewable Energy by State Development and Reform Commission (NDRC [2005]No.2517, November 29,2005);
18) Essentials of 2000-2015 Development Plan for New Energy and Renewable Energy Industry (State Economic and Trade Commission, August 23,2000);
19) Notice on Strengthening Power Construction Management and Promoting Orderly and Healthy Power Industry Development (State Development and Reform Commission Energy Resource [2004]No.272,March 19,2004);
20) Notice on Printing and Distributing “Relevant Provisions for the Administration of the Generation of Electricity Using Renewable Energy Resources ”by State Development and Reform Commission (Fagai Energy [2006]No.13, January 5,2006);
21) Notice on Printing and Distributing the 11th 5-year Planning on Development of Renewable Energy Resources by State Development and Reform Commission (Fagai Energy[2008]No610, March 3,2008);
22) The Guideline Catalogue for Industrial Restructuring (2005 version (No.40) of State Development and Reform Commission, December 2,2005)
23) Fagai Environment and Resource[2006]No.1457, Notice on Printing the Suggestions of 10 Key Energy-Saving Projects during 11th 5-year period
24) Notice on Accelerating Electricity Industry Structure Adjustment and Promoting the Sound Development(Fagai Energy Resource[2006]No.661,April 18,2006)
25) Provisional Regulations on Construction Management of Power Projects utilizing Cogeneration and Coal Gangue (Fagai Nengyuan (2007) No.141, Jan. 17,2007)
26) Provisional Regulations on Construction Projects of New Energy Sources(Jijiao Energy[1997]No.955, May 27,1997)
27) Regulations on Developing Cogeneration (Jijiao Energy[1998]No.220, February 17, 1998)
Shandong Academy of Environmental Science
2
EIA Report of 2×15MW Biomass Cogeneration Project
28) State Environmental Protection Administration, Administration of Environmental Protection in Construction Projects by Means of Classification Catalogue (State Environmental Protection Administration fa[2006]No.2, September 2, 2008)
29) Regulations on Environmental Impact Evaluation (EIE) Approvals for Construction Projects (State Environmental Protection Administration, No.5, January 16,2009)
30) State Environmental Protection Administration, Huanfa [2006] No.152, Notice on Strengthening Environmental Impact Assessment to Prevent Environmental Risks;
31) Opinions on Enforcing Water Conservation Work of Industry by State Economic and Trade Commission, Ministry of Water Resource, Ministry of Construction , Ministry of Science and Technology, State Environmental Protection Administration and State Revenue Bureau (State Economic and Trade Resource[2000]No.1015, October 25, 2000)
32) State Environmental Protection Administration, Huanfa[2006]No.26, Policy on Technologies for Prevention and Control of SO2 Emissions from Coal-Burning
33) Notice on Printing and Distributing the Key in National Environmental Protection in 2006(State Environmental Protection Administration, Huanfa[2006]No.8, January 16,2006)
34) Huanfa[2006]No.28, Notice on Printing “Guide Suggestions of Sulfur Dioxide Gross Distribution” and Attachment of “Guide Suggestions of Sulfur Dioxide Gross Distribution;
35) Notice on Further Strengthening the Environmental Impact Assessment Management of Generating Bioelectricity Project (Huanfa[2008]No.82, September 4, 2008)
36) Notice on Strengthening New Projects by Strict Environmental Protection Examination and Reply (Huanbanhan[2006]No.349, July 6,2006)
37) Thermal Power Environmental Assessment Regulations (Ministry of Power, Dianji[1996]No.280)
38) Notice on Strengthening the Environmental Impact Assessment Management of Construction Project Loaning by International Finance Organization (Huanjian[1993]No.324 June 21,1993)
1.1.2 Shandong Provincial Laws, Regulation and Policies
1) 11th 5 Year Plan and 2015 Energy Development Outline of Shandong (passed on 51st Routine Conference of Shandong Provincial Government on August 15, 2005);
2) Circular on Strengthening Urban Water Supply, Water Conservation and Water
Shandong Academy of Environmental Science
3
EIA Report of 2×15MW Biomass Cogeneration Project
Pollution Control(Luzheng Fa[2001]No.16);
3) Shandong Environmental Protection Provisions (No.99 Public Notice of Shandong People’s Congress, and revised by 24th Conference of 9th Standing Committee of Shandong on December 7, 2001);
4) Measures of Shandong to Implement Atmospheric Air Pollution Prevention Law of PRC (passed on 20th Conference of 9th Standing Committee of Shandong on April 6, 2001);
5) Circular on Strengthening Water Conservation in Industries (Shandong Economic and Trade Commission, Lujing Maozi [2001] No. 511);
6) Shandong Water Pollution Prevention and Control Provisions ( passed on 15 th
Conference of 9th Standing Committee of Shandong on October 26, 2000);
7) Luzheng Faming Dian[2003] No.8, Shandong Government, Urgent Notice on Strengtheing All Measures to Conserve on Water;
8) Measures of Shandong to Implement Environmental Assessment Impact Law of PRC (passed on 17th Conference of 10th Standing Committee of Shandong on November 25, 2005);
9) Shandong People’s Government, On Printing and Issuing 11th Five Year Environment Protection Plan of Shandong (Luzheng Fa 〔2006〕No.82);
10) Shandong People’s Government, On printing and Issuing Comprehensive Work Plan for Energy Saving and Emission Reduction(Luzheng Fa [2007]No.39) ;
11) Provisions on Comprehensive Utilization of Resources of Shandong( passed on 20 th
Conference of 9th Standing Committee of Shandong on April 6, 2001);
12) Measures of Shandong to Implement Law on Prevention and Control of Solid Waste Pollution of PRC (passed on the 9th Standing Committee on September 28, 2002);
13) Shandong People’s Government, On Implementation of Guo Fa [2005] No.3, Comments of Further Implementing Scientific Development Outlook and Strengthen Environment Protection (Lu Zhenfa[2006] NO.72, June 29, 2006);
14) Shandong 11th Five Year Water Conservation Society Development Plan(Luzheng Zi [2006] No.270, Nov.15, 2006);
15) Shandong General Office, Circular on Strengthening Environment Assessment and Three Simultaneous on Environment Protection Facilities in Construction Projects( Luzheng Banfa[2006] No.60, July 10, 2006);
16) Shandong Environmental Protection Bureau, Luhuan Fa[2007] No.131, Comments on Further Implementing Environmental Assessment and Three Simultaneous
18) Circular on Strengthening Total Emission of Pollutants of Construction Projects (Lu Huanfa [2007] No.108;
19) Circular on Printing and Issuing Water Quality Improvement Objectives Ambient Air Improvement for Township Cities through the years in Shandong 11 th Five Year Period(Luhuan Fa[2007] No.138);
20) Shandong Environment Protection Bureau, On Detailed Operation Procedure of Forbidden Approval and Limitation Approval (Luhuan Fa[2007] No.142) .
1.1.3 Relevant Regulations of World Bank
1) World Bank OP/BP4.01 and annex(Environmental Assessment);
2) World B ank OP/(Environmental Assessment);
3) World Bank GP4.01(Environmental Assessment);
4) World Bank OP/BP4.12(Non-voluntary migrants );
5) World Bank GP14.70(Participation of non-governmental organization in Activities Sponsored by World Bank)
5) Construction Project Environmental Risk Assessment Technical Guidelines (HJ/T169-2004);
6) Environment Impact Assessment Report Compilation Specifications of Thermal Power Construction Projects (HJ/T13-1996);
7) Circular on Printing and Issuing Interim Measures of Public Participation in Environment Impact Assessment (Huanfa[2006] No. 28);
Shandong Academy of Environmental Science
5
EIA Report of 2×15MW Biomass Cogeneration Project
8) Ecological Function Division Plan of Weifang Surface Water;
9) Regulations of Ambient Air Quality Regionalization of Weifang.
1.1.5 Project Basis
1) Letter of Attorney;
2) Biomass Cogeneration Project Feasibility Study of Anqiu Shengyuan Biomass Thermal Co., Ltd. (Shandong Engineering Consulting Institute);
3) Shandong Environmental Protection Bureau, Reply on the Environmental Impact Report on Anqiu Shengyuan Biomass Thermal Power Project (Luhuanshen[2007] No.194, October11, 2007);
4) No. 406(2008) Lu-Huan-Han, June 20, 2008, Shandong Environmental Protection Bureau, Reply on Certain Changes to 2*15MW Biomass Cogeneration Project submitted by Anqiu Shengyuan Thermal Power Company Limited;
5) Shandong Development and Reform Commission, August 18,2008, Approval to Establish Anqiu Shengyuan Biomass Cogeneration Company Limited;
6) No.369(2007), August 3,2007, Lu-Guo-Tu-Zi-Zi, Shandong Ministry of Land Resources, Pre-Examination on the Construction Site for 2*15MW Biomass Cogeneration Project of Anqiu Shengyuan Thermal Power Co., Ltd.;
7) Reply from Shandong Provincial Development and Reform Commission on the Project Proposal of Anqiu Shengyuan Biomass Thermal Power Company Limited to utilize World Bank loan to construct 2*15MW Biomass Cogeneration Project (No.782 (2009), June 26,2009, Lufagai Waizi)
8) Anqiu Urban Development Plan (2004-2020) and Reply from Shandong provincial government on the reply to the Anqiu Urban Development Plan (Luzheng Zi[2006] No.59);
9) Anqiu Ecological Development Plan (Anqiu Municipal Government, October 2005);
10) Weifang Environment Protection Bureau, Reply on the Application of Applicable Standards to the Environment Impact Assessment for 2*12MW Biomass Cogeneration Project of Anqiu Shengyuan Thermal Power Co., Ltd. (Weihuan Shenzi[2007] No.49, June 18, 2007);
11) Comments on the distribution plan of total emission indicators of pollutants of 2*12MW Biomass Cogeneration Project of Anqiu Shengyuan Thermal Power Co., Ltd.( Anqiu Environment Protection Bureau, July 13, 2007);
12) Reply to the Pollutant Total Emission Indicators Authorization Adjustment by Anqiu Municipal Government (January 18, 2007);
Shandong Academy of Environmental Science
6
EIA Report of 2×15MW Biomass Cogeneration Project
13) Confirmation on Total Emission of Shandong Construction Projects(SDZL[2007] No.006);
14) Certification from Anqiu Xing’an District Hospital, Anqiu Power Supply Company, Anqiu Women and Infant Hospital, Anqiu Experimental High School, Anqiu People’s Hospital, Anqiu Buccual Hospital, Anqiu Vocational Training School, and Anqiu People’s Court;
15) Anqiu Municipal Government, Reply on Construction of of 2*15MW Biomass Cogeneration Project of Anqiu Shengyuan Thermal Power Company Limited( Anqiu Municipal Government, June 16, 2006);
16) On the Construction of 2*15MW Biomass Cogeneration Project of Anqiu Shengyuan Thermal Power Company Limited from Anqiu Planning Bureau on November 12, 2006;
17) Water Supply Statement (Anqiu Water Conservancy Bureau, June 15,2007 ) ;
18) Water Supply Agreement (Anqiu Tap Water Company, April 30,2007);
19) Survey Of Stalk Resources in Anqiu and Neighboring Areas (Anqiu Municipal Government);
20) Stalk Supply Agreement(Collection Agents from Jingzhi County, Guangzhuang County, Huangqi Pu County, Shipu Zi County, August 2008);
21) Composition Analysis Report (Wheat and Corn Stalk) (Shandong Coal Quality Testing Center of Shandong Coal Geological Bureau, July 26, 2007);
22) Ash Purchase Agreement with Shandong Aobao Chemical Co., Ltd.(April 30, 2007);
23) Heat Supply Agreement (Anqiu Fuhua Food Company Limited, Anqiu WaimaoFood Company Limited, Anqiu Lvyuan Food Company Limited, Weifang Ludong Food Co., Ltd., Anqiu Xinlong Clothing Co., Ltd., Weifang Sentao Timber Co., Ltd. June 16, 2006);
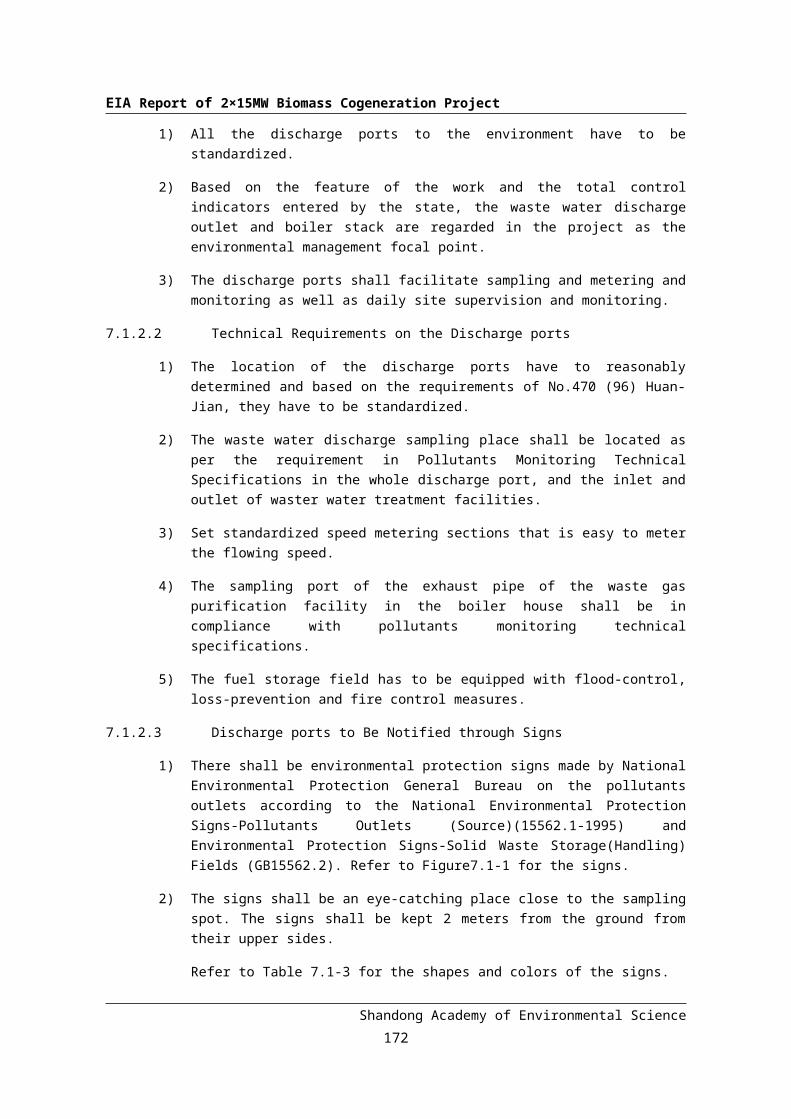
25) Environmental Impact Assessment First Public Notice Proof (Advertising Department of Anqiu TV, August 8,2007)
26) Environmental Impact Assessment Second Public Notice Proof (Advertising Department of Anqiu TV, July 10,2007)
27) Public Seminar Minutes on EIA Assessments of Anqiu Shengyuan Biomass Cogeneration Project (November 26, 2009)
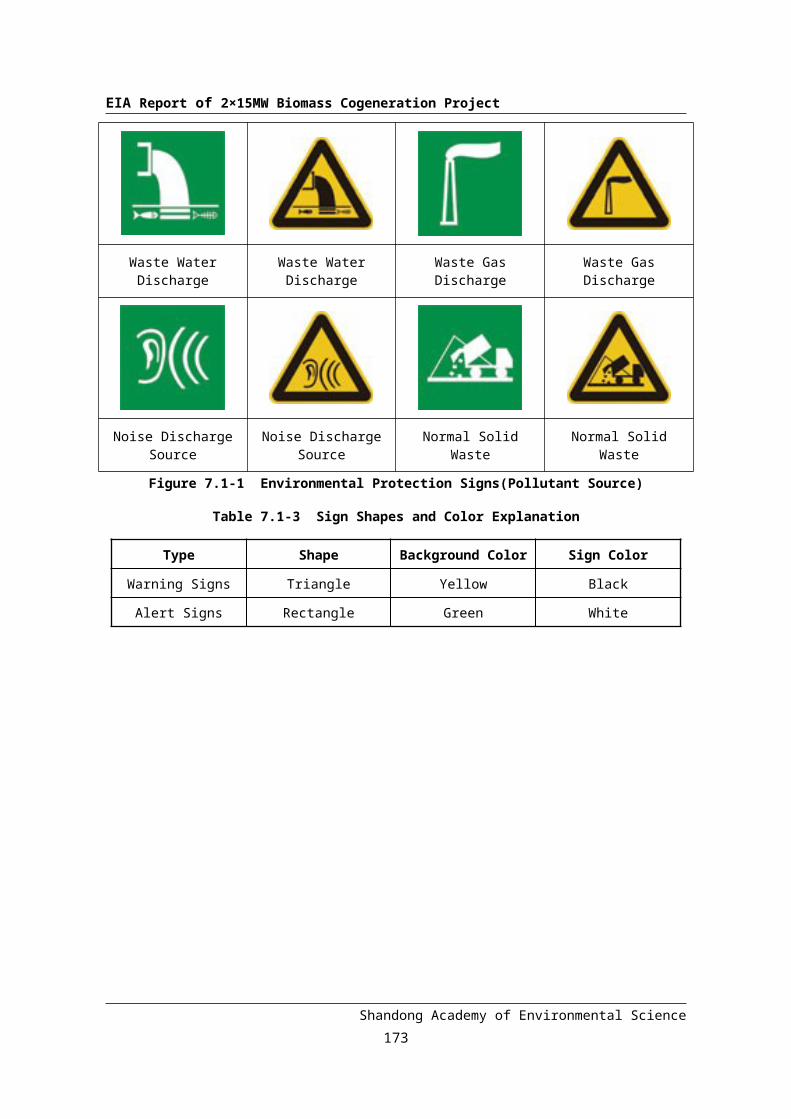
Shandong Academy of Environmental Science
7
EIA Report of 2×15MW Biomass Cogeneration Project
1.2 Assessment Aim and Guidelines
1.2.1 Assessment Aim
To be familiar with the current environment quality status and character of the assessment region through the environment survey; and
to analyze the emission stages of major pollutions and emission amount through project analysis; and
to predict the degree of the impact to the surroundings after the project completion in combination with the current regionalization of the environment,
so to decide on the feasibility of the project and to provide decision-making basis for the environment management authorities.
1.2.2 Guidelines
Based on the project features, to assess the major environment impact factors with scientific methods for objective assessment results; also
the assessment shall be based on the principle of national industry policy, overall urban development plan, environment ecological function requirement, clean production analysis, allowable discharges, total emission control, environmental risks and public participation;
the suggested environmental control measures shall be technically viable, economical and reliable; and
under the precondition of quality assurance, to shorten the assessment period.
1.3 Identification of Environmental Impact Factors and Selection of Assessment Factors
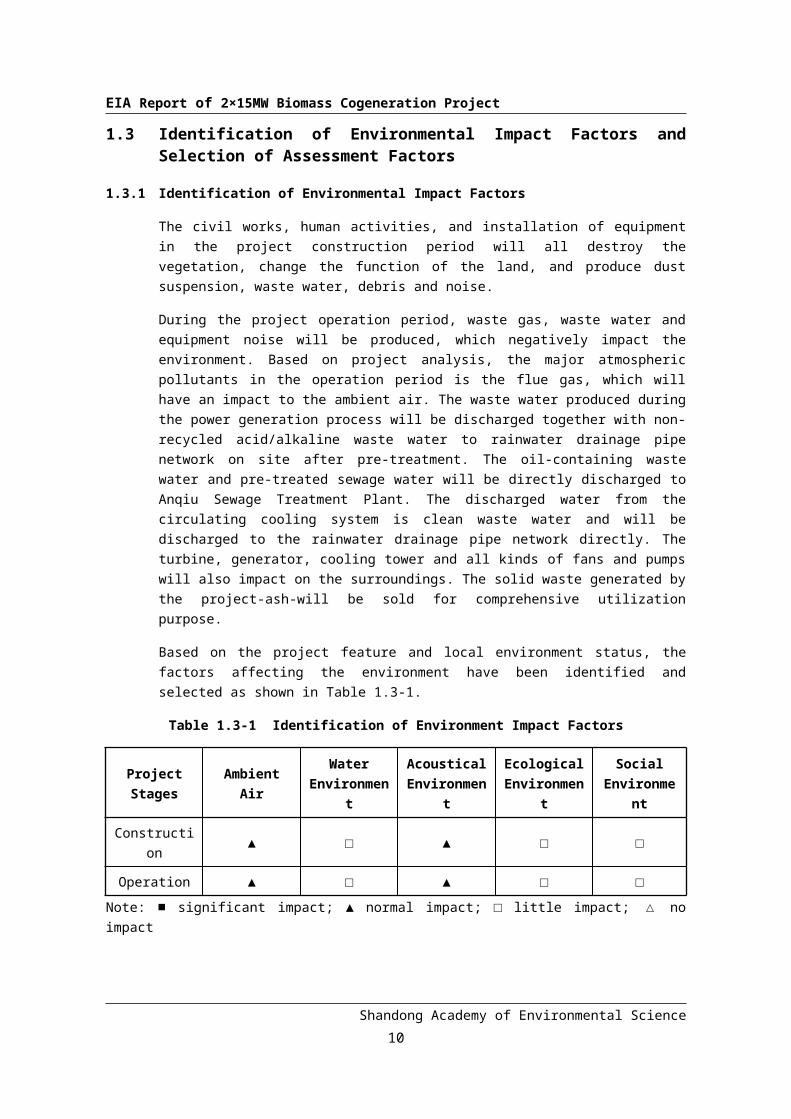
1.3.1 Identification of Environmental Impact Factors
The civil works, human activities, and installation of equipment in the project construction period will all destroy the vegetation, change the function of the land, and produce dust suspension, waste water, debris and noise.
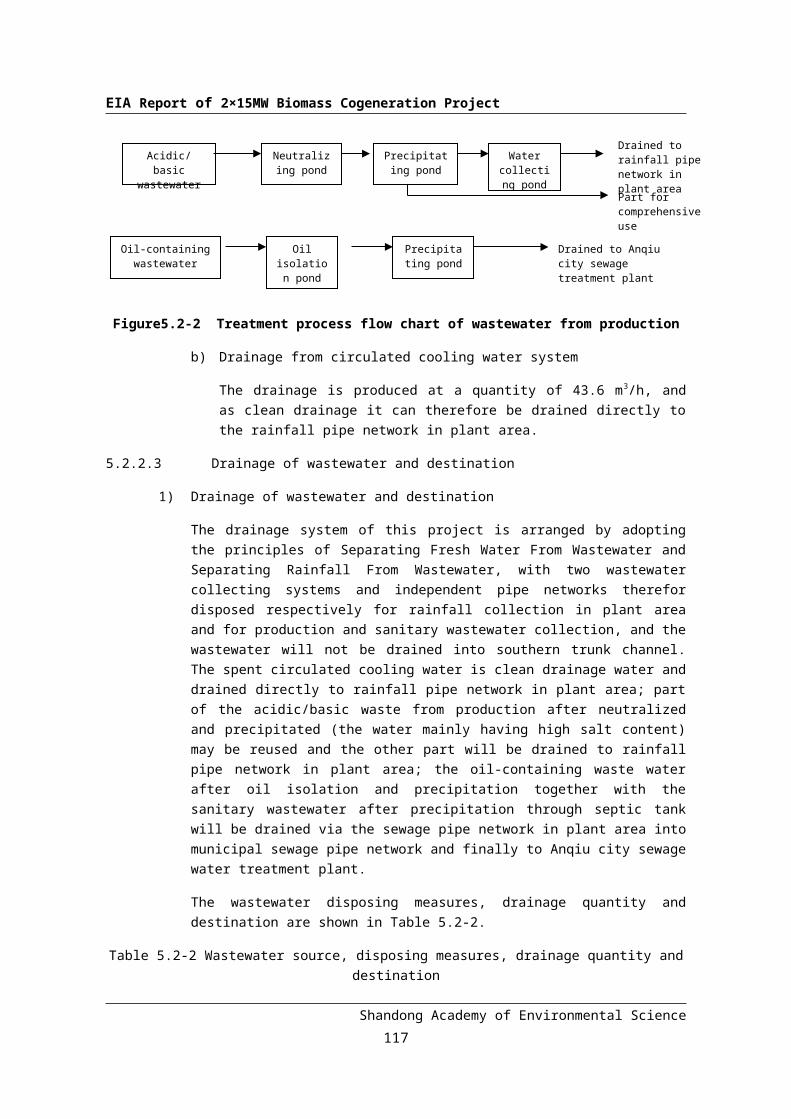
During the project operation period, waste gas, waste water and equipment noise will be produced, which negatively impact the environment. Based on project analysis, the major atmospheric pollutants in the operation period is the flue gas, which will have an impact to the ambient air. The waste water produced during the power generation process will be discharged together with non-recycled acid/alkaline waste water to rainwater drainage pipe network on site after pre-treatment. The oil-containing waste water and pre-treated sewage water will be directly discharged to Anqiu Sewage Treatment Plant. The
Shandong Academy of Environmental Science
8
EIA Report of 2×15MW Biomass Cogeneration Project
discharged water from the circulating cooling system is clean waste water and will be discharged to the rainwater drainage pipe network directly. The turbine, generator, cooling tower and all kinds of fans and pumps will also impact on the surroundings. The solid waste generated by the project-ash-will be sold for comprehensive utilization purpose.
Based on the project feature and local environment status, the factors affecting the environment have been identified and selected as shown in Table 1.3-1.
Table 1.3-1 Identification of Environment Impact Factors
Project Stages
Ambient AirWater
EnvironmentAcoustical
EnvironmentEcological
Environment
Social Environmen
t
Construction ▲ □ ▲ □ □
Operation ▲ □ ▲ □ □
Note: ■ significant impact; ▲ normal impact; □ little impact; △ no impact
1.3.2 Selection of Environment Impact Factors
1.3.2.1 Construction Period
The environment impact of the construction period is decided, to a large extent, by project features, construction season, and the landscape and geology etc of the site. After analysis, the major environment impact factors in the construction period are listed in Table 1.3-2.
Table 1.3-2 Major Environment Impact Factors in the Construction Period
Environment Element Impact Activities Major Impact
Factors
Ambient Air
Leveling, excavation, earthwork, construction material transportation, storage, and use
Dust
Exhaust gas, and use of gas cookers NOx,SO2
Water Environment
Domestic waste water from the workers on site COD,BOD,SS
Acoustical Environment
Construction equipment noise, vehicle noise Noise
Ecological Environment
Leveling, excavation, and land occupationWater and soil loss,
destruction of vegetation
Earthwork, storage of construction materialsLand use and compaction
Shandong Academy of Environmental Science
9
EIA Report of 2×15MW Biomass Cogeneration Project
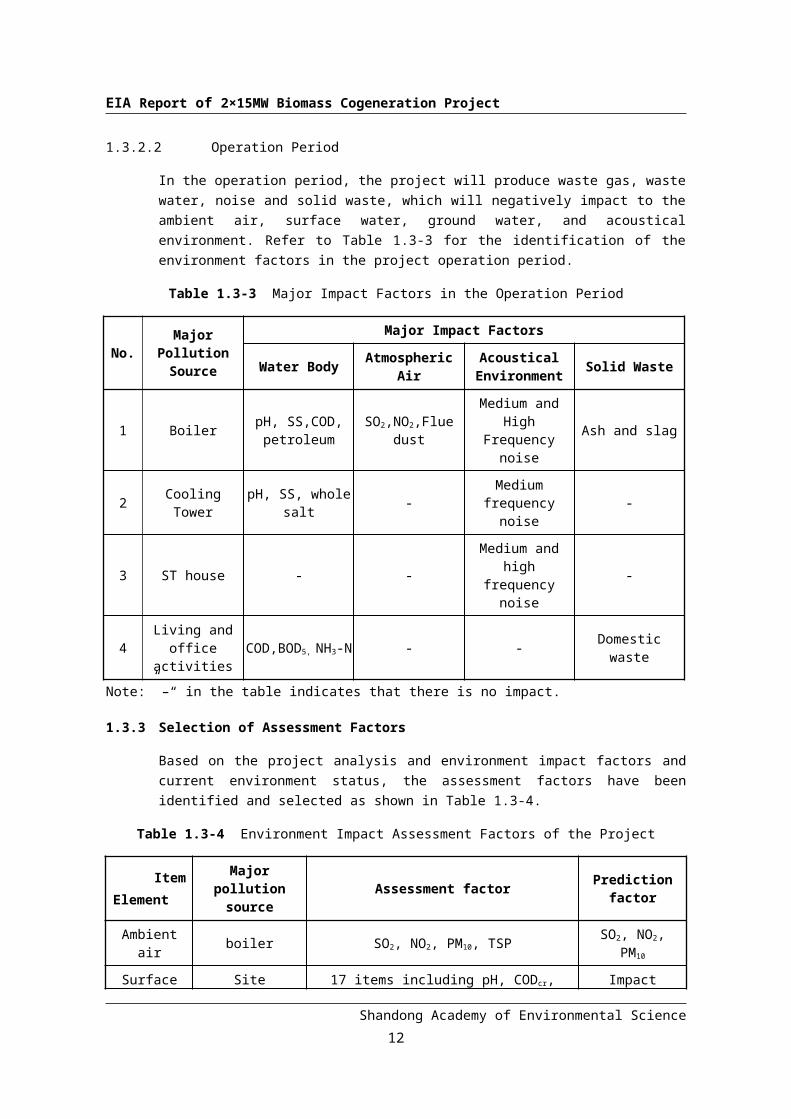
1.3.2.2 Operation Period
In the operation period, the project will produce waste gas, waste water, noise and solid waste, which will negatively impact to the ambient air, surface water, ground water, and acoustical environment. Refer to Table 1.3-3 for the identification of the environment factors in the project operation period.
Table 1.3-3 Major Impact Factors in the Operation Period
No.Major
Pollution Source
Major Impact Factors
Water Body Atmospheric Air Acoustical Environment Solid Waste
1 BoilerpH, SS,COD,
petroleumSO2,NO2,Flue
dustMedium and High Frequency noise
Ash and slag
2 Cooling TowerpH, SS, whole
salt-
Medium frequency noise
-
3 ST house - -Medium and high frequency noise
-
4Living and
office activitiesCOD,BOD5, NH3-
N- - Domestic waste
Note:” –“ in the table indicates that there is no impact.
1.3.3 Selection of Assessment Factors
Based on the project analysis and environment impact factors and current environment status, the assessment factors have been identified and selected as shown in Table 1.3-4.
Table 1.3-4 Environment Impact Assessment Factors of the Project
ItemElement
Major pollution source Assessment factor Prediction
factor
Ambient air boiler SO2, NO2, PM10, TSP SO2, NO2, PM10
Surface water
Site drainage
17 items including pH, CODcr, BOD,sulphide, petroleum, ammonia nitrogen,
total phosphorus, volatile phenol, SS, As, Pb, and Cd etc.
Impact analysis
Ground water
Site drainage11 items including pH, total hardness,
permanganate index, ammonia nitrogen, coliform, nitrite and sulphate etc.
Impact analysis
NoiseProduction equipment
LAeq LAeq
Shandong Academy of Environmental Science
10
EIA Report of 2×15MW Biomass Cogeneration Project
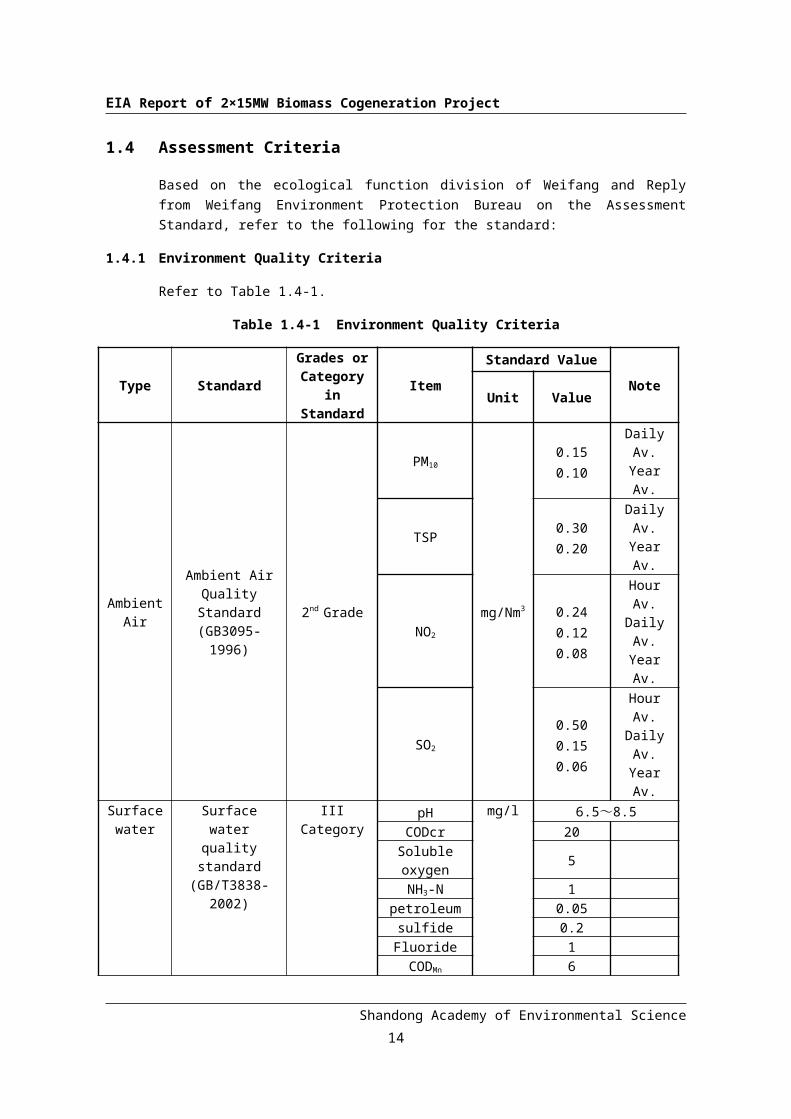
1.4 Assessment Criteria
Based on the ecological function division of Weifang and Reply from Weifang Environment Protection Bureau on the Assessment Standard, refer to the following for the standard:
1.4.1 Environment Quality Criteria
Refer to Table 1.4-1.
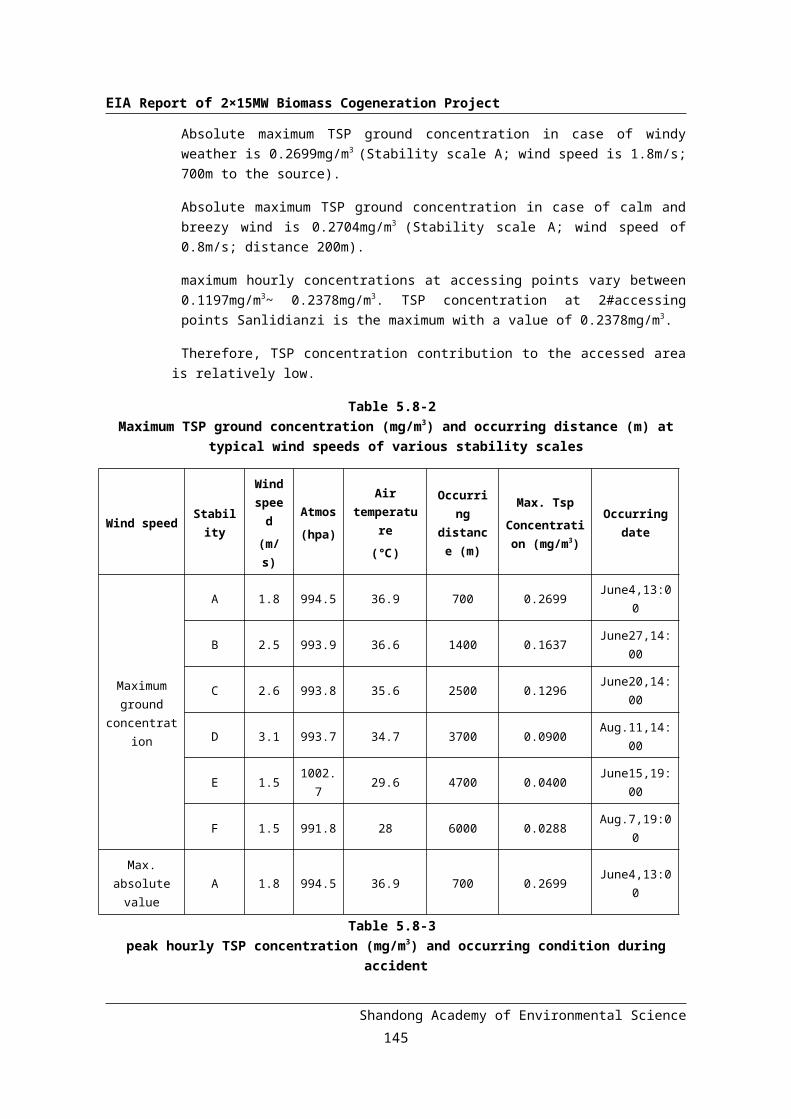
Table 1.4-1 Environment Quality Criteria
Type StandardGrades or
Category in Standard
Item
Standard Value
NoteUnit Value
Ambient Air
Ambient Air Quality Standard (GB3095-1996)
2nd Grade
PM10
mg/Nm3
0.150.10
Daily Av.Year Av.
TSP0.300.20
Daily Av.Year Av.
NO2
0.240.120.08
Hour Av.Daily Av.Year Av.
SO2
0.500.150.06
Hour Av.Daily Av.Year Av.
Surface water
Surface water quality standard
(GB/T3838-2002)
III Category pH mg/l 6.5~8.5CODcr 20Soluble oxygen
5
NH3-N 1petroleum 0.05
sulfide 0.2Fluoride 1CODMn 6BOD5 4
Total N 1Total P 0.05cyanide 0.2Arsenic 0.05chrome 0.05
lead 0.05volatile phenol
0.005
Shandong Academy of Environmental Science
11
EIA Report of 2×15MW Biomass Cogeneration Project
Type StandardGrades or
Category in Standard
Item
Standard Value
NoteUnit Value
Fecal coliform
10000
Ground water
Ground water quality standard (GB/T14848-93)
IIICategory
pH 6.5~8.5Total
hardness ≤450 -
CODMn ≤3.0 -Soluble total
solid ≤1000 -
NO2--N ≤0.02 -
NH3-N ≤0.2 -F- ≤1.0 -Cl- ≤250 -
NO3--N ≤20 -
SO42- ≤250 -
Coliform ≤3.0 -Total
Hardness
Acoustical
Acoustical Environment
Standard (GB3096-2008)
II Category LeqA dB(A)
60Nighttim
e
50 Daytime
Shandong Academy of Environmental Science
12
EIA Report of 2×15MW Biomass Cogeneration Project
1.4.2 Pollutant Emission Criteria
Refer to Table 1.4-2.
Table 1.4-2 Pollutant Emission Criteria
Item StandardGrade or Category
in Standard
Waste gas
Atmospheric Pollutant Emission Standard (GB16297-1996) 2nd grade
Thermal Power Plant Atmospheric Pollutant Emission Standard(Shandong local standard DB37/664-2007) *
Third phase
Foul gas Emission Standard (GB14554-93) 2nd grade
Waste water
Pollutant Discharge Standard for Urban Sewage Treatment Plant (GB18918-2002)
1st Grade Class B
Water Pollutant Discharge Standard for the Water Bodies in Shandong Peninsula (DB37/676-2007)
2nd grade
Water Quality Standard for Drainage Water to be Discharged to Drainage Network (CJ3082-1999)
--
Water Quality Standard for Recycled Water and Water for Other Uses (GB/T19820-2002)
Relevant water standard
Noise
Border: Environment Noise Standard for Enterprises at the Border (GB12348-2008)
II category
Construction: Noise Level Ceiling Value at Construction Site (GB12523-90)
--
Solid waste
Solid Waste Storage and Handling Control Standard (GB18599-2001)
--
Note: “*” The Shandong Provincial Standard, which is stricter than the national standard, is applicable to power generation boiler with a capacity of 65t/h. The allowable density for flue dust, SO2 and NOx discharge are respectively 50mg/m3, 400mg/m3, and 400mg/m3 compared with 50mg/m3, 400mg/m3 and 450mg/m3 in the national standard. That is the reason why EIA adopts the Shandong Provincial Standard.
Shandong Academy of Environmental Science
13
EIA Report of 2×15MW Biomass Cogeneration Project
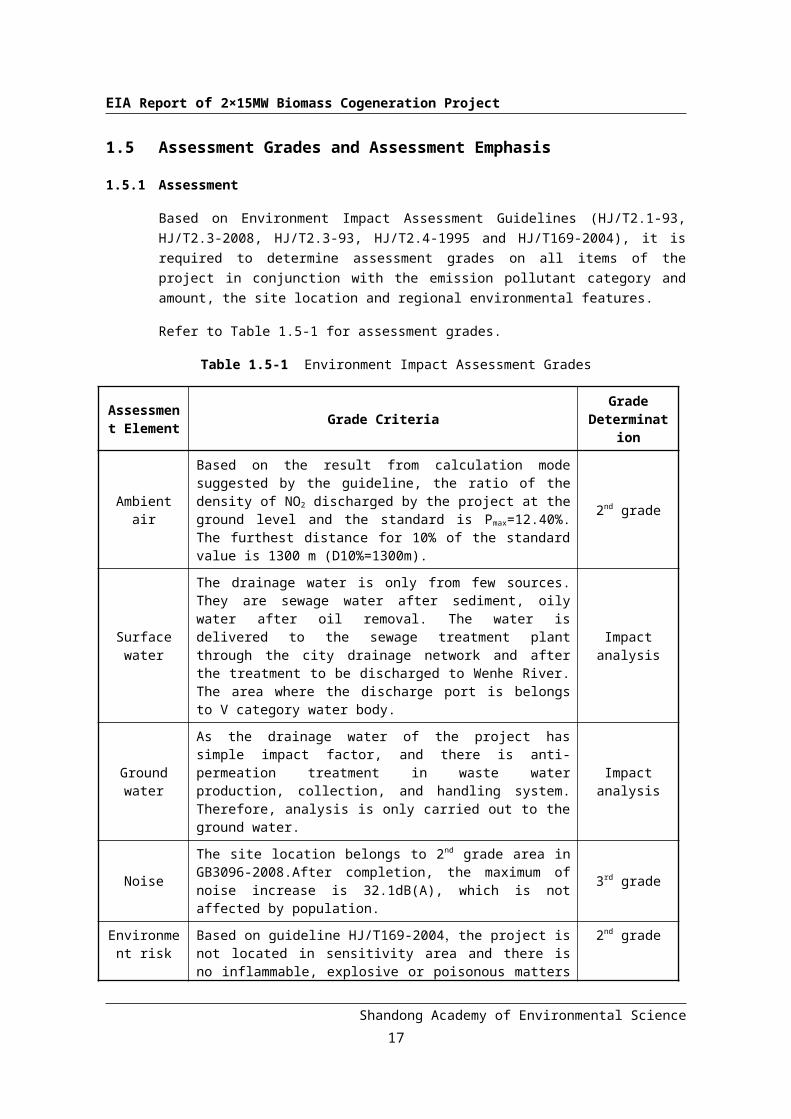
1.5 Assessment Grades and Assessment Emphasis
1.5.1 Assessment
Based on Environment Impact Assessment Guidelines (HJ/T2.1-93, HJ/T2.3-2008, HJ/T2.3-93, HJ/T2.4-1995 and HJ/T169-2004), it is required to determine assessment grades on all items of the project in conjunction with the emission pollutant category and amount, the site location and regional environmental features.
Refer to Table 1.5-1 for assessment grades.
Table 1.5-1 Environment Impact Assessment Grades
Assessment Element Grade Criteria
Grade Determinatio
n
Ambient air
Based on the result from calculation mode suggested by the guideline, the ratio of the density of NO2 discharged by the project at the ground level and the standard is Pmax=12.40%. The furthest distance for 10% of the standard value is 1300 m (D10%=1300m).
2nd grade
Surface water
The drainage water is only from few sources. They are sewage water after sediment, oily water after oil removal. The water is delivered to the sewage treatment plant through the city drainage network and after the treatment to be discharged to Wenhe River. The area where the discharge port is belongs to V category water body.
Impact analysis
Ground water
As the drainage water of the project has simple impact factor, and there is anti-permeation treatment in waste water production, collection, and handling system. Therefore, analysis is only carried out to the ground water.
Impact analysis
NoiseThe site location belongs to 2nd grade area in GB3096-2008.After completion, the maximum of noise increase is 32.1dB(A), which is not affected by population.
3rd grade
Environment risk
Based on guideline HJ/T169-2004,the project is not located in sensitivity area and there is no inflammable, explosive or poisonous matters in the supplement to the raw material. Therefore, it does not pose great environment risk.
2nd grade
1.5.2 Assessment Emphasis
Based on the project feature, local environment status, and project analysis as well as on the basis of identification of relevant environment impact factors and emission of pollutants, it is decided that the assessment emphasis includes: current ambient air quality, the predicated impact assessment, pollution prevention and control measures
Shandong Academy of Environmental Science
14
EIA Report of 2×15MW Biomass Cogeneration Project
and their technical and economic feasibility, and the total emission analysis.
1.6 Scope of Assessment and Environmental Sensitive Targets
The proposed project is located in the southwest of Anqiu, which doesn’t belong to double-controllable zone. Around 5Km from the site, No.206 national highway and No.222, 221 Provincial highways crisscross around the plant. The city boasts of advanced road networks backboned by state highway and provincial highways and filled by county level roads and roads connecting all villages. The nearest villages to the site are Sanli Dianzi village to the east of the site and Zhang Jialou village to the southwest of the site.
The Environmental Assessment Sensitive Objects are decided according to the local meteorology, hydrology, geology, the emission of Three Wastes of this Project, and the distribution of residents and plants in the adjacent area. Refer to table 1.6-1 and figure1.6-1.
Table 1.6-1 Major Sensitive Objects around the Proposed Project
Element Scope of Assessment No. Environmental
Sensitive Object Direction Distance to the Plant (m)
AmbientAir and
Environment Risk
Centered around the site in a radius of
3KM
1 Sanli Dianzi E 1502 Shui Matou E 20003 Xiaozhuangzi SE 6504 Hou Qili He SE 19005 Qian Qili He SE 20506 Yuanjia Zhuang SE 27507 Dawei Yuan SE 30008 Caojia Lou S 9509 Zhangjia Lou SSW 250
10 Hanjia Bu SW 135011 Xinjia Yao WSW 90012 Qili Village WSW 150013 Xinjia Village WNW 140014 Qili Gou WNW 200015 Liangshuiwang Tou WNW 215016 Da Jinge Village NW 70017 Xiao Jinge Village NW 90018 Xin Villiage NW 155019 Xiejia Village NNW 115020 Sanli Zhuang NNW 1450
21 Anqiu UrbanAnqiu City NE 2000
22 Nan Sanli Zhuang ENE 90023 Laozhuangzi ENE 1700
Noise Range: 1m out of the plant and within around 200m, such as the site itself and Sanli Dianzi village etc.
Groundwater Ground water in the area of 1500m around the site, such as that of Sanli Dianzi, Zhangjia Lou and Xiaozhuang Zi villages.
Shandong Academy of Environmental Science
15
EIA Report of 2×15MW Biomass Cogeneration Project
Surface WaterMushan Reservoir is 2nd class preserved zone for tap water. The outlet of Anqiu Sewage Treatment Plant is discharged to Wenhe River and the discharge ports
are located in mixed function zone.
Shandong Academy of Environmental Science
Proposed site
Figu
re 1
.6-1
Dis
trib
utio
n of
Sen
sitiv
e O
bjec
ts a
roun
d th
e Si
te
16
EIA Report of 2×15MW Biomass Cogeneration Project
Chapter 2 Project Analysis
2.1 Project necessity
2.1.1 In compliance with national laws and regulations
The Renewable Energy Law of the People's Republic of China states that:
The Government lists the development of utilization of renewable energy as the preferential area for energy development.
The Government encourages economic entities of all ownerships to participate in the development and utilization of renewable energy and protects legal rights and interests of the developers and users of renewable energy on the basis of law.
The Government encourages and supports various types of grid-connected renewable power generation.
Grid enterprises shall enter into grid connection agreement with renewable power generation enterprises that have legally obtained administrative license or for which filing has been made, and buy the grid-connected power produced with renewable energy within the coverage of their power grid, and provide grid-connection service for the generation of power with renewable energy.
If the gas and heat produced with biological resources conform to urban fuel gas pipeline networks and heat pipeline networks, enterprises operating gas pipeline networks and heat pipeline networks shall accept them into the networks.
Financial institutions may offer preferential loan with financial interest subsidy to renewable energy development and utilization projects that are listed in the national renewable energy industrial development guidance catalogue and conform to the conditions for granting loans.
The Government grants tax benefits to projects listed in the renewable energy industrial development guidance catalogue, and specific methods are to be prepared by the State Council.
From the above, it is clear that biomass is a sustainable long term renewable energy source and China attaches great importance to the utilization and exploration of the energy source and has made some preferential policies on the utilization of the renewable energy resources.
Shandong Academy of Environmental Science
17
EIA Report of 2×15MW Biomass Cogeneration Project
2.1.2 In Compliance with Requirements of Circular Economy and Renewable Energy Resource
Biomass power is new and environmental friendly type of energy and is an important means to solve the energy shortage. It is in compliance with international and national policy to encourage circular economy and save on fossil fuels.
In the Chapter 12, Section 3 of the Eleventh Five Year Plan of China for the national Economy and Social Development, it is stated that to speed up development of biomass power and support development of biomass power, combustion of waste and landfill gas for power generation and to establish power stations of biomass and agro-forestry to enlarge the production capacity of biomass solid type fuel, ethanol fuel, and bio-diesel. The installation capacity for wind power and biomass power shall respectively reach 5,000,000KW and 5,500,000KW.
2.1.3 The project can save on fossil fuel and protect the environment
The current energy sector is mainly fossil fuel industry including coal, petrol and natural gas. On one hand, the mineral energy resource has promoted the social progress. However, the resources are being depleted. The detected oil reserve in the world is around 12.70billion tons and the coal reserve is around 140billion tons. According to the current technology level for exploration, the oil can only still be explored for 40 years and coal 200 years. On the other hand, the unscrupulous utilization of fossil fuel has brought ever-increasing environmental problems, such as global warming, depletion of ozone layer, destruction of carbon balance in the ecological circle, release of harmful matters and causes of acid rain.
In China, for the recent 20 years, with the population increase and development of social economy, the energy consumption is skyrocketing. In 1980, the disposable energy consumption in China was equivalent to 602million tons of standard coal, among which coal occupied 72.2%, oil 20.7% and natural gas 3.1%. In comparison, by 2008, the consumption reached equivalent to 122million tons of standard coal, among which coal, oil and gas occupied 67.1%,23.4%, and 6.7% respectively. Simultaneously, the consumption of mineral resources will produce large amount of pollutants, such as CO, SO2, CO2 and NOx etc., which are major ambient pollutants. In the new century, China is faced by challenges of energy sources and environmental problems. Therefore, to develop and utilize alternative sources of energy that has great potential and is environmental friendly is an important issue that is concerned with the national economy sustainable development and national safety and social progress.
According to preliminary estimation, the amount of stalks available for energy resources each year in China is around 350million tons. If they were to be used for power generation, they would generate 45.51billion KWh of electric power, which could generally satisfy the electricity demand of rural area. In addition, to use biomass to replace fossil fuel, the emission of CO, SO2, CO2 and NOx will be reduced. If the above available stalks
Shandong Academy of Environmental Science
18
EIA Report of 2×15MW Biomass Cogeneration Project
were utilized efficiently for fuel, each year, there would be CO2 emission reduction of 590million tons, SO2 emission reduction of 1.68million tons, and flue dust of 4.2million tons. Also, it can solve the prevalent problem in the rural area that can not be uprooted: onsite combustion of stalks that causes ambient pollution.
Biomass cogeneration projects utilizes stalks as fuel, which is characterized by low Sulfur content. When bag filters are used to remove the dust, and control measures are taken for waste water and noise etc., the emission will all satisfy environment protection requirements, and have little impact to the environment. As a new type of environment-friendly projects, to develop high efficiency and clean biomass power generation industry can reduce pollution brought by combustion of fossil fuel and conducive to the construction of harmonious society.
Above all, the biomass cogeneration project, since it utilizes the deserted stalks as fuel to produce electricity and supply steam and heat, changes the waste into energy resources. Simultaneously, it realizes centralized heating to the surrounding enterprises, so it can protect the environment, and save on resources. Thus, construction of the proposed project is necessary.
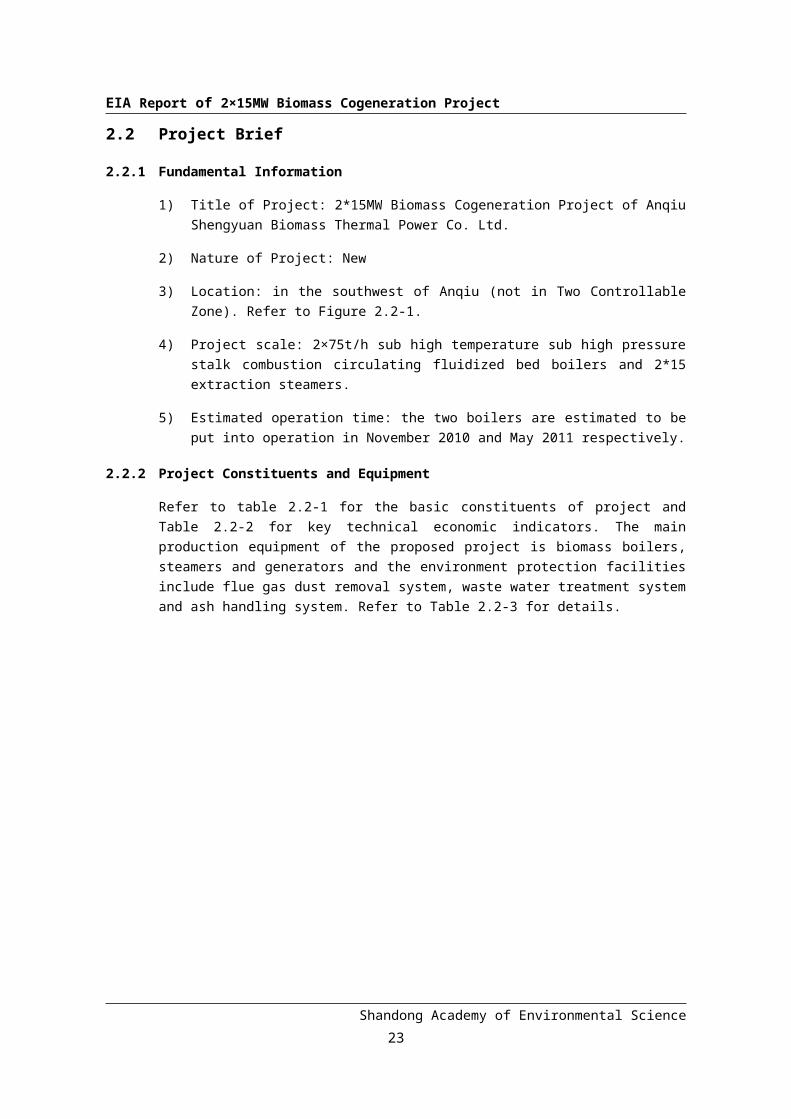
2.2 Project Brief
2.2.1 Fundamental Information
1) Title of Project: 2*15MW Biomass Cogeneration Project of Anqiu Shengyuan Biomass Thermal Power Co. Ltd.
2) Nature of Project: New
3) Location: in the southwest of Anqiu (not in Two Controllable Zone). Refer to Figure 2.2-1.
4) Project scale: 2×75t/h sub high temperature sub high pressure stalk combustion circulating fluidized bed boilers and 2*15 extraction steamers.
5) Estimated operation time: the two boilers are estimated to be put into operation in November 2010 and May 2011 respectively.
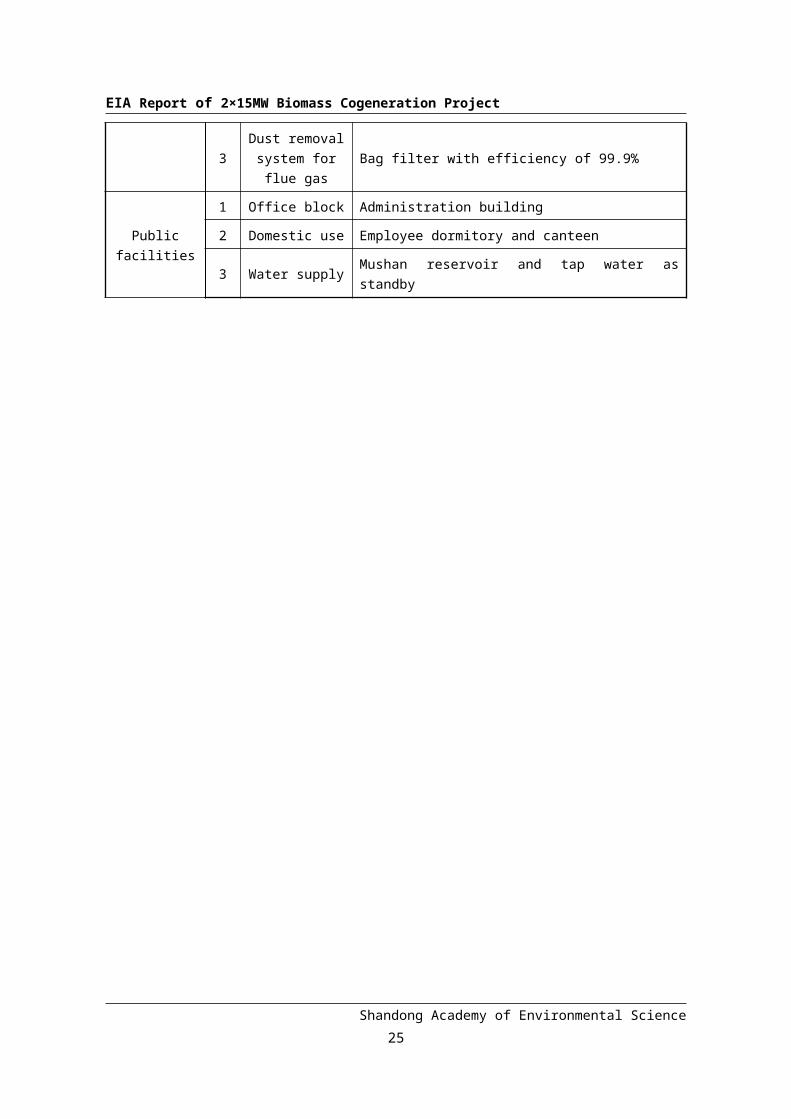
2.2.2 Project Constituents and Equipment
Refer to table 2.2-1 for the basic constituents of project and Table 2.2-2 for key technical economic indicators. The main production equipment of the proposed project is biomass boilers, steamers and generators and the environment protection facilities include flue gas dust removal system, waste water treatment system and ash handling system. Refer to Table 2.2-3 for details.
Shandong Academy of Environmental Science
19
EIA Report of 2×15MW Biomass Cogeneration Project
Table 2.2-1 Project constituents
ItemNo.
Constituents Specifications
Main works1 ST house 2×15MW extraction steamers
2 Boiler House 2×75t/h circulating fluidized bed boilers
Auxiliary
Works
1Fuel Storage
filed
254m long, 105m wide, 8 stacks for storageStacks are 5m tall, each stack with 1959m2. Storage capacity 14,100t, 19 days for 2 boilers
2 Fuel shed
150m long, 30m wide, fuel storage area 4500m2, average stack height 5m
Storage capacity 4050t, 5days for 2 boilers
3Fuel bunkers with movable
bottom
2 bunkers with 200m3 with storage capacity of 72t,
2 hours for 2 boilers
4Chemical water
treatment system
RO plus primary mixed bed facility with handling capacity of 140t/h
5 Booster station One 35KV booster station, single layer frame structure
6
Temporary ash/slag house for emergency
use
Length and width of 20m, pile height of 3m, storage capacity of 5 days ash/slag amount under normal production conditions
Environmental Protection
works
1Waste water
treatment system
Neutralize acid/alkaline waste water and mix with oil water to be sedimented, filtered and chlorined; handling capacity of 25m3/h
2Ash removal
systemAsh and slag separation, artificial slag removal, mechanical ash removal and vehicle transportation
3Dust removal
system for flue gas
Bag filter with efficiency of 99.9%
Public facilities
1 Office block Administration building
2 Domestic use Employee dormitory and canteen
3 Water supply Mushan reservoir and tap water as standby
Shandong Academy of Environmental Science
20
EIA Report of 2×15MW Biomass Cogeneration Project
Table 2.2-2 Major Economic Indicators
No. Item Unit Indicators
1Stalk consumption for power generation (equivalency to standard coal)
kg/kwh 0.471
2 Electricity Consumption by power plant % 11.03
3 Annual electricity generation kwh 1.43×10⁸
4 Annual electricity supplied kwh 1.25×10⁸
5 Annual heat supply capacity GJ/a 91.8×10⁴
6 Annual Utilization hour coefficient h 6000
7 Total investment 0,000RMB23050 to 24000
8 Project area m2 75600
9 Vegetation area m2 18520
10 Vegetation ratio % 24.5
11 Number of staff 106
12 Return on investment % 7.45
13 Profit and tax investment ratio % 12.46
14 Financial net value 0,000RMB 1680
15 Internal rate of return % 11.21
16 Payback period YEAR 8.97
17 Thermal rate - 0.79
18 Average annual thermal efficiency % 53.77
19 Average annual heat electricity rate % 177
Shandong Academy of Environmental Science
21
EIA Report of 2×15MW Biomass Cogeneration Project
Shandong Academy of Environmental Science
Figu
re 2
.2-1
Pro
pose
d S
ite M
ap L
ocat
ion
Wei
fang
City
Jina
nA
nqiu
City
Site
loca
tion
22
EIA Report of 2×15MW Biomass Cogeneration Project
Table 2.2-3 Major Equipment and Environmental Protection Facilities
Item Unit Content
SteamerModel - 2 C12-4.9/0.981-2, single cylinder, extraction steamer
Output MW 2×12
GeneratorModel - 2 QF-15-2, 3 phase AC excitation generator
Output MW 2×15
Boiler
Model -2 JG75/5.3-SW, fluidized circulating fluidized bed boilers
Evap.Amo.
t/h 2×75
Flue gas
control
Dust removal
Type Bag filter
efficiency % 99.9%
Stack
height m 100
Outlet in. diameter
m 2.8
Qty. 1
NOx
controlType - Reserved space for de-NOx facilities
Cooling water treat
- 1500m2 natural ventilation cooling tower
Waste water treatment
DomesticAfter sediment in septic tanks to be discharged to sewage treatment plant of Anqiu
Amountm3/h
0.56
Production
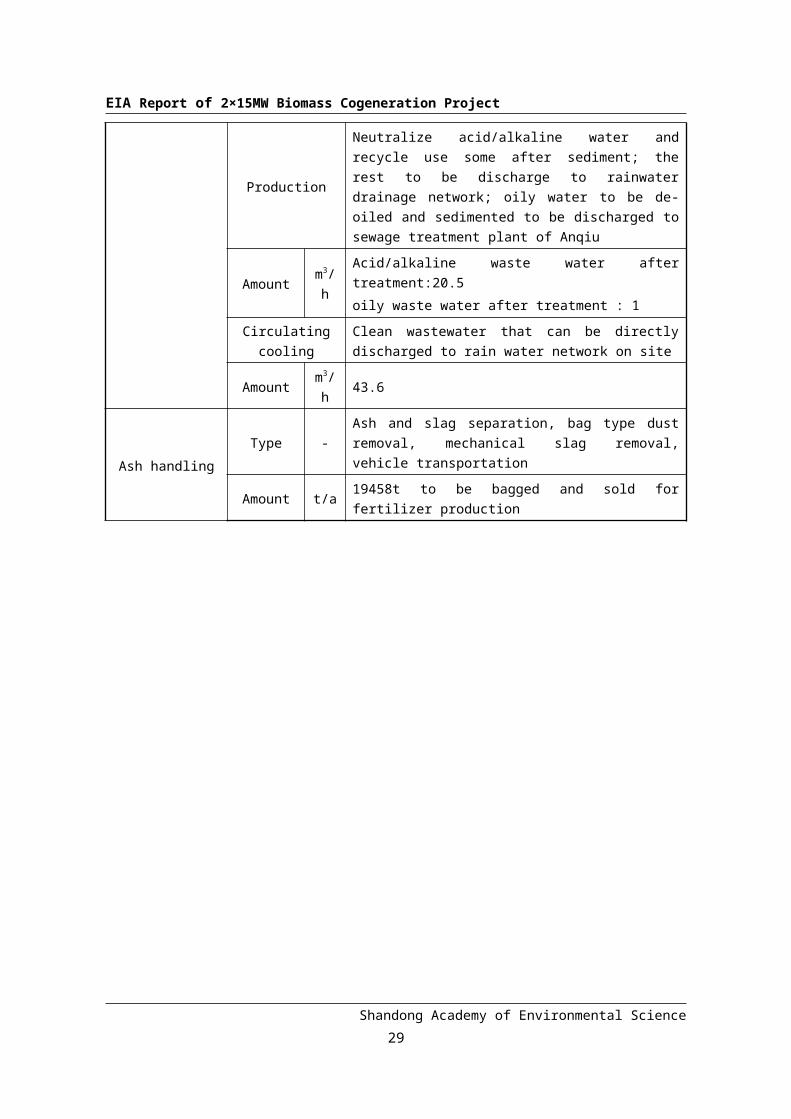
Neutralize acid/alkaline water and recycle use some after sediment; the rest to be discharge to rainwater drainage network; oily water to be de-oiled and sedimented to be discharged to sewage treatment plant of Anqiu
Amountm3/h
Acid/alkaline waste water after treatment:20.5
oily waste water after treatment : 1
Circulating cooling
Clean wastewater that can be directly discharged to rain water network on site
Amountm3/h
43.6
Shandong Academy of Environmental Science
23
EIA Report of 2×15MW Biomass Cogeneration Project
Ash handlingType -
Ash and slag separation, bag type dust removal, mechanical slag removal, vehicle transportation
Amount t/a 19458t to be bagged and sold for fertilizer production
Shandong Academy of Environmental Science
24
EIA Report of 2×15MW Biomass Cogeneration Project
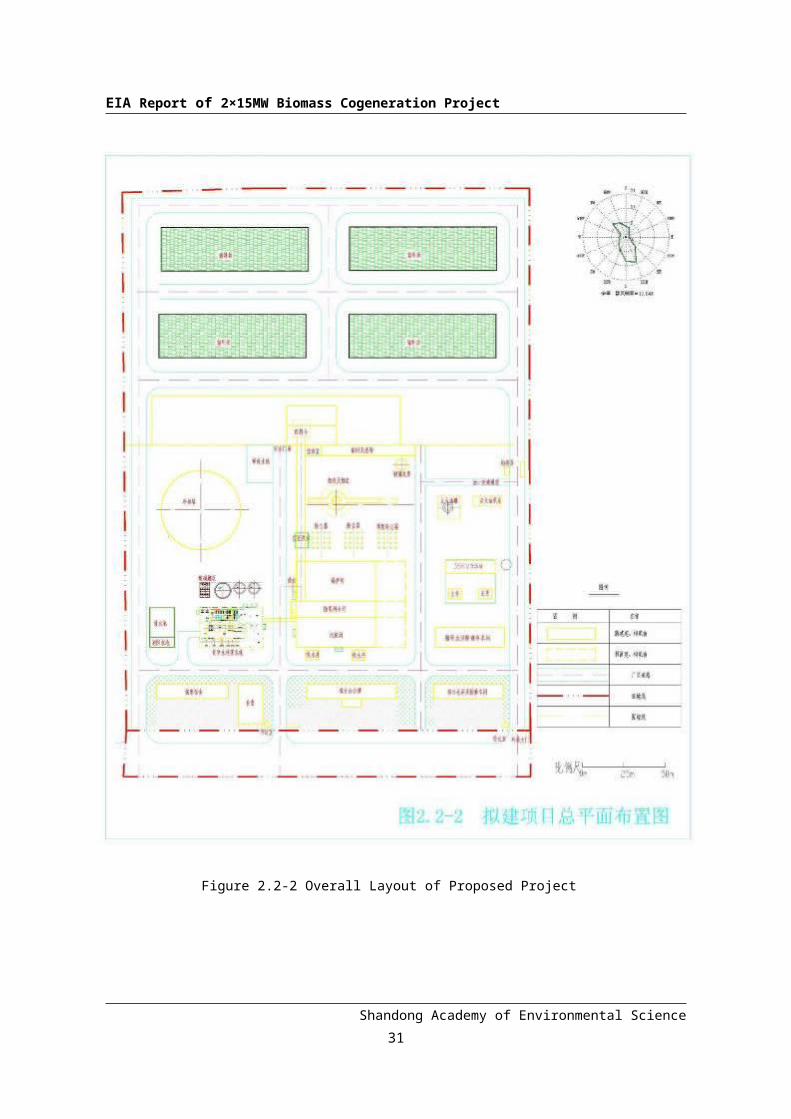
2.2.3 Layout plan
The main building lies in the direction of south and north, with west side fixed and to be expanded to the east. There are three main paths inside in the same direction, with the main central one as for walking and the gate is to the direction of south. In the center of the site, there will be an division wall lying from east to west. The southern part of the site will be manufacturing area while the northern area the fuel storage and preparation area. The east main path is for fuel and material transportation which directly links to the fuel area while the west main path is construction and safety path which is also linked to the fuel area and forms a circle with the east main path.
The office block is located to the south of the main buildings and towards the central gate. The main building is located in the center with three rows layout, which in the order from the south to the north in the manufacturing section is ST house, de-oxidized compartment, boiler house, and dust collectors, flue duct, and ash storage etc. To the east of main buildings are auxiliary production area, which in the direction from the south to the north is: maintenance and service workshop, laboratory, heat supply workshop, 35KV step-up station, and starting firing pump room and ash house etc. The auxiliary manufacturing area lies to the west of the main building, which in the direction from the south to the north is: staff dormitory, canteen, common room, chemical water treatment room, water tank, and cooling tower. The site covers an area of 75600m 2 and vegetation area of 18520m2. Refer to Figure2.2-2 for the layout plan.
Shandong Academy of Environmental Science
25
EIA Report of 2×15MW Biomass Cogeneration Project
Shandong Academy of Environmental Science
Figure 2.2-2 Overall Layout of Proposed Project
26
EIA Report of 2×15MW Biomass Cogeneration Project
2.2.4 Production procedure
The stalks delivered by the collection agents are shredded to be conveyor belted to the bunker with movable bottom. Then they are fed into boiler furnace to be combusted by 4 enclosed feeders with metering functions and 4 straight-line spiral feeders. The combustion will release heat energy to turn the boiler water to sub high temperature sub high pressure steam to enter the steamers. The steamers are driven to start the generator for power generation. The electricity produced will be distributed to clients through power cables and power distribution facilities. The steam from the steamers will be extracted from the center of steamers to supply heat through heat supply networks. The steam discharged by steamer will be cooled in condensers to be piped back to the boiler for recycling. In winter, the circulating hot water will not go through cooling tower but directly goes to the urban residential area for central heating supply. The flue gas from the boilers goes through superheater and economizer and preheater, to be collected by bag filters through a draft fan for dust removal purpose and then to be discharged from the 100m stack. The ash and slag will be handled by dry method of separation and to be transported out of the site for utilization.
Refer to figure2.2-3 for production technique and pollution inducing sections.
2.2.5 Heat Supply Works
2.2.5.1 Current Heat Supply Status
Anqiu, a city with long history, is located in the central part of Shandong, neighboring to Weifang to the north, Zhucheng to the south, Gaomi and Changyi to the east and Linju to the west. With an area of 2010 square kilometers, the city is with a length of 65.3kilometers south to north and a width 61.5 kilometers east to west. The population of Anqiu is around 1.05million with around 120,000 living in the urban area (14.6 square kilometers).
The site of the project is in the southwest of the city. To the north and northwest of the site, there are 6 companies which require steam: Anqiu Fuhua Food Compay, Anqiu Waimao Food company, Weifang Ludong Food Company, Anqiu Lvyuan Food Company, Anqiu Xinlong Clothing factory. The total steam demand is 83t/h. With the economic development, development of Anqiu is southbound. Around the site, there will be petrochemical companies, clothing companies, food processing companies and vegetable processing factories. In the southern Anqiu, the current steam users, inclusive of those under construction, are 10 companies. By 2011, the steam required within the supply scope can reach 110t/h. The completed project will supply steam to them.
There are 6 enterprises scattered around the proposed site within a radius of 3KM which require heating/steam supply. Currently, they all use small scale coal burning boilers. There are in total 17 low pressure coal burning boilers with a total capacity of 108t/h and most of them are small boilers with evaporation amount of 6.35t/h. The efficiency of the
Shandong Academy of Environmental Science
27
EIA Report of 2×15MW Biomass Cogeneration Project
boilers is low and the stack height is less than 50m. They not only wastes resources also they seriously pollutes the environment. As they have been in operation for many years, and also they have low efficiency, the steam supplied cannot meet the requirements. And some of the offices, workshops, canteens, and dormitories cannot be heat supplied due to inefficiency of heat supply from them.
In recent years, Anqiu has accelerated its urbanization and the proposed project is adjacent to the urban south area. Based on the city planning, the proposed and under construction residential area in the south is 371,000 square meters. After completion of the project, it will supply centralized heating to them in winter.
2.2.5.2 Thermal Load
1) Heat Supply Parameters
As the steam users are using steam pressure between 0.4 and 0.8MPa and the steam temperature is saturated temperature of 180ºC, therefore, the heat supply parameters for industrial heat users are: outlet pressure 0.98MPa, outlet temperature around 300°C. The clients can adjust them based on their own requirements through temperature control valves and pressure reduction valves.
The parameters for the heat supply from the circulating water will be the same as that from original heat supply network: outlet parameter 0.5MPa and 65°C/40°C.
2) Designed Thermal Load
Once the project is complete, it will replace the 17 small scale coal burning boilers scattered around in its heat supply scope, with a total capacity of 108t/h. As the 17 boilers are operated on the mode of “one in use, the other as standby” and those operated are long term in low operation parameters; therefore, if the amount consumed is converted to the steam of the project, the actual amount in demand is around 36t/h. That will satisfy the production requirements in the clients. And Simultaneously, it will supply heat to the residential communities (370,000m2) in the southern part of the urban area. Refer to Table 2.2-8 for the thermal load.
Shandong Academy of Environmental Science
28
EIA Report of 2×15MW Biomass Cogeneration Project
Shandong Academy of Environmental Science
Figu
re 2
.2-3
Pro
duct
ion
Pro
cess
and
Pol
lutio
n P
rodu
cing
Sec
tion
29
EIA Report of 2×15MW Biomass Cogeneration Project
Table 2.2-4 Designed Thermal Load
Category Unit Max. Average Min.
Industrial Steam Loadt/h 41 36 31
GJ/h 120.95 106.2 91.45
Circulating Water Heat Load0,000m² 60 48.5 37
GJ/h 138.24 111.744 85.248
Note: Heat from circulating water is calculated at 2.304GJ/h per 10,000m²
3) Recycling of condensation water
The project is mainly oriented towards industrial steam users. As the users use mainly direct heating with steam, there will be great difficulty to recycle the condensation water. Therefore, the project initially will not consider recycling of condensation water, but it will leave reserved space in the heat supply network for condensation water pipeline.
2.2.5.3 Heat Supply Network
1) Network laying methods
The laying method of heat supply network is on the principle of economical and non-interference with the landscape. Based on the comments from the urban construction authorities and in consideration of the technical practicability, the network will be overhead constructed. The overhead is mainly medium and low overhead structure. When there are bridges, roads, or gates, direct burial methods or overhead laying shall be adopted. The standard elevation of the pipe structure is usually between 4.5 and 5.5m. When the pipeline is over major roads in the city, the standard elevation of the structure is 6 meters and there shall be some embellishments. When the pipeline is over the railway, it is suggested to use overhead laying with elevation of 6m.
Regarding pipe expansion, it shall try to utilize pipe angle and elbow for natural expansion. When it fails, expansion joint can be used.
2) Network Construction and laying direction
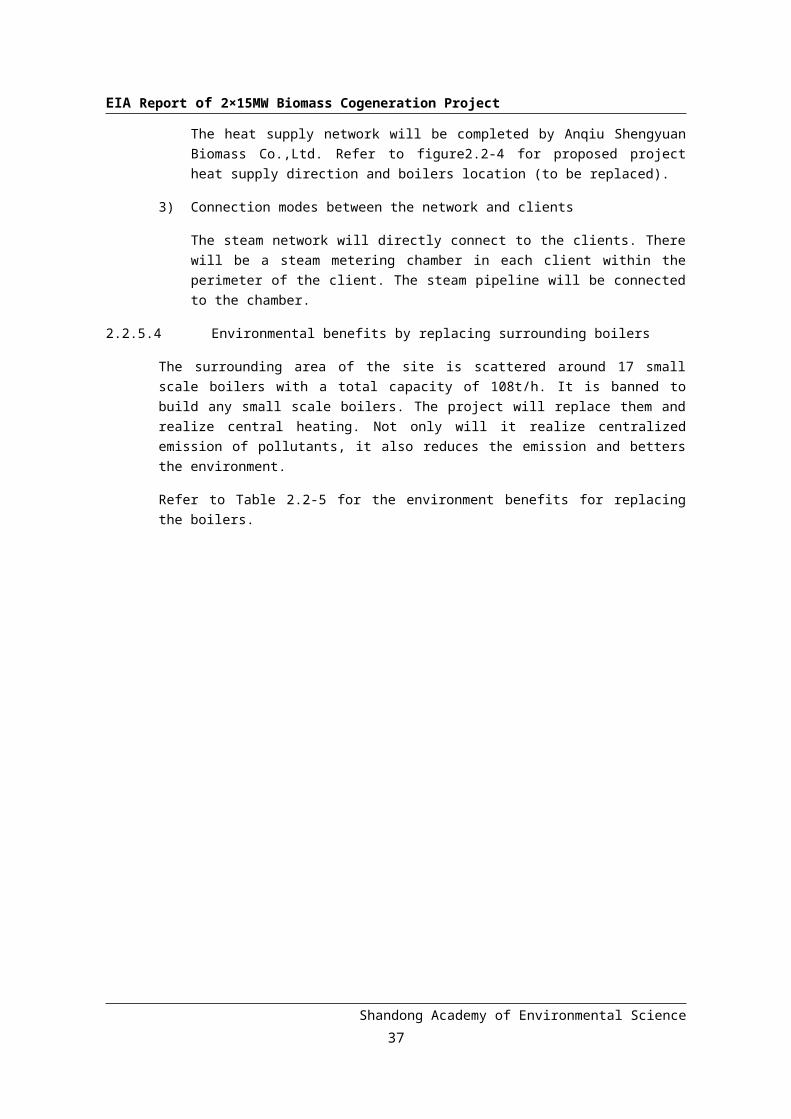
The heat supply network will be completed by Anqiu Shengyuan Biomass Co.,Ltd. Refer to figure2.2-4 for proposed project heat supply direction and boilers location (to be replaced).
3) Connection modes between the network and clients
The steam network will directly connect to the clients. There will be a steam metering chamber in each client within the perimeter of the client. The steam
Shandong Academy of Environmental Science
30
EIA Report of 2×15MW Biomass Cogeneration Project
pipeline will be connected to the chamber.
2.2.5.4 Environmental benefits by replacing surrounding boilers
The surrounding area of the site is scattered around 17 small scale boilers with a total capacity of 108t/h. It is banned to build any small scale boilers. The project will replace them and realize central heating. Not only will it realize centralized emission of pollutants, it also reduces the emission and betters the environment.
Refer to Table 2.2-5 for the environment benefits for replacing the boilers.
Shandong Academy of Environmental Science
31
EIA Report of 2×15MW Biomass Cogeneration Project
Table 2.2-5 Environmental Benefits to Replace the Boilers
Figure 2.2-4 Heat Supply Orientation and Distribution of Boilers to be Replaced
Proposed circulating water heat supply
Proposed steam heat supply
Power outlets
Existing heat supply
Existing water supply
Stalk routes
33
EIA Report of 2×15MW Biomass Cogeneration Project
2.2.6 Fuel Storage and Transportation
2.2.6.1 Fuel Source
The fuel will be from agriculture stalks from Anqiu, with wheat and corn stalks as the major fuel source.
2.2.6.2 Fuel Collection
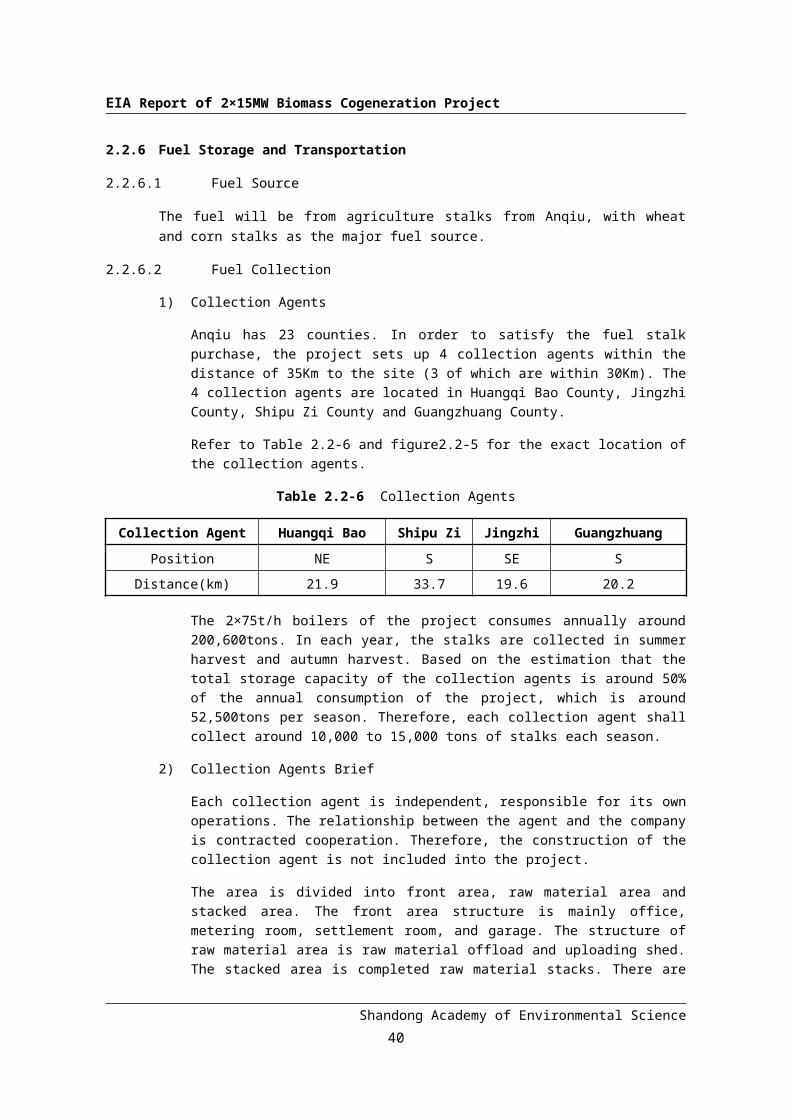
1) Collection Agents
Anqiu has 23 counties. In order to satisfy the fuel stalk purchase, the project sets up 4 collection agents within the distance of 35Km to the site (3 of which are within 30Km). The 4 collection agents are located in Huangqi Bao County, Jingzhi County, Shipu Zi County and Guangzhuang County.
Refer to Table 2.2-6 and figure2.2-5 for the exact location of the collection agents.
Table 2.2-6 Collection Agents
Collection Agent Huangqi Bao Shipu Zi Jingzhi Guangzhuang
Position NE S SE S
Distance(km) 21.9 33.7 19.6 20.2
The 2×75t/h boilers of the project consumes annually around 200,600tons. In each year, the stalks are collected in summer harvest and autumn harvest. Based on the estimation that the total storage capacity of the collection agents is around 50% of the annual consumption of the project, which is around 52,500tons per season. Therefore, each collection agent shall collect around 10,000 to 15,000 tons of stalks each season.
2) Collection Agents Brief
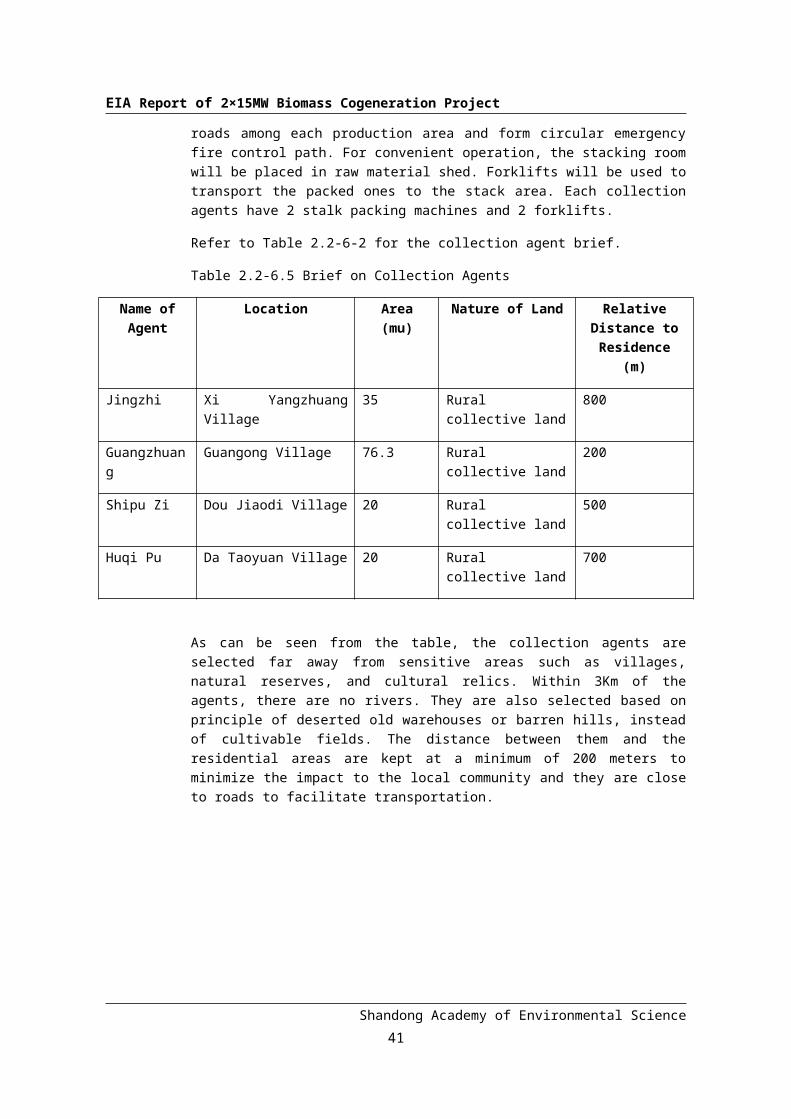
Each collection agent is independent, responsible for its own operations. The relationship between the agent and the company is contracted cooperation. Therefore, the construction of the collection agent is not included into the project.
The area is divided into front area, raw material area and stacked area. The front area structure is mainly office, metering room, settlement room, and garage. The structure of raw material area is raw material offload and uploading shed. The stacked area is completed raw material stacks. There are roads among each production area and form circular emergency fire control path. For convenient operation, the stacking room will be placed in raw material shed. Forklifts will be used to transport the packed ones to the stack area. Each collection agents have 2 stalk packing machines and 2 forklifts.
Refer to Table 2.2-6-2 for the collection agent brief.
Shandong Academy of Environmental Science
34
EIA Report of 2×15MW Biomass Cogeneration Project
Table 2.2-6.5 Brief on Collection Agents
Name of Agent
Location Area (mu) Nature of Land Relative Distance to
Residence (m)
Jingzhi Xi Yangzhuang Village 35 Rural collective land 800
Guangzhuang Guangong Village 76.3 Rural collective land 200
Shipu Zi Dou Jiaodi Village 20 Rural collective land 500
Huqi Pu Da Taoyuan Village 20 Rural collective land 700
As can be seen from the table, the collection agents are selected far away from sensitive areas such as villages, natural reserves, and cultural relics. Within 3Km of the agents, there are no rivers. They are also selected based on principle of deserted old warehouses or barren hills, instead of cultivable fields. The distance between them and the residential areas are kept at a minimum of 200 meters to minimize the impact to the local community and they are close to roads to facilitate transportation.
Shandong Academy of Environmental Science
35
EIA Report of 2×15MW Biomass Cogeneration Project
Shandong Academy of Environmental Science
Figure 2.2-5 Location of Collection AgentsFigure 2.2-5 Location of Collection Agents
Shipu Zi
Guanzhuang
Site
Huangshu Qipu
Jingzhi
36
EIA Report of 2×15MW Biomass Cogeneration Project
2.2.6.3 Fuel Transportation
The fuel of the project is mainly corn and wheat stalks, supplemented by other stalks. The project includes 2 boilers with an annual stalk consumption of 200,600 tons and hourly consumption between 32.47 and 33.44tons. Based on the transportation modes of similar projects, the projects entrusts collects agents to collect stalks in places where there are great amount and asks them to be responsible for organization of vehicles to transport them to centralized collection fields for storage. The farmers near the collection agents can also collect them and bring them to the agents. The stalks will be packed and stored. Vehicle transportation will be used between the collection agents and the project site.
About the fuel material transportation, as Anqiu is located in the central part of Shandong, it is marked by convenient transportation with 206 state highway, 325, 222 and 221 provincial highway running across. In addition, most of Anqiu is plain area, and all villages have highways connected. The project site is located to the southwest of 206 State highway 4.2km and through Shuangfeng road and a path, it is directly connected to 206 state highway. Therefore, the site has convenient transportation and excellent location, which provides convenience to the stalk purchase and other construction materials.
It is estimated that each hour the vehicles entering and exiting the project might be between 6 and 8 per hour. The fuel transportation, therefore, will have little impact to the local traffic and the roads can satisfy the transportation demand of the project.
2.2.6.4 Fuel Storage
In the north of the site, there is a storage field with an area of 26,440 m2. To the south of the field, there is a fuel preparation shed, within which there are stalk shredding equipment and feeding ditch. In the feeding ditch, there are 2 rotating feeding systems. The stalks from the collection agents will be temporarily stored in the storage field. The field is with a length of 254m and a width of 105m. There will be 8 stacks of fuel with a height of 5m. Each stack occupies an area of 1959m2. If calculated at the rate of 180kg of fuel in 1m3, the storage field can store stalks 14,100t, which can satisfy the production needs for 19 days under normal operation conditions.
The project includes a fuel preparation shed. The stalks are delivered to the fuel preparation shed from automatic grapples. The shed is with a length of 150m and a width of 30m, and it is used for drying, shredding and storage of stalks. The shredded stalks will be delivered through conveyor belts to two bunkers, each with a volume of 200m3. The surroundings of the bunkers are enclosed and at the top, there is fuel inlet. The bunkers can store fuel 72 tons, which can satisfy 2 boilers operation for 2 hours. The fuel shed storage area is 4500m2 and the stack height is 5m. If calculated at 180kg per 1m3, in the shed, the amount of stored material is 4050t, which can satisfy the two boilers for 5 days. The top of the shed is enclosed and under the beam, there will be rain covers and at the bottom there will be perimeter with a height of 1 meter. The shed has ventilation and fire control facilities.
Shandong Academy of Environmental Science
37
EIA Report of 2×15MW Biomass Cogeneration Project
2.2.6.5 Fuel Feeding
1) Fuel Feeding Procedure
The fuel feeding procedure is as follows:
Storage field→feeder→ automatic unpacking and feeding equipment→ stalk shredding machine→rotary screen(dust removal →) offloading ditch→1# conveyor belt→2# conveyor blet→distributor→bunker with movable bottom→speed adjustable belt with metering equipment→spiral feeder→combustion
2) Fuel Feeding System control
The control is carried out from the control room or on site operation. In the control room, there is operation platform, on which the lights and sound signal represents different parts together with interlocking device. The commissioning and stop shall be carried out according to set sequence. The key places in the system will be monitored by CCTV, with images displayed in the control room.
3) Safe Operation
a) Feeding system
The bulky stalk and bundled stalks in the central storage field will be delivered to the cylinder feeder through grapples. The stalks will be automatic unpacked and enters the stalk shredding device in an even way. The shredded stalks will enter the rotary screen to remove the dust of the stalks and the remaining cleaned stalks will be offloaded to the No.1 Belt to be transported to No. 2 Belt. Then through distributors, it will enter the bunkers with movable bottom in the front of the 2 boilers. .
The two boilers are each equipped with 3 cylinder feeders, knife roll breakers, and rotary screens.
b) Combustion system
i) Each boiler is equipped with one bunker (volume at least 200 m3 with movable bottom). At the bottom of each bunker, there are several kick-out device to kick out the stalks in the bunker to the chain pan distributor in an even manner. The distributor will respectively deliver the fuel to the speed adjustable conveyor belt on both sides of the boiler, which will be fed into the boiler for combustion purpose through the straight line spiral feeders on both sides of the boiler. Each feeder is to satisfy the fuel supply of at least 60%. When there is one feeder faulty on either side, the other feeder can ensure the boiler is in operation economically.
The feeding amount to the boiler is controlled by the speed adjustable
Shandong Academy of Environmental Science
38
EIA Report of 2×15MW Biomass Cogeneration Project
character from the kick-out device, chain pad distributor and conveyor belt (with metering functions). In each chain pad distributor, there is electric powered pad to adjust the delivery amount.
Blowing air is provided in the feeding port to prevent coking and backfire and the straight line spiral feeder can effectively prevent damages to the feeding system caused by back fire.
ii) Diffuser: water cooling grid plate, column hood (heat & wear resisting alloy steel); ignite below the bed.
iii) Boiler bed material discharge: bed material is continuously discharged into sorting unit from the boiler. Under faulty conditions, the bed material will be temporarily discharged. After cooling, large bed material particles will be discharged while other materials with qualified size will be returned into furnace.
iv) Secondary air device: secondary air is sent at a speed of 50m/s to different height of the furnace through secondary air pipe nozzle to control combustion. During operation, the secondary air pressure shall not be lower than 7000Pa with amount around 50%.
To accurately control air flow, electric air damper and air metering devices are installed on the primary and secondary air pipes.
v) Ignition and combustion - supporting oil system: 2 igniters are arranged in parallel on the air inlet pipe below the boiler bed. Each igniter is equipped with an ignition oil torch, high-energy electronic igniter, fire detect device and observation port. The oil torch adopts mechanical atomizer methods and the fuel is 0 grade diesel with a consumption of 800kg/h. Fume will be formed after burning of diesel, which will be delivered to the furnace through diffuser from water cooling chamber. In order to observe the oil torch, there is observation port.
Before being discharged into the atmosphere by draft fan through stack of 100m, high temperature flue gas and ash produced by combustion will flow through convection pipe bundle, low temperature superheater, economizer and air pre-heater, as well as bag-type dust collector.
2.2.6.6 Fuel Consumption
1) Fuel combustion composition and consumption
The fuel of the project is mainly stalks (wheat stalk and corn stalk in any proportion). With the exception of the starting firing when it is allowed to use diesel, it is forbidden to use any other fuel other than stalks. The annual consumption of fuel is 200600 tons and the setup of collection agents and stalk availability can ensure the
Shandong Academy of Environmental Science
39
EIA Report of 2×15MW Biomass Cogeneration Project
amount required for the project and its purchase, transporting and preparation.
Refer to Table 2.2-7 for composition and Table 2.2-8 for consumption.
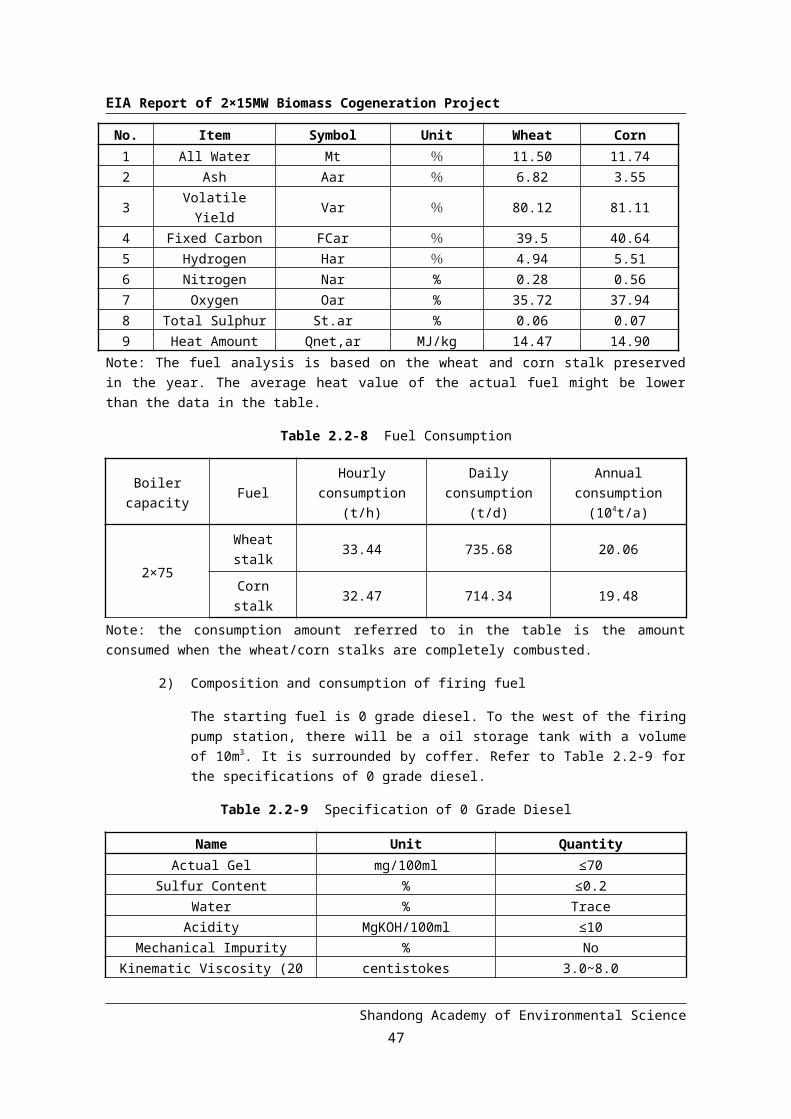
Table 2.2-7 Stalk Composition Analysis
No. Item Symbol Unit Wheat Corn1 All Water Mt % 11.50 11.742 Ash Aar % 6.82 3.553 Volatile Yield Var % 80.12 81.114 Fixed Carbon FCar % 39.5 40.645 Hydrogen Har % 4.94 5.516 Nitrogen Nar % 0.28 0.567 Oxygen Oar % 35.72 37.948 Total Sulphur St.ar % 0.06 0.079 Heat Amount Qnet,ar MJ/kg 14.47 14.90
Note: The fuel analysis is based on the wheat and corn stalk preserved in the year. The average heat value of the actual fuel might be lower than the data in the table.
Table 2.2-8 Fuel Consumption
Boiler capacity FuelHourly
consumption (t/h)Daily consumption
(t/d)Annual consumption
(104t/a)
2×75Wheat stalk 33.44 735.68 20.06
Corn stalk 32.47 714.34 19.48
Note: the consumption amount referred to in the table is the amount consumed when the wheat/corn stalks are completely combusted.
2) Composition and consumption of firing fuel
The starting fuel is 0 grade diesel. To the west of the firing pump station, there will be a oil storage tank with a volume of 10m3. It is surrounded by coffer. Refer to Table 2.2-9 for the specifications of 0 grade diesel.
The project requires small amount of chemical materials in the project commissioning period and for water purification and treatment purpose in operation period. The chemicals will be stored in designated warehouse in water treatment house. All materials will be packed based on their own chemical properties. Refer to table 2.2-14 for the composition and consumption of the chemical materials.
Table 2.2-10 Major Chemical Materials and Consumption (Unit: t/a)
No. Name Form Storage methods Consumption
1 Sodium hypochlorite Solid Sealed plastic bags 1
2 Sulfuric acid Liquid Carbon steel tank 60
3 Sodium hydrate Solid Sealed plastic bags 1
4 Ammonia Liquid Carbon steel tank 1.5
5 Hydrazine Liquid Teflon plastic container 0.1
6 Hydrochloric acid (30%) Liquid Glass fiber tank 50
2.2.7 Ash and Slag removal system and ash and slag storage
Based on the requirements from the Reply from Shandong Environmental Protection Bureau, the proposed project should adopt separate removal systems for ash and slag and shall have ash and slag storage house. The ash and slag removal systems of the project are as follows:
2.2.7.1 Ash removal system
The project includes 2 circulating fluidized boilers. The ash removal system adopts two methods: synchronized method and buffering method. The former means the ashes are directly bagged in at the bottom of the dust collectors to be transported outside and the latter means that the ashes are pneumatically transported to steel bunker with a volume of 600m3 to be transported by special tankers. The whole process is enclosed and airtight. Refer to figure2.2-6 for the ash removal procedure.
Shandong Academy of Environmental Science
Ash from AC Roots blower Ash pipe
Transportation
Ash silo
Transportation
Anqiu Fertilizer Plant, Shandong Aobao
Sack packer
41
EIA Report of 2×15MW Biomass Cogeneration Project
Figure2.2-6 Ash removal sytem procedure
2.2.7.2 Slag removal system
The project includes 2 circulating fluidized biomass boilers. When the stalks enter the furnace, they are combusted among 900ºC circulating bed materials (river sand or quartz sand) and the ashes after combustion will be collected together with flue gas by bag filters. Therefore, during normal operation, the slag removal is little.
The boilers are required to discharge partial or complete bed materials (bed slag) under faulty conditions or planned outages. Therefore, a slag removal system is still required and designed. It requires chain and bucket type conveyor to discharge the bed material to steel made bunker for storage. Then when they are required, they will go through a mechanical classifier. The qualified bed material will be returned to the furnace and those who do not qualify will be transported to temporary ash and slag house for temporary storage. The house can also be used to store the dry ash which is bagged and has not been transported outside.
Refer to figure2.2-7 for the procedure.
Figure2.2-7 Slag removal system procedure
2.2.7.3 Ash and Slag house
The bottom ash after biomass combustion is a kind of quality organic fertilizer, rich in calcium, magnesium, phosphorous and potassium. It can be utilized as the raw material for organic fertilizer. The construction company has already signed a letter of intent with Shandong Aobao Chemical Co.Ltd. to sell all the ashes and slag of the project to Shandong Aobao. Therefore, the exploitation of the ash and slag will not have problems.
The project will set up a temporary ash and slag house which is located in the northeast of the main production buildings, with an area of 400m2. The ash and slag that have not been immediately transported outside will be bagged and stored in the field. If calculated at each bag of ash and slag 20kg, and the stack with a height of 3m, the temporary ash and slag house can store the amount of ash and slag produced for 5 days under normal production conditions. The temporary ash and slag storage house will adopt an enclosed
Shandong Academy of Environmental Science
Fluidized bed material
Chain and bucket elevation conveyor Steel made bed bunker
classifier temporary slag field
Qualified bed material recycled
42
EIA Report of 2×15MW Biomass Cogeneration Project
structure at the top and one entrance and exit at the sides respectively. The top of the house will be equipped with an automatic pulsed back flushing type bag filter to purify the blowing air for ash. The ash and slag will be transported in enclosed tankers and the small amount of leakage during offload and uploading process will be immediately cleaned to avoid spreading.
2.2.8 Number of Staff and Work System
2.2.8.1 Number of Staff
After completion of the proposed project, the number of staff required are 106, which are 23 of production management, 64 operators, and 19 maintenance and service personnel.
2.2.8.2 Work System
Based on the production technique requirement and characteristics of production, the production personnel work on 4 shifts but running 3 shifts per day with each shift 8 hours.
2.2.9 Water supply and drainage system
2.2.9.1 Water supply system
1) Water source
The average water consumption for this project shall be about 221.46 m3/h, and the annual water consumption shall be about 1,328,800 m3/a. In accordance with the document numbered Huanfa [2006]82: Notification regarding Enhancing Management of Environment Effect Evaluations on Biomass Power Generation Projects issued by State Environmental Protection Administration which specifies “Encouraging the use of reclaimed water from city sewage water treatment plants, limiting the use of surface water in northern water-deficient areas, inhibiting the use of ground water”, water from the city sewage water treatment plants shall be used as circulated cooling water for projects to be built as soon as possible.
According to investigations, Anqiu city sewage water treatment plant is located at NE 11km away from this project. Considering that the far distance may be a constraint factor for laying piping, the reclaimed water will not be considered as makeup water for circulated cooling water. Therefore, Mushan water reservoir will be considered as makeup water source for the whole project and Auqiu tap water company as backup water source.
Currently, the water outputting from Anqiu city sewage water treatment plant is drained to Wenhe river after satisfying Urban Sewage Water Treatment Plant Effluent Drainage Standard (GB18918-2002): Class 2 Standard. After the upgrading of Anqiu city sewage water treatment plant is completed, the water drained from sewage water treatment plant can satisfy Urban Sewage Water Treatment Plant Effluent Drainage Standard (GB18918-2002): Class 1 Standard B, but still can not
Shandong Academy of Environmental Science
43
EIA Report of 2×15MW Biomass Cogeneration Project
satisfy the requirements for reclaimed water.
It is thus suggested from the above descriptions that: after the water outputting from Anqiu city sewage water treatment plant can satisfy the reclaimed water requirements and the layout of associated piping for supplying reclaimed water is completed, the power plant shall use the reclaimed water from sewage water treatment plant as the circulated cooling water makeup and reduce or avoid the use of surface water.
Mushan water reservoir is located at the branch of Weihe river, in the middle reach of Wenhe river and at the foot of Mushan mountain 6 km west to Anqiu county and has an upstream watershed area of 1262km2. Mushan water reservoir was constructed from October of 1959 and basically completed in June of 1960 for reserving water. The total planned storage of the water reservoir is 0.33 billion m3. In 1985, the following data were checked and finalized: designed flood water level reoccurred every 100 years: 78.73m; total storage: 0.164 billion m3; normal water level: 154.23 m; usable storage: 0.1205 billion m3; dead water level: 71.85 m; dead storage: 19,600,000 m3; the multi-year average rainfall of water reservoir: 702.3mm; evaporation: 1042.3 mm; leakage: 100,000 m3/a. In view of the designed irrigation reserve of Mushan water reservoir of 30,000,000 m3, the living water reserve of 20,000,000 m3, the industrial water reserve of 35,000,000 m3 and the annual water consumption for this project of 1,328,800 m3, the water supply capacity of the reservoir can meet the water consumption requirements of this project under 95% water supply guarantee rate. The construction company shall be responsible for investing and laying the water supply piping eastward from Mushan water reservoir along southern trunk channel to plant area.
The trend of water supply piping is showed in Figure 2.2-9.
2) Water supply system and water treatment
a) Water supply system
The water supply system for power plant area includes chemical water treatment system, living water supply system, industrial water system, fire-fighting water supply system, and a water pool with a capacity of 1000m3. Mushan water reservoir piping is to be connected to the 1000m3 water pool, then via pump house for production water, living water and fire-fighting water pumps to the whole power plant where water is needed. The pump house incorporates respectively two chemical water pumps, two industrial water pumps, two living water pumps and two fire-fighting water pumps (one in use and one as standby). The production water and living water are supplied by independent pipe networks connected to the 1000 m3 water pool, and the indoor living water and fire-fighting water are supplied by common pipe network laying along road and in loop arrangement. The outdoor fire-fighting water adopts independent piping connected to the water pool under cooling tower.
Shandong Academy of Environmental Science
44
EIA Report of 2×15MW Biomass Cogeneration Project
This project adopts secondary circulated water system of cooling tower, with the circulated water pumps arranged in the main building.
The boiler water makeup system is to be supplied by the water pool with the water therein being treated by chemical water treatment system, and the acidic/basic waste after treated in neutralizing pond and other industrial water are pooled into water collecting pond and are to be used as makeup water of circulated cooling system.
b) Water treatment manner
In order to guarantee the quality of boiler makeup water and satisfy the steam/water requirements of generating units, the makeup water will, prior to being fed to boiler, be treated by chemical water treatment system, with its process flow chart shown in Figure 2.2-8.
3) Water consumption and water balance
The fresh water consumption for this project will be 221.46 m3/h, with the detailed consumption of the whole power plant shown in Table 2.2-11.
Shandong Academy of Environmental Science
Raw water pumpWater pool Heater multi-media filter active carbon filter
scale inhibitorReverse osmosis
system
Primary mixed bed
carbon dioxide removal device
Intermediate water tank
Figure 2.2-8 Process flow chart of chemical water treatment system
Intermediate water pump
Demineralized water tank
Demineralized water pump
Main building
45
EIA Report of 2×15MW Biomass Cogeneration Project
Table 2.2-11Summary of water consumption and drainage from the whole power plant (in: m3/h)
No. Items
Fres
h w
ater
flo
w
Seco
ndar
y w
ater
flow
Rec
over
ed
wat
er fl
ow
Con
sum
ed
wat
er fl
ow
Dra
inag
e w
ater
flow
Com
preh
ens
ive
wat
er
flow
1Circulated cooling water system
28.76 70 0 55.16 43.6 0
2Chemical water quantity
115 0 0 92 20.5 2.5
3 Industrial water 57 0 55 1 1 04 Sampling water 15 0 15 0 0 0
5Water for spraying road etc.
0 1 0 1 0 0
6Water for slag and dust removal
0 1 0 1 0 0
7Water for fuel transfer and dust removal
0 0.5 0 0.5 0 0
8 Living water 0.7 0 0 0.14 0.56 0
9Unexpected water consumption
5 0 0 0 0 0
In total 221.46 72.5 70 150.8 65.66 2.5
2.2.9.2 Drainage system
The drainage system of this project is arranged by adopting the principles of Separating Fresh Water From Wastewater and Separating Rainfall From Wastewater, with two wastewater collecting systems and independent pipe networks therefor disposed respectively for rainfall collection in plant area and for production and sanitary wastewater collection, and the wastewater will not be drained into southern trunk channel. The spent circulated cooling water is clean drainage water and drained directly to rainfall pipe network in plant area; part of the acidic/basic waste from production after neutralized and precipitated (the water mainly having high salt content) may be reused and the other part will be drained to rainfall pipe network in plant area; the oil-containing waste water after oil isolation and precipitation together with the sanitary wastewater after precipitation through septic tank will be drained via the sewage pipe network in plant area into municipal sewage pipe network and finally to Anqiu city sewage water treatment plant.
The drainage piping is to be invested and laid by construction company northward from the wastewater pipe network in plant area along a distance of 1000m into municipal
Shandong Academy of Environmental Science
46
EIA Report of 2×15MW Biomass Cogeneration Project
sewage pipe network.
2.2.10 Step-up station and outgoing line scheme
2.2.10.1 Profile of step-up station
The project to be built is located at south-west of Anqiu, with 2×15 MW thermal power generating units to be installed for this phase. Anqiu Nanfu substation is located at north of and 800m away from the project site, its capacity of 85MVA can fully meet the requirements of the power plant for connecting to grid at 35 kV voltage level.
2.2.10.2 Outgoing line scheme
2X15MW units are to be built in this phase with a voltage of 10 kV at generator outlet, the generators and main transformers form generator-transformer unit and are stepped up for connecting to 35kV busbar, which adopts sectionalized single-bus configuration. In this phase two 35kV tie lines are to be laid for connecting to Anqiu 110KV Nanbu substation.
2.2.10.3 Electro-magnetic radiation sources
The main electro-magnetic radiation sources in power plant include main transformer, HV electrical equipment, start-up/standby transformer, relays in step-up stations, AC security busbar and battery recharger. During operation, the transformers and HV switchgears may produce strong power-frequency electromagnetic radiation. The electromagnetic radiation from 35kV lines are relatively low and thus has little effect on ambient environment, however, these lines may produce radio noise generally due to the following three reasons: air corona discharge at conductor and metal surfaces; discharge and sparks in the area of insulators withstanding high potential gradient; spark gap resulting from loose connection or poor contact. The 35 kV power lines of this project may produce lower noise and thus have lower effect on ambient environment.
2.2.10.4 Effects of step-up station on ambient environment
The effects of step-up station on environment mainly include electromagnetic radiation and noise. By comparison to the effects of other 35 kV step-up stations on environment, the 35kV step-up stations for this project are at lower substation voltage level, and the power line corridor is totally above farmland without passing through villages, therefore having little effects on environment
Shandong Academy of Environmental Science
47
EIA Report of 2×15MW Biomass Cogeneration Project
2.3 Estimation on environmental protection investment
The environmental protection investment involves expenditures on dust removing system, ash and slag removing system, greening and environment monitoring etc., in total of RMB 10,420,000 Yuan and accounting to 4.52% of the total investment on this project. The investments on individual environmental protection facilities are shown in Table 2.4-1.
Table 2.4-1 Estimation on environmental protection investment
No.
ItemsAmounts
(in 10,000 RMB Yuan)1 Wastewater treatment 30
Noise control 802 Dust removing system 6003 Ash and slag removing system 1324 Continuous on-line flue gas monitor 985 Equipment and instrument for environment monitoring station 726 Greening in plant area 307 In total 10428 Total investment of the project 23050
9The proportion of environmental protection investment in the total investment
4.52%
Shandong Academy of Environmental Science
48
EIA Report of 2×15MW Biomass Cogeneration Project
Chapter 3 Brief on Natural and Social Environment
3.1 Brief on Natural Environment
3.1.1 Location
Anqiu (36°05′ ~ 36°38′ N and 118°44′ ~ 119°27′E) is located in the central part of Shandong, neighboring to Weifang to the north, Zhucheng to the south, Gaomi and Changyi to the east and Linju to the west. With an area of 2010 square kilometers (1.3% of Shandong Province areawise), the city is with a maximum length of 61.5kilometers south to north and a maximum width 65.3 kilometers east to west. It is 32km from Weifang to the north and 200km to Jinan (provincial capital).
The city boasts of convenient transportation with State Highway 206 running through urban area and it is only 20 kilometers from the Weifang Airport and 30 kilometers from the Weifang Railway Station.
Refer to figure3.1-1 for the exact geographical location of Anqiu.
The site is located in the southwest of Anqiu urban area and to the west of Anwu Road, and the east of Sanli Dianzi Village of Xing’an Street Administrative, and the south of Nanyuan road. The South Main Canal runs through the site. Refer to Figure2.2-1A and 2.2-1B for the site location.
3.1.2 Landscape
Anqiu is located on the north edge of low hilly area in the central south of Shandong. The linshu fracture shapes the landscape and water distribution and the landscape is extended along Taiyi Mountain with a slope from the high southwest to the northeast. The Taiping Mountain on the southwest edge is 523m above the sea level, which is the acme of the city, whereas the Wenhe River bed at Hetao village on the northeast edge is with an altitude of 22m, the bottom of the city. The south of the city is characterized by mountains and hills and the south is plain, with proportions of 19%, 15% and 66% respectively.
The proposed project is located in the southwest of Anqiu urban area and to the west of Anwu Road. The surrounding area is farmland and vegetable greenhouses and there are no scenic spots or archeological sites or mining ores around the site. There are no airports, radio stations, or military facilities in the adjacent area. The site is characterized by a slope (average slope of 2%) from high east to low west with a natural elevation of 59.2 to 68.4 meters.
Shandong Academy of Environmental Science
49
EIA Report of 2×15MW Biomass Cogeneration Project
3.1.3 Geology
In Anqiu, except for the east of Anqiu which is located in Jiaolai Basin and the west extension from Jiaobei Arc Upheaval, most part is located in the central of the north of linshu Fracture, belong to the upheaval portion of northern China.
The geological layers exposed in the city range from Archeozoic period to Cenozoic period with exceptions Silurian, Devonian, Carboniferous, Permian, and Triassic periods due to the ancient geographical environment and earth crust movement. The rock type is metamorphic rock of Tai Mountain and Fenzi Mountain, sedimentary rock of Paleozoic earathem, Mesozoic group, and Cenozoic group and serpentine rock, amphibolite rock in Taishan period etc. In Taiping mountain, Daan mountain, Liushan mountain and Chengdingshan mountain, there is the spread of basalt rocks of Cenozoic group.
The geological structure of the proposed project is located to the west of Linmu Fracture and in the east of Luzhong rupture.
3.1.4 Surface Water System
There are more than 50 rivers whatever the size in Anqiu, which are mainly scattered around east, north and south and all belong to Weihe River. The major rivers are Weihe River, Wenhe River, Quhe River, Honggou He River, and Shijiao He River. The watershed area is 1884km2, which is 93.7% of the Anqiu. The nearest river to the site is Wenhe River with a distance of 2.8Km.
Weihe River is also named Weishui River and is the biggest river in the city and located in the east of the city. The origins of the Weihe River are two, with major one from Xiaoquan Gou of Yishui County. It flows from Wulian County and Zhuzheng city before it comes to Anqiu. The length of the river in Anqiu is 36.5Km. As the upstream of the river has more mountainous areas, the fall of the river is big with historical record of flood of 7850m3/s.
Wenhe River is also called Wenshui River and is a branch of Weihe River. The origin of Wenhe river is from Sang Spring from Linqu. As Sangquan is also called Wenshui, that is how it got its name Wenhe river. It flows from Linqu and Changle to enter Anqiu, with a length of 78Km in Anqiu. There are 6 branch streams for Weihe River. The controllable watershed area is 1076km2. The river is seasonal with historical flood record of 5550m3/s.
Mushan water reservoir is located at the branch of Weihe river, in the middle reach of Wenhe river and at the foot of Mushan mountain 3.8 km west to the project and has an upstream watershed area of 1262km2. Mushan water reservoir was constructed from October of 1959 and basically completed in June of 1960 for reserving water. The total planned storage of the water reservoir is 0.33 billion m3. In 1985, the following data were checked and finalized: designed flood water level reoccurred every 100 years: 78.73m; total storage: 0.164 billion m3; normal water level: 154.23 m; usable storage: 0.1205 billion m3; dead water level: 71.85 m; dead storage: 19,600,000 m3; the multi-year average rainfall of water reservoir: 702.3mm; evaporation: 1042.3 mm; leakage: 100,000
Shandong Academy of Environmental Science
50
EIA Report of 2×15MW Biomass Cogeneration Project
m3/a.
Refer to figure2.2-5 for detailed of the water bodies around the site.
3.1.5 Hydrology
With the character of exposed rocks in Anqiu, the shallow ground water bearing rocks are generally classified into 5 groups.
The first group is loose rock pore water, with nature of rocks from flushing, proluium, slope deposit of Quaternary. The rocks are distributed in Weihe river and Wenhe river and the alluvial plain along the river in counties including Jingzhi, Zhaoge, Huangqi Pu, Linghe, Guangwang, Anqiu, Jiage, Danshan and Liuwu, with an area of 696.57Km2. The thickness of water bearing layer varies and the rich water bearing character is different, with unit water yield ranges from 10 to 50m3/t.m.
The proposed site has rich resource of ground water between 2.5 and 5 meters underground. The ground water type is loose pore water and the stratum is continuous medium sand layer with water elevation of 59.83 to 60.59meters. It is the low pressure water from the Quaternary stratum, which is not corrosive to steel bars and concrete.
3.1.6 Water Resource
The average annual rainfall of the city has been 1.506billion m3 for several years with annual runoff depth of 198.6mm and groundwater rainfall recharge modulus 114,000m3/km2. The average total water resource for the past several years has been 475million m3, among which the surface runoff resource 404million m3 (81% of the total water resource) and the groundwater recharge amount 71million m3 (14.9% of the total water resource). The average usable water resource is 273million m3, among which the usable surface water resource 206million m3 (75.5% of the total usable water resource) and the usable ground water resource 67million m3 (24.5% of the total usable water resource).
3.1.7 Earthquake Intensity
Based on Zone Map of Seismic Dynamic Parameters in China (GB18306-2001) figure and Zone Map of China Earthquake Spectrum (GB18306-2001) figureB1, the earthquake peak accelerator of the region is 0.15 and the intensity is VIII grade.
3.1.8 Accumulated Maximum Frost Earth Depth of the Region
The accumulated maximum frost earth depth of the region is 0.6m.
3.1.9 Climatae and Weather Conditions
Climate: Anqiu belongs to temperate continental seasonal sub humid climate with obvious seasonal changes and seasonal wind. In Spring, as the solar altitudinal angle starts to
Shandong Academy of Environmental Science
51
EIA Report of 2×15MW Biomass Cogeneration Project
rise, the radiation will increase and it will be more windy and less rainy. In summer, when the solar altitudinal angle is the highest, there is the strongest radiation and affected by warm and damp air, it will be hot and rainy. In autumn, as the solar altitudinal angle lowers, the radiation will become decreased and the warm and damp air will retreat to the south and continental air will take over; which means the weather is getting cold and less rainfall. In winter, the solar altitudinal angle is the lowest and the land gets the least amount of solar radiation and controlled by continental air from the north; the weather is dry and cold. To summarize the above is: dry, windy spring, hot, humid, and rainy summer, cool autumn, and long winter with less now.
Temperature: The average of annual temperature for the recent years is 12.9ºC. In July each year, it is the hottest month, with the average monthly temperature 25.8ºC while in January, the coldest month, the temperature is -3.6ºC. The difference between the hottest and coldest each year is around 29.4ºC. The extreme hottest temperature was 40.1ºC recorded on June 11, 1968 and the coldest was -18.7ºC on January 27, 1981.
Rainfall: the average annual rainfall is between 600 and 800mm. In southwest mountainous areas, the average rainfall is more than 750mm and in the middle hilly area between 700 and 750mm and in northeast plain areas the rainfall is less than 700mm.
Sunshine: average annual sunshine hours over the years 2362 hours. The year with the greatest sunshine hours recorded was 1965 with 2904.7 hours and the least in 1975 with 2250.1 hours. The annual average sunshine proportion is 58% and the annual average solar radiation amount is 123.2 Kcal/cm2 with relative variation of 3%.
Wind: The most frequent wind in Anqiu is Southeast wind, followed by northwest and east wind. The wind in four seasons of the year has its own characteristics. In winter, it is characterized by north wind. In spring, the prevailing wind will change from north wind to south wind and to Southwest wind. In summer, the prevailing wind is south wind and in autumn from September, the prevailing wind is shifting from south wind to north wind. The annual wind speed is 2.4m/s with Spring the greatest around 3.3m/s and autumn the smallest around 1.5m/s. The wind speed in plain area is greater than mountainous area and the same goes to the east to the west and the south to the north.
Frost season and frozen earth: the average frost free period over the years are 186 days and the deepest frozen earth recorded is 50~60cm。
3.2 Brief on social environment
Anqiu is the first batch of coastal county-level cities approved by the state council to adopt “open” policy. It has an area of 2010 km2 with a population of 1.05million. Anqiu boasts of its industrial sector with 48 city-level enterprises and 206 county-level ones in ten sectors including light industry, petrochemical sector, textile, electronics, machinery, construction, and construction materials. With the deepening of the market economy, the industry and agriculture of Anqiu has gone further in development. The industry of Anqiu
Shandong Academy of Environmental Science
52
EIA Report of 2×15MW Biomass Cogeneration Project
has established a comprehensive industry system concentration on fertilizer, paper-making, construction material, petrochemistry, brewery, and machinery manufacturing. The urban area of Anqiu, as the science and technology, economic, and culture center of the city, has promoted its exported oriented economy by introducing foreign investment and paid attention to the development of its advantageous sector. In recent years, it has developed into a new industrial city integrating business, light industry and tourism.
In Anqiu Energy Consumption Structure, the composition of coal, oil, and natural gas is respectively 68%, 23.45%, and 3%. The proportion of the first, second and tertiary industry in Anqiu is 18.15:50.45:31.4. In 2008, the GDP of Anqiu is around RMB14.27billion.
Anqiu has 26 counties with a population of 1.05million. The average annual income of employees in the city is around RMB6635 and farmers’ annual income RMB3550. In the past several years, the industry and agriculture sector of Anqiu have undergone great development, especially the former, which has formed a comprehensive industry system majored in fertilizer, paper-making, construction material, petrochemistry, brewery and machinery making.
The proposed project is located in the southwest of Anqiu, to the west of Anwu Road and Sanli Dianzi Village of Xing’an Street Administration, to the south of Nanyuan Road. The site has convenient transportation network with state highway 206 and provincial highway 222 and 221 nearby. The nearest villages to the site are Sanli Dianzi Village and Zhangjia Lou Village. There are no cultural heritage areas, nature reserves, mining sites, and scenic spots in the adjacent area. The project does not involve migration, resettlement or relocation of people or enterprises.
3.3 Ambient air quality
3.3.1 Current status of ambient air quality
Based on the atmospheric emission characteristic and assessment grades of the proposed project, and in combination with the surrounding environment feature and climate conditions, the EIA has set 4 monitoring spots for the ambient air. Based on the assessments on the current status, the following can be seen:
Based on the assessment results on the current environment quality, the hourly average concentration and daily average concentration of assessment factor SO2 and NO2 around the project site satisfy the second grade standard in Ambient Air Quality Standards(GB3095-1996). The maximum pollution indicators for the hourly average concentration and daily average concentration of SO2 in each monitoring spot are 0.170 and 0.287 respectively. The maximum pollution indicators for the hourly average concentration and daily average concentration of NO2 in each assessment spot are 0.192 and 0.258 respectively. The daily average concentration of PM10
has exceeded the value specified to a little extent in Sanli Zhuang and the assessment results range 0.507~
Shandong Academy of Environmental Science
53
EIA Report of 2×15MW Biomass Cogeneration Project
1.100 and there was 5% over the standard value. The daily average concentration of TSP has exceeded the value specified to a little extent in Sanli Zhuang and the assessment results range 0.647~1.010 and there was 5% over the standard value.
3.3.2 Current status of surface water quality
Based on the results from the surface water routine monitoring, expect for petroleum and BOD5,the other assessment factors of the surface water of Mushan reservoir in region of the project all meet with the requirements of III category standard in Surface Water Quality Standard (GB3838-2020). The reason for excessive petroleum and BOD5 is due to the sewage discharge from the surrounding residential areas.
In Wenhe Yan roof section, except for CODcr,BOD, permanganate index, NH3-N, and total phosphorus, the other assessment factors can all satisfy the requirement of V category in Surface Water Quality Standard (GB3838-2002). In Wenhe River Sleeve Section, except for BOD, permanganate index and total phosphorus, the other assessment factors can all meet the requirements in III category in Surface Water Quality Standard (GB3838-2002). After self-purification, the downstream of Wenhe river has better water quality than the upper stream. The reason for the above excessive indicators is due to the discharge water from the sewage treatment plant cannot meet the standard of V category in Surface Water Quality Standard (GB3838-2002).
3.3.3 Current status of ground water quality
Based on the assessment results on the current environment quality, the assessment items including pH, permanganate index, sulphate, nitrate nitrogen, nitrous acid nitrogen, NH3-N, fluoride, chorid, and coliform of the three monitoring spots in the site neighboring area can all satisfy the standard in category III of Ground Water Quality Standard (GB-t14848-93). The total hardness is excessive in Sanli Dianzi village and Nan Sanli Village, with the maximum indicator of 2.19. For the assessment factor of soluble total solid, it is excessive in all monitoring spots with maximum indicator of 1.27. The reason for the excessiveness is due to the geology of the area.
3.3.4 Current status of acoustical environment quality
Based on current environment quality assessment results, the acoustical environment of the site and the surrounding sensitivity objects is good and the noise level of them at daytime and nighttime can both satisfy the standard in Category II in Acoustical Quality Standard (GB 3096-2008).
3.3.5 Ecological Environment Status
3.3.5.1 Current Land Nature
The proposed project, based on the Approval on Construction of 2*15MW Biomass Cogeneration Project of Shengyuan Biomass Cogeneration Company Limited, Anqiu
Shandong Academy of Environmental Science
54
EIA Report of 2×15MW Biomass Cogeneration Project
Planning Bureau (November 12, 2006), is located in the southwest of Anqiu City, to the west of Anwu Road and Sanli Dianzi village, to the south of Nanyuan Road. The land nature is for construction use and the project occupies an area of 113.4mu. The south main canal runs through the north side of the project site.
The proposed site is characterized by an average slope of 2% from east to west and south to north, with natural elevation between 59.20 and 68.40 meters. The site is currently surrounded by farming field covered by wheat and vegetables; thus it is typical agricultural ecological system, with simple ecological structure.
The proposed project will impact to a certain degree to the local ecological environment. Therefore, the construction shall adopt measures to repair and compensate for the damage it would cause to the ecological environment, so to minimize and avoid any damage, disturbance and maintain and improve the current ecological system.
3.3.5.2 Current Status on Species
1) Plant Distribution
Due to the historical factor and human activities, the original plant cover on the land site is no longer there and instead, there is sub-grown plantation, with majority as artificial plantation as farming field for wheat and vegetables.
With the increase in the number of enterprises in the area, the agricultural economy has been gradually replaced by the industrial economy. The site nature is no longer for farming purpose but for construction use.
Based on statistics from Rare and Endangered Plant Species of Shandong, there are 84 species of rare and endangered species in Shandong, distributed around hilly and mountainous areas. After careful examination with each individual species, there is no endangered species found in the site area.
2) Animal Distribution
The animals around the site area are mainly hardy wild animals and domesticated animals, with the former including rats, hares, and weasels, sparrows, magpies, ravens, swallows, insects and reptiles etc. The proposed area has frequent human activities and does not belong to typical wildlife habitat to be protected.
3.3.5.3 Survey on Local Sensitive Objects to be preserved
The proposed area is surrounded by farm fields and there are no sensitive preservation areas.
3.3.5.4 Assessment on Ecological Environment Status
The assessed area is artificial ecological system based on human activities and industrial production and there is no large area of natural plant coverage and wildlife habitat. The
Shandong Academy of Environmental Science
55
EIA Report of 2×15MW Biomass Cogeneration Project
biodiversity is not diversified as the existing species are normal sight in northern China.
The ecological system of the assessed area has relative stability and complete functionality. Due to artificial management and energy supply, the system can be maintained and developed with certain drought resistance ability.
3.4 In Compliance With Relevant Plans and Industrial Policies
3.4.1 Anqiu Ecological Development Plan
3.4.1.1 Objectives
Based on Anqiu Ecological Development Plan, the comprehensive city aim and in consideration of limiting factor for the urban development and resources, the orientation for ecological construction of Anqiu is:
1) Key functional city in Shandong peninsula cities and secondary central city of Weifang;
2) Shandong specialty agriculture products and food processing export base;
3) Landscape gardening city with focus on manufacturing and tourism.
Based on Anqiu Ecological Development Plan, the Anqiu can be divided into 4 different ecological function divisions:
Southwest low mountain ecological function division: refers to the low mountain area in the southwest of Anqiu. The area is characterized by high vegetation coverage, large patches of forest vegetation, and good ecological quality. It safeguards the ecological system of Anqiu. It covers counties including Dasheng, Shaoshan, Tuoshan, Hongsha Gou, Huiqu, Anshang, Shipu Zi, and Baoquan.
Central hilly ecological function division: refers to the hilly areas in the center and east of Anqiu. The division is characterized by typical hilly landscape with crops such as peanuts and tobacco. The counties in the area include Baifen Zi, Guangzhuan, Jingwu Zi, Song Guangtong, Guangong, and Shidui.
East Alluvial plain ecological function division: refers to counties in the alluvial plain in the Wenhe and Quhe drainage area. The area is characterized by fertile soil and good natural conditions, which forms an area noted for developed agriculture economy. The area includes counties such as Huangqi Pu, Zhaoge, Jingzhi, Luwu, and Wangjia Zi.
City center ecological function division: refers to the urban area of Anqiu including Liujia Yao county, Xing’an Street Administration, Jiage Street Administration, and eastern area of Guangwang county. The area is characterized by its economic foundation, developed industry and business. It is the political and economic center of Anqiu.
The proposed project is located in the city center ecological function division. According to
Shandong Academy of Environmental Science
56
EIA Report of 2×15MW Biomass Cogeneration Project
Anqiu Ecological Construction Plan, the orientation of the division is to realize environmental protection while creating a good living environment and the major measures are: a. on the basis that the ecological environment deterioration is preliminary controlled, stick to sustainable development policy and rely on science and technology progress and industrial restructuring to implement clean production and establish circular industrial economic mode to reduce emission amount and lower pollution; b. speed up the pollution control infrastructure construction and perfect pollution control system and social environment quality assurance system; c. strengthen measures to eliminate backward production techniques that waste resources and pollute the environment; and d. accelerate key pollution control work construction and strictly control the total emission of pollutants to gradually improve the environment quality and boost the living standard of people.
The proposed project will fully utilize the abundance of stalks in the region to reduce emission and save on energy resources and boost farms’ income. After completion, the project will supply steam to 6 companies including Anqiu Fuhua Food Co., Ltd, and Anqiu Waimao Food Co., Ltd. It will replace all the coal burning boilers in them. Also the boilers in Anqiu People’s Court and Anqiu Experiment School will be shut down. Therefore, the proposed project will play an active role in bettering the ambient air quality and the project satisfies the SO2 emission in the region and meets with divisional requirements of ecological function.
Based on Anqiu Ecological Development Plan, for the power sector in the ecological industry framework, more investment shall be made to perfect the transmission capacity of the grid under the basis of completing agricultural grid construction to form a power supply network centered with 220KV and backboned by 110KV stations. And the optical communication network shall be perfected to cover the whole power supply region. In addition, cogeneration projects shall be greatly promoted and perfected to optimize power supply and heat supply network. It plans to build a power plant to get rid of scattered heating supply and realize central heating.
The proposed project is located in the southwest of the Anqiu city and it is biomass cogeneration project in compliance with requirements on power sector in ecological industry framework.
3.4.1.2 Urban Development Plan
Based on Anqiu Urban Development Plan (2004-2020) and No.59,Lu-Zheng-Zi (2006),Shandong Provincial Government, Reply on Anqiu Urban Development Plan (2004-2020), there are three categories of cities according to their functions: the first category is Anqiu urban area, as the political, economic, cultural and technical center; the second category is Jingzhi, Huangqi Pu, Ling He, Zhao Ge, Wushan and Shi Puzi towns; the third category are other small towns. The spatial structure has set the urban area of Anqiu as the center of the city for development according to the axis by three main roads (206 state highway, 221 provincial highway and Baishi highway). Based on the functions
Shandong Academy of Environmental Science
57
EIA Report of 2×15MW Biomass Cogeneration Project
of the towns, there are three levels of towns and six economic zones to construct an orderly, reasonably configured urban system. The urbanization objective is to reach 45% and 55% respectively by 2010 and 2020. Based on the principle to comprehensively consider both urban and rural areas, it is set to plan and construct urban residential areas and city infrastructure to promote urban and rural area for fast, sustainable and balanced healthy development.
Based on Anqiu Urban Development Plan (2004-2020), the urban development scope includes: Xing’an Steet Administrative, Jiage Street Administrative, Liujia Yao Country Administrative area, Nan Xiejia Village, Chenjia Caiyuan, Lijia Xiapu, Gaojia Guzhuang Village and its east area, and Chenguan Ting Village, Luwang Village and Shaling Zi Village and their northern area, and 500m surrounding the Mushan Reservoir. The total planned area is 260km2.
Based on Anqiu Urban Development Plan (2004-2020), the urban power supply and heat supply plan of Anqiu: Based on the determined land listed in plan, it is estimated the electricity required by 2010 and 2020 will be 240,000KW and 380,000KW respectively. The construction of the heat supply source and network shall be in consideration of short term and long term objectives to realize implementation in stages. The cogeneration projects are promoted and it is banned to construct any small scale boilers smaller than 10 tons inside the planned zone for higher heat supply efficiency.
In order to realize comprehensive and centralized heating, there are three heat sources listed in Anqiu Urban Development Plan. Anqiu now have two constructed thermal power plants and they are under normal operation. Anqiu Tiantian Thermal Co., Ltd. is located to the west of Weian Road in the urban north area and its farthest heat supply distance is 5Km. Anqiu Shengyuan Thermal Company Limited is located at No.7 of Chang’an Road and the planned furthest heat supply distance is 5Km. Based on the principle of gradual construction of heat source in Anqiu, the third heat source provider is the proposed project with the furthest heat supply distance of 3Km. The construction of the project complies with requirements in Anqiu power supply and heat supply plan.
The proposed project is located in the southwest of Anqiu to the east of Mushan Reservoir and it complies with Anqiu Urban Development Plan (2004-2020) and requirements for power supply and heat supply.
Based on Anqiu Planning Bureau, Nov.12, 2006, Comments on Project Plans of 2*15mw Biomass Cogeneration Project proposed by Anqiu Shengyuan Thermal Company limited, the proposed site is in the southwest of Anqiu and to the west of Anwu Road and the south of Nanyuan Road. The land nature is for construction use. After the identification of the project, Anqiu Planning Bureau will, according to the national laws and regulations, process land use and construction formalities.
Shandong Academy of Environmental Science
58
EIA Report of 2×15MW Biomass Cogeneration Project
3.4.2 In compliance with Industrial Policy
3.4.2.1 In compliance with Industrial Restructuring Guidance Catalogue requirements
The project is biomass cogeneration project, which is in compliance with the clause 5 in the power sector in Industrial Restructuring Guidance Catalogue, which encourages power sector to develop wind power, solar power, geo-thermal power, ocean power, and biomass power.
3.4.2.2 In compliance with the requirements in Circular on Further Strengthening EIA Management for Biomass Power Generation Projects
Based on (Huan-Fa (2008) No.82) Circular on further strengthening EIA management for Biomass power generation projects from the State Environment Protection Ministry, the project utilizes fuel of wheat and corn stalks (not to be mixed with coal or other mineral fuel). The project is to build 2 75t/h sub-high temperature and sub-high pressure stalk combustion circulating fluidized bed boilers with 2 15MW extraction steamers. As the stalks contain low sulfur, the project is equipped with desulfurization equipment and as bag-type dust collectors are used (99.9% efficiency), there is ask and slag storage facilities for comprehensive utilization of ash and slag. The emission of pollutants can meet with our national emission standards. Based on the stalk supply situation, and in consideration of the transportation, there are 4 fuel collection agents to be set up within 35Km from the proposed site. The project has environment risk assessment chapter and formulated environment risk prevention and emergency plans to prevent pollution accidents.
The project complies with requirements in the circular.
3.4.2.3 In compliance with relevant requirements About Regulations to Develop Biomass Cogeneration projects
Based on About Regulations to Develop Biomass Cogeneration Projects (Ji-Jiao-Neng (1998) No.220), the overall heat efficiency average per year shall be bigger than 45% and the heat electricity ratio annually shall be bigger than 100% for thermal units with each unit capacity lower than 50,000Kw. The project overall heat efficiency average per year is 53.77% and the heat electricity ratio is 177%.
3.4.2.4 In compliance with Provisional Rules for Construction of Power Projects from Cogeneration and Coal Gangue
The farthest heat supply distance of the project is 3Km, which meets the requirements of 8Km of heat supply radius for cogeneration projects listed in the Provisional Rules for Construction of Power Projects from Cogeneration and Coal Gangue. There will not be similar cogeneration projects within 8Km.
Therefore, the project complies with national industrial policy.
Shandong Academy of Environmental Science
59
EIA Report of 2×15MW Biomass Cogeneration Project
Chapter 4 Environment Impact Analysis in Design and Construction Period
4.1 Environment Impact Analysis in Design Period and the Prevention and Control Measures
In the project preliminary preparatory stages including project feasibility study stage (inclusive of environment impact assessment) and preliminary design stage (inclusive of geological survey), the project will not produce direct negative impact to the environment. The feasibility of the project hinges on the selection of the site.
4.2 Environment Impact Analysis in Construction Period and the Prevention and Control Measures
The proposed project is located in the southwest of Anqiu urban area and the site is surrounded by farmland and vegetable greenhouses. The construction of the project does not require relocation of residents or enterprises. The construction period is 18 months with major project constituents include site foundation leveling, construction of buildings and other temporary structures (main production houses, administration building, and cooling tower) and equipment installation (boilers, steamers, and generators). The environment impact during construction period mainly consists of: mechanical noise, temporary deserted soil, dust suspension, traffic congestion, waste water and destruction of green coverage. The total excavation amount of the project is around 12045m3, and the refilled amount is 10400m3; the remnant earthwork will be used for road expansion and site ground leveling.
4.2.1 Analysis of impact on acoustical environment
4.2.1.1 Types of Noise Sources
The types of noise sources in the project construction period will be mainly noise from earthwork machinery during operation and traffic noise produced by vehicles on and outside of the site.
4.2.1.2 Noise Level at Noise Source
According to the construction content, the main construction equipment in the construction period will include shocks pile driver, electric saw, excavator, concreter mixer, and cranes, the noise level of which is above 75dB(A). The vehicles in the construction period will include heavy duty vehicles such as heavy duty lorries, tractors,
Shandong Academy of Environmental Science
60
EIA Report of 2×15MW Biomass Cogeneration Project
wheel loaders, and tippers. The noise of them is characterized by line source and moving, level of which is around 80~90dB(A). Refer to Table 4.2-1 for the noise level of all kinds of construction equipment.
Table 4.2-1 Major Noise Sources and their Noise Levels (Unit:dB(A))
Construction Equipment Noise Level Construction Equipment Noise Level
Pile Compactor 80~93 Bulldozer 80~90
Air compressor 75~88 excavator 78~96
Electric saw 85 Concrete mixer 82~98
vehicles 80~90 vibrator 85~90
Wheel loader 80~90 crane 85
Note: the data in the table are values measured 1.5m from the source.
4.2.1.3 Analysis of impact on acoustical environment
As construction is outdoor activity and the site usually has nil noise barrier or reduction measures, it brings requirement for strong construction management. In accordance to relevant regulations in Construction Site Noise Level Limit (GB12523-90), the standard limits for construction equipment on the site border are listed in Table 4.2-2.
Table 4.2-2 Predicted Result of Construction Noise Impact(Unit: dB(A))
No. Main EquipmentExtreme Noise
LevelAssessment Standard
Daytime Nighttime
1 Bulldozer 80~85 75 55
2 Excavator 78~96 75 55
3 Concrete Mixer 82~98 70 55
4 Pile Driver 80~93 85 Banned
5 Vibrator 85~90 70 55
6 Electric Saw 85 70 55
7 Crane 85 65 55
8 Air Compressor 75~88 75 55
9 Vehicles, tractors 80~85 70 55
In reference to the construction equipment noise impact of similar projects, it is known that the construction equipment noise impact range for the project is around 90m and 180m at daytime and nighttime respectively. As the project site is rectangle shaped with a length (south to north) 370m and width (east to west)210m, the noise impact of all the construction equipment can be contained in the site either in daytime or nighttime. The
Shandong Academy of Environmental Science
61
EIA Report of 2×15MW Biomass Cogeneration Project
site is 150m west to a sensitive object-Sanli Dianzi Village, so it is recommended to construct a noise barrier on the east border of the site to reduce the noise impact to the residents. Simultaneously, it is banned to carry out construction at night or lunch break time.
4.2.2 Analysis of impact on ambient air
4.2.2.1 Main Pollutant Source
The ambient air impact source during the construction period is mainly: a. site excavation and leveling, storage of temporary deserted soil and construction materials, and suspension of dust in windy weather; b. dust suspension caused by vehicles; and c. exhaust gas from the construction equipment and vehicles.
4.2.2.2 Analysis of impact on ambient air
The climate of the site is temperate continental seasonal semi-humid climate with obvious seasonal changes and seasonal wind. Every year, the prevailing wind is southeast wind, following by northwest and east wind. The four seasons have obvious own wind characteristics. In winter, it is usually north wind while when spring comes, the prevailing wind will change from north wind to south wind to southwest wind. In summer, it is noted for the south wind. In winter from September, the prevailing wind is changing from south wind to north wind. The windy weather may cause dust suspension on site. The situation is exacerbated by continuous rolling and disturbance of the site surface by vehicles, which will bring impact to the ambient air quality. Based on survey on similar projects, the impact range of dust suspension is confined generally to 50m to the work site. Therefore, the dust suspension will have little impact to the residents of surrounding areas (the nearest sensitive object is 150 meters away from the site to the east) if, simultaneously, control measures are taken, such as water spraying during excavation and windy conditions and on dust suspension prone area.
As the traffic on the main roads outside of the site is heavy, it is possible that serious traffic dust suspension will happen. Based on some analysis, the dust suspension concentration of the two sides of the roads used by construction material transportation vehicles can reach 8~10mg/m3, exceeding the 2nd grade requirements stated in Ambient Air Quality Standard (GB3095-96). The road dust suspension impact scope is usually between 50m on each side of the road. Based on site survey, the construction material routes are far from the villages; thus, they will have little impact on the sensitive objects on the roads. In order to minimize the impact, the transportation vehicles will be covered by awning and periodically cleaned.
During construction, all kinds of oil-based equipments and vehicles will produce exhaust gas, the composition of which is mainly CO and NOx. As the pollution source is scattered and the emission is relatively small daily, the impact will be minimal.
Shandong Academy of Environmental Science
62
EIA Report of 2×15MW Biomass Cogeneration Project
4.2.3 Analysis of impact on water environment
4.2.3.1 Analysis of impact on surface water
The wastewater during the construction period includes personal living water consumption, scrubbing water, and water for cleaning construction materials and equipment. Based on statistics, if the rate of personal living water consumption of each person is around 0.05m3/d per person, and the amount of construction workers are 100, the personal living water consumption per day is only 5m3/d. A septic tank can be built and the wastewater can be recycled for the site after precipitation.
As it requires a lot of water to flush the construction material, the water after precipitation will be collected and not drained. The water for ground flushing and equipment cleaning required is not large and the pollutants are small amount of petroleum and SS. It will be collected to be used for construction works or evaporated normally but not drained. Through the above analysis, the majority of the waste water during construction period will be recollected to be used in construction and the remaining part is mainly lost through evaporation. As it is not drained, it will not negatively impact on the surface water environment in the surrounding area.
4.2.3.2 Analysis of impact on ground water environment
The waste water from construction works inevitably has leakage problems and small amount of waste water will permeate underground. As it has less pollutants (mainly petroleum ones and SS), in permeation, after soil absorption and disintegration, it will have little impact to the ground water environment in the neighboring area.
4.2.4 Analysis of solid waste impact and its handling/treatment
The solid waste in the construction period is mainly construction debris and domestic waste. As majority of the excavated earthwork will be refilled and small amount of deserted soil will be used to expand site road or level the ground, there will be no deserted earthwork to be handled. The construction debris during the construction period include bricks and stones etc., which will be used for the foundation works for the main roads outside of the site. If the rate for the production of domestic waste is calculated at 0.5Kg/d per person, for 100 people, the daily production of domestic waste in the construction period is only 0.05t/d. They will be stored at designated places to be cleaned periodically by sanitary workers.
Through the above analysis, the solid waste for the project in the construction period is mainly construction debris and domestic waste, which will be stored at designated placed and handled by sanitary authorities. They are not to be drained or discharged outside, thus, they will have little impact to the surrounding environment.
Shandong Academy of Environmental Science
63
EIA Report of 2×15MW Biomass Cogeneration Project
4.2.5 Analysis of impact on ecological environment
1) Analysis of impact on flora
The construction work will involve excavation and refill of earthwork. When it is done in dry seasons, the dust suspension will fall on the leaves of agriculture crops and trees and impede the photosynthesis, causing reduction in agriculture output. Also, the crops and plants on both sides of the construction roads will be affected by dust suspension caused by vehicles with stunted growth. When the construction is done in rainy seasons, the rainwater will flush the loose soil to the surrounding fields around the site, causing swampy area covering the crops and plants and affecting their growth.
2) Analysis of impact on fauna
The activities of people and the equipment on site during the construction period will make the wild animals in the neighboring area scared though the impact is only confined to areas and for only a short-term. As the assessed area does not have precious wildlife, and major animals around the site are wildlife with great adaptability and poultry. During construction period, due to frequent human activities and great disturbance, the environment is not appropriate for animals. The birds and reptiles will temporarily move to surrounding areas. With the construction work coming to an end, the human disturbance to the animals will disappear. Therefore, the project will have little impact to animals during construction period. Though it might cause the distribution of the species of the area to be temporarily changed, it will not lower the diversity of the species of the area.
3) Analysis of impact on landscape
The landscape impact during the construction period is temporary reduction of green coverage mainly caused by reduction of vegetation and increase of naked surface. The proportion between the reduction of the vegetation and the landscape of Anqiu is small and with the completion and project and with the implementation of ecological measures, the green coverage will be gradually returned. Thus, the project will have little negative impact to the whole landscape to the region.
4) Analysis of impact to the South Main Canal
As the south main canal runs through the stalk storage field in the north of the site, during the construction period, the canal will be covered up with slabs and improvised. As on both sides the canal there are piles of deserted soil, so it is 1m higher than the ground level. In the improvising process, the soil will be used for leveling purpose. In addition, the surface of the internal canal and the bottom will be paved with stones, the process of which will involve excavation of small amount of soil for leveling purpose and will not produce deserted soil. Small amount of green coverage will be removed but it will not reduce the diversity of plant species.
Shandong Academy of Environmental Science
64
EIA Report of 2×15MW Biomass Cogeneration Project
The excavation in the construction period will destroy the land surface structure and change soil composition. The proposed site is mainly farmland with monotonous crops. The impact on the flora during the construction period is limited to the reduction of plant in patches and will not impact on the regional ecological environment.
As the area surrounding the site is mainly farmland and affected by agriculture practice, the site does not have large-sized wildlife but with only small amount of sparrows and insects; thus, the project will bring little impact to the animals in the surrounding areas.
4.2.6 Analysis of impact on water and soil loss
4.2.6.1 Water and Soil Loss Analysis
The scope of water and soil loss of the project is only limited to the proposed site which is a permanent occupation of land with nature of use for construction, and a total area of 75600m2.
The water and soil loss of the project is mainly caused by the construction in the construction period and based on the main works construction time, the proposed construction period is around 18 months.
4.2.6.2 Analysis on the Area of Disturbance to Original Landscape and Damage to Water Preservation Facility
The living area for the construction workers is located on site and during the construction, the disturbance to the landscape is mainly excavation of foundation for construction of site buildings and structure. The disturbance area of the project is therefore 75600m2. Currently, the site has been used as farmland and the water preservation measures are wheat crops and vegetable greenhouses. Therefore, the project will damage the water preservation area of 75600m2.
4.2.6.3 Disposed Earthwork Analysis
The total excavation amount of the project is around 12045m3 and landfill amount 10400m3. The remaining small amount of earthwork is used to broaden the roads on the sites or level of the ground.
4.2.6.4 Analysis of Possible Soil Loss
The current status of the site is farmland and during construction, the wheat and vegetable greenhouses will be removed, which will cause water and soil loss. If the soil erosion rate is calculated based on 2220t/km2·a, the soil loss during the construction period is around 167.8t, which is small.
4.2.6.5 Comprehensive Analysis of Impact on Water and Soil Loss
Shandong Academy of Environmental Science
65
EIA Report of 2×15MW Biomass Cogeneration Project
There is danger of water and soil loss in the project construction, which is reflected in two aspects: on one hand, the construction will cause violent disturbance to the surface, which artificially accelerates the soil loss and cause negative impact to the surroundings; on the other, in each construction area, if attention is not paid to the temporary preservation during construction, it will also accelerates the local water and soil loss, bringing negative impact to the local environment.
In order to ensure the smooth implementation of the project and minimize the water and soil damage to the greatest extent, the project will integrate plant preservation with management and implement protection to the water and soil resources during construction to realize sustainable development of the social economy.
4.2.7 Analysis on Pipeline Laying Environment Impact
The heating support pipeline network is mainly through overhead support with focus on medium and low height support. During laying of the network, they shall not be laid cross rivers or main roads or prosperous downtown area. Therefore, the laying of the heat supply network will bring little impact to the surrounding environment.
The drainage pipes will be extended from the site drainage pipeline network to the north for 1000m to get connected to the City Council drainage network. As the drainage pipe laid is not over long distance and pipes selected are corrosive-resistant ones with ant-corrosion treatment, the drainage water will not contact soil directly. In addition, as the soil around the pipes is compacted, the waste water in the discharge process will not permeate underground and affect the water quality. Therefore, drainage pipeline network laying will have little environment impact.
Water supply pipeline network is laid from Mushan Reservoir to east and along the south main canal to the site. As the laying distance is long, it will have impact to the ecological system in the surrounding area. The emphasis of the environment impact assessment is to give objective assessment to the ecological impact caused by the water pipeline laying work, and put forward practical ecological protection and recovery measures to the destruction caused by the construction and operation periods.
The ecological environment along the pipes is the results of long term interactions of all kinds of natural factors. The construction of the water supply network will disturb, crash and destroy the ecological environment. The laying of the water pipeline network brings high-strength, low frequency and linear disturbance. When the project is completed, the surface area along the pipeline is required to be returned to original state.
During construction, the factors that will impact on the ecological environment include: variations in soil composition or its physical chemical characteristics; pipeline laying land use (temporary land use); change of type of land by pipeline land use (permanent); and impact to the turfs and water and soil preservation.
4.2.7.1 Impact on Soil
Shandong Academy of Environmental Science
66
EIA Report of 2×15MW Biomass Cogeneration Project
1) Damage Soil Structure
Soil structure is a stable structure system that was formed after a long term of cultivation under local natural conditions and excavation will damage the original soil structure. The multi-layer and particulate characteristics of the soil are developed after a long term and recovery of them will require a long time once they are damaged.
2) Change in Soil Quality
The soil quality varies greatly from place to place and due to formation conditions. Even for the same soil, different sections have different qualities: the quality of the surface layer is very different from the bottom layer. The excavation and refill will mix the original layers. As when the soil is formed, it has clear layers, with surface layer as cultivation layer, medium layer as filtering and sediment layer and bottom layer is mother layer. Different types of soil have different physiochemical properties and thickness. The excavation and refill mixed the stable layered developed over time, which changed the soil quality.
3) Soil Compact
When the pipeline is being refilled, it is hard to return to its original compaction in a short time. Because the surface soil is loose, due to irrigation or rainfall, the water will permeate underground, causing the layer to go down and form swamp. When it is compacted too tight, it will affect the plant growth as the roots will be difficult to grow. During construction period, the vehicles and heavy duty machinery will cause the two sides of the pipelines to be too compacted, which will cause growth problems to the plants.
4) Impact of Temporary Land Use on Soil Environment
The temporary land use for the pipeline construction is mainly for the piling of excavated soil, storage of construction material, parking of construction equipment, residence for workers and activities. The temporary occupied land can basically be resumed but the rolling of construction equipment, stamping of working, disturbance of the soil and mixture of construction debris and waste water etc. all have relatively great impact to the physiochemical properties of the soil.
5) Impact on Soil Nutrients
The soil structure is composition of soil layers. Different layers have different characteristics and physiochemical properties. In regards to the nutrients, the surface layer is always better than core layer, as it has higher content of organic matter, whole nitrogen, efficient phosphorus, and efficient Kaliumm, appropriate concentration and air space, which brings higher cultivability. Construction activities will bring disturbance to the soil structure, affecting the nutrients distribution, even
Shandong Academy of Environmental Science
67
EIA Report of 2×15MW Biomass Cogeneration Project
causing deterioration of the soil quality. It will affect the plants grown on it and once damaged, it is hard to be returned.
In order to lower the nutrients impact, during pipeline construction, attention shall be paid to the measures for piling soil according to layers.
4.2.7.2 Analysis of Impact on vegetation
During construction, the vegetation of the excavation and piling area will all be damaged and the vegetation on both sides of the pipeline will be damaged to certain extent. The original vegetation in the excavation area and piling area will basically disappear and for the sides of the pipeline, due to the activities of equipment, vehicles and humans, will be slightly affected.
4.2.7.3 Impact To Endangered Species
1) Impact to Endangered Plant Species
As the pipeline works go through the area with long development history and frequent human activity, there are no endangered plant species. As pipeline work involves narrow excavation with narrow scope, the construction will not impact on endangered plant species.
2) Impact to Wildlife
The activities of workers and mechanical noise will have a certain impact on the wildlife (activities and habitat) on the site and its surrounding areas. However, the impact will only bring temporary migration of wildlife and they will migrate back when the construction is over.
4.2.7.4 Impact to People
The impact of construction of pipeline is mainly reflected by inconvenience in traffic, mechanical noise and dust suspension in excavation, as well as visual impact by construction. During construction, necessary measures shall be taken to minimize its impact to a certain scope.
The recommended measures mainly include: 1. sectional construction to minimize the construction scope; 2. signposts the construction area and isolate it with barriers; 3. construction time to be as per specified and avoid resting time of people; and 4. water spraying to avoid dust suspension in dry weather.
4.2.7.5 Analysis of Soil Erosion Impact
The soil erosion caused by pipeline construction mainly takes place in construction period. The excavation of ditches will inevitably damage the original stable surface layer, making it loose and producing certain area of naked ground, causing soil erosion. The water and soil loss caused by the construction basically disappears when the construction
Shandong Academy of Environmental Science
68
EIA Report of 2×15MW Biomass Cogeneration Project
work is done. In the operation period, when the vegetation surface is recovered, as long as the water and soil preservation measures are strictly followed, soil erosion will not be caused.
In water erosion area, civil engineering fabric cloth and bags can be used for covering the excavated earthwork and drainage channel shall be built temporarily to prevent water and soil loss. In wind erosion area, dry grass can be spread in the work area, with tree braches and sand as weight.
Above all, the laying of the water pipeline of the project will cause ecological problems such as the change in the flora and fauna variety, amount, water and soil loss, and soil erosion. Those problems will ease or end with the completion of the project and with appropriate ecological environment protection and recovery measures, the impact will gradually disappear.
Shandong Academy of Environmental Science
69
EIA Report of 2×15MW Biomass Cogeneration Project
Chapter 5 Environmental Impact Analysis of Operation Period
5.1 Environmental air impact prediction and assessment
5.1.1 Analysis on air pollution trend
1) Favorable factors: the landform around project area is open and easy for the diffusion and dilution of air pollutants. The directions of prevailing wind of accessed area are relative simple, which are SSE (occurrence frequency of 13.05%) and S. the downwind area is more likely to be polluted. Based on analysis of pollution coefficient and rose diagram of wind direction frequency, the area north to the pollution source may be polluted heavier that others. Therefore sensible receptors should be arranged at the east or west direction to the pollution source. The air mixed layer of the accessed area is relative high with an annual average value of 629.4m. it reaches its peak at spring, which is 838.7m and its height is 746.3m in weather of Stability Scale D. the high mixed layer make causes a relative large range for pollutants diffusion and dilution, favorable for rapidly reducing the pollutant concentration.
2) Adverse factors: occurrence frequency of days with calm wind breezy wind in accessed area in recent three years is 39.23%, which is adverse for diffusion and dilution of pollutant concentration at ground level. The temperature inversion occurrence frequency in this area is high with a long duration. It is adverse for diffusion of flue gas and easy to form a “temperature inversion fumigation” pollution phenomenon. Because stack height of the project to be built is 100m and the effective height of stack for raised gas height can be over 185m, and the emission of air pollutants is low, it is predicted that the fumigation phenomenon has little impact on the ambient environment with a short duration.
From the above, the regional pollution meteorological conditions are both favorable and adverse for air pollutants diffusion of the project to be built however the favorable factors prevail in general.
5.1.2 Environment Air Impact and Assessment
5.1.2.1 Organized waste gas
1) Control of waste gas pollution
2X75t/h sub high-temperature and sub high-pressure circulating fluidized bed
Shandong Academy of Environmental Science
70
EIA Report of 2×15MW Biomass Cogeneration Project
boilers are to be built for this project, with the waste gas mainly being SO2, flue gas and NO2, which after treated by bag type collectors with a dust removal efficiency of 99.9% is discharged through 100m stack.
2) Production and discharge of pollutants
The discharges of boiler flue gas and pollutants are calculated as follows:
a) Calculation of flue gas discharge
In which: -total flue gas volume, Nm3/a;-fuel consumption, t/a;-actual flue gas volume, Nm3/kg;-low thermal value limit of fuel, kJ/kg;-surplus air factor (taken as 1.2, provided by boiler manufacturer);
-theoretical air requirement, Nm3/kg;
-percentage contents of C, S, H, O elements within fuel.
b) Calculation of flue gas discharge
In the formula:
-flue gas discharge, t/h;-fuel consumption under continuous maximum output conditions of boiler, t/h;-dust removal efficiency, %;-as-received ash of fuel, %;- heat loss factor due to boiler mechanical incomplete combustion, %
(taken as 4%, provided by boiler manufacturer)
-low limit of as-received fuel thermal value, kJ/kg;
-ash carrying with boiler flue gas, % (taken as 80%, provided by boiler manufacturer)
c) Calculation of SO2 discharge
MSO2=2B×(1-q4)×St.ar×K
Shandong Academy of Environmental Science
71
EIA Report of 2×15MW Biomass Cogeneration Project
In which: MSO2-SO2 discharge, t/h;B- fuel consumption under continuous maximum output conditions of boiler, t/h; q4-heat loss factor due to boiler mechanical incomplete combustion, % (taken as 4%, provided by boiler manufacturer)St.ar-total as-received sulfur, %; K-percentage of fuel S oxidized into SO2, % (taken as 90%, provided by boiler manufacturer)
d) Determination of NOX discharging concentration
Since no actual NOX data are measured for this project, the NOX concentration is to be determined according to relevant test results.
The NOX products from combustion mainly include NO, NO2 and small amount of N2O, collectively referred to as NOX, whose production is mainly due to combustion temperature.
State Key Laboratory of Coal Combustion in Huazhong University of Science and Technology has made studies on NOx/N2O discharge from biomass fuel and coal mixture at different blending ratio. The main constituents of tested fuels are as Table 5.1-1 and Figure 5.1-1.
Shandong Academy of Environmental Science
72
EIA Report of 2×15MW Biomass Cogeneration Project
Table 5.1-1 Summary of main constituents of tested fuels
Fuel GL coal SM coal Wood chip
N% 1.18 0.90 0.21
Volatiles % 10.86 30.11 81.13
Note: GL coal and SM coal respectively represent two coals with different volatiles
Figure 5.1-1 Blending ratio of coal and wood versus NOX concentration
From the test results we can see that when the blending ratio of coal to wood ranges from 20:1 to 10:1, the discharge of NOX reduces by 8% to 11%; when the blending ratio of coal to wood ranges from 20:3 to 4:1, the discharge of NOX reduces by 17% to 31%, indicating that the NOX discharge from biomass is lower than that from coal; when the combustion temperature reaches 800 ºC, the higher the temperature is, the lower the effects of wood addition implies on weakening the discharge of NOX, indicating that when the combustion temperature reaches 800 ºC, the wood in fuel mixture has been combusted to a nearly complete extent; at the same blending ratio, the NOX discharge from GL coal is weakened to a lower extent than SM coal; at the blending ratio of 20:3 and the temperature of 800 ºC, the NOX discharge from GL coal is reduced by 17%, the NOX discharge from SM coal is reduced by 11%, which indicates that the higher the volatiles content is, the lower the combustion temperature is, and the lower the NOX concentration is.
In this project, the Vdaf of wheat stalk and that of corn stalk are respectively 80.12% and 81.11%, and both fuels are completely combusted at 800 ºC, therefore the NOX discharge concentration will be determined based on the test results at 800 ºC conditions. When the SM coal and wood are blended at a ratio of 10:1, the N content is about 0.9%, the N ar of wheat stalk and that of corn stalk are respectively 0.28% and 0.56%, the N contents of the two fuels are respectively about 0.3 and 0.6 times of that of the mixture of the two fuels at a ratio of 10:1.
The NOX concentration for this project is to be determined based on the test results obtained by using the blending ratio of SM coal to wood of 10:1 and a temperature of
Shandong Academy of Environmental Science
NO
X C
once
ntra
tion
/ 10
NO
X C
once
ntra
tion
/ 10
Effects of GL coal and wood mixture on NOX discharge Effects of SM coal and wood mixture
on NOX discharge
73
EIA Report of 2×15MW Biomass Cogeneration Project
800ºC, under which conditions the test result is about 170mg/m3. By adopting wheat stalk and corn stalk at any ratio as the fuel for this project, the volatiles content is high, the fuel can be easily combusted, the combustion temperature is relatively low and the nitrogen oxide concentration would be lower than the test results. Considering the difference between combustion in test equipment and actual boiler operation, the NOX concentration for this project is conservatively determined as 200 mg/m3.
The main atmospheric effluents and the specified standards are shown in Table 5.1-2.
Shandong Academy of Environmental Science
74
EIA Report of 2×15MW Biomass Cogeneration Project
Table 5.1-2 Atmospheric effluents and specified standards
Fuel
Flue gas
discharge
(Nm3/h)
Main
effluents
Amount to be
producedDust removal
measures and
efficiency
Amounts to be
dischargedAnnual
discharge
(t/a)
Applicable standard
Allowable
discharge
concentration
(mg/m3)
Up to
standard
or not
Remarks
mg/Nm3 kg/h mg/Nm3 kg/h
Wheat
stalk162586
SO2 213.2 34.67
The dust
removal
efficiency of bag
type collector:
99.9%
213.2 34.67 208.0
Thermal Power Plant
Atmospheric Emission
Standard
(Shandong provincial
standard DB37/664-
2007)
Phase 3
400 YesStack height:
100m
Internal
diameter at
outlet: 2.8m
Flue gas
temperature at
outlet: 120 ºC
Flue
gas15971.5 2597 15.97 2.597 15.582 50 Yes
NO2 200 32.52 200 32.52 195.12 400 Yes
Corn
stalk161652
SO2 242.9 39.28 242.9 39.28 235.7 400 Yes
Flue
gas8528.6 1379 8.53 1.379 8.274 50 Yes
NO2 200 32.33 200 32.33 193.98 400 Yes
Shandong Academy of Environmental Science
75
EIA Report of 2×15MW Biomass Cogeneration Project
From the above table it can be seen that, after this project is put into operation, the discharge concentrations of flue gas, SO2 and NOX can fully meet the Thermal Power Plant Atmospheric Emission Standard (Shandong provincial standard DB37/664-2007) Phase 3: in case of using wheat stalk as the only fuel, the annual discharges are respectively as follows: flue gas 15.582 t, SO2 208.0 t, NO2 195.12 t; in case of using corn stalk as the only fuel, the annual discharges are respectively as follows: flue gas 8.274 t, SO2 235.7 t, NO2 193.98t.
5.1.2.2 Waste gas under abnormal conditions
Bag filters with dust removal efficiency of 99.9% are to be adopted for this project. The functions of them rely on the filter films within four filter chambers for collecting dust from flue gas, therefore the dust removal efficiency depends on filter film, which may leak during long-term operation and thus reduce dust removal efficiency.
If the bag filters are faulty, the dust removal efficiency would be reduced and is to be considered as 80% in such case for determining the discharges of main pollutants, as shown in Table 5.1-3.
Table 5.1-3 Flue gas discharge under faulty conditions
Pollutant
Condition
Dust removal
efficiency (%)
Discharge concentration
(mg/m3)
Discharge flow rate
(kg/h)
Stack height
(m)Notes
Flue gasDischarge
under faulty condition
80 3194.3 519.4 100Failure of bag filter
5.1.2.3 Foul gas
Foul gas may result from long-term impregnating in water (NH3, H2S, methanthiol etc.). The stalk for this project after arrival will be stored temporarily at storage yard with a length of 193m and width of 144m as 8 piles at a spacing of 16m, the storage yard has a cover at the top, flashing boards under beams and 1m high enclosing walls. The fuel will be stored in storage yard and shed for a short term to meet 18 days of demand. The shed also has a cover at the top, flashing boards under beams and 1m high enclosing walls. Effective measures are to be taken for storage yard and shed to avoid stalk from being wet by rainfall and prevent rainfall from entering therein, additionally, the well ventilation shall be guaranteed to prevent spontaneous combustion of methane resulting from stalk storage and avoid stalk from getting mildewed. Generally, the storage measures to be adopted for this project would not result in foul gas from mildewed stalk.
5.1.2.4 Unorganized discharge of waste gas
Shandong Academy of Environmental Science
76
EIA Report of 2×15MW Biomass Cogeneration Project
The unorganized discharge is mainly used for discharging small amount of dust from temporary slag and ash house, fuel crushing and delivering processes.
Automatic pulsed back flushing type bag filters are to be arranged at the top of temporary slag and ash yard for purifying ash carried with air, the ash and slag are to be transported by closed tank truck, and the dust escaped during loading and unloading is to be cleaned timely to avoid spreading thereof.
Through the above measures, the dust rising from temporary slag and ash yard only has little effects on ambient environment.
Crusher room is arranged at fuel crushing section, with air exhausting and dust removing devices disposed in the room. The dust produced by crusher will be exhausted by air fans to bag filters for filtering and then discharged; during fuel transportation, the dust is to be reduced by spraying water and periodic cleaning to avoid dust from polluting environment.
The dust produced by fuel crushing section after collected by bag filter with efficiency of 99.9% is to be directly emitted from the filter outlet at low dust emission, therefore the non-organized dust discharge mainly refers to the dust emitted from bag filter outlet and those from fuel transportation, which may be considered as 0.1% of maximum turnover for determining the annual dust discharge as 201t/a. Considering the effect of foul gas, the atmospheric environment protection distance of storage yard and shed is to be determined as 100m.
By adopting the above pollutant control measures, and considering the effects of unorganized discharge and foul gas, the atmospheric environment protection distance is determined as 100m away from the most sensitive target nearest to the power plant to be built – Sanlidianzi village, and 150 m away from the plant site. It can be seen that no sensitive target is present within the area covered by such protection distance.
Therefore, the dust produced during fuel storage, crushing, and transporting may have little effects on ambient environment.
5.1.2.5 Ground concentration prediction
1) Items and contents of prediction
a) Items: SO2, NO2, PM10 and TSP.
b) Objective: impact on the environment by the project to be built; change of concentration after the operation of project and shutdown of other boilers in this accessed area.
c) Contents:
i) based on the meteorology information measured by the Anqiu weather
Shandong Academy of Environmental Science
77
EIA Report of 2×15MW Biomass Cogeneration Project
station in 2006, calculate the predicted concentration values under all joint meteorological conditions of all concerned points (air temperature, atmos, wind direction, wind speed, stability).Then get the maximum hourly concentration of concerned points by sorting. Calculate the maximum ground concentration under various stability scales in windy weather, and then predict the impact degree and range on the SO2, NO2 hourly average concentration and maximum fumigation concentration of accessed area and concerned points by the wind, calm wind and breezy wind weather.
ii) Calculate 356 days’ daily average concentration value of all concerned point and the get the maximum daily average concentration contribution of SO2, NO2, PM10 and the draft maximum daily average concentration scattergram.
iii) according to local wind direction, wind speed and stability joint frequency, predict annual average concentration contribution of SO2, NO2 and PM10
emission and draft annual average concentration scattergram.
iv) Demonstration on rationality of the 100 m stack height of the project to be built.
v) Calculation substitution effect of SO2, NO2, TSP after operation of project.
2) Prediction method
Select a suitable method according to prediction assessment grade, range and pollution source parameters and based on measured meteorological information. Taking the stack of project to be built as the coordinate origin and setting griding range as 6km×6km with an interval of 100m, calculate hourly, daily and annual average concentration on 3721 nodes (61×61) and three assessing points.
5.1.2.6 Prediction results of air pollutant concentration of project to be built
1) Prediction results of the contribution by the project to be built to the hourly peak concentration at accessed area and assessing points
Based on daily meteorological data of 2006 measured at Anqiu weather station, calculate SO2, NO2hourly maximum, absolute maximum ground concentration and occurring distance in case of windy weather, calm and breezy weather. And calculate the predicted concentration under all joint meteorological conditions for each point (air temperature, atmos, wind direction, wind speed, Stability). Hourly peak concentrations of concerned points can be obtained. Predict the concentration under adverse conditions such as temperature inversion fumigation and analyze the impact range and degree. Calculation results are shown in Table 5.1-27~5.1-30.
a) hourly absolute maximum SO2, NO2 ground concentration and occurring distance under typical wind speeds of various stability scales in case of windy
Shandong Academy of Environmental Science
78
EIA Report of 2×15MW Biomass Cogeneration Project
weather
hourly absolute maximum SO2, NO2 ground concentrations under typical wind speeds of various stability scales in case of windy weather are respectively 0.0199mg/m3 and 0.0164mg/m3(Stability scale A, wind speed of 1.6m/s, distance of 700m, occurring time is June 4, 13:00). According to the secondary standard of Ambient air quality standard (GB3095-1996), the Max. Concentrations account 3.98% and 6.83% of their relative standard values. Hourly maximum ground concentration contribution is lower than assessing standard.
b) Temperature inversion fumigation axial concentration in case of calm and breezy wind
In case of lm and breezy wind, absolute maximum SO2 and NO2 ground concentration are respectively 0.0195mg/m3 and 0.0160mg/m3(Stability Scale A; wind speed of 0.9m/s; distance of 100m, time is July 5, 11:00) accounting 3.90% and 6.67% of the standard values specified in Ambient Air Quality Standard (GB3095-1996). The hourly maximum ground concentration contribution is lower than assessing standard value. In case of temperature inversion fumigation, in the range with a distance of 512~1998 m to source, ground concentrations of SO2 and NO2 are relative high. Under the weather condition of stability scale E, wind speed of 2.0m/s and fumigation, the SO2, NO2 fumigation concentration reach the maximum at a distance of 512m to the source, which are respectively 0.1045mg/m3 and 0.0860mg/m3, accounting 20.90% and 35.83% of the secondary standard value specified in the Ambient air quality standard (GB3095-1996). Values of SO2 and NO2 are both within limit.
Table 5.1-4 Maximum ground concentration (mg/m3) of SO2, NO2 and occurring distance (m)
Wind speed
ConditionStability
Wind
speed
(m/s)
Atmos
(hpa)
Air
temperature
(ºC)
Distance
(m)
So2 peak
concentration
(mg/m3)
No2 peak
concentration
(mg/m3)
Date
Max.
ground
concentration
A 1.6 998.5 30.4 700 0.0199 0.0164 June 4, 13:00
B 2.5 994.7 35.5 1400 0.0123 0.0101 June 27, 14:00
C 2.4 998.7 35.0 2600 0.0098 0.0081 June 20, 14:00
D 2.4 999.2 33.4 4300 0.0068 0.0056 Aug.11, 14:00
E 1.5 990.9 27.9 4700 0.0030 0.0025 June 15, 19:00
F 1.5 998.8 26.9 6100 0.0022 0.0018 Aug.7, 19:00
Max. absolute
valueA 1.6 998.5 30.4 700 0.0199 0.0164 June 4, 13:00
iii) Hourly absolute maximum concentration and rising condition of assessing points
Shandong Academy of Environmental Science
79
EIA Report of 2×15MW Biomass Cogeneration Project
Among assessing points, the maximum hourly concentration of SO2, NO2 at 2# Sanlidianzi are the highest, respectively 0.0165mg/m3 and 0.0136mg/m3, accounting 3.30% and 5.67% of standard values. Their hourly maximum ground concentration contribution is far lower than standard. hourly peak concentration at assessing points are all within limit .
Table 5.1-5 peak concentration of SO2 and NO2 (mg/m3) and rising distance (m)
Assessing
points
Directio
n
Distanc
e
(m)
Time (2006)Wind
direction
Wind
speed
Stabilit
y
Atmos
(hpa)
Air
temperature
(ºC)
Peak
concentration
(mg/m3)
So2 No2
1#Daweiyuan SE 3000 July 20, 9:00 NW 2.3 C 995.5 23.8 0.0087 0.0072
2#Sanlidianzi E 150 May14,13:00 W 2.2 A 1006.5 26.7 0.0165 0.0136
2) Prediction of daily average concentration of SO2, NO2, PM10
The prediction method is determined based on the daily measured data of 2006 by Anqiu weather station and according to the recommended typical day selection method by the Environmental Impact Assessment Training Materials (prepared by State Environmental Protection Administration in 2000) .Calculate the daily average concentration of each assessing point and sort the values to get the 100% maximum cumulative frequency day based on daily data of 2006. Then the maximum daily average concentration related to this frequency is the typical daily average concentration of concerned point. Four typical days are determined for this assessment as shown in Table 5.1-31.
Table 5.1-8 Typical days and meteorological conditions at assessing points
Stability D D D D D D D D D B B B C C B C D D E E D D D D
Shandong Academy of Environmental Science
83
EIA Report of 2×15MW Biomass Cogeneration Project
The maximum daily average concentration of SO2, NO2, PM10 at assessing points and whole accessed area is shown in Table 5.1-9.
The maximum daily average concentration of SO2, NO2, PM10 at whole accessed area project to be built are respectively 0.0048mg/m3, 0.0040mg/m3, 0.00017mg/m3, accounting for 3.20%, 3.33%, 0.11% of the secondary limits specified by the Ambient air quality standard. Obviously, daily average concentration of SO2, NO2, PM10 at assessing points will not exceed the limit.
Table 5.1-9 daily average concentration contribution of SO2, NO2, PM10 (mg/m3)
3) Annual average concentration contribution of SO2, NO2, PM10
Annual average concentration distribution diagram of SO2, NO2, PM10 of the plant to be built is shown in Figure 5.1-1. Annual average concentration of SO2, NO2, PM10 at assessing points and whole accessed area is shown in Table 5.1-10.
Maximum annual average concentration of SO2, NO2, PM10 at assessed area are respectively 0.0021mg/m3, 0.0017mg/m3 and 0.00007mg/m3, accounting for 3.20%, 3.33%, 0.11% of the secondary limits specified by the Ambient air quality standard. Obviously, daily average concentration of SO2, NO2, PM10 at assessing points will not exceed the limit.
Table 5.1-10annual average concentration contribution of SO2, NO2, PM10 for the project to be built
Based on calculation of regional substitute pollution source concentration, variations of pollutant concentration after operation of project in the accessed area can be obtained.
SO2, NO2, TSP concentration variation = added value of concentration - substitute pollution source concentration contribution
If concentration variation is positive, it means that the pollutant concentration value after operation of project accessed area will be higher than current concentration. Otherwise, it will be lower than current value.
1) Variation of hourly environmental air pollutants peak concentration after operation of project in accessed area
hourly peak concentration variation of SO2, NO2 at assessing points after operation of project is shown in Table 5.1-12. Hourly concentrations of SO2 and NO2 at assessing points are all significantly improved. Variation of SO2 hourly concentration is between -0.0235 mg/m3~-0.0408mg/m3; variation of NO2 hourly concentration is between -0.0105mg/m3~-0.0175mg/m3.
Shandong Academy of Environmental Science
86
EIA Report of 2×15MW Biomass Cogeneration Project
Table 5.1-12 Hourly pollutant concentration variation of assessing points after operation of project
2) Variation of daily average environmental air pollutants concentration in accessed area after operation of project
Accessed area variation of daily average SO2 concentration after operation of project is shown in Table 5.1-13. After operation of project, daily average concentrations of SO2, NO2, TSP at assessing points improve significantly. variation of daily average SO2 concentration is between -0.0172mg/m3~-0.0319mg/m3; variation of daily average NO2 concentration is between -0.0069mg/m3 ~ -0.0168mg/m3; variation of daily average TSP concentration is between -0.0112mg/m3 ~ -0.0211mg/m3. The substitute effect is obvious.
Table 5.1-13Variation of daily average pollutant concentration at assessing points after operation of project
3) Variation of annual average environmental air pollutants concentration in accessed area after operation of project
Shandong Academy of Environmental Science
87
EIA Report of 2×15MW Biomass Cogeneration Project
Variation of annual average SO2, NO2, concentration in accessed area after operation of project are shown in Figure 5.1-9. Variation of annual average SO2, NO2, TSP concentration at assessing points after operation of project are shown in Table 5.1-14. After operation of project, annual average SO2, NO2, TSP concentration at assessing points all improve significantly. Variation of annual average SO2 concentration is between -0.0150 mg/m3~-0.0266mg/m3; Variation of annual average NO2 is between -0.0056 mg/m3 ~-0.0110mg/m3; Variation of annual average TSP is between -0.0081 mg/m3 ~-0.0140mg/m3.
Table 5.1-14Variation of annual average pollutant concentration at assessing points after operation of project
5.1.2.8 Prediction and assessment of environmental air quality
According to examination result of current environment air quality and foresaid prediction result, a single factor index method is adopted for superposition calculation of concentration and assessment of the impact range and degree to the ambient environmental air by the project, as well as environment effect to the air quality.
1) Assessing factors: SO2, NO2, TSP
2) Assessing standard : secondary standard of Ambient air quality standard (GB3095-1996)
3) Assessment on hourly concentration impact
Assessing result of hourly concentration impact is shown in Table 5.1-15.
Current value: current maximum hourly monitoring concentration of SO2, NO2 of the project to be built are respectively 0.085mg/m3 and 0.046mg/m3, accounting 17.00%, 19.17% of the values specified by relative standards. No current hourly concentration value at assessing points exceeds limit.
Shandong Academy of Environmental Science
88
EIA Report of 2×15MW Biomass Cogeneration Project
Superposed value: project to be built SO2, NO2 hourly concentration max. Superposed values are respectively 0.0440mg/m3 and 0.0300mg/m3, accounting 8.80% and 12.50% of standard values. Hourly concentration superposed value assessing points are all within limit.
Table 5.1-15 Impact assessment on hourly SO2, NO2 concentration (mg/m3)
Pollutant Assessing points
Concentration
variation
(mg/m3)
Current value(mg/m3) Superposed value (mg/m3)
Max.
Current
value
Ratio to
standard
value
Overlimit
Max.
Superposed
value
Ratio to
standard
value
Overlimit
SO2
1#Daweiyuan -0.024 0.032 0.0640 no 0.0080 0.0160 no
2#Sanlidianzi -0.037 0.028 0.0560 no -- -- no
3# Sanlizhuang -0.041 0.085 0.1700 no 0.0440 0.0880 no
4# Anqiu No.1
middle school-0.030 0.035 0.0700 no 0.0050 0.0100 no
NO2
1#Daweiyuan -0.011 0.038 0.1583 no 0.0270 0.1125 no
2#Sanlidianzi -0.016 0.046 0.1917 no 0.0300 0.1250 no
3# Sanlizhuang -0.018 0.033 0.1375 no 0.0150 0.0625 no
4# Anqiu No.1
middle school-0.012 0.035 0.1458 no 0.0230 0.0958 no
4) Impact assessment on daily average concentration
Daily average concentration impact assessing results are shown in Table 5.1-16.
current value: currently monitored maximum daily average SO2 and NO2
concentration are respectively 0.043mg/m3 and 0.031mg/m3, accounting to 28.67% and 25.83% of standard values. Current daily average SO2, NO2 concentration values at all assessing points meet standard requirements. Currently measured maximum daily average TSP concentration of 3# Sanlizhuang is 0.303mg/m3,accounting to 101.00% of standard value exceeding limit while no value of other points exceed limit.
Superposed value: maximum daily average SO2, NO2, TSP concentration superposed value of the project to be built are respectively 0.0111mg/m3, 0.0201mg/m3 and 0.2819mg/m3, accounting 7.40%, 16.75%, 93.97% of standard values. Daily average SO2, NO2, TSP concentration superposed value of all assessing points meet standard requirements.
Shandong Academy of Environmental Science
89
EIA Report of 2×15MW Biomass Cogeneration Project
Table 5.1-16 Impact assessment on daily average SO2, NO2, TSP concentration (mg/m3)
Pollutant Assessing points
Concentration
variation
(mg/m3)
Current value(mg/m3) Superposed value (mg/m3)
Max. Current
value
Ratio to
standard
value
Over
limit
Max.
Superposed
value
Ratio to
standard
value
Over
limit
So2
1#daweiyuan -0.0172 0.022 0.1467 No 0.0048 0.0320 No
2#Sanlidianzi -0.0308 0.017 0.1133 No -- -- No
3# Sanlizhuang -0.0319 0.043 0.2867 No 0.0111 0.0740 No
4# Anqiu No.1 middle
school-0.0214 0.022 0.1467 No 0.0006 0.0040 No
No2
1#daweiyuan -0.0069 0.027 0.2250 No 0.0201 0.1675 No
2#Sanlidianzi -0.0153 0.031 0.2583 No 0.0157 0.1308 No
3# Sanlizhuang -0.0168 0.021 0.1750 No 0.0042 0.0350 No
4# Anqiu No.1 middle
school-0.0102 0.026 0.2167 No 0.0158 0.1317 No
Tsp
1#daweiyuan -0.0112 0.282 0.9400 No 0.2708 0.9027 No
2#Sanlidianzi -0.0198 0.277 0.9233 No 0.2572 0.8573 No
3# Sanlizhuang -0.0211 0.303 1.0100 Yes 0.2819 0.9397 No
4# Anqiu No.1 middle
school-0.0134 0.269 0.8967 No 0.2556 0.8520 No
5.1.2.9 Rationality demonstration of stack height
The project to be built adopts 100m stack and the stack height satisfies the following requirements:
1) Clause 5.6.2 in the GB/T13201-91: “height of gas stack of plants and factories should not be higher than two times of the height of auxiliary building”. The highest building in the plant area is 25m. The stack height is qualified.
2) Clause 5.6.3 in the GB/T13201-91: “when buildings required protection exist around stack, the final stack height should be added a height of 2/3 of the average height of buildings”. The highest building in the plant area is 25m. The stack height is qualified.
3) Maximum concentration of indicating pollutants (SO2, NO2) in the accessed area should meet requirements of environment quality standard. The prediction of environmental air indicates that absolute maximum SO2, NO2 ground concentrations of the project to be built are low.
4) Impact of SO2, NO2 to the environment should be less than the difference between environment quality standard limit and current concentration, i.e. there should be environmental margin after operation of project. It is predicted that hourly, daily and yearly average SO2 and NO2 concentration superposed values will not exceed limit
Shandong Academy of Environmental Science
90
EIA Report of 2×15MW Biomass Cogeneration Project
after operation of plant.
5) Whether the maximum ground concentration point is at sensitive area: all stable absolute maximum ground concentration points are not with the range of 500 m to the 4# Assessing points-Anqiu No.1 middle school (maximum ground concentration occurs at a distance about 700m under Stability scale A). After operation, project has a low hourly, daily and yearly average contribution rate to the pollutants at 4# assessing point-Anqiu No.1 middle school.
To sum up, it is reasonable to choose a 100m stack for the project to be built.
5.1.3 Conclusion
1) Pollutants emission contribution of the project to be built to hourly, daily and yearly average concentration is very low. Its contribution of SO2 and NO2 to hourly absolute maximum ground concentration of accessed area are respectively 0.0199mg/m3
and 0.0164mg/m3. Maximum daily average concentration value of SO2, NO2 and PM10 are respectively 0.0048mg/m3, 0.0040mg/m3 and 0.00017mg/m3. Maximum yearly average concentration value of SO2, NO2 and PM10 are respectively 0.0021mg/m3, 0.0017mg/m3 and 0.00007mg/m3, which meet requirement and have a low ratio to standard value. Pollutant concentrations at assessing points are all qualified. In case of fumigation, maximum ground concentrations of SO2 andNO2 are high but within limit.
2) After operation of project, the hourly, daily average, yearly average concentration of SO2, NO2 and TSP at assessing points will drop. Hourly concentration of SO2 will drop 0.0235mg/m3~0.0408mg/m3, daily average concentration will drop 0.0172 mg/m3~0.0319mg/m3 and yearly average concentration will drop 0.0150mg/m3
~0.0266mg/m3. Hourly concentration of NO2 will drop 0.0105mg/m3~0.0175mg/m3, daily average concentration 0.0069mg/m3~0.0168 mg/m3, and yearly average concentration 0.0056mg/m3 ~0.0110mg/m3. Daily average concentration of TSP will drop 0.0112mg/m3~0.0211mg/m3, and yearly average concentration will drop 0.0081mg/m3~0.0140mg/m3. The replacing effect is obvious and the environmental air quality will improve.
3) Assessing result of concentration prediction and superposition indicate that: max. Hourly concentration superposed value of SO2, NO2 of the project to be built are respectively 0.0440mg/m3 (3# Sanlizhuang) and 0.0300mg/m3 (2# Sanlidianzi). Max. daily average concentration superposed value of SO2, NO2 and TSP are respectively 0.0111mg/m3 (3# Sanlizhuang ), 0.0201mg/m3 (1#Daweiyuan ) and 0.2819mg/m3 (3# Sanlizhuang ). Pollutant concentrations at all assessing points meet requirements.
4) It is reasonable for the project to be built to build a stack of 100m and the environmental protection requirements can be satisfied.
Shandong Academy of Environmental Science
91
EIA Report of 2×15MW Biomass Cogeneration Project
To sum up, in consideration of environmental air impact, the construction of this project is feasible.
Figure 5.1-2 Variation diagram of yearly average concentration of TSP after operation of project
5.2 surface water environmental impact analysis
5.2.1 Feasibility of discharging water into sewage treatment plants
1) Introduction of sewage treatment plant
Anqiu sewage treatment plant is located at Jiage Street of Anqiu, the joint of Wenhe River and Moxi River. It is planned and to be constructed by Anqiu Construction Bureau; Anqiu sewage treatment plant is approved by Decree of the State Council [2001] No.124 and was listed into the Clean Bohai Sea Action Plan. It was primarily designed by the Chinese Research Academy of Environmental Sciences and passed the acceptance test organized by Shandong Environment Protection Bureau on June 16, 2005. Online monitoring devices have been installed in sewage treatment plant; the plant area(built) covers 86.4 Mu with a sewage treating capacity of 60 000m3/d. Biolak centenary suspension sewage treatment process is adopted with a total investment of RMB 77 100 000.
According to Anqiu regional development plan and based on current sewage collecting pipe network and layout of enterprises, the service range of sewage treatment plant is defined to treat the domestic and industrial sewage from urban area, and not to treat that from newly built economic – technical development zone and industrial area. Quality of discharged water from Anqiu sewage treatment plant is drained to Wenhe River when reaching national secondary emission standard, to
Shandong Academy of Environmental Science
93
EIA Report of 2×15MW Biomass Cogeneration Project
make up Wenhe River water supply; discharge water from sewage treatment plant flow to Bohai Sea through Wenhe River and then Weihe River. Discharge port of sewage treatment plants belongs to the mixed function and irrigation zone, therefore, category V water quality standard I applied.
According to the approval by Department of Environment Protection of Shandong Province to the environment impact report of Anqiu sewage treatment plant project (Luhuanfa [2002] No. 223), secondary standard of sewage comprehensive emission standard(GB8978-1996) is applied to Anqiu sewage treatment plant. Along with the issuing of new standards, the secondary standard of Urban Sewage Treatment Plant Pollutant Emission Standard (GB18918-2002) is required to apply to Anqiu sewage treatment plant to meet the requirement of surface water function layout.
State Environmental Protection Administration puts forward requirements to urban sewage treatment plants requiring their discharged water to reach first B standard of Urban Sewage Treatment Plant Pollutant Emission Standard (GB18918-2002). Therefore, Anqiu sewage treatment plant has to be reformed. The reform is under construction including adding mechanical mixing reaction pool, horizontal flow type grit chamber and related design of flow return system of reaction pool. The improve plant will be put into operation by the end of 2009.
2) Treatment process and design indicators
Treating process of sewage treatment plant is shown in Figure 5.2-2.
Figure 5.2-1 process flowchart of Anqiu sewage treatment plant
Shandong Academy of Environmental Science
Coa
rse
grid
ing
格 栅P
ump
stat
ion
Fine
grid
ing
Vorte
x gr
it ch
ambe
r
Ana
erob
ic p
ool
aera
tion
tank
Cla
rific
atio
n gr
idin
g
池 Sta
biliz
atio
n po
ol
Inlet Outlet
Mud return
Concentrating pool
Dewater Mud left
Transportation of mud
94
EIA Report of 2×15MW Biomass Cogeneration Project
Designed water quality indexes of Anqiu sewage treatment plant and pollutant removing efficiency are shown in Table 5.2-8.
Table 5.2-1 Designed intake and outlet water quality of sewage treatment plants
(mg/l, pH value non-dimensional )
Item pH CODcr BOD5 SS TP NH3-NIntake water 6-9 500 170 310 2.0 30Outlet water 6-9 100 30 30 1.0 15removal rate % - 80 82.4 90 50 50GB18918-2002 secondary standard 6-9 100 30 30 1.0 15
From above table, quality of discharged water from Anqiu sewage treatment plants can reach the secondary standard requirements of Urban Sewage Treatment Plant Pollutant Emission Standard (GB18918-2002).
Online monitoring data of Anqiu sewage treatment plants during April 1 2008-July15,2008 is also collected. The COD concentration range of discharged water is 50.66-100mg/l, and the average value is 79.4mg/l; ammonian concentration range is 0.18-1.93mg/l and average value is 0.78mg/l. therefore, values of COD and ammonian of discharged water can meet the secondary standard of Urban Sewage Treatment Plant Pollutant Emission Standard (GB18918-2002).
3) Feasibility and reliability discharging water to sewage treatment plants
a) city sewage pipe network
The project to be built is 11km about away from sewage treatment plant. Its sewage pipe network has been routed to the spot 1000m to the project site. Construction company will route sewage pipe work to city sewage pipe network. Waste water from power plant enters sewage treatment plant by city sewage pipe network. It is reliable in consideration of city sewage pipe network.
b) Schedule suitability
Power plant project is planned to put into operation in May 2011 while Anqiu sewage treatment plant is built up in Oct. 2004. it is being reformed to meet new national standards. The reform is under construction including adding mechanical mixing reaction pool, horizontal flow type grit chamber and related design of flow return system of reaction pool. The improve plant will be put into operation by the end of 2009. Waste water from power plant enters sewage treatment plant by city sewage pipe network. It is reliable in consideration of schedule.
Shandong Academy of Environmental Science
95
EIA Report of 2×15MW Biomass Cogeneration Project
c) Water quality and volume
Project site is within the working range of Anqiu sewage treatment plant. Daily treating capacity of Anqiu sewage treatment plant is 35000 m3/d with a margin of 25000 m3/d while the waste water emission of project to be built is 34.32m3/d. therefore Anqiu sewage treatment plant has far enough capacity to treat waste water from project to be built; quality emission standard of discharged waste water can meet relative requirements of sewage treatment plants; the discharge water quality of improved sewage treatment plants will meet the first B standard of Urban Sewage Treatment Plant Pollutant Emission Standard (GB18918-2002). Waste water from plant project enters sewage treatment plants by city sewage pipe network. It is feasible in consideration of water quality and volume.
To sump up, in consideration of city sewage pipe network, schedule suitability, water quality and volume, It is reliable and feasible for waste water from power plant entering sewage treatment plant by city sewage pipe network.
5.2.2 Surface water environmental impact analysis
5.2.2.1 Wastewater source and quantity
The wastewater includes wastewater from production and sanitary wastewater, with the wastewater from production mainly being circulated wastewater, oil-containing wastewater from equipment cooling system etc, and the sanitary water mainly being scrubbing water and toilet flushing water from plant area. The wastewater is produced at a quantity of 68.16m3/h.
5.2.2.2 Wastewater disposing measures
1) Sanitary wastewater and disposing facilities
The personal living water consumption is to be calculated as 150L/day, thus the total living water consumption of 106 persons for this project is to be 0.7m 3/h, and the sanitary wastewater quantity is taken to be 80% of living water consumption and thus calculated as approximately 0.56m3/h. The sanitary wastewater after precipitated in septic tank is to be drained to Anqiu city sewage water treatment plant.
2) Wastewater from production and disposing measures
a) Industrial wastewater
The industrial water is to be produced at a quantity of 24m3/h, mainly including acidic/basic wastewater from chemical treatment system of 23m3/h and oil-containing wastewater from equipment cooling system of 1m3/h. Part of the acidic/basic wastewater after neutralized is to be used for road spraying,
Shandong Academy of Environmental Science
96
EIA Report of 2×15MW Biomass Cogeneration Project
wetting ash and slag, and reducing dust during fuel transportation, the other part will be drained to rainfall pipe network in plant area; the oil-containing waste water after oil isolation will be drained Anqiu city sewage water treatment plant. The detailed treatment process is shown in Figure 5.2-2.
Figure5.2-2 Treatment process flow chart of wastewater from production
b) Drainage from circulated cooling water system
The drainage is produced at a quantity of 43.6 m3/h, and as clean drainage it can therefore be drained directly to the rainfall pipe network in plant area.
5.2.2.3 Drainage of wastewater and destination
1) Drainage of wastewater and destination
The drainage system of this project is arranged by adopting the principles of Separating Fresh Water From Wastewater and Separating Rainfall From Wastewater, with two wastewater collecting systems and independent pipe networks therefor disposed respectively for rainfall collection in plant area and for production and sanitary wastewater collection, and the wastewater will not be drained into southern trunk channel. The spent circulated cooling water is clean drainage water and drained directly to rainfall pipe network in plant area; part of the acidic/basic waste from production after neutralized and precipitated (the water mainly having high salt content) may be reused and the other part will be drained to rainfall pipe network in plant area; the oil-containing waste water after oil isolation and precipitation together with the sanitary wastewater after precipitation through septic tank will be drained via the sewage pipe network in plant area into municipal sewage pipe network and finally to Anqiu city sewage water treatment plant.
The wastewater disposing measures, drainage quantity and destination are shown in Table 5.2-2.
Table 5.2-2 Wastewater source, disposing measures, drainage quantity and destination
No.Wastewater
sourceDischarge
mannerQuantity
(m3/h)Drainage
(m3/h)Main
pollutantsDisposing measures
Drainage destination
Shandong Academy of Environmental Science
Acidic/basic wastewater
Neutralizing pond
Oil-containing wastewater
Oil isolation
pond
Water collecting
pondPart for comprehensive use
Drained to rainfall pipe network in plant area
Drained to Anqiu city sewage treatment plant
Precipitating pond
Precipitating pond
97
EIA Report of 2×15MW Biomass Cogeneration Project
1
Drainage from
circulated
cooling water
system
Continuously 43.6 43.6 SS, salts No
Drained to rainfall
pipe network in plant
area
2
Drainage from
chemical water
treatment
Intermittently 23 20.5 SS, saltsNeutralization,
precipitation
Part for
comprehensive use,
the other part drained
to rainfall pipe
network in plant area
3Oil-containing
wastewaterIntermittently 1 1
Petroleum
oils
Oil isolation,
precipitation Drained to Anqiu city
sewage water
treatment plant4Sanitary
wastewaterIntermittently 0.56 0.56
COD, NH3-
NSeptic tank
2) Quality of wastewater drainage
The quality of wastewater drainage after treated by wastewater pre-treatment process is shown in Table 5.2-3.
Table 5.2-3 Quality of wastewater drainage Unit: mg/l (pH excluded)
PollutantsDrainage quantity
pH COD BOD SSN from
NH3
Pollutant concentration in wastewater drainage
1.56m3/h 6~9 240 160 180 15
Designed quality of wastewater inletting to Anqiu city sewage
water treatment plant- 6~9 500 220 310 50
From the above it can be seen that, the wastewater drainage quality of this project meets the designed quality of wastewater inletting to Anqiu city sewage water treatment plant. Anqiu city sewage water treatment plant is designed to treat 60,000 m3/d wastewater with a treatment margin of 25,000 m3/d, accordingly fully capable of receiving and treating the wastewater from this project with a discharge quantity of 34.32 m3/d.
The annual wastewater discharge of this project to be built is designed to be 9,360 m 3/a, and at a discharge of COD2.25t/a.
Annual emission waste water of this power plant is 9360m3/a and emission of COD2.25t/a. philosophy of “separating clean and sewage water” and “separating rainwater and sewage” is adopted. Two separate waste water collection systems with separate pipe networks are established for rainfall of plant area and domestic sewage. Waste water is not discharged to the Nangan Canal. Circulation cooling waste water is clean and discharged to the rain pipe network; acid and alkali waste water produced
Shandong Academy of Environmental Science
98
EIA Report of 2×15MW Biomass Cogeneration Project
during production will be neutralized and precipitated before recycle and discharge. Waste water containing oil will be filtered of oil and precipitated before discharged into the city sewage pipe network together with the domestic waste water after treatment in the cesspool. Treated sewage is finally discharged into the Wenhe River and then Weihe River. The section of Wenhe River from regulating dam of Anqiu to the Wanggao Bridge is mixed function and irrigation zone and category V water quality standard is applied. The water from Anqiu sewage treatment plant is charged into this zone. The downstream from Wanggao Bridge is used as drinking water and III category standard is applied. Two monitoring sections (Anding, Jiahetao) are arranged at the downstream from regulating dam. Anding section is located at mixed function area and irrigating area while Jiahetao section is located in drinking water area. Category Ⅴ and Ⅲ water quality standards are applied respectively. Category III standard of the Environmental quality standards for surface water (GB3838-2002) is applied to Weihe River. After improvement, quality of discharge water from Anqiu sewage treatment plant can meet the requirements of the first B standard of the Urban Sewage Treatment Plant Pollutant Emission Standard (GB18918-2002). No negative impact will be generated to the water quality of Wenhe River and Weihe River.
To sum up, discharged waste water from project to be built has little impact on surface water.
Shandong Academy of Environmental Science
99
EIA Report of 2×15MW Biomass Cogeneration Project
5.3 Groundwater environmental impact analysis
5.3.1 Groundwater environmental impact analysis
Monitoring and assessment on groundwater current condition show that current environmental groundwater quality in the accessed area is high during monitoring period. The pollutants which may impact the groundwater environment after the operation of project to be built are industrial wastewater, domestic sewage and household garbage. Through taking various environmental protection measures, domestic sewage and industrial wastewater are drained into plant sewage pipe work and to the sewage treatment plant through municipal sewage pipe network.
During the discharge process, special pipes are used for carrying waste water avoiding contact with soil. Soil layer around pipes are compacted to avoid seeping into underground water and impacting water quality; Emergent water pool is to be provided in the project. In case of malfunction of waste water treating equipment, waste water will be drained into the emergent water pool and then to the Anqiu sewage treatment plant.
To sump up, construction of the project will not impact groundwater obviously and the pollution trend will not change greatly.
To sump up, based on strict pollution prevention measures and sound management of plant area management, impact on the local groundwater by the project can be maximally reduced. From the monitoring result, it shows that current groundwater condition quality is relatively good. It can be predicted that the impact on the groundwater environment by the project to be built is low provided effective protection measures and pollution prevention measures.
Shandong Academy of Environmental Science
100
EIA Report of 2×15MW Biomass Cogeneration Project
5.4 Assessments on acoustical environment impact
5.4.1 Acoustical environment impact prediction and assessment
5.4.1.1 Analysis of main noise sources on site
Noise sources of the project to be built are air compressor, steam turbine, fans, water pump and cooling tower. According to project analysis, this project takes several effective noise reducing and preventing measures. High noise equipment is installed indoor provided with damping base measures. Mufflers are provided for fans and air compressor. Equipment noise levels of the project to be built are in the range of 60~ 82B (A) after prevention measures are taken. Noise sources strength is shown in Table 5.4-1.
Table 5.4-1 Summary of noise sources strength of the project
No. Noise sources Noise equipment Qty Unit noise dB(A)
1 Boiler house
boiler 2 88
draft fan 2 90
forced fan 2 90
air compressor 2 90
2 Steam turbine house
steam turbine 2 92
generator 2 90
exciter 2 80
3 Recirculating pump house water pump 2 80
4 Feedwater pump house water pump 4 83
5 Natural draft cooling tower - 1 82
6 Boiler Instant exhaust 110
7 Blow pipe noise 110
5.4.1.2 Prediction on acoustical environment impact
1) Prediction method
Methods recommended in the Technical Guidelines for Environmental Impact Assessment: Noise Environment (HJ/T2.4-1995) are adopted for prediction. Sound level A is used for calculation:
a) sound pressure level at prediction points for outdoor sound sources:
LA(r)=LAref(ro)-(Adiv + Abar + Aatm + Aexc)
where:LA(r)- sound level A of the point with a distance of r to the sound source,dB(A);
Shandong Academy of Environmental Science
101
EIA Report of 2×15MW Biomass Cogeneration Project
LAref(ro)- sound level A of reference position ro, dB(A); Adiv- introduced attenuation of sound level A by sound wave geometric divergence, dB(A); Abar- sound level attenuation caused by shelters, dB(A); Aatm- sound level attenuation caused by air absorption, dB(A); Aexc- additional attenuation, dB(A).
b) sound pressure level at prediction points for indoor sound sources:
i) calculate the sound pressure level near envelop enclosure caused by a certain indoor sound source:
LA=Lw+10lg(Q/4πri2+4/R)
where :LA is the sound pressure level near envelop enclosure generated by an indoor sound source; Lwsound power level of a certain sound source; r is the distance between a certain sound source and envelop enclosure; R is room constant; Q is directional factor.
ii) Calculated the total sound pressure level near envelop enclosure generated by all indoor sound sources:
iii) Calculate outdoor sound pressure level near envelop enclosure:
L2(T) = L1(T)-(TL+6)
where :TL- average window acoustic insulation mass,dB(A).
iv) Transform the outdoor sound level L2(T) and sound transparent area to an equivalent outdoor sound source, and calculate sound power level Lw of equivalent sound source:
Lw=L2(T)+10lgS
where :S is sound transparent area, m2;
v) The position of equivalent outdoor sound source is that of envelop enclosure. Its sound power level is Lw. sound level at prediction points generated by equivalent sound source can be calculated.
c) Calculation of total sound level
Shandong Academy of Environmental Science
102
EIA Report of 2×15MW Biomass Cogeneration Project
Provided that the sound level A at prediction point caused by the ith outdoor sound source is LAin,I; the operating time (T)of sound source is t in,i; sound level A cause by the jth equivalent outdoor sound source is Laout,j; the operating time (T) of sound source is tout,j. therefore the total effective sound levelat prediction is:
where :Tis the time for calculating equivalent sound level; N is the number of outdoor sound sources ; M is the number of equivalent outdoor sound sources.
2) Determination of parameters
a) Sound level attenuation caused by geometric divergence of sound wave:
i) Point sound source Adiv=20Lg(r/ro)
ii) Line sound source with a certain length (Lo)if r>Loand ro>Lo, Adiv=20Lg(r/ro)if r<Lo/3 and ro<Lo/3 Adiv=10Lg(r/ro)if Lo/3<r<Lo and Lo/3<ro<Lo Adiv=15Lg(r/ro)
b) Attenuation Aatm caused by air absorption
Project noise is of low and medium frequency causing little absorption attenuation, which can be ignored during prediction.
c) Attenuation Abar caused by shelters
During noise transmission, sound energy will be attenuated because of sheltering by the building and other workshops. The detailed attenuated value is determined according to the transmission way of different sound levels. It is normally 0~30 dB (A). 0 is applied for this assessment.
d) Additional attenuation Aexc
It is mainly the addition attenuation caused by ground effect, according to general layout of this project, noise source strength and outside environment, this additional attenuation can ignored.
3) Prediction results
According to layout arrangement, calculate the contribution of noise sources of the project to be built to the boundaries and Sanlidianzi village and Zhangjialou village. Details are shown in Table 5.4-2 and Table 5.4-5 respectively.
Shandong Academy of Environmental Science
103
EIA Report of 2×15MW Biomass Cogeneration Project
Table 5.4-2 Summary of sound level contribution of main noise equipment to boundaries
Note: predicted noise value of cooling tower is determined according to the measured data of Huangtai Power plant.
Contribution of main noise equipment to the position of maximum predicted noise value and village sound level is shown in Table 5.4-3 and 5.4-4 respectively.
Table 5.4-3Summary of contribution of main noise equipment to the position of maximum predicted noise
Note: predicted noise value of cooling tower is determined according to the measured data of Huangtai Power plant.
5.4.1.4 Acoustical environment impact assessment
1) Assessment standard and method
According to the approval comments on this project by the Weifang Environment protection Bureau, the secondary standard of Emission Standard for Industrial Enterprises Noise at Boundary (GB12348-2008) and the secondary standard of Standard for Acoustic Environmental Quality (GB3096-2008) are applied. Value exceeding limit method is adopted for assessment.
Calculation formula is:
P=LAeq-Lb
where :P is the value exceeding limit, dB(A); LAeqis prediction sound level of monitoring spots, dB(A); Lb is boundary noise standard value, dB(A).
2) Boundary noise assessing result
Boundary noise assessing results are shown in Table 5.4-5 while village noise Assessing result are shown in Table 5.4-6.
From the boundary noise assessing results, it shows that except the daytime and nighttime noise at west boundary, that of other boundaries after operation of the project to be built meet the secondary standard of Emission Standard for Industrial Enterprises Noise at Boundary (GB12348-2008); because the distance from cooling tower to the west boundary is short, the noise at west boundary is seriously out of limits.
Table 5.4-6 Summary of village noise prediction results assessment (unit: dB(A))
Prediction spot
Day time Night timePredicted
valuestandard
valueValue out of limits
predicted value
standard value
Value out of limits
Sanlidianzi 42.160
-17.9 42.150
-7.9Zhangjialou 38.2 -21.8 38.2 -11.8
From above table, after operation of project to be built, daytime and nighttime noise at neighbor villages Sanlidianzi and Zhangjialou meet the secondary standard of Standard for Acoustic Environmental Quality (GB3096-2008).
Refer to Table 5.4-7 and 5.4-8 for the superposing values of the boundary and village noise level.
Table 5.4-7 Summary of superposed results of boundary noise prediction (unit:dB(A))
prediction spot
daytime nighttimecurrent value
predicted value
superposed value
added value
current value
predicted value
superposed value
added value
East boundary
55.3 44.6 55.7 0.4 39.9 44.6 45.9 6
south boundary
48.9 44.1 50.1 1.2 37.2 44.1 44.9 7.7
west boundary
50.3 72.0 72.0 21.7 37.7 72.0 72.0 34.3
north boundary
53.6 38.2 53.7 0.1 38.7 38.2 41.5 2.8
Shandong Academy of Environmental Science
106
EIA Report of 2×15MW Biomass Cogeneration Project
Table 5.4-8 Summary of superposed results of village noise prediction (unit: dB(A))
prediction
spot
daytime nighttime
current
value
predicted
value
superposed
value
added
value
current
value
predicted
value
superposed
value
added
value
Sanlidianzi 51.6 42.1 52.1 0.5 39.6 42.1 44.0 4.4
Zhangjialou 49.7 38.2 50.0 0.3 37.9 38.2 41.1 3.2
According to regional layout of environment function areas and the approval comments of this project by the Weifang Environment Protection Bureau, category II standard of the Acoustical environment Quality Standard (GB3096-2008) is applied, i.e. daytime 60dB(A), nighttime 50dB(A).
Assessing results are shown in Table 5.4-9 and Table 5.4-10.
Table 5.4-9 Summary of assessment on superposed boundary noise prediction value
Prediction spotDaytime dB(A) Nighttime
Superposed value
Standard value
Value out of limits
Superposed value
Standard value
Value out of limits
East boundary 55.7
60
-4.3 45.9
50
-4.1
south boundary 50.1 -9.9 44.9 -5.1
west boundary 72.0 +12.0 72.0 +22.0
north boundary 53.7 -6.3 41.5 -8.5
Table 5.4-10 Summary of assessment on superposed village noise prediction value
Prediction spot
Daytime dB(A) Nighttime
Superposed
value
Standard
value
Value out
of limits
Superposed
value
Standard
value
Value out
of limits
Sanlidianzi 52.160
-7.9 44.050
-6.0
Zhangjialou 50.0 -10.0 41.1 -8.9
From the assessing results, it shows that except the daytime and nighttime noise at west boundary, that of other boundaries after operation of the project to be built meet the secondary standard of Standard for Acoustic Environmental Quality (GB3096-2008); Because the distance from cooling tower to the west boundary is short, the noise at west boundary is caused out of limits. Environment noise at villages Sanlidianzi and Zhangjialou site near the site meets the secondary standard of Standard for Acoustic Environmental Quality (GB3096-2008).
5.4.2 Boiler instant exhaust and blowpipe noise environment impact prediction and assessment
5.4.2.1 Instantaneous noise and sources strength
Noise of boiler instant exhaust is generated because of reducing pressure for protection
Shandong Academy of Environmental Science
107
EIA Report of 2×15MW Biomass Cogeneration Project
of main equipment in case of boiler over pressure. It belongs to high frequency steam exhaust noise with a typical duration of several decades’ seconds. The noise level is 110~130dB (A); blowpipe noise is a kind of exhaust noise when system installation is completed and steam is used to blow out debris inside pipelines. The duration is several decades’ seconds with a sound level of 110~130dB (A). Although the occurring rates of boiler instant exhaust noise and blowpipe noise are low, they have a high noise level and large impact area. Noise reducing and preventing measures, such as muffler, should be adopted to lower the noise level within 110dB (A). Therefore, the instantaneous noise source strength of this acoustical environment impact assessment is defined as 110dB (A). The position of source strength is the top of boiler.
5.4.2.2 Instantaneous noise impact prediction
Instantaneous noise source strength of the project to be built is taken as 110dB (A) for calculation. Its attenuation distance is predicted as the point source method specified in the Technical Guidelines for Environmental Impact Assessment: Noise Environment (HJ/T2.4-1995). Prediction results are shown in Table 5.4-15.
Villages near the site: Sanlidianzi is east to the site with a distance of 150m to site; Zhangjialou is south-south-west to the site with a distance of 200m site. Noise contribution of boiler instant exhaust noise and blowpipe noise to close villages is shown in Table 5.4-12. The superposed results with the contribution of other equipment are shown in Table 5.4-13.
Table 5.4-12 Prediction results of instantaneous noise to close villages
to villages (m)Noise contribution to villages dB(A)
Sanlidianzi Zhangjialou Sanlidianzi ZhangjialouBoiler house 110 224 338 63.0 59.4
Table 5.4-13 Impact superposed results of instantaneous noise to close villages
Name of prediction
point
Daytime Nighttime
Other equipmentpredicted
value
Instantaneous noise predicted
value
Superposed value
Other equipmentpredicted
value
Instantaneous noise predicted
value
Superposed value
Sanlidianzi 52.1 63.0 63.3 44.0 63.0 63.1
Shandong Academy of Environmental Science
108
EIA Report of 2×15MW Biomass Cogeneration Project
Zhangjialou 50.0 59.4 59.9 41.1 59.4 59.5
From prediction results, it can be concluded that boiler instant exhaust noise and blowpipe noise will impact the close villages - Sanlidianzi and Zhangjialou. The noise contribution to Sanlidianzi in daytime and Zhangjialou in daytime and nighttime can not satisfy the secondary standard of the Standard for Acoustic Environmental Quality (GB3096-2008) but can meet the requirement of not exceeding maximum standard value of 15dB(A) in case of sudden noise during nighttime.
After operation of the project to be built, transportation of fuel and ash and slag are performed by auto vehicles, passing by the Anwu Road and Shuangfeng Road at the east side of plant area. According to general layout, there are two entrances, one of which is at the north for people and another at the south east for goods in and out. Sanlidianzi is located to the east of plant area with a distance of 150m to the south east entrance. Daily fuel consumption of this project is 735.68t/d. in consideration of the density of biomass and transportation high limit, if a truck with a capacity of 5 tons can carry biomass 5 tons, 6~8 trucks will enter the plant. In rush hour, the number of trucks entering plant is 11 in consideration of 1.3.
Therefore, the main transportation route after operation of project is: southeast entrance - Anwu road - No.206 state road. Refer to Figure 2.2-4 for more details. Because of the long distance to Sanlidianzi (according to analysis based on experience and information, the range impacted is tha area 100m to the side of road). For transportation at Anwu Road and Shuangfeng Road, horn should be forbidden, speed should be kept and only daytime is allowed for transportation. Based on these measures, transportation noise will has little impact on village Sanlidianzi.
5.5 Analysis on solid waste environmental impact
5.5.1 Generation of solid waste
5.5.1.1 Generation of solid wastes
The solid wastes of this project mainly include labors’ household wastes, junk packages, dust and ash collected by dust collectors as well as slag produced by combustion within boiler. The household wastes are generated at a quantity of 23.15t/a. The ash and slag quantity resulting from this project is calculated as follows:
1) Ash quantity
MA=B·η(Aar+q4·Qnet.ar/8100·4.1868)·αfh
where: MA-ash quantity, t/h;B-fuel consumption under continuous maximum output conditions of boiler, t/h;
Shandong Academy of Environmental Science
109
EIA Report of 2×15MW Biomass Cogeneration Project
η-dust removal efficiency, %;Aar-as-received ash of fuel, %;q4-heat loss factor due to boiler mechanical incomplete combustion, % (taken as 4%, provided by boiler manufacturer);Qnet.ar-low limit of as-received fuel thermal value, kJ/kg;αfh - ash carrying with boiler flue gas, % (taken as 80%, provided by design company)
2) Slag quantity
MA=B·(Aar+q4·Qnet.ar/8100·4.1868)·dfh
In which: MA-slag quantity, t/h;B-fuel consumption under continuous maximum output conditions of boiler, t/h;Aar-as-received ash of fuel, %;q4-heat loss factor due to boiler mechanical incomplete combustion, % (taken as 4%, provided by boiler manufacturer);Qnet.ar-low limit of as-received fuel thermal value, kJ/kg;dfh-percentage carrying with slag, % (taken as 20%, provided by design company).
The ash and slag quantities are shown in Table 2.2-21.
Table 5.5-1 Ash and slag quantity
FuelHourly ash and slag quantity (t/h) Annual ash and slag quantity (t/a)
Slag quantity
Ash quantity
Ash and slag quantity
Slag quantity
Ash quantity
Ash and slag quantity
Wheat stalk
0.649 2.594 3.243 3894 15564 19458
Corn stalk
0.345 1.378 1.723 2070 8268 10338
5.5.1.2 Disposal of solid wastes
1) Household wastes
The household wastes from this project are to be collected by the power plant for centralized treatment by Anqiu city environment and sanitation department.
2) Junk packages
The amount of junk packages from this project is relatively low, and the packages are to be collected by the power plant for centralized treatment by Anqiu city environment and sanitation department.
Shandong Academy of Environmental Science
110
EIA Report of 2×15MW Biomass Cogeneration Project
3) Boiler ash and slag
Ash and slag produced from stalk combustion contain rich potassium, magnesium, phosphorus and calcium elements and can be used as raw materials for producing organic fertilizer. The construction company has signed Letter of Intention with Shandong Aobao Chemical Group Co., Ltd. (referred to as the Group) which states that all ash and slag produced from stalk combustion will be sold to the Group for producing organic fertilizer, therefore, the ash and slag from this project can be completely used as raw materials for producing organic fertilizer.
5.5.2 Ash and slag environmental impact analysis
Ash and slag generated by the fuel combustion includes slag generated in the boiler and ash collected by the bag dust collector. Unreasonable treatment may cause bad impact on the environmental air. Adverse impact also may occur if correct prevention measures are not taken for the collection, storage and transportation ash and slag
5.5.3 Ash and slag pollution prevention measures and comprehensive utilization program
5.5.3.1 Ash and slag pollution prevention measures
A separate ash and slag removing mode is adopted. A dust packing workshop is arranged in the project to be built. Dust is from the dust collector. A dust discharge pipe is provided under the ash bucket of bag dust collector. Ash collected by ash buckets of the bag dust collector drop into ash bags below through manual gate valve and electric ash discharging valve. Ash inside bags will be packed before transported for sales; a slag silo is provided for slag from boiler, which is carried by bucket chain conveyor and bucket elevator.
Because ash collecting devices are provided in ash packing workshop and slag silo is sealed with steel plate avoiding drench and fly ash. Therefore no bad impact will be caused to the water environment; because ash and slag are transported in closed method, no ash pollution will occur; because the limited capacity of workshop and silo, ash and slag should be transported in time to avoid any negative impact caused.
5.5.3.2 Comprehensive utilization program of ash and slag
This project is a biomass cogeneration plant, and fuel is crops straw. It will generate a kind of high quality fertilizer as a result of straw combustion. The ash and slag is rich in potassium, magnesium, phosphorus and calcium, which can be used as raw materials of fertilizer. The owner of plant has signed a cooperation agreement with Shandong Aobao Chemical Industry Group Co., Ltd regarding lash and slag supply. Therefore, ash and slag generated by fuel combustion can be completely reused.
Shandong Academy of Environmental Science
111
EIA Report of 2×15MW Biomass Cogeneration Project
5.6 Environmental impact analysis on straw collection, transportation and storage
5.6.1 Straw collection, transportation and storage
5.6.1.1 Straw sources
Anqiu is located in the central Shandong, southeast of Weifang, adjacent to Zhucheng, Gaomi, Changle and Linqu. It is 65.3km long from east to west and 61.5km from south to north with a total area of 2010km2. The population is of 1050000; the terrain is high at south and low at north. The mountainous region accounts for 19% of total area while hills for 15% and plain for 66%; there are two main streams - Weihe River, Wenhe River; Anqiu has rich solar energy, surface water and groundwater. Type of crops is complete and production is stable.
Anqiu currently has arable land of 13010000 Mu with crops mainly of maize, wheat, peanut, cotton, beans and garlic.
Anqiu straw production is the lowest in 2002. the total production of straw and and agriculture and forestry waste is 610000 tons; while in 2006, total straw production is 690000t and the straw and agriculture and forestry waste within 50km range is 3138000 t and that in 35km range is 1554300 tons. Annual straw consumption of this project is 200600 t. the straw supply both within 35km and 50km range are sufficient. Therefore the supply of fuel is ensured.
A straw resources investigation of Anqiu and neighbor area (within 50 km) was organized by the Anqiu government and performed by relative departments in August 2006. the final conclusion of this investigation is that the straw supply of Anqiu and its neighbor area may reach 800000 t/a in 15 years, which can completely meet the straw demand (200600 tons/ a)of this power plant project. Regional social and economic environment and climate conditions are suitable for transportation of straw. The construction of this project is contributable for energy saving and improving environment as well as increasing income of peasants.
Main crops planting area, grain yield distribution in Anqiu in 2006 is shown in Table 5.6-1 and Main crops planting area, grain yield of Anqiu in 2001~2006 and coming 15 years.
Shandong Academy of Environmental Science
112
EIA Report of 2×15MW Biomass Cogeneration Project
Table 5.6-1 Summary of Investigation Assessment on Anqiu Straw Resources
5.6.1.2 Straw collection, storage and transportation
1) Straw collection method
Straw fuel is mainly collected from the countryside in a range of 40km to the site. Storage fields are taken as centralized purchase spot. The purchase is mainly carried out by agents organizing a large number of temporary collection agents in countryside. The agents are also responsible for the transportation to centralized storage fields. In other hand, straw also can be carried by farmers to the purchase spot and sold the centralized purchase spot. Purchased straw will be examined for water content. Straw with a water content lower than 15% will be packed and stored in warehouse. The purchase flow is shown in Figure 5.6-1.
Figure 5.6-1 Diagram of straw collecting
2) Calculation of transportation amount and method
The straw transportation amount is 200600t/a. straw is transported by trucks.
Shandong Academy of Environmental Science
Transportation
Transportationorganization
Transportation
TransportationIndividual
farmer
Distributed
collection agentsCentralized
storage
fields
Plant
113
EIA Report of 2×15MW Biomass Cogeneration Project
5.6.2 Environmental impact analysis on straw storage and transportation
5.6.2.1 Environmental impact analysis on storage
Straw collected will be stored in four centralized collection agents. The pollution caused by the spots is the packing dust and noise.
Because the straw is in solid state, straw will be transported into the spot after procurement. Packing of straw is performed indoor. Cutting machines are sealed devices and dust collecting devices are also provided indoor. Therefore, the dust pollution to the environment caused during straw packing is very low.
Hydraulic packing machines are adopted, which belong to low noise equipment. Straw storage fields are far away from villages and packing process is performed indoor. Therefore the noise of packing machines has little impact to the acoustical environment of neighbor villages.
Since execution of this project, materials will be transported into or out of plant. A certain degree impact will be introduced to the air, noise and social environment along transportation road.
In consideration of the density of biomass and transportation height limit, if a truck with a capacity of 5 tons can carry biomass 5 tons, 6~8 trucks will enter the plant. In rush hour, the number of trucks entering plant is 11 in consideration of coefficient of 1.3. Impact is low.
Vehicle exhaust pollutants are mainly from volatilization fuel oil and exhaust funnel. Carbon monoxide is a product of the combustion in engine while nitrogen oxide is the product generated under high temperature. During transportation, a small amount of above pollutants will be discharged. Because the area around roads is countryside and open, the pollutants are easily diluted. Therefore the exhaust of vehicle has a low impact on the air environment along roads.
Because the roads are paved with asphalt or concrete, dust emission caused by transportation trucks is low and the impact to air environment is low.
During transportation, straw packages are fixed by cables and nets. Therefore no dust pollution will be caused.
Shandong Academy of Environmental Science
114
EIA Report of 2×15MW Biomass Cogeneration Project
5.7 Ecological Environment Analysis
5.7.1 Analysis of impact on vegetation
Impact to neighbor vegetation during operation period includes impact to the leaves by soot dust discharged by stack, impact to leaves by SO2 and NO2, impact to the vegetation roots by waste water.
1) Impact on vegetation by exhaust gas
Vegetation photosynthesis and breathing will be impacted when dust drops on its leaves.
If pollutants are absorbed, leaves tissues will be damaged and dots will appear on leaves surface, then leaves, flowers and fruits will drop. SO2 may cause brown or dark red dots on leaf veins; NO2 may cause white, brown or dark red dots among leaf veins.
Based on analysis on impact degree of three exhaust gas pollutants, SO2 may cause heavier impact on vegetation in case of the same concentration.
Acute SO2 injury thresholds of various vegetations are shown in Table 5.7-1.
Table 5.7-1 Table of Acute SO2 injury thresholds of various vegetations
Duration (h)Concentration (ppm) cause 5% visible injury
Sensitive Intermediate Resistant
1 1.01~1.20 1.73~2.02 ≥4.0
2 0.65~1.09 1.36~1.64 ≥3.5
4 0.59~0.80 0.59~1.00 ≥3.0
6 0.41~0.70 0.52~0.64 ≥2.5
8 0.31~0.50 0.28~0.51 ≥2.0
Table 5.7-1shows that:
The lowest concentration for sensitive vegetation exposing to SO2 for an hour is 1.01mg/m3 for causing 5% visible injury while 0.31mg/m3 for 8 hours. However, the predicted SO2 concentration is far below this value. Therefore, concentration contribution of SO2 discharged by the project is lower than the acute SO2 injury threshold of sensitive degree vegetation. It can be concluded that no obvious impact will be caused by discharged SO2 after operation of plant.
The upper limit of pollutant concentration for protection of crops is shown in Table 5.7-
Shandong Academy of Environmental Science
115
EIA Report of 2×15MW Biomass Cogeneration Project
2.
Table 5.7-2 Summary of upper limit of pollutant concentration for protection of crops (mg/m3)
Pollutant Sensitivity
Average concentration
during growing
Daily average concentration
One time Corps
SO2
Sensitive 0.05 0.15 0.5Winter wheat , spring wheat
Intermediate 0.08 0.25 0.7rice, maize,
broomcorn, cotton
Resistant 0.12 0.30 0.8rape, sunflower,
strawberry
According to assessment on current environment air quality and impact, in case of windy weather, absolute maximum SO2 ground concentration under various stability scales is within the upper limit of pollutants for protection crops.
2) Impact on vegetation by waste water
During operation period of project, the major impact on vegetation is the water soluble matter entering groundwater and soil, which will be absorbed by vegetation roots. The growing will be seriously effected. Furthermore, pollutants may be accumulated inside vegetations and threaten the health when they made into foods.
Many processes of power plant may produce waste water. Several measures are to be taken to save water and reduce water discharge, such as separating clean water and polluted water, rainwater and waste water, recycle utilization.
Impacts on neighbor vegetation and crops could be eliminated by implementing environment protection measures, treating water treatment structures anti-seepage.
To eliminate bad impact on vegetation and soil, environment protection measures should be strictly implemented during operation period to control the discharge of SO2, prevent seepage, wind and rain from impacting environment. Domestic garbage are to be handled by special staff.
5.7.2 Analysis of impact on animals
The area of project belongs to agriculture ecological system and no endangered animal lives in this area. Animal resources are wild animals with high adaptability and domestic beats and birds. Therefore, the project will have no impact on animals during operation period.
Shandong Academy of Environmental Science
116
EIA Report of 2×15MW Biomass Cogeneration Project
5.7.3 Analysis of impact on landscape
Before construction of project, the local landscape pattern is simple agriculture ecological system; after completion of project, the land will be covered by buildings, roads and grassy area.
To sump up, construction of project will not cause significant impact on regional ecological environment. Furthermore, more green area will be built inside plant area, which can improve the water holding capacity. Local trees will be preferentially selected for area greening. The combination of tree, bush and grass will be considered.
5.8 Environmental risk analysis
5.8.1 Risk identification and determination of assessment degree
5.8.1.1 Risk identification of facilities
This project is a biomass cogeneration plant with advanced process, high automation degree and dense technology. Main systems of plant are boiler, steam turbine, generator power distribution and steam supply, straw storage, ash and slag handling, flue gas treatment, feedwater, circulating water, waste water treatment. A large number of equipment and facilities are involved, such as boiler, pressure vessel, crane, forklift, waste water treatment facilities, gas treatment facilities as well as high temperature equipment, rotating or moving machinery, and pollution preventing devices. Therefore, main risk factors during operation include: explosion of boiler and HP vessel, discharge of excessive pollutant, electrical injury and mechanical injury. This assessment is focusing on the impact caused by discharge of excessive pollutant because of accident of dust collecting facilities.
5.8.1.2 Physical risk identification
Fire accident is prone to happen during application and storage of fuel - straw.
5.8.1.3 Determination of assessment degree
According to determination basis for risk assessment degree, the following basis is considered:
1) This project is far away from natural protective zone and important fishing water, and there is no specified environment sensitive objective;
2) This project is a clean energy development project with products of electricity and heat. its major fuel is crops straw, which belongs to clean raw material;
According to Technical Guidelines for Environmental Risk Assessment on Projects (HJ/T169-2004), Environmental risk assessment degree of this project is determined as degree two.
Shandong Academy of Environmental Science
117
EIA Report of 2×15MW Biomass Cogeneration Project
This assessment is mainly focusing on the environmental risk impact caused by excessive soot dust discharge because of dust collector failure and straw storage fire accident.
The efficiency of bag dust collector is 99.9%. Its working principle is to collect soot dust by filter membrane in four filter chamber. Its efficiency is determined by filter membrane. The efficiency may drop in case of filter membrane damage due to long term operation. There are factors causing dust collector accident:
1) Unreliability of dust collecting equipment. Unreliability is only related to the design, manufacture, detection method, installation quality, wear and tear as well as design service life. Therefore, the unreliability is defined as soon as equipment is fabricated.① due to site condition and other factors (installation of proper, bag and bucket), unbalance air flow distribution normally occurs in bag dust collector. During operation, turbulence or perturbation of air flow cause wear of bag and lower efficiency of dust collection; ② due to unreasonable installation arrangement, block straw not completely fired may burn the bag;③bag cloth may be hardened in case of dew which reduces the efficiency of dust collection;④bag is also prone to be worn by dust power.
2) Safety management of enterprise. Occurrence of accident is either caused by human unsafe behavior or by unsafe equipment state, which are both caused by incomplete management. Hence, all accidents could be concluded as management failure.
5.8.2.2 Analysis on accident risk impact
1) Risk accident state and determination of source strength
This assessment is based on the condition that bag dust collector fails and only cyclone dust collector operates with an efficiency of 80%. Source strength soot dust during accident is shown in Table 5.8-1.
Table 5.8-1 Source strength of soot dust during accident
pollutant
condition
Efficiency of dust collectio
n (%)
discharge concentratio
n (mg/m3)
discharge flow (kg/h)
Stack height
(m)Remarks
soot dustaccident
discharge80 3194.3 519.4 100
bag dust collector fault
2) Pollutant concentration prediction results during accident
Shandong Academy of Environmental Science
118
EIA Report of 2×15MW Biomass Cogeneration Project
Maximum hourly absolute TSP ground concentration during accident, axis peak concentration of calm and breezy wind and hourly concentration of accessed points are shown in Table 5.8-2~5.8-3.
Absolute maximum TSP ground concentration in case of windy weather is 0.2699mg/m3 (Stability scale A; wind speed is 1.8m/s; 700m to the source).
Absolute maximum TSP ground concentration in case of calm and breezy wind is 0.2704mg/m3 (Stability scale A; wind speed of 0.8m/s; distance 200m).
maximum hourly concentrations at accessing points vary between 0.1197mg/m3~ 0.2378mg/m3. TSP concentration at 2#accessing points Sanlidianzi is the maximum with a value of 0.2378mg/m3.
Therefore, TSP concentration contribution to the accessed area is relatively low.
Table 5.8-2 Maximum TSP ground concentration (mg/m3) and occurring distance (m) at typical wind
speeds of various stability scales
Wind speedStabilit
y
Wind spee
d
(m/s)
Atmos
(hpa)
Air temperatur
e
(℃)
Occurring
distance (m)
Max. Tsp
Concentration (mg/m3)
Occurring date
Maximum ground
concentration
A 1.8 994.5 36.9 700 0.2699 June4,13:00
B 2.5 993.9 36.6 1400 0.1637 June27,14:00
C 2.6 993.8 35.6 2500 0.1296 June20,14:00
D 3.1 993.7 34.7 3700 0.0900 Aug.11,14:00
E 1.51002.
729.6 4700 0.0400 June15,19:00
F 1.5 991.8 28 6000 0.0288 Aug.7,19:00
Max. absolute
valueA 1.8 994.5 36.9 700 0.2699 June4,13:00
Table 5.8-3 peak hourly TSP concentration (mg/m3) and occurring condition during accident
accessing points
directiondistance
(m)Time (2006)
atmos
(hPa)
air temperature
(℃)
wind direction
wind speed
StabilityMax. TSP
concentration (mg/m3)
1#Daweiyuan SE 3400 July28,11:00 NW 2 C 992.9 27.6 0.1197
2#Sanlidianzi E 780 June3,11:00 W 1.9 A 997.7 27.6 0.2378
To ensure timely and effective fuel supply, the turnover capacity of stack yards and sheds can reach 21100t. the environmental risk during straw storage is potential fire accident. factors causing straw fire include: smoking and firing without permit; no spark extinguisher installed on the funnels of vehicles entering storage; effective preventive measures are not taken during maintenance with gas cutter or welder; sparks are generated in case of switching electrical lines or facilities, bad contact, short circuit and electricity leakage as well as electrostatic discharge; fault lightning protection measures cause fire by lightning strike.
Pollution impact to the environment by fire accident is mainly the large amount of poisonous gases generated during fire. Due to the emission of gases which is hard to measure, this assessment is mainly to analyze the impact to neighbor environment by fire accident.
5.8.3.3 Analysis of impact on neighbor villages during fire accident
A certain degree of impact will be caused to the neighbor villages during fire accident. Village Sanlidianzi is the nearest village to Fuel storage with a distance of 200m. It is at the southwest to fuel storage. Concentration of poisonous gas will be diluted during fire, and only temporary impact will be caused.
More CO may be produced in case of moisture and insufficient oxygen. Normally CO concentration at fire site is high (concentration reaches 0.02%) while the concentration 30m from fire site reduces (0.001%); normally sulfur dioxide content will be lower than 1μg/g at a distance of 30m to the fire site and no hazard will be caused; at an open area outside fire site, smoke will be diffused rapidly and no hazard will occur and the concentration of Nitrogen dioxide will be diluted. Therefore the potential hazard is low; in the space outside of fire site, due to convection between fresh air and smoke, the concentration is diluted.
Therefore, environmental air quality of neighbor sensitive spots may worsen in a short time but no injury will be caused to body.
5.8.3.4 Fire fighting water environmental impact analysis
In case of fire, water is to be supplied by a 1000m3 reservoir through fire fighting water
Shandong Academy of Environmental Science
120
EIA Report of 2×15MW Biomass Cogeneration Project
pumps with a flow of 60L/S. if the fire duration is three hours, required fire fighting water is 648m3. An emergent water reservoir is provided for this project with a dimension of L 12mW 10mH 6m. Fire fighting water will be discharged into Anqiu sewage treatment plant after sediment in the accident emergent water reservoir causing little impact to neighbor water environment impact.
5.8.4 Other risk factors impact analysis
Poisonous substances are used during water treatment, so environmental risk exists during transportation, storage and operation. To reduce the environmental risk to minimum, relative regulations should be completed and observed strictly. And effective precautionary measures also should be taken to reduce the possibility of environmental risk accident.
Because the quantity of involved poisonous matters for transportation, operation and storage is low and these matters are in liquid state, the spreading speed is much lower than that of gas and the impact range is relatively small if timely measures are taken upon leakage accident. Therefore, it is hard to assess the leakage possibility and hazard degree. This assessment is only focusing on the analysis of hazard caused by chemicals leakage and measures to be taken.
Hazardous chemicals like acid and alkali will be used for waste water treatment process. To ensure safe operation, firefighting facilities, labor protection, special warehouse should be strictly managed and satisfy the requirements of The Regulations of Safe Management Regarding Dangerous Chemicals (Decree of the State Council, No.344, executed since March 2002). Firefighting and safety should be regarded as the most important issues.
According to Notice on Strengthening Management of Chemicals and Dangerous Goods ( Issued by the State Environmental Protection Administration, State Economic and Trade Commission, Ministry of Public Security, ministry of communications, State Bureau of Quality and Technical Supervision)(Huanfa[1999] No.269): storage of hazardous chemicals, storage place satisfying requirements of safety and environment protection should be arranged; a strict material in-out recording and sales recording system should be established; storage of hazardous chemicals used as raw materials should meet relative requirements; during production, storage, use and transportation of hazardous chemicals, is an accident occur, accident responsible unit and personnel should take emergency measures immediately and inform units and personnel subject to potential hazard, and report to local police, environment, economic and trade committee, quality and technical supervision bureau. Any falsification will be punished; overdue hazardous chemicals and used container of hazardous chemicals should be well kept and disposed as per relative standards.
A very few hazardous chemicals is used during waste water treatment and these substances will be recovered by manufacturers when overdue.
Shandong Academy of Environmental Science
121
EIA Report of 2×15MW Biomass Cogeneration Project
5.8.5 Summary of risk assessment
There are few risk factors during project operation, which are dust collector failure and straw firing accident. Failure of dust collector can be repaired online with a low impact on neighbor environment. Strict management of material stack yard and material shed can reduce the possibility of fire accident. Although a small amount of poisonous and harmful substances will be used during water treatment, possibility of accident is very low when precautionary measures and regulations are established and strictly performed.
5.9 Analysis on Relevant Environment Protection Policy
5.9.1 In compliance with Environment Protection Policy
Based on Circular No. 131 issued by Environmental Protection Bureau of Shandong, the proposed project complies with environment protection laws and regulations and technical specifications as well as local development plan. The emission of the project is within discharge criteria and does not affect the local pollution control and emission discharge targets. The site location is not within scope where there shall not be any construction. The project meets the requirements of projects listed in the circular No. 131.
To sum up, the project is in compliance with the environment protection policy.
5.9.2 In compliance with world bank policy
The waste gas of the project is mainly the flue gas from the boilers and the project utilizes agriculture stalks as fuel (low sulfur content) and the supporting facility includes bag filters (99.9% efficiency) and the project also reserves space for desulphurization equipment. The emission density of flue dust, SO2, and NOx can satisfy the requirements in the third phase of Thermal Power Plant Pollutants Emission Standard (Shandong Provincial Standard DB37/664-2007 ). SO2 emission of the project can satisfy the total emission indicators from Anqiu Municipal government. Some of the waste water generated by the project will be recycled after pre-treatment on site, while the rest will mix together with domestic waste water after pre-treatment to go to the Anqiu Water Treatment Plant through sewage pipeline of the city council. The ash and slag from the boilers are all organic fertilizers and will be comprehensively utilized. The environment control measures complies with the relevant requirements in HSE Guidelines for Thermal Plant.
Based on HSE Guidelines for Thermal Plant of the World Bank, refer to Table 5.9-1 for the compliance of the discharged gas and boiler emission.
Table 5.9-1 Effluents and specified standards
Pollutants PM10(mg/m3) NOx(mg/m3) SO2(mg/m3)World Bank Atmospheric emission
standard30 510 900
Shandong Academy of Environmental Science
122
EIA Report of 2×15MW Biomass Cogeneration Project
Shandong Thermal Power Plant Emission Standard DB37/664-2007
Standard Phase 350 400 400
Effluents(Wheat Stalk) 15.97 200 213.2
Effluents(Corn Stalk) 8.53 200 242.9
As can be seen from the table, the effluents discharge from the proposed project can satisfy the specified standards in HSE Guidelines for Thermal Plant.
Chapter 6 Alternative Plan Analysis
The purpose of alternative plan analysis is to optimize the project design from the environment aspect, not to discuss on the rationality of the plan selected by the project. The alternative plans can be: different construction sites, different types of technology; different materials and operation conditions or different buffering measures.
The major source of the alternative plans include: the ones recommended in the feasibility study, the ones vetoed by the feasibility study, the ones from public consultation, especially from professionals and experts, or the ones recommended by the EIA from the aspects of environment.
6.1 Nil Project Analysis
The key of the analysis is to look at the environment effects with and without the project on the aspects of environmental protection.
1) Plan 1: Construct Biomass Cogeneration Project
2) Plan 2: Nil Project
Refer to Table 6.1-1 for the advantages and disadvantages of the above plans.
Shandong Academy of Environmental Science
123
EIA Report of 2×15MW Biomass Cogeneration Project
Table 6.1-1 Comparison of Plans
Category Plan 1 Plan 2
Pros
1. The project is in compliance with the national industrial policy;
2. The project, as one of the popular projects in Anqiu, satisfies with the overall planning of Anqiu urban area and in compliance with the ecological construction requirements;
3. The project can reduce the pollution caused by onsite combustion of stalks and boost the farmers’ income;
4. The project is one of the key ways to solve the current energy shortage problem and is in compliance with international and national policy to develop circular economy and save on non-renewable energy;
5. After completion, the project can help realize centralized heating and change the current heating situation supplied by small scale boilers;
6. The ash and slag produced can be used as raw materials for organic fertilizer;
7. An absolute majority of the surveyed public are supportive to the project, which shows that the construction is the willingness of the public.
Free from all kinds of environmental impacts brought by the construction period and operation period of Plan 1, especially in the operation period.
Cons
1. Impact on surrounding environment from flue gas, unorganized emission of dust and foul gas;
2. The discharged waste water of the project will increase the burden of the waste water treatment plant;
3. Impact on the surrounding environment from the transient noise and industrial nose during operation.
1. When the stalks are returned to soil after combustion, it will increase pollution;
2. As the stalks are not centralized and collected for comprehensive use, it is far from the environment requirement from the state and seriously inhibit the urban economic development;
3. The area where the project is situated cannot realize centralized heating;
4. Not in compliance with the urban overall planning and ecological construction plan requirement.
Summary From the social and environmental protection, Plan 1 is more preferable than Plan 2.
Shandong Academy of Environmental Science
124
EIA Report of 2×15MW Biomass Cogeneration Project
As can be seen from the table, though in Plan 2 there is no environmental impact in the project operation period, there is still traditional on-site combustion methods to handle the stalks, which not only exacerbates the pollution, also inhibits the social economic development. Though the construction of the project will bring environmental impact, relevant control measures can be taken to minimize and prevent the effect. Through prediction assessment, the project will have little impact on the surrounding environment during the operation period and the construction of the project will bring long term social and environmental benefits. Therefore, from the social and environmental aspects, the construction of the project is better; thus, the project is necessary.
6.2 Boiler Selection
The boilers selected for the project shall take the feature of the fuel, site conditions and slag application into full consideration and they shall comply with the local environment protection requirements. Currently, optional biomass fuel combustion boilers mainly include chain boilers, vibration and combined grate boilers, and circulating fluidized bed boilers. Considering the heat efficiency, the chain boilers have relatively lower heat efficiency and are less preferred and the latter two are chosen more often.
The combustion mode of the vibration and combined grate boilers is when the fuel enters the furnace and falls onto the continuously vibrating grates to burn, the fuel are scattered due to vibrated so it get completely combusted.
The combustion mode of circulating fluidized bed is fuel is combusted in the furnace in flowing state and those not completely combusted will be separated through cyclone separator, which will return to the furnace to get burned.
The comparison of specifications of vibration combined grated boilers and circulating bed boilers are as follows:
1) Application: mechanical grate boilers have long term operation history overseas with many clients and there are several popular boilers. In recent years, there are numerous applications of that in China. From the current application aspect, the overseas grate boilers are represented by BWE Denmark with its product-vibration water cooled grate boilers. The circulating fluidized bed boilers are represented by differential bed technology of KARLBAY Germany.
2) Boiler Dimensions: as the degrees of mixture, gas distribution, and integrated reaction time of the fuel in the grate boilers are generally lower than those of the circulating fluidized bed boilers, the stalk will stay longer in the grate boilers and the sectional thermal load of them is also generally lower, which means the grate boilers are generally more expansive but the fluidized bed boilers are tall but slim.
3) Appropriate fuel: the grate boiler require relatively stable heat value of the fuel while the fluidized bed boilers require a large amount of high temperature fuel, so the latter has great thermal capacity and fuel adaptability.
Shandong Academy of Environmental Science
125
EIA Report of 2×15MW Biomass Cogeneration Project
4) Secondary Pollution Control: As the circulating fluidized bed boilers adopt low temperature (850~950ºC) and graded combustion, it limits the formation of NOx. However, the grate boilers are characterized by high combustion temperature with high concentrations of pollutants in the flue gas. Therefore, from the aspect on control of secondary pollution, the circulating fluidized bed boilers are better than grate boilers.
5) abrasion: in grate furnace boiler, combustion of stalk occurs on the long grate surface, causing less abrasion; the abrasion of circulating fluidized bed boiler is more serious than grate furnace at air distributing plate, waterwall and heating surface of HRSG and furnace wall.
6) Investment Cost: As currently there is no mature grate boiler design and manufacturing company in China, the grate boilers are usually imported and usually very expensive. The fluidized bed baffers is similar to coal-burning circulating fluidized boilers, which is mature technology. The cost of the fluidized bed boilers is generally lower than the grate boilers.
To summarize, as there is relatively high amount of alkaline metal and chlorine in stalk ash and the slag has low fusion temperature, problem of slag is likely to happen. If ashes are changed into solid or semi-fluid, it is hard to get rid of them during operation and they will affect the normal operation of the boilers. In addition, the fuel of the project is mainly corn, wheat stalks and other small amount of agro-forestry mixture, characterized by impurity, variability, and uncertain proportion. The circulating fluidized bed boilers will realize full combustion of the fuel with greater range of thermal load. Therefore, selection of fluidized bed boilers is more preferable and the project selects circulating fluidized bed boilers as stalk combustion boilers.
Circulating fluidized bed stalk combustion boiler is the core equipment of this project. The stalk fired circulating fluidized bed boiler co-developed by Zhejiang University and Nantong boiler factory has passed the technical qualification supervised by the science commission of Jiangsu Province and Ministry of coal and won the second prize for Progress in Science and Technology in 1992. This boiler has been put into operation in Jiangsu Suqian China Energy conservation biomass power plant. The same type of boilers produced by Shandong Taian Boiler Factory and Jiangxi Jianglian Boiler Factory also have been successfully applied in domestic biomass boiler power plants.
The main technical specifications of the circulating fluidized bed boilers include: (1) excellent, stable, and complete combustion with control on the secondary pollution; (2) low temperature and sectional combustion inhibit the formation of atmospheric pollutants; (3) Solves the firing, stable combustion and combustion control problems of low heat value, humid fuel with variable compositions; (4) The fuel can enter the boiler for combustion with minimal preparation and low preparation cost; (5) Strong thermal capacity and wide adjustable scope; small boilers with less investment but high combustion efficiency; (6) No movable part in boilers which ensures the reliability of
Shandong Academy of Environmental Science
126
EIA Report of 2×15MW Biomass Cogeneration Project
operation and brings low maintenance cost.
6.3 Site Selection
The site selection is crucial as it involves overall planning of the region, land acquisition, transportation, geological composition, communication, water supply and draining, and economical requirements of project. The proposed project during the feasibility study period had two sites to be selected.
Site one is located 2Km southwest of Anqiu downtown, southwest to Sanli Dianzi Village of Xing’an Street Administrative, west to Anwu Road, South to Nanyuan Road. The site is for construction use according to plan and the shortest distance from the site to Mushan reservoir is 3.9Km.
Site two is located 2Km south of Anqiu downtown, west to Qili He Village of Xing’an Street Administrative, 5Km to the Southwest of Mushan reservoir. The site is surrounded by farm field and it is 1km to the west of Anwu Road, 1km to the east of 206 State Highway. The south and north sides of the site are all trunk roads fro the development zone.
Refer to Figure 6.3-1 for the two sites to be selected.
The environment impact assessment compares the two sites from technical, economical, and environmental protection aspects. Refer to Table 6.3-1 for details of comparison.
Shandong Academy of Environmental Science
127
EIA Report of 2×15MW Biomass Cogeneration Project
Table 6.3-1 Comparison of Main Technical and Economic Conditions of the Two sites
No. Item Site one Site two
1Site
Conditions
Location
2km to the southwest of Anqiu downtown, southwest to Sanli Dianzi Village of Xing’an Street Administrative, West of Anwu Road, South of Nanyuan Road.
2km to the South of Anqiu downtown, west of Qili He Village of Xing’an Street Administrative
Relationship to the neighboring
areas
No effect to the urban downtown. The nearest village to the site is Sanli Dianzi Village, around 150mto the east of the site.
Has effect to the urban downtown. The nearest village is Qili He village, around 100m to the east of the site.
Land Category Farm field Ditto left.
Ground waterGround water and soil are no corrosive to the concrete.
Ditto left.
RoadsThe site is connected to 206 State Highway through Shuangfeng Road and an unpaved road.
The site is connected to 206 State Highway through an unpaved road.
2Water Supply
Water sourceMushan reservoir is southwest to the site with a relative distance of 4Km.
Mushan reservoir is southwest to the site with a relative distance of 5Km.
PipelinePiping laying length around 5.3km,with less investment cost
3 Nature of LandIndustrial use listed in Anqiu City Overall Plan
Ditto left.
If the two sites are compared through environmental protection aspects:
1) Air: the environment impact assessment on current air quality shows that it is good now and there is still tolerance on SO2 and NO2
, which means that both sites are suitable for project construction. The distance between the two sites is 1.7Km. Site one is not on the prevailing wind direction of Anqiu downtown but site two is on the prevailing wind direction of Anqiu and on the upper stream. Therefore, site two will have greater impact to the Anqiu downtown. Selection of site one is more reasonable.
2) Surface water: the waste water of the project adopts separate piping. Oily waste water through oil removal and sediment will mix will domestic waste water after
Shandong Academy of Environmental Science
128
EIA Report of 2×15MW Biomass Cogeneration Project
septic tank sediment to be discharged to city council sewage network and finally enter Anqiu Waste Water Treatment Plant. Therefore, there is little difference in two sites. Either of that is reasonable in this aspect.
3) Ground water: as the two sites are close to each other and there is no difference in the water and geological conditions, after implementation of anti-permeation measures, either of them will have impact to the ground water to the area. Therefore, either of the sites selected is reasonable from the aspect of impact on ground water.
4) Noise: The acoustical environment of the two sites is good and can both satisfy second category of the Acoustic Quality Standards (GB3096-2008). They both have sensitivity spots, villages, but after adoption of noise reduction measures, the acoustic level can meet with the standards. Therefore, from this aspect, either of the sites is reasonable.
To summarize, from the technical and economic aspects, as they are close to each other, they have both advantages and disadvantages. However, site one outweighs site two. Therefore, the environment impact assessment think selection of site one is reasonable.
6.4 Overall Layout
The main building lies in the direction of south and north, with west side fixed and to be expanded to the east. There are three main paths inside in the same direction, with the main central one as for walking and the gate is to the direction of south. In the center of the site, there will be an division wall lying from east to west. The southern part of the site will be manufacturing area while the northern area the fuel storage and preparation area. The east main path is for fuel and material transportation which directly links to the fuel area while the west main path is construction and safety path which is also linked to the fuel area and forms a circle with the east main path.
The office block is located to the south of the main buildings and towards the central gate. The main building is located in the center with three rows layout, which in the order from the south to the north in the manufacturing section is ST house, de-oxidized compartment, boiler house, and dust collectors, flue duct, and ash storage etc. To the east of main buildings are auxiliary production area, which in the direction from the south to the north is: maintenance and service workshop, laboratory, heat supply workshop, 35KV step-up station, and starting firing pump room and ash house etc. The auxiliary manufacturing area lies to the west of the main building, which in the direction from the south to the north is: staff dormitory, canteen, common room, chemical water treatment room, water tank, and cooling tower. The site covers an area of 75600m 2 and vegetation area of 18520m2. Refer to Figure2.2-2 for the layout plan.
Analysis on layout plan
1) The site has three gates with people entrance in the central gate in the south side of
Shandong Academy of Environmental Science
129
EIA Report of 2×15MW Biomass Cogeneration Project
the site and the material entrance in the southeast corner and safety exit in southwest corner. The plan has divided people and materials for easy management and safety reasons. Also, it has shortened the transportation distance on site which ensures an orderly production environment.
2) The site has clear defined areas with reasonable production procedure. The pipeline and cable layout is reasonable and avoided overlapping.
3) The cooling tower is located in the center of the west side of the site. It is far from the office block, canteen, and dormitory and it will not have noise impact to the office workers and resting employees.
4) As the office block, canteen, and dormitory are not located downstream of stack and temporary ash house, it is less likely that they will be impacted by them.
5) The cooling tower is located in the west side of the site and is at least 320 meters away from the nearest village Sanli Dianzi Village; therefore, the noise from the cooling tower will have little impact on the sensitivity objects.
6) Convenient electric outlets for easy and short connection.
Therefore, the layout plan is reasonable.
Shandong Academy of Environmental Science
130
EIA Report of 2×15MW Biomass Cogeneration Project
6.5 Fuel Selection
During normal operation, maize straw and wheat straw will be mixed in a random scale for combustion. This project is put into operation, the discharge concentrations of flue gas, SO2 and NOX can fully meet the Thermal Power Plant Atmospheric Emission Standard (Shandong provincial standard DB37/664-2007) Phase 3: in case of using wheat stalk as the only fuel, the annual discharges are respectively as follows: flue gas 15.582 t, SO2 208.0 t, NO2 195.12 t; in case of using corn stalk as the only fuel, the annual discharges are respectively as follows: flue gas 8.274 t, SO2 235.7 t, NO2 193.98t. It can be seen that when the production of flue gas is relatively greater when combustion of the wheat stalk but with less SO2 and the difference is little in terms of production of NO2 and pollutants.
The comparison of maximum ground concentration of firing maize straw and wheat straw is shown in Table 6.5-1.
Table 6.5-1 Maximum ground concentration of SO2 and NO2 (mg/m3) and occurring distance (m)
FuelStabilit
y
Wind
speed
(m/s)
Atmos
(hpa)
Air
temperature
(ºC)
Occurring
distance
(m)
SO2peak
concentration
(mg/m3)
NO2peak
concentration
(mg/m3)
Occurring
date
Maize
Straw
A 1.6 998.5 30.4 700 0.0199 0.0164 June 4 13:00
B 2.5 994.7 35.5 1400 0.0123 0.0101 June 27 14:00
C 2.4 998.7 35.0 2600 0.0098 0.0081 June 20 14:00
D 2.4 999.2 33.4 4300 0.0068 0.0056 Aug.11 14:00
E 1.5 990.9 27.9 4700 0.0030 0.0025 June15 19:00
F 1.5 998.8 26.9 6100 0.0022 0.0018 Aug.7 19:00
Wheat
Straw
A 1.6 998.5 30.4 700 0.0175 0.0164 June 4 13:00
B 2.5 994.7 35.5 1400 0.0108 0.0101 June 27 14:00
C 2.4 998.7 35.0 2600 0.0086 0.0081 June 20 14:00
D 2.4 999.2 33.4 4300 0.006 0.0056 Aug. 11 14:00
E 1.5 990.9 27.9 4700 0.0027 0.0025 June 15 19:00
F 1.5 998.8 26.9 6100 0.0019 0.0018 Aug.7 19:00
When separately firing maize straw and wheat straw, NO2 has little impact on the accessed area with maximum hourly value of 0.1164mg/m3; there is little difference in S02 density too, with 0.0199mg/m3 and 0.0175mg/m3 respectively. The proposed project during normal operation might fire them in random proportion. When firing wheat straw, maximum hourly absolute ground concentration of SO2 is only 87.94% of that of maize straw, all of which meet requirements. They all satisfy the specified standards.
The EIA report recommends using wheat stalks from the aspect of SO2 control.
Shandong Academy of Environmental Science
131
EIA Report of 2×15MW Biomass Cogeneration Project
6.6 Waste Gas Control Measures Comparison and Selection
Currently the control measures for the flue gas of boiler are ESP and bag type dust collector. As ESP is characterized by instability for small scale unit, under usual circumstances, bag type filters are selected.
The following is comparison between these two types of dust collectors and discuss on the selection of bag type dust collectors.
Bag type dust collectors is also called filters, as a type of dry method of dust collection. It utilizes organic fiber or non-organic filter to filter the dust in the air so to collect industrial dust. It has been widely used in some thermal plants in America, Canada, Australia and Europe. It has been a mature technology for the boiler to use bag type dust collectors and by now in China there have been 10 bag type dust collector manufacturers in China with their products being used all over China.
ESP is a dust removal equipment which utilized magnetic power to separate dust particles from air when it passes through the high voltage electrical field. ESPs have been utilized in China early and after many years of development, the technology has become maturer and with high dust removal efficiency.
Refer to Table 6.6-1 for the advantages and disadvantages of the two types of collectors and refer to Table 6.6-2 for the cost effectiveness.
Shandong Academy of Environmental Science
132
EIA Report of 2×15MW Biomass Cogeneration Project
Table 6.6-1 Dust collectors Comparison
Bag type collector ESP
Pros
High reliability and can adopt to load with easy operation; suitable for fine dust and can be collected and recycled; can realize service without shutdown; occupies less space; can be designed based on area; high automation; can detect and alarm in the dust removal system and does not require a lot from operators
Dust removal efficiency higher than 99% and can collect fine dust smaller than 1μm; Handle greater amount of flue gas and can be applied in high temperature, pressure and humidity conditions; can operate continuously and realize automation
Cons
Higher requirement on filtering materials when used to condensation prone oil steam or water steams; fire proof measures to be taken when filtering gas with sparks; thermal insulation measures when filtering relative humid dusty air (esp. in winter) to prevent dysfunctions; when used to filter corrosive gases, suitable corrosive resistance materials shall be used; when used to treat high temperature flue gas, temperature drop measures shall be taken to lower the temperature to ones that filter can handle for a long time.
Spacious; raw material demanding; require high voltage transformer and rectifier; normally the HV power output peak is 70-100kV, with high investment; requires high technical and management level; dust removal efficiency is affected by factors ; pretreatment is required to the initial gas with a density higher than 30g/cm3; does not have offline service function; once it is faulty, either it runs or the boiler shut down to repair .
Reliable
① can ensure long term the dust emission density <50mg/m3, not to be influenced by entry dust density and other factors; ②major spare parts——filter higher than 30000h ③ major spare parts——electromagnetic pulse higher than 1 million times; ④ All operation equipment has detection and alarm device; ⑤major service——can be performed by two people; ⑥ utilize offline function to realize service, maintenance, and it does not affect the normal operation;⑦ In northern China in winter, use compressed air to blow the filter and use insulation measures for the body can prevent condensation.
① Normal operation after initial period and can reach expected dust removal efficiency; but was affected by entry flue dust conditions;② After a period of time, the pole might change affecting the electrical field and lowers the efficiency ③ maintenance and service can only be performed after shutdown of the boiler.
Service
Once fault happens, alarm will show in the control system. The faulty one can be offline (boiler normal working condition) and serviced; the service to be carried out outside of the collector; Closing measures for broken filters in daily maintenance (when the broken ratio is less than 5%)
ESP does no have offline service function. Once fault happens, the boiler has to be stopped or collectors to be run under faulty conditions. In service, the personnel has to enter inside with arduous conditions and demanding work.
Shandong Academy of Environmental Science
133
EIA Report of 2×15MW Biomass Cogeneration Project
Table 6.6-2 Major economic indicators
Parameters Bag type collector ESP
Land space(m2) 100 300
Investment(0,000RMB) 600 640
Maintenance cost(0,000RMB/a) 36 60
From the above comparison, the selection of bag type collectors for the proposed project is based on the following:
a. Bag type collectors can meet increasing stricter environment requirement. Currently, a lot of developed nations have been using bag type collectors and it has been a mature technology. In addition, the life of bag type collection is longer than 2 years with some of them reaching 6 years.
b. Bag type collectors are noted for high dust removal efficiency and compact size (compared with ESPs). In recent year, with the development of technology, the corrosion to the bags and friction have all be effectively solved, to provide a forceful gurantee to the bag type filters.
c. Bag type collectors are not affected by factors such as load and the ones by ESPs.
d. The operation, fault and diagnosis can be automatically controlled and the bag type collectors can be serviced offline to ensure its dust removal efficiency.
e. For the same dust removal efficiency, the investment and operation cost of bag type collectors are smaller that those of ESPs. High temperature flue gas, after heat conduction in boiler and water cooler, will go through high temperature overheater, Low temperature overheater, economizer, and air preheater to conduct heat transfer. When the temperature is lowered to 150 , it will enter collector. Under this circumstance, the filter can be used longer. ℃
f. As the boiler flue gas has high temperature at the outlet, U type air cooler is used to lower its temperature.
g. Bag type collectors are the best for biomass boilers. As the stalk combustion will produce some chlorine element, which can be corrosive to the metal elements on ESPs, the bag type collectors, as they use nylon, have good resistance.
To sum up, the bag type collectors are technically mature and economically feasible for the project. With appropriate equipment, operation methods and design as well as quality assurance in the manufacturing and maintenance based on the detailed flue gas conditions, good performance can be achieved from bag type collectors.
Shandong Academy of Environmental Science
134
EIA Report of 2×15MW Biomass Cogeneration Project
Chapter 7 Environmental Management and Monitoring Plan
Environment management plan is aimed at formulating a whole set of environment measures that is technical feasible, financially economical, and practically operationable to the unavoidable environment impact in both the construction period and the operation period to minimize the negative impact of the project to the society and the environment.
The function of EMP is to list the environment measures and measures from the monitoring and supervision institutions for the construction period and the operation period to avoid and control the negative impact and suggest detailed actions for the measures. The environment management plan is a key connection for the environment impact and measures, through which to achieve the environment protection purpose.
It is clearly stated in the Regulations on Environmental Monitoring Management in Thermal Power Sector (No.280,1996, Dian-Ji, Ministry of Electric Power) that thermal power plant environmental monitoring forms an essential part in the monitoring and management of industrial pollutants as it provides the state and sector administrative authority the emission status and trend. Data from monitoring provides the criteria for environmental management and pollution control and the basis to check whether there is compliance with the environmental protection laws and regulations. Therefore, the power enterprises shall establish a perfect environmental management and monitoring organization. They shall based on the features of the production technology and nature of emission, establish a comprehensive environmental organization and strengthen environmental monitoring management. On-site monitoring shall also be carried out and the environmental protection shall be integrated into the production management to ensure the implementation of pollution control measures to realize the aim to better the environment and lower emission of pollutants.
As there is huge difference in the environmental management content during the construction and operation period of the project, also as there is difference between temporary and permanent nature for the two periods, independent and separate environmental management organizations shall be established for each period to be responsible for the management for their own periods. The organization for the construction period shall cease to exist when the construction is over and the organization for the operation period shall come into function. Based on practice conditions, there is allowed an overlapping period for the two organizations.
7.1.1.1 Environmental Management Organization During the Construction Period
Shandong Academy of Environmental Science
135
EIA Report of 2×15MW Biomass Cogeneration Project
In order to ensure the effectiveness and impartiality of the environmental management, independent management implementation organization shall be established and the staff in the organization shall be personnel with qualifications and experience and capable of carrying out the work. Separate offices shall be set up for the on-site construction work and water supply and drainage work. Refer to Table 7.1-1 for detailed configuration.
Table 7.1-1Configuration for Environmental Management Organization in Construction Period
Personnel Configuration On-site Works Piping NetworksTeam Head(No.) 1 1Environmental Air Monitor(No.)
7.1.1.2 Environmental Management Organization in Operation Period
To strengthen the environmental protection in the operation period, the company will set up special environmental management and monitoring organization to supervise and monitor on the environmental problems on site. Based on the scale and characters of the proposed project, the company will have environmental protection department and monitoring and analysis office. The environmental protection department will under direct leadership of one of the operation manager and the department will have 2 personnel with 1 director and 1 clerk and they will be responsible for the environmental protection work. The monitoring and analysis office will have one director and 4 lab analysts (3 of whom shall be co-positioned by personnel from the Chemical Water Treatment Department). They will be responsible to monitor all the pollution items on site. One of them will be specially responsible for the statistics and filing of the monitoring data to prevent pollution incidents. The configuration for the organization can be solved within the company through adjustment.
In terms of administrative function, the monitoring and analysis office shall be under environmental protection department. Refer 7.1-2 for details:
Shandong Academy of Environmental Science
136
EIA Report of 2×15MW Biomass Cogeneration Project
Table 7.1-2 Configuration of Environmental Protection Organization
No.
Environment Protection
OrganizationPersonnel Configuration Shifts
No.
1Environment Protection Department
Director Day Shift 1
Clerk Day Shift 1
2Monitoring and Analysis Office
Head Day Shift 1Analyst 1 Day Shift 1Analyst 2 Co-positioned by
personal from Chemical Water Dept.
Day Shift 1Analyst 3 Day Shift 1Analyst 4 Day Shift 1
3 Total 4
7.1.1.3 Emergency Management and Responsibilities
The emergency measures during the operation period are oriented towards effective rescue operations and minimize consequences including casualties, property losses, and environment destruction. Therefore, emergency management team shall be established with responsibilities. The responsibilities of leading group: in case of fire accident, the leading team is responsible for directing all rescue works; giving orders; coordinating works of individual teams; making decision based on latest conditions; reporting to local firefighting departments and related authorities at the first time. Members of this team take turns on duty. If emergent fire accident occurs, the member on duty will be the deputy team leader taking in charge of all relative activities before the team leader arrives at site.
Duties of individual teams are as follows:
Contact team: get to know details of accident and report to management level and local related construction authorities, electric authorities, labor authorities and families of concerned persons.
Rescue team: as per orders from leading team, rush to save life and property and organize persons to accompany injured in hospital. In case out of control, inform contact team to ask for help from authorities.
Evacuating team: organize people to evacuate and escape from site.
Health care team: cure injured persons and send them to hospital.
Logistics team: save materials and provide supply of tools and materials.
Guarantee firefighting team: participate in fire fighting as per preplan.
Organize saving actions and evacuation, or take measures to protect other persons inside dangerous zone. Save injured people is the foremost target. Rapid, orderly and
Shandong Academy of Environmental Science
137
EIA Report of 2×15MW Biomass Cogeneration Project
effective actions are critical for reducing injury rate and property loss. Staff should be trained of self protection in case of fire accident; notify villagers of Sanlidianzi to take necessary measures of self protection; if necessary, organize staff and villagers to evacuate from dangerous or potential dangerous area.
Promptly control the situation and detect the hazard caused by fire accident and evaluate the hazard area, nature and degree. Control the source of hazard is an important task of fire fighting. Only the source is under control, effective rescue efforts can be carried out. The guarantee fire fighting team and fire fighters should be organized as soon as possible to control the situation.
Eliminate the impact of hazard and recover the site. Take measures such as enclosing, isolating, flushing and detecting should be taken to prevent further hazard to people, soil and air. Clean the remainders and recover basic facilities to a relative stable state.
Find out the accident cause and evaluate hazard degree. Timely investigate the cause and nature of accident and evaluate the hazard range and degree of accident. Record the injury, damage and loss situation.
7.1.2 Standardized Management on the Discharge ports
The discharge ports are the passage of pollutants to enter the environment and affect the environment after the project completion. Strengthening on the management of the discharge ports is one of the essential works to realize pollutants amount control and also an important means to realize scientific and quantitative pollutants emission from regional environmental management.
7.1.2.1 Basic Principle on Standardized Management of Discharge port
1) All the discharge ports to the environment have to be standardized.
2) Based on the feature of the work and the total control indicators entered by the state, the waste water discharge outlet and boiler stack are regarded in the project as the environmental management focal point.
3) The discharge ports shall facilitate sampling and metering and monitoring as well as daily site supervision and monitoring.
7.1.2.2 Technical Requirements on the Discharge ports
1) The location of the discharge ports have to reasonably determined and based on the requirements of No.470 (96) Huan-Jian, they have to be standardized.
2) The waste water discharge sampling place shall be located as per the requirement in Pollutants Monitoring Technical Specifications in the whole discharge port, and the inlet and outlet of waster water treatment facilities.
3) Set standardized speed metering sections that is easy to meter the flowing speed.
Shandong Academy of Environmental Science
138
EIA Report of 2×15MW Biomass Cogeneration Project
4) The sampling port of the exhaust pipe of the waste gas purification facility in the boiler house shall be in compliance with pollutants monitoring technical specifications.
5) The fuel storage field has to be equipped with flood-control, loss-prevention and fire control measures.
7.1.2.3 Discharge ports to Be Notified through Signs
1) There shall be environmental protection signs made by National Environmental Protection General Bureau on the pollutants outlets according to the National Environmental Protection Signs-Pollutants Outlets (Source)(15562.1-1995) and Environmental Protection Signs-Solid Waste Storage(Handling) Fields (GB15562.2). Refer to Figure7.1-1 for the signs.
2) The signs shall be an eye-catching place close to the sampling spot. The signs shall be kept 2 meters from the ground from their upper sides.
Refer to Table 7.1-3 for the shapes and colors of the signs.
1) Upon completion of this Project, Registration for Graphic Signs at Normalized Discharge Ports in People’s Republic of China printed uniformly by the State Environmental Protection Administration of China shall be filled in as specified.
2) According to requirements of management files of discharge ports, information such as category, volume, concentration, discharge direction, identification sign of main pollutants as well as operation condition of facilities shall be recorded and filed.
Refer to Table 7.1-4 for the summary of environment management mechanisms.
Shandong Academy of Environmental Science
141
EIA Report of 2×15MW Biomass Cogeneration Project
7.1-4 Environment Management Mechanisms
Stages Project relevant parties Duties
Personnel requirement
s
Design and preparation
Client or project office
Coordinators have office and transportation means and budget ; in the bidding document list all technical specifications ; ESD ensure implementation of measures and land usability.
Project office by the client
Designing institute
Assist the company to select site and production process
Project team by the design
institute
EA institute Identify major environment impact and discuss on control measures
Project team by EA
institute
Construction period
Project Owner or office
Select qualified contractors and supervise the contractors to implement control measures. The team head shall report to the project management and compile a monthly environmental management inspection results and raise solutions to the potential environmental problems found in the inspection. The monitors for the air, noise and solid waste shall, based on plan, to inspect on the implementation of the preventive measures of all pollutants in the construction period. The monitors shall be responsible to arrange all the monitoring to be carried out based on plan on the place and at the time. They shall monthly report to the team head regarding the inspection, monitoring result and on-site handling comments. The complaint hotline handling staff shall be responsible to record, file and report to the team head and be responsible to inform the public about the results.
Environment control team
Contractor
Responsible to implement control measures in the environment management plan ; carry out monitoring to the environment activities ; and provide performance journal once every day or week.
Establish assessment
team
Work/Environment
inspector
Supervise contractor to carry out work according to environment management plan; Record implementation condition in the environment measures in the monthly report by the inspectors.
Establish assessment
team
Environment Monitoring Unit
Monitoring the pollutant emission during construction period according to environment
Monitoring
Shandong Academy of Environmental Science
142
EIA Report of 2×15MW Biomass Cogeneration Project
Stages Project relevant parties Duties
Personnel requirement
s
monitoring plan. team
Environment protection bureau Comprehensive inspection to the construction Inspection
team
Operation period
The project owner or operating company
a) Implements environmental protection laws and regulations;
b) Make and modify Enterprise Environmental Protection Regulations and supervise on the implementation;
c) Make and organize to implement environmental protection plans;
d) Lead and organize environmental monitoring;
e) Check on the operation status of environmental protection facilities and raise corrections and suggestions once problems arise;
f) Promote environmental protection advanced technology and experience and promote clean production technique.
g) Organize and develop environmental protection scientific and research and academic exchange;
h) Make environmental monitoring plan according to the environmental protection authority and organize and coordinate to complete the monitoring plan;
i) Organize and develop environmental protection special training to raise the quality of the personnel;
j) Organize pollution survey to make clear and master pollution status of the company and establish pollutants profile and statistics.
Establish environment control office
Environment monitoring
institute
Based on environment management plan and national relevant requirements, to carry out monitoring to the waste gas, water, solid; carry out online monitoring to waste gas and waste water
Establish monitoring
team;Online
monitoring device
Authorities in charge of operation
Periodically carry out inspection to the project and major environment protection facilities.
Inspection team
Shandong Academy of Environmental Science
143
EIA Report of 2×15MW Biomass Cogeneration Project
7.2 Environment Impact Buffering Measures
Refer to Table 7.2-1 for major environment impact and its reduction measures.
Shandong Academy of Environmental Science
144
EIA Report of 2×15MW Biomass Cogeneration Project
Table 7.2-1 Table on Environment Impact and Reduction Measures
Stage Activities Major Negative Impact Impact reduction and control measures Carried by Supervised
by
Design and Preparatory
Select design institute and EIA institute to select
site and techniques
No negative impact though the site
selection will decide whether the project
is reasonable or not.
Choose quality institutes to compare the site plans and technique plans. Consult farmers in the villages and experts. Principle on the selection of the collection agents: 1. They shall be more than 200m way from sensitive
objects such as villages, natural reserves, cultural heritage areas;
2. The site shall be preferred deserted warehouses and shall not be arable land.
3. The site shall be close to highway.
Project office
Anqiu Shengyuan
BiomassCo., Ltd.
Construction Period
Leveling and excavation
Mechanical noiseNoise: set noise barrier to the east border of the site to less the impact to the residents and ban construction on night and lunch break hours.
Construction company
Construction company and
Anqiu Environment
Bureau
Temporary soil and deserted soil; dust
suspension; Ambient air
1. immediate compaction to the excavation or disturbed surface to prevent soil erosion.
2. To the naked ground, conduct water spray to prevent dust suspension.
3. construction waste and domestic waste, shall be deposited to be handled by Anqiu Sanitation Department.
Waste water Water environment: set up a septic tank for simple treatment and recycle for construction site.
Soil Plant coverage damage, water and
soil loss
1. Perimeter works: surrounding the site to build a perimeter to provide convenience to the construction and also prevent soil loss.
2. implement strict construction plan and minimize the construction time and excavation and space used.
Shandong Academy of Environmental Science
145
EIA Report of 2×15MW Biomass Cogeneration Project
Stage Activities Major Negative Impact Impact reduction and control measures Carried by Supervised
byConstruction of
Workshop, office building, cooling
tower and installation of boiler, turbine, generators
Mechanical noiseNoise: set noise barrier to the east border of the site to less the impact to the residents and ban construction on night and lunch break hours.
Temporary Deserted Soil, dust and
ambient air
1. Timely cleaning of the main transportation roads relevant to the project to maintain the cleanliness to reduce dust suspension;
2. To vehicles carrying bulky materials, cover them with awning to prevent falling and dust pollution;
3. The dust suspension areas, such as concrete mixing spot and cement stockyard etc, shall be located in the wind downstream of the main construction site and sensitive objects. In addition, there shall be isolation perimeters and baffles to be set up surrounding those areas to prevent dust suspension and spread. The construction material piles shall be covered by awnings.
4. construction debris and domestic waste to be deposited in designated places to be handled by Anqiu Sanitation department. The domestic waste from the site workers shall be collected and sent to designated place for treatment. It is forbidden to be stacked or earth filled to prevent permeation underground.
Waste water Water environment: septic tank to be set up for water treatment; recycle the water for material flushing.
Destruction of green coverage; water and
soil loss
1. Compensate for the green coverage damaged with consideration of spatial arrangement and species to be planted and where to have the green coverage; Water and soil loss: 1) Green Coverage Measures: On site, a
comprehensive spatial prevention system
Shandong Academy of Environmental Science
146
EIA Report of 2×15MW Biomass Cogeneration Project
Stage Activities Major Negative Impact Impact reduction and control measures Carried by Supervised
byinvolving arbor, shrubs and herbs. By doing that, a system can be formed with great ecological functions and can prevent disturbance. Based on the principle, in the cultivation, under the arbor layer, there shall be at least a layer of shrubs or herbs.
2) Preference shall be given to local species as they are adaptive to the local environment with great survival rate and adaptation. Proportion among arbors, shrubs and herbs shall be determined based on their ecological functions. In a fixed area, enlarging the proportions of arbors and shrubs could boost the ecological functions of the green coverage.
3) The trees along both sides of the road can be considered to be noise reduction measures.
2. Green coverage can be carried out by planting trees and herbs. On site, there shall be a spatial prevention system with arbor, shrubs, and herbs as well as vine species. In administration area, the green coverage shall be focused on landscape. There shall be herbs with artificial hills and fountain etc. In manufacturing area, species with pollution resistance, dust absorption, and noise absorption shall be selected. Along the pipelines, species with shall rooting shall be selected. Tall tress shall not be selected for booster station as they will interfere with fire control and lightening functions.
3. Water pool: Upon the completion of the project, the leveling of site will also be completed. The landscape change makes it possible that rain water will make flushing of the site. In order to prevent flushing of the rainwater to the surface, it is recommended that the south canal(which runs through the site) to be used
Shandong Academy of Environmental Science
147
EIA Report of 2×15MW Biomass Cogeneration Project
Stage Activities Major Negative Impact Impact reduction and control measures Carried by Supervised
byas ground water pool. Not only can it save on rain water and reduce flushing, but also the rain water collected can be used for construction use or water spraying functions. During operation period, it can be used as landscape or provide water for grass irrigation.
4. Planting grass bricks is a popular gardening ground paving technique popular in China now, the guiding principle of which is to change complete hardening of the ground in the past and to make the ground and underground maintain energy exchange, including water and air etc.
Piping:
1. sectional construction to minimize the construction scope;
2. signposts the construction area and isolate it with barriers;
3. construction time to be as per specified and avoid resting time of people; and
4. water spraying to avoid dust suspension in dry weather.
Operation period Boiler operation
Boiler flue gas and dust; ambient air
1. Adopt bag type filter with 99.9% efficiency; 2. Reserved space for desulphurization; 3. Install flue gas continuous monitoring system; 4. the storage yard has a cover at the top, flashing
boards under beams and 1m high enclosing walls 5. Automatic pulsed back flushing type bag filters are to
be arranged at the top of temporary slag and ash yard for purifying ash carried with air, the ash and slag are to be transported by closed tank truck, and the dust escaped during loading and unloading is to be cleaned timely to avoid spreading thereof.
Anqiu shengyuan
biomass co., ltd.
Anqiu environment
protection bureau
Circulating drainage 1. After treatment in septic tank, the domestic waste
Shandong Academy of Environmental Science
148
EIA Report of 2×15MW Biomass Cogeneration Project
Stage Activities Major Negative Impact Impact reduction and control measures Carried by Supervised
bywater, acid/alkaline
water, oily water and domestic waste
water
water is discharged into sewage plant. 2. As circulating cooling water is good, it is discharged
to rainwater network. 3. The acid/alkaline waste water, after neutralization
and sediment, is partly recycled and partly drained to rainwater network.
4. Oily water, after pre-treatment, is discharged to sewage plant for treatment.
5. The project to be built should utilize anti-seepage measures, and establish and perfect the wastewater and rainwater collection system. Special pipes are used for the collection and transportation of domestic sewage and industrial waste water. Pipes are made of anti-corrosion materials. Cesspool for domestic sewage precipitation and facilities for treating industrial waste water should be made of steel and concrete structure, and the ground should be of concrete.
6. The normal operation of whole plant including water treatment equipment should be kept so as to increase recycle utilization rate of waste water. Therefore, the impact to the groundwater environment by the construction waste water can be reduced or avoided.
7. After operation of project, in addition to regular inspection of water treatment equipment and pipes to avoid any kind of leakage, the measures should be taken to avoid any impact on the local groundwater.
8. Strict anti-seepage measures should be taken for the ground of both production area and waste water treating area. The bottom of cesspool and chemical water treatment workshop of the project to be built should be paved with a steel concrete layer of 1 m
Shandong Academy of Environmental Science
149
EIA Report of 2×15MW Biomass Cogeneration Project
Stage Activities Major Negative Impact Impact reduction and control measures Carried by Supervised
bythick.
9. Reinforced concrete should be applied for the waste water emergent pool with a bottom thickness of 800mm and wall thickness of 300mm; special anti-seepage materials should be used for the underground waste water pipelines, such as RPM pipe, bentonite waterproofing carpet.
10. Strictly manage the domestic garbage to avoid injurious ingredient from entering groundwater. Domestic garbage should be packed in bags and treated by Anqiu environment protection service units.
Noise from equipment and cooling towers
a) Vibration-damping substrates are to be adopted for turbines, generators, various pumps and fans;
b) Silencers are to be installed at boiler venting pipe nozzles, inlets of safety valves and air compressors;
c) Flexible joints are to be used at air pipe connections and compensation joints are to be disposed to reduce noise due to vibration;
d) HP jetting type silencers are to be installed at blowing pipe nozzles and the blowing pipe shall avoid residents’ rest period as far as possible;
e) Sound absorbing plates are to be hung in turbine house;
f) Independent foundations are to be adopted for such large equipments as turbines, boilers, circulated water pumps etc. to reduce noise due to resonance;
g) Vibration and impulse reduction requirements shall be considered when making pipe arrangement, design and hangers/supports selection in order to reduce the effects of noise on environment;
h) The enclosing structures for air compressor room shall adopt sound isolation door, sealed sound
Shandong Academy of Environmental Science
150
EIA Report of 2×15MW Biomass Cogeneration Project
Stage Activities Major Negative Impact Impact reduction and control measures Carried by Supervised
byisolation windows, silencing air-inletting louvers and silencing air exhausters;
i) All control rooms are sound isolated and equipped with sound isolation doors, double-layer sound isolation observing windows and sound absorbing ceiling.
Domestic waste and old packages and
dust and ash collected by the dust
collector
1. Old package and domestic waste shall be collected and handled together by the sanitary department of Anqiu.
2. The ash and slag of the project will be purchased by Shandong Aobao Chemical Group.
Storage, crushing and delivery of
stalks
Foul gas in stalk storage and dust
suspension in crushing and
conveying of stalks.
1. Crusher room and dust suspension areas (cutting machines, cylinder sieves and offloading ditch) are arranged at fuel crushing section, with air exhausting and dust removing devices disposed in the room. The dust produced by crusher will be exhausted by air fans to bag filters for filtering and then discharged;
2. During fuel transportation, the dust is to be reduced by spraying water and periodic cleaning to avoid dust from polluting environment;
3. At the head section of the conveyor belt, bag type filter is to be installed and buffering rollers to be adopted in the fuel guiding grooves. The fuel shall fall between the feeding buffering rollers.
4. The falling height of the fuel shall be minimized to prevent dust suspension. If the distance is high, buffering air lock shall be set up.
5. At the head drum of belt conveyor, cleaner or vibrator is to be installed for cleaning the fuel adhered to working surface of belt, with the size of head hopper being suitable for receiving the cleaned fuel material; before the tail drum and the first turning drum of perpendicular tensioning device, cleaner is to be
Shandong Academy of Environmental Science
151
EIA Report of 2×15MW Biomass Cogeneration Project
Stage Activities Major Negative Impact Impact reduction and control measures Carried by Supervised
byinstalled for cleaning the fuel adhered to non-working surface of belt.
6 Enclosures around storage yard and shed can effectively avoid dusting from stalk storage.
7. By spraying water etc. the dusting can be minimized during stalk unloading and unpacking.
8. The vehicles loaded with stalk are to be covered by awning and enter the power plant under cover to avoid dusting during transportation. The stalk packs are to be unloaded by forklift or to be used at the time of unloading.
9. Additionally, green belt is to be planted around storage yard and around the plant to further control dust and noise.
Stalk storage environment risk
1) eliminate and control sources of open flame: conspicuous “No Open Flames” sign should be set inside stack yard and shed; vehicles entering dangerous area should be equipped with spark extinguisher and flame trap, stop air draft and close ash box; personnel entering dangerous area should register as required and match and lighter are forbidden; all permits for gas welding and electric welding operation should be issued before carried out. During operation, dangerous state of tools and equipment should be eliminated. Fire extinguishers should be ready before operation; all operation should be performed as per safety technical regulation.
2) prevent electrical spark: measures should be taken to prevent sparks caused by switching electrical lines or facilities, bad contact, short circuit and electricity leakage as well as electrostatic discharge; lightning grounding measures should be taken to avoid
Shandong Academy of Environmental Science
152
EIA Report of 2×15MW Biomass Cogeneration Project
Stage Activities Major Negative Impact Impact reduction and control measures Carried by Supervised
bylightning discharge spark.
3) Ventilation of storage should be well arranged; anti-moisture measures should be taken to prevent from producing inflammable gases by rotten straw; a certain distance should be kept between stack yard, material shed and other structures to avoid fire spreading in case of fire
4) Circular firefighting path shall be constructed surrounding the storage fields. There shall be safe protection distance among the storage field, fuel shed, and surrounding structures to prevent fire spread.
5) Emergency management and rescue organization or emergency management and rescue personnel team should be established and provided with necessary equipment. Firefighting measures should be inspected regularly to maintain their validity. And periodic drill shall be carried out.
Dust collector fault risk
1) Precautionary measures. Design, installation and operation of cyclone dust collector and bag dust collector should be highly regarded to eliminate potential risks and ensure normal operation of dust collectors. At the same time, high reliability bags should be adopted; online continuous gas monitoring instrument is installed and appointed staff is responsible for monitoring and control. When discharge concentration of soot dust increase abnormally, it indicates that failure of dust collector may occur. Relative department should be informed to inspect and repair dust collector; maintain equipment in a sound state; together with perfection of regulations, staff training should be improved. Possibility of accident will drop to the minimum when sufficient measures have been taken for both
Shandong Academy of Environmental Science
153
EIA Report of 2×15MW Biomass Cogeneration Project
Stage Activities Major Negative Impact Impact reduction and control measures Carried by Supervised
byequipment and management.
2) Emergency Preplan: Once bag dust collector fails and causes low efficiency of dust collection, failure cause should be find out in time and dust collector should be fixed in the shortest time; if the accident is serious and can not be recovered within four hours, report the situation to power dispatch department to reduce production load even to shutdown unit.
Shandong Academy of Environmental Science
154
EIA Report of 2×15MW Biomass Cogeneration Project
7.3 Environmental Monitoring System and Plan
7.3.1 Monitoring Equipment
A certain amount of monitoring equipment shall be equipped in the environmental monitoring station to meet the demand of monitoring work. Refer to Table 7.3-1 for main monitoring equipment. In addition, based on Thermal Power Plant Atmospheric Pollutants Emission Standards, the stack of the project shall be equipped with monitoring device to continuously monitor the concentration of flue dust and SO2 in the flue gas in accordance to GB5468-91/T16157-1996. During the construction of the stack, it is required to set permanent sampling holes based on requirements.
Table 7.3-1 List of Environmental Monitoring Equipment
No. Name of Device Type Amount Use1 Analytical Scale FA-1004 1 Weighing
2COD Measuring
DeviceTL-1A 1 Measuring
3 spectrophotometer 752 Model 1 Spectrum4 Acidity meter PHS-3C 1 pH
5Portable salinity
meterHI931100 1 Measurement
6 Conductivity meter DDS-11A 1Water quality
analysis
7 Turbidity meter QZ201L 1Water quality
analysis
8Centrifugal separator
300 1Quick centrifugal
sediment
9Atmospheric
samplerKB-6 3 sampling
10 Drying box CF-2 1 drying
11Flue dust sampling
deviceSYC-3 2 measurement
12Continuous flue gas monitoring device
-- 1 measurement
13Noise measuring
deviceAWA6218 1 Noise
14 Portable flow meter LJX Model 1 Flowing Rate15 Fridge Any 1 Storage
Shandong Academy of Environmental Science
155
EIA Report of 2×15MW Biomass Cogeneration Project
7.3.2 Monitoring Regulations and Analytical Methods
7.3.2.1 Monitoring Content
1) Construction Period
Based on the features and practical conditions of the pollutants during the construction period, certain monitoring regulations shall be established and implemented. The monitoring methods shall be implemented in accordance to the current standards and regulations of the state and ministry. Refer to Table 7.3-2 for the monitoring content.
Table 7.3-2 Environmental Monitoring Plan During Construction
No.
Environmental Factor
Monitoring Spot
Monitoring Items
Monitoring Frequency
Monitoring cost
1 Air
Storage yard of construction
materials; unpaved
construction road;
neighboring residential
areas
TSP
1 period/2 months, 2days/period, 2
times/day
Random Check on dry weather (windy
conditions)
2400RMB
2 NoiseBorders to the
siteLeq
Monthly, Twice a day, one in
daytime and the other night time
2400RMB
2) Operation Period
After the project completion, all monitoring regulations shall be set up based on features of emissions and practical conditions of the project. Relevant monitoring items and monitoring spot and frequency shall be implemented according to Thermal Power Plant Environmental Monitoring Regulations and DL/T414-2004 Thermal Power Environment Monitoring Specifications. The kcy monitoring content includes waste gas, waste water, solid waste, noise etc.
All the monitoring equipment for the project monitoring plan is owned by the monitoring company. The project owner shall pay suitable amount for the depreciation of the equipment and does not need to purchase new monitoring equipment. The depreciation cost shall be included in the monitoring cost. The monitoring cost of the pollution source of the project is RMB36450RMB per year
Shandong Academy of Environmental Science
156
EIA Report of 2×15MW Biomass Cogeneration Project
and the environment monitoring cost is RMB11200 per year, that is a total of RMB47650 annually.
Refer to Table 7.3-3 for details about pollutant monitoring. Refer to Table 7.3-4 for Environment Quality Monitoring Information.
Table 7.3-3 Table on Pollutant Monitoring Information
Item Monitoring Purpose
Monitoring Spot Monitoring Content Monitoring
FrequencyMonitoring
cost
Flue Gas
To understand and calculate
flue gas handling and emission; to understand
conditions that might produce unorganized emission of
dust
Flue gas outlet
terminal and flue duct;
fuel shredding chamber; feeding
ditch; and ash storage
room
Concentration of SO2, flue dust, and
NOx
And the emission rate and flue gas
amount
Dust
Continuous online
monitoring
One period every quarter
of a year
0.98million RMB*
600RMB per year
Waste
Water
To understand and calculate
the waste water and discharge
Waste water
discharge port
Amount of waste water produced and
emission concentration of all
key pollutants
One period every week
28800RMB per year
Solid Wast
e
To summarize the amount of
solid waste produced
during production
Bagging room, and slag room
Slag amount and handling methods
Daily during normal
production
5450RMB per year
Noise
To understand key noise producing
equipment in all workshops
Noise source of
workshopsLeq[dB(A)]
Once every quarter during
normal production
2600RMB per year
FuelTo understand
actual fuel consumption
Fuel Storage
Field
Fuel Composition, Source and Amount
Daily report and summary
Note: * Online monitoring equipment investment in the operation period is lump sum 0.98million RMB, which is to be calculated as the environment protection investment.
Shandong Academy of Environmental Science
157
EIA Report of 2×15MW Biomass Cogeneration Project
Table 7.3.4 Table on Environment Quality Monitoring
Item Monitoring Purpose
Monitoring Spot
Monitoring Content
Monitoring Frequency
Monitoring cost
Ambient Air
Understand the air quality
surrounding the site
Sanli Dianzi, Daweiyuan,
Sanli Zhuang, Anqiu No. 1
Middle School
SO2, PM10t,NOx,
TSP
1 period per season
3200RMB per year
Surface Water
Understand water quality from South Main Canal
South main canal near the
site
BOD,COD,NH3-
N,SS, flow rate
1 period per month
7200 RMB per year
Acoustic
Understand noise level in
the border4 borders Leq[dB(A)]
1 period per half a year
800 RMB per year
7.3.2.2 Monitoring Analytical Methods
The methods shall be in accordance to the relevant regulations on the pollutants monitoring analytic methods specified in Environmental Monitoring Specifications, Consistent Monitoring Methods on Pollutants, Air Quality Standards, Ground Water Quality Standards, Boiler Flue Dust Measuring Methods, and Thermal Plant Monitoring Technical Specifications.
Shandong Academy of Environmental Science
158
EIA Report of 2×15MW Biomass Cogeneration Project
7.3.3 Training Plan of Environmental Protection
In order to ensure the smooth and effective implementation of environmental management, knowledge and skill training of environmental protection shall be carried out to the all parties (project office, client, contractors, supervisors, operation enterprises and enterprise employees). The training shall include the significance of protection and importance of implementation and also training catered to different positions. Refer to Table 7.3-5 for the Budget on Environmental Protection Training of the Project.
Table 7.3-5 Training Budget for Environmental Protection Personnel
Training Personnel Content Number PeriodCost(0,000RMB
)
Contractors and EP personnel and shift
supervisors
Construction period pollution control measures to be combined in the training
for safety operations 2 2 days
2.5
Monitoring methods of noise level in the construction period and control measures
2 3 days
Clerk of Works on site
Environment Control Plan certain measures and requirements; relevant
environment protection laws and regulations, work procedure and
supervisory details in the construction period
1-2 3 days
9.0
Ambient Air monitoring and control techniques, noise level monitoring and
control techniques 6 5 days
Project Owner/Operation
Company and their management
All the above content and environmental management plan for operation period and environmental protection facility
operation and maintenance
8 5 days 10.0
Total — — — 21.5
Shandong Academy of Environmental Science
159
EIA Report of 2×15MW Biomass Cogeneration Project
Chapter 8 Public Participation
8.1 Brief on Public Participation
Public participation is a crucial part of environmental impact assessment and is a bilateral communication between the construction company and the public. The purpose of public participation is to make the public understand the type, scale, site, content, pollutant emission, and control measures of the project and under the comprehension of the above, the public could fully express their suggestions and comments of the project and raise corresponding request for the construction company. The company, upon receiving them, will implement the suggestions and comments to the detailed assessment gradually to ensure the clean production and practicability of the pollution control measures.
The aim of this public participation is to familiarize the public who are affected by the project environmentally about the 2*15 biomass cogeneration project and to provide feedback to the environmental administrative authority and the construction company about the attitude, comments and suggestions of the public to ensure more reasonable and perfection of design and construction of the project so to maximize the comprehensive and long term benefits of the project.
8.2 The Scope of Public Participation Survey and Methods
The public survey is implemented according to Circular on Printing and Issuing of Environmental Impact Assessment Public Survey and Provisional Methods (Huan-Fa, 2006, No.28) and China Environmental Impact Assessment Law.
8.2.1 Time and Scope of Survey
The construction company carried out the public survey between July 3, 2007 and August 15, 2007. The scope of the survey includes villages around the construction site and partial regions of Anqiu urban area.
8.2.2 Survey Methods
The survey methods include notices to the public, questionnaires to be filled out, and simplified version of the report publication. The public notice is through Anqiu TV Station to inform the public. After broadcast of the notice, questionnaires will be distributed and collected to get the public opinion on the project. Also, simplified version of the environmental impact report and other environment impact information will be publicized and broadcasted to the public through Anqiu TV Station.
Shandong Academy of Environmental Science
160
EIA Report of 2×15MW Biomass Cogeneration Project
8.3 Public Participation Procedure
8.3.1 The First Public Notice
The first public notice was broadcasted on Life Cable Channel of Anqiu TV Station between July 3 and July 8, 2007 with an aim to familiarize the public with the environmental impact assessment work procedure and content and the contact information, including:
1) Name and brief of the project 2) Name and contact of the construction company of the project 3) Name and contact of environmental impact assessment authority
Refer to the appendix for the details on the notice.
8.3.2 The Second Public Notice
The second public notice was broadcasted on Life Cable Channel of Anqiu TV Station on 8:00am and 20:00pm on August 3, 2007 with an aim to brief the public of the project and its possible environmental impact and the proposed control measures, including:
1) Brief introduction on the project;
2) Brief on the possible environmental impact of the project;
3) Key points listed in the environmental impact assessment conclusion in the environmental impact report;
4) And the methods and period of the public to read the simplified version of the environmental impact report and raise comments.
Refer to the appendix for details.
8.3.3 The Third Public Notice
The construction company-Anqiu Shengyuan Biomass Co., Ltd. Issued its public participation notice on Anqiu Today, a local newspaper, on November 24, 2009, and also posted public notices in the surrounding villages around the site, the content of which includes:
Project brief;
The possible environment impact of the project and its corresponding control measures;
Project compliance with the industrial policy;
EIA summary;
Methods for project understanding and feedback;
Shandong Academy of Environmental Science
161
EIA Report of 2×15MW Biomass Cogeneration Project
Address for EIA perusal: Preparatory Office of Anqiu Shengyuan Biomass Co., Ltd.
Website for EIA perusal: www.saes.com.cn
Photos of the newspaper clip and public notice are attached.
8.3.4 Questionnaires
After the second public notice, the construction company handed out questionnaires to collect the public opinion on the project.
Refer to the appendix for the questionnaires.
8.3.5 Public Notice for Fuel Storage Fields
Public notices have been posted around the villages where the fuel storage fields will be located on March 20, 2010 by the project company, Anqiu Shengyuan Biomass Cogeneration Co., Ltd. The content of the notice includes:
Brief of the project;
Brief on the selected fuel storage fields;
Potential environmental impact during fuel storage and transportation and control measures;
Project compliance with industrial development policy and public opinion feedback options;
Refer to the attached for the photos on the posted notices.
8.4 Public Survey Questionnaire
8.4.1 Distribution Proportion Based on Region
100 questionnaires were distributed and refer to Table 8.4-1 for the distribution proportion. All of them have been collected back and all of them are valid. Refer to Table 8.4-2 for the background of the respondents.
8.4.2 Analysis on the Public Opinion to the Project
Through statistical analysis to the questionnaires, the public is unanimous to all the questions of the project, which shows more active participation of the public to the public sector and certain knowledge of the project environmental impact. Refer to Table 8.4-3 for summary of the public opinions.
Shandong Academy of Environmental Science
163
EIA Report of 2×15MW Biomass Cogeneration Project
Table 8.4-3 Summary of Some Opinions from the Public to the Proposed Project
Question Attitude Number
Proportion on Valid
Questionnaires (%)
Preferred Consideration
1. Do you know the
construction of the project?
Yes 95 95 √
No. 5 5
2. What do you think of the air
quality surrounding the
proposed site?
Good 91 91 √
Slight Pollution 9 9
polluted 0 0
Heavy Pollution 0 0
3. What do you think of the
pollution of the surface
water in Mushan Reservoir?
Good 92 92 √
Slight Pollution 8 8
polluted 0 0
Heavy Pollution 0 0
4. What do you think of the
pollution of the ground water
surrounding the proposed
project site?
Good 89 89 √
Slight Pollution 11 11
polluted 0 0
Heavy Pollution 0 0
5. What do you think of the
effect of the project
construction to the
neighboring environment?
Nil 47 47
Little 53 53 √
Some 0 0
Heavy 0 0
6. Do you think the project will
promote the economic
development in the local
area?
Yes 97 97 √
No 0 0
Little 3 3
Unsure 0 0
7. Do you think the project can
boost the farmer income
and improve their living?
Yes 99 99 √
No 0 0
Little 1 1
Unsure 0 0
8. Which environment effect
are you more concerned
brought by the project?
Water 3 3
Air 51 51 √
Noise 46 46
Others 0 0
9. Do you regard the control
measures of the project can
effectively inhibit the effect?
Yes 98 98 √
No 0 0
Unsure 2 2
10. What do you think of the
project after considering all
the effects brought by it?
Approval 92 92 √
Disapproval 0 0
Unsure 8 8
Shandong Academy of Environmental Science
164
EIA Report of 2×15MW Biomass Cogeneration Project
8.4.3 Analysis of Public Opinion
As shown in the Table 8.4-2, 73% of the respondents are between 36 and 60 years old, followed by 25% of 18 and 35 years old. Also, among the respondents, 63% of them do not have certificates from junior high schools and 31% are with diplomas. Concerning what the respondents do, majority of them are farmers with 86%. To sum up, the public composition is reasonable and the result of the questionnaire can reflect the basic opinion of the neighboring public to the project.
As shown by Table 8.4-3:
1) 95% of the respondents have already become aware of the construction of the project before the environment impact assessment.
2) 91% of the respondents thought the air quality near the site is good and only a small proportion, 9%, thought there is slight pollution. That means the public generally think the air quality now around the site is good.
3) 92% of the respondents thought the water quality of the surface water of the Mushan Reservoir is good and the rest thought otherwise, which means the public generally think the water environment of the Mushan reservoir is good.
4) 89% of the respondents thought the ground water quality of the site is good while the rest thought otherwise, which means the public generally accepts that the ground water quality is good.
5) 47% of the respondents thought the project will bring no environmental effect to the surrounding area and 53% thought it will bring little pollution. That means the public think the project will bring relatively little environmental effect.
6) 97% of the respondents thought the project will promote the development of the local economy while the rest thought otherwise, which shows the majority of the public all acknowledge the positive effect of the project to the local economy.
7) 99% of the respondents thought the project, once completed and put into operation, will boost the farmers’ income and better their life quality, which means an absolute majority of the public agree that the project will bring economic benefits to the local people.
8) 51% and 46% of the respondents are concerned about the environmental impact of air and noise respectively, which the other 3% are concerned about the water impact of the project. Therefore, the public are most concerned with the air impact brought by the project.
9) 98% of the respondents thought the control measures will effectively control the pollution, which shows that majority of the public are positive towards the control measures of the project.
Shandong Academy of Environmental Science
165
EIA Report of 2×15MW Biomass Cogeneration Project
10) About whether to support the construction of the project, 98% of the public said yes with only 8% withdrew to comment.
We have revisited the 8 respondents who withdrew to comment on whether or not to lend support to the project. Through discussion, we have got to know that the reason for withdrawal is due to their concern that the power plant will cause severe noise impact to the environment. Based on the conclusion of the Acoustical environment Impact Assessment, the proposed project, after implementing all the control measures, the sound impact will be minimal. In addition, the environmental impact assessment requires the project, during the construction and operation, adopts accurate engineering design and implements the request and suggestion of the report and explain carefully to the people in surrounding area. The construction company also commits that during execution and operation of the project it will carry out strictly the control measures in the report to keep the environmental impact of the construction to its minimal.
The public, while acknowledging the feasibility of the project, raises some suggestions and request. Take the following for example. They hope the project can give preferential treatment the labors in the surrounding areas when it comes to recruitment. Also, they hope the power plant shall keep a good relationship with the surrounding villages to realize harmonic development. Furthermore, they hope during the project construction, environmental control measures will be strictly implemented to lower the negative effects.
8.5 Public Seminar
8.5.1 Public Seminar for the Proposed Project
At 2pm on November 30, 2009, a public seminar was held between Anqiu Biomass Cogeneration Company Limited and farmer representatives from the surrounding villages in the staff training room of Anqiu Shengyuan Biomass Cogeneration Co., Ltd.
Participants included are Mr. Ma Lianjiang, Comprehensive Administration Office from the company, Mr. Lv Fansheng, an environmental protection engineer of the company, Ms. Ma Qinqin, secretary of Comprehensive Administration Office. The farmer representatives are: Mr. Han Zhiming, Mr. Li Guozhong, Mr. Wang Guocai, Mr. Cao Honggui, Mr. Liu Wenfu, Mr. Gao Hanxiang, Mr. Zhang Hongyi, and Mr. Wang Yongchang etc.
The company briefed the construction of the projects and its possible environment impact and measures to be adopted. Through the seminar, the company got to know that the public knows the project and accepts the project, believing that the construction of the project could improve the environment, increase the farmers’ income.
Seminar Content:
1) Brief of the project by Mr. Ma Lianjiang;
Required by the world bank, we have called upon all the presents to discuss on the
Shandong Academy of Environmental Science
166
EIA Report of 2×15MW Biomass Cogeneration Project
environment impact of the project.
2) Questions and Answers session from Mr.Lv Fansheng
As environment protection is an issue with paramount importance as it is closed related with everyone present, we want to discuss with everyone so to enhance our understanding to realize harmonious development. Next, I would like to conduct the question and answer session for your understanding of the project.
a) Do you know the information of the project?
Representatives: Yes. We know it from all media reports of the project and we know it utilizes stalks as fuel for power generation and heat supply. It could better the environment and save resources and supply power.
b) What is your attitude towards the project?
Representatives: We are supportive to the project as we know from recent years that China encourages utilization and development of new resources and renewable resources.
c) Do you think the project will promote the local economy?
Representatives: Yes. There are many export oriented food processing companies and clothes tailoring companies in the south of urban area near the site villages. We have some relatives and friends working there and we are told that they are all big steam and electricity consumers.
d) Do you think the project can increase farmers’ income and better their life?
Representatives: Yes. We believe the selling the stalks will increase our income.
e) What positive effects do you think the project can bring to you?
Representatives: It is good thing that we can sell our stalks as we used to deserted them in the field or burn them on the spot, which is banned now. In addition, the project construction can increase our employment opportunities.
f) What environment aspect are you concerned with re the project?
Representatives: At the first beginning, we were worried about the noise impact. Through the public notices, we got to know the project utilizes foundation shock absorption measures and silencing measures. It shows that the project is environmentally concerned and adopts measures to minimize the impact. Therefore, until now, there has not been negative impact.
g) Do you think the project will bring pollution to your domestic water supply?
Shandong Academy of Environmental Science
167
EIA Report of 2×15MW Biomass Cogeneration Project
Representatives: Through communication with the company, we know the project utilizes water from Mushan Reservoir not ground water. We also know that the water discharge enters the sewage treatment plant of Anqiu. Therefore, we are not worried.
h) What are the effects of the pollutant emissions of the project to you?
Representatives: We are not worried as stated in the public notices and media that the ash and slag are sold to Shandong Aobao Chemical Co., Ltd for comprehensive utilization.
i) What kind of negative impact will the project bring to your life?
Representatives: We got to know that the project is an energy saving and environment friendly project. After operation, it will collect stalks and bring benefits to us. Unlike chemical factories to pollution water resources, the project has little impact. We welcome these kinds of projects.
j) Have you read the two public notices and what do you think of them?
Representatives: We have read the notices and they have been released in Anqiu local newspaper and posted in our village. We think that they are objective. As long as the company does what it says, we will be free from worries.
k) Do you the ways to feedback?
Representatives: Yes. If there are any, we will provide feedbacks.
l) What are the other issues you might have?
Representatives: We are also concerned with what you have asked. We think your questions are thorough. About others, it will be whether the company could first consider labors from the surrounding villages when recruiting labors. We want to have good relationships and realize harmonic development. We also hope that during the construction period, the environmental pollution control measures (three simultaneous) can be implemented as promised to minimize the impact. Except for those, we do not have other issues.
3) Mr. Ma Lianjiang: Thank you for attending the seminar. Biomass power generation is good for the local communities and the whole country. Not only could it provide direct benefits to the local people but also help to resolve the issue of surplus labor. As the project is cogeneration project, it will play an active role in the heat supply to local communities, and potential enterprises. We hope all the presents can help us to promote the project and bring more participation to make the project best for everyone.
Shandong Academy of Environmental Science
168
EIA Report of 2×15MW Biomass Cogeneration Project
To sum up, the public is supportive to the project. The construction company shall take up the comments and suggestions from the public to realize construction of the project with control measures and economic development with little environment impact.
8.5.2 Public Seminar for Fuel Storage Fields
Between March 30 and 31, 2001, Representatives from Anqiu Shengyuan Biomass Thermal Company Limited conducted a public seminar on environmental impact of the fuel collection fields with the local residents. Through the discussions, most residents support the construction of the storage fields provided all the pollution control measures are implemented and they regard the construction is beneficial for their income and economic development.
Refer to the attached for the seminar minutes, photos and attendants’ signatures.
Photos on Public Notices and Newspaper Notice and Seminar
Shandong Academy of Environmental Science
169
EIA Report of 2×15MW Biomass Cogeneration Project
Shandong Academy of Environmental Science
170
EIA Report of 2×15MW Biomass Cogeneration Project
Attendance of Public Seminar of Anqiu Shengyuan Biomass Cogeneration Company Ltd.
(2009-11)
No. Name Age Sector Signature
1 Han Zhiming 39 Businessman
2 Li Guozhong 42 Insurance
3 Wang Guocai 39 Transportation
4 Cao Hongkui 45 Businessman
5 Liu Wenfu 40 Businessman
6 Gao Hanxiang 37 Driver
7 Zhang Hongyi 41 Businessman
8 Wang Yongchang 40 Worker
Shandong Academy of Environmental Science
171
EIA Report of 2×15MW Biomass Cogeneration Project
Chapter 9 Conclusion and Suggestions
9.1 Conclusion
9.1.1 Project Brief
1) The 2*15MW Biomass Cogeneration Project of Anqiu Shengyuan Biomass Cogeneration Co., Ltd. is to be invested and constructed by Anqiu Shengyuan Biomass Cogeneration Co., Ltd., with a total investment of RMB230.5million, 4.52% of which is investment for environment protection (equivalent to RMB10.42million). The project is to construct 2 JG-75/5.3-SW sub-high temperature and sub-high pressure stalk combustion fluidized bed boilers, affiliated by 2 C12-4.9/0.98 extraction steamers, and 2 QF-15-2 air-cooling generators. The fuel for the project is corn and wheat stalks, and once it is completed, the annual amount of electricity generated is 1.43*108KWh.
The proposed project is situated in the Southwest of Anqiu and it is in compliance with the Overall Anqiu Urban Development Plan and relevant national industrial development policy.
The fuel for the project (agriculture crop stalks) is to be collected by the 4 storage fields (collection agents) scattered around the proposed site and transported to the site by vehicles. The annual fuel consumption of the project is around 200,600 tons.
The average water consumption of the project is around 221.46m3 per hour and around 1,328,800m3 per annum. The primary water source for the project is from Mushan Reservoir with water from Anqiu Tap Water Company as a standby source.
2) The project adopts bag type dust collectors for dust removal purpose with an efficiency of 99.9%. The flue gas, after dust removal, is discharged by a 100m stack with an internal diameter at the outlet of 2.8m. The discharge by the stack meets the requirements of the third time phase in the Flue Gas Emission Standards by Thermal Power Plant (Shandong Provincial Standards DB37/664-2007).
The project generates around 68.16m3/h waste water, among which 0.56m3/h is domestic waste water, 24m3/h industrial waste water and 43.6m3/h circulating waste water. The domestic waste water is discharged to Anqiu Water Treatment Plant after sedimentation and treatment in septic tanks. The industrial waste water is mainly acid/alkaline containing waste water and greasy water (from the equipment cooling system). The acid/alkaline containing water is neutralized (characterized by high salinity), and partly used for site road spray, ash removal system spray, and fuel feeding system spray, with the rest discharged to rainwater drainage network. The
Shandong Academy of Environmental Science
172
EIA Report of 2×15MW Biomass Cogeneration Project
greasy water is discharged to Anqiu Water Treatment Plant after Grease Trap treatment. As the circulating cooling water is clean, it is directly discharged into the rainwater drainage network. The annual waste water discharge of the project is 9,360m3.
The project produces 19,458 tons of ash and slag per year (15,564 tons of ash and 3,894 tons of slag). They are not stored on site but directly transported to Shandong Aobao Chemical Group Co., Ltd. as raw material for fertilizer manufacturing.
After comprehensive measures on noise reduction such as isolation, silencer, and vibration proof, the noise level within 100m to the site west boundaries shall meet with the requirements of the 2nd category in the Standard of Noise at Boundary of Industrial Enterprises (GB3096-2008). The environmental noise level in the nearest villages (Sanli Dianzi Village and Zhang Jialou Village) meets with the 2nd category in the Standard of Noise at Boundary of Industrial Enterprises (GB3096-2008).
The project, once completed, turns the discarded agriculture crop stalks into resources and the biomass energy into power and heat energy; thus, it can simultaneously perform the function of environment protection, energy saving, and balance of local power grid and heat supply load.
9.1.2 Current Ambient Quality
9.1.2.1 Current Ambient Air Quality
The hourly concentration level and daily concentration level of SO2 and NO2 in all the monitoring positions around the site are within the secondary category stipulated in Ambient Air Quality Standard (GB3095-1996). However, the level of PM10 and TSP in Sanli Village are slightly above the standard due to the dry climate of the Northern China and re-suspension of dust particles.
9.1.2.2 Current Surface Water Quality
For the water resources in Mushan Reservoir, all the monitoring factors can meet the third category water requirements stipulated in Surface Water Quality Standard (GB3838-2002) with the exception of petroleum factor and BOD5. The exception is mainly due to the domestic waste water discharge from the surrounding areas into the reservoir. For the water resource of Wen River in Yanding Section, all the monitoring factors can meet the fifth category water requirements stipulated in Surface Water Quality Standard (GB3838-2002) with the exception of CODcr, BOD, permanganate index, ammonia-nitrogen, and sum P. For the water resource in Jiahe Tao Section of Wen River, all the monitoring factors can meet the third category water requirements stipulated in Surface Water Quality Standard (GB3838-2002) with the exception of BOD, permanganate index, and sum P. The water quality of Wen River is getting better with the downstream of water due to self-purification function of the river. The unsatisfactory result of the water quality in CODcr, BOD, permanganate index, ammonia-nitrogen, and sum P factors is mainly due to
Shandong Academy of Environmental Science
173
EIA Report of 2×15MW Biomass Cogeneration Project
the malfunction of Anqiu Water Treatment Plant, which leads to unsatisfactory discharges into the River.
9.1.2.3 Current Ground Water Quality
The results from the 3 ground water monitoring sites around the project indicate that the monitoring factors including PH value, permanganate index, sulphate, nitrite-nitrogen, ammonia-nitrogen, fluoride, chloride, and coliform group can all meet the requirements in the third category stipulated in Ground Water Quality Standards (GB/T14848-93). However, the factors including total hardness and soluble total particles exceed the specified amounts, with maximum of the former 2.19 found in Sanli Dianzi and Sanli Villages, and of the latter 1.27 among one of the three sites. That is due to the geological composition of the soil, which causes the total hardness and soluble total particles to be excessive.
9.1.2.4 Current Acoustical Sound Quality
The acoustical environment around the site and sound sensitive objects in the surrounding areas is good with noise level both in daytime and nighttime in compliance with the requirements of 2nd category stipulated in Acoustical Environment Quality Standard (GB3096-2008).
9.1.3 Major Results for Prediction of Environment Impact
9.1.3.1 Prediction of Impact on Ambient Air
The completed project will have relatively little impact on the ambient air quality. The maximum hourly concentration overlap of SO2 and NO2 of the proposed project is respectively 0.0440mg/m3 and 0.0300mg/m3, which is 8.8% and 12.5% respectively of the corresponding specifications in the Standard; therefore, the overlap of the hourly concentration in all monitoring positions meets the requirements of the standard. The maximum daily concentration overlap of SO2 and NO2 of the proposed project is respectively 0.0153mg/m3 and 0.0428mg/m3, which is 10.20% and 35.67% respectively of the corresponding specifications in the Standard. Considering the maximum daily concentration overlap of SO2, NO2 and TSP of the monitoring sites is respectively 0.0111mg/m3, 0.0201mg/m3 and 0.0300mg/m3, which is 7.4%,16.75% and 93.97% respectively of the corresponding specifications in the Standards; therefore, the overlap of the daily concentration in all monitoring sites shall meet the requirements of the standard. As the project utilizes crop stalks instead of coal, there will be obvious drop in the average daily and annual concentration level of SO2 and TSP.
Affected by unorganized discharge and odor discharge, it is finally decided that the hygienic control distance is 100m. As the nearest sensitive object (Sanli Dian Village) is 150m from the proposed site, it is clear that within the hygienic control distance, there are no sensitive objects. Therefore, the dust impact from fuel storage, fuel shredding, and feeding to the local environment is minimal.
Shandong Academy of Environmental Science
174
EIA Report of 2×15MW Biomass Cogeneration Project
9.1.3.2 Prediction of Impact on Surface Water
The drainage system of this project is arranged by adopting the principles of Separating Fresh Water from Wastewater and Separating Rainfall from Wastewater, with two wastewater collecting systems and independent pipe networks therefor disposed respectively for rainfall collection in plant area and for production and sanitary wastewater collection, and the wastewater will not be drained into southern trunk channel. The spent circulated cooling water is clean drainage water and drained directly to rainfall pipe network in plant area; part of the acidic/basic waste from production after neutralized and precipitated (the water mainly having high salt content) may be reused and the other part will be drained to rainfall pipe network in plant area; the oil-containing waste water after oil isolation and precipitation together with the sanitary wastewater after precipitation through septic tank will be drained via the sewage pipe network in plant area into municipal sewage pipe network and finally to Anqiu city sewage water treatment plant. The output of Anqiu sewage water treatment plant after its renovation will satisfy the requirement of category B first class in Pollutant Discharge Standard for Urban Sewage Treatment Plant (GB18918-2002); therefore, the discharge will not impact on the Wenhee river and Weihe river. To summarize, the discharge of waste water of the project has little impact to the surface water.
The water discharge from Anqiu Water Treatment Plant after its renovation will satisfy the requirements of secondary category of Urban Water Treatment Plant Pollutants Emission Standards (GB18918-2002) and it will not impact on the water quality of Wen River and Huai River.
Therefore, the waste water of the project has little impact on the ground water quality.
9.1.3.3 Prediction of Impact on Ground Water
The project utilizes water from Mushan Reservoir and use of underground water is not within plan, therefore, it will not have impact on quantity of the underground water available.
The domestic waste water and industrial waste water will be discharged together to the site waste water drainage networks and through the municipal waste water network to be piped to Anqiu Water Treatment Plant. After implementation of all the pollution control measures, the project, during its operation, will have little impact to the underground water on site and surrounding areas.
9.1.3.4 Prediction of Impact on Acoustical Environment
It is predicted that the noise level within 100m to the site west boundary at both daytime and nighttime satisfies the requirements of the 2nd category in the Standard of Noise at Boundary of Industrial Enterprises (GB3096-2008). As there are no sound sensitive objects within this area and also due to the land nature of site is industrial use (there will not be sound sensitive objects), the environmental noise level in the nearest villages
Shandong Academy of Environmental Science
175
EIA Report of 2×15MW Biomass Cogeneration Project
(Sanli Dianzi Village and Zhang Jialou Village) meets with the 2nd category in the Standard of Noise at Boundary of Industrial Enterprises (GB3096-2008). Therefore, the project has little impact to environment sound towards the sound sensitive objects.
9.1.3.5 Prediction of Solid Waste Impact
As the solid waste of the project is mainly boiler ash and slag, which are a quality organic fertilizer, it will be sold completely to Shandong Aobao Chemical Group Co., Ltd. for comprehensive utilization. The project will adopt pollution control measures to the solid waste storage and transportation. Therefore, the solid waste of the project has little impact to the surrounding environment.
9.1.3.6 Prediction on Environment Impact from Stalk Collection and Transportation
The project has 4 crop stalk storage fields (collection agents), each of them is far away from residential areas. What is more, all the stalks are stacked in enclosed storage fields, therefore, the dust re-suspension and noise will have little impact on the surrounding areas.
As Anqiu boasts of convenient road networks with all the villages and counties connected by tarmac roads, the transportation of fuel by vehicles is made easy from the 4 storage fields to the site. As the project does not require a large number of vehicles on the road, impact from the transportation vehicles will be little on the environment.
9.1.3.7 Environmental Risk Analysis
There are few risk factors in project operation with exception of dust collector faults and stalk fire accidents. When the dust collectors are faulty, they can be repaired at real time in operation. Unless they are severe faults which cannot be repaired within 4 hours, the case shall be immediately reported to the power grid control center; and based on practical circumstance, it shall be decided whether to reduce the power supply load or have boiler trip or turbine trip. Therefore, the dust collectors’ faults have little impact on the surrounding environment. When the management is strictly implemented, there will be little chances of fire accidents in storage fields and dry fuel house. As the project utilizes minimal amount of poisonous matter in the water treatment process, the labor safety and hygienic management shall be strengthened to prevent any chances of accidents and eliminate the possibilities of environmental impact.
9.1.4 Environmental Management Plans in the Construction Period and Operation Period
9.1.4.1 Environment Management Plans in the Construction Period
1) Dust
Timely cleaning of the main transportation roads relevant to the project to maintain the cleanliness to reduce dust suspension; To vehicles carrying bulky materials, cover them with awning to prevent falling and dust pollution; The dust suspension areas,
Shandong Academy of Environmental Science
176
EIA Report of 2×15MW Biomass Cogeneration Project
such as concrete mixing spot and cement stockyard etc, shall be located in the wind downstream of the main construction site and sensitive objects. In addition, there shall be isolation perimeters and baffles to be set up surrounding those areas to prevent dust suspension and spread. The construction material piles shall be covered by awnings.
2) Waste Water
A septic tank will be built to pre-treat the domestic waste to be recycled for site use.
3) Noise
A noise barrier will be set up in the east border of the site to reduce the impact of the construction noise to the neighboring villages and the construction is not allowed to be carried out during night and lunch break.
4) Solid Waste
Construction debris and domestic disposals are to be deposited in designated places to be collected by the Anqiu Sanitation Department and will not be discharged. A perimeter will be constructed along the site borders to provide convenience to the construction and prevent water and soil loss.
5) Ecological Environment
Immediate leveling and compaction is to be done to any activities that disrupts the earth surface by excavation to prevent water and soil loss. To any exposed surfaces, water spraying is to be carried out periodically to maintain water content so to inhibit dust suspension.
9.1.4.2 Major Pollution Control Measures in the Operation Period
1) Flue Gas
It is both technically mature and economical for the project to use bag type dust collectors with an efficiency of 99.9%. The bag type dust collectors shall achieve great benefits if they are designed according to the practical conditions of the flue gases, and in consideration of the operation methods and manufacturing quality control and daily maintenance.
The combustion of the fuel of the project (wheat straw and corn stalk) produces relatively lower amount of NOX, which satisfies with the requirements of the third time frame standards in Thermal Power Plant Atmospheric Pollutants Emission Standards (DB 37/664-20067). Also, the project reserves space for equipment to remove NOX
based on stipulations in the Circular on Strengthening Environmental Impact Assessment on Biomass Cogeneration Project.
The project will install continuous flue gas monitoring system in stacks or flues to
Shandong Academy of Environmental Science
177
EIA Report of 2×15MW Biomass Cogeneration Project
mainly monitor the emission of SO2, NOX, and flue dust and the data will be real time transmitted to DCS. The flue gas continuous monitoring system shall comply with the requirements in HJ/T75-2001 The Technical Specifications for Continuous Monitoring of Flue Gas Emission. Based on the monitored data, monthly report will be compiled to provide technical support and experience to the biomass thermal project environmental protection work.
Control measures will be adopted for dust suspension on the fuel collection, preparation, conveying, and feeding to prevent any negative impact from unorganized discharges.
2) Waste Water
The acid/alkaline containing waste water will be treated in proposed neutralization tank and the greasy water will be treated by grease trap. The project adopts discharge principle of separation of clean water and waste water and separation of rainwater and waste water. There are two waste water collection systems on site, one for rainwater and the other for manufacturing waste water and domestic waste water. The two systems have independent grid networks. The waste water is not discharged into the south canal. As the circulating cooling water is clean waste water, it is directly discharged to the site rainwater grid network. The acid/alkaline containing waste water in manufacturing waste water, after being neutralized and sediment treatment (characterized by high salinity), will be partly recycled and the rest discharged to the rainwater grid network. The greasy water, after grease trap and sediment, will be discharged to the Municipal Waste Water grid network to be piped to Anqiu Water Treatment Plant. The same applies to domestic waste water after it is treated in septic tanks. The waste water treatment is technically satisfactory and economically reasonable.
3) Noise
Based on the characteristics of the noise source of the project, the project has taken a series of measures of noise control from both internal aspects and external aspects. Overall, the control measures are all mature and accepted practices, which are technically reliable and economical. Once the project is put into operation, the boiler steam and gas pipe blowing shall be carried out in daytime and a notification system shall be implemented, in which the time and noise strength shall be notified to Sanli Dianzi Village and Zhang Jialou in advance.
4) Solid Waste
The solid waste produced by the project is mainly ash collected by dust collectors and boiler slag. As they are organic fertilizers, they are completely recycled to be made into fertilizers. The practice is technically feasible. With them being sold to fertilizer manufacturers, the income of the company can be boosted too.
Shandong Academy of Environmental Science
178
EIA Report of 2×15MW Biomass Cogeneration Project
9.1.5 Public Participation
While the feasibility of the project is acknowledged and confirmed, the public has raised some suggestions and requirements as follows:
It is hoped that the labors from the surrounding villages are given preferential treatment in employment when the project is being constructed and put into operation.
The relationship between the project and the surrounding villages shall be well kept during the project operation to realize harmonic development.
During the project construction, environmental impact shall be minimized through implementation of three simultaneity system (simultaneous design, construction and operation of pollution control facilities with the project construction) to minimize the negative environmental impact.
9.1.6 General Conclusion
To summarize, the 2*15MW Biomass Cogeneration Project of Anqiu Shengyuan Biomass Cogeneration Co., Ltd. is to be invested with a total of between RMB230.50million and RMB240million to construct 2 JG-75/5.3-SW sub-high temperature and sub high pressure stalk combustion fluidized bed boilers, affiliated by 2 C12-4.9/0.98 extraction steamers, and 2 QF-15-2 air-cooling generators. The project is in compliance with national industrial development policy and the site selection in compliance with the Anqiu Overall Development Plan. Once all the pollution control measures are implemented, the project will have relatively little impact to the surrounding environment. The construction of the project complies with the requirements of clean production with the total emission within the control criteria and risk factors within effective control. The public supports the construction of the project. The project is environmentally feasible.
9.2 Prevention Measures and Suggestions
9.2.1 Pollution Control Measures
1. The dust re-suspension control measures shall be implemented in fuel collection, shredding, conveying and feeding processes to prevent damages to the site and environment by unorganized discharges.
2. The supplementary facilities for pollution and other public nuisances (waste water, waste gas, solid waste and noise) shall be simultaneously designed, constructed and operated together with the project. Once the project is complete, the maintenance and control to the above shall be strengthened to ensure their smooth operation.
3. The fuel storage system management shall be strengthened with implementation of
Shandong Academy of Environmental Science
179
EIA Report of 2×15MW Biomass Cogeneration Project
automatic fire detection and control, and installation of fire warning signs. Relevant personnel shall be assigned for the control. Contingency plans shall be made and fire control practices shall be periodically carried out.
4. During the project operation, special personnel shall be assigned to inspect and handle any pipe leakages.
5. During construction, all the environmental protection facilities shall be constructed and the monitoring and control on the pollution shall be strengthened and to implement the environmental control and monitoring plan stated in the Report to ensure its smooth operation to realize the discharge within specifications.
6. Once the project is put into operation, the boiler steam and gas pipe blowing shall be carried out in daytime and the time and noise strength shall be notified to Sanli Dianzi Village and Zhang Jialou in advance.
9.2.2 Suggestions
1) To strengthen environmental control once the project is complete and based on flue gas continuous online monitoring data, monthly report shall be compiled to give technical support and experience for the environmental protection of biomass cogeneration projects.
2) To implement ISO1400 environmental management system accreditation and clean production auditing to cross check with factors in project operation (raw material, product, water consumption and energy consumption) to determine the source, quantity and types of pollutants, so to make emission reduction objectives and suggest corresponding technical control measures.