93
Page | 1 Biomass energy – optimising its contribution to poverty reduction and ecosystem services Report of an international workshop Parliament House Hotel, Edinburgh 19-21 October 2010

P a g e | 1
Biomass energy – optimising its contribution to
poverty reduction and ecosystem services
Report of an international workshop
Parliament House Hotel, Edinburgh 19-21 October 2010

P a g e | 2
Contents
Executive summary ....................................................................................................................................... 3
Objective ....................................................................................................................................................... 4
Background ................................................................................................................................................... 4
Restatement of the aims of this ESPA Biomass energy consortium ............................................................. 5
Provisional agenda for the meeting .............................................................................................................. 7
Day 1: Tuesday 19 October 2010 .................................................................................................................. 8
Introductions to each other and the consortium ..................................................................................... 8
Global overview of biomass energy, environment and development .................................................... 8
Biomass energy crops and climate change ............................................................................................ 15
Biomass energy use in India ................................................................................................................... 24
Biomass energy use in Kenya ................................................................................................................. 33
Biomass energy use in Malawi ............................................................................................................... 38
Biomass energy and poverty reduction ................................................................................................. 45
Biomass energy and ecosystem services assessment ........................................................................... 48
Biomass energy and watershed management - considerations for dedicated energy plantations and
biomass from natural forests ................................................................................................................. 57
Importance of remote sensing and ground based surveys in the design, implementation and
monitoring of biomass energy projects and carbon .............................................................................. 60
Community biomass energy project development ............................................................................... 64
Plenary discussion on interesting facts, approaches and gaps highlighted by review panels .............. 69
Day 2: Wednesday 20 October 2010 .......................................................................................................... 74
Problem tree analysis to develop indicators of success ........................................................................ 74
Feedback from two groups of the causal problems and discussion of interaction between the two .. 75
Theory of change methodology to develop conceptual framework ......................................................... 77
Feedback from the two groups followed by discussion of the best and most questionable bits of both
frameworks ............................................................................................................................................. 77
Day 3: Thursday 21 October 2010 .............................................................................................................. 80
Communication and impact planning .................................................................................................... 80
Feedback from two groups of the impact plan analysis and discussion of best and most questionable
features of each ...................................................................................................................................... 80
PEAPOD Africa ........................................................................................................................................... 81
PEAPOD India ............................................................................................................................................. 83
Research prioritization exercise ............................................................................................................. 90
Institutional responsibilities and capacity strengthening ...................................................................... 91

P a g e | 3
Executive summary
The percentage of biomass energy within the total share of different energy sources is set to treble from 10% to 30% by 2050 according to the International Energy Agency – with major potential impacts (both positive and negative) for poverty reduction and the protection of ecosystem services. An international consortium drawn from the India, Kenya, Malawi and the UK met to design a research proposal that would deliver both excellent multi-disciplinary science and actually make a real positive impact in reducing poverty and conserving ecosystem services relating to biomass energy. The workshop was structured in three sections. The first day was devoted to information sharing from each of the consortium members – drawing on five background reports for the workshop that had been prepared by Chancellor College - Malawi, IIED - UK, Practical Action-Kenya, Rothamstead Research – UK and TERI – India. The second day involved a detailed analysis of the underlying causes of the suboptimal use of biomass energy for poverty reduction and ecosystem services – and the development of a theory of change for India and African contexts to address those underlying causes. The third day was devoted to planning the impact pathway in order to ensure that desired changes actually occurred within the timeframe of the project (and within a longer 30 year time horizon). Concluding sessions focused in on the main elements of, and institutional responsibilities for, the research project framework. The outcome of the workshop was a strong consensus about the need to address four interrelated problems: poor biomass resource governance; resulting loss of the biomass energy resource itself, unequal distribution of benefits from existing biomass energy business value chains; and finally, inefficient biomass energy conversion and consumption. Four research objectives and detailed work packages were discussed to address these inter-related problems: (i) Integrated biomass energy policies in India, Malawi and Kenya; (ii) Spread of more efficient and sustainable production methods of biomass energy by the poor; (iii) Pro-poor formalization of biomass energy business/delivery models; (iv) More efficient / less emitting consumption of biomass energy through the widespread adoption of appropriate technologies. The details of the subsequent proposal will be developed in an iterative and participatory manner by the consortium partners in dialogue with key target audiences.

P a g e | 4
Objective
To share information on global overviews and biomass energy use in India, Kenya and Malawi, identify research activities to improve its impact on ecosystem services and poverty, design a conceptual framework for that research with appropriate criteria and indicators of success, develop an impact plan, agree a monitoring and evaluation process, assign institutional responsibilities and agree plans to present a full proposal to ESPA.
Background
Biomass energy makes up 77% of the world primary renewable energy mix – or 10% of the total world energy mix (3% in OECD and 22% in non-OECD countries). As a major and increasing component of land use, biomass energy systems therefore have significant impacts on both ecosystem services and poverty. In the North, emerging opportunities for energy security through biomass are being developed fast. In the South, biomass energy is often viewed as 'inefficient and non-commercial', 'a health hazard', 'a cause of deforestation' or 'a poverty trap', often legislated to be 'illegal' as a result. Yet for many Southern countries forestry is primarily an energy business in volume and value terms, not a timber business and at a domestic level it dominates energy supply (>80% in most non-OECD countries). While a substantial proportion of biomass energy is burnt directly for domestic heat and cooking, especially in the South, there are also various conversion routes towards other forms of energy such as transferable heat, electricity, liquid biofuels or gases, developed primarily in the North. As a result of these advances in conversion technology, many of which are in commercial or near commercial stage of development, the International Energy Agencies latest predictions suggest that biomass energy is likely to make up one third of the total world energy mix by 2050. Much of this will be 'efficient', 'clean', 'sustainable and near carbon-neutral' comprising ' decent green jobs'. Clearly it is how the transition toward biomass energy takes place that will be decisive for its impacts (e.g. on health through the Products of Incomplete Combustion, poverty reduction, climate change mitigation, biodiversity conservation, watersheds and water availability etc). In order for increasing biomass energy use to have positive impacts on poverty reduction and ecosystem services, innovative interdisciplinary research is needed to map out transition pathways that optimize these impacts. This project aims to develop, through its six objectives, a South-South-North partnership and project to reshape the impact of a predicted large-scale expansion in global biomass energy use towards greater poverty reduction and maintenance of ecosystem services in developing countries. The consortium of partners represents leading biomass energy researchers from multiple disciplines. Together, a conceptual framework on biomass energy will be designed with clear indicators for 'reshaping' impacts on poverty reduction and ecosystem services. For example, in assessing the impact of future biomass energy use we will explore multi-disciplinary indicators and supply and demand factors: resource carrying capacities, demand by most needy for energy, security in access and supply, impact on food security, impact on land and resource rights, decency of work in its provision, broader social contributions, impact on ecosystem services (carbon, biodiversity and resilience, watersheds, landscape

P a g e | 5
beauty) and enhancement of cultural identity. At this planning meeting from 19-21 October 2010, this framework and evidence of technological and economic projections for biomass energy will be discussed. Leaderships teams will form to develop research plans, analysis tools and procedures both for assessing biomass energy developments themselves, and for conducting poverty impact assessments and evaluations of carbon, biodiversity and watershed ecosystem sustainability. Visiting researchers (from India, Kenya and Malawi) will help design appropriate research, communication and impact strategies for their different contexts. Innovative business and value chain models will be analysed to test the impact of different options for transition towards increasing biomass use. Policy analyses will be formulated so that research findings can be targeted towards changing particular policies and institutional practices.
Restatement of the aims of this ESPA Biomass energy consortium
This ESPA Partnership and Project Development action targets ESPA's forest theme, where the expected outcome is "enhanced contribution of forest ecosystem services to poor people's livelihoods and sustainable growth processes in the context of environmental and climate change". The overarching objective of this proposal is to develop a world class interdisciplinary South-South-North research partnership and strategy that reshapes the impact of a predicted large-scale expansion in global biomass energy use towards greater poverty reduction and maintenance of ecosystem services in developing countries. The action has a number of subsidiary objectives which in order of priority are as follows:
(i) develop a relevant conceptual framework - by organizing a South-South-North participatory
planning meeting to refine a conceptual framework with clear evidence of demand, indicators of success and monitoring, reporting and verification processes. A participatory process in Southern partner countries prior to a three day planning meeting will refine the legitimacy of objectives and indicators of success along with research inputs.;
(ii) establish sound technological and economic projections as a baseline for promoting impact - by gathering evidence on the technological and economic projections for biomass energy in order to identify where impacts on poverty and ecosystem services are likely to be greatest (both positive and negative). For example, we will collate agro-ecological and socio-economic data from India, Kenya and Malawi looking at both domestic biomass energy options for cooking, heat and even electricity generation and industrial opportunities for gaseous, liquid fuels and electricity generation;
(iii) develop research plans, analysis tools and procedures - by identifying and drawing together
leadership teams that will explore together how to quantify and assess possible transitions towards greater biomass energy use - and how to use results to optimize impacts on poverty and ecosystem services. This will be done in India, Kenya and Malawi, chosen on account of current energy-forest pressure, experience of approaches to address this, and the desire for geographical spread to improve relevance of findings. A sufficient range of disciplinary expertise will join in specific partnerships to model biomass crop dynamics and

P a g e | 6
assess different impact categories such as: multi-faceted poverty, carbon sequestration, biodiversity and ecosystem resilience, watershed dynamics and flows, landscape beauty;
(iv) identify in partner countries specific political change agents, communications strategies and
impact plans – by working with visiting researchers from India, Kenya and Malawi to understand not only the scale of biomass use, but also the social and political economy of decision making in particular contexts and the pathways by which a transition towards biomass energy provision could occur that contributes most to poverty reduction and ecosystem services;
(v) evaluate innovative business and value chain models to test transition options towards increase
biomass energy use - by collecting data, employing analytical tools and developing conceptual optimization models to evaluate in India, Kenya and Malawi the structures that govern, or might govern, woody biomass energy. We will consider quantitative models for bioenegy crops to improve yields and reduce food competition, community dynamics in biomass production, best-bet business models and a range of policy incentives.
(vi) develop a full ESPA proposal with a strategy to fill knowledge and capacity gaps - by working
together in an equitable South-South-North partnership that involves appropriate mentorship, training and other strategies to build capacity-through-involvement. The ultimate end-point will be clear policy recommendations about which transition pathways should be pursued in search of poverty reduction and conserved ecosystem services.
P a g e | 7
Provisional agenda for the meeting
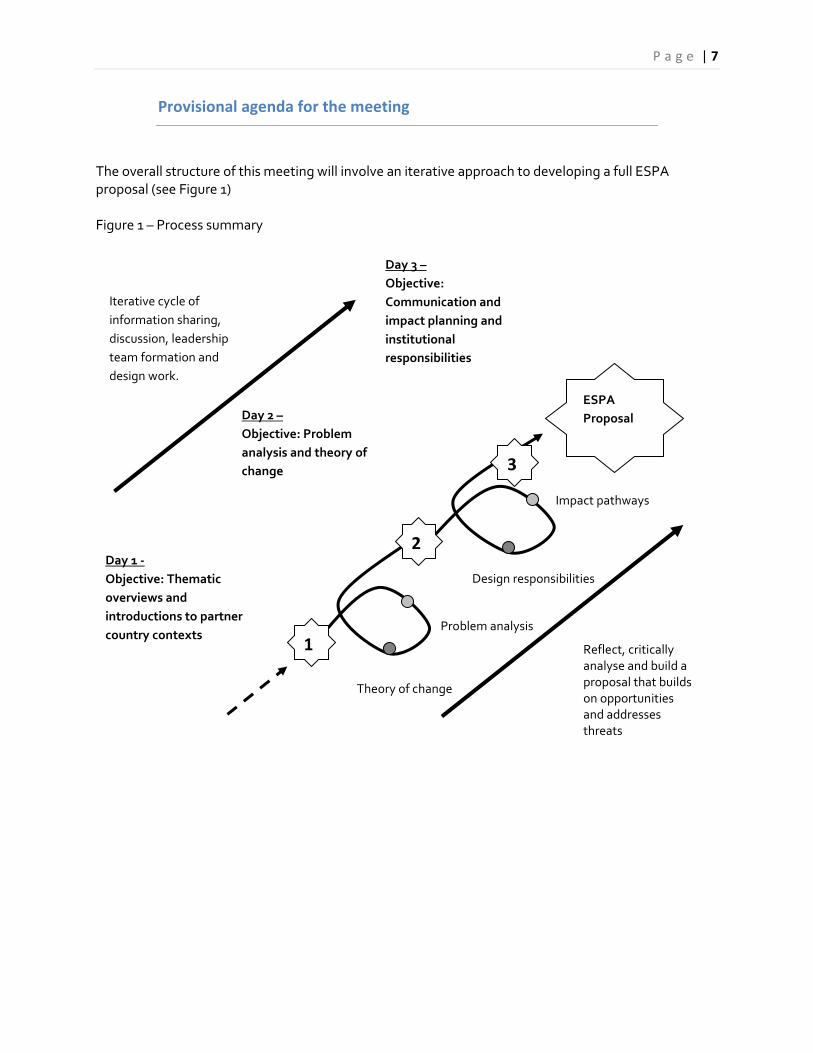
The overall structure of this meeting will involve an iterative approach to developing a full ESPA proposal (see Figure 1) Figure 1 – Process summary
Day 1 -
Objective: Thematic
overviews and
introductions to partner
country contexts Problem analysis
Reflect, critically analyse and build a proposal that builds on opportunities and addresses threats
Day 2 –
Objective: Problem
analysis and theory of
change
Iterative cycle of
information sharing,
discussion, leadership
team formation and
design work.
ESPA
Proposal
3
Day 3 –
Objective:
Communication and
impact planning and
institutional
responsibilities
Theory of change
Design responsibilities
Impact pathways
1
2

P a g e | 8
Day 1: Tuesday 19 October 2010
9.00 Duncan Macqueen (IIED)
Introductions to each other and the consortium
Each of the consortium members introduced themselves. The main methodology for the first day was discussed. Each of the following presentations lasted 20 minutes – followed by a panel discussion. Three different members from the consortium were asked to form a panel to review each different presentation, changing each time, focusing on three areas (i) facts that deserve emphasis in a full ESPA proposal (ii) emphases / approaches / research methodologies that deserve inclusion in a full ESPA proposal and (iii) Gaps in knowledge / expertise that a full ESPA proposal needs to address.
9.30 Duncan Macqueen (IIED)
Global overview of biomass energy, environment and development
This presentation focused on (i) a snap shot of the global scale and trends of biomass energy use, (ii) an assessment of the advantages of biomass energy use for environment and development; (iii) an overview of renewable energy technologies and programmes for development; (iv) cost comparisons for renewable alternatives; (v) conclusions on the components of a research framework that might be necessary to promote a transition towards biomass energy that reduces poverty and detrimental impacts on ecosystem services. The global context is one in which new greener energy sources are urgently needed:

P a g e | 9
Current sources in the global primary energy mix show heavy biomass dependence in non-OECD countries: OECD:
Non-OECD:
Existing biomass energy is primarily forest based:

P a g e | 10
There is a growing trade in liquid and solid biomass fuels:
IEA predicts biomass will rise to 30% of global energy by 2050 with ever increasing options for biomass conversion and use:
P a g e | 11
Biomass energy globally is a tale of two sides – OECD high tech biomass boom and Non-OECD biomass criminalisation <PIE CHARTS, MAP & CHART: UK ENERGY 2009 AND 2020>
• 1 million tonnes of biomass in electricity plants now • 3 GW of large biomass electricity approved (20-25 million tonnes required) • 4 GW of small to medium biomass electricity (30-35 million tonnes required) • Total 50-60 million tonnes required. • UK total = 10 million tonnes
<PIE CHARTS, MAP & CHART: MALAWI ENERGY 2009 AND 2020>
• 1.2 million tonnes of biomass currently used • Under most likely scenario – this will still rise to 2.1 million tonnes by 2020 despite investment
in coal and hydro-power • North – Demand 23% of supply • Centre – Demand 95% of supply • South – Demand is 11% of supply
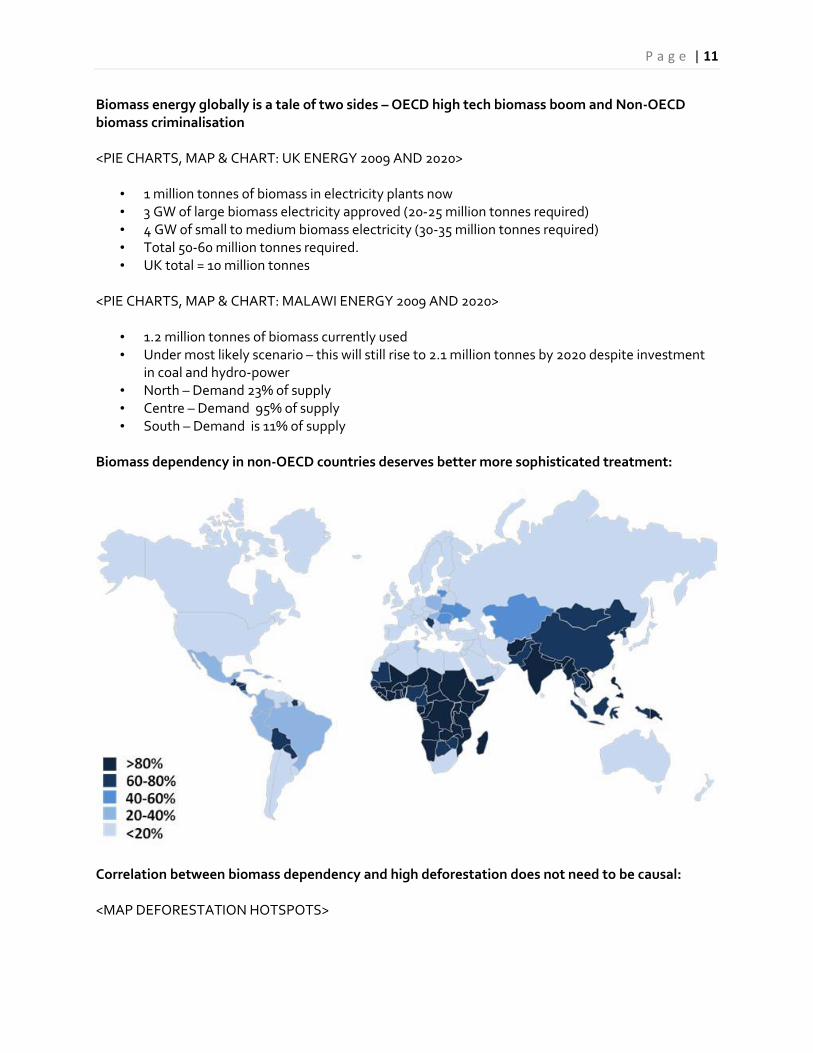
Biomass dependency in non-OECD countries deserves better more sophisticated treatment:
Correlation between biomass dependency and high deforestation does not need to be causal: <MAP DEFORESTATION HOTSPOTS>

P a g e | 12
Advantages: • Accessibility? But poor access to raw material / technology? • Sustainability? But incentives to reinvest profit in management? Biodiversity? • Energy security? But local and national balance of supply and demand? • Carbon neutrality? But conversion efficiencies and time scale? • Production flexibility? Feed stocks and conversion technology to heat, gas, liquid, electricity? • Labour intensity? But quality of jobs? • Cost competitiveness? But unfair subsidies to other energy sources?
<GRAPH: OPERATION AND MAINTENANCE JOBS> Costs, such as electricity:
• Depends on energy carrier • Indian duel fuel (DF) biomass gasifiers (run together with diesel) are competitive with diesel, for
capacities of 20 kW+ at an operating load of 100%. • Ugandan 25 kW wood-based gasifiers are cheaper (US$ 0.11 /kW) compared with solar panels
(US$ 0.19 /kW) or diesel generators (US$ 0.39 / kW) <GRAPH: LEVELISED UNIT COST FOR ELECTRICITY PRODUCTION> Renewable energy alternatives:
Energy services Income generating value Renewable energy options
Irrigation Better yields; higher value crops; greater reliability; growing during periods when market prices are higher
Biomass, wind, solar photovoltaic (PV)
Illumination Increased working hours Biomass, wind, solar photovoltaic (PV), micro-hydro, geothermal
Grinding, milling, husking
Creation of value added processing from raw agricultural commodity
Biomass, wind, solar, photovoltaic (PV), micro-hydro
Drying, smoking (heat preservation)
Creation of value added product; preservation of produce for higher value markets
Biomass, wind, solar photovoltaic (PV), micro-hydro, geothermal
Refrigeration, ice-making (cold preservation)
Preservation of produce to allow sale to higher value markets
Biomass, wind, solar photovoltaic (PV), micro-hydro, geothermal
Extraction Production of refined oils or distillates from biomass, seeds or fruit
Biomass, Solar thermal
Transport Access to markets, service providers and policy makers; public transport
Biomass (biofuels)

P a g e | 13
Telecommunications (computer, telephone, internet)
Access to market news, business and financial service providers and policy processes; coordination of suppliers and distributors; entertainment; weather information
Biomass, wind, solar photovoltaic (PV), micro-hydro, geothermal
Battery charging Wide range of services for end users Biomass, wind, solar photovoltaic (PV), micro-hydro, geothermal
Overseas Development assistance has historically paid biomass little attention:
Renewable energy alternatives to involve and reach poor:
• Hydro – strongly promoted but well rehearsed problems • Micro-hydro - technologically mature, simple to maintain, low energy costs, operating life of at
least 20 years, high potential for local manufacture, not intermittent but location specific • Wind – cost competitive, from simple mechanical to electricity, can be manufactured locally,
but vulnerabilities and intermittency • Solar – water heaters, lamps and solar PV widely pushed but initial capital costs and
technological production issues • Biomass – flexibility - simple stoves to biogas, liquid biofuels, steam turbines to gasifiers for
electricity – not intermittent but dependent on feedstock availability and technology with substantial gains from conversion efficiencies (e.g. kilns, fuel efficient stoves etc)
Making more of biomass: <FLOWCHART: INDIA BIOMASS GASIFIER ELECTRICITY SYSTEMS> How?
• Investigate alternatives to secure tenure rights • Compile and promote reasons to de-stigmatise / decriminalise biomass • Research systems that optimise poverty / ES impacts

P a g e | 14
• Develop models to incentivise transitions to efficient sustainability • Investigate governance / tax / investment support options
ESPA research could redefine the political economy of biomass…promoting:
• a central place in strategies for national energy security with effective sustainability criteria • a central role in plans to mitigate and adapt to climate change • comprehensive data on production and use in national energy statistics and planning • clear institutional mandates for policy and sector development • fair treatment alongside other energy sources • secure biomass tenure based on sustainable management • incentives for efficient conversion and use • support for investment in newer biomass technologies • an active programme of research and development

P a g e | 15
10.00 Goetz Richter / Mairi Black (Rothamstead Research / Imperial)
Biomass energy crops and climate change
This presentation focused on (i) an overview of global dedicated biomass energy crop potentials; (ii) some principles of best practice in their use; (iii) an assessment of the impacts of the use of such crops on climate change and vice versa (vi) conclusions on the components of a research framework that might be necessary to promote a transition towards biomass energy that reduces poverty and detrimental impacts on ecosystem services. Objectives of Background Report: This presentation was based on a background report: "Global assessment of biomass energy crops and climate change" that aimed to:
i. To give an overview of dedicated biomass energy crop potentials (as global as possible) ii. To lay down some principles of best practice in the use of bioenergy
iii. To review the impact assessment for the use of such crops on climate change and vice versa iv. To draw some conclusions on the components of a research framework to promote a transition
towards biomass energy that reduces poverty and detrimental impacts on ecosystem service When considering biomass potential for bioenergy production need to think of both:
• Theoretical, technical or economic concepts – Theoretical potential: physical possibilities of biomass production (NPP, AEZ, etc.) – Technical potential: availability, accessibility and efficiency of conversion processes – Economic feasibility of conversion processes, affected by external market factors such
as fossil fuel prices and fiscal incentives. • Implementation potential
– Affected by technical, [socio-]economic potential and policy interventions. – Considers practical outcomes of bioenergy scenarios based on available understanding
of technical and economic aspects and – the likelihood of scenario development for particular supply chains in a given
geographic location (constraints!).
Technologies for feedstock conversion are advancing- both energy carriers and end uses/markets: • Thermo-chemical pathways
– combustion, – gasification and – pyrolysis
• Bio-chemical pathways – digestion, – fermentation, – methylesterification, – hydrogenation

P a g e | 16
Key questions are: Where would biomass for bioenergy be acceptable? Which land would be most suitable? What alternative routes could be taken optimising tradeoffs for energy? These questions have been substantially addressed by mapping land use constraints – e.g. In England:
• Yield map England for all soils except organic (~ 10 M ha) • Yield map for 9 (primary) constraints (E-C9 <8 M ha) • Yield map 11 (secondary) constraints (E-C11 <5 M ha) • Yield map for E-C11 & ALC 3&4 (~ 3 M ha)

P a g e | 17
Regional availability of land suited to biomass crops can be a major issue: <MAP: INC. PIE CHARTS>
• Regional contrasts occur in the importance of different constraints • Areas with highest yields co-locate with important food producing areas • On average, Miscanthus yields 12.5 odt ha-1 on suitable land (ALC 3 or 4) • Between 10 and 40% are likely to be below an economic threshold of 9 t/ha
Bauen et al.(2010) Modelling supply and demand of bioenergy from short rotation coppice and Miscanthus in the UK. Bioresource Technology (on-line: doi:10.1016/j.biortech.2010.05.002) The maximum energy crop yield from multiple herbaceous and woody sources varies by species:
It is therefore possible to calculate the cost-based optimum energy crop: <MAPS SIMILAR TO THOSE ABOVE>

P a g e | 18
But there are other issues also to consider in decision making – e.g.:
• Carbon sequestration /GHG-emission (TSEC-Biosys – Hillier et al, 2009) • Bio-diversity in perennial energy crops (RELU-Biomass) • Ecological impacts/benefits –ecosystem services
Yield mapping & application: Examples and maps were given of:
• GHG-Balance of 1st and 2nd generation bio-energy crops: • Soil organic carbon under perennials: • Biodiversity:
• 24 commercial fields each crop • Flora
– Seedbank – Weeds (counts & biomass) – Seed rain
• Invertebrates – Ground & plant active – Pollinators (bees & butterflies) – Moths – Aerial/canopy
• Identified to species level • Same protocols as FSE project • Allows cf. break crops and cereals
Take-home messages:
• All indicators significantly higher in short rotation crop willows cf. Miscanthus • Indicators significantly greater in both biomass crops cf. arable crops
Plants • 3 x > in SRC willows than in Miscanthus • 4 x > (Miscanthus) and 11 x > (SRC) than in cereals
Invertebrates • 1.5 x ground and plant active inverts in SRC willows than Miscanthus • 2.5 x canopy insects in the SRC willows than Miscanthus • 13 x > inverts in SRC c.f. arable crops
Birds • SRC positive for many birds; Miscanthus –neutral • Birds needing open spaces/winter flocking may be disadvantaged
Haughton et al. (2009) J. Appl Ecol 46: 323-333 Sage et al. (2010) Ibis 152: 487-499 GLOBAL PERSPECTIVE Key factors for potential bioenergy supply have been laid out by Dornburg et al. (2010):

P a g e | 19
Comparing biomass energy supply potentials:
• Range assuming

P a g e | 20
• different intensities (1st bar) • With lignocellulosic biomass (2nd bar) • modelled primary bioenergy demands (3rd bar) • estimate range for the total global primary energy demand from the World Energy Assessment
(4th bar)
Policy implications for implementing sustainable biomass potentials: • Competition between food, feed and fuels could be avoided if the increased production of
biomass for energy is balanced by improvements in agricultural management and by growing perennial ligno-cellulosic crops on degraded and marginal areas.
• At the same time, key environmental concerns, including biodiversity, soil quality and water availability, should be addressed. This can be achieved by selecting appropriate bioenergy systems and applying adequate land use planning.
• Positive GHG balances of bioenergy systems can be secured by choosing suited biomass sources (e.g. using residual biomass and perennial crops), while preventing direct and indirect land use changes that lead to high greenhouse gas emissions.
• Overall sustainability should be guaranteed by implementing suitable policy frameworks that cover the above, for example by means of developing biomass certification schemes.
Global biomass potential/use distribution
<TABLE: Global biomass potential from different sources and its regional use (103 PJ/year)>

P a g e | 21
Key question is then what land to use? One option might be abandoned agricultural land (crop/pasture): (Field et al., 2008)
Figure 2. ... as estimated from the HYDE 3 land-use change database, with a spatial resolution of 5′ [45]. Crop and pasture areas are for the year 2000. Abandoned areas are the positive differences between the pre-2000 maximum areas and the 2000 areas. This estimate misses areas where crops or pastures were shifted from one place to another, without a change in area, but the relatively high spatial resolution of the HYDE 3 dataset means that it should capture shifts of more than 10–20 km.
• Potential global above-ground plant growth on abandoned agricultural lands has an energy content representing 5% of world primary energy consumption in 2006.
• The global potential for biomass energy production is likely to replace only a few percent of current fossil fuel usage.
• Increasing biomass energy production beyond this level would probably reduce food security and exacerbate forcing of climate change.
Another option might be to enhance biomass energy on marginal agricultural land: (Cai et al. 2010)

P a g e | 22
Key issues to discuss • Top-down vs bottom-up approach • Down-scaling energy demand and up-scaling of energy supply • Rural economy development
An example was given of decentralised energy planning (DEP) – a case study of Tumkur district in India acc to Hiremath et al. (2010)
• The approach adopted was bottom-up (village to district) to allow a detailed description of energy services and the resulting demand for energy forms and supply technologies.
• Different scenarios are considered at four decentralized scales for the year 2005 and are developed and analyzed for the year 2020.
• Decentralized bioenergy system for producing biogas and electricity, using local biomass resources, are shown to promote development compared to other renewables.
• Apart from meeting energy needs, multiple goals could be achieved such as self-reliance, local employment, and land reclamation apart from CO2 emissions reduction.
Decentralized Energy Planning (DEP): Hiremath et al. (2010) DEP model requires the following set of data:
• Socio-economic features • Land use: forests land, wasteland, cropping pattern, etc. • Energy; activities, end-use devices, efficiency of devices • Biomass production for energy; area under forests and plantations, biomass productivity,
production and availability of crop residue for energy • Energy efficiency, energy conversions, energy use • Energy: renewable energy technologies (RET) and fossil fuel (FF) technologies • Cost of energy systems operation and maintenance cost and financial value of energy and
products.
DEP at different levels: • Biogas is viable only at village scale due to inability to liquefy it • Biomass demand can be met by raising wood fuel on degraded or waste land • Gasification plant location at Panchayats scale depends on supply of land & biomass, transport
and distribution costs • At block level, 27-45% of the waste land is needed for energy production under business as
usual scenario • The different energy needs in the district (10 blocks) have can be met by allocating 12% of the
wasteland (assuming yield of 8 t/ha/ year) under sustainable development scenario Review impact assessment of bioenergy crops on climate change and vice versa: Points to discuss here are:
• Positive effects of carbon sequestration under perennial crops • Land reclamation for degraded, eroded soils • Negative GHG balances from false allocation of energy crops • Water use benefits and hazards • Change of the energy balance due to land cover changes • Increase or decrease in yield and yield uncertainty
P a g e | 23
• Pests and diseases Conclusions for a research framework to promote biomass energy within ESPA:
• Inventory of land use and land resources • Bio-diversity inventory and conservation areas • Agro-ecological zoning in terms of productivity at regional and sub-regional scale • Water and energy balance modelling • Bio-resource inventory – food, feed and fibre supply and demands • Calculation of the bioenergy potential differentiated acc to form and usage • Integration and analysis of multi-crop/multi-purpose production systems • Supply chain analysis acc to feedstock diversification, demand and infrastructure
References: Field CB, Campbell JE and Lobell DB (2008) Biomass energy: the scale of the potential resource. Trends in Ecology and Evolution 23 (2): 65-72 Cai XM, Zhang X, Wang DB (2010) Combining marginal cropland and grassland may meet the world’s biofuel demand . UIUC (unpublished)

P a g e | 24
10.30 Ibrahim Rehman / Abhishek Kar (The Energy Resources Institute, TERI)
Biomass energy use in India
This presentation focused on (i) a quantified analysis of biomass use in India; (ii) a description of what is known of the impact of biomass energy use on poverty reduction and ecosystem services in India; (iii) a description of the main policies, institutions and individuals that currently define biomass use in India; (iv) innovative initiatives in the sector and why they have succeeded or failed to date and (v) a theory of change about what a desirable biomass energy ‘transition’ in India would look like and how to bring it about. India’s energy profile – setting the scene:
• Rising demand o Per capita energy consumption in India has risen by 28.25% in the period 1997-2007 o Expected to be more than three to four times the current level in another 25 years
• Import dependence for commercial fuel sources o 76% of Crude oil is imported o 29% of Natural gas is imported
• Non-commercial energy sources, predominantly fuel wood, chips and dung cakes, contribute around 30% of the total primary energy
Power shortages frequent:
• Provision of electricity through extension of grid in remote areas with scattered settlements characterized by:
o High transmission and distribution (T&D) losses o Frequent disruption in supply of grid power o Financial un-viability of extending grid to remote and inaccessible areas
• 5% of urban and 40% of rural households depend primarily on kerosene for lighting Role of bio-energy in energy basket
• Biomass is the primary residential energy source: It delivers 90% of energy in rural and 40% of energy in urban households to meet cooking, water heating and space conditioning needs
• Dependence on biomass is expected to continue o projected increase in rural population in absolute terms o continued lack of access to commercial fuels in rural areas particularly for cooking like
LPG o Planning Commission estimates share of bioenergy in total household energy
consumption would be over 50% in 2031-32 Bioenergy usage characteristics
• 85% of rural and 24% of urban households use traditional mud stove fuelled by unprocessed solid biomass
• Due to poorly ventilated kitchens, IAP levels in rural households are often much higher than outdoor air pollution in cities
• Characterized by low efficiency (10-15%) as compared to LPG (65%) • 40% of acute respiratory infections (ALRI), 20% of chronic obstructive pulmonary disease
(COPD), & 3% of DALYs are caused by IAP from burning of solid fuels

P a g e | 25
Bioenergy resources and use – an overview:
• Biomass Energy: • Availability
o Agricultural residue o Wasteland produce o Forest produce
• Utility o Cooking and heating fuel
Direct combustion
Unprocessed solid biomass
Processed biomass Biogas
o Biomass gasification based power/co- generation o Biofuel for transportation
Land-use in India and potential for biomass expansion:
• Geographical area – 328.7 Mha. • Forest – 69.8 Mha (22.9%) to be increased to 33% under NAPCC • Not available for cultivation – 42.5 Mha (13.9%) • Uncultivated land excluding fallow land – 26.9 Mha. (8.8%) • Fallow land – 24.2 Mha. (7.9%) • Net sown area – 141.9 Mha (46.5%)
Biomass from forests Sl. No. Parameter Symbol Factor 1995 2005
1 Growing stock of country in Mm3
GS 5842.32 6218.28
2 Mean biomass expansion factor EF 1.575
3 Ratio (Below to above ground biomass) RBA 0.266
4 Above ground biomass (volume) AGB = GS X EF 9201.65 9793.79
5 Below ground biomass (voume) BGB = AGB X RBA 2447.64 2605.15
6 Total biomass (volume) TB = AGB + BGB 11649.29 12398.94
7 Mean density MD 0.7116
8 Biomass in Mt GS X MD 8289.63 8823.09
Source: Technical paper; India's forest and tree cover, 2009 (source: TERI 2009)

P a g e | 26
Biomass from agri-residue
CropEconomic
produce
Gross
cropped
area
Total
economic
production
Total
residue
production
Residue to total
economic
produce ratio
Type of residue
Mha MT MT (air dry) At harvest At use
Rice Food grain 42.6 85.7 154.3 1.8 Straw+Husk 30 10
Wheat Food grain 26.5 70.3 112.5 1.6 Straw 30 10
Jowar Food grain 9.0 7.1 14.3 2.0 Stalk 30 10
Bajra Food grain 9.3 8.2 16.3 2.0 Stalk + cobs 30 10
Maize Food grain 7.4 14.0 35.1 2.5 Straw 30 10
Other Cereals Food grain 3.2 3.7 7.4 2.0 Stalk 30 10
Red Gram Food grain 3.5 2.4 12.0 5.0 Waste 20 10
Gram Food grain 6.8 5.5 8.8 1.6 Waste 20 10
Other pulses Food grain 12.1 5.5 15.9 2.9 Shell + waste 20 10
Ground nut Oil seed 6.2 6.4 14.7 2.3 Waste 30 10
Rapeseed and Mustard Oil seed 6.3 6.7 13.3 2.0 Waste 20 10
Other oil seeds Oil seed 16.1 14.9 29.8 2.0 Waste 20 10
Cotton Fiber 8.4 16.0 55.9 3.5 Seeds + waste 20 10
Jute Fiber 1.0 11.0 17.6 1.6 Waste 30 10
Sugarcane Sugar 4.3 279.0 111.6 0.4 Bagasse + leaves 30 30
Total 162.7 619.4
Moisture %
(source: TERI 2009) Current use of agri-residue
Crop
Fodder Fuel Other
Rice 124.7 17.2 12.4
Wheat 97.3 0.0 15.3
Jowar 14.3 0.0 0.0
Bajra 14.7 0.0 1.7
Maize 28.4 6.7 0.0
Other Cereals 7.4 0.0 0.0
Red Gram 0.0 9.4 2.6
Gram 0.0 8.8 0.0
Other pulses 0.6 7.7 7.6
Ground nut 0.0 1.9 12.7
Rapeseed and Mustard 0.0 13.3 0.0
Other oil seeds 0.0 29.8 0.0
Cotton 0.0 55.9 0.0
Jute 0.0 17.6 0.0
Sugarcane 13.2 45.7 52.7
Total 300.5 214.0 105.0
2010
(source: TERI 2009)

P a g e | 27
Availability of agri-residue Crop
MT PJ
Rice 29.6 383.6
Wheat 15.3 198.5
Jowar 0.0 0.0
Bajra 1.7 21.5
Maize 6.7 86.0
Other Cereals 0.0 0.0
Red Gram 12.0 154.7
Gram 8.8 114.1
Other pulses 15.4 200.2
Ground nut 14.7 200.5
Rapeseed and Mustard 13.3 182.7
Other oil seeds 29.8 34.1
Cotton 55.9 838.4
Jute 17.6 261.8
Sugarcane 98.4 1553.7
Total 319.0 4229.8
2010
(source: TERI 2009) Wasteland SL. No Category of wasteland Suitability
1 Gullied and/or ravenous land (Shallow) suitable
2 Land with scrub suitable
3 Land without scrub suitable
4 Land affected by salinity/alkalinity (Slight) suitable
5 Shifting cultivation area (Abandoned Jhum) suitable
6 Shifting cultivation area (Current Jhum) suitable
7 Under utilized/degraded notified forest land suitable
8 Under utilized/degraded notified forest land (Agri.) suitable
9 Degraded pastures/grazing land suitable
10 Degraded land under plantation crop suitable
11 Gullied and/or ravenous land (Medium) moderately suitable
12 Waterlogged and Marshy land (Seasonal) moderately suitable
13 Land affected by salinity/alkalinity (Strong) moderately suitable
14 Land affected by salinity/alkalinity (Moderate) moderately suitable
15 Sands-(Levees) moderately suitable
16 Sands-(Coastal Sand) moderately suitable
17 Sands-(Semi Stab.-Stab.>40m) moderately suitable
18 Sands-(Semi Stab.-Stab Moder. High 15-40m) moderately suitable
19 Sands-(Semi Stab.-Stab. Low<15m) moderately suitable
20 Sands-(Closely Spaced Inter-Dune Area) moderately suitable
21 Mining wastelands moderately suitable
22 Industrial Wastelands moderately suitable
23 Gullied and/or ravenous land (Deep) unsuitable
24 Waterlogged and Marshy land (Permanent) unsuitable
25 Sands-(Flood Plain) unsuitable
26 Barren Rocky/Stone Waste/Sheet Rock Area unsuitable
27 Steep Sloping Area unsuitable
28 Snow covered and/or Glacial Area unsuitable
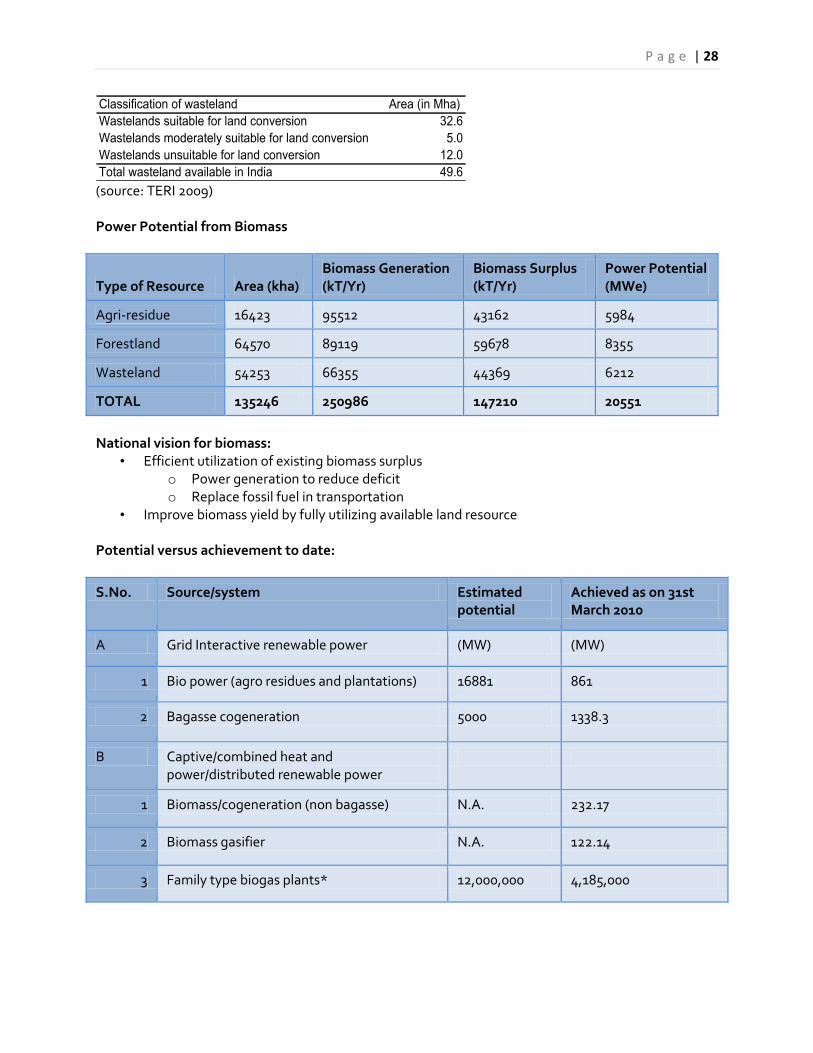
P a g e | 28
Classification of wasteland Area (in Mha)
Wastelands suitable for land conversion 32.6
Wastelands moderately suitable for land conversion 5.0
Wastelands unsuitable for land conversion 12.0
Total wasteland available in India 49.6 (source: TERI 2009) Power Potential from Biomass
Type of Resource Area (kha) Biomass Generation (kT/Yr)
Biomass Surplus (kT/Yr)
Power Potential (MWe)
Agri-residue 16423 95512 43162 5984
Forestland 64570 89119 59678 8355
Wasteland 54253 66355 44369 6212
TOTAL 135246 250986 147210 20551
National vision for biomass:
• Efficient utilization of existing biomass surplus o Power generation to reduce deficit o Replace fossil fuel in transportation
• Improve biomass yield by fully utilizing available land resource Potential versus achievement to date:
S.No. Source/system Estimated potential
Achieved as on 31st March 2010
A Grid Interactive renewable power (MW) (MW)
1 Bio power (agro residues and plantations) 16881 861
2 Bagasse cogeneration 5000 1338.3
B Captive/combined heat and power/distributed renewable power
1 Biomass/cogeneration (non bagasse) N.A. 232.17
2 Biomass gasifier N.A. 122.14
3 Family type biogas plants* 12,000,000 4,185,000

P a g e | 29
Policy Review • Earlier perspective (Pre- 1990s)
o Biomass viewed as traditional fuel for meeting rural energy needs o Supply-side push with market instruments having little role in biomass policies o Mostly government and NGO initiatives in programme/ project mode
• Current perspective o Biomass is a competitive energy resource, which can be pulled through energy markets o Promote technologies and private investment for optimum biomass resource utilization
for power generation • Focus Areas
o Power Generation Direct combustion and co-generation for power generation (ex. Sugar Industry) Biomass gasifier for rural power requirements Biogas based power generation
o Cooking Fuel NPIC, recently launched National Biomass Cook stove Initiative National Project on Biogas Development
• Incentives to invite private players o Central Financial Assistance (CFA) in the form of capital subsidy and/ or interest subsidy o 80% accelerated depreciation • Concession in import duty • Excise duty exemption on equipments • Tax holiday • Preferential feed in tariffs along with renewable purchase obligation
Existing biomass energy stakeholder framework

P a g e | 30
Bio-energy and Poverty Alleviation • Employment Generation: Labor intensive biofuel/energy plantation would generate 100 times
more workers per unit energy production as compared to technology-intensive fossil fuel industry
o Unskilled employment generation o Must be studied in greater detail as it can mobilize political support for bio-energy
• Distributed Power: o Rural community face unreliable power scenario due to national deficit of >10% o Bioenergy technologies like biomass gasification can bridge deficit o Provision of quality power helps in enterprise development and competitiveness
• Fuel wood saving: o Average rural household conume1800 kg of fuel/year o Improved cook stoves have potential of reducing fuel consumption by almost 30% to
45% leading to monetary saving o Food V. Fuel: Biomass production could compete with food production on a local/
regional scale and lead to regional food supply shortage or price volatility o Threat to land rights: Mono-culture and un-monitored entry of private investors
How does this relate to the MDGs? E.g. 4a, 5a, 6c: Reduce…child ..maternal mortality….Halt…incidence of major diseases…
• 3 billion people dependent on direct burning of biomass • Approx 150 million rural households adversely impacted by biomass based cooking in India • Close to 2 million people die globally due to indoor air pollution – chief cause of ALRI • Monitoring of IAP
• A few thousand improved cookstoves installed • SHGs for manufacturing and marketing of stoves • Current commercial options cost around $80 • Focus on cost reduction to bring it down to $ 20 • Focus on real time monitoring of cooking to claim C credits
Bio-energy and Climate Change
• The life-cycle carbon balance of bioenergy critically depends o Choice of feedstock o Management of land resources o Land-use changes induced by cultivation, conversion and processing methods o Type of fossil energy carrier which is replaced o Efficiency of energy end-use.
• Potential for significant GHG abate potential:>100 million ton C/year o Sustainable harvesting? o Alternative land usage?
• Water footprint of biofuel: o Jatropha (600 m3/GJ) Vs Rapeseed (400m3/GJ) o Conflict with water for food crop
• Loss of bio-diversity with mono-culture? Case Study : SKG Sangha
• Technology: 2 cubic meter Deenbandhu (DB) model in brick masonry sufficient for family size of 4-6 people, owning 3-4 cows

P a g e | 31
• Cost: 18,000 INR ~ 400 USD • Target Beneficiary: Rural women
o who own cattle o have sufficient space for installation of biogas plant
• 1993-2008: 64000 plants installed • Success rate of 95% functionality after 5 years of operation against national average of 42% • International Ashden Award for Sustainable Energy – 2007 • Beneficiary Contribution in cash and kind
o sense of ownership will be instilled o increase in accountability
Biogas plants are functional Regularly repaired and maintained.
• Quality control o All material used purchase material directly from factories – cheaper & better quality
• Addressed main identified reasons for past failures in biogas programmes o Local level supervisors o Adequate training of implementing staff o Reliable and Prompt After sale services:
100% guarantee for all plants for 5 years All service costs borne by SKGS for life of plant 100% replacement for technical faults
o Awareness and capacity building of beneficiaries Some examples of innovation:
• Creation of Linkage between biogas and vermi-compost o 200 no. of 30 kg bags of vermiculture manure a year produced from each biogas plant o Sale of manure @INR 3/kg yields yields economic benefit
• Beyond government subsidies: o CDM and VER being explored as opportunities for future financing o In process of implementing quality projects under CDM and VER
Benefits from biomass energy
• Economic o Generation of employment for local youth as supervisors, technicians and masons o Additional income from vermin-composting o Indirect non-monetized benefits
Time saved: 3-4 hrs in fuel collection Reduction in expenditure on health due to reduction in IAP Reduction in expenditure on firewood and kerosene for cooking etc.
• Environmental o 3.56 tCO2e annual reductions per household o Saving of 3.56 tonnes of fuel wood/household/year o Improvement in soil fertility by using vermi-compost o Improvement in indoor air quality and reduced smoke in kitchens
• Social o Capacity building of local manpower especially youth o Reduced drudgery of women and children: 2-4 hours traveling 2-3 kilometres a day to
collect fire wood

P a g e | 32
o Women empowerment: income generation through vermin-composting, health benefits, awareness and capacity building
Scope of improvement
• Need to attempt quantification of benefit of fuel wood saving, reduced health cost, opportunity cost of time saved
• Documentation of technical and other problems o Maintain a member card o Update date and type of problem faced, date and rectification measure, person
undertaking rectification Demonstrate prompt problem rectification Analysis of types of problems to understand general trend over a time period
Recommendations
• Dovetailing: Create linkage between existing programmes and bioenergy technologies o NREGA and energy plantation o Dairy and biogas o Afforestation with biomass gasification
• Promotion of technology transfer: Role of donor agencies in lobbying with respective governments
• Compulsory financing of viable BE technologies by commercial banks • Reduce policy uncertainties with specific roadmap: Clear national and state level legislations
(not draft policy or draft guidelines as current trend suggests) • Encourage small-scale community based Jatropha initiatives like agro-forestry with Jatropha
intercropping for in-situ usage like lighting fuel or as fuel for running water pumps.
11.00 Coffee

P a g e | 33
11.30 Steven Hunt (on behalf of Practical Action, Kenya)
Biomass energy use in Kenya
This presentation focused on (i) a quantified analysis of biomass use in Kenya; (ii) a description of what is known of the impact of biomass energy use on poverty reduction and ecosystem services in Kenya; (iii) a description of the main policies, institutions and individuals that currently define biomass use in Kenya; (iv) innovative initiatives in the sector and why they have succeeded or failed to date and (v) a theory of change about what a desirable biomass energy ‘transition’ in Kenya would look like and how to bring it about. Sources of energy in Kenya According to a national study of 2000, Kenya depends on the following forms of energy:
• Biomass – 68% (includes crop residues) • Petroleum fuels – 22% • Electricity – 9% • Others (e.g. Solar and wind) – 1%
Fuelwood as a source of energy in (2000)
• URBAN – 7% - 691 kg/capita/year • RURAL – 89% - 741kg/capita/year • NATIONAL – 34.3m Tonnes – 15.1m Tonnes of fuelwood and 16.5m Tonnes wood for
charcoal Charcoal as a source of energy in Kenya
• URBAN HOUSEHOLDS – 82% - 52 kg/capita/year • RURAL HOUSEHOLDS – 34% – 156 kg/capita/year • NATIONAL CONSUMPTION - 2.4 million tonnes per year
Current sources of biomass energy
• Farmlands exotic and remnant natural vegetation – 39% • Closed Forests, Woodlands, Wooded grasslands, Bushlands – 45% • Plantations – 7% • Agricultural wastes and Industrial wastes – 9% • Sustainable wood yields meet only 43% of the total demand. The balance of 57% is drawn
from standing stock – leading to deforestation. • The key sinks for GHG are the oceans and the forests. • Harvesting wood unsustainably for energy therefore contributes to climate change which
in-turn contributes to food insecurity and increased poverty
P a g e | 34
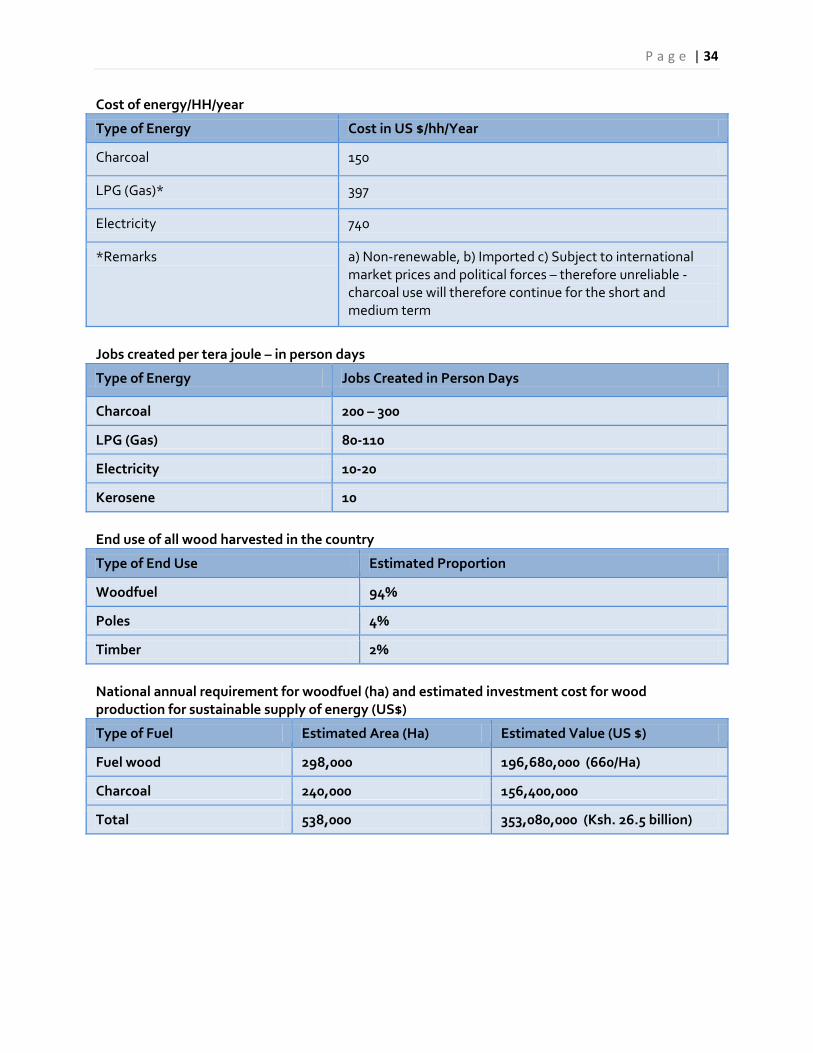
Cost of energy/HH/year
Type of Energy Cost in US $/hh/Year
Charcoal 150
LPG (Gas)* 397
Electricity 740
*Remarks a) Non-renewable, b) Imported c) Subject to international market prices and political forces – therefore unreliable - charcoal use will therefore continue for the short and medium term
Jobs created per tera joule – in person days
Type of Energy Jobs Created in Person Days
Charcoal 200 – 300
LPG (Gas) 80-110
Electricity 10-20
Kerosene 10
End use of all wood harvested in the country
Type of End Use Estimated Proportion
Woodfuel 94%
Poles 4%
Timber 2%
National annual requirement for woodfuel (ha) and estimated investment cost for wood production for sustainable supply of energy (US$)
Type of Fuel Estimated Area (Ha) Estimated Value (US $)
Fuel wood 298,000 196,680,000 (660/Ha)
Charcoal 240,000 156,400,000
Total 538,000 353,080,000 (Ksh. 26.5 billion)

P a g e | 35
Biomass energy balance situation by provinces 2000 Province Biomass Energy
Deficit/Tons/Year % Deficit
Nairobi 2,304,903 -99.55*
Coast 1,540,367 -51.21*
North Eastern 253,394 -21.23
Eastern 2,247,187 -39.02*
Central 3,300,154 -71.30*
RiftValley 3,431,392 -39.67*
Nyanza 3,887,661 -72.07*
Western 3,130,047 -75.04*
National 20,095,106 -57.22*
Policies and legislation governing biomass energy use in Kenya
• Energy Policy of 2004 • Energy Act of 2006 • Forest Act of 2005 • Environmental Management and Coordination Act 1999 • Draft Environmental Policy – Final touches • Draft Forest Policy – In parliament
Examples of successful projects for biomass energy supply and use in Kenya
• Kakuzi Charcoal Production Enterprise • RAFDIP – Charcoal Production Model • Mumias Electricity Generation from Biomass • GTZ-Ministry of Energy Biogas Project
Kakuzi charcoal production enterprise
Activity Est Cost/Bag (Ksh)
Tree growing 75
Kiln construction 20
Harvesting of wood 39
Operational cost 11
Handling cost 12
Store & stock 3
Total cost 159

P a g e | 36
Rafdip charcoal production model <IMAGE>
• Current area of land and charcoal woodlots 220 ha • 100 tons of round wood or 30 tons of charcoal per ha after 6 years
Mumias electricity generation from biomass use in Kenya
• Mumias Sugar Company generates 34 MW of power from bagasse • 6 MW consumed internally • Sells balance of 28MW to the National Electricity Grid
GTZ-Ministry of Energy biogas project in Kenya
• In 1997,1100 biogas plants were estimated to be in operational mostly constructed under the Ministry of Energy’s Special Energy Programme sponsored by GTZ.
• Most systems found in Kenya are between 4-16 cubic metres. 3 cubic metres of gas is considered sufficient to meet the cooking and lighting needs of a family of 5 persons in Kenya. The per capita daily consumption of biogas is 0.6 cubic metres, which translates to an annual per capita consumption of 219 cubic metres of biogas.
• Uptake of biogas technology in Kenya has remained very low due to high capital costs for not only the plant, but also for the modified burners and lighting units.
• Inadequate maintenance and management support services required have further impeded uptake because plants are prone to cracking and leaking yet their operations require that they be air and water-tight.
• Lack of adequate water supplies, which is normally added in a ratio of between one and three parts water to one part feedstock, has also been an impediment.
Possible future trend for biomass energy
• Kenya’s increasing urban population (7.4%) per year • Rural population (3.0%) per year • Unreliability of the fossil fuels – LPG and Kerosene • Demand for charcoal and fuelwood is expected to increase proportionately. • Unemployment will also increase. • There is need to increase biomass energy supply, which will also create more employment • Investment in extensive commercial farm forestry, plantation and management of dry
land woody resources for sustainable fuel wood and charcoal production offers hope for energy supply, employment creation, and ecosystem services
• Expanded adoption of efficient biomass utilization technologies will reduce the demand for wood energy hence contribute to reduced deforestation, land and environmental degradation.
• Develop the carbon markets so that farmers can earn an income from the trees they plant as they protect the environment.
Political / policy interventions
• Lobby the President/Prime Minister and other key offices to actively facilitate and monitor implementation of the forest and energy policies in the country
• Carry out advocacy for tree planting for the Ministry of Finance (Treasury) to allocate more money for investment in the sub-sector this will ensure energy security and also contribute to employment

P a g e | 37
• Using scientifically proven facts, lobby parliamentarians to give sufficient priority to afforestation and energy conservation programmes – all the way up to their constituencies
Market / finance interventions
• Develop woodfuel markets to promote tree growing as a cash crop for the market • Encourage NGOs and CBOs to support farmers to invest in commercial agroforestry for
income, food, employment and ecological stability • Create an Afforestation Fund at the newly formed Counties – and or increase funding for
afforestation through the Forest Conservation Fund (of KFS), Constituency Development Fund or Local Authority Transfer Fund of the Local Government – e.g. for 10-20 years to expand tree planting and also ensure improved land productivity
• Seek for resources for tree planting from the private sector including commercial banks • Establish a large corporation or company for producing charcoal on commercial basis for
the urban and rural market and/or especially for educational institutions, tea factories and other fuelwood using industries e.g. paper manufacture
Land / supply interventions
• Target afforestation of Local Authority land – The Forests Act (legislation) provides for establishment of new forests by Local Authorities
• Target the idle rural land of urban dwellers for commercial tree planting through an affordable investment scheme.
• Invest in promoting natural regeneration of the woodlands in the arid and semi-arid areas by developing and implementing appropriate woodland management plans.
Demand side interventions
• Promote the use of energy efficient charcoal kilns to reduce the wood used for charcoal production by more than half – current adoption level of efficient kilns is about 1%.
• Promote the use of efficient charcoal and fuelwood stoves to reduce the wood resources consumed by more than half.
Individual interventions Key stakeholders (including individuals) should be encouraged to:
• Adopt a group to support in tree planting • Adopt a tree nursery to support in supply of seeds and polytubes • Adopt a school for enhanced tree planting
Capacity interventions
• Provide extension services to a community e.g. advice on the number of trees that should be planted on each farm for their biomass energy needs?
• Train extension support providers at the community level e.g. train volunteer forest assistants in each location e.g. 1 per village and attach them to the Chief or Assistant Chief for implementation of afforestation programmes at the village level.
• Package extension information from scientific conferences for farmers to use • Build capacity of Community Forest Associations to coordinate tree planting and efficient
utilization of the wood resources

P a g e | 38
12.00 Patrick Kambewa (University of Malawi)
Biomass energy use in Malawi
This presentation focused on (i) a quantified analysis of biomass use in Malawi; (ii) a description of what is known of the impact of biomass energy use on poverty reduction and ecosystem services in Malawi; (iii) a description of the main policies, institutions and individuals that currently define biomass use in Malawi; (iv) innovative initiatives in the sector and why they have succeeded or failed to date and (v) a theory of change about what a desirable biomass energy ‘transition’ in Malawi would look like and how to bring it about. Background information
• Population 13 million
• Population distribution (50 percent in the south, 38 percent center and 12 percent in the north)
• Over 80 Percent living in the rural areas
• 40 percent living below poverty line
• 85 percent dependent on agriculture
Biomass energy supply and use
• Biomass accounts for 97% of total primary energy supply
– 59% is used in its primary form as firewood (52%)
– Residues (7%)
– 41% are converted into charcoal
Table 1: Annual Use of Roundwood in Malawi, 2007
Forestry Resource Use Total Consumption(thousand m3/year) Percent (%)
Charcoal 1,999 13
Firewood 11,644 78
Poles 975 7
Sawnwood 280 2
Total roundwood 14,895 100
P a g e | 39
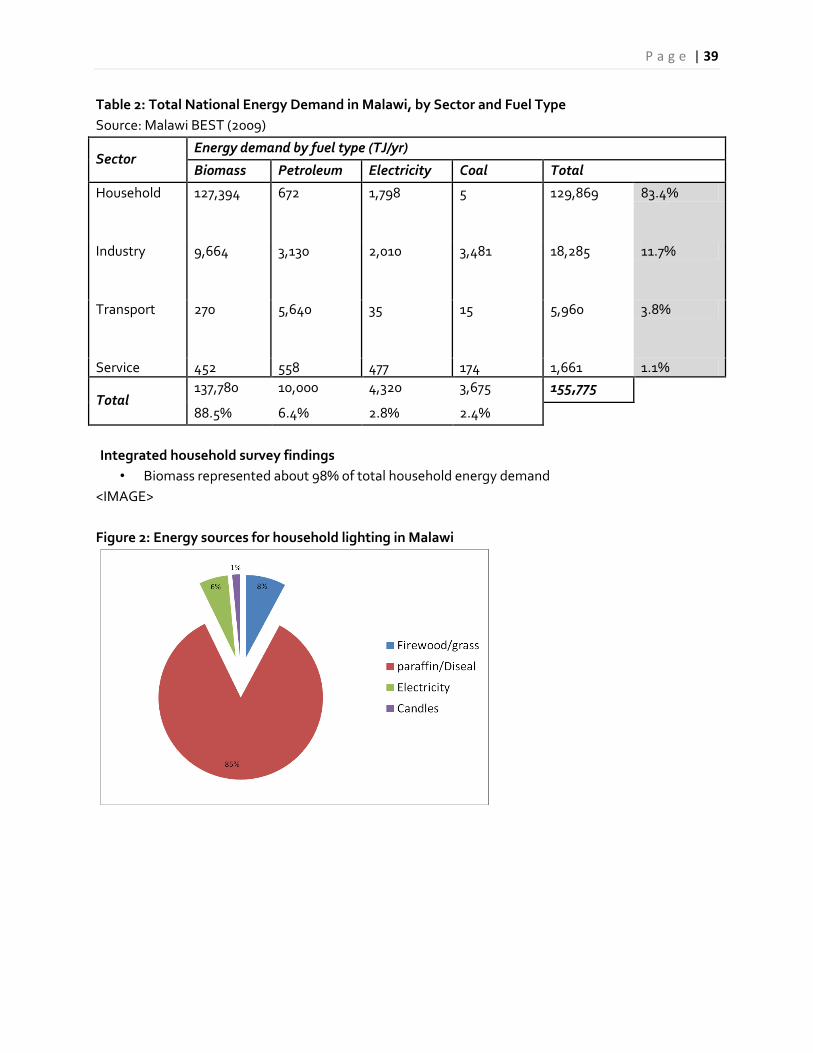
Table 2: Total National Energy Demand in Malawi, by Sector and Fuel Type
Source: Malawi BEST (2009)
Sector Energy demand by fuel type (TJ/yr)
Biomass Petroleum Electricity Coal Total
Household 127,394 672 1,798 5 129,869 83.4%
Industry 9,664 3,130 2,010 3,481 18,285 11.7%
Transport 270 5,640 35 15 5,960 3.8%
Service 452 558 477 174 1,661 1.1%
Total 137,780 10,000 4,320 3,675 155,775
88.5% 6.4% 2.8% 2.4%
Integrated household survey findings
• Biomass represented about 98% of total household energy demand
<IMAGE>
Figure 2: Energy sources for household lighting in Malawi
P a g e | 40
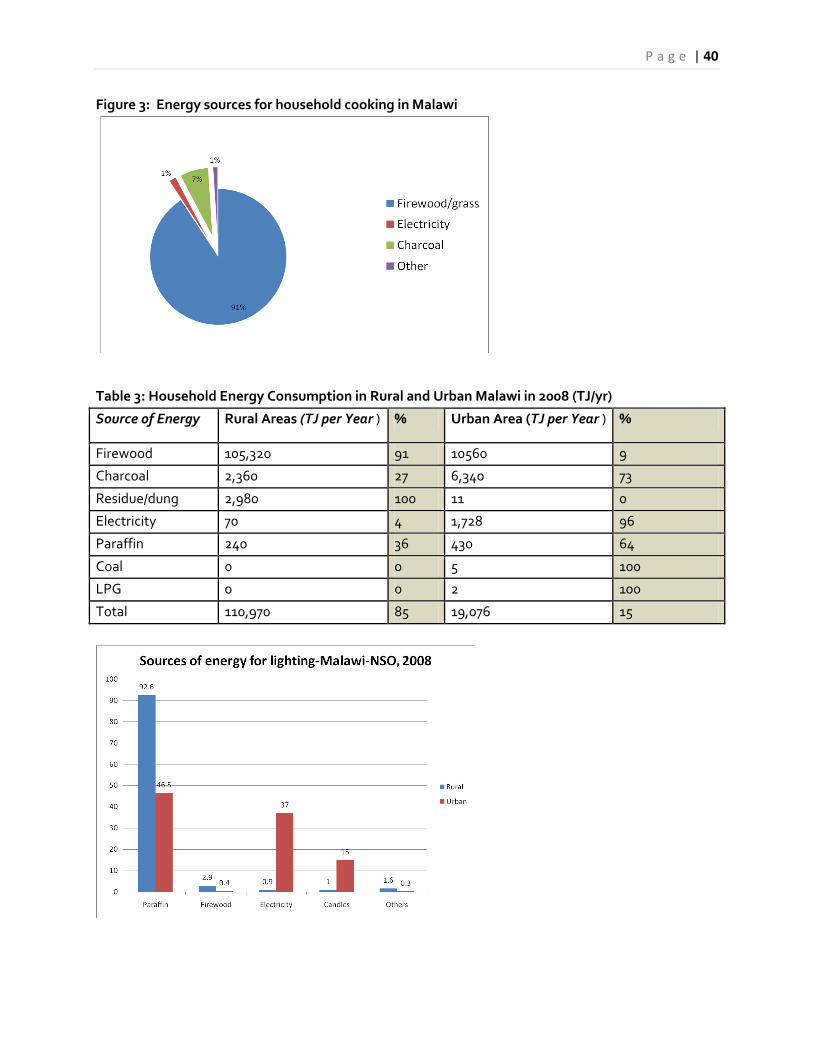
Figure 3: Energy sources for household cooking in Malawi
Table 3: Household Energy Consumption in Rural and Urban Malawi in 2008 (TJ/yr) Source of Energy Rural Areas (TJ per Year ) % Urban Area (TJ per Year ) %
Firewood 105,320 91 10560 9
Charcoal 2,360 27 6,340 73
Residue/dung 2,980 100 11 0
Electricity 70 4 1,728 96
Paraffin 240 36 430 64
Coal 0 0 5 100
LPG 0 0 2 100
Total 110,970 85 19,076 15

P a g e | 41

P a g e | 42
Impact of current biomass use on poverty reduction
• Supply side impacts
– Openshaw (1997) and Lowore (2006) reported that trade in wood fuel in the country’s
four cities provided 55,000 part time employments valued at US$43.7 million.
– The Malawi BEST (2009) estimated that the forestry sector, employed about 29,000
people with 20,000 in the informal sector and 130,000 people involved in fuel wood
– Malawi BEST (2009) estimated that labour costs for charcoal and firewood sold in the
urban sector was valued at US$148 per day
– Kambewa et al. (2007) reported that 92,800 people were involved in the value chain of
charcoal as producers, transporters and wholesale and retail traders for the country’s
four cities
• Demand side impacts
– Biomass energy as a source of more affordable and accessible energy
– Unreliability of electricity supply
Impact of Current Biomass use on Carbon Sequestration

P a g e | 43
Table 4: Cost effectiveness and benefits of three mitigation options
(Source: Kambewa et al. (2003))
Scenario Net Present Value Benefit from Reducing
Atmospheric Carbon (BRAC)
Endowment PV cost
K/t-C K/ha K/t-C/year K/t-C K/ha
Natural
regeneration
-548.35 -10,490 -4.112 0 0
Protection -1.58 -110 -0.119 56.31 3903
Short rotation -2,376.10 -29,730 -17.821 2506.9 32, 042
Impact of biomass use on biodiversity and ecosystem resilience • Effect of charcoal on preferred species (Kambewa et al, 2007, and Ngalande undated)
• Effect on soil erosion in mid-Shire region (Yaron et al. 2010)
Impact of Biomass Use on Watershed dynamics and flows (off-site effects) <IMAGE>
• Impact of silting on hydroelectricity generation (US$10 million or 1.9 percent of the country’s
GDP)
• Cost the Blantyre Water Board US$415,949 in 2008
• Impact on irrigation
Policies that govern biomass use
• The National Energy Policy, 2003
– improve efficiency and effectiveness of the commercial energy supply industries;
– improve the security and reliability of energy supply systems;
– increase access to affordable and modern energy services;
– stimulate economic development and rural transformation for poverty reduction;
– improve energy sector governance; and mitigate environmental, safety, and health
impacts of energy production and utilisation
• The Forestry Policy, 1996
– sustainable production and conservation of wood resources and recognises the
importance of wood fuels in the national energy supply and the need to bring about
improvements in their sustainable production and supply
– a reduction in the dependence on woodfuel as a source of energy through switching to
alternative sources of fuel and adopting woodfuel-saving devices
• The Malawi Biomass Energy Strategy, 2009
– Increase the supply of sustainable woodfuels;
– Increase the efficiency of energy use ; and
– Create the institutional capacity to manage the biomass energy sector
• Other policies/strategies affecting the governance of biomass use and supply
– Land Policy
P a g e | 44
– The Malawi Growth and Development Strategy (conservation of natural resources such
as fisheries, forestry and the environment)
Institutions and individuals affecting the biomass use and supply
• Regulators of production and use of biomass energy
– Malawi Energy Regulatory Authority (MERA)
– Department of Energy
– Department of Forestry
• Producers of biomass energy and alternative energy sources
– Smallholders/estates
– ESCOM
– PIL
• Users of biomass energy
– Households, estates, industry and others
• Advocacy organizations
– Forest Governance Learning Group and its allied NGOs and international partners
• Parliamentary Committee on Agriculture and Natural Resources
Innovative Projects in Biomass Use
• Blantyre Fuelwood Project (1986)
• Gelfuel project
• Improved Forest Management for Sustainable Livelihoods
• Community Based Natural Resource Projects
Emerging Issues
• Biomass energy sources are pro-poor from supply and demand perspectives
• Use of biomass (harvesting especially charcoal) still remains stigmatized making it a pariah
sector
• Challenge is to make the production of biomass energy as attractive and as legitimate as
possible
• Use of alternative sources other than indigenous trees should be explored
• Can production of biomass energy sources be made an attractive business?
• Need to document lessons from various initiatives to isolate driving factors for success and/or
failure.

P a g e | 45
13.00 Lunch
14.00 Steven Hunt (Practical Action UK)
Biomass energy and poverty reduction
This presentation will focus on (i) an introduction to the various ways in which biomass energy is being used to meet poor people's demand for energy and involve them in its supply; (ii) specific case studies of successful initiatives drawn from the PISCES programme and beyond; (iii) appropriate technologies that improve biomass use efficiency especially for the big two - charcoal and fuelwood (iv) policy frameworks that provide options for sustainable commercial use of biomass by the poor (v) conclusions on the components of a research framework that might be necessary to promote a transition towards biomass energy that reduces poverty and detrimental impacts on ecosystem services. Energy Access and the MDGs
• Poverty o Energy as a basic need and for economic activities
• Hunger and drinking water o Energy to process and cook food, and pump water
• Child, maternal mortality and disease o Energy for lighting, refrigeration, sterilisation, transport
• Education and Equality o Energy for basic tasks, home study, security, ICTs
• Environmental Sustainability o Reducing emissions, local resources
Energy Services and carriers – biomass has a particular relevance to those marked in red
Energy Carriers
Fuels Electricity Mechanical Power
Energy Services
Lighting X XXX
Cooking/water heating XXX XX
Space heating XXX XX
Cooling X XXX
ICTs XXX
Irrigation XXX XX XXX
Agro-processing XX XX XXX
Manufacturing XX XX XXX
Lifting–crossing XX XXX

P a g e | 46
Energy carriers – the three main ingredients:
“A reliance on traditional biomass” has been couched as a ‘problem’. What the ‘fuelwood problem’ is perceived to be:
• Drudgery • Deforestation
o Reducing availability o Environmental Damage
• Smoke o IAP Kills 1.5M per annum (WHO) o CO2 and Black Carbon
• No access to “modern” energy o Safety, cost, security o Basic services, ICTs
PISCES Bioenergy Framework <FLOWCHART OF ABOVE>
BIO
EN
ER
GY
RE
SO
UR
CE
S
BIORESOURCES
BIORESIDUES
BIOFUELS PR
OD
UC
TIO
N S
TE
PS
PR
OC
ES
SIN
G S
TE
PS
DE
LIV
ER
Y V
EC
TO
RS SOLID
LIQUID
GAS
AP
PL
IAN
CE
TE
CH
NO
LO
GIE
S
BIO
EN
ER
GY
SE
RV
ICE
S
EN
ER
GY
AC
CE
SS
LIV
EL
IHO
OD
S

P a g e | 47
Conceptual framework of link between biomass energy and forest related ecosystem services:
Examples were given of:
• Appliances • Alternative Fuels • Whole chain approaches • Biomass for rural industry
A value chain approach was recommended as one way of improving impacts:

P a g e | 48
Policy research issues • Land rights and ownership • Technologies and capacity • Standards and certification • Financing and taxation • Planning and regulation • Communication and enforcement • Monitoring and verification • Sustainable market development
14.30 Alan Bond (University of East Anglia)
Biomass energy and ecosystem services assessment
This presentation focused on (i) an introduction to ecosystem services as defined in the Millennium Ecosystem Assessment (ii) an introduction to a system for Environmental Impact Assessments (EIAs) of projects, and for Strategic Environmental Assessments (SEAs) or Sustainability Appraisals (SAs) for biomass energy crops - together with RRes as appropriate (iii) current examples of the use of such frameworks in biomass energy initiatives (vi) conclusions on the components of a research framework that might be necessary to promote a transition towards biomass energy that reduces poverty and detrimental impacts on ecosystem services. Millennium ecosystem assessment: Introduction
• MEA called for by the United Nations Secretary-General Kofi Annan in 2000 (initiated 2001) • Objective to “assess the consequences of ecosystem change for human well-being and the
scientific basis for action needed to enhance the conservation and sustainable use of those systems and their contribution to human well-being”
MEA: types of capital

P a g e | 49
MEA: Ecosystem Services
MEA: conceptual framework

P a g e | 50
MEA: overview • Human health and well-being focused • Trade-offs common in order of provisioning; regulating; cultural services (Rodriguez et al. 2006) • Four scenarios tested and suggest need for (Carpenter et al. 2006):
o Resilience building o Adaptive management o Green technology
Introducing environmental impact assessment (EIA) for biomass energy
• EIA since 1970 in USA • Most countries in world have EIA legislation • Usually refers to agriculture and forestry projects • In practice – limited EIA takes place (agriculture permitted development in UK – no obvious
decision points) • End use tends to be subject to EIA
EIA focus
• EIA originally designed to redress socio-economic bias • EU Directive focuses on:
o human beings, fauna and flora; o soil, water, air, climate and the landscape; o material assets and the cultural heritage; o the interaction between the factors mentioned in the first, second and third indents
EIA practice (UK example)
• For power stations: guidance that requirement starts at 50MW output (in practice it is lower)
What is Sustainability Appraisal / Assessment (SA)?
• Broad assessment of social, economic and environmental implications of doing something • Practice in England, Western Australia, Canada, South Africa • Application level (policies, plans, programmes, projects) varies • In England – SEA is subsumed with SA

P a g e | 51
EIA case example – Brazilian Sugarcane
Sugarcane crops in Brazil
central-southern region
north-northestern region
MT
GO
MG
PR
RN
PB
PE
AL
SE
MS
sugarcane crops
The State of São Paulo
E
N
W
S
240 0 240 Km

P a g e | 52
Agri-environmental zoning
Requirements for the approval of new projects in São Paulo
Type of zoning Main requirements In suitable areas appropriate environmental study (PER or EIS) in
accordance with Resolution SMA 42/2006 Maximum water consumption 1 m
3 per ton of processed
sugarcane
Rehabilitation of riparian vegetation In areas considered as suitable with environmental limitations
EIS Continuous air emissions monitoring (particulate matter and
NOx) Detailed study of aquifer vulnerability Underground water monitoring and target of maximum
nitrate concentration of 5 mg/L Maximum water consumption 1 m
3 per ton of processed
sugarcane Full protection of remaining natural vegetation stands and
wetlands Landscape ecology studies to support any request to fell
isolated remaining trees
In areas considered as suitable with environmental constraints
As above and Establishment of ecological corridors Fauna monitoring during operation Maximum water consumption 0.7 m
3 per ton of processed
sugarcane Detailed landscape ecology and ecological studies
In unsuitable areas New projects are forbidden

P a g e | 53
EIA in Brazil – effectiveness • Mismatch between impacts studied and those which are significant
o Socio-economic impacts largely missing (not an issue with badly done EIA necessarily) • Project EIA works on too small a scale for land use change impacts • More strategic assessment with a broader focus needed • Human rights issues?
Case example – the Relu-Biomass project
• Land use under biomass crops is expected to expand • Perennial Biomass crops are:
o In the ground for circa 25 yrs o Harvested in winter/spring o Dense, tall crops
Potential implications for:
• Landscape • Tourist income • Farm income • Water • Biodiversity • Soil
Sustainability Assessment case study: Relu-Biomass
• Both SRC willow and Miscanthus • Two contrasting regions studied (SW England and E-Midlands) • Utilised existing data & generated new data to fill knowledge gaps
1. GIS-based suitability mapping and landscape visualisations 2. Public surveys (n=490), stakeholder and focus groups 3. Biodiversity assessments (24 fields of each crop) 4. Water use assessments (over the year in both crops) 5. Economic assessment from farm to wider scale
Sustainability Appraisal Framework
• What do we want the area to be like in the future (our objectives)? • How do we measure this (indicators)? • Objectives and indicators should be established through critical examination of existing
policies/objectives and pressures in the given sector/area • They should be agreed by as many stakeholders as possible
Typical objectives and indicators
• Protect and enhance biodiversity o Bird population indices (a) farmland birds o Characteristic plant and invertebrate species/groups o Butterfly abundance
• Enhance viability of farming o Average duration of product supply contracts o Number of farms with alternative enterprises o Farm profitability

P a g e | 54
Sustainability Appraisal process – some issues? • Typically 20-30 objectives • Typically at least 3 indicators per objective • Likely to be testing each scenario / option / alternative against over 100 indicators • Multiple interpretations of sustainability • Different framings of effectiveness (substantive, transactive, process) • Reductionist
Scenarios development
SOUTH WEST
1. LAND COVER
SW Scenario
1a) 43,000 Ha of Miscanthus planting
1b) 18,000 Ha of Miscanthus planting
1c) “Extreme” 130,000 Ha of Miscanthus planting
2. BIOMASS END-USE
2a) Small-scale CHP (Based on 8MW CHP units)
2b) Large-scale co-firing (Based on 100MW-biomass units)
2c) Dedicated Biomass (Based on 40MW units)
3. LANDSCAPE MANAGEMENT: SW
3a) Monocrop Miscanthus - Heavily aggregated
3b) Monocrop Miscanthus - Realistic scenario 3c) Monocrop Miscanthus - Evenly spread 4. FIELD MANAGEMENT
4a) 4m
4b) 10m
Scenarios – developed to actual locations

P a g e | 55
Biomass crops in the landscape • Most people were unconcerned –thought crops would fit in well • More concerns over lorry movements and where the power stations would be • Wider margins and smaller, scattered fields were slightly more favoured
Biomass crops and water use
• SRC willow and Miscanthus roots grow no deeper than deep rooting annual crops. • SRC willow water use is similar to that of a cereal crop, higher than permanent grass and lower
than that of mature woodlands • Miscanthus water-use approaches that of woodlands.
Biomass crops and biodiversity
• More butterflies in the field margins of both energy crops • SRC has positive effect on farmland and woodland birds Miscanthus more variable • More weed biomass and invertebrates in SRC than Miscanthus • Certain important species may be negatively affected • Plantation design and management are important
Stakeholder concerns / concerns about stakeholders!
• SA is a tool that can lead to perverse decisions because of trade offs (e.g. planting on SSSIs) – constraints mapping
• ‘Experts’ have insufficient grasp of local issues to be trusted to interpret SA results • Scale is a critical issue – statutory consultees tend to work on a national, not regional scale
Impacts on alternative land-use
• Yield map for all soils except organic (~ 11 M ha) • Yield map for 9 absolute eco-environmental constraints (<8 M ha) • Yield map 2, secondary, constraints (<5 M ha) • Yield map for all constraints plus ALC 3 & 4 (~ 3 M ha)
Ways forward?
• Accommodating pluralism is key
• Correct spatial scale is large • Ecosystem services a nice concept – but potential for poor trade-offs • No set list of indicators applicable everywhere • Have to work for those who will directly use the ecosystem services • Have to be creative over alternative means of ‘service’ provision
References
• Carpenter, S R, E M Bennett and G D Peterson (2006), "Scenarios for ecosystem services: An overview", Ecology and Society, 11(1).
• Rodríguez, J P, T D Beard Jr, E M Bennett, G S Cumming, S J Cork, J Agard, A P Dobson and G D Peterson (2006), "Trade-offs across space, time, and ecosystem services", Ecology and Society, 11(1).
• Lovett, A A, G M Sünnenberg, G M Richter, A G Dailey, A B Riche and A Karp (2009), "Land Use Implications of Increased Biomass Production Identified by GIS-Based Sustainability and Yield Mapping for Miscanthus in England", Bioenergy Research, 2(1), pages 17-28.

P a g e | 56
• Karp, A, A J Haughton, D A Bohan, A A Lovett, A J Bond, T Dockerty, G Sünnenberg, J W Finch, R B Sage, K J Appleton, A B Riche, M D Mallott, V E Mallott, M D Cunningham, S Clark and M M Turner (2009), "Perennial Energy Crops: Implications and Potential", in M Winter and M Lobley (editors), What is Land For? The Food, Fuel and Climate Change Debate (Earthscan, London).
• Haughton, A J, A J Bond, A A Lovett, T Dockerty, G Sünnenberg, S J Clark, D A Bohan, R B Sage, M D Mallott, V E Mallott, M D Cunningham, A B Riche, I F Shield, J W Finch, M M Turner and A Karp (2009), "A novel, integrated approach to assessing social, economic and environmental implications of changing rural land-use: a case study of perennial biomass crops", Journal of Applied Ecology, 46(2), pages 315-322.
• Bond, A, T Dockerty, A Lovett, A B Riche, A J Haughton, D A Bohan, R B Sage, I F Shield, J W Finch, M M Turner and A Karp (in press), "Learning how to deal with values, frames and governance in Sustainability Appraisal", Regional Studies. DOI: 10.1080/00343404.2010.485181
• Gallardo, A L C F and A Bond (2010), "Capturing the implications of land use change in Brazil through environmental assessment: Time for a strategic approach?" Environmental Impact Assessment Review, In Press, Corrected Proof. DOI: 10.1016/j.eiar.2010.06.002

P a g e | 57
15.00 Jonathan Finch – (Centre for Ecology and Hydrology)
Biomass energy and watershed management - considerations for dedicated energy
plantations and biomass from natural forests
This presentation focused on (i) a general introduction to the hydrological effects of biomass energy plantations and / or natural forest (ii) specific case studies of how the use of biomass energy has affected hydrological services (iii) monitoring techniques that might be used to evaluate impacts (iv) conclusions on the components of a research framework that might be necessary to promote a transition towards biomass energy that reduces poverty and detrimental impacts on ecosystem services. The Issues
• Water quantity – how is the water balance of a catchment changed with consequences for resources and hazards?
• Water quality – e.g. fate of agri-chemicals, soil erosion • Water is a directional ecosystem service – the impacts do not necessarily coincide spatially with
the production

P a g e | 58
Vegetation Water Use
Constraints on Evaporation
Climate Vegetation type Evaporation constraint
wet temperate tall air turbulence
short plant physiology and sunshine
dry temperate tall plant physiology and sunshine
short plant physiology and soil water availability
dry tropical tall soil water availability
short soil water availability
wet tropical tall rainfall intensity and sunshine
short sunshine
Water Use of Forestry There is a sizeable body of literature on the impact of forests on water quantity:
• Forestry almost inevitably leads to higher annual evaporation losses. • There is no evidence that forests “attract” rainfall. • Forests are more likely to decrease dry weather flows than increase them. • Forests’ ability to moderate floods is much less than often claimed – small storm magnitudes
and limited catchment sizes. Water Use of Biomass Crops
• The majority of studies come from the USA and Europe. • The focus has been on short rotation coppice and “energy grasses”, e.g. Miscanthus and
switchgrass • A limit to some of the research has been that they quantify the water use only during the
growing season – hydrologists need the annual budget. • The results suggest that the annual water use of biomass crops is higher than conventional
crops but lower than forestry. • It is difficult to directly compare the results from measurements studies – models allow us to do
this.
P a g e | 59
Water Quality – Soil Erosion • Natural forests tend to have lower erosion than agricultural and pasture. • Managed forests – poor practices can result in high erosion rates, e.g. clear fell, roads, drainage
ditches etc. • Perennial biomass crops might be expected to act like managed forests, but there are very few
studies. • It is difficult to scale up from the plot to the catchment – barriers and pathways
Water Quality – Agricultural chemicals
• Managed forests do not usually have agri-chemicals applied • Perennial crops generally have a low requirement – herbicides sometimes applied during crop
establishment, low rates of fertiliser applications. • Limited research in the literature. • Agri-chemicals normally breakdown in the top few metres of the soil, but the rainfall regime is
important. • Further changes occur during transportation to water bodies – dilution and dispersion.
Impact of Land Use Change
• Very dependant on what replaces what and what the climate is. – e.g. a higher evaporation loss might be desirable, Australian wheat belt
• Also the baseline selected for deciding whether a change is beneficial or detrimental. • Heterogeneity of the landscape is challenging. • Models exist that can be used but major research issues are spatial scales and quantifying the
uncertainties. Impact of Processing the Biomass
• Comparatively little information except for biofuels. • Industrial scale processing could have a significant impact but it will be dependant on a variety
of factors, e.g. scale, efficiency, handling of raw materials. • Water quality may be more important than water quantity – effect of waste effluent.
15.30 Tea

P a g e | 60
16.00 Richard Tipper (Ecometrica)
Importance of remote sensing and ground based surveys in the design, implementation
and monitoring of biomass energy projects and carbon
This presentation focused on (i) an introduction to GIS remote sensing and ground based surveys for biomass assessments (ii) guidance on building local capacity to monitor relevant quantitative aspects of biomass (iii) suggestions on how biomass energy might (or might not) be able to capitalise on the carbon markets and (iv) conclusions on the components of a research framework that might be necessary to promote a transition towards biomass energy that reduces poverty and detrimental impacts on ecosystem services. Where is intervention required / worthwhile?
• In most rural areas of developing countries, biomass in form of wood is the default / mainstream form of heating and cooking energy.
• There may be a case for intervention in technologies such as improved stoves for health and social welfare.
• But from resource management perspective, communities and families are able to organise adequately and there may be no substantive requirement for formal / expensive monitoring and control systems.
• Don’t think of traditional bioenergy in terms of projects. So, where and when are more formal (technical) monitoring systems appropriate? Biomass constraints and resource problems tend to occur where urban demand for charcoal and woodfuel exceeds sustainable production capacity over a wide area. Cities, large towns, industrial plants, traditional energy intensive industries (e.g. fish smoking, tobacco curing). Intervention may also be required in context of 3 Cs
• Climate – climate change affecting biomass production or causing change in demand (migration)
• Capital – changes in local economic system, investment, new demands • Conflict – migration, reduced access to resources
What is context of Using RS and Ground-based measurement?
• Regional assessments of potential • Project level feasibility / investment studies • Project due diligence, IEA • Monitoring
• On-going monitoring • Controls
What are the characteristics of useful monitoring systems?
• Must be needed • Need must be widely accepted • Must be part of a system responding to signals through controls or other actions • Response could include increased production as well as constraining consumption • Response could also include improved use efficiency

P a g e | 61
Key Challenges for measurement and monitoring systems Commercial systems
• Must be linked to investment and formal controls Traditional bioenergy
• Legitimacy and effectiveness of controls (corruption) • Local dependence on licence revenues promote unsustainable use • Difficult to change / improve informal systems
Technical Monitoring Issues
• Affordability • Resolution • Timeliness (repeat cycle; processing time; distribution time) • Spectral coverage • Linkage with ground based data • Cross-reference with other info (ownership, licences.....)
Choosing optical RS data requires trade-offs
• Spatial resolution o pixel size
• Spatial coverage o scene size
• Repeat frequency o satellite orbit o continuous/specified acquisition
• Spectral resolution
o width of bands o no. of bands
• Signal-to-noise ratio • Sensor characteristics • Conditions (ground, atm.) • Cost
Higher resolution images show more detail LANDSAT 30m> Aster 15m e.g. sharper edges, forest canopy structure >
LANDSAT 30m> Ikonos 1m e.g. individual trees>
... and cost more!
e.g.
• Landsat (30 m) £0/km2 (1978)
• Aster (15 m) ~ £0.02 /km2 (2000)
• SPOT 5 (5 m) ~ £0.65 /km2 (2002)
• Ikonos (1 m) ~ £15 /km2 (2000)

P a g e | 62
Applications of RS to bioenergy / biofuels
• Identification and mapping of ecosystems in and around potential biofuel production areas
• Definition of historic land use and ecosystem change prior to any biofuel feedstock production
• Planning of ecosystem conservation, restoration and management within and around
production areas
• Monitoring of changes to productive and natural ecosystems
Monitoring change in vegetation / biomass resources
This can be achieved by:
• Acquiring RS data at frequent intervals during the project period (LC classification)
• Combine field data from permanent monitoring plots with this RS data (e.g. to show
increase in biomass/biodiversity)
Example: LUC from sugarcane
Multi-temporal Landsat data to monitor the encroachment of sugarcane on the Budongo forest
reserve, Uganda

P a g e | 63
Proposed Technologies to Test
• Participatory, web based monitoring (mobiles - licences)
• Auto download RS data (found to be effective at reducing activity in Brazil)
• Example: www.biocarbontracker.com
BioCarbon Tracker
Carbon / Biomass Markets
• Still immature, and uncertain beyond 2012
• May be linkages to Renewable Energy Directive via supply chain requirements, but these will be
for specific locations in vicinity of export biomass areas.

P a g e | 64
16.30 Wendolin Aubrey (Bioclimate Research and Development)
Community biomass energy project development
Providing (i) an introduction to necessary steps in the development of community access to energy (ii) processes of developing community capacity to assess different energy options - including biomass (iii) useful frameworks to develop biomass energy pilot projects and (iv) conclusions on the components of a research framework that might be necessary to promote a transition towards biomass energy that reduces poverty and detrimental impacts on ecosystem services. Community engagement
• BioClimate • Community context • Appropriate project? • Project development framework • Transition to bioenergy
Community-driven land management and sustainable bioenergy projects Senegal
• Efficient cookstoves • Afforestation & reforestation, agroforestry, avoided deforestation
Nepal • Fuel efficient cookstoves • Afforestation & reforestation, agroforestry
Cameroon • Methane capture, solar cookers, solar lamps • Avoided deforestation, agroforestry, sustainable agriculture
Uganda • Woodlots
Community context – What is the context with respect to community, livelihoods and resource use
• Poverty, labour • Land ownership, tenure, resource use rights • Culture and structure of community • Natural resource use • Partnerships • Markets • Energy access
• Resources • Uses • Needs
Opportunities
• People involved (actors in input-production-output chain) • Access to finance, credit • Women, ethnic groups

P a g e | 65
Constraints • Technology • Market access • Input supply • Finance • Policy • Management and organisation • Infrastructure – transport • Large-firm competition • Social, cultural, legal constraints
Community context – How to gather information
• Key informant interviews • Focus groups • Workshops • Surveys
How do you know if it is an appropriate project?
• Community capacity
• What can the community run? • Organisation – collaboration between market supply & demand sides • Labour – poverty, time, women • Maintenance • Technical skills • Ranking bioenergy technologies • Attractiveness matrix, weighted ranking
o Criteria o Relative importance of criteria
Energy market map
Project development framework Participation & capacity strengthening Do pilot project Follow implementation steps Record, maintain, adapt

P a g e | 66
1) Assess and scope out project idea – work with people who understand the communities • Identify project opportunity, landscape, potential areas of working • Carry out community & local stakeholder consultations, field & other research into: • Ecological aspects • Landscape, land use, livelihoods • Social & community aspects • Policy, legal, institutional aspects • Participation aspects • Assess risks & challenges of introducing a bioenergy project and the implications for project
design and implementation approach • Select pilot sites and communities • Describe project idea
2) Initial preparation and planning
• Define & set up project governance & management structure • Assess & create plan to strengthen implementation capacity of coordinating organisation • Draw up overarching project implementation plan & budget • Obtain funding for project development • Develop framework for monitoring, reporting & evaluation of programme progress and
outcomes 3) Official engagement and support building
• Establish contact with relevant officials, structures & stakeholders to explain & gain support for the project
• Work to align institutional arrangements (e.g. land management rights) & project requirements • Define opportunities (information sharing, training) & methods of working, build institutional
partnerships 4) Community engagement & project design
• Facilitate community consultations to raise awareness and build support for project activities • Identify, appoint, train & support workers • Conduct socioeconomic surveys at project sites • Define project activities & target land areas at each site (waste, existing sustainable resources,
bioenergy crops) • Develop & implement community capacity building programme • Identify and/or gear up community nurseries (bioenergy crops) for programme activities • Write project manual
5) Technical development
• Land management – sustainable ecosystem services • Bioenergy – application of technology • Draw up technical development plan with steps to address data gaps and meet support needs • If applicable - Ensure site boundaries and land use & land cover (LULC) types are accurately
mapped • Finalise GIS maps of target areas for project interventions • Train & do any required biomass (and biodiversity/other) surveys with communities • If applicable - Define methods and quantify carbon stocks at project start point • Determine project baselines for each project intervention

P a g e | 67
• Assess risks to durability of project carbon benefits & determine risk buffer • Consult communities & write up management plans for each project activity • Write up technical manual/guide for each project activity
6) Develop monitoring system and payment mechanisms
• Develop monitoring system with payment agreements • Establish community monitoring teams, provide training & support • Establish mechanism for managing payments • Agree community governance arrangements for the management of payments • Develop project database for managing technical, monitoring & payment data • Decide how initial funding will be used across sites & activities • Agree approach for staging payments for each programme activity at each site • Prepare community contracts linking activities & outcomes
7) Start project activities, monitor, improve
• Agree schedule for implementation of management (activity) plans • Communities initiate project activities a per implementation plan • Implement monitoring system for project activities • Make initial round of service payments • Assess & improve monitoring systems • Adapt project as required
Transition to bioenergy Understand community
• Involve community – cooperation and partnership
Project is community driven
• Learning by doing Community projects succeed when…
• When projects are developed in a participatory and inclusive way • When projects start within their means and grow within their means • When things are made as simple as possible • Where communities are given the means and support to succeed • When communities take responsibility and see benefits • When the national government and policy are supportive • When the coordinator is strong and capable • When there is transfer of skills and increased self reliance • Where the technology works & is appropriate for the community
Partnerships Central role of the coordinator
• Implementation leader - programme champion and problem solver • Drives consultation, engagement, facilitation, partnership building • Must have a strong relationship with all key participants

P a g e | 68
• Responsible for drawing together key components, management, organisation • Technical • Administrative • Social

P a g e | 69
17.00
Plenary discussion on interesting facts, approaches and gaps highlighted by review panels
The review panels comments on each presentation (and some discussion points arising are captured in the table below:
PRESENTATION FACTS TO EMPHASISE APPROACHES TO USE GAPS TO ADDRESS
IIED
Scale of biomass use remarkable
50 year time horizon. Subsistence commercial
Ecosystem services/sustainability: how to put biomass into this area/terminology
Land tenure as a key issue
Demand side research building on political economy
Transition to sustainable
supply in contexts of
poor tenure security
Rothamstead Research
Global scale: Lots of research available (Domburg et
al. 2010) on bioenergy supply
Global biomass potential use is high:
Global biomass used (38% of possible) Least used in Latin America and Middle East
Focus on: “Abandoned land” “Marginal land” (Africa, South America) ~ 700 million ha could be used
Impact assessment bioenergy on climate change “energy balance” (research), carbon sequestration
Land use, land resource mapping is interesting
“Global assessment”: overview, principles, impact assessment
Supply chain analysis: inventories, zoning, water/energy balance modeling, multipurpose production systems
Yield map: miscanthus; water availability vs. yield potential; constraints ( [i] cities, moors etc. [ii] grassland, tourism); farmer perceptions (economic gain) Where to grow + multiple applications (GHG/economic/producers)
Standardised measurements
Analysis of abandoned lands/marginal lands
Different types of bioenergy ESS linkages
Need to get beyond “Food + Fuel”
To what extent should we accept “Natural” plantations?”
To what extent should we do planning vs. evolution
Who grows what and why is a key question
Prospects for boosting fertility?
Interaction with local climate versus global climate

P a g e | 70
PRESENTATION FACTS TO EMPHASISE APPROACHES TO USE GAPS TO ADDRESS
The Energy and Resources
Institute, India
Carbon credits available for cookstove use
India energy consumption expected to rise 3-4 times current levels in next 25 years
Inefficient electricity transmission in remote areas
IAP issues with 85% rural 24% urban mud stove use
Biomass competitive with fossil fuels for energy
Employment impacts not understood at present
Intrahousehold energy mix (biomass, electricity, etc.)
How do we improve biomass use (technology development)
Household energy choices
Public-Private partnerships in biomass production
Identify households that are using different sources of energy (poor, gender, landless, etc.)
Work out appropriate incentive structures for use and production of biomass
In terms of efficiency: what are the optimum scales for energy production/ distribution -grid, local but centralised, household
How to engage the feedstock producers
Definition of available land need care
Practical Action, Kenya Energy from charcoal, 90% use in rural households and 82% use in urban households
Only 43% of this from sustainable sources
Choice due to low price
Energy – driver of deforestation – proximity to population centres Ecosystem service links strong
Policy frameworks for sustainability exist but need to be implemented
Source of finance – carbon markets might be one option
Community enterprise versus impacts of largescale-e.g. tea
Reduce resource need through efficiency
Ownership + responsibility for stakeholders
Approach and methodology for macro/micro level data collection/collation (use of state of the art) – Compare with creation of Biomass Res. Atlas
Approach and methodology to calculate cost of energy (eff. biomass usage) – Compare to India
Policy support for attracting private sector investments
Technology – end use – cost/economics – mapping
Upscaling of biogas/cookstoves
Value chain and delivery models
Monoculture propagation – pros and cons
Both economic and ecological maximum sustainable production for each source of bioenergy – if biomass is going to be competitive with other energy sources/alternatives
Need to address the negative impacts of afforestation/re-forestation as well: water cycle,
hydrological services of forest
what type of forest to plant?
potential to be part of REDD++
Too much emphasis on supply side. How about demand?

P a g e | 71
PRESENTATION FACTS TO EMPHASISE APPROACHES TO USE GAPS TO ADDRESS
University of Malawi
97% of primary energy supply from biomass
98% of household energy from biomass
Urban/Rural divide:
Supply side employment charcoal making species disappear over time (Kambewa, 2007)
Policy: use of sustainable biomass and alternate fuels
Lack of legitimacy in charcoal
Gender issues/equity/access issue
Energy by sector and fuel type – assessing demand for population against other available sources
Biomass distribution (by admin. region): differentiation between regions (southern deficit)
Survey about people useful figures for socioeconomic conditions in determining “sustainability” principles
Ecosystem services: preferred species changes in dominant spp. “dynamics and flow of watersheds”
Excellent statistical base.
Think of poverty as more than income/ energy security/ social resilience, etc.
Positive pilot projects
Political resistance to implementing pilots
Efficient stove work?
Practical Action
PISCES whole chain approach useful
Energy-dependent services analysis good
Electricity (power) – fuel – machine – how about mobility (transport fuel?)
Bioenergy: low income, cooling-heating-manufacturing health hazard, environmental damage, time consumption
Waste/resources vs. fuel opportunity
Technology to improve energy access and livelihood is key
Balance of forest: ecosystem services | managed forests | technology introduction in resource provision and energy efficiency | alternative fuels (LPG, BG)
Value chain analysis well developed i.e. actors, supporting actors and enabling environment
Poverty approaches/methodologies
Sustainable forest management (of existing forests and managed wood lots) for resource use +
Tree planting: native species, timber + fuelwood
Where deforestation + degradation is driven by unsustainable wood harvesting, any alternative bioenergy will help to reduce this pressure
Current information about bioenergy use check local applicability
Rural Urban
Firewood 91 9
Charcoal 27 73

P a g e | 72
PRESENTATION FACTS TO EMPHASISE APPROACHES TO USE GAPS TO ADDRESS
University of East Anglia
Millennium Assessment – people orientated. Leads to Ecosystem Services – a classification in terms of “managing” – dominantly trade offs
EIA – refers to agricultural + forestry but in reality is limited to large projects Mismatch between impacts studied and those which are significant Project scale too small for land use change impacts
Sustainability appraisal - stakeholder driven – so aspirations objectives that need indicators - but lots of objectives indicators – so need to reduce - Role of stakeholders critical e.g. recommending exclusion
Sustainability Appraisal seems a
useful method : pluralist
Appraisal – aspirations (20-30) /
indicators (x3)
To what extent do we need to
zone our work and how? E.g.
population density in Malawi
Assessment of vulnerability of ecosystem and its services to climate change
Sustainable livelihood approach
Centre for Ecology and
Hydrology
Water is a directional ecosystem service
Things will change in rainfall in 50 years
Soil – must integrate water and carbon
Forests don’t attract/produce rainfall
Natural forests lower erosion (roots + leaves protect)
Miscanthus is nitrogen fixing. Helps fertility
Right plantations for right conditions
Limited research thematically and geographically
Studies: different locations/methods. Difficult to compare
Numerical models can be used instead for comparison
Challenges: spatial scales; quantifying uncertainties; specific to researchers
Moving to next generation sharing of tools
Hydrology component has to depend on focus determined by ESPA team
Water use for crops outside Europe/USA – validity of existing models?
Understanding of catchment scale processes (e.g. soil erosion)
Agreement on targets needed – what level are we seeking against indicators?

P a g e | 73
PRESENTATION FACTS TO EMPHASISE APPROACHES TO USE GAPS TO ADDRESS
Ecometrica
Monitoring vs. modeling (quantifying from measurement) – remote sensing and ground-based methods.
Identifying areas (e.g. around urban areas, industrial/ traditional energy intensive)
Contexts: commercial biofuel/bioenergy; traditional bioenergy Scale concept
Useful monitoring tactics – must be needed, accepted and with prospects for change to be made
Technical monitoring – affordability, resolution, timeliness (change over time) link with ground-based data
Understanding trade-offs: relating to technological aspects; resolution based on different GS systems
Simpler techniques to do monitoring/ assessment should be developed. Advantages: - Reduces transaction cost; hence, more benefit transferred to the rural poor (through REDD); - Employment generation; therefore tackle poverty.
Remote sensing can be used to measure forest degradation
Not modeling related? Acceptance? usefulness/cost? not academic
Resolution / costs £ 0.02/km
2 £ 15/km
2
15 day cycle
Query on a series of RS data. RED monitor request/obligation
BioClimate Research &
Development
Community based vs. community involved?
Different levels: community | town/city | industry/region
Need to work out how to carry out assessment efficiently
Understanding the community context What? How: workshops, surveys, interviews…
Framework: Livelihood/resources | Opportunities | Constraints
Do we follow a project development approach (community-based) or focus on a more entrepreneurial approach?
Need to explicitly indicate strengths and weaknesses for a project (community livelihoods – resource use),
Stakeholder analysis to identify potential facilitators and constraining persons
Ranking bioenergy technologies: weighed ranking by wealth group, gender
Food security assessment and income to be measured simultaneously
Need to develop an action plan with the community
17.30 Close
P a g e | 74
Day 2: Wednesday 20 October 2010
9.00 Duncan Macqueen (IIED)
Problem tree analysis to develop indicators of success
The consortium divided into two groups – each working to define more clearly the underlying causes of two key problems (i) biomass energy is contributing sub-optimally to poverty reduction and (ii) biomass energy is contributing sub-optimally to ecosystem service provision. The former group deliberately explored a broad understanding of the elements of poverty to include (e.g.): basic needs, security, social networks, decent work, ecological integrity and cultural identity. The latter group deliberately explored why current biomass use is suboptimal for supporting ecosystem services (nutrient cycling, soil formation), provisioning ecosystem services (biodiversity and the agricultural production of food and fibre materials and water availability), regulating ecosystem services (carbon emission regulation, hydrological cycles, erosion control, pollination, pests and diseases) and cultural ecosystem services (recreation and tourism, aesthetic values, religious values, national identity and self-sufficiency).

P a g e | 75
12.00
Feedback from two groups of the causal problems and discussion of interaction between the two
Diminishing
Resource
Uneven
benefit sharing
Insecurity, inequity
and non-
availability of land
(Tenure and
ownership)
Poor Resource
Management
Technology
inefficiencyWeak supply
chain
Limited
Capacity
Weak
Community
organisation
Weak Regulatory
and implementation
Framework
Limited Access to
improved
technology
Labour
intensity
drudgery
Gender
Inequality
Corruption Limited access to
credit
Limited sector
specific
incentives
Limited affordable
technologies
available
Poor
infrastructure
321a
Research Advocacy on
inadequate policies/
corruption and impacts
1b
Bioenergy resource mapping,
monitoring and planning
Technical and economic potential of improved technologies.
South South technology transfer. Participatory Market System
Development (Gendered). Pilot with communities and other
actors.
Methodologies for understanding
communities/requirements
Biomass Energy is Contributing Sub-
Optimally to Poverty Reduction

P a g e | 76
13.00 Lunch

P a g e | 77
14.00
Theory of change methodology to develop conceptual framework
The consortium will again work in two groups (but this time divided into regional India and Kenya/Malawi teams) to discuss (i) what is the desirable change we want to see the project bring about and why?; (ii) how are we going to bring about those changes (what evidence, policies and institutions need to be influenced to make that desirable change happen in India, Kenya and Malawi or more broadly?); (iii) who needs to do what to make that happen? (e.g. research, demonstration projects, communication, advocacy) .
16.30
Feedback from the two groups followed by discussion of the best and most questionable
bits of both frameworks
Summary tables from India and Kenya / Malawi on subsequent pages.

P a g e | 78
STRATEGIC
ISSUE
PROBLEM
“Biomass
energy is
contributing
sub-
optimally to
poverty
reduction
and to the
provision of
ES”
Desired Changes
Integrated bio-energy policy (excluding but
complementary to biofuel policy)
Business/delivery models orientated towards the poor
(BPL)
Widespread adoption of efficient/ less emitting
technologies (households, enterprises, institutions,
communities and micro-enterprises) by BPL
Spread of better forest/NR management and expansion
practice (that optimizes ES)
Efficient management of biomass resources (including
forests) for delivery of ES (including carbon)
Poverty reduction (reduced drudgery, inequality, gender
imbalance, insecurity, health problems etc)
How are we going to make those changes? Bio-cultural diversity (?)
Bioenergy policy:
o Review policies
o Organize workshops
o Sensitize policy makers
o Contribute to draft bioenergy policy
Business/delivery models
o Review existing models
o Prepare toolkit/ guidance
o Pilot test including ES
o Engaging with finance entrepreneurs etc
Technology adoption
o Community/end user preferences
o Benchmarks: emission/pollution protocols & climate
o Economics/costs comparisons: stoves, kilns, gasifiers,
fuel supply etc
Better resource management:
o Survey review existing macro-geographical/ zoning data
o Select pilot districts
o Develop pro-poor appraisal of aspirations for ES
Outreach/ comms:
o Establish national advisory committee, south-south
exchange, guidance modules, M&E
Why have we selected those changes?
Impacting 80% of rural poor: 27% of total are BPL
Huge implication on gender equity (women and children)
Change highlighted by problem analysis: diminishing resources(ES)/
inefficient use, unequal benefit sharing
Scaling issues: widespread relevance
Biomass energy neglected and isolated
Achievable: precedents in existing policies
Diminishing access to ES
Why have we chosen these strategies/tactics?
Emerging policy direction to build on. E.g. new initiative for cookstoves
Evidence of encouragement of private sector and PPP models. Builds
on existing knowledge
Building on current benchmarking – to include cost economics –
poverty
Builds on proven methodologies and documents. E.g. biomass
resources ATLAS/ sustainability appraisal
Relevance from local to global scale
What’s the consortium’s role in bringing these changes? [TERI] policy analysis: support from IIED, partner, ICEP
[TERI] PA: business models
[TERI] Imperial Porter Alliance: technology
[TERI] Ecometrica (survey):
IIED
Who else do we need to engage to make these tactics work? Min. of new and renewable energy; Min. of env. And forests
Financials& EG; State Bank of India;
Local NGOs; manufacturers; local communities (BPL); Panchayats
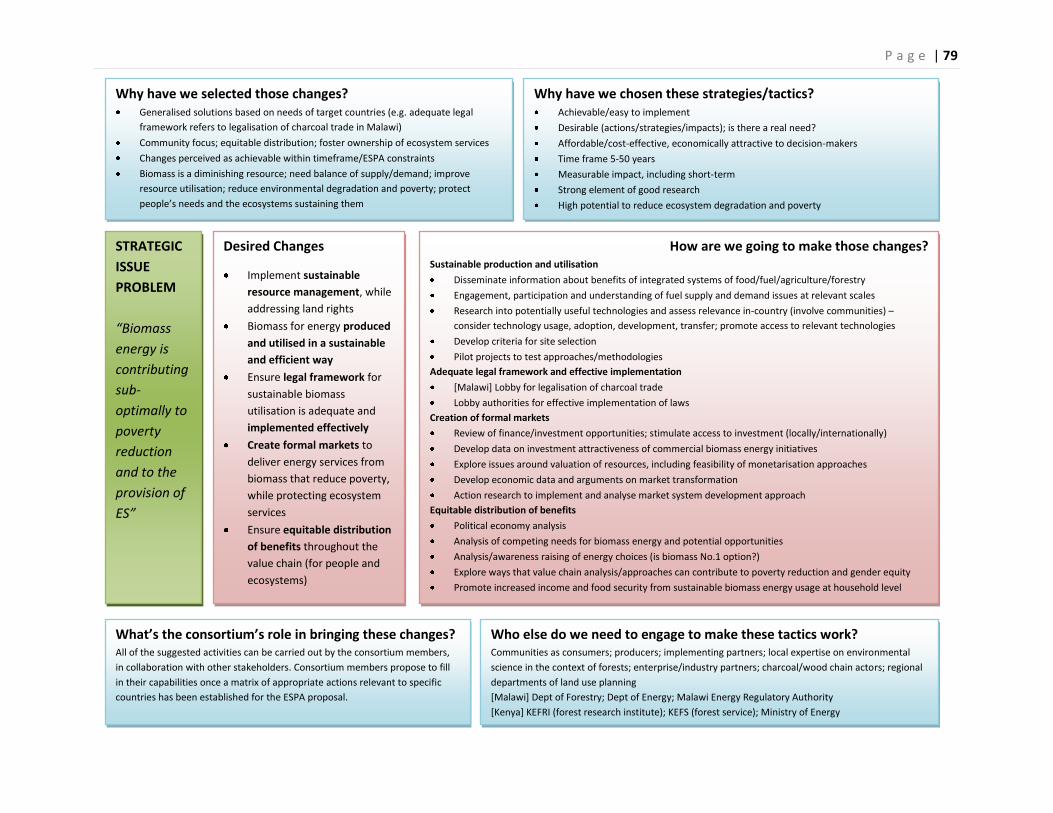
P a g e | 79
STRATEGIC
ISSUE
PROBLEM
“Biomass
energy is
contributing
sub-
optimally to
poverty
reduction
and to the
provision of
ES”
Desired Changes
Implement sustainable
resource management, while
addressing land rights
Biomass for energy produced
and utilised in a sustainable
and efficient way
Ensure legal framework for
sustainable biomass
utilisation is adequate and
implemented effectively
Create formal markets to
deliver energy services from
biomass that reduce poverty,
while protecting ecosystem
services
Ensure equitable distribution
of benefits throughout the
value chain (for people and
ecosystems)
How are we going to make those changes? Sustainable production and utilisation
Disseminate information about benefits of integrated systems of food/fuel/agriculture/forestry
Engagement, participation and understanding of fuel supply and demand issues at relevant scales
Research into potentially useful technologies and assess relevance in-country (involve communities) –
consider technology usage, adoption, development, transfer; promote access to relevant technologies
Develop criteria for site selection
Pilot projects to test approaches/methodologies
Adequate legal framework and effective implementation
[Malawi] Lobby for legalisation of charcoal trade
Lobby authorities for effective implementation of laws
Creation of formal markets
Review of finance/investment opportunities; stimulate access to investment (locally/internationally)
Develop data on investment attractiveness of commercial biomass energy initiatives
Explore issues around valuation of resources, including feasibility of monetarisation approaches
Develop economic data and arguments on market transformation
Action research to implement and analyse market system development approach
Equitable distribution of benefits
Political economy analysis
Analysis of competing needs for biomass energy and potential opportunities
Analysis/awareness raising of energy choices (is biomass No.1 option?)
Explore ways that value chain analysis/approaches can contribute to poverty reduction and gender equity
Promote increased income and food security from sustainable biomass energy usage at household level
Why have we selected those changes? Generalised solutions based on needs of target countries (e.g. adequate legal
framework refers to legalisation of charcoal trade in Malawi)
Community focus; equitable distribution; foster ownership of ecosystem services
Changes perceived as achievable within timeframe/ESPA constraints
Biomass is a diminishing resource; need balance of supply/demand; improve
resource utilisation; reduce environmental degradation and poverty; protect
people’s needs and the ecosystems sustaining them
Why have we chosen these strategies/tactics? Achievable/easy to implement
Desirable (actions/strategies/impacts); is there a real need?
Affordable/cost-effective, economically attractive to decision-makers
Time frame 5-50 years
Measurable impact, including short-term
Strong element of good research
High potential to reduce ecosystem degradation and poverty
What’s the consortium’s role in bringing these changes? All of the suggested activities can be carried out by the consortium members,
in collaboration with other stakeholders. Consortium members propose to fill
in their capabilities once a matrix of appropriate actions relevant to specific
countries has been established for the ESPA proposal.
Who else do we need to engage to make these tactics work? Communities as consumers; producers; implementing partners; local expertise on environmental
science in the context of forests; enterprise/industry partners; charcoal/wood chain actors; regional
departments of land use planning
[Malawi] Dept of Forestry; Dept of Energy; Malawi Energy Regulatory Authority
[Kenya] KEFRI (forest research institute); KEFS (forest service); Ministry of Energy

P a g e | 80
Day 3: Thursday 21 October 2010
9.00 Duncan Macqueen (IIED)
Communication and impact planning
The consortium divided into two groups by country to conduct a Peapod impact pathway analysis. The PEAPOD acronym was developed to provide a helpful way of thinking through how specifically to engage critical audiences in order to achieve the desired changes highlighted above. The acronym is spelled out below:
People targeted
Engagement strategy
Attention grabber
Process required
Objectively verifiable indicators of success
Deadlines – what has to happen when?
12.00
Feedback from two groups of the impact plan analysis and discussion of best and most
questionable features of each

P a g e | 81
PEAPOD Africa
People Engagement Attention Grabber Process of Delivery Objectively verifiable
indicators
Deadlines
National
State Actors
Min of Envt,
forest and
wildlife
Personal Contacts
Forest learning group
(Malawi)
Stakeholder
Workshops
Proposal stage
Filling implementation
gaps
Evidence base
developed
Ecosystem services
value – contribution to
poverty reduction
Policy Briefs/ press
releases
Reports
Websites
Media
National
events/activities
International events
Policy change
ESPA tools integrated
in policy/decision
making
Ecosystem accounting
system
Project
end
M of Energy
M of Land
M of Local Govt
M of Water
M of Co-op
Development
M of Trade
M o economic
Planning
Local State
Actors
Provincial level
District level
Village level
Research
Institutes
KEFRI PhD scholarships
Publications
North-South Linkages
Proposal/Implement
Resources, skills,
expertise,
collaboration,
scholarship
Process delivery
partnerships/
collaboration
working
Scholarships
International
conference
3 PhDs completed on
ESS
ESS integrated in
curriculum at Univs
Bioenergy ESS
monitoring system
integrated within
KEFS
MIRTDC
Bureau of
standards
Unis
ACTS

P a g e | 82
Membership of
learned societies
national actors
NGO/ civil
society
WAFC Personal contacts
FGLG
Stakeholder
Workshops
Proposal stage
Valuation of ES is first
step towards bringing
financing via COP
process
Management skills
Training sessions
Technical briefs
Reports/policy briefs
CURE
Greenbelt
Movement
Donors GTZ/EU Donor co-ordination
committee
Proposal stage
Better basis/evidence
for informed
intervention
Case Studies
Impact assessments
Private
Actors
Kakuzi Chamber of
commerce
Implementation stage
Economic opportunities
from ESS
Technology Access
Participatory market
mapping/
development
Technology fair,
forest-based
enterprises fair
Small holder
farmers
Community
Actors
District
Associations
FGDs
During the project
Opportunities for
income generation
Control of local
resources
EU visibility
Community
meetings/
marketplaces
FGDs
Rural/Urban
communities
Consumer
Assoc
CFGs

P a g e | 83
PEAPOD India
People Engagement Attention Grabber Process of delivery Objectively verifiable indicators
Deadlines
Who to contact (Category)
Who to contact (Specific)
How they will be involved
Research process and communication
Measure success When they will be involved
Policy Government Agencies & Officials
Form national level advisory committee to involve national level
India can take a lead position in biomass transition. Evidence of integrated approach biomass energy with poverty alleviation & ecosystem services. Briefing of biomass energy at the global level and increasing dependence, and tailor it to show how India is a technological leader in biomass development.
Bioenergy policy review and formalization. Review documentation to feed into existing policy framework for bioenergy (bioenergy, ecosystem services poverty alleviation).
Participation in advisory meetings, stakeholder workshops, dovetails with ongoing initiatives, signs that ideas from work are included in policies. Recommendations and guiding tools incorporated into ongoing government initiatives. Sensitizing and recognizing issues.
Inception of project
Federal
–Planning commission
Stakeholder workshop at inception stage of project
Initiative opens avenue to get into global biomass technology transfer & global climate change related to biomass energy.
Inception & formal launch
–Ministry of environment and forest, (MOEF)
NAPCC, national action plan on climate change. Aiming for carbon sequestration as well as emission reductions.
Inception, continuous, review & monitoring meetings (6 months)

P a g e | 84
–Ministry of new and renewable energy (MNRE)
Green economy coalition (IIED). Thinking globally about energy provision, environmental NGOs, community groups, companies. Relevant to this work.
–Ministry of rural development (MoRD)
State government – Uttaranchal, Orissa, Jharkhand, Kerala, Rajasthan, Uttar Pradesh State government – Uttaranchal, Orissa, Jharkhand, Kerala, Rajasthan, Uttar Pradesh
Planning commission – Mr Chaturvedi Secretary to gov’t of India – Dr Vibha Puri das District forest officers
Stakeholder workshop at inception stage of project
Connect to similar initiatives within the state. Bring value to ongoing & potential initiatives (e.g. Karala total energy security mission)
Research Institutions
–Indian Institute of Technology, New Delhi –Indian Institute of Science,
Stakeholder workshop at inception stage of project
Exposure to consortium. International publications to open new frontiers for research. Issue on biomass energy (International Forestry Review)
Publications about better resource management.
Journal articles published
Inception, continuous, review & monitoring meetings (6 months)

P a g e | 85
Bangalore –Pantnagar University, Uttaranchal
Experts
Prof Ravindranath, IISC
Prof Rajendra Prasad, IIT
Networks
–GNESD (Global network of energy for sustainable development) –REEEP (Renewable energy and energy efficiency programme) –GVEP (Global village electrification programme)
Stakeholder workshop at inception stage of project
Information exchange platform. Make new information available to help networks.
Continuous updating on information
Information transferred
Inception, continuous, review & monitoring meetings (6 months)
Donors
–SDC (Swiss development corporation)
Stakeholder workshop at inception stage of project Review of what donors are spending on renewable energy. Reviewing forest and climate type
Potential collaboration to expand their mandate and get better outcomes for projects.
Continuous updating on information
Awareness raised, potentially funding secured

P a g e | 86
investment programmes (IIED). Make strategic links.
Private sector technology partners
Stakeholder workshop at inception stage of project
Platform for organized information on potential of bioenergy, tools and methodologies for implementing initiatives. Opportunity for development of value chains.
Business delivery models.
Uptake of tools, approaches, business models. Number of delivery models engaged or impacted. Number of dovetailed pilot projects.
Inception, continuous, review & monitoring meetings (6 months)
Biomass Gassifier –Chanderpur Works Biomass fuel processing) –BS Fuel Improved Cookstoves –Envirofit –First energy –Philips (cook stoves)
TERI could run incubator program in Malawi and Kenya for these developing countries to advance.
Opportunity to incubate and take forward technology in these countries.
Benchmarking of technologies. Guidance of success factors for bioenergy chains. Resource management for ecosystem services. Guidance from all of these can be shared with other groups.
NGOs Centre for Peoples Forestry, Sewa Mandir (Rajasthan) Enviro legal
Stakeholder workshop at inception stage of project
Better understanding and opportunity to work on poverty alleviation and linkage to bioenergy at the local level. Opportunity to benefit from global research on this issue & to be part of bigger network. Capacity building related to local communities and bioenergy.
NGOs involved in assessment for better resource management and widespread technology adoption, contributing to
Involvement Inception, continuous, review & monitoring meetings (6 months)

P a g e | 87
firm poverty alleviation agenda.
Chirag , Myrada (Uttera khand)
Better understanding and capacity building for the linkage between ecosystem services and livelihoods, access to better approaches, methodologies, and tools.
Local community / gov’t
Stakeholder workshop at inception stage of project
Poverty reduction, more control over resources, livelihood enhancement, energy security, better quality of life (health issues).
Directly involved in process of developing appraisal of aspiration of ecosystem services, biomass energy, livelihood activities, technology adoption, business delivery pilots, monitoring, & adaptation of tools/approaches.
Involved in project Inception, continuous, review & monitoring meetings (6 months)
Village head – Panchayats
Geographical sites selected
Gender and minority issues (disaggregation)
Teachers Engage through PRA - identify needs, participatory rural appraisal
Rights to ecosystem services recognized in exchange for sustainable management.

P a g e | 88
Resource persons
Incubate initiatives - encourage entrepreneurship at community level. Biomass processing can be done through local entrepreneur, which much less exploitive of local ecosystem services.
Media
Stakeholder workshop at inception stage of project Electronic & print media, local creative communication groups
Media department of TERI, media department of IIED. Media briefs, conference, continuous communication, short films.
Project in publications / radio / TV / etc.
Inception, continuous, review & monitoring meetings (6 months)
NDTV Continuous engagement
TERI Media Brochure, pamphlets, case studies, press releases
Standards bodies
Check appropriateness of existing standards Mr Pandey (Ex Dg Forests) Prof Ramanthan (UCSD)
Review of relevant policies and standards.
Inception, continuous, review & monitoring meetings (6 months)
Financial institutions
State bank of India
Stake holder workshop
Investment opportunities Business delivery models development, toolkit and guidance includes
Involved in financing businesses
Inception, continuous, review & monitoring meetings (6
P a g e | 89
financial institution.
months)
State bank of Hydrebad
Review biannual
Micro- finance institutions, NABARD

P a g e | 90
14.00
Research prioritization exercise
In order to keep this session live and reduce tension we used a game play ‘auction’ process. The consortium divided into small institutional groups and considered (with a limited imaginary budget) which areas of work they wish to bid for (from those generated on day 2). The aim was to help see which areas of work are broadly felt to be important across the different project partners, which areas of particular interest to particular institutions and which areas are widely considered to be peripheral. Having divided into four teams each with a hypothetical budget to spend of £100 an auction was run in which each team tried to ‘buy’ the research ingredients they felt would be most important for an ESPA consortium on biomass energy. The ingredients were drawn up from discussions at the meeting itself. Where two or more groups had to compete for something they felt to be important the value of that ingredient rose – giving a very rough indication of issues which more than one group felt to be priorities. The research ingredients sold at the following prices:
Community-based ecosystem services and poverty assessment methods (£ 65)
Advocacy / policy work towards formal biomass market development (£ 58)
Research on sustainable biomass harvesting / planting options (£ 43)
Use of geographical information systems and models for biomass energy planning (£ 41)
Technology benchmarking and standards for different biomass technologies (£ 39)
Business / value chain analysis and pilot projects for biomass energy businesses (£ 26)
Economic cost comparisons for different technology options (£ 21)
Communication / media / education work on biomass energy (£ 20)
South-South –North technology transfer and incubation (£ 16)
Policy reviews on biomass energy (£ 10)
15.30 Tea

P a g e | 91
16.00
Institutional responsibilities and capacity strengthening
We will work in plenary to discuss how research can best be designed to (i) meet in-country needs (ii) strengthen in-country capacity (iii) allow comparative analysis between partner country sites for the development of broader recommendations and (iv) meet the exacting quality standards expected by ESPA. A discussion was held about the possible framework for an ESPA biomass energy consortium and the institutional responsibilities within that. The initial draft of that framework was then drafted by IIED – but will be heavily modified pending review by partners: Under the over arching objective of optimizing the contribution of biomass energy to poverty reduction and ecosystem services, this project will target four specific problems with corresponding objectives and work packages: OBJECTIVE 0. Management of a consortium that will deliver excellent science and strong impact in optimizing the contribution of biomass energy to poverty reduction and ecosystem services delivery Comments: Proposal is that the IIED Forest Team lead on this – in close collaboration with the four work-package leads. PROBLEM 1. Overarching problem of poor natural resource governance – that results in confused institutional mandates in which forest departments often have disproportionate control over biomass energy which translates into inadequate incentives to develop a pro-poor sustainable biomass energy industry. DESIRED CHANGE - OBJECTIVE 1. Integrated biomass energy policies in India, Malawi and Kenya (complementary to any biofuel policies) that provide an adequate legal framework for pro-poor sustainable biomass energy production and use CORRESPONDING WORK PACKAGE 1. Application of macro-geographical / land use zoning tools that highlight key issues and opportunities for expected biomass energy expansion in India, Malawi and Kenya used in tandem with rigorous socio-economic policy analysis to involve key decision-makers in policy dialogues and promote or draft reforms that can then be implemented. Comments: Proposal is that Ecometrica will lead on this using their Biocarbon tracker type technology, working with RRes on yield mapping and marginal lands to develop and apply geographical / land-use zoning tools for policy work in key areas of biomass concern in Malawi, Kenya and India. CDM, TERI and PA-Kenya will collaborate and lead on the policy analysis / engagement (including workshops) with IIED helping to synthesize results.

P a g e | 92
PROBLEM 2. Diminishing biomass energy resource that has multiple roots in insecure tenure and resource rights, poor management / restoration practices, inefficient conversion technologies and inequitable value chain development DESIRED CHANGE – OBJECTIVE 2. Spread of more efficient and sustainable production of biomass energy by the poor that optimizes ecosystem services identified by the poor as critical through testing with local entrepreneurs and government authorities in India, Malawi and Kenya CORRESPONDING WORK PACKAGE 2. Gendered participatory perception appraisal to develop an indicators framework for the impact of biomass energy on poverty and ecosystem services at three levels local, national and international levels that is then used as a tool to design and implement pilots for better biomass resource rights, management or plantation practices and institutional support functions that pay attention to stratifications within poor communities with special attention to gender. Comments: Proposal is that UEA will lead on this – developing a version of sustainability appraisal to gauge perception on ecosystem services desired from biomass energy management – at local national and international levels, with CDM, TERI and PA-Kenya helping to set up field work. PROBLEM 3. Uneven benefit distribution within existing biomass energy value chains that has its roots in power relations of largely informal economies, the lack of organization and voice of poor communities and actors in the biomass value chains DESIRED CHANGE - OBJECTIVE 3. Pro-poor formalization of biomass energy business/delivery models in such a way that currently marginalized groups derive a more equitable share of ecosystem service values from specific value chains in India, Kenya and Malawi CORRESPONDING WORK PACKAGE 3. Value chain analysis of a range of pro-poor biomass energy business in India, Kenya and Malawi leading to the development of a widely applicable toolkit / guidance modules on best practice in monetarisation / market development approaches that can be tested in pilots with relevant finance and business support programmes. Comments: Proposal is that Practical Action Consulting will lead on this in collaboration with the IIED energy team to develop / adapt value chain analysis and in collaboration with BCR&D, develop community-based pilots in the three countries with Practical Action Kenya, CDM and TERI. PROBLEM 4. Inefficient conversion and usage of biomass energy leading to damaging health and climate emissions that have their roots in current cultural practices, poor knowledge of and access to cost effective technologies and under developed (poorly incentivized) markets to supply them. DESIRED CHANGE - OBJECTIVE 4. More efficient / less emitting consumption of biomass energy through the widespread adoption of technologies (at household, enterprise and institutional levels) among the poorest groups in India, Kenya and Malawi CORRESPONDING WORK PACKAGE 4. Field analysis of end user preferences that will inform new benchmarking of fuel supply, kiln, stove and gasifier technologies with enhanced economic and

P a g e | 93
emissions comparisons and a programme of communication and appropriate technology transfer within and between India and Africa. Comments: Proposal is that TERI lead on this but with Imperial bringing in the Porter technology alliance and RRes contributing thoughts on decentralized energy planning and CDM and PA-Kenya helping to host country-country technology exchange. PATHWAYS TO IMPACT – IIED will lead on this as part of its management function but with TERI, CDM and PA-Kenya having a greater spend in line with their proximity to actual decision makers.
17.30
Evaluation of the workshop
Participants were invited to rank different workshop components as (i) Excellent – centre green (ii) good – light green (iii) OK - orange and (iv) bad - red on the chart below which summarises what participants thought of how things had gone.
Approach /
facilitation
6
4
8
4
3
3
4
8
8
Usefulness of
content
Degree to which
biomass proposal
designed
Logistics, meeting
space, food


