BIOMASS RESOURCES FOR GASIFICATION POWER PLANT ETSU B/M3/00388/31/REP Contractor Energy For Sustainable Development Ltd Kings College, University of London Prepared by D Hislop Prof D O Hall The work described in this report was carried out under contract as part of the New and Renewable Energy Programme, managed by the Energy Technology Support Unit (ETSU) on behalf of the Department of Trade and Industry. The views and judgements expressed in this report are those of the contractor and do not necessarily reflect those of ETSU or the Department of Trade and Industry. First Published 1996
Transcript
BIOMASS RESOURCES FOR GASIFICATION POWER PLANT
ETSU B/M3/00388/31/REP
Contractor
Energy For Sustainable Development Ltd Kings College, University of London
Prepared by
D Hislop Prof D O Hall
The work described in this report was carried out under contract as part of the New and Renewable Energy Programme, managed by the Energy Technology Support Unit (ETSU) on behalf of the Department of Trade and Industry. The views and judgements expressed in this report are those of the contractor and do not necessarily reflect those of ETSU or the Department of Trade and Industry.
SECTION 1 Current Biomass Resources.............................................................................. 3 1.1 General ................................................................................................................ 3 1.2 The Global Biomass Resource ............................................................................ 3 1.3 Agricultural and Forestry Residues..................................................................... 4
Categories ...................................................................................................... 4 Availability of residues for EfB..................................................................... 5
1.4 Biomass Plantations for Energy. ......................................................................... 6 Introduction ................................................................................................... 6 State of the Art............................................................................................... 7
1.5 The land available for energy plantations ........................................................... 8 Agricultural land............................................................................................ 8 Marginal and degraded land. ......................................................................... 8
1.6 The Global Total ................................................................................................. 9
SECTION 2. Future projections........................................................................................... 13 2.1 Power Demand Forecasts .................................................................................... 13 2.2 Fuel Supply - The Economically Available Supplies of Biomass for EfB ......... 14
The Renewable Intensive Global Energy Scenario ....................................... 14 The Existing Policies Scenario ...................................................................... 16
2.3 Forecasts by Region ............................................................................................ 16 2.4 Plant Sizes for the Residue and Plantation Sectors ............................................. 20 2.5 Penetrating the Market ........................................................................................ 21
APPENDIX 1. DATA .......................................................................................................... 24
APPENDIX 2 THE SHORT TERM MARKET ................................................................... 26 Forecasts for Short-term Growth............................................................................... 27
SUMMARY This report is based on existing secondary information and data sources, and is divided into two sections. Section 1 summarises the properties of biomass, and estimates the biomass resource, under the headings of agricultural and forestry residues, biomass from existing forests, and biomass plantations for energy. Estimates of yields are combined with estimates of the land available for plantations, both agricultural and marginal or degraded lands, to give global estimates of the potential global biomass supply for electricity from biomass (EfB) under favourable conditions. Section 2 provides preliminary estimates of the long term markets for electricity from biomass. Its forecasts of global electricity demand were prepared by the Response Working Group of the Intergovernmental Panel on Climatic Change, and are linked to the group's Accelerated Policies Scenario (APS). The policy characteristics of the APS are listed, and forecasts of electricity production from biomass by region are presented. A longer term forecast, to 2025, is then developed on the basis of an Existing Policies Scenario and the Renewables-Intensive Global Energy Scenario (RIGES) of reference [14]. This is translated into numbers of projects, by fuel type, size and region, for both scenarios. Finally, the changing market structures that will accompany the development of the market are described, and priority long-term markets are indicated on the basis of the following criteria: fuel availability, power shortages, infrastructure and policy framework. In appendix 1 the likely development of the short term market is analysed; a list of short term projects is provided, leading to a forecast of project numbers and regions to the year 2000
SECTION 1 CURRENT BIOMASS RESOURCES
1.1 GENERAL In the present report biomass refers to plant-derived matter, other than fossilised. It includes dedicated agricultural and forest products - eg. fuelwood, sugarcane, rape seed; agricultural and forestry residues; and the products of energy plantations. Table 1 summarises the main physical and chemical properties of the biomass fuels that will generally be used for electricity from biomass.
Density 150 kg/m3 for willow coppice chips to 500 kg/m3 for heavier woods
~820 kg/m3
Moisture content 8-20% (wb) for wheat straw at harvest 30-60% (wb) for wood at harvest
2-12%
Useful energy (GJ/m3)
1-8 ~25
Ash content 0.4-2.0% by weight with high P and K, generally free from toxic and other trace contaminants
1.5-2.0 with low P and K
Sulphur content 0.01-0.1% by weight 0.5-5% by weight
Table 1 shows that in terms of emissions and ash disposal EfB has considerable advantages over coal. However, its much lower useful energy content/m3 has important implications for the size and equipment of biomass fuelled power plant. Because of the high transport costs and dispersed production of biomass, the maximum size of generating plant is likely to be about 50-100 MWe, far smaller than the typical fossil-fuelled plant. However, storage and handling equipment has inevitably to be proportionately larger and more expensive.
1.2 THE GLOBAL BIOMASS RESOURCE Global production of biomass is an estimated 220 billion dry tonnes/year [1], nearly all in the form of natural growth wood and of agricultural and forestry residues. It accounts for about 15% of global energy consumption - 3% in industrialised countries and about 38% in developing countries. In some of the poorest countries, biomass accounts for over 90% of energy consumption (eg Nepal, Rwanda, Tanzania). In this context the development of biomass as a modern fuel might appear an anachronism. However, within living memory wood, sometimes grown specifically for the purpose, has served as the standard fuel for railways; it is used on a large scale to produce charcoal for the Brazilian steel industry; and it was used as a feedstock for methanol in India immediately after the second world war. Indeed, in those industrialised countries with major
3
wood resources biomass accounts for much larger than the average proportion of energy consumption: in Finland and Sweden wood (together with a small amount of peat) account for 18% and 16% respectively. Estimates of the biomass resource which might be available for EfB are necessarily speculative. Agricultural and forestry residues are the fuels most readily available now; local data on residue production, use and availability is often not collected, and what is collected is rarely aggregated and distributed in ways that are useful for the present report. Exceptions are residues from the sugar and paper/pulp industries. In estimating the future wood resource, natural, unexploited forest is ignored, because it is extremely difficult to estimate what degree of utilisation would be sustainable, and because of the dangers of decreasing bio-diversity. Only wood grown specifically as an energy crop is considered. Modern experience of the latter is so limited that there is virtually no productive base on which to estimate potential supply, and the forecasts that follow are based on estimates of suitable land availability and forecasts of yields.
1.3 AGRICULTURAL AND FORESTRY RESIDUES
Categories Straw (and other agricultural residues left in the field or at the farm after the crop is harvested). Usually highly dispersed, with high transport costs if centralised, these residues often have local uses and major non-energy markets (eg fodder, bedding, board manufacture) which reduce their availability as a fuel, and also tend to raise their price to levels at which their use in EfB would not be economic. None-the-less, straw is a potential fuel in countries in which it is in surplus, such as the UK; in Denmark there are already several district heating schemes operating on straw; and in several countries there are plans to co-fire straw with coal. Mill residues produced when the harvested crop is processed at a mill. Examples include rice husk, sawdust and wood off-cuts, bagasse (the cane residue left after extraction of the juice from sugar-cane), ground-nut shell, and coffee husk. They are concentrated in large quantities at a limited number of mills, where they may be an environmental or fire danger. These residues are often already used to provide heat, and sometimes power as well, to the mill, albeit usually with very low efficiency. They are the most immediately available fuel for EfB, whether through upgrading existing energy systems or through the installation of new ones. Forestry residues include the lops and tops left after clear felling; thinnings; wind blow; and premature clear felling.
Availability of residues for EfB In developing countries, rising populations will require increases in food production, and thus of residue production, for some decades to come. In
4
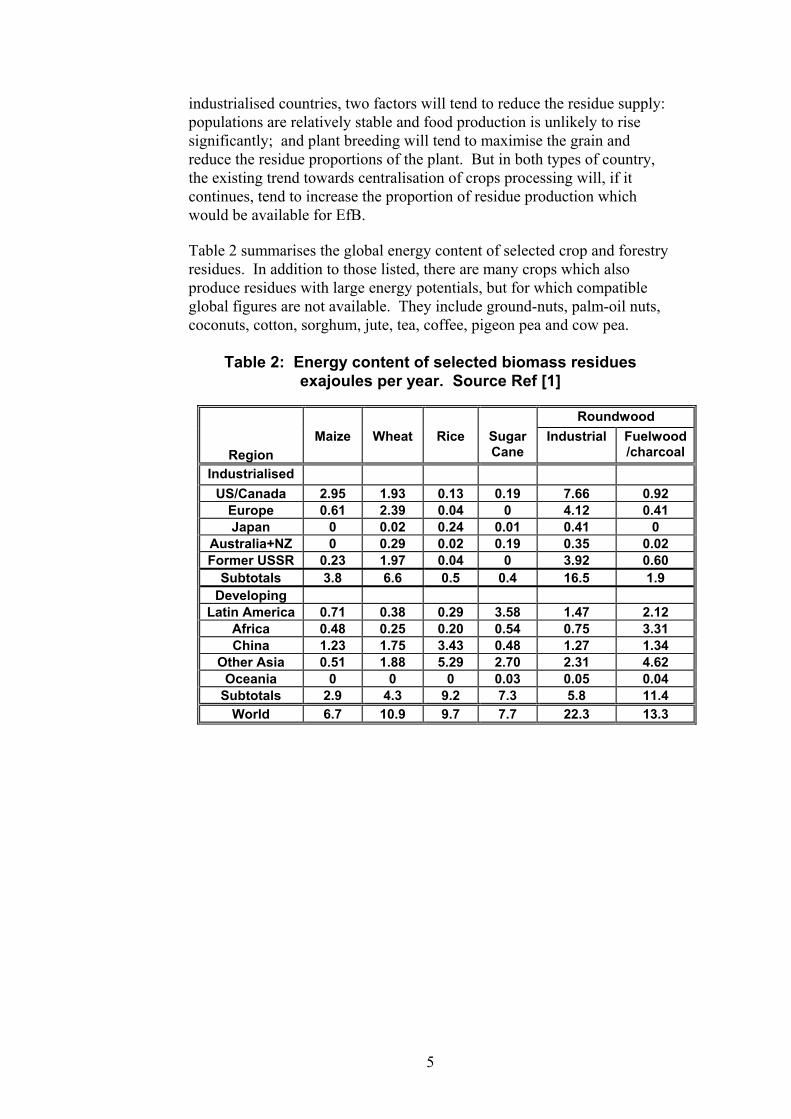
industrialised countries, two factors will tend to reduce the residue supply: populations are relatively stable and food production is unlikely to rise significantly; and plant breeding will tend to maximise the grain and reduce the residue proportions of the plant. But in both types of country, the existing trend towards centralisation of crops processing will, if it continues, tend to increase the proportion of residue production which would be available for EfB. Table 2 summarises the global energy content of selected crop and forestry residues. In addition to those listed, there are many crops which also produce residues with large energy potentials, but for which compatible global figures are not available. They include ground-nuts, palm-oil nuts, coconuts, cotton, sorghum, jute, tea, coffee, pigeon pea and cow pea.
Table 2: Energy content of selected biomass residues exajoules per year. Source Ref [1]
The economically realistic and environmentally sustainable supply of residues for EfB is much lower than the potential shown in Table 2. Many residues, especially in-field residues, play an important role in maintaining the long term fertility, structure and stability of agricultural soils; their increasing removal for other uses in recent decades is thought to have been an important cause of the soil degradation now affecting large amounts of agricultural land throughout the world. The maximum residue removal compatible with sustainability is highly crop, climate and site specific. In the US corn belt, residue removal rates averaging 35% have been calculated as the maximum possible if soil erosion is to be below the "soil-loss tolerance level", defined as "the maximum level of soil erosion that will permit a high level of crop productivity to be sustained economically and indefinitely". Conservation and non-till practices would increase this figure to 52% and 58% respectively [1]. The amount of residues available for EfB also depends on recovery and storage technologies. In the 1980s, on average, only 20% of US residues could actually be used because only 60% of the sustainably acceptable removal could be recovered with the technology available, and storage losses would average about 15%. However, collection and storage technologies are developing rapidly in response to changing needs, and this figure is likely to increase.
1.4 BIOMASS PLANTATIONS FOR ENERGY.
Introduction Energy plantations provide by far the largest long term global opportunities for gasification and generating equipment. But most of the existing 100 mn ha of industrial tree plantations are relatively slow-growing species for industrial markets such as paper pulp. Only about 6 mn ha are the fast growing non-coniferous (hardwood) trees best suited to EfB, although the success of those that do exist, particularly eucalypts in Brazil, with its strong tradition of wood plantations to supply raw materials and/or energy for the lumber, plywood, pulp and paper, and iron and steel industries, shows what will be possible in the future. In temperate climates there is less experience, although the development of energy plantations is accelerating rapidly. There are over 0.8 mn ha of pulpwood eucalypts in Spain and Portugal; in Northern Europe there are about 15,000 ha of experimental short rotation crops (mainly willow) of which about 10,000 ha are in Sweden. The US has about 24,000 ha of hardwood plantations in the Pacific Northwest. The experimental work now being undertaken in these countries is providing the foundations for the rapid development and expansion of the EfB industry.
6
Plantations for EfB will take two main forms: species with very high dry matter production, which would ideally be grown on good quality agricultural land - for example, set-aside land in Europe; and species capable of reasonably high dry matter production on marginal and degraded land. Examples of the former include short rotation tree (C3) crops such as poplar and willow in temperate areas, harvested every 3-8 years, with replanting every 15-30 years; willow in colder Northern areas; and eucalypts in more Mediterranean and tropical areas. They also include herbaceous (C4) thick stemmed (sweet sorghum, sugarcane) or thin stemmed grasses (switchgrass, miscanthus). Some, such as miscanthus, switch grass and cordgrasses are perennials, harvested every 6-12 months, and replanted perhaps every 10 years. Others, such as sweet sorghum, are annuals, planted and harvested each year. Annuals and perennials are more are more easily integrated into traditional farming systems, but have the disadvantage of higher agro-chemical and energy inputs and costs. Examples of species suitable for degraded lands include alders, black locust, birch, castanea sativa, platanus, nicotania [7].
State of the Art A great deal of R & D is still needed to maximise yields, to provide appropriate on-farm techniques and machinery, and to integrate energy crops, particularly perennials and SRC, into existing agricultural systems dominated by annual food crops. However, the political, environmental and economic benefits of EfB have encouraged governments and international organisations such as the World Bank and the European Union to allocate increasing proportions of their energy R & D and project budgets to this area. The results can now be seen in the rapidly increasing literature on all aspects of energy crops and their conversion to electricity, in yield improvements, in the development of commercial planting and harvesting machinery, and in demonstration projects in several countries. Estimates of yields from plantations are inevitably limited by the lack of data so far, and vary enormously according to species, soil conditions, climate, management, etc. One example is the sugar industry in Zimbabwe, where yields averaged 120 tonnes of harvested matter/ha/year at 50% moisture content in 1987; another is the grain crop yields in temperate climates, which include 7.5 and 7.0 tonnes of dry matter/ha/year for maize in the US and wheat in the UK respectively, in 1986-87. Inclusion of above-ground residues brings the biomass yields to about 14-18 tdm/ha/year for both wheat and maize. These figures then need to be modified by assumptions about increasing productivity over time: in both of the grain examples, yields have more than tripled since the 1940 with intensive management and improved technology: further improvements of 2.0 and 2.5 times present yields are expected for maize and rice respectively, in the US, for 2030 over 1982. Although such improvements have not yet appeared in plantation-based biomass energy systems, hybrid poplar yields of 43 tdm/ha/year have been achieved in experiments in the US Pacific Northwest, and eucalyptus
7
yields of 39 tdm/ha/year have been achieved in trials in Brazil. These compare with existing yields in tdm/ha/year which include 10-15 for poplar and willow in temperate zones, 12-30 for miscanthus, 8 for switchgrass, 2-20 for cordgrasses, and 13-25 for sweet sorghum. It is generally assumed that with sufficient R & D inputs, particularly species breeding and selection, maximising characteristics such as water and nutrient utilisation efficiency, and in-field processes and harvesting techniques, long term yield increases will parallel those achieved in grain crops in industrialised countries over the past 50 years; production costs are expected to fall in parallel. The goal of the EU biomass programme, for example, is to reach an average yield of 12 tdm/ha/year in the next century, with much higher yields on high grade land and lower yields on marginal/degraded land.
1.5 THE LAND AVAILABLE FOR ENERGY PLANTATIONS
Agricultural land. The amount of land available for energy plantations varies both within and between industrialised and developing countries. There are two main categories: surplus agricultural land, and marginal or degraded lands. In the short term, the surplus agricultural land will be available mainly in OECD countries, where the growth of agricultural productivity over the past 50 years, combined with stable or only slowly growing populations, is rapidly reducing the amount of land needed for food production. Although there are still many institutional and economic constraints on the conversion of this land to energy plantations, they are being overcome by environmental and agro-political pressures. Both the US and Europe provide examples of policies to encourage conversion of agricultural land to energy crops. In the US, 4.5-31 mn ha/year of productive cropland were made idle during the 1980s, and this is expected to rise to 60 mn ha/year by 2010-2020. In the European Union, 15% of arable land is already available for set-aside, the system of payments to farmers if land is removed from conventional food production, and this is expected to rise to 15-20 mn ha by 2000, and to at least 40 mn ha into the next century [8]. Indeed, EU-12 food production could take place on as little as 20-60% of current utilised area under certain high intensity agricultural scenarios [9].
Marginal and degraded land. About 50% of global arable land (700-1000 mn ha) are degraded but are still under agricultural production, or have been withdrawn from agriculture because of erosion, salination, rising water tables, contamination, overgrazing or deforestation. SRC plantations would be ideal for some of these lands because they could help to mitigate many of these problems. As an example of policy to encourage this, the US 1985 Food Security Act included provisions for establishment of wood energy crops, and its Conservation Reserve Programme set a target 16 mn ha of highly erodible land for long-term retirement from food crop production.
8
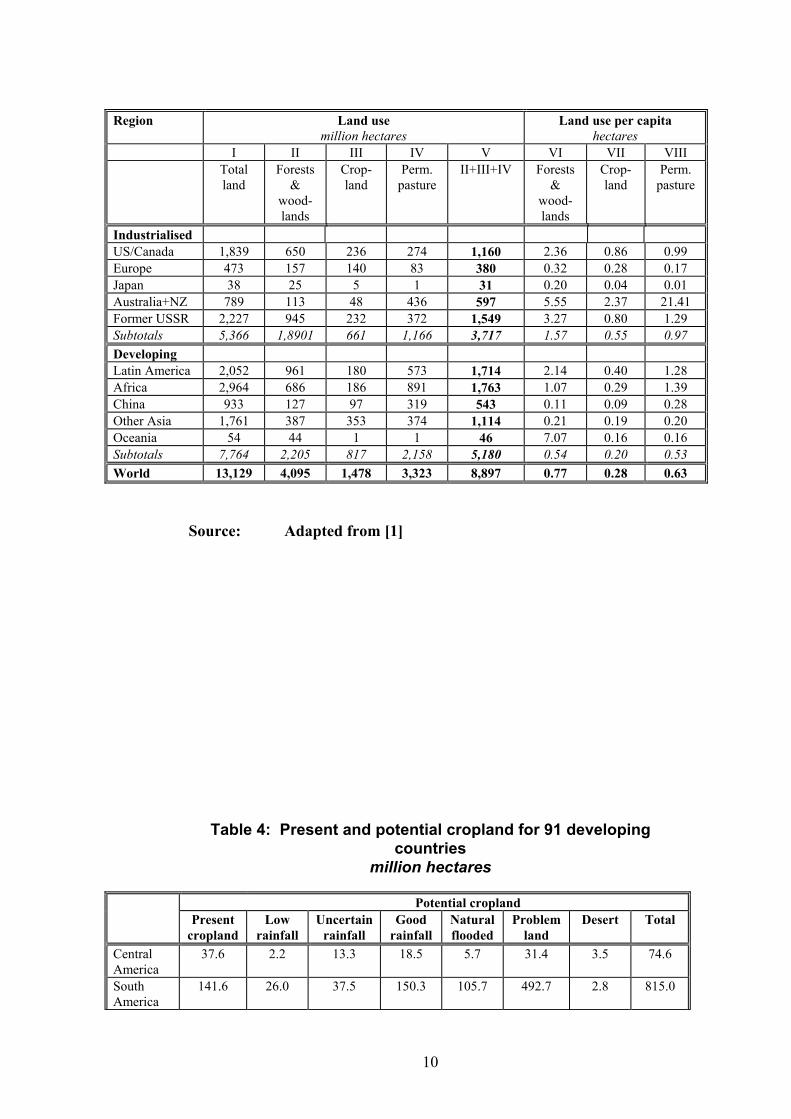
Development of drought resistant or tolerant species would greatly increase this total. 18 mn acres of SRC for EfB in this context is an "optimistic but not unreasonable" target in the US. EfB could also help to remedy the problems of the similar quantity of US land that is so wet that it is liable to contribute to surface and groundwater pollution when used for ordinary agriculture [3]. To exploit this land base and revitalise US agriculture, a Task Force Report requested by the Secretary of Agriculture (New Farm and Forest Products Task Force, 1987) proposed a national goal of "developing and commercialising within 25 years, an array of new farm and forest products, utilising at least 60 mn ha of productive capacity, to meet market needs representing net new demand for agriculture and forestry production". SRC would appear to be such a "new product". To put these large figures in context, there are now about 25 mn ha under soybeans, from almost zero in first half of this century [10]. The potential in many developing countries is very different: an estimated 50% more land will be needed for food over the next 30 years, and although there will be a surplus of potential agricultural land in Latin America and Africa of about 1.6 billion ha in 2025, Asia (excluding China) may have a deficit of about 0.05 billion ha [1], and here there could well be conflicts between food and fuel production. However, these can be reduced by linking energy production more closely with the energy needs of agriculture and the agricultural processing industry, and with rural development programmes. Estimating the land available globally is obviously extremely difficult: the estimates used in this report are derived from the present global land use patterns summarised in Table 3, and the present and potential crop land for developing countries in Table 4. The prospects for plantation lands in developing countries are then summarised in Table 5, which shows the potential excess agricultural land, and takes 10% of crop plus permanent pasture and forests and woodlands, together with degraded lands and 20% of desertified drylands [1].
1.6 THE GLOBAL TOTAL Table 2 summarises the total global energy content of selected crop and forestry residues. However the sustainable supply of residue energy is below the totals of Table 2 because the sustainably usable proportion is well below 100% of the total supply. Columns 2 and 3 of Table 6 summarise the sustainable energy available from residues, assuming the following sustainably recoverable proportions: sugar-cane - 100% of the bagasse and 25% of leaves and tops; logging residues - 25%; mill and manufacturing residues - 75%; other crop residues - 25%. Column 4 shows that the global potential sustainable biomass supply from residues is about 26 exajoules, or about 7.5% of world commercial energy use.
Table 4: Present and potential cropland for 91 developing countries
million hectares
Potential cropland Present
croplandLow
rainfall Uncertain
rainfall Good
rainfall Natural flooded
Problem land
Desert Total
Central America
37.6 2.2 13.3 18.5 5.7 31.4 3.5 74.6
South America
141.6 26.0 37.5 150.3 105.7 492.7 2.8 815.0
10
Africa
178.8 73.4 96.8 149.3 71.3 358.1 3.8 752.7
Asia (ex.China)
348.3 59.8 67.0 67.4 80.5 117.6 20.3 412.5
Total 706.3 161.4 214.7 385.5 263.1 999.7 30.4 2,054.9 Source: Adapted from [1]
Table 5: The prospects for plantations in developing regions million hectares
Cropland measures
Alternative measures of land areas potentially available for
plantations Present
cropland Potential cropland
Cropland required in 2025
Excess potential cropland in 2025
10% of cropland + perm. pasture + forests & woodlands
Degraded lands suitable for reforestation (see note 1)
Latin America 179.2 889.6 269 621 171 156(+32) Africa 178.8 752.7 268 484 176 101(+148) Asia(ex.China) 348.3 412.5 522 -110 111 169(+150) Total 706.3 2,054.9 1,059 995 458 426(+330)
Note 1: The figure in brackets gives one fifth of the area of desertified dry lands, which is the fraction of these lands considered suitable for re-forestation Source: Adapted from [1] To the residue totals must be added the biomass energy available from plantations. Estimates for sustainable plantation energy production are derived from Table 3, which estimates present global land use patterns; from Table 4, which estimates the present and potential cropland in 91 developing countries; and from Table 5, which provides a forecast of the prospects for plantations in developing countries. Using the land areas derived from these Tables, column 5 of Table 6 provides an estimate of the sustainably and economically available supply of biomass energy from plantations, assuming an overall yield of 15 tdm/ha/year, and that plantations will cover 10% of the total land now in forests, woodlands, cropland and permanent pasture (shown in Table 5) [1]. These figures are neither optimistic not pessimistic - they are extrapolated from experience and present understanding on the assumption that society will support the research and development necessary, and that hundreds of millions of hectares of plantations will be established over the next few decades. Column 6 of Table 6 shows the total sustainable energy available, including plantations: the global total is about 293 exajoules/year, over 90% of present commercial energy use. The proportion of present energy
11
supply accounted for by the biomass energy resource is much higher in developing (17.7%) than in industrialised countries (5.1%). Table 6: Potential Sustainable Global Supplies of Biomass for Energy (exajoules/year)
Crop Forest Total Industrialised US/Canada 1.7 3.8 5.5 34.8 40.3 Europe 1.3 2.0 3.3 11.4 14.7 Japan 0.1 0.2 0.3 0.9 1.2 Australia + NZ 0.3 0.2 0.5 17.9 18.4 Former USSR 0.9 2.0 2.9 46.5 49.4 Subtotals 4.3 8.1 12.5 111.5 124.0 Developing Latin America 2.4 1.2 3.6 51.4 55.0 Africa 0.7 1.2 1.9 52.9 54.8 China 1.9 0.9 2.8 16.3 19.1 Other Asia 3.2 2.2 5.4 33.4 38.8 Oceania - - - 1.4 1.4 Subtotals 8.2 5.5 13.7 155.4 169.1 World 12.5 13.6 26.2 266.9 293.3
12
SECTION 2. FUTURE PROJECTIONS The long-term projections presented here are based on global electricity demand and biomass fuel supply scenarios. This section considers the long-term opportunities for Electricity from Biomass under two possible future scenarios - a continuation of existing policies and a more radical approach to address global warming and land rehabilitation. The potential biomass resources under both of these scenarios are estimated. The forecasts in the section are based on those developed by Williams and Larsen in Ref [11]. This section also looks at the different sizes of plant likely to be needed in different sectors of the industry, stresses the important role of entrepreneurs in long-term development of the markets and assesses the geographical priorities for those companies seeking to enter the EfB market. The message of this section is clear - provided that the more environmentally conscious energy and land use policies now being formulated globally are followed through, the potential market for a range of plant sizes from 100kWe to 50 MWe and above is very large indeed.
2.1 ELECTRICITY DEMAND FORECASTS The forecasts of electricity consumption used for this report were prepared by the Response Strategies Working Group of the Intergovernmental Panel on Climatic Change and based on 4 demand scenarios, developed to show the effects of different energy and energy-related policies on global CO2 emissions. These are explained more fully in Box 1. For the purposes of this report demand is assumed to develop according to the Accelerated Policies Scenario. This scenario assumes high economic growth and the adoption of policies that will stimulate the adoption of energy-efficient technologies without restricting economic growth. What is clear from these forecasts is that electricity demand will at least triple regardless of environmental controls. This growth will be so strong that the take up of EfB is likely to be completely dependent upon the price and availability of the fuel resource.
2.2 FUEL SUPPLY - THE ECONOMICALLY AVAILABLE SUPPLIES OF BIOMASS FOR EFB To estimate the future market for biomass power plant two fuel supply scenarios have been developed. The first represents a policy stance heavily biased towards renewables which will lead to the extensive use of biomass
13
residues and the establishment of energy plantations. The second is a more conservative approach that assumes less ambitious measures based on an extension of current policies.
The Renewable Intensive Global Energy Scenario The Renewable Intensive Global Energy Scenario (RIGES), was designed to satisfy the energy demands of the Accelerated Policies scenario whilst maximising the economic contribution from renewable energy sources, The policies in this scenario will help to ensure that biomass is competitive in terms of cost, availability, reliability and operability with both conventional and non-conventional power systems. The Accelerated Policies scenario also shows the lowest electricity consumption overall of the four scenarios developed by the Intergovernmental Panel on Climatic Change. The type of policies required to implement this scenario are detailed in Box 2. Although it is too early to be able to cite actual examples of projects under the Renewables-Intensive Global Energy Scenario, important developments such as the emerging Chinese policy of massive reforestation, which could easily be adapted to use biomass energy plantations, show that its forecasts are firmly based on world trends. In many other Asian countries, particularly India, similar developments are under discussion in conjunction with the creation of Rural Energy Centres. In these Centres, the production of both heat and power is to be integrated with existing agricultural and forestry systems and with regeneration of degraded, saline and contaminated land.
14
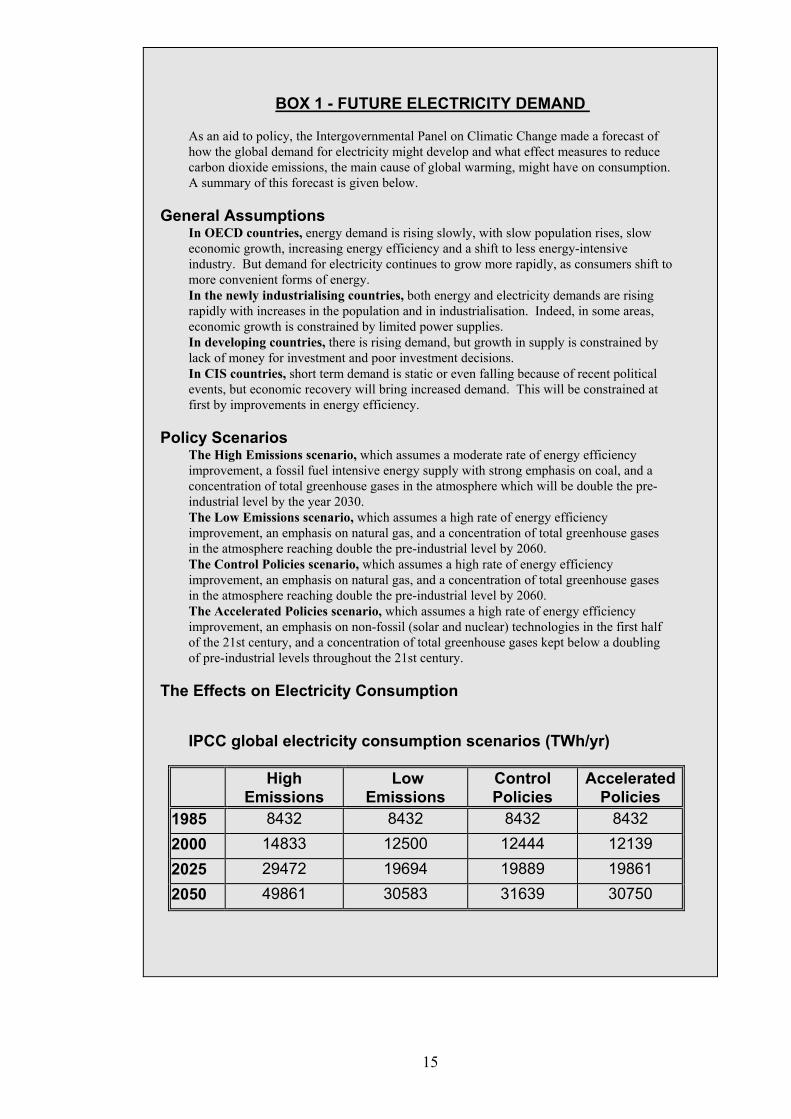
BOX 1 - FUTURE ELECTRICITY DEMAND As an aid to policy, the Intergovernmental Panel on Climatic Change made a forecast of how the global demand for electricity might develop and what effect measures to reduce carbon dioxide emissions, the main cause of global warming, might have on consumption. A summary of this forecast is given below.
General Assumptions In OECD countries, energy demand is rising slowly, with slow population rises, slow economic growth, increasing energy efficiency and a shift to less energy-intensive industry. But demand for electricity continues to grow more rapidly, as consumers shift to more convenient forms of energy. In the newly industrialising countries, both energy and electricity demands are rising rapidly with increases in the population and in industrialisation. Indeed, in some areas, economic growth is constrained by limited power supplies. In developing countries, there is rising demand, but growth in supply is constrained by lack of money for investment and poor investment decisions. In CIS countries, short term demand is static or even falling because of recent political events, but economic recovery will bring increased demand. This will be constrained at first by improvements in energy efficiency.
Policy Scenarios
The High Emissions scenario, which assumes a moderate rate of energy efficiency improvement, a fossil fuel intensive energy supply with strong emphasis on coal, and a concentration of total greenhouse gases in the atmosphere which will be double the pre-industrial level by the year 2030. The Low Emissions scenario, which assumes a high rate of energy efficiency improvement, an emphasis on natural gas, and a concentration of total greenhouse gases in the atmosphere reaching double the pre-industrial level by 2060. The Control Policies scenario, which assumes a high rate of energy efficiency improvement, an emphasis on natural gas, and a concentration of total greenhouse gases in the atmosphere reaching double the pre-industrial level by 2060. The Accelerated Policies scenario, which assumes a high rate of energy efficiency improvement, an emphasis on non-fossil (solar and nuclear) technologies in the first half of the 21st century, and a concentration of total greenhouse gases kept below a doubling of pre-industrial levels throughout the 21st century.
The Effects on Electricity Consumption
IPCC global electricity consumption scenarios (TWh/yr) High
The Existing Policies Scenario This scenario was derived by taking the biomass resource used for the Renewables-Intensive Global Energy scenario and limiting it to what seems realistic given no radical changes to policies already in train in several crucial regions of the world. Under these conditions it is assumed that only those residues and plantation crops which show the lowest risks and highest returns will be used for EfB. These are estimated as:
• 80% of the sugar cane and kraft pulp residues in Latin America, South and East Asia, Japan, Australia and New Zealand, the US and OECD Europe all of which have the necessary infrastructure and political commitment, but only 10% in Africa because of its political instability and lack of infrastructure;
• for other residues, 5% of the potential in Africa, 10% in Centrally Planned Europe, and 40% in the remaining countries;
• for plantations, 50% of the US and OECD Europe potential, 20% for Latin America, 10% for Centrally Planned Asia and Centrally Planned Europe, and 5% for Africa.
2.3 FORECASTS BY REGION Table 6 in Section 1 showed the potential, sustainable global supplies of biomass, not taking into account economic considerations. Table 7 below gives a forecast of electricity production from solid biomass from sustainably and economically available residues and plantations under the Existing Policies scenario and under the Renewables-Intensive Global Energy Scenario for the years 2025 and 2050. These projections are based on figures derived for the RIGES for biomass energy supplies (modified on the assumptions about proportions which will actually be used are listed in section 1) and for electricity from biomass by region (See Appendix 1 Tables 12, 13 and 14). Table 7 shows that
• the potential market for power from biomass under the Existing Policies scenario is 207 gigawatts.
• the potential market for power from biomass under the Renewables-Intensive scenario is 455 gigawatts in 2025 and 687 gigawatts in 2050. This is equivalent to 9200 50 MWe plants by 2025 and 13700 by 2050.
These figure do not include residues from pulses, fruits and berries, oil crops, tree nuts, coffee, cocoa and tea and tobacco and fibre crops for which no suitable figures are available. Several of these, especially oil crops such as palm oil, coffee and tea, have large amounts of residue or are moving into biomass fuel production. These could offer an additional 5% capacity. BOX 2 - THE RENEWABLE INTENSIVE GLOBAL ENERGY SCENARIO (RIGES)
16
A means of achieving the policy objectives of the Accelerated Policies scenario without constraining economic growth The Renewables-Intensive Global Energy Scenario assumes the large-scale global development of EfB and includes all the EfB listed in Table 4. It requires a radical, global extension of present policies to very large-scale reforestation and conversion of large areas of degraded marginal land to energy plantations. To achieve this, a number of policy interventions must take place. These are:
• The elimination of subsidies on fossil and nuclear energy, or, if this is not possible for political reasons, equal treatment for the renewables.
• The introduction into investment decisions of a full social cost evaluation of energy systems which includes the environmental and other external costs imposed upon society but not reflected in energy market prices.
• Government support for the research, development and demonstration of renewable energy systems, in co-operation with the private sector, to exploit the technical potential of biomass gasification.
• Government regulation of power utilities to ensure adequate incorporation of renewables in their investment plans, including equitable treatment of independent generators. Such regulation will need to be incorporated into the conditions of the privatisation process now changing the structures of many national electricity supply industries.
• Integration of agricultural, environmental and energy policy to ensure the development of EfB.
• The creation and/or strengthening of national and international bodies responsible for the research, development and promotion of renewable energy technologies and the implementation and assessment of renewable energy schemes.
Although only a small proportion of these policy interventions are as yet taking place, and then only in a few countries, this scenario is not unrealistic given the current EfB developments already planned or taking place. Table 8 shows the total potential for EfB both as total capacity and as a proportion of the total electricity demand as forecast under the Accelerated Policies scenario. The average of 18% is exceeded by a wide margin in many parts of the world, such as Latin America, but less will be possible in others. Table 8: Electricity from biomass by region. Adapted from Ref
[14].
Sugar cane TWh per year
Other TWh per year
Total TWh per year
As fraction of electricity
17
2025 2050 2025 2050 2025 2050 2025 2050
Africa 129 174 284 519 413 693 0.37 0.33
Latin America
589 683 510 811 1,099 1,494 0.54 0.46
SE Asia 354 419 - - 354 419 0.13 0.07
PC Asia 36 39 378 632 414 671 0.11 0.11
Japan - - 57 82 57 82 0.09 0.10
Australia/NZ 20 20 - - 20 20 0.15 0.12
United States
- - 456 504 456 504 0.15 0.15
Canada - - - - - - - -
OECD Europe
- - 399 529 399 529 0.19 0.22
Former CP Europe
- - 522 1,355 522 1,355 0.13 0.25
Middle East - - - - - - - -
Total 1,128 1,335 2,606 4,432 3,734 5,767 0.18 0.18
18
Table 7: Electricity Production from Solid Biomass by Region (TWhe/year). Adapted from Table 2 in [1] and Table S in [14]
Resource Sugar cane Kraft pulp Other residues Plantations Total
Africa 13 129 174 2 22 na 3 55 104 8 165 311 26 351 589Latin America 471 589 683 70 88 na 32 80 162 48 241 487 622 998 1332
S & E Asia 283 354 419 na na na na na na na - - 283 354 419 Centrally planned Asia 4 36 39 6 59 na 32 80 158 24 239 474 65 414 671
Japan na na na 38 48 na na na na na - - 38 48 -Australia/New Zealand 16 20 20 22 27 na na na na na - - 38 47 20
USA na na na 210 262 na 20 49 126 73 146 378 302 456 504OECD Europe na na na 60 75 na 32 81 132 122 243 397 214 399 529
Centrally planned Europe na na na 10 95 na 5 107 339 32 320 1016 47 522 1355 Total electricity production 787 1128 1335 418 676 na 124 446 1021 307 1339 3063 1635 3589 5419
Data for the kraft pulp industry are for 2020, not 2025, and are not available for 2050, so totals for both years are less than they would if correct estimates were available.
19
2.4 PLANT SIZES FOR THE RESIDUE AND PLANTATION SECTORS Although EfB systems of over 15MWe (the minimum size at which the combination of fluidised bed gasifiers with gas turbines appears to be cost-effective), are the focus of this Report, there is also considerable scope for marketing smaller systems. The likely pattern of demand in the various residue sectors is summarised here. In the sugar cane and alcohol sectors most of the plant would be 15MWe and above but there are some smaller centres of production which would require 1-15MWe systems. We assume that these account for about 10% of the available residue. They would probably use the up-draft fixed bed gasifier, though the entrained flow gasifier may be developed to compete at this level. Until the commercialisation of smaller scale, high efficiency gas turbines, Stirling engines or fuel cells, the prime mover will be the large, high efficiency diesel engine. In the forestry residue sector, in some countries the costs of transporting the resource from small and widely dispersed forestry operations will dictate the use of more medium-sized plant than in the agricultural residue sector. About 25% of the potential forestry residue supply is assumed to be affected by these considerations. In the plantations sector, the position is more complex. In Europe there is still much controversy about appropriate plant size. There will be a market for large systems, although it may be difficult to produce enough fuel in densely populated areas to justify plant larger than 10-25 MWe. There will also be a demand for medium sized systems; it is estimated that these will account for 15% of the available plantation crop. For example, the schemes being proposed under the UK Non-Fossil Fuel Obligation, which provides renewable energy systems with premium prices for their electricity in order to accelerate their commercialisation, are all in the 2-5MWe range. But there will also be a place in the market for even smaller systems of 100 kWe to 2MWe. In this case, the technology is likely to be down draft or entrained flow gasification using modules of standard high speed, low-cost diesels in the short term and Stirling engines in the medium to longer term. The market for these will be on-farm and farmer co-operatives, small CHP systems for agro-industry (e.g. grain dryers), industry, schools, hospitals and other institutions. In fact, the low risks and flexible fuel use offered by these plants will ensure that they develop more rapidly than the large-scale plants in some countries. It is therefore reasonable to assume that small sized systems will account for 15% of the potential plantation land. Tables 8 and 9 combine the RIGES figures of Table 4 with the plant size allocations described above to give a long term forecast of the potential market for EfB plant under each scenario by region, fuel type and plant size. (For convenience representative sizes for the small medium and large plant are taken as 0.5MWe, 7MWe and 40MWe respectively). The
20
message of these Tables is clear - the potential market for all three sizes of plant is very large indeed - provided of course that the more environmentally conscious energy and land use policies now being formulated globally are followed through.
2.5 PENETRATING THE MARKET Changing market structures and increased competition in electricity supply are now opening up attractive opportunities for private generators who are well placed to take rapid advantage of new technological developments. The development of efficient biomass fuelled power stations will provide new challenges for farmers, foresters, mill-owners and others with no experience of power generation for export. Entrepreneurs will probably have an important role to play in co-ordinating the activities and interests of fuel producers, generators, power distributors, consumers and financiers - especially where deregulation and or privatisation of the power industry takes place. At mills, for example, they may take responsibility for the residue fuel, providing the mill with the energy it needs and exporting the excess power to the national or regional grid on a mutually profitable basis. These entrepreneurs may well operate as energy management or CHP companies, like those that have been active in industry and commerce in the industrialised world since the early 1970's. There may also be partnerships between equipment manufacturers and utilities. Indeed the formation of such business interest groups involving biomass resource owners, equipment manufacturers, utilities and power consumers will probably play an essential part in the rapid and effective commercial development of new technologies based on biomass gasification.
Geographical Priorities The growth of the market for EfB will be dictated in the early years by a combination of the four factors of resource availability, power shortages, existence of a policy framework and existence of the necessary infrastructure. Table 11 below shows that in the short to medium term the priority markets are Latin America, and on a smaller scale Australia/New Zealand. These are followed by the US, OECD Europe and Asia. The African and centrally planned Asian markets are likely to follow later.
21
Table 9: The potential market for EfB systems under the RIGES, by number and size of plant (MWe), by 2025
Africa 234 369 40 63 249 44 6287 599 341 6287 1122 816 Latin America 1069 1683 160 251 363 64 9182 874 497 9182 2466 2495S & E Asia 642 1012 na na na na na na na na 642 1012Centrally planned Asia 65 103 107 169 363 64 9106 867 493 9106 1402 828Japan na na 87 137 na na na na na na 87 137Australia/New Zealand 36 57 49 77 na na na na na na 85 134USA/Canada na na 475 749 222 39 5563 530 301 5563 1227 1089OECD Europe na na 136 214 367 64 9258 882 501 9558 1385 780Formally CP Europe na na 176 271 485 85 12192 1161 660 12192 1819 1017Total 2047 3223 1226 1932 2023 354 51016 4859 2763 51016 10155 8272
Table 10: The potential markets for EfB systems under the Existing Policies Scenario, by number and size of plant (MWe),
Africa 23 37 4 6 25 4 314 30 17 314 82 65Latin America 855 1346 128 201 290 51 1836 175 99 1836 1448 1698S & E Asia 514 809 na na na na na na na na 514 809 Centrally planned Asia 7 10 11 17 290 51 911 87 49 911 394 127 Japan na na 70 110 na na na na na na 70 110Australia/New Zealand 29 46 39 62 na na na na na na 68 107USA/Canada na na 380 599 178 31 2781 265 151 2781 823 781OECD Europe na na 109 171 294 51 4629 441 251 4269 844 474 Formally CP Europe na na 17 27 49 8 1219 116 66 1219 182 102 Total 1428 2249 758 1193 1126 197 11691 1113 633 11691 4424 4272
22
Table 11: Market Development Criteria
Resource availability
Power shortages
Policy framewor
k
Infrastructure development
Total
Africa 2 3 0 0 5 Latin America 3 3 2 2 10
S & E Asia 2 3 2 2 9 Centrally planned Asia 1 2 2 2 8 Australia/New Zealand 3 2 2 3 10
USA 2 1 3 3 9 OECD Europe 2 1 2 3 8
Formally Centrally planned Europe
1 2 1 2 6
23
APPENDIX 1. DATA FOR SECTION 1
Table 12: Biomass Energy supplies from forest for the RIGES
exajoules per year
Industrial
Residues Fuelwood
Subtotal Fuel- wood
Total
2025 2050 2025/ 2050
2025 2050 2025/ 2050
2025 2050
Africa 0.72 0.98 0.78 1.50 1.76 2.43 3.93 4.19 Latin America 0.87 1.01 0.51 1.38 1.52 1.59 2.97 3.11 S&E Asia 0.95 1.12 1.00 1.95 2.12 3.13 5.08 5.25 CP Asia 0.78 0.84 0.39 1.17 1.23 1.21 2.38 2.44 Japan 0.20 0.19 - 0.20 0.19 - 0.20 0.19 Australia/NZ 0.15 0.15 0.00 0.15 0.15 0.02 0.17 0.17 United States 2.18 2.14 0.20 2.38 2.34 0.61 2.99 2.95 Canada 0.96 0.95 0.01 0.97 0.96 0.04 1.01 1.00 OECD Europe 1.28 1.27 0.10 1.38 1.37 0.31 1.69 1.68 Former CP Europe
Table 13: Biomass supplies from residues other than forest residues for
the RIGES exajoules per year
Sugar cane Dung Cereals Urban refuse 2025 2050 2025 2050 2025 2050 2025 2050 Africa 1.17 1.58 3.46 5.19 0.68 0.85 - - Latin America 5.33 6.19 3.23 4.18 0.98 1.70 - - SE Asia 3.20 3.79 6.12 11.53 2.34 2.98 - - PC Asia 0.32 0.35 1.23 1.39 1.13 1.19 - - Japan - - - - 0.16 0.23 0.53 0.53 Australia/NZ 0.18 0.18 0.48 0.62 0.27 0.38 0.063 0.062 United States - - 0.62 0.41 1.72 1.81 1.14 1.12 Canada - - - - 0.35 0.35 0.11 0.11 OECD Europe - - 0.76 0.80 1.41 1.41 1.30 1.28 Former CP Europe
- - 1.10 1.14 1.81 2.07 - -
Middle East - - - - - - - - Total 10.20 12.09 17.00 25.26 10.85 12.97 3.14 3.10 Source: Adapted from [14]
24
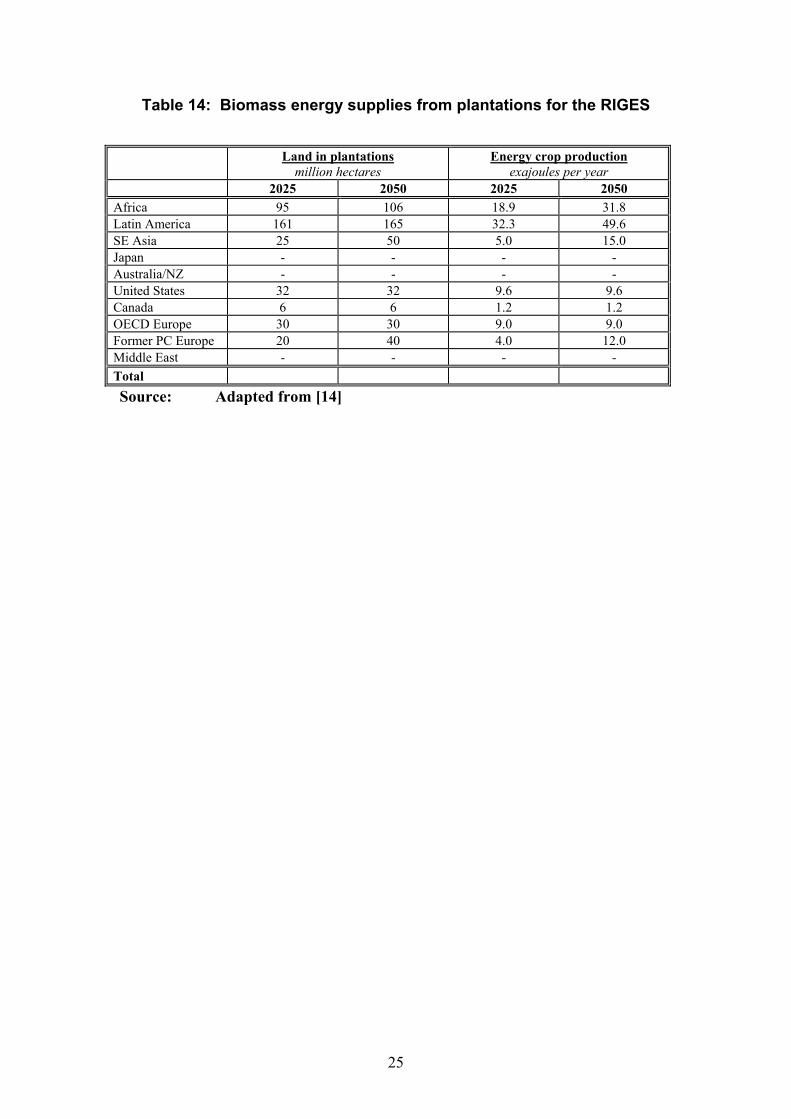
Table 14: Biomass energy supplies from plantations for the RIGES
Land in plantations million hectares
Energy crop production exajoules per year
2025 2050 2025 2050 Africa 95 106 18.9 31.8 Latin America 161 165 32.3 49.6 SE Asia 25 50 5.0 15.0 Japan - - - - Australia/NZ - - - - United States 32 32 9.6 9.6 Canada 6 6 1.2 1.2 OECD Europe 30 30 9.0 9.0 Former PC Europe 20 40 4.0 12.0 Middle East - - - - Total Source: Adapted from [14]
25
APPENDIX 2 THE SHORT TERM MARKET FOR ELECTRICITY FROM BIOMASS
In the short term (1994 - 2000), development of EfB will take place in two main situations:
• where growth in the demand for power is not matched by growth in capacity, but low value biomass resources - usually residues - are under-used and readily available or;
• where political initiatives have been taken to favour EfB as a result of concerns for the environment and rural development.
Brazil provides the best example of the first type of situation. Here power shortages are expected within the next few years as development of the country's low-cost hydro potential is completed and it faces the prospect of more costly and more environmentally sensitive schemes. Given Brazil's large biomass resource, particularly from its sugar-cane and cane alcohol industry, the development of EfB is a logical move. The most important Brazilian EfB project at present is the commercial demonstration of a biomass integrated gasifier/gas turbine in a 30MWe power plant to be fuelled initially by chips from eucalyptus plantations and later, perhaps, by bagasse. The preliminary investigations for this were funded by the US Environmental Protection Agency, the US Agency for International Development, the Rockafeller Foundation and Winrock International. The second and third phases of process and equipment development are being funded by the Global Environmental Facility of the World Bank, with project management by Shell International. Bioflow will supply a pressurised gasifier or TPS Thermiska Processor an atmospheric gasifier, while General Electric will supply an LM 2500 gas turbine. Another example from Brazil is the agreement between the owners of about 150 sugar cane alcohol distilleries in Sao Paulo State and the State's three power utilities to invest in biomass integrated gasification/gas turbines. Over the next 15 years, the new plants will raise the present power capacity of 200MWe to over 3000MWe from the same amount of cane, and this power will be sold to the utilities. The US offers examples of both of the situations described above. There are already over 7000MWe of EfB capacity installed under the Public Utilities Regulatory Policies Act, using mainly biomass wastes with traditional conversion technologies. Under the Department of the Environment's (DoE's) National Biomass Power Programme, the industry, the regulators, potential users and federal agencies will all collaborate to add a further 6000 MWe by the year 2000. Forecasts of EfB capacity in the US by the year 2010 range from 26000 to 50000MWe.(4). Of the capacity to be installed by the year 2000, about 600MWe, equivalent to 10-20 plants, will be provided by biomass integrated gasifier/gas turbine technology. The Vermont Department of Public Service is considering a commercial demonstration using wood chips from forestry management operations; in preparation for this, tests have been carried out with wood chips and other biomass fuels at the pilot-scale fixed bed gasifier operated by General Electric. These have been jointly supported by the
26
Us DoE, the US Environmental Protection Agency and the US Agency for International Development. In Hawaii, a 7MWe plant in a sugar mill is nearing completion. Europe, too, has plans for developments under both headings. A biomass CHP plant providing 6MWe and 9MW of heat is about to become operational in Sweden. Here, large resources of wood, combined with the running down of the nuclear programme, seem set to lead to the development of further EfB plants. Two plants of up to 50MWe each are planned for pulp mills in Finland, which has similar incentives to develop EfB, and other plants are planned for Italy and Belgium. Although there are not specific strategies equivalent to the US National Biomass Power Programme, the 20 million hectares of set-aside land expected in the European Union by 2005 provide a powerful incentive for countries to look to biomass as a source of energy. The European Commission's Directorate General for Energy has already allocated funding under its THERMIE programme for two demonstration biomass integrated gasification/gas turbines of about 8MWe, using short rotation coppice fuel. These will hopefully encourage the utilities, manufacturers and financiers to enter and expand the market. In the Netherlands, environmental legislation now bans landfill of organic materials and a planned 30MWe plant will be fuelled with demolition timber and other waste wood products. This kind of plant is also being considered in other European countries, including Switzerland. Examples of EfB projects planned in other parts of the world include a 25MWe gasifier/diesel system operating on rice husk in Mali, and a 10MWe straw-fuelled gasification plant in the Indian Punjab.
FORECASTS FOR SHORT-TERM GROWTH The Table below brings together forecasts for the short term growth of the market for biomass integrated gasification/gas turbine systems in all the countries reviewed. These forecasts are based on reasonably conservative assumptions about the success of the pilot projects now under way and the effectiveness of existing short-term policies and other incentives designed to encourage EfB.
Short Term Market for Biomass Gasification Systems - Forecasts of New Plant.
Type 1995 1996 1997 1998 1999 2000 TOTAL
USA Residue: Plantation:
2 0
1 0
1 0
1 1
1 1
4 1
11 3
27
Europe Residue: Plantation:
2 2
2 0
1 1
1 1
1 2
2 2
9 8
Brazil Residue: Plantation:
0 1
0 0
1 0
2 0
2 0
2 1
7 2
Others Residue: Plantation:
0 0
0 0
0 0
0 0
1 0
2 1
3 1
Totals Residue: Plantation:
4 3
3 0
3 1
4 2
5 3
10 5
30 16
Overall Total
7 3 4 6 8 15 46
28
APPENDIX 3 REFERENCES [1] Hall. D.O. et al in: Johansson T.B, Kelly H, Reddy A.K.N, Williams R.H. (eds);
Renewable Energy - Sources for Fuels and Electricity. Earthscan, London; and Island Press; Washington. 1992.
[2] Foster F. The Carbon and Energy Budgets of Energy Crops. ETSU, Harwell, 1993. [3] Hall D.O., Mynick H.E. and R.H. Williams. Carbon Seqestration versus Fossil Fuel
Substitution. PU/CEES Report no 255, November 1990. [4] Electricity from Biomass: National Biomass Power Programme 5-year plan, 1994-
1998. Solar Thermal and Biomass Power Division, Office of Solar Energy Conversion, US Dept. of Energy. Washington DC, 1993.
[5] ESD Ltd. The SAFIRE Project. EC DG XII. To be published. [6] Woods J., and Hall D.O. Bioenergy as a Sustainable Substitute for Fossil Fuels: their
Potential for CO2 Emissions Reductions. FAO, 1992. [7] Turnbull J. Strategies for Achieving a Sustainable, Clean and Cost Effective Biomass
Resource. EPRI, January 1993. [8] NSCGP, 1992 [9] Stuurman H.A., Buitelar R.M., Huizing H.J. Energy from Ligno-Cellulosic Biomass:
Prospects for the EC. Instituut voor Agrotechnologisch Onderzoek, April 1993. [10] Wright L.L., Graham R.L., Turhollow A.F. Short-rotation Woody Crop
Opportunities to Mitigate Carbon Dioxide Build-up. Oak Ridge National Laboratory, Oak Ridge, Tennessee, 1990.
[11] Williams R.H. and Larsen in Johansson T.B, Kelly H, Reddy A.K.N, Williams
R.H. (eds); Renewable Energy - Sources for Fuels and Electricity. Earthscan, London; and Island Press; Washington. 1992.
[12] West C.D. Principles and Applications of Stirling Engines. Van Nostrand Reinhold,
New York, 1986. [13] Elliott P., Booth R. Brazilian Biomass Power Demonstration Project. Special Project
Brief, Shell, London 1993. [14] Appendix 1 of Johansson T.B, Kelly H, Reddy A.K.N, Williams R.H. (eds);
Renewable Energy - Sources for Fuels and Electricity. Earthscan, London; and Island Press; Washington. 1992.
[15] Ogden J., Williams R.H., Fulmer M.E. Cogeneration Applications of Biomass
Gasifier/Gas Turbine Technologies in the Cane Sugar and Alcohol Industries. CEES, Princeton University, Princeton, 1990.
[16] Larson E.D. Biomass-Gasifier/Gas-Turbine Applications in the Pulp and Paper