See discussions, stats, and author profiles for this publication at: https://www.researchgate.net/publication/236941288 Torrefaction Process and Desing of Moving Bed Reactor Conference Paper · May 2011 CITATIONS 0 READS 215 4 authors, including: Jaya Shankar Tumuluru Idaho National Laboratory 131 PUBLICATIONS 863 CITATIONS SEE PROFILE Christopher T Wright Idaho National Laboratory 42 PUBLICATIONS 732 CITATIONS SEE PROFILE Richard D. Boardman Idaho National Laboratory 36 PUBLICATIONS 281 CITATIONS SEE PROFILE Available from: Jaya Shankar Tumuluru Retrieved on: 03 November 2016
This information was prepared as an account of work sponsored by an agency of the U.S. Government. Neither the U.S. Government nor any agency thereof, nor any of their employees, makes any warranty, expressed or implied, or assumes any legal liability or responsibility for the accuracy, completeness, or usefulness, of any information, apparatus, product, or process disclosed, or represents that its use would not infringe privately owned rights. References herein to any specific commercial product, process, or service by trade name, trademark, manufacturer, or otherwise, does not necessarily constitute or imply its endorsement, recommendation, or favoring by the U.S. Government or any agency thereof. The views and opinions of authors expressed herein do not necessarily state or reflect those of the U.S. Government or any agency thereof.
INL/EXT-10-19569-1
Biomass Torrefaction Process Review and Moving Bed Torrefaction System Model Development
Jaya Shankar Tumuluru, INL Shahab Sokhansanj, ORNL Christopher T. Wright, INL Richard D. Boardman, INL
August 2010
Idaho National Laboratory Biofuels and Renewable Energy
Technologies Department Idaho Falls, Idaho 83415
http://www.inl.gov
Oak Ridge National Laboratory Bioenergy Resource and Engineering
Systems Group Oak Ridge, TN 37831
http://www.ornl.gov
Prepared for the U.S. Department of Energy Office of Biomass Program
Under DOE Idaho Operations Office Contract DE-AC07-05ID14517
This page intentionally left blank.
iii
ABSTRACT
Torrefaction is gaining attention as an important preprocessing step to improve the quality of biomass in terms of physical properties and chemical composition. Torrefaction is a slow heating of biomass in an inert or reduced environment to a maximum temperature of approximately 300°C. Torrefaction can also be defined as a group of products resulting from the partially controlled and isothermal pyrolysis of biomass occurring in a temperature range of 200–280ºC. Thus, the process can be called a mild pyrolysis as it occurs at the lower temperature range of the pyrolysis process. At the end of the torrefaction process, a solid uniform product with lower moisture content and higher energy content than raw biomass is produced. Most of the smoke-producing compounds and other volatiles are removed during torrefaction, which produces a final product that will have a lower mass but a higher heating value.
This work was supported by the U.S. Department of Energy under DOE Idaho Operations Office Contract DE-AC07-05ID14517. The authors also gratefully acknowledge the contributions of Leslie Ovard, Allen Haroldsen, Penny Simon, Kim Jackson, Huan-chen Tang, and Caitlin Lanier for graphic design, layout, and editorial support in developing this publication.
vi
This page intentionally left blank.
vii
CONTENTS
ABSTRACT ................................................................................................................................................. iii
ACKNOWLEDGEMENTS .......................................................................................................................... v
3. MODEL DESIGN OF A MOVING BED TORREFACTION SYSTEM ........................................ 23
3.1 Reactor ................................................................................................................................... 25 3.1.1 Temperature Profile of Solid Material ...................................................................... 25
3.2 Design Calculations ............................................................................................................... 27 3.2.1 Height of Torrefier for Different Zones .................................................................... 27 3.2.2 Height of the Truncated Cone ................................................................................... 31 3.2.3 Gas Flow Rate ........................................................................................................... 31
3.3 Excel Calculation Sheet Developed for Torrefaction System Height, Heat Load, Gas Flow, Pressure Drop, and Blower Capacity ........................................................................... 32
Figure 2. Arrangement of cellulose, hemicellulose, and lignin in biomass matrix (Murphy and McCarthy 2005; Shaw 2008). ....................................................................................................... 4
Figure 3. Physiochemical changes in biomass during torrefaction (Bergman et al. 2005a). ........................ 7
Figure 4. Products formed during torrefaction of biomass (Bergman et al. 2005). .................................... 12
Figure 5. Overall mass balance of several torrefaction experiments. ......................................................... 13
Figure 6. Product yields of condensable volatiles formed in torrefaction (Prins et al. 2006a). .................. 15
Figure 7. Compositions of the different organic product groups (Kiel 2007). ............................................ 15
Figure 8. Compositions of the main permanent gases product groups (Kiel 2007). ................................... 16
Figure 9. Product yields of noncondensable volatiles formed in torrefaction at different conditions for willow and larch and straw (Prins 2005). ............................................................................. 16
Figure 10. Change in gas composition over time for torrefaction at 250°C (Prins 2005). ......................... 17
Figure 11. The envisaged conceptual structure of the torrefaction process of ECN. .................................. 20
Figure 12. Typical experimental results of torrefaction of willow (Kiel 2007). ......................................... 21
Figure 13. Overall drying and torrefying system. ....................................................................................... 23
Figure 14. INL moving bed torrefier reactor. ............................................................................................. 25
Figure 15. Different temperature zones in a torrefier. ................................................................................ 26
Figure 16. Mass of biomass as it passes through the torrefier. ................................................................... 26
Figure 17. Shape of truncated cone. ............................................................................................................ 31
TABLES Table 1. Typical lignocellulosic content of some plant materials. (Mohan et al. 2006) ............................... 4
Table 2. Mass percent of hemicellulose, cellulose, and lignin in raw biomass fuels (dry ash free basis). (Bridgeman et al. 2008) ..................................................................................................... 4
Table 3. Typical product yields (dry wood basis) obtained by different modes of pyrolysis of wood. ............................................................................................................................................ 6
Table 4. Bulk density (dry basis) of Eucalyptus grandis wood in three different treatments. ...................... 8
Table 5. Physical properties of wood chips—regular and torrefied pellets. ............................................... 10
Table 6. Ultimate analysis, HHV (dry ash free basis), and moisture content of untreated and torrefied biomass. ....................................................................................................................... 10
Table 8. Mass and energy distribution for torrefaction of willow in 280°C for 17.5 min reaction time (Bergman and Kiel 2005). (daf: dry and ash free basis) ..................................................... 12
ix
Table 9. Influence of temperatures on torrefied samples yields and heating value (Deng et al. 2009). .......................................................................................................................................... 13
Table 11. Energy and mass yields, and volatiles lost during torrefaction of reed canary grass, wheat straw, and willow at different temperatures (Bridgeman et al. 2008). ............................. 14
Table 12. Physiochemical analysis of pine and treated pinea. ..................................................................... 17
Table 13. Composition of gaseous products produced during torrefaction (nitrogen and water free basis). .......................................................................................................................................... 18
Table 14. Elemental compositions of solid products. ................................................................................. 18
Table 15. Mass distribution in the wet torrefaction of Loblolly Pine. ........................................................ 18
Table 16. Ultimate analysis of biomass solid. ............................................................................................ 19
Table 17. Mass distribution for torrefaction of willow at 280°C for 17.5 minutes. .................................... 19
Table 18. Gas phase composition during torrefaction of willow at 260°C for 32 minutes. ........................ 19
Table 20. Example values used in Equation 1. ........................................................................................... 27
Table 21. Sample values used in Equation 7. ............................................................................................. 28
Table 22. Sample values used in Equation 11............................................................................................. 29
Table 23. Constants for the reaction kinetics of Equation 16. .................................................................... 30
Table 24. Sample values for use in Equations 14 and 15. ........................................................................... 30
Table 25. Densities and mass fractions based on Equation 17. .................................................................. 30
x
This page intentionally left blank.
xi
ACRONYMS BTU British thermal unit
daf Dry ash free basis
DMD Dry matter digestibility
ECN Center for energy research and development
GC Gas chromatography
H/C Hydrogen to carbon
HHV Higher heating value
HPLC High performance liquid chromatography
INL Idaho National Laboratory
LHV Lower heating value
MS Mass spectrometry
O/C Oxygen to carbon
OH Hydroxyl group
SPA Solid-phase adsorbent
TD Thermal desorption
TGA Thermogravimetric analysis
xii
This page intentionally left blank.
Biomass Torrefaction Process Review and Moving Bed Torrefaction System Model Development
1. INTRODUCTION
The world is currently facing challenges to reduce dependence on fossil fuels and to achieve a sustainable renewable energy supply. Renewable energies represent a diversity of energy sources that can help maintain the equilibrium of different ecosystems. Among the various sources of renewable energy, biomass is increasingly used as it is considered carbon neutral, since the carbon dioxide released is already part of the carbon cycle (Arias et al. 2008). Increasing the utilization of biomass for energy can help reduce the negative CO2 impact on the environment and help meet the targets established in the Kyoto Protocol (UN 1998). Energy from biomass can be produced from different processes like thermochemical (combustion, gasification, and pyrolysis), biological (anaerobic digestion and fermentation), or chemical (esterification), in which direct combustion can provide a direct near-term energy solution (Arias et al. 2008). Some of the inherent problems with raw biomass materials, like low bulk density, high moisture content, hydrophilic nature, and low calorific value, limit its ease of use (Arias et al. 2008). In fact, due to its low energy density compared to fossil fuels, high volumes of biomass are needed; adding to problems associated with storage, transportation, and feed handling at a cogeneration plant. Furthermore, grinding biomass can be very costly, and in some cases impractical. All of these drawbacks have led to the development of new technologies in order to increase the quality of biomass fuels. The purpose of this work is mainly focused in four areas:
1. Provide an overview of the torrefaction process and a literature review on the physical properties of torrefied raw material and torrefaction gas composition
2. Design of a moving bed using basic principles, such as (a) calculation of the height of the torrefier, (b) equations governing the flow of the gases, and (c) effect of physical properties of the raw materials
3. Design of a moving bed torrefaction system of different capacities
4. Development of an excel sheet for calculating the length and diameter of the packed bed column based on the design considerations.
1.1 Overview of Torrefaction Process
Biomass is considered a carbon-neutral fuel source based on the perception that biomass fixes atmospheric carbon through photosynthesis. Hence, when biomass is harvested from a renewable resource, such as an energy crop plantation, or taken from farm residues that are normally burned in the field (i.e., wheat stubble), then work can be performed with the solar energy stored in biomass. The growing interest in biomass for fuel includes not only combustion to produce steam for electrical power and commercial plant duties, but also gasification to produce combustible gas (called producer gas when containing a large partial pressure of nitrogen and carbon dioxide) and syngas (principally containing carbon monoxide and hydrogen with low amounts of nitrogen and carbon dioxide). The use of either producer gas or syngas in modern reciprocating or gas turbines to produce higher value chemicals and fuels is limited, mainly due to biomass mass preparation and accumulation logistics and economics.
Biomass torrefaction has been recognized as a technically feasible method for converting raw biomass into high-energy-density, hydrophobic, compactable, grindable, and lower oxygen-to-carbon (O/C) ratio solid that is suitable for commercial and residential combustion and gasification applications. Torrefaction is generally understood to be a thermal pretreatment technology performed at atmospheric pressure in the absence of oxygen at temperatures between 200 and 300C (Usla, et al. 2008). The raw
biomass contains appreciable amounts of oxygen, nitrogen, sulfur, chlorine and fluorine, which makes it thermally unstable and produces tars and oils that can be problematic in conventional equipment used for coal combustion or gasification. The relatively high O/C ratio in biomass can have advantages and disadvantages. The high oxygen content can be used to form a stoichiometric ratio of H2 and CO to produce synthetic fuels and chemicals. Unfortunately, it is invariably necessary to “combust” (or oxidize) part of the fuel to attain the temperatures needed to thermally deconstruct the lignins and cellulose to produce H2 and CO. Hence, it is desirable to reduce the O/C ratio in biomass prior to gasification from and exergetic point of view (Prins et al. 2006).
Torrefied biomass in general defines a group of products resulting from the partially controlled and isothermal pyrolysis of biomass occurring in a temperature range of 200–230ºC and 270–280ºC (Zanzi et al. 2002). During the initial heating, drying takes place, which is followed by further heating during which more water is removed due to chemical reactions through a thermo-condensation process. This happens at over 160°C and also results in the formation of CO2 (Zanzi et al. 2002). Between 180 and 270°C, the reaction is more exothermal, and the degradation of hemicellulose continues. At this point, the biomass begins to turn brown and give off moisture, carbon dioxide, and large amounts of acetic acid with some phenols that have low energy values (Zanzi et al. 2002). During the torrefaction of lignocellulosic materials, the major reactions of decomposition affect the hemicellulose. Lignin and cellulose may also decompose in the range of temperatures at which torrefaction is normally carried out, but to a lesser degree (Shafizedeh 1985 and Williams and Besler 1996). The biomass retains most of its energy and simultaneously loses its hygroscopic properties. At about 280°C, the reaction is entirely exothermic, and gas production increases, resulting in the formation of carbon monoxide, hydrocarbons like phenols and cresols, and other, heavier products. For torrefaction, process temperatures over 300°C are not recommended as these initiate the pyrolysis process (Bourgeois and Doat 1984). There are many advantages in the pretreatment of biomass using torrefaction before densification. Torrefaction reduces variability in the feedstock, which is mainly due to differences in types of the raw materials, tree species, climatic and seasonal variations, storage conditions, and time (Lehtikangas 1999), and helps in developing a uniform feedstock to produce high-quality densified biomass.
Besides improving physical attributes, torrefaction also results in significant change in proximate and ultimate composition of the biomass and makes it more suitable for fuel applications. Studies (Sadaka and Negi 2009) on torrefaction of straws and cotton gin waste at 200, 260, and 315°C for 60, 120, and 180 minutes have concluded that moisture content was reduced by 70.5%, 49.4%, and 48.6% for wheat straw, rice straw, and cotton gin waste, respectively, whereas the heating value increased by 15.3%, 16.9%, and 6.3%, respectively. It was also observed that the highest heating value of 22.75 MJ/kg or 9761 (BTU/lb) was achievable at torrefaction conditions of 315°C and 3 hours. Similarly, by increasing the temperature from 230–280°C and time from 1–3 hours increased the carbon content and decreased the hydrogen, nitrogen, and oxygen content of miscanthus (Zanzi et al. 2002). At 280°C the carbon content increased to about 52% from an initial value of 43.5% while hydrogen and nitrogen content decreased from 6.49–5.54% and 0.90–0.65% for 2 hours of torrefaction. In general, an increase in torrefaction temperature results in an increase in carbon content and a decrease in hydrogen and oxygen content due to the formation of water, carbon monoxide, and carbon dioxide. This process also causes the hydrogen to carbon ratio (H/C) and oxygen to carbon ratio (O/C) to decrease with increasing torrefaction temperature and time, which is favorable because it results in less smoke and less water-vapor formation and reduced energy loss during combustion and gasification processes. Bridgeman et al. (2008), in their study of reed canary grass and wheat straw torrefaction at 230, 250, 270, and 290°C for 30 minute residence times, found that the moisture content decreases from an initial value of 4.7%–0.8%. They found that carbon and calorific value increased 48.6–54.3% and 9,372–9,716 BTU/lb, and hydrogen and nitrogen content decreased from 6.8–6.1% and 0.3–0.1%.
2. TORREFACTION REVIEW
2.1 Major Components of Biomass
A summary of the various components of biomass is given in this section to explain the effect of thermal treatment on compositional changes. Figure 1 indicates the various low molecular weight substances and macromolecular weight substances available in biomass (Mohan et al. 2006).
Biomass materials are essentially a composite of carbohydrate polymers with a small amount of inorganic matter and low molecular weight extractable organic constituents. Figure 1 indicates the linage for both the low- and high-molecular weight macromolecular polymers and oligomers and lignins. The micro and macromolecular substances in the biomass change with the biomass type (i.e., woody or herbaceous). Lignins generally range from 18–35 wt% while cellulosic material typically ranges from 65–75 wt%. Low molecular weight species, including the inorganic matter, generally equal less than 10 wt% of the biomass material.
Figure 1. Plant biomass composition (Mohan et al. 2006).
Cellulose is a high molecular weight polymer (with molecular weight up to 106 and higher) that makes up the fibers in wood and other biomass. This strength is important in cell walls, where the microfibrils are meshed into a carbohydrate matrix, conferring rigidity to plant cells. Cellulose degradation begins at 240–350C, resulting in anhydrous cellulose and levoglucosan (Mohan et al. 2006). The crystalline structure resists thermal depolymerization better than unstructured hemicelluloses. Amorphous regions in the cellulose contain waters of hydration and hold free water within the plant. When heated rapidly, this water is converted to steam which can rupture the cellulose structure.
Unlike cellulose, hemicelluloses are branched polymers (also a polysaccharide) consisting of shorter chains: 500–3000 sugar units as opposed to the 7,000–15,000 glucose molecules per polymer seen in cellulose. It accounts for about 25–35 wt% in dry wood. Hemicellulose thermal degradation occurs with slow pyrolysis in the range of 130–260C, with the majority of weight loss occurring above 180°C (Demibras 2009; Mohan et al. 2006), depending on its chemical nature and relationship with lignins within the cell. Hemicelluloses generally evolve as light volatiles, producing less tars and char compared to cellulose.
Lignin is an amorphous, highly branched, cross-linked macromolecular polyphenolic resin with no exact structure. Lignin fills the spaces in the cell wall between cellulose, hemicellulose, and pectin components. It is covalently linked to hemicellulose and thereby cross-links different plant polysaccharides, conferring mechanical strength to the cell wall and by extension to the plant as a whole. It is relatively hydrophobic and aromatic in nature. Lignin decomposes when heated to 280–500C,
producing phenols via the cleavage of ether bonds and scissioning of carbon-carbon bonds (Demibras 2009; Mohan et al. 2006). Lignin is difficult to dehydrate and thus converts to more char that cellulose or hemicelluloses.
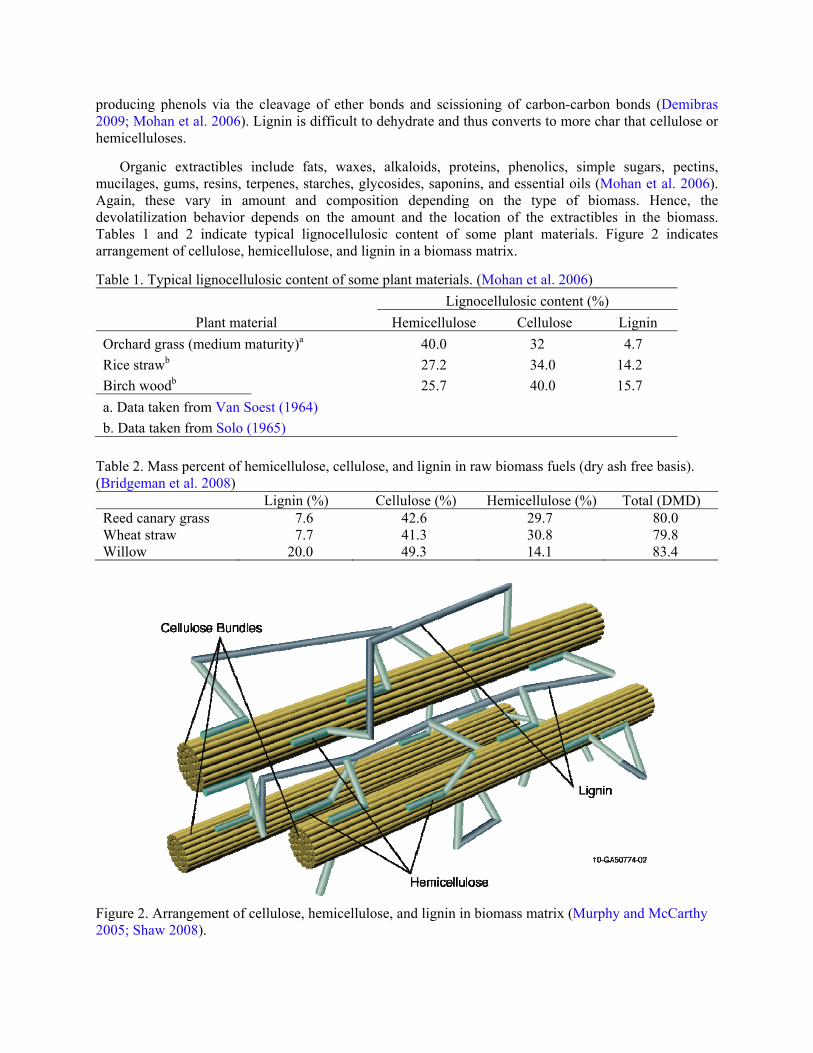
Organic extractibles include fats, waxes, alkaloids, proteins, phenolics, simple sugars, pectins, mucilages, gums, resins, terpenes, starches, glycosides, saponins, and essential oils (Mohan et al. 2006). Again, these vary in amount and composition depending on the type of biomass. Hence, the devolatilization behavior depends on the amount and the location of the extractibles in the biomass. Tables 1 and 2 indicate typical lignocellulosic content of some plant materials. Figure 2 indicates arrangement of cellulose, hemicellulose, and lignin in a biomass matrix.
Table 1. Typical lignocellulosic content of some plant materials. (Mohan et al. 2006)
Lignocellulosic content (%)
Plant material Hemicellulose Cellulose Lignin
Orchard grass (medium maturity)a 40.0 32 4.7
Rice strawb 27.2 34.0 14.2
Birch woodb 25.7 40.0 15.7
a. Data taken from Van Soest (1964)
b. Data taken from Solo (1965)
Table 2. Mass percent of hemicellulose, cellulose, and lignin in raw biomass fuels (dry ash free basis). (Bridgeman et al. 2008)
Figure 2. Arrangement of cellulose, hemicellulose, and lignin in biomass matrix (Murphy and McCarthy 2005; Shaw 2008).
2.2 Torrefaction
Carbonization of biomass using torrefaction can be good for reducing moisture content and increasing calorific value, which makes biomass energy dense. Torrefaction is a feasible method for improving the properties of biomass as a fuel (Sadaka and Negi 2009). It consists of heating biomass slowly in an inert atmosphere to a maximum temperature of 300°C (Fonseca et al. 1998) and has been defined as the partially controlled and isothermal pyrolysis of biomass occurring in a temperature range of 200–300ºC (Bergman and Kiel 2005). The treatment yields a solid uniform product with lower moisture content and higher energy content compared to raw biomass. Torrefaction lowers the O/C ratio and makes it more efficient for applications, including gasification and combustion (Bourgois and Doat 1984; Bourgois and Guyonnet 1988; Pentananunt et al. 1990; Pach et al. 2002).
The initial heating of biomass during torrefaction removes unbound water. Further heating results in the removal of bound water through chemical reactions. It is assumed that most of the bound water is removed by a thermo-condensation process, which occurs above 160°C when the formation of CO2 begins (Zanzi et al. 2002). Further heating between 180–270°C results in an exothermic reaction and initiates the decomposition of the hemicellulose, which causes the biomass to change color due to loss of water, CO2, and large amounts of acetic acid and phenols. The energy values of these compounds are relatively low, resulting in a significant increase in the energy density of the biomass (Zanzi et al. 2002). The process becomes completely exothermic at temperatures greater than 280°C, resulting in significant increases in the production of CO2, phenols, acetic acid, and other higher hydrocarbons (Zanzi et al. 2002).
Torrefaction of lignocellulosic materials results in decomposition of more hemicelluloses than lignin and cellulose. These decomposition reactions lead in destruction of hydroxyl groups (OH) and further increase the density and specific heating value of the product. The destruction of hydroxyl groups also results in creating a hydrophobic product that remains stable in abusive storage environments, making fungal degradation unlikely (Hakkou et al. 2006). Arias et al. (2008) reported that torrefaction of biomass significantly influences the grindability and reactivity of woody biomass. Bergman et al. (2005a) mentioned that the torrefaction process increases the uniformity of the final product quality. They have found that round wood, demolition wood, and waste wood had similar physical and chemical properties after torrefaction. They also concluded that seasonal influences on these properties were reduced.
The torrefaction process, when carried out at temperatures less than 250°C, is generally endothermic and may decrease its energy efficiency. However, some of the studies carried out on system energy balances and economics indicate that torrefied biomass could be a viable option for co-gasification or co-combustion with coal (Bergman et al. 2005; Prins et al. 2006a; Kavalov and Peteves 2005). Evaluating the design of torrefaction process for both herbaceous and woody biomass is the purpose of this work.
2.2.1 Principles of Torrefaction
Torrefaction is a process that effectively lowers the O/C ratio of biomass. The energy consumption during milling is reduced, and at the same time sharp edges and splinters are eliminated in the milled powder, greatly enhancing feeding properties. The torrefied biomass has also proved to have hydrophobic properties, which gives an advantage in long term storage compared to raw biomass.
Torrefaction, also referred to as mild pyrolysis, resides before the pyrolysis process in the continuum of temperatures starting at drying and ending at gasification. For reference, pyrolysis is the thermal decomposition of material occurring in the absence of oxygen which includes the first steps in the combustion and gasification processes that are followed by partial or total oxidation of the primary products. Lower process temperatures and longer vapor residence times favor the production of charcoal (upper end of the torrefaction process), whereas higher temperatures and longer vapor residence times
increase gas production (lower end of the gasification process). Moderate temperatures and short vapor residence times are optimum for producing liquids (pyrolysis range). Table 3 indicates the typical product yields of wood at different modes of heat treatment (IEA Bioenergy Task 34 2010).
Table 3. Typical product yields (dry wood basis) obtained by different modes of pyrolysis of wood.
Mode Conditions Liquid (wt %)
Char (wt %)
Gas (wt %)
Fast 500°C, short hot vapor residence time 1 second 75 12 13
Intermediate 500°C, short hot vapor residence time 10–30 seconds
50 25 25
Slow-Torrefaction
290°C, solids residence time 30 min – 82 % solid
18
Slow-carbonization
400°C, long vapor residence time hrs–days 30 35 35
Gasification 800°C 5 10 85
2.2.2 Torrefaction Process Technique
The thermochemical process of torrefaction is actually an incomplete pyrolysis process, and is characterized by the following parameters: reaction temperature 200–300°C, heating rate < 50°C/min, absence of oxygen, residence time < 30 minutes at T > 200°C, ambient pressure, and flexible feedstock. Absence of oxygen in the reactor is of great importance to avoid oxidation and ignition.
2.2.3 Biomass Reactions
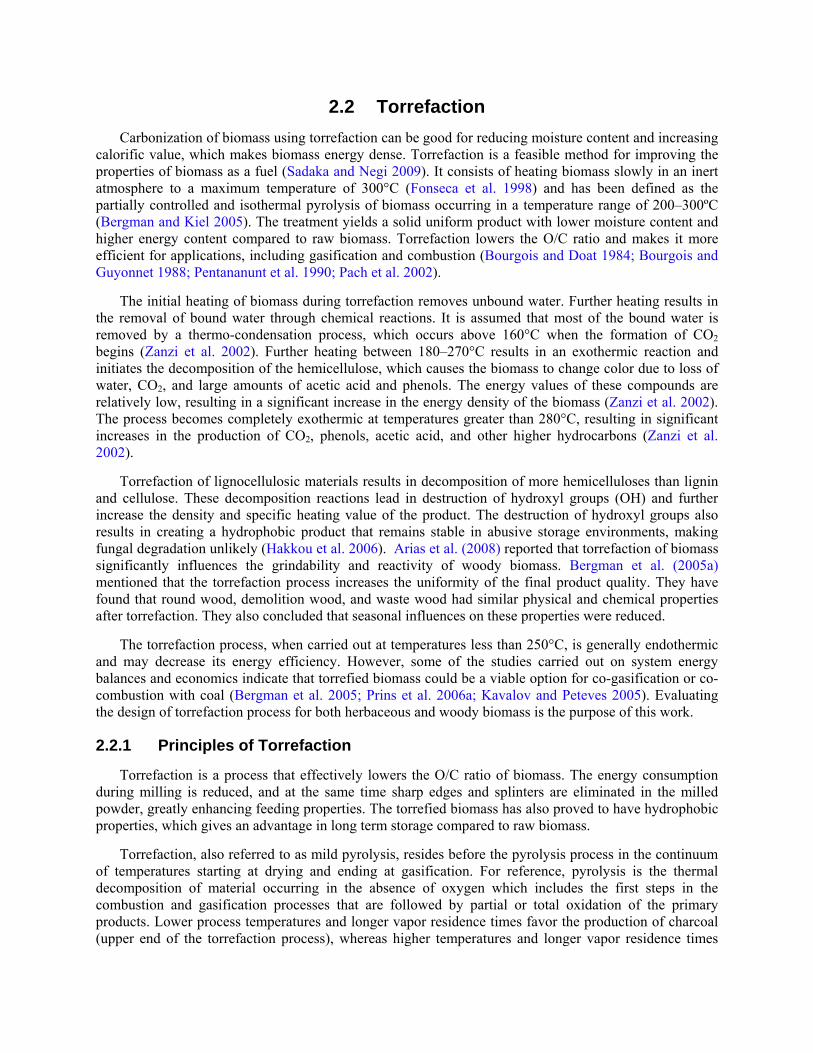
The cell in woody biomass is a rather complex construction of several building blocks. Polysaccharides are arranged in long chains called microfibrils enclosed in even structures of amorphous lignin and building the core of the crystalline cellulose. The cellulose is encased in a shell of hemicellulose. All these building blocks are more or less influenced by heat, but in different temperature ranges; therefore, they are converted by specific reactions. The physiochemical changes in biomass during torrefaction are shown in Figure 3.
2.2.4 Process Reactions
Drying: 200°C
Torrefaction reactions: 200–300°C
a. Devolatilization and carbonization of hemicellulose
b. Depolymerization and devolatilization/softening of lignin
c. Depolymerization and devolatilization of cellulose.
Figure 3. Physiochemical changes in biomass during torrefaction (Bergman et al. 2005a).
2.2.5 Process Results
Mass yield: ~70%
Energy yield: ~90%
Net calorific value: (LHV) 17–19 MJ/kg → 18–23 MJ/kg
Moisture content: 1–2%
Hydrophobic, max: 1–6% moisture uptake.
2.3 Physical Properties of Torrefied Biomass
Torrefaction of biomass significantly changes physical properties like moisture content, density, grindability, pelletability, hydrophobicity, and calorific value, (Sadaka and Negi 2009) and also storage behaviors in terms of off-gassing, spontaneous combustion, and self heating.
2.3.1 Moisture Content
Being a deep drying process, torrefaction reduces the moisture content of the pre-dried biomass from 10% to <6% (Lipinsky et al. 2002). Typically the moisture content of the torrefied biomass ranges between 1–6% on a weight basis, depending on the conditions of torrefaction (Bergman and Kiel 2005).
2.3.2 Density
Mass loss in the form of solids, liquids, and gases during the torrefaction process causes the biomass to become more porous. This results in a significant reduction in volumetric density, typically between 180–300 kg/m3, depending on initial biomass density and torrefaction conditions (Bergman and Kiel 2005).
Oliveira et al. (2009), in their studies on the effect of torrefaction on energy properties of Eucalyptus grandis wood, indicated that there is a loss of 14.12% of bulk density when it is torrefied at 280°C for 30 minutes. Table 4 indicates the loss of bulk density at torrefaction temperatures ranging 220–280°C.
Table 4. Bulk density (dry basis) of Eucalyptus grandis wood in three different treatments.
Treatment Bulk density (g/cm3) Percentage loss
Control* 0.85a –
T2-220°C 0.83a 2.35
T3-250°C 0.79b 7.06
T4-280°C 0.73c 14.12
Note: Means followed by the same letter in the superscript are statistically similar at the 5% probability level.
* Average moisture content of control treatment = 15%.
2.3.3 Grindability
Biomass is highly fibrous and tenacious in nature, because fibers form links between particles and make the handling of the raw ground samples difficult. During the torrefaction process the biomass loses its tenacious nature, which is mainly coupled to the breakdown of the hemicellulose matrix and depolymerization of the cellulose, resulting in the decrease of fiber length (Bergman et al. 2005; Bergman and Kiel 2005). There is a significant decrease in the particle length but not the diameter per se, resulting in better grindability, handling characteristics, and the ability of the biomass to flow unhindered through processing and transportation systems. During the torrefaction process the biomass tends to shrink; becomes lightweight, flaky, and fragile; and loses its mechanical strength, making it easier to grind and pulverize (Arias et al. 2008).
Bergman and Kiel (2005) conducted studies on the energy requirements for grinding raw and torrefied biomass like willow, woodcuttings, demolition wood, and coal using a heavy duty cutting mill. They concluded that power consumption reduces dramatically when biomass is first torrefied. The reduction in power consumption ranges from 70–90%, based on the conditions under which the material is torrefied. They have also found that the capacity of the mill increases by a factor 7.5–15. The most important phenomenon they have observed was that the size reduction characteristics of torrefied biomass resulted in a great similarity with coal.
2.3.4 Hydrophobicity
In general, the uptake of water by the raw biomass is high due to presence of hydroxyl groups (OH). Torrefaction produces a hydrophobic product by destroying OH groups and forcing the biomass to lose the capacity to form hydrogen bonds (Pastorova et al. 1993). Due to these chemical rearrangement reactions, nonpolar unsaturated structures are formed, which preserves the biomass for a long time without any biological degradation, like coal (Bergman and Kiel 2005; Wooten et al. 2000). Bergman’s (2005) studies evaluated the hygroscopic nature of the pellets made from a torrefaction and pelletization process (TOP) pelletized material based on the state of the pellet after immersing in water and its degree of water uptake, which was determined by gravimetric measurement. This study indicated that the pellets
made from untreated biomass showed rapid swelling followed by the disintegration of the pellet into the original particles, whereas the TOP pellets remained stable for longer times.
2.3.5 Pelletability
Variability in feed stock quality due to differences in the types of raw materials, tree species, climatic and seasonal variations, storage conditions, and time significantly influence the quality of biopellets (Lehtikangas 1999). On the other hand, torrefying the biomass before pelletization produces uniform feedstock with consistent quality. Lignin in the biomass is considered as the basic binding agent; thus the pelletability of any biomass is evaluated based on the amount of the lignin. In general, the higher the amount of lignin, the better the binding and milder the process conditions required for densification. Woody biomass has more lignin than lignocellulosic biomass and binds easily. Torrefaction process opens up more lignin active sites by breaking down the hemicellulose matrix and forming fatty unsaturated structures which creates better binding. The bulk densities of the torrefied pellets are 750–850 kg/m3 (Bergman and Kiel 2005).
Densification following torrefaction is considered by several researchers (Lipinsky et al. 2002; Reed and Bryant 1978; Koukios 1993; Bergman et al. 2005). These studies indicated that the pressure required for densification can be reduced by a factor of two when material is densified at a temperature of 225°C and the energy consumption during densification is reduced by a factor of two compared to raw biomass pelletization using a pellet mill. Densification experiments were carried out on untreated and torrefied biomass using a piston press (Pronto-Press), which can be operated at different pressures and temperatures, to understand the densification behavior of different types of torrefied biomass. The pellets produced based on the TOP process had higher bulk densities, in the range of 750–850 kg/m3, with the relatively high-calorific value (LHV basis) of torrefied biomass (generally 19–22 MJ/kg). The energy density of TOP pellets ranged from 15–18.5 GJ/m3 and is comparable to subbituminous coal, which typically has a value of 21–22 GJ/ m3. The pellets produced had a higher mechanical strength, typically 1.5–2 times greater, than the conventional pellets. The higher mechanical strength of these pellets is due to densification of the biomass at high temperature, which causes the biomass polymers to be in a weakened state (less fibrous, more plastic). The higher durable pellets from torrefied biomass can be due to chemical modifications that occur during torrefaction lead to more fatty structures that act as binding agent. In addition, the lignin content increases by 10–15%, as the devolatilization process predominantly concerns hemicellulose (Bergman 2005).
2.3.6 Calorific Value
Biomass loses relatively more oxygen and hydrogen than carbon during torrefaction, which in turn increases the calorific value of the product (Uslu et al. 2008). The net calorific value of torrefied biomass is 18–23 MJ/kg (LHV, dry) or 20–24 MJ/kg (HHV, dry) (Bergman et al. 2005; Prins 2005). The mass and energy in the torrefied biomass is predominantly preserved in the solid product for a long time as the material does not degrade with time. Tables 5, 6, and 7 present the physical properties, ultimate analysis, and elemental composition of torrefied woody and lignocellulosic biomass properties in comparison to the original raw materials.
Table 5. Physical properties of wood chips—regular and torrefied pellets.
Table 7. Elemental composition of torrefied forest residue samples. Torrefaction
temperature (°C) C (%) H (%) O (%) N (%) S (%) Non-torrefied 45.3 5.9 48.5 0.3 0.1 220 49.4 5.5 44.1 0.3 0.0 250 50.5 5.4 41.8 0.4 0.0 280 56.4 5.4 36.1 0.9 0.1
2.4 Torrefaction Off-Gas Composition Data
Torrefaction is a mild pyrolysis process carried out at temperatures 200–300°C, in which biomass produces mainly three products: a solid product of a brown/dark color; a condensable liquid including mostly moisture, acetic acid, and other oxygenates; and non-condensable gases—mainly CO2, CO, and small amounts of methane. The last two products can be represented by volatiles. During torrefaction the raw material loses most of its moisture and other volatiles which have a low heat value. Many researchers have worked on identifying the gas composition in terms of quantity and quality. The type and amount of the gas that comes as off-gas during torrefaction depends upon the raw material type and torrefaction process conditions, including the process temperature and residence time.
Currently, much of the published research about biomass torrefaction has focused on the compositional changes of biomass by proximate and ultimate analysis, along with product distribution. Several studies have also investigated the composition of liquid and gas released during torrefaction (Bergman et al. 2005; Prins et al. 2006; Deng et al. 2009).
During torrefaction, numerous reaction products are formed. Their yield strongly depends on torrefaction conditions (temperature and time) and on biomass properties. Figure 4 (Bergman et al. 2005) gives an overview of the torrefaction products, classified based on their state at room temperature, which can be solid, liquid, or gas. The solid phase consists of a chaotic structure of the original sugar structures and reaction products. The gas phase includes the gases that are considered permanent gases, but also light aromatic components such as benzene and toluene. The condensables, or liquids, can be divided into three subgroups which include water, organics, and lipids (Figure 4). One subgroup is reaction water as a product from thermal decomposition. The liquid also contains the free and bound water that has been released from the biomass by evaporation. The organics subgroup (in liquid form) consists of organics that are mainly produced during devolatilization and carbonization. Finally, the lipids are a group of compounds that are present in the original biomass. This subgroup contains compounds such as waxes and fatty acids.
A typical mass and energy distribution can be seen in Table 8, which shows the high preservation of mass and energy content in the solid product. Besides the solids, mostly water is produced during torrefaction, and the energy content of the volatiles is mainly preserved in the lipids and organics. Torrefaction operating conditions and biomass properties have a significant impact on the amount of both the solid residue remaining and the volatile and gaseous products produced during torrefaction. As a result, for different studies, their analysis results are not exactly the same. Prins et al. (2006) conducted several typical overall mass balances of torrefaction experiments. These data are reproduced in Figure 5 and show that, for different biomass types, their product distributions have big differences. Larch has the largest yield of solid product, and smallest gas and liquid yield; straw has higher gas and liquid fractions than woody biomass; and willow is between woody biomass and straw. It was also found that an increase in torrefaction temperature leads to a decrease in solid biochar yield and an increase in the volatile fractions, including liquid and non-condensable gases. That is a result of the competition between charring and devolatilization reactions that become more reactive at higher temperatures. The study of Deng et al. (2009) on the influence of temperatures on the yields of torrefied samples and heating value
can be seen in Table 9. Mani (2009) worked on the effect of torrefaction temperature on the proximate composition of forest residue samples (Table 10).
Figure 4. Products formed during torrefaction of biomass (Bergman et al. 2005).
Table 8. Mass and energy distribution for torrefaction of willow in 280°C for 17.5 min reaction time (Bergman and Kiel 2005). (daf: dry and ash free basis)
Reaction products Mass yield Energy yield (LHV, daf) (%)
Solid 87.5 94.9
Lipids 1.40 3.40
Organics 1.70 1.60
Gases 1.40 0.10
Water 8.00 0.00
Figure 5. Overall mass balance of several torrefaction experiments.
Table 9. Influence of temperatures on torrefied samples yields and heating value (Deng et al. 2009).
Samples Temperature
(°C) Solids
(wt, %) Liquids (wt, %)
Gases (wt, %)
Conversion (wt, %)
HHV (MJ/kg)
Rice straw 200 59.84 3.47 36.69 40.16 17.16
250 40.32 4.23 55.45 59.68 18.03
300 36.57 6.56 56.87 63.43 18.68
Rape stalk 200 63.29 6.76 29.95 36.71 19.50
250 38.26 9.42 52.32 61.74 20.10
300 25.30 10.04 64.66 74.70 21.59
Comparing the conversion of agricultural residues (rice straw and rape stalk) to woody biomass from literatures, the conversion of the former is much higher than that of the latter under the same torrefaction conditions (temperature and residence time) (Bergman et al. 2005). This is due to the higher volatile matter content in the agricultural residues and the decomposition of hemicellulose, the main fraction decomposed in the temperature range of torrefaction. Bridgeman et al. (2008) drew similar conclusions that the mass yield (dry ash free) was 55.1%, 61.5%, and 72.0% for wheat straw, reed canary grass, and willow, respectively, at 290°C for 30 minutes.
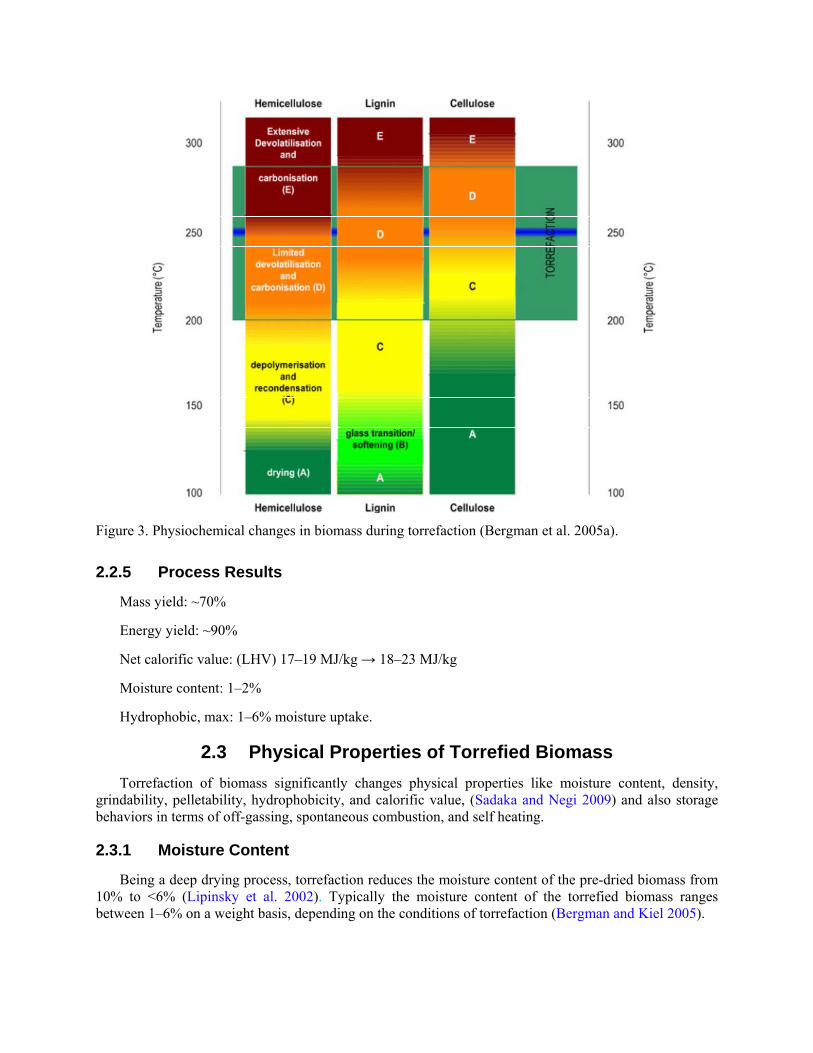
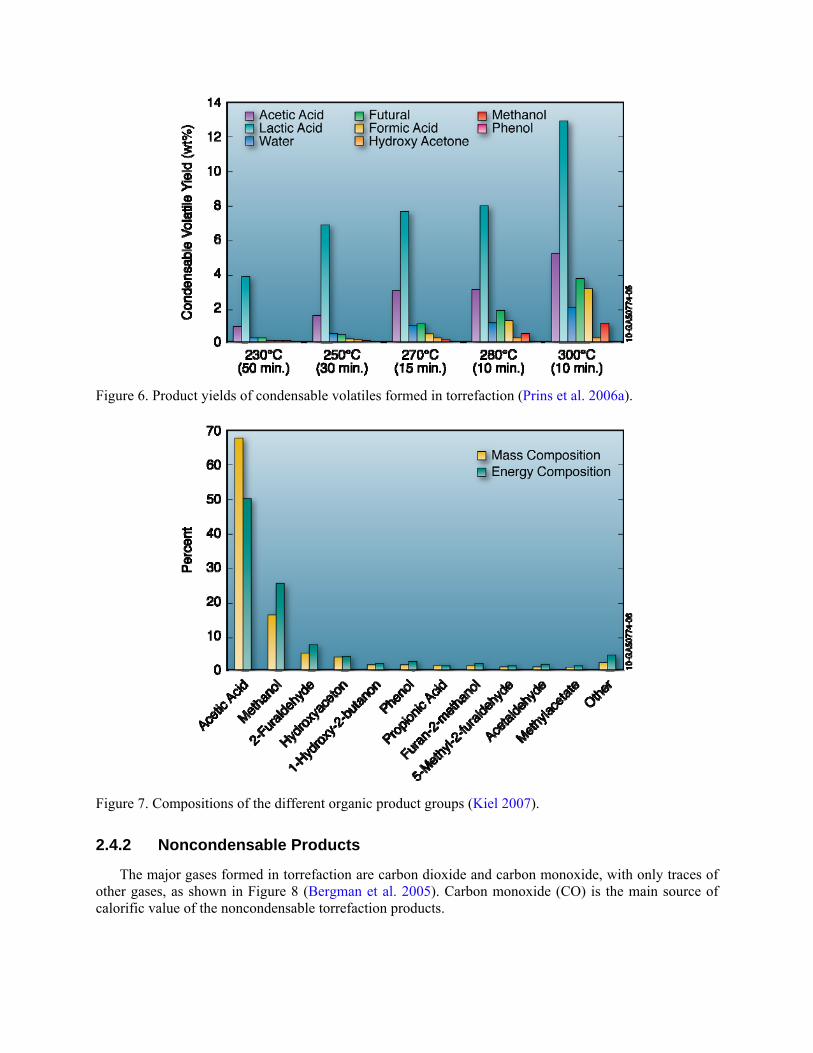
Water is the major condensable product. Water is released during drying when moisture evaporates and during dehydration reactions between organic molecules. Acetic acid is also a condensable torrefaction product, mainly originating from acetoxy- and methoxy-groups present as side chains in xylose units present in the hemicelluloses fraction. Prins et al. (2006) showed that smaller quantities of formic acid, lactic acid, furfural, hydroxyl acetone, and traces of phenol are also present in the volatile component liberated during the decomposition of biomass. For most of the condensable volatiles, their yields will increase with the torrefaction temperature, as shown in Figure 6. As a result, more energy is transferred to the volatiles fraction in the form of combustibles such as methanol and acetic acid. Bergman et al. (2005) showed the specific energy composition of organics in Figure 7. This figure shows the role of compositions in the energy content of volatiles. Bridgeman et al. (2008) have listed the energy and mass yields, and volatiles lost during torrefaction of reed canary grass, wheat straw, and willow at different temperatures (Table 11).
Table 11. Energy and mass yields, and volatiles lost during torrefaction of reed canary grass, wheat straw, and willow at different temperatures (Bridgeman et al. 2008).
Temperature (°K)
503 523 543 563
Reed Canary Grass
Mass yield (daf) 92.6 84.0 72.0 61.5
Energy yield (daf) 93.5 86.6 77.1 69.0
Volatiles (daf) 7.4 16.0 28.0 38.5
Wheat Straw
Mass yield (daf) 91.0 82.6 71.5 55.1
Energy yield (daf) 93.5 86.2 78.2 65.8
Volatiles (daf) 9.0 17.4 28.5 44.9
Willow
Mass yield (daf) 95.1 89.6 79.8 72.0
Energy yield (daf) 96.5 92.7 85.8 79.2
Volatiles (daf) 4.9 10.4 20.2 28
Note: daf: dry ash free basis
Figure 6. Product yields of condensable volatiles formed in torrefaction (Prins et al. 2006a).
Figure 7. Compositions of the different organic product groups (Kiel 2007).
2.4.2 Noncondensable Products
The major gases formed in torrefaction are carbon dioxide and carbon monoxide, with only traces of other gases, as shown in Figure 8 (Bergman et al. 2005). Carbon monoxide (CO) is the main source of calorific value of the noncondensable torrefaction products.
Figure 8. Compositions of the main permanent gases product groups (Kiel 2007).
The formation of CO2 may be explained by decarboxylation of acid groups in the wood. The formation of CO cannot be explained by dehydration or decarboxylation reactions. The increased CO formation is reported in literature (White and Dietenberger 2001) as the reaction of carbon dioxide and steam with porous char. This reaction produces CO. Traces of hydrogen and methane are also detected in noncondensable products. A gas composition comparison between wood and agricultural residues indicates that the latter is characterized by a higher CO2 production (Bergman et al. 2005; Prins et al. 2006; Deng et al. 2009). In addition, a kinetic study on the generation of main noncondensable gases shows that the gases are formed through parallel independent first-order reactions (Prins et al. 2006).
The composition of the noncondensable volatile product obtained from torrefaction at different conditions is depicted in Figure 9, with more CO2 than CO. The ratio of CO to CO2 increased with temperature because cellulose and lignin decompose at higher temperatures (Prins et al. 2006).
Figure 9. Product yields of noncondensable volatiles formed in torrefaction at different conditions for willow and larch and straw (Prins 2005).
Figure 10 shows the gas composition of the noncondensable products over time (not totaling exactly to 100% because only the main components, CO2 and CO, are shown) (Prins et al. 2006). These results were obtained by torrefaction of larch and willow at 250°C and analysis of noncondensable gases after 5, 15, and 30 minutes. It was found that the ratio of CO2 to CO decreases with time, in line with the theory that CO is formed in a secondary reaction. Table 12 indicates the physiochemical composition of pine and treated pine at torrefaction temperatures from 240–290°C. Fixed carbon increased, and volatiles and moisture content decreased, with the increase in torrefaction temperature.
Table 12. Physiochemical analysis of pine and treated pinea.
a. in each case, the mean result given was obtained from a minimum of four different experiments
b. roasting time: 30 minutes
c. native pine
d. neutral-solvent extractable (ethanol, benzene, boiling water)
e. powder samples left at the laboratory atmosphere still had a constant humidity
Figure 10. Change in gas composition over time for torrefaction at 250°C (Prins 2005).
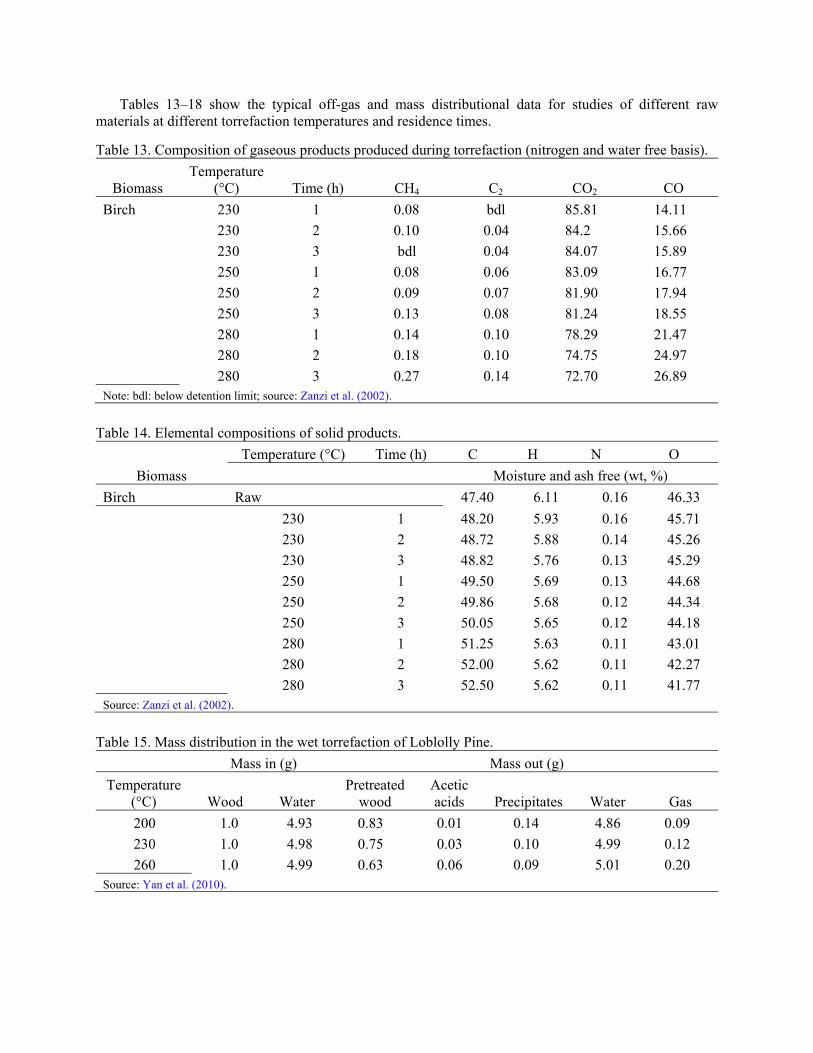
Tables 13–18 show the typical off-gas and mass distributional data for studies of different raw materials at different torrefaction temperatures and residence times.
Table 13. Composition of gaseous products produced during torrefaction (nitrogen and water free basis).
Table 15. Mass distribution in the wet torrefaction of Loblolly Pine.
Mass in (g) Mass out (g)
Temperature (°C) Wood Water
Pretreated wood
Acetic acids Precipitates Water Gas
200 1.0 4.93 0.83 0.01 0.14 4.86 0.09
230 1.0 4.98 0.75 0.03 0.10 4.99 0.12
260 1.0 4.99 0.63 0.06 0.09 5.01 0.20 Source: Yan et al. (2010).
Table 16. Ultimate analysis of biomass solid.
Biomass solid Temperature (°C) C H N S O
Loblolly Pine n/a 50.25 5.97 0 0 43.34
Wet torrefied loblolly pine 200 54.72 6.03 0.14 0 39.11
230 56.05 5.94 0.09 0 37.92
260 72.07 4.90 0.16 0 22.89 Source: Yan et al. (2010).
Table 17. Mass distribution for torrefaction of willow at 280°C for 17.5 minutes.
Reaction products Mass yield (%)
Solids 87.7
Lipids (Terpenes, phenols, fatty acids, waxes, and tannins) 1.40
Organics (Sugars, polysuguars, acids, alcohols, furans, and ketones) 1.70
Gases (H2, CO, CO2, CH4, CxHy, toluene, and benzene) 1.40
Water 8.00 Source: Bergman and Kiel (2005); Bergman et al. (2005).
Table 18. Gas phase composition during torrefaction of willow at 260°C for 32 minutes.
Gas phase composition Mass yield (%)
CO 0.1
CO2 3.3
H20 89.3
Acetic acid 4.8
Furfural 0.2
Methanol 1.2
Formic acid 0.1
Reminder (CH4, CxHy, toluene, and benzene) 1.0 Source: Kiel (2007).
2.4.3 Significance of the Torrefaction Off-Gas
The torrefaction process is a considerable energy densification process, during which chemical energy transfers from the feedstock to the torrefied product, while fuel properties are improved. In addition, to achieve high energy efficiency at low cost, innovative technologies of torrefaction were developed; with Center for Energy Research and Development’s (ECN) TOP process one of the most mature (Bergman 2005), as shown in Figure 11.
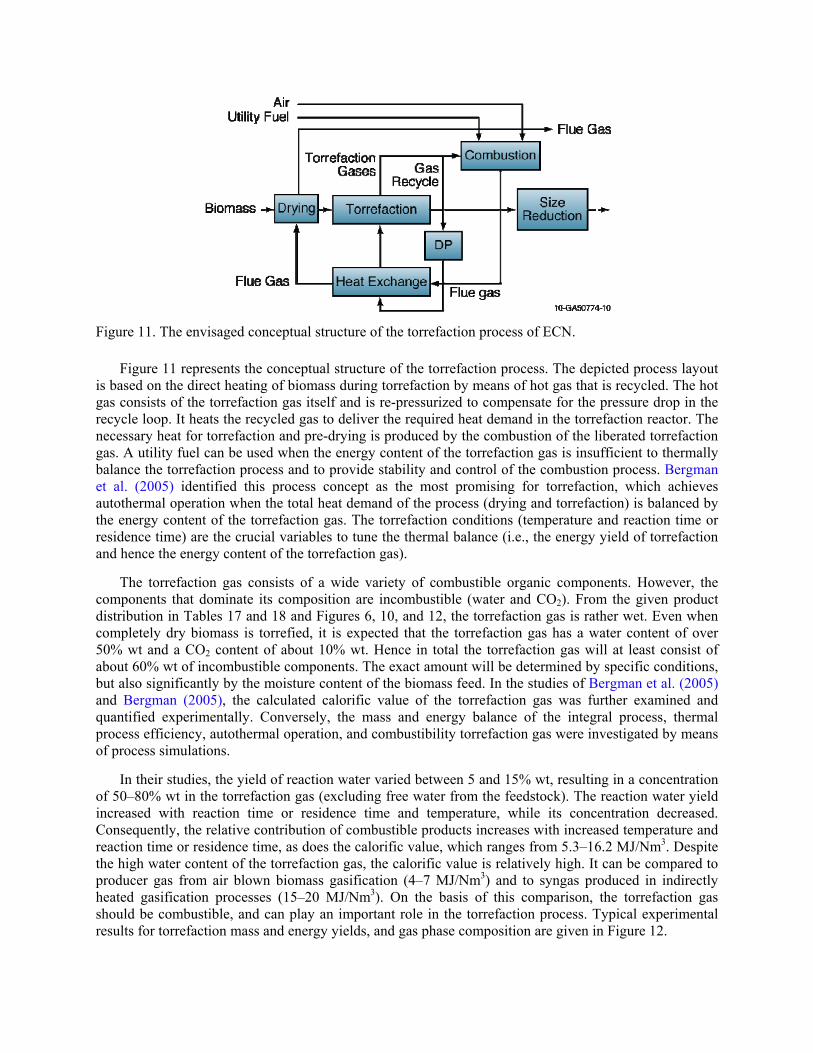
Figure 11. The envisaged conceptual structure of the torrefaction process of ECN.
Figure 11 represents the conceptual structure of the torrefaction process. The depicted process layout is based on the direct heating of biomass during torrefaction by means of hot gas that is recycled. The hot gas consists of the torrefaction gas itself and is re-pressurized to compensate for the pressure drop in the recycle loop. It heats the recycled gas to deliver the required heat demand in the torrefaction reactor. The necessary heat for torrefaction and pre-drying is produced by the combustion of the liberated torrefaction gas. A utility fuel can be used when the energy content of the torrefaction gas is insufficient to thermally balance the torrefaction process and to provide stability and control of the combustion process. Bergman et al. (2005) identified this process concept as the most promising for torrefaction, which achieves autothermal operation when the total heat demand of the process (drying and torrefaction) is balanced by the energy content of the torrefaction gas. The torrefaction conditions (temperature and reaction time or residence time) are the crucial variables to tune the thermal balance (i.e., the energy yield of torrefaction and hence the energy content of the torrefaction gas).
The torrefaction gas consists of a wide variety of combustible organic components. However, the components that dominate its composition are incombustible (water and CO2). From the given product distribution in Tables 17 and 18 and Figures 6, 10, and 12, the torrefaction gas is rather wet. Even when completely dry biomass is torrefied, it is expected that the torrefaction gas has a water content of over 50% wt and a CO2 content of about 10% wt. Hence in total the torrefaction gas will at least consist of about 60% wt of incombustible components. The exact amount will be determined by specific conditions, but also significantly by the moisture content of the biomass feed. In the studies of Bergman et al. (2005) and Bergman (2005), the calculated calorific value of the torrefaction gas was further examined and quantified experimentally. Conversely, the mass and energy balance of the integral process, thermal process efficiency, autothermal operation, and combustibility torrefaction gas were investigated by means of process simulations.
In their studies, the yield of reaction water varied between 5 and 15% wt, resulting in a concentration of 50–80% wt in the torrefaction gas (excluding free water from the feedstock). The reaction water yield increased with reaction time or residence time and temperature, while its concentration decreased. Consequently, the relative contribution of combustible products increases with increased temperature and reaction time or residence time, as does the calorific value, which ranges from 5.3–16.2 MJ/Nm3. Despite the high water content of the torrefaction gas, the calorific value is relatively high. It can be compared to producer gas from air blown biomass gasification (4–7 MJ/Nm3) and to syngas produced in indirectly heated gasification processes (15–20 MJ/Nm3). On the basis of this comparison, the torrefaction gas should be combustible, and can play an important role in the torrefaction process. Typical experimental results for torrefaction mass and energy yields, and gas phase composition are given in Figure 12.
Figure 12. Typical experimental results of torrefaction of willow (Kiel 2007).
2.5 Methods for Torrefaction Off-Gases Analysis
In order to make an overall mass balance, all the reaction products should be collected and weighed accurately. The solids, liquids, and gases produced are each analyzed using reliable standardized techniques. The following will review the analysis method for volatiles in torrefaction.
In the study of Prins et al. (2006a), the volatile products are split into a liquid and gas phase in a cold trap at –5°C. Liquid products collected in the cold trap were diluted with 2-butanol because not all the products dissolved in water. The diluted liquid was analyzed with high performance liquid chromatography (HPLC) using a Chrompack Organic Acids column with detection based on refraction index. The composition of the produced gas was analyzed with a Varian Micro gas chromatography (GC) with a Poraplot Q and a Molsieve column.
In the study of Deng et al. (2009), the products were removed from the hot zone to minimize the second reactions between the liquid and char, and to maximize the solid yield. A two-necked flask immersed in liquid nitrogen was used as a trapping system for condensable liquid. Noncondensable gases went through a filter to remove the carbon soot before entering an infrared gas analysis. The gas composition and concentration were recorded continuously throughout the heating process. Finally, the weight of the biochar and the amount of liquids obtained were measured.
In the study of Bridgeman (2008) a Nicolet Magma-IR AEM connected to a Stanton Redcroft Simultaneous Analyser STA-780 Series was used to perform torrefaction experiments at laboratory scale while simultaneously analyzing the volatile pyrolysis products for corresponding Thermogravemetric analyzer (TGA) data.
In addition, the analysis of biomass tar can also be used for reference. In the study of Dufour et al. (2007), two methods for the sampling and analysis of tar produced from wood pyrolysis were compared. The first method used a conventional cold-trapping technique in solvent-filled impingers followed by liquid injection. The second one is a new application of multi-bed solid-phase adsorbent (SPA) tubes followed by thermal desorption (TD). Both methods are based on GC coupled with mass spectrometry (MS). Quantification was performed with a well reproducible GC–MS method with three internal deuterated standards.
2.6 Storage Behavior
Solid biofuels are porous, often moist materials, and are prone to off-gassing and self-heating caused by chemical oxidation and microbiological activity. In general, the moisture content of biomass plays an important role in initiating chemmicrobial reactions. Moisture content coupled with high storage temperatures can cause severe off-gassing and self heating from biomass based fuels. Tumuluru et al. (2008) concluded that high storage temperatures of 50°C can result in high CO and CO2 emissions, and the concentrations of these off-gases can reach up to 1.7 and 6% for 60 days of storage period. These emissions were also found sensitive to relative humidity and product moisture content (Kuang et al. 2009).
Torrefied biomass or pellets are superior to the regular raw pellets as they are hydrophobic in nature and moisture uptake is almost negligible even under severe storage conditions. The storage issues like off-gassing and self heating may be very low in torrefied biomass as most of the solid, liquid, and gaseous products, which are chemically and microbiologically active, are removed during the torrefaction process. Some studies conducted by researchers at the University of British Columbia, Vancouver, Canada on off-gassing from torrefied wood chips indicated that CO and CO2 emissions were very low, nearly one third of the emissions from regular wood chips.
2.7 Product Applications
The high fuel quality of torrefied biomass makes it very attractive for combustion and gasification applications. Due to high calorific values, the thermal energies of the combustion and gasification system can be improved significantly (Bergman and Kiel 2005). The other applications include (i) high-quality smokeless fuels for industrial, commercial, and domestic applications; (ii) solid fuel for cofiring directly with pulverized coal at electric power plants; (iii) an upgraded feedstock for fuel pellets, briquettes, and other densified biomass fuels; and (iv) high quality biomass fuel for advanced bioenergy application.
3. MODEL DESIGN OF A MOVING BED TORREFACTION SYSTEM
Based on the fundamental concepts of the torrefaction process, a model torrefaction system based on a moving bed concept was developed. The following criteria were used in establishing the model design:
Minimize the volume and footprint of the system
Combine several functions into a single unit
Accept a wide range of particle sizes
Minimize fixed and operational costs.
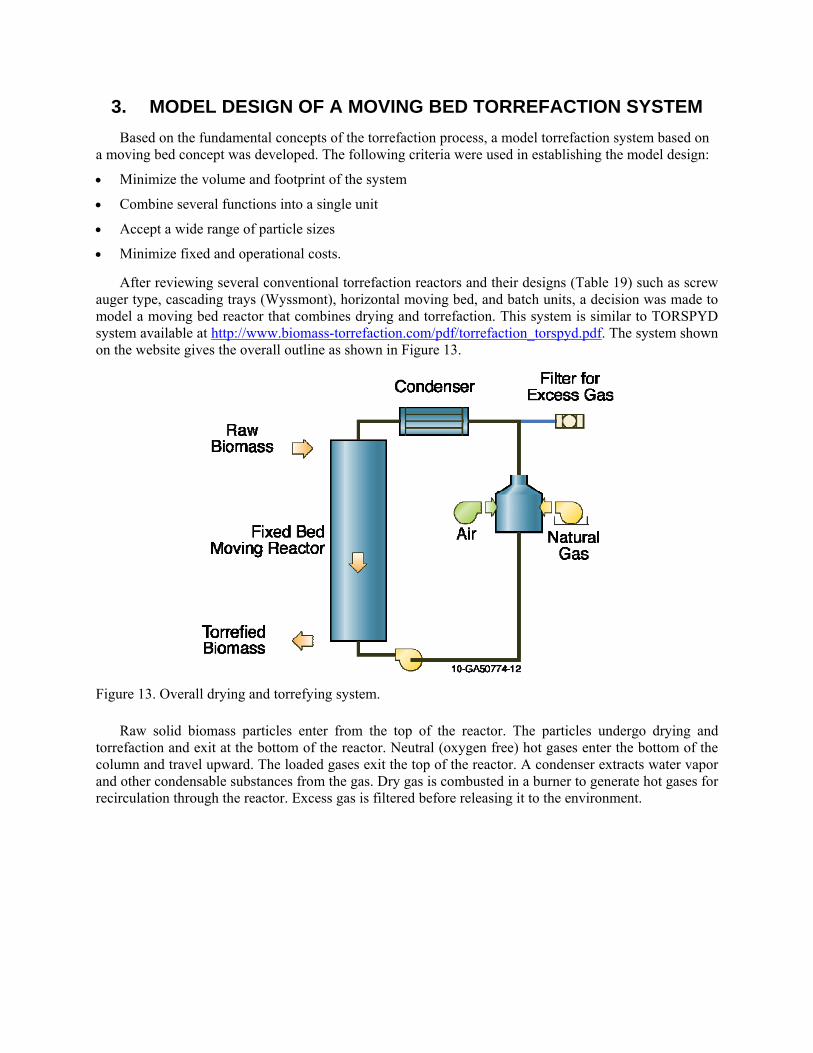
After reviewing several conventional torrefaction reactors and their designs (Table 19) such as screw auger type, cascading trays (Wyssmont), horizontal moving bed, and batch units, a decision was made to model a moving bed reactor that combines drying and torrefaction. This system is similar to TORSPYD system available at http://www.biomass-torrefaction.com/pdf/torrefaction_torspyd.pdf. The system shown on the website gives the overall outline as shown in Figure 13.
Figure 13. Overall drying and torrefying system.
Raw solid biomass particles enter from the top of the reactor. The particles undergo drying and torrefaction and exit at the bottom of the reactor. Neutral (oxygen free) hot gases enter the bottom of the column and travel upward. The loaded gases exit the top of the reactor. A condenser extracts water vapor and other condensable substances from the gas. Dry gas is combusted in a burner to generate hot gases for recirculation through the reactor. Excess gas is filtered before releasing it to the environment.
Wyssmont Turbo-dryer Rotating/multi-tray dryer with leveling (uniform residence time)
Direct 240–270 NO pilot plant Gramling S Carolina Operating Integro Earth Fuels
10 T/hr Roxboro N Carolina 2010 Integro Earth Fuels
3.1 Reactor
In the following sections, we describe procedures used to calculate the initial sizing of each subsystem within the reactor.
Figure 14 shows the preliminary configuration of the reactor. Biomass particles enter a hopper at the top of the reactor. The material is then passed through an airlock as it fills up the entire length of the column. The bottom of the reactor is a hopper leading to an airlock and a screw conveyor. The function of the screw conveyor is to cool the hot torrefied material to a temperature below its ignition temperature.
As the biomass travels down in the column, it goes through several treatments; heating, drying, heating, torrefying, and finally cooling through the screw conveyor. The reactor is divided into 5 distinct zones: (A) heating zone up to drying temperature, (B) drying zone, (C) heating zone up to torrefying temperature, (D) torrefying zone. The height of the reactor column is determined by the flow rate of the material and the material residence times in zones A, B, C, and D. The cooling zone E does not contribute to the length of the column and is dealt with separately.
3.1.1 Temperature Profile of Solid Material
Figure 15 and Figure 16 depict temperature and mass of solid materials as they pass through zones A, B, C, and D. The X-axis is the distance the material travels in each zone. The length of travel must be such that the material remains in that zone until the reaction is complete. Zone A is where the initial preheating takes place. In this zone the wet, cool, and raw biomass is heated to a temperature at which drying takes place. We assume that the moisture content of the material does not change until it reaches the drying temperature of 100°C. In Zone B, the temperature remains constant at 100°C while the material loses its moisture. In Zone C, the material’s temperature increases to the desired torrefaction temperature. At this temperature, the material will lose a fraction of its weight to volatiles. The total height of the reactor is the sum of distance the biomass travels while passing through zones A, B, C, and D. In the following sections, the methods used to estimate the distance or time for each zone is described.
Figure 14. INL moving bed torrefier reactor.
Figure 15. Different temperature zones in a torrefier.
Figure 16. Mass of biomass as it passes through the torrefier.
3.2 Design Calculations
3.2.1 Height of Torrefier for Different Zones
Zone A—Heating Zone up to Drying Temperature
It is assumed that in Zone A, the biomass temperature will rise from its initial temperature when it enters the zone to an equilibrium temperature with the air. The transfer of energy takes place through convection. It is also assumed that all of the material in Zone A has the same temperature. This is shown in Equation (1).
tCV
hS
eo
e eTT
TT
(1)
where T is temperature at time t, Te is equilibrium temperature, To is initial temperature, h is the average heat transfer coefficient (W/m2 °K), S is total surface area m2 of solid particles in the zone, is the bulk density (kg/m3) of material in Zone A, C is its specific heat of material (J/kg°K), and V is the volume of the zone (m3).
We can run an experiment with a bulk material in an oven and record temperatures versus time. For the material we can then estimate the value of the group with Equation (2):
1
CV
hS
(2)
where is a time constant for the materials. Typical values are given in Table 20.
Table 20. Example values used in Equation 1.
h S V C Te To T
W/(m2 °K) m2 m3 Decimal kg/m3 J/(kg K) °C °C °C
10 0.00208 0.0000032 0.5 150 2000 160 20 100
Surface area and volume are calculated for a particle with dimensions 4 mm × 20 mm × 40 mm.
39.0)60(1
)5.0/0000032.0)(2000)(150(
)00208.0)(10(
(1/minute) (3)
For temperature
43.016020
160100
TeTo
TeTTR
(4)
Heating time is calculated by
69.239.0/)43.0( Lnt minutes (5)
The required heat to raise the temperature of the biomass is
TCmQ pph (6)
Zone B—Drying Zone
In Zone B the biomass loses its weight by moisture evaporation. Drying temperature remains constant. Similar to the heating zone, the moisture transfer equation can be expressed by Equation (7).
nkt
o
e eMeM
MM
(7)
where M, Me, and Mo are moisture content at time t, equilibrium, and initial moisture content. k is the drying constant for the material. Constant n is an exponent that improves the performance of the drying. For wood chips,
76.2)T/1(2200)k(Ln (8)
where T is in Kelvin (273 + temp °C) and k is the drying constant in 1/min.
Typical values are given in Table 20. All moisture contents are decimal fractions of the dry mass.
15.1t09.0e0.075.0
0.010.0
(9)
where 8.13t
Other values used in these calculations are in Table 21.
Table 21. Sample values used in Equation 7.
k n M Me M0
1/min – Dry basis Dry basis Dry basis kg/m3
0.09 1.15 0.10 0.0 0.75 150
Zone C—Heating Zone up to Torrefaction Temperature
In Zone C, the dried material’s temperature rises to torrefying temperature, 250°C. The heating process is similar to the heating process in Zone A, shown in Equation (10):
tVpC
hS
fo
fe
TT
TT
(10)
where T is temperature at time t, Tf is equilibrium temperature at which the torrefaction reaction takes place, To is the initial temperature, h is the average heat transfer coefficient (W/m2.K), S is total surface area of solid particles in the zone, is the bulk density of material in Zone C, Cp is its specific heat, and V is the volume of the zone.
We can run an experiment with a bulk material in an oven and record temperatures versus time. For the material we can then estimate the value of the group, using Equation (11) (Table 22):
1
pVC
hS
(11)
Table 22. Sample values used in Equation 11.
h S V C Te To T
W/(m2 K) m2 m3 kg/m3 J/(kg °K) °C °C °C
15 0.00208 0.0000032 150 2000 300 150 250
Surface area and volume are calculated for a particle with dimensions 4 mm × 20 mm × 40 mm.
975.0)60(1
)5.0/0000032.0)(2000)(150(
)00208.0)(15(
(1/minute) (12)
For temperature
33.0300150
300250
TeTo
TeTTR
(13)
Heating time is calculated by
13.1975.0/)33.0(Lnt (14)
where t is time in minutes.
Zone D—Torrefaction
The torrefaction process is similar to the drying process where the material goes through a breakdown of the constituents, resulting in loss of volatiles. In Zone D, the biomass loses its weight through the breakdown of chemical constituents and loss of volatiles. We assume torrefaction temperature remains constant during this process. Similar to Zone B, the loss of volatiles will follow Equation (15).
nkt
o
e emem
mm
(15)
where m, me, and mo are the mass concentration of volatiles at time t, equilibrium, and initial volatile content. k is the mass loss constant for the material. For wood chips,
RT
EexpAk (16)
The values of A, E, and R are listed in Table 23. T is in Kelvin (273 + temp °C) and k is the drying constant in 1/min. Typical values are given in the Table 24. All moisture contents are decimal fractions of the dry mass.
Table 23. Constants for the reaction kinetics of Equation 16.
Species A E R
Pine 2.64 77.080 8.3144
Fir 3.01 88.760 8.3144
Pine bark 2.72 44.410 8.3144
Mix Spruce, Pine, Fir (SPF) 2.30 76.680 8.3144
Table 24. Sample values for use in Equations 14 and 15.
K (pine) n m me mo T
1/min – Dry basis Dry basis Dry basis kg/m3 °C
0.09 1.0 0.10 0.0 0.35 150 250
Bulk Density
The bulk density of the biomass changes as it goes through drying and torrefaction stages (Table 25). We can write the bulk density as a function of its constituents as shown in Equation (17).
ssX
v
v
w
w XX
1 (17)
where is the bulk density and X is the mass fraction of the constituents. Subscripts w, v, and s are for water, volatiles (substances before becoming volatile), and solid.
Table 25. Densities and mass fractions based on Equation 17.
w v s Xw Xv Xs
kg/m3 kg/m3 kg/m3 kg/kg kg/kg kg/kg kg/m3
1000 150 250 0.25 0.35 0.40 293
The sum of mass fractions equals 1
1XXX svw (18)
or
wsv X1XX (19)
We assume (20)
sv XX
2wX1
sX (21)
3.2.2 Height of the Truncated Cone
Figure 17. Shape of truncated cone.
A=1.13 m2
V2=0.226 m3
V1= 2.274 m3
Height of the torrefaction region: V1/A=2.012 m
In these calculations we assume that the ratio of the height of the torrefier over the diameter is around 5.
Total height of the torrefaction reactor: Zone A + Zone B + Zone C + Zone D.
3.2.3 Gas Flow Rate
1. Calculation of gas
2. Calculation of Nitrogen
3. Heat balance
Equations Governing the Flow of Gas and Material in Packed Bed
A packed bed is a cylindrical column filled with a suitable packaging material. The gas is admitted at the bottom and flows upward. From a fluid mechanical perspective, the most important issues are that the pressure drop required for the gas to flow through the column at a specified flow rate and the frictional factor. To calculate the frictional factor, the Ergum equation is commonly employed.
(22)
(23)
(24)
(25)
(26)
fgpppp hwmTCmQ ))((
)( outina HHmW
outinout HHH
Wma
500
TC
Qm
p
pa
TCmQ paa
38
3.3 Excel Calculation Sheet Developed for Torrefaction System Height, Heat Load, Gas Flow, Pressure Drop, and Blower Capacity
38
38
38
38
38
44
4. CONCLUSIONS 1. Torrefied biomass in general defines a group of products resulting from the partially controlled and
isothermal pyrolysis of biomass occurring at a temperature range of 200–300°C.
2. The common torrefaction reactions include (a) devolatilization and carbonization of hemicelluloses and (b) depolymerization and devolatilization of lignin and cellulose.
3. Torrefaction reduces the variability in biomass feedstocks and helps to develop a uniform feedstock with consistent physical, chemical, and biochemical composition.
4. Torrefaction of biomass improves:
a. Physical properties like grindability and pelletability, thereby increasing energy density
b. Ultimate and proximate composition by increasing the carbon content and calorific value and decreasing the moisture and oxygen content
c. Biochemical composition by decomposing the hemicelluloses and softening the lignin, resulting in better binding during pelletization.
5. Densification of torrefied material at 225°C reduces the energy consumption and increases the throughput by a factor of two.
6. During torrefaction, the biomass loses most of the low energy content of the material (a) solids, which include original sugar structures and other newly formed polymeric structures; (b) liquids, which are condensables like water organics and lipids, and (c) gases like CO and CO2.
7. Off-gas emissions from a torrefied biomass during storage are less when compared to raw biomass.
8. Torrefied biomass, being hydrophobic, does not absorb moisture from the environment and remains stable for long storage times.
9. Torrefied biomass has a wider range of application, especially when densified and used in power generation plants along with coal.
5. COMPONENTS LIST FOR MOVING PACKED BED TORREFIER 1. Reactor: Hopper, Air lock in-feed, Gas exit port, Air lock out-feed, Conveyor screw, Cooling jacket,
Gas inlet conveyor, Insulation, Heating jacket, and Sampling ports for gases and solids
2. Heat exchanger (1): Cooling gas and condensation.
3. Oxidizer
4. Heat exchanger (2): preheating (heat from oxidizer)
5. Blower
6. Heat exchanger (3): preheating (heat from out feed cooling)
7. Holding tank for in-feed
8. Conveyor for in-feed in
9. Conveyor for out-feed
10. Holding tank for out-feed
11. Instrumentation: Data logging for temperature, Data logging for pressure, and Micro GC Off-gas sampling
Control: Temperature controls and Gas flow controls
44
6. EXPERIMENTAL DATA REQUIRED TO SUPPORT THE DESIGN ASPECTS
1. Bulk density of the wood chips at different moisture contents
2. Specific density of wood chips at different moisture contents
3. Rate of heating
4. Moisture loss from the biomass at different drying temperatures
5. Drying rate data at different moisture contents
6. Rate of moisture and volatiles loss during torrefaction.
44
7. REFERENCES Arias BR, CG Pevida, JD Fermoso, MG Plaza, FG Rubiera, and JJ Pis Martinez (2008) “Influence of
Torrefaction on the Grindability and Reactivity of Woody Biomass,” Fuel Processing Technology, 89:2, pp. 169–175.
Bergman PCA, AR Boersma, JHA Kiel, MJ Prins, KJ Ptasinski, FJJG Janssen (2005) Torrefied Biomass for Entrained-flow Gasification of Biomass, Report ECN-C--05-026.
Bergman PCA, AR Boersma, RWH Zwart, JHA Kiel (2005a) Torrefaction for Biomass Co-firing in Existing Coal-fired Power Stations, ECN-C--05-013.
Bergman PCA and JHA Kiel (2005) “Torrefaction for Biomass Upgrading,” Published at 14th European Biomass Conference & Exhibition, Paris, France, October 17–21, 2005.
Bergman PCA (2005) Combined Torrefaction and Pelletisation: The TOP Process, ECN-C--05-073.
Bourgois J and R Guyonnet (1988) “Characterization and Analysis of Torrefied Wood,” Wood Science and Technology, 22:2, pp. 143–155.
Bourgois JP and J Doat (1984) “Torrefied Wood from Temperate and Tropical Species: Advantages and Prospects,” In Bioenergy 84, Goteborg, Sweden, June 15–21, 1984, Elsevier Applied Science Publishers, 153–159.
Bridgeman TG, JM Jones, I Shield, and PT Williams (2008) “Torrefaction of Reed Canary Grass, Wheat Straw and Willow to Enhance Solid Fuel Qualities and Combustion Properties,” Fuel, 87:6, pp. 844–856.
Demirbas A (2009) “Pyrolysis Mechanisms of Biomass Materials,” Energy Sources, Part A: Recovery, Utilization, and Environmental Effects, 31:13, pp. 1186–1193.
Deng J, G Wang, J Kuang, Y Zhang, and Y Luo (2009) “Pretreatment of Agricultural Residues for Co-gasification via Torrefaction,” Journal of Analytical and Applied Pyrolysis, 86:2, pp. 331–337.
Dufour A, P Girods, E Masson, S Normand, Y Rogaume, and A Zoulalian (2007) “Comparison of Two Methods of Measuring Wood Pyrolysis Tar,” Journal of Chromatography A, 1164:1–2, pp. 240–247.
Fonseca Felfli F, CA Luengo, G Bezzon, and P Beaton Soler (1998) “Bench Unit for Biomass Residues Torrefaction,” Proceedings of Conference on Biomass for Energy and Industry, Würzburg, Germany, June 8–11, 1998.
Hakkou M, M Pétrissans, P Gérardin, and A Zoulalian (2006) “Investigation of the Reasons for Fungal Durability of Heat-treated Beech wood,” Polymer Degradation and Stability, 91:2, pp. 393–397.
IEA Bioenergy, Task 34 Leader: Doug Elliott, Pyrolysis of biomass, www.pyne.co.uk, published 2010, Web page visited June, 2010.
Kavalov B and SD Peteves (2005) “Status and Perspectives of Biomass-to-Liquid Fuels in the European Union,” European Commission—DG JRC, Institute for Energy, Petten, The Netherlands, 92-894-9784-X.
Kiel J (2007) “Torrefaction for Biomass Upgrading into Commodity Fuels,” IEA Bioenergy Task 32 workshop on “Fuel storage, Handling and Preparation and System Analysis for Biomass Combustion Technologies”, Berlin, May 7, 2007.
Koukios EG (1993) Progress in thermochemical, solid state refining of Biofuels: from research to commercialization. Adv. Thermochmeical Biomass Conversion, 2.
44
Kuang X, JS Tumuluru, XT Bi, CJ Lim, S Sokhansanj, and S Melin (2009) “Rate and Peak Concentrations of Off-Gas Emissions in Stored Wood Pellets—Sensitivities to Temperature, Relative Humidity, and Headspace Volume,” Annals of Occupational Hygiene (In Press).
Lehtikangas P (1999) Quality Properties of Fuel Pellets From Forest Biomass, Licentiate Thesis, University of Agricultural Sciences, Uppsala, Sweden.
Lipinsky ES, JR Arcate, and TB Reed (2002) “Enhanced wood fuels via torrefaction,” Fuel Chemistry Division Preprints, 47:1, pp. 408–410.
Mani S (2009) “Integrating Biomass Torrefaction with Thermo-chemical Conversion Processes,” Proceedings of the 2009 AIChE Annual Meeting, Nashville, Tennessee, Nov 8–13, 2009.
Mitchell P, J Kiel, B Livingston, and G Dupont-Roc (2007) “Torrefied Biomass: A Foresighting Study into the Business Case for Pellets from Torrefied Biomass as a New Solid Fuel,” All Energy, May 24, 2007.
Mohan D, CU Pittman, and PH Steele (2006) “Pyrolysis of Wood/Biomass for Bio‐oil: A Critical Review,” Energy & Fuels, 20:3, pp. 848–889.
Murphy JD and K McCarthy (2005) “Ethanol Production from Energy Crops and Wastes for Use as a Transport Fuel in Ireland,” Applied Energy, 82:2, pp. 148–166.
Oliveria Rodrigues T and PLA Rousset (2009) “Effects of Torrefaction on Energy Properties of Eucalyptus Grandis Wood,” Cerne, 15:4, pp. 446–452.
Pach M, R Zanzi, and E Björnbom (2002) “Torrefied Biomass a Substitute for Wood and Charcoal,” In Sixth Asia-Pacific International Symposium on Combustion and Energy Utilization, Kuala Lumpur, May 20–22, 2002.
Pastorova I, PW Arisz, and JJ Boon (1993) “Preservation of D-Glucose Oligosaccharides in Cellulose Chars,” Carbohydrate Research, 248, pp. 151–165.
Pentananunt R, ANM Mizanur Rahman, and SC Bhattacharya (1990) “Upgrading of Biomass by Means of Torrefaction,” Energy, 15:12, pp. 1175–1179.
Prins MJ (2005) “Thermodynamic Analysis of Biomass Gasification and Torrefaction,” Thesis submitted to Eindhoven: Technische Universiteit Eindhoven, 2005.
Prins MJ, KJ Ptasinski, and FJJG Janssen (2006a) “Torrefaction of Wood: Part 2. Analysis of Products,” Journal of Analytical and Applied Pyrolysis, 77:1, pp. 35–40.
Prins MJ, KJ Ptasinski, and FJJG Janssen (2006) “Torrefaction of Wood: Part 1. Weight Loss Kinetics,” Journal of Analytical and Applied Pyrolysis, 77:1, pp. 28–34.
Prins MJ, KJ Ptasinski, and FJJG Janssen (2006a) “More Efficient Biomass Gasification via Torrefaction,” Energy 31:15, pp. 3458–3470.
Reed T, and B Bryant (1978) Densified biomass a new form of solid fuel. Solar Energy Research Institute, US Department of Energy, Division of Solar Technology.
Sadaka S, and S Negi (2009) “Improvements of Biomass Physical and Thermochemical Characteristics via Torrefaction Process,” Environmental Progress & Sustainable Energy, 28:3, pp. 427–434.
Shafizedeh F (1985) “Pyrolytic Reactions and Products of Biomass,” RP Overend, TA Milne, LK Mudge (eds.), Fundamentals of Biomass Thermochemical Conversion, Elsevier: London, pp. 183–217.
Shaw M (2008) Feedstock and Process Variables Influencing Biomass Densification, Ph.D. Thesis, University of Saskatchewan, Saskatoon, Saskatchewan, Canada.
Solo ML (1965) Mattalorest, Aikakawsh, 37, 127.
44
Tumuluru JS, K Xingya, S Sokhansanj, LC Jim, T Bi, and S Melin (2008) “Effect of Storage Temperature on Off-gassing and Physical Properties of Wood Pellets,” ASABE, Providence, Rhode Island, June 29–July 2, 2008, ASABE Paper No. 084248.
United Nations (UN), Kyoto Protocol to the United Nations Framework convention on Climate Change, 1998.
Uslu A, APC Faaij, and PCA Bergman (2008) “Pre-treatment Technologies, and Their Effect on International Bioenergy Supply Chain Logistics. Techno-economic Evaluation of Torrefaction, Fast Pyrolysis and Pelletisation,” Energy 33:8, pp. 1206–1223.
Van Soest PJ (1964) “Symposium on Nutrition and Forage and Pastures: New Chemical Procedures for Evaluating Forages,” Journal of Animal Science, 23, pp. 838–845.
White RH and MA Dietenberger (2001) “Wood Products: Thermal Degradation and Fire,” KH Jürgen Buschow, RW Cahn, MC Flemings, B Ilschner, EJ Kramer, S Mahajan, and P Veyssière (eds.), The Encyclopedia of Materials: Science and Technology, Elsevier, Ltd.: Amsterdam, pp. 9712–9716.
Williams PT, and S Besler (1996) “The Influence of Temperature and Heating Rate on the Slow Pyrolysis of Biomass,” Renewable Energy, 7:3, pp. 233–250.
Wooten JB, B Crosby, and MR Hajaligol (2000) “Evaluation of Cellulose Char Structure Monitored by 13C CP MAS NMR,” Fuel Chemistry Division Preprints, 46, pp. 191–193.
Yan W, JT Hastings, TC Acharjee, CJ Coronella, and VR Váasquez (2010) “Mass and Energy Balances of Wet Torrefaction of Lignocellulosic Biomass,” Energy Fuels (In press).
Zanzi R, DT Ferro, A Torres, PB Soler, and E Bjornbom (2002) “Biomass torrefaction,” In The 6th Asia-Pacific International Symposium on Combustion and Energy Utilization, Kuala Lumpur, May 20–22, 2002.