Table of Contents A.Individual Contributions Breakdown.......................................................................................3 B. Summary of Changes............................................................................................................4 1. Customer Statement of Requirement...................................................................................5 a) Problem Statement…............................................................................................................5 b) Glossary of Terms.................................................................................................................9 3. System Requirements…………………………………………….……………………....................................11 a) Enumerated Functional Requirements………………….…………………………………..…………………..11 b) Enumerated Non-Functional Requirements………….…………………………….….……………………..13 c) On-Screen Appearance Requirements………………….…………………………..….……………………….13 d) Acceptance Tests………………………………………………….…………………………….………………………...15 4) Functional Requirements Specifications..............................................................................18 a) Stakeholders.......................................................................................................................18 b) Actors and Goals.................................................................................................................18 c) Use Cases............................................................................................................................19 d) System Sequence Diagrams................................................................................................28 e) Use Case System Sequence Diagrams……….………………………………………………………………….......…....30
5. Effort Estimation using use case Points.............................................................................41 5.1 Unadjusted Use case Points.............................................................................................41 5.2 Technical Complexity Factor............................................................................................45 5.3 Environmental Complexity Factor……………………………………………………………………………….........47 5.4 Calculating the Use Case Points........................................................................................... 48 5.5 Deriving Project Duration from Use-Case Points...................................................................48 6. Domain Analysis..………………………………………………………………………………………………….………50 a)Domain Model……………………………………..……………………………………………………………….………50 b)System Operation Contracts…………………………………………………………………………………..……..59 7. Interaction diagrams………………………………………………………………………………………………………..…………62
8. Class Diagram and Interface Specification……………………………………………………………………….…………71
8.1 Class Diagram…………………………………………………………………………………………………………….…..…………71
8.2 Data Types and Operation Signature………………………………………………………………………..…………..72
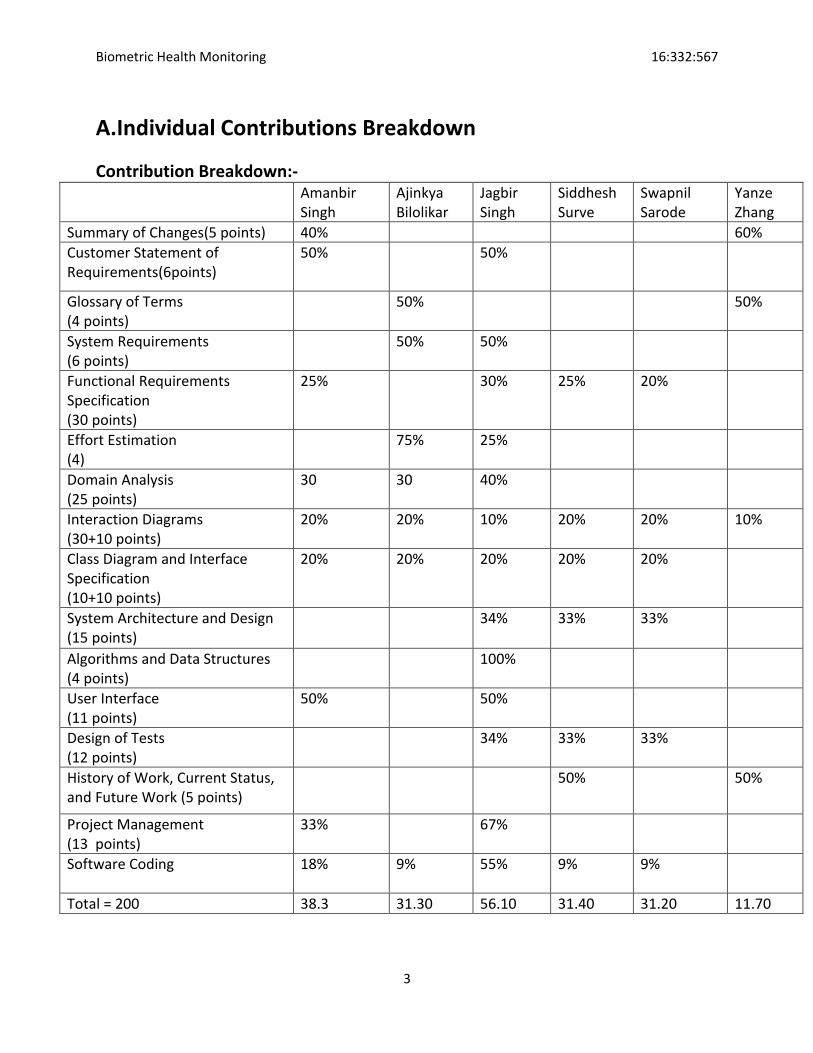
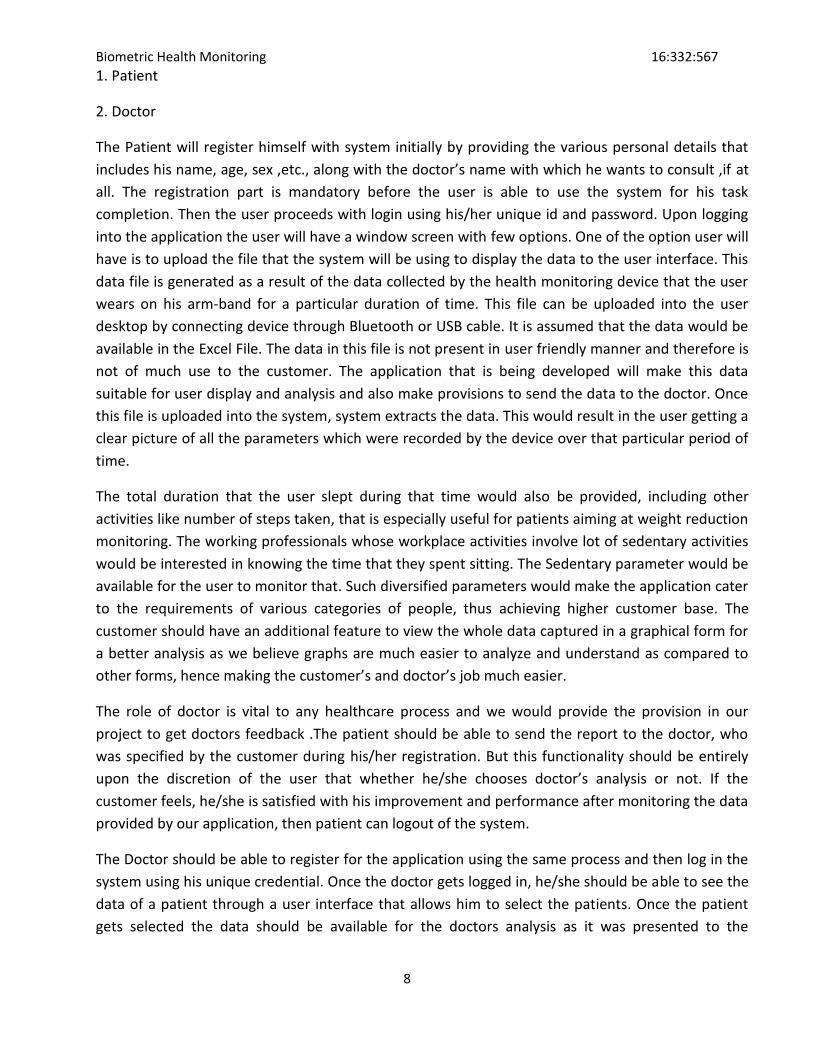
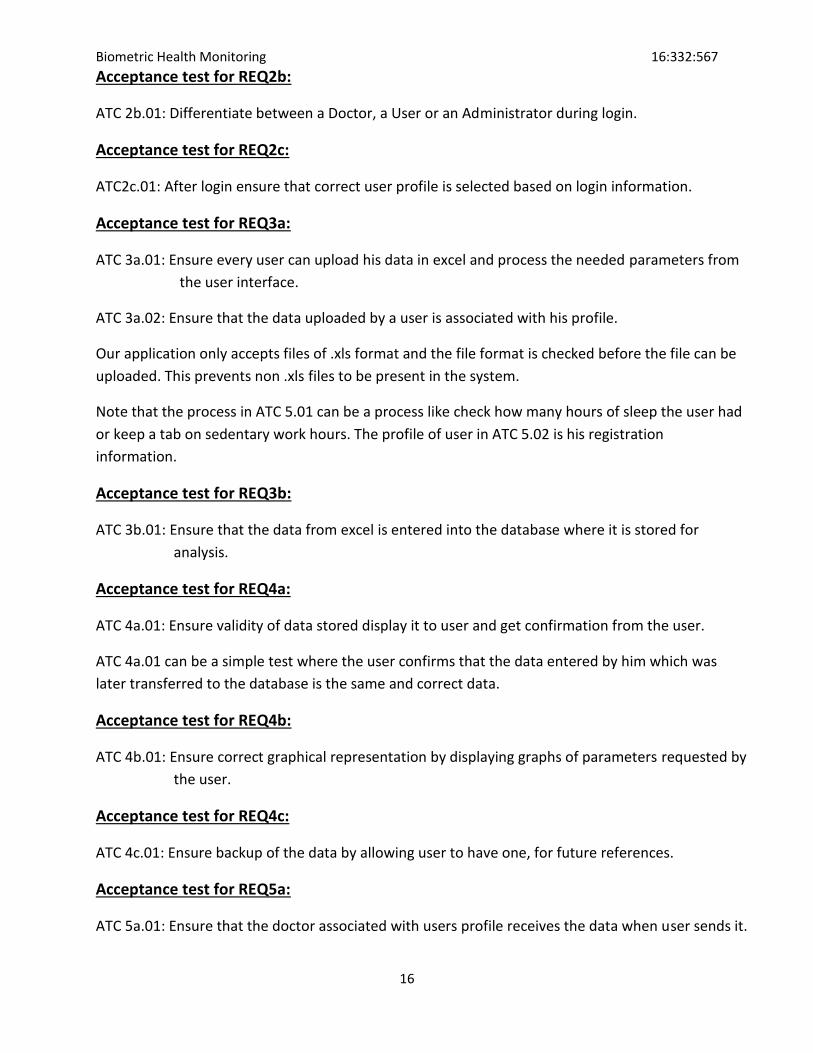
Class Diagram and Interface Specification (10+10 points)
20% 20% 20% 20% 20%
System Architecture and Design (15 points)
34% 33% 33%
Algorithms and Data Structures (4 points)
100%
User Interface (11 points)
50% 50%
Design of Tests (12 points)
34% 33% 33%
History of Work, Current Status, and Future Work (5 points)
50% 50%
Project Management (13 points)
33% 67%
Software Coding
18% 9% 55% 9% 9%
Total = 200 38.3 31.30 56.10 31.40 31.20 11.70
Biometric Health Monitoring 16:332:567
4
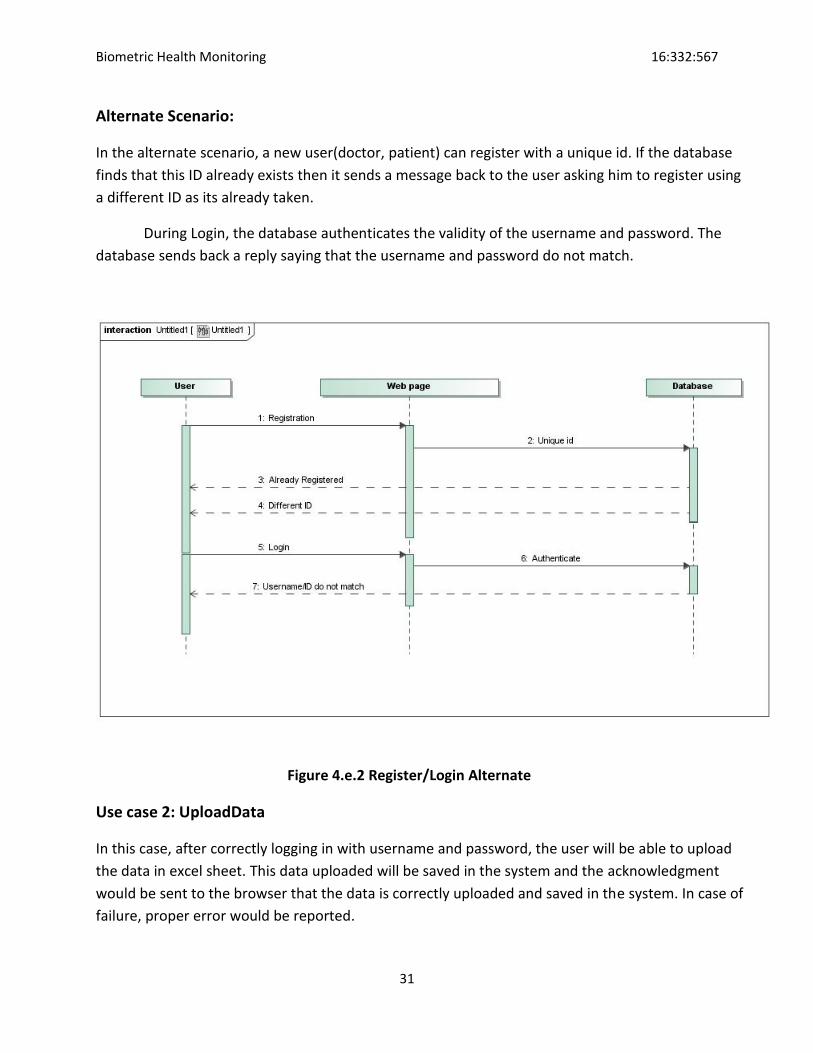
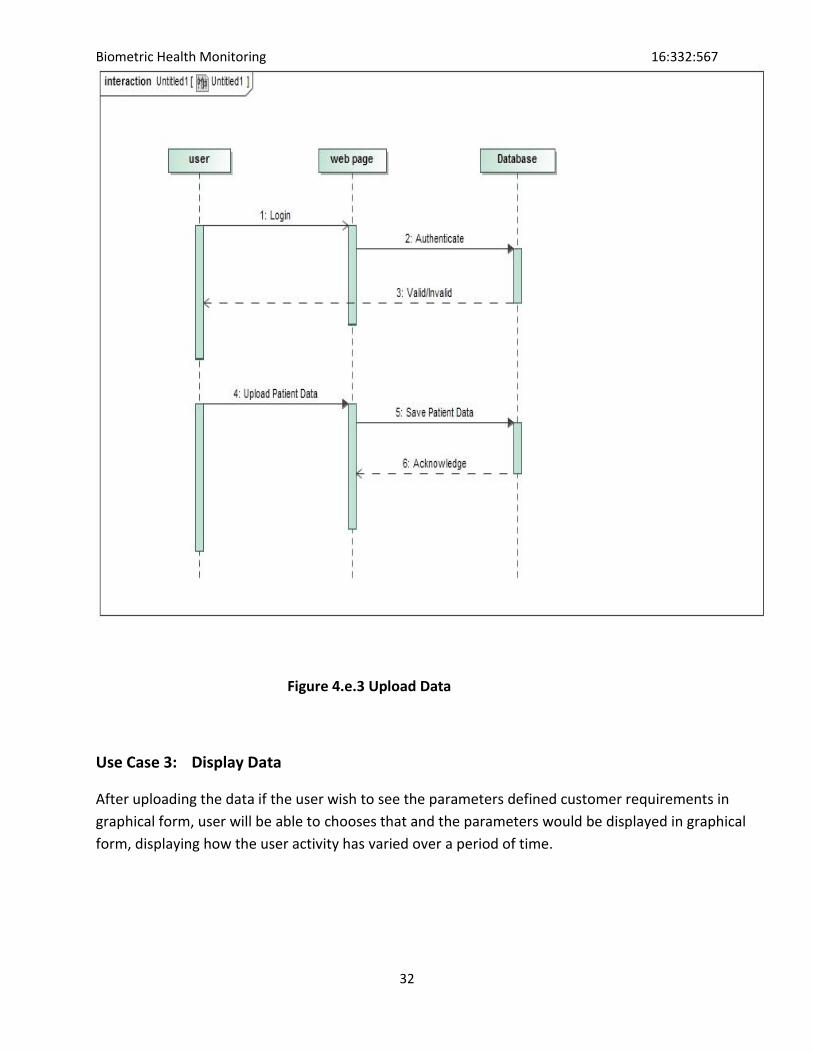
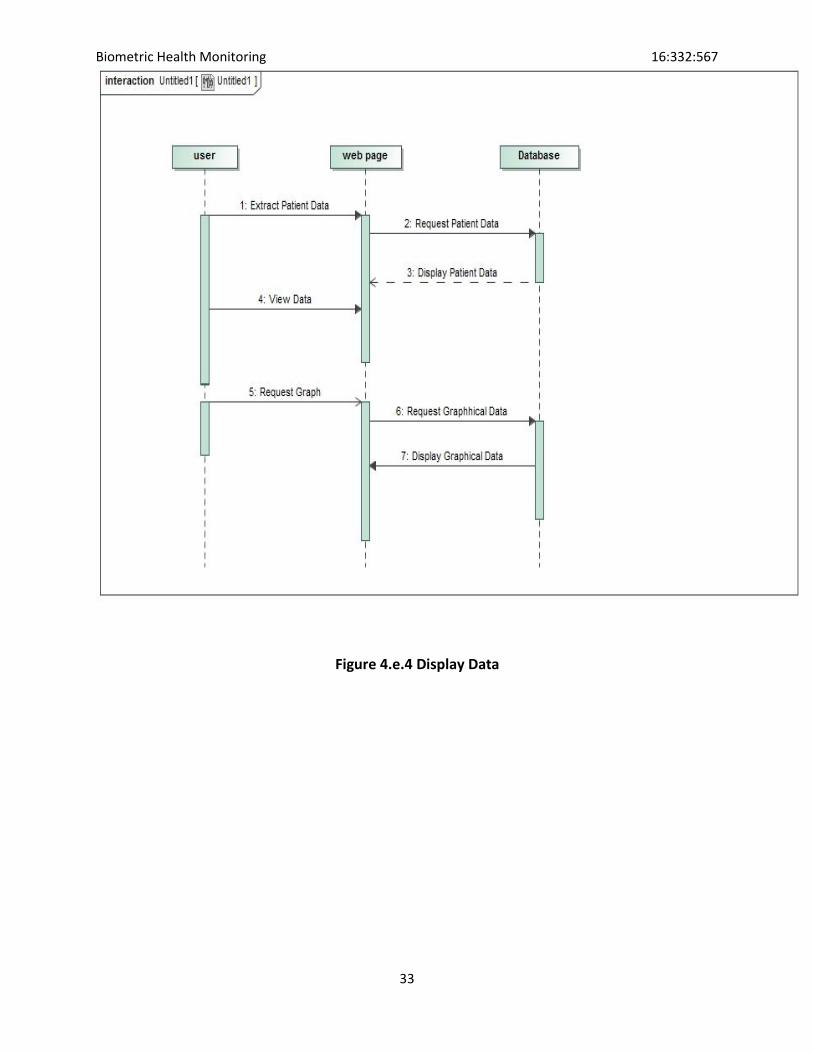
B. Summary of Changes
Revisions Full REPORT:
In Problem statement page 7, we have included a section of graphical data which gives description of all
the graphs.
In requirements on page 11, we replaced the req 9 because it was not used in our project.
We have also added a line of highest priority requirement of 3a on page 11.
In acceptance test on page 14 and 15, we have added additional details in req 1a, req2a and req 5b.
Traceability Matrix: Updated the traceability matrix, now also including the weights.
We have added Object Constrained Language (OCL) Contract Specifications.
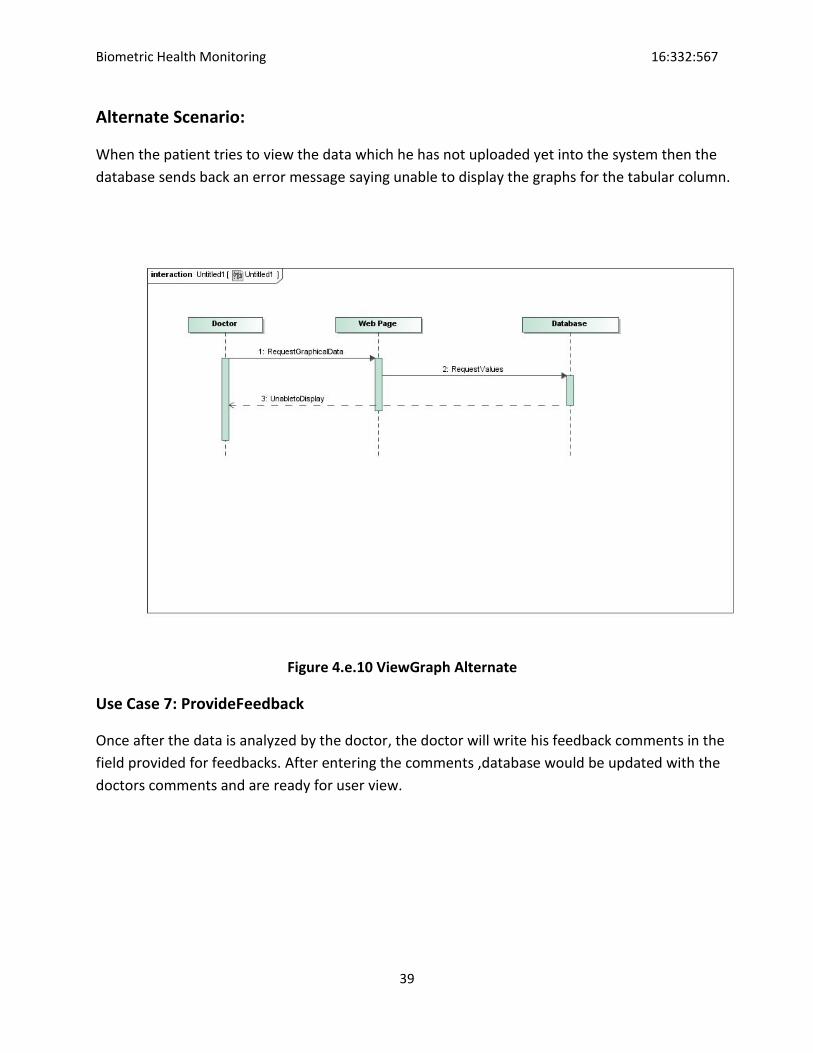
System Sequence Diagram: Provided with an alternative scenario for the use cases along with the original
success scenario and added names to every diagrams.
We have included a new section of effort estimation using use case points on page 39.
In interaction diagrams we added the names which were missing for the use cases.
In class diagram on page 80, we updated and changed the diagram and added user interface class and
changed the traceability matrix.
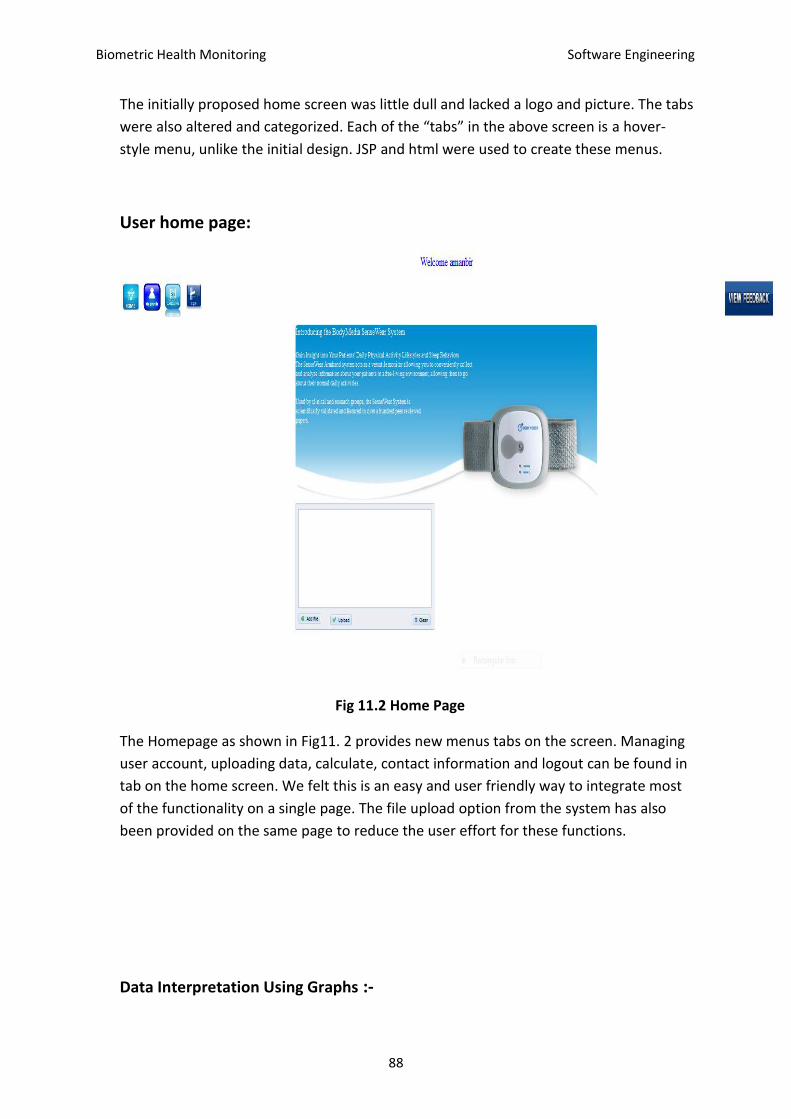
In user interface we have added the details of how every tab on the screen and added
various details about types of graphs.
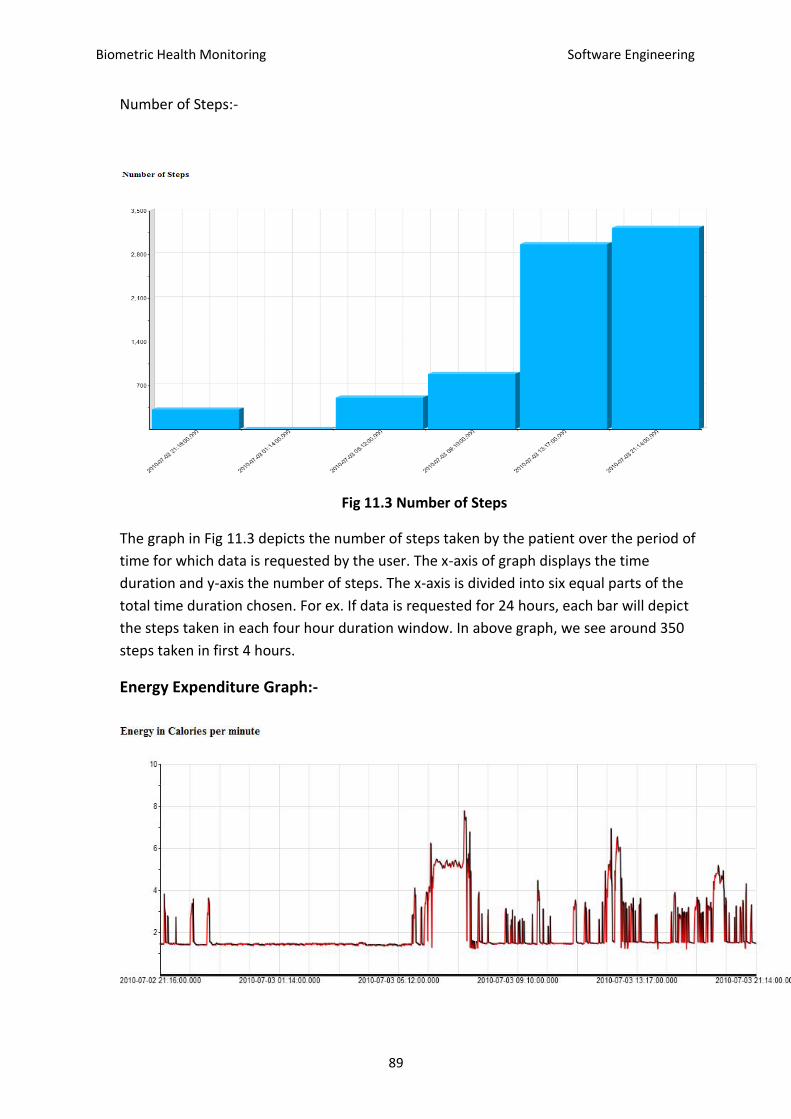
In design of tests we have provided examples of the tests performed for very case.
We have updated the plan of work and added the diagram from Microsoft project.
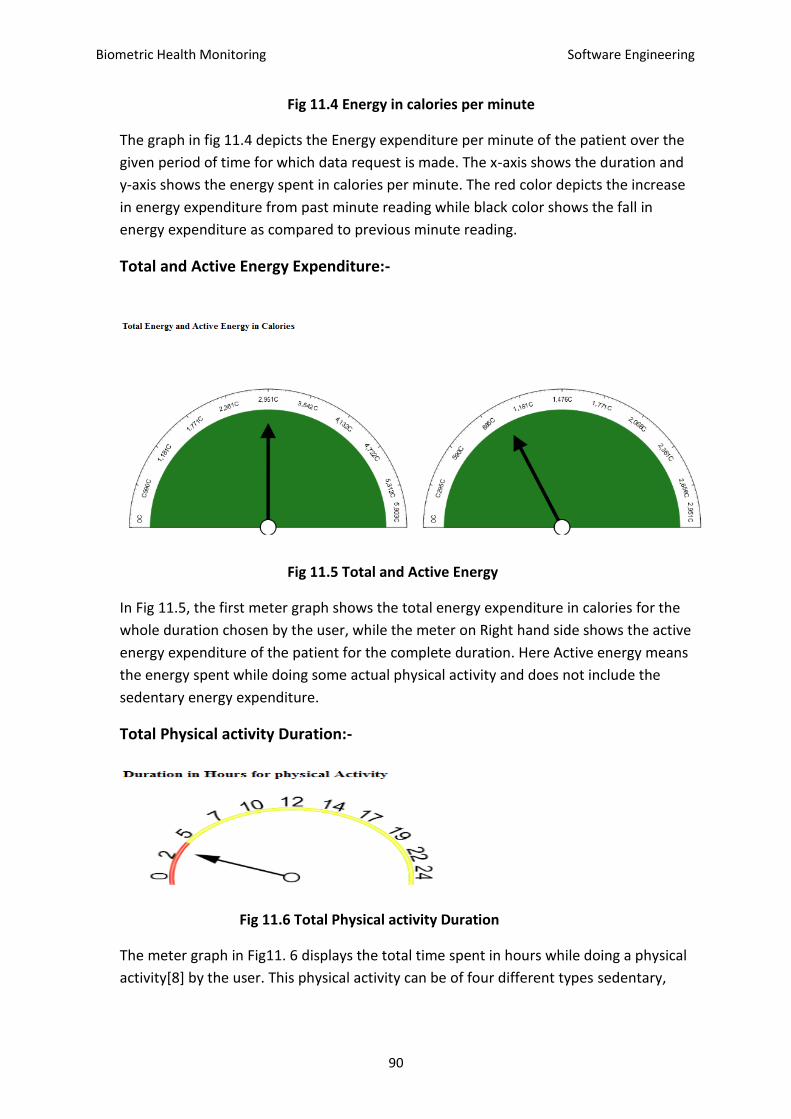
We have updated the references in the last section.
Biometric Health Monitoring 16:332:567
5
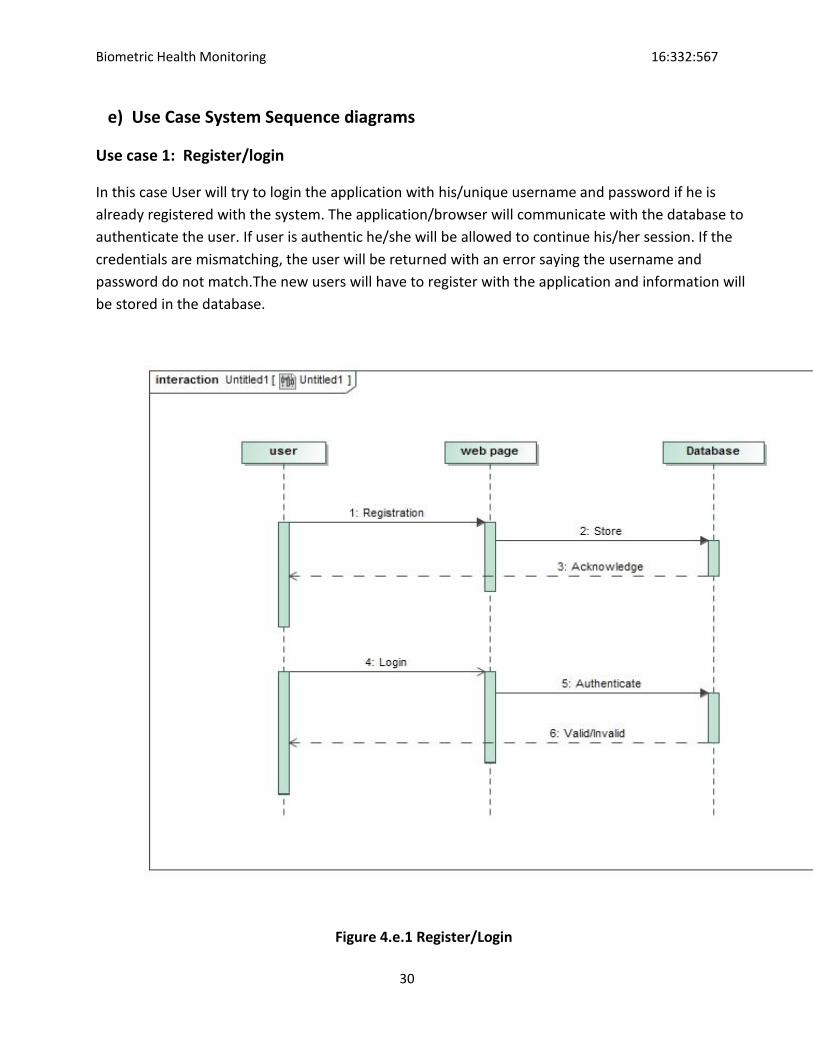
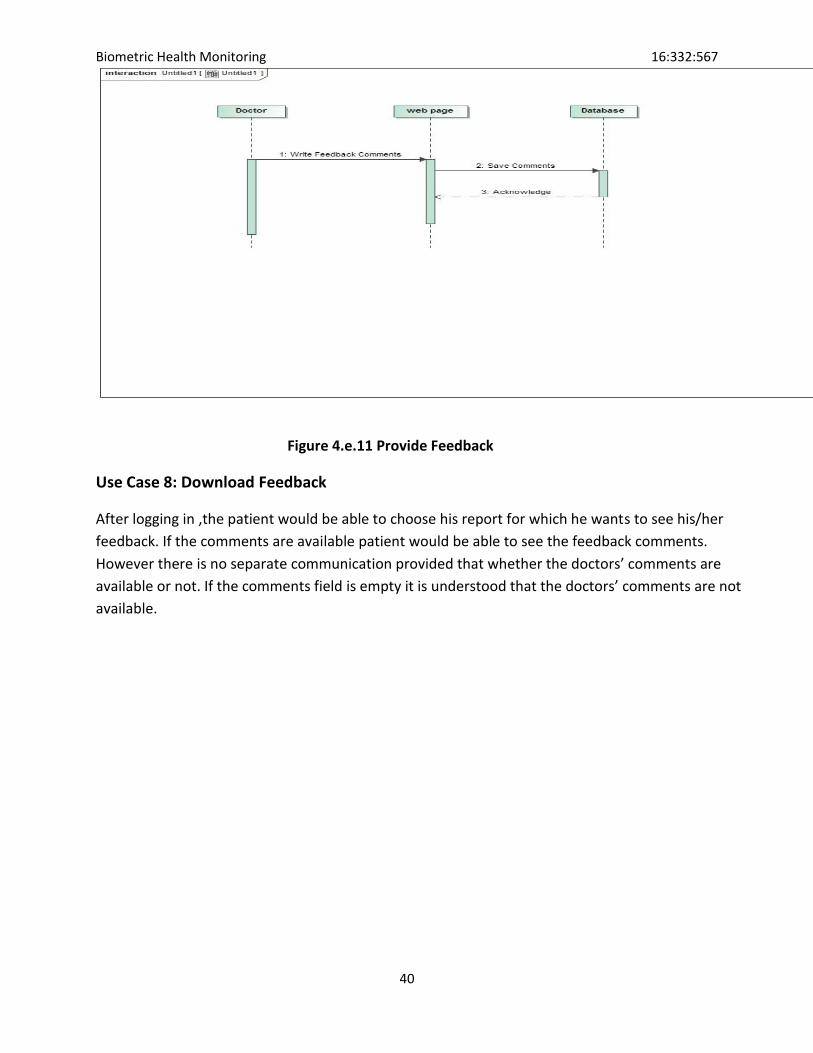
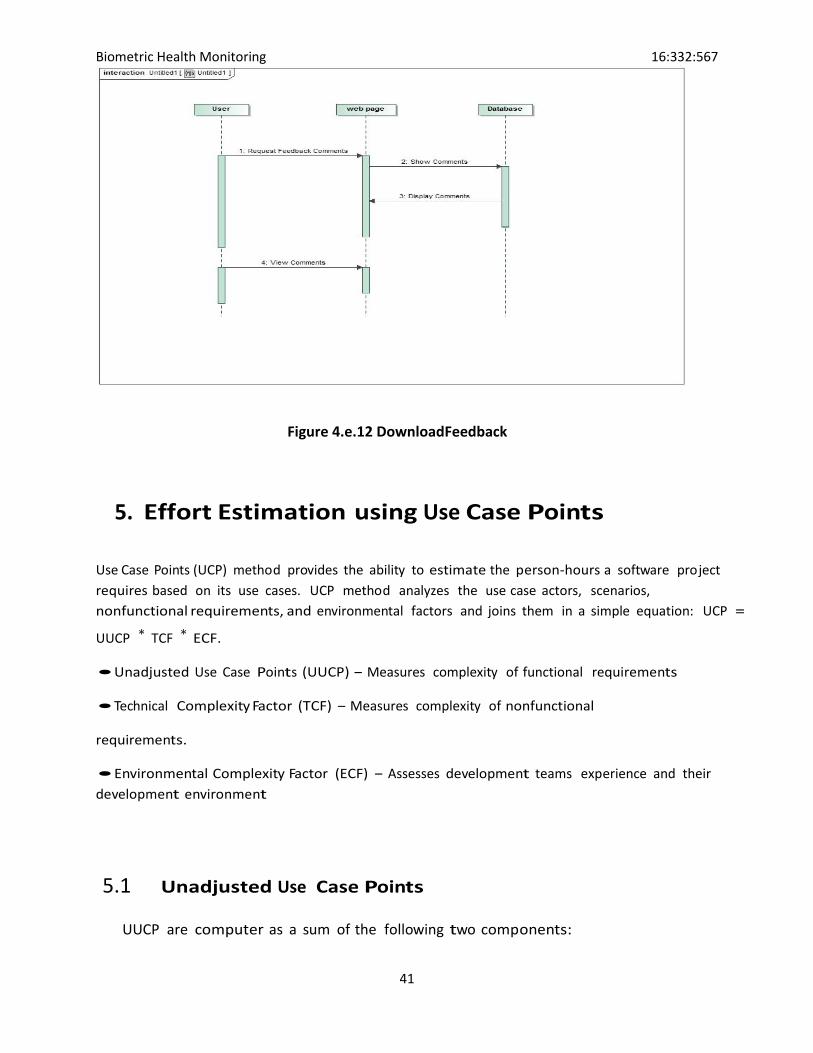
1. Customer Statement of Requirements a) Problem Statement
Biometrics devices can take unique information about you from your eye, or your hand prints, or
your thumb prints and use it to identify you. This information can be used to obtain the valuable
healthcare information. The personal health monitoring of each individual is considered very
important because of rise in health problems in today's world. The increasing stressful lifestyle is
taking maximum toll on the public health. With the ever increasing queues at hospitals and ever
increasing number of patients, the doctor fees have sky-rocketed which is affecting especially those
patients who cannot afford the fee or who are not suffering from major ailments but get to know so
only after paying a hefty fee to the doctor. The researchers and surveys often demonstrate that
most of the major health ailments are the result of careless attitude towards the minor health
ailments. Majority of these issues can be solved by just following a good diet, proper sleep pattern
and regular exercising. But how does a patient know what diet is good or what exercise he/she
should follow and more importantly whether the plan that he is following is working effectively for
him. The absence of such a mechanism makes the task of patient a difficulty, thus landing him with
an option either to go to the doctor that means heavy fee or ignore the ailment that is more
dangerous.
Moreover the increase in patients has also led to the decrease in the relative number of doctors per
patient which results in vicious cycle where ignored or delayed diagnostics of an ailment makes the
patient more dependent on doctor’s check-up. But is it necessary that every time the user faces
some issue or requires advice, that are not that serious, like somebody wants to get rid of some
extra fat or somebody wants to improve his/her stamina, he/she is required to go to doctor?
Well, though it is advisable to visit the doctor whenever possible, but as discussed above if due to
unavailability of specialist due to some reason, the Health Monitoring Devices offer and effective
alternative. These days it is advisable to each individual to monitor and maintain good health by
using biometric health monitoring devices and keep modifying their diet so as to improve their
health stats. Thus there is a need for software that utilizes the data available from the device,
uploads it to the website, gets feedback from the doctors via internet and show health reports.
Doctor should be able to get data anytime he wants for analysis.
The biometric health devices can record the various data like metabolism rate, sleep hour,
sedentary activity while being in contact with the user and this data from user can be used by
physicians to recommend any changes to user’s routine. Our project attempts to use the
information obtained using such devices to give the detailed analysis of health of a
patient/individual that can help in getting a prompt and timely advice from a doctor. Currently
healthcare monitoring is extensively doctor depending .Our System is basically designed for those
customers who can self-monitor their health indicators to check the progress that they are making
Biometric Health Monitoring 16:332:567
6
through a diet plan change or exercise routine modification. An option will also be provided to
customer to send the report to the doctor for expert advice in case the customer feels he/she is not
completely satisfied by the diet routine, sleep hours or any other general habit he is acquiring.
Different types of health indicators would be used for the analysis.
Assumption:-
1. The User already possesses a biometric health device that would be used to record
the health parameter. These recorded parameters are internal to the device and
using our application software user would be provided with some real time user
friendly parameters that are defined under parameters sections and these
parameters would be displayed on user screen upon request.
2. This device need to be worn by the user/patient on his arm for a particular duration
of time, for which he wants his health parameters to be monitored.
3. User would be able to connect this device to his/her PC and would be able to
generate the excel sheet in agreed format using the device software, this excel would
be kept in user machine and application developed by our team will process data in
this excel once after uploading it.
Device Operation:-
The device used during this project is The Sense Wear Armband[6][7]. The user will be wearing this
device for some period of time. This device contains sensors that collect the body movements of the
user and record data based on those body movements and body temperature and sweating to
provide information about what type of activity user is doing. Details of device monitoring are given
below:-
Motion: The Armband contains an accelerometer, a device that measures motion. Steps: The Armband counts your steps, using the accelerometer to measure the distinct
patterns created by walking and/or running. Galvanic Skin Response: This measures the electrical conductivity of the skin, which changes
in response to sweat and emotional stimuli.[8][6] Skin Temperature: A sensitive electronic thermometer measures the temperature of the
skin. Heat Flux: Measures the amount of heat dissipating from the body.[17]
Once the user has worn the device and he/she wishes to get his activity log over a period of time
using some more real-life parameters, user can connect this device to his Personal computer and
Biometric Health Monitoring 16:332:567
7
the device software(the software internal to the device and not this project software) will provide
user with an excel file that would contain the information recorded by the device. This information
contained in the excel would be used by our application to display the parameter explained later in
this text.
Once the user has the generated this excel, the user would log into his account on our application
and reach his/her homepage. User will have an option to upload this excel and once the excel is
uploaded to proceed with the execution to process the information. Once the processing is done the
user will be provided with the information mentioned in next section.
Parameters provided :-
1. Total energy Expenditure: - This field will display the total no. of calories burned by
the user over a period of time.The vigorous activities would lead to faster rate of
burning and this rate would be depicted better through the graphical repersentation.
2. No. of Steps : - Total no. of steps taken by the user over the window period of
wearing the device.
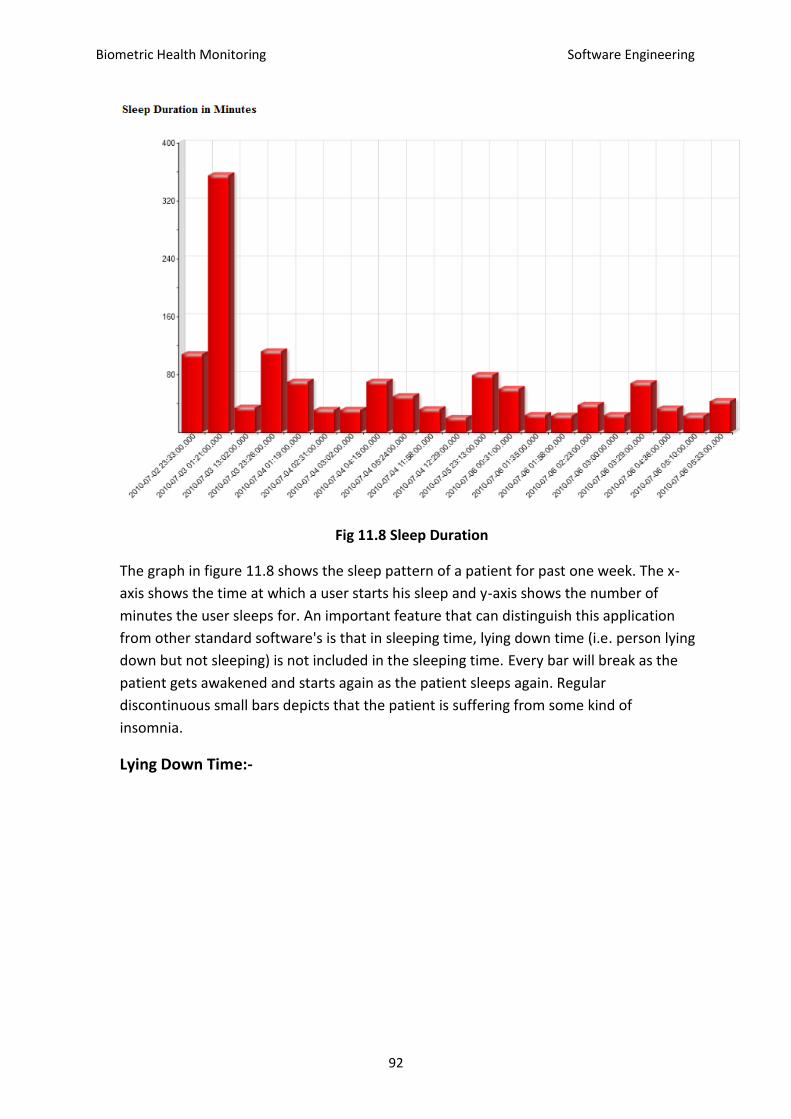
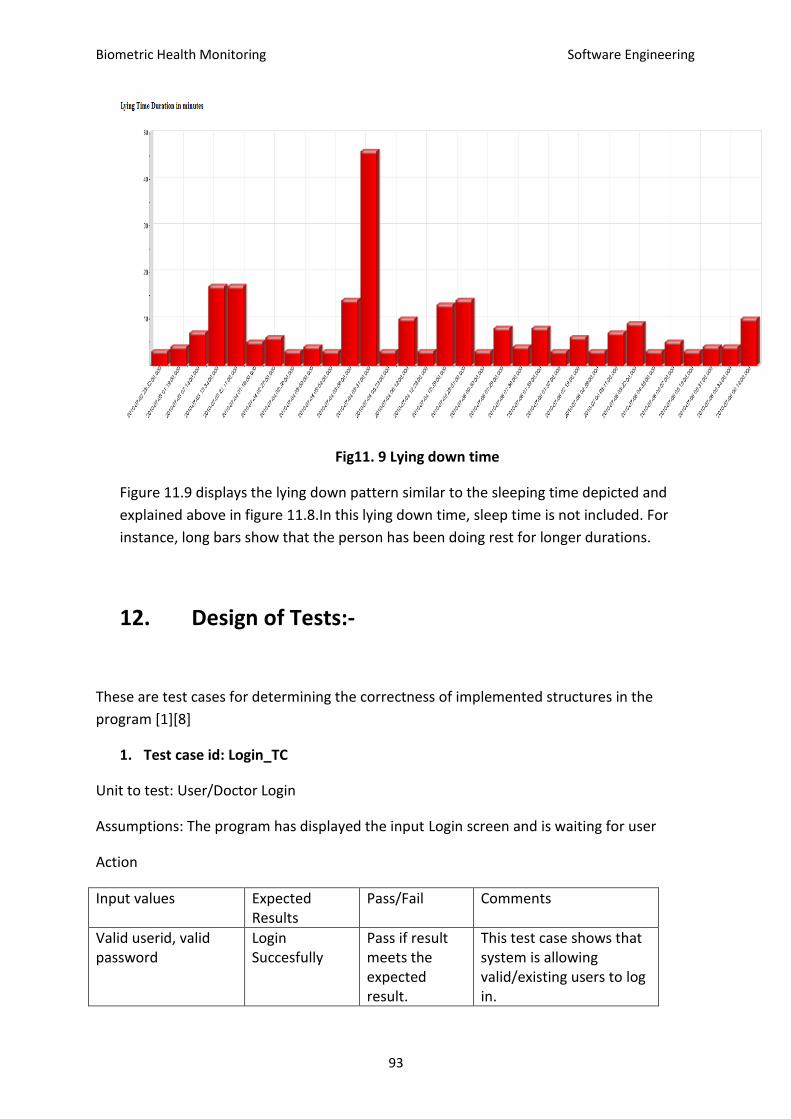
3. Lying Down Time: -Total no. hours the user has spent lying down.This time will also
include the sleeping time
4. Sleeping time: - The total time that user has spent while sleeping.
5. Sedentary: - The total time spent while sitting by the user.
6. Physical Activity Duration: - The total time for which the user performed the physical
activity over a period of time. Any activity with 3 MET(see glossary) would be
considered as Physical Activity.
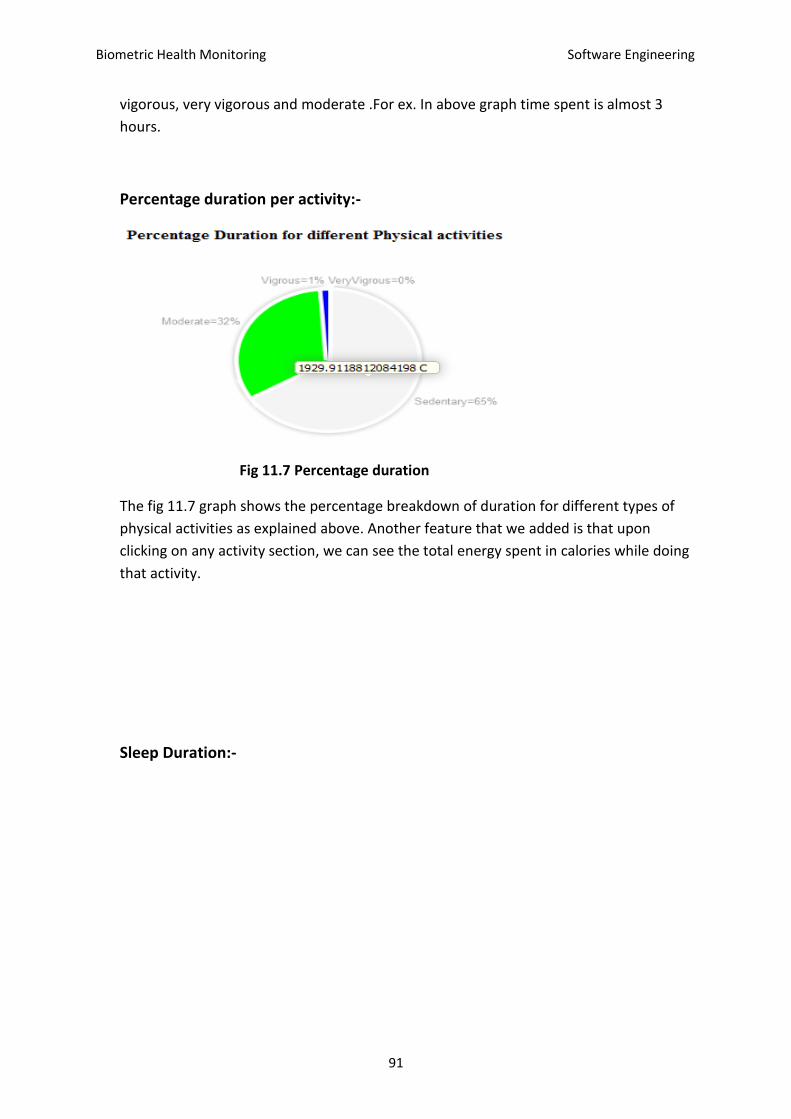
Graphical Data:- For making the system more user friendly to all the users, the above data would be
shown with the help of different meters and graphs. We believe it would prove very useful to the
doctor especially while providing the feedback about the health condition of a Patient. It is planned
to employ the three major graphs Bar Graph, Line graph and Meter Graph.
The System will basically consists of three different users that would be interacting with the aim of
providing better healthcare service through mutual utilization of self-monitoring and the
consultation from a specialist. The mutual interaction exists because user will have the option of
sending the data for analysis to the doctor, getting the feedback and then acting on his advice. The
three users are:-
Biometric Health Monitoring 16:332:567
8
1. Patient
2. Doctor
The Patient will register himself with system initially by providing the various personal details that
includes his name, age, sex ,etc., along with the doctor’s name with which he wants to consult ,if at
all. The registration part is mandatory before the user is able to use the system for his task
completion. Then the user proceeds with login using his/her unique id and password. Upon logging
into the application the user will have a window screen with few options. One of the option user will
have is to upload the file that the system will be using to display the data to the user interface. This
data file is generated as a result of the data collected by the health monitoring device that the user
wears on his arm-band for a particular duration of time. This file can be uploaded into the user
desktop by connecting device through Bluetooth or USB cable. It is assumed that the data would be
available in the Excel File. The data in this file is not present in user friendly manner and therefore is
not of much use to the customer. The application that is being developed will make this data
suitable for user display and analysis and also make provisions to send the data to the doctor. Once
this file is uploaded into the system, system extracts the data. This would result in the user getting a
clear picture of all the parameters which were recorded by the device over that particular period of
time.
The total duration that the user slept during that time would also be provided, including other
activities like number of steps taken, that is especially useful for patients aiming at weight reduction
monitoring. The working professionals whose workplace activities involve lot of sedentary activities
would be interested in knowing the time that they spent sitting. The Sedentary parameter would be
available for the user to monitor that. Such diversified parameters would make the application cater
to the requirements of various categories of people, thus achieving higher customer base. The
customer should have an additional feature to view the whole data captured in a graphical form for
a better analysis as we believe graphs are much easier to analyze and understand as compared to
other forms, hence making the customer’s and doctor’s job much easier.
The role of doctor is vital to any healthcare process and we would provide the provision in our
project to get doctors feedback .The patient should be able to send the report to the doctor, who
was specified by the customer during his/her registration. But this functionality should be entirely
upon the discretion of the user that whether he/she chooses doctor’s analysis or not. If the
customer feels, he/she is satisfied with his improvement and performance after monitoring the data
provided by our application, then patient can logout of the system.
The Doctor should be able to register for the application using the same process and then log in the
system using his unique credential. Once the doctor gets logged in, he/she should be able to see the
data of a patient through a user interface that allows him to select the patients. Once the patient
gets selected the data should be available for the doctors analysis as it was presented to the
Biometric Health Monitoring 16:332:567
9
customer, with the exception that doctor should be able to add his/her comments or feedback after
seeing the details of the patient thus issuing his/her advice. It must be noted that the data available
for monitoring should not be editable either by the patient or the doctor. Once the doctor’s
feedback is posted, user/patient would be able to see that once after logging into his account.
Doctor Analysis and Feedback:- The doctor would analyze the parameter mentioned in above
specific to particular patient. Doctor would take into consideration the information of patient
medical history maintained in patients profile during the registration of patient.
For Ex.:- A patient is suffering from obesity and is undergoing process to reduce his/her weight, the
doctor would check the weight from user profile and compare the amount of physical activity that
user is undergoing. Based on whether the patient is doing enough or less, doctor can suggest his/her
advice. For this doctor would be provided a field in his profile and after checking the user data he/she
would be able to enter the prescription/advice in that field and send to the user. This would provide
for an efficient and productive communication between the patient and doctor.
The designed application will be extremely user friendly since the users can be of any age. Simplicity
in presenting the application to the user will be the key to success of this system.
2. GLOSSARY OF TERMS:
User- A person who wants to upload his personal health information on the web site.
Doctor- A person who monitors the health information of the user and provides feedback to the
user.
Database – Entity that stores all the system’s information.
Website – An interface that the user and doctor can use to register, and upload or download the
health information.
Graph- A graph is an abstract representation of a set of objects where some pairs of the objects are
connected by links.
Report- A report is a textual data of the user’s health made with the specific intention of relaying
information or recounting certain events in a widely presentable form.
Acknowledgement- A feedback given by the doctor to the user to make changes in his/hers diet.
Software application- An application is computer software designed to help the user to perform
specific tasks which manage and integrate a computer's capabilities.
Biometric Health Monitoring 16:332:567
10
Web Server- a server is a physical computer dedicated to running one or more services to serve the
needs of the users of other computers on the network.
Unique ID- Identification is a process whereby the subject assimilates an aspect, property, or
attribute of the other and is transformed, wholly or partially, after the model other provides.
Diet- the sum of the food consumed by an organism or group.
Heart Beat- Heart rate is the number of heartbeats per unit of time, typically expressed as beats per
minute (bpm).
Energy Expenditure- It refers to the amount of energy (calories), that a person uses to breathe,
circulate blood, digest food, and be physically active.
Number of Steps- It is the total number of steps travelled by the user to cover a particular distance.
Threshold- A limiting value of a parameter below which the health of the user gets degraded.
MET : - The Metabolic Equivalent of Task (MET), or simply metabolic equivalent, is a physiological measure
expressing the energy cost of physical activities and is defined as the ratio of metabolic rate (and therefore
the rate of energy consumption) during a specific physical activity to a reference metabolic rate[8].
Biometric Health Monitoring 16:332:567
11
3. System Requirements
a) Enumerated Functional Requirement
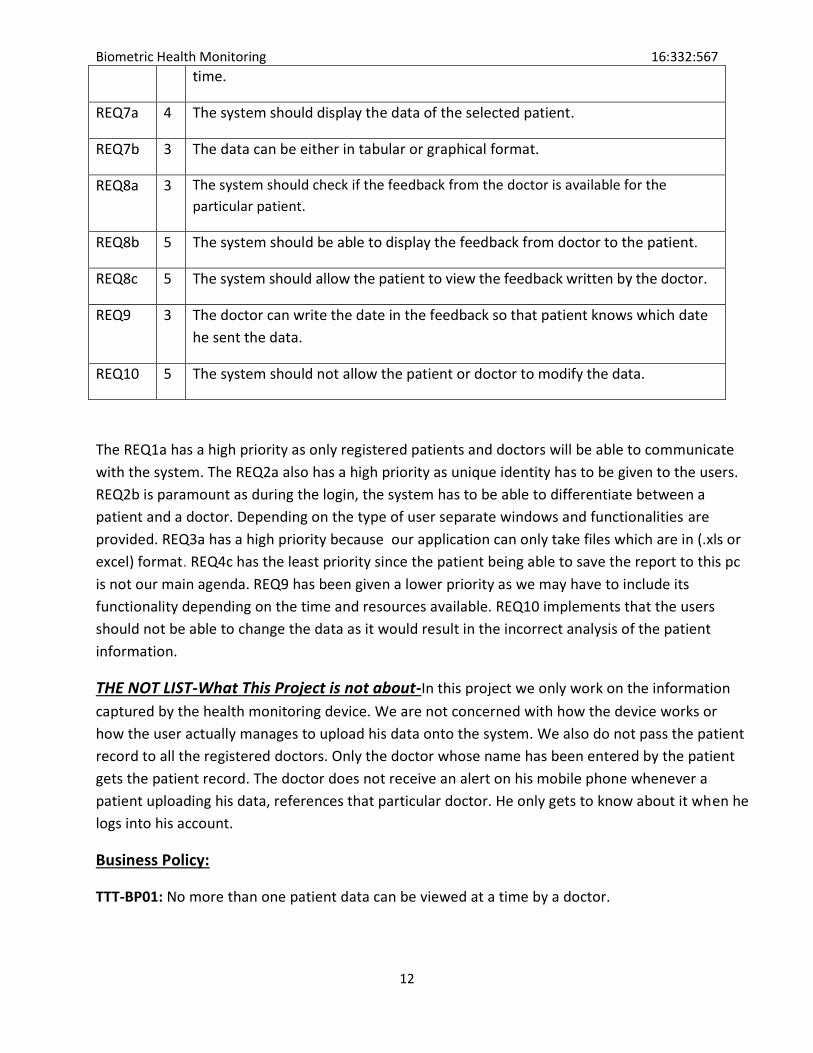
The functional requirements are tabulated below [1]
REQ1a 5 The system shall allow new users to register an account on the website.
REQ1b 5 The doctor and the patient have to register themselves with the administrator.
REQ2a 5 The system should provide a specific Login ID to every Registered user and
doctor.
REQ2b 5 The system should be able to differentiate between the user's and doctors while
login.
REQ2c 4 The system shall identify the user based on his login ID and Password.
REQ3a 5 The system should be able to upload the data in excel form using a user
interface upon user request and process it.
REQ3b 4 The system should be able to convert the rawdata from excel and store it in the
database.
REQ4a 2 The system should be able to display the data to the user in a tabular form. This
data would include energy expenditure, metabolic rate, sleeprate, etc.
REQ4b 2 On user request the System should be able to display the graphs
corresponding to data displayed in the REQ7.
REQ4c 1 The system should provide the user with the option to save the data on his PC.
REQ5a 4 The system should send the data to the doctor.
REQ5b 3 The user should provide the doctor name he wishes to send the data to during
registration.
REQ6a 5 The system should display the list of all the user's mapped to a particular doctor.
REQ6b 5 The system shall allow the patient data to be received by only one doctor to
avoid conflict of feedbacks from doctors.
REQ6c 5 The system shall allow the doctor to view only one patient data at one point of
Biometric Health Monitoring 16:332:567
12
time.
REQ7a 4 The system should display the data of the selected patient.
REQ7b 3 The data can be either in tabular or graphical format.
REQ8a 3 The system should check if the feedback from the doctor is available for the
particular patient.
REQ8b 5 The system should be able to display the feedback from doctor to the patient.
REQ8c 5 The system should allow the patient to view the feedback written by the doctor.
REQ9 3 The doctor can write the date in the feedback so that patient knows which date
he sent the data.
REQ10 5 The system should not allow the patient or doctor to modify the data.
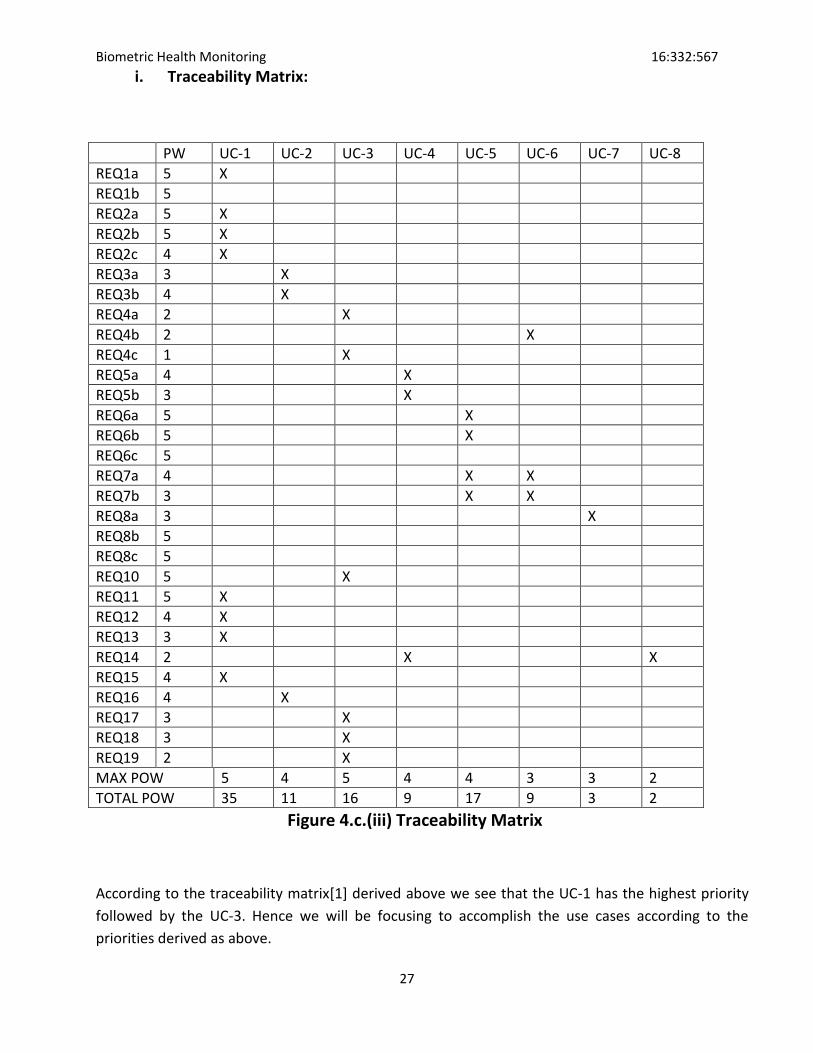
The REQ1a has a high priority as only registered patients and doctors will be able to communicate
with the system. The REQ2a also has a high priority as unique identity has to be given to the users.
REQ2b is paramount as during the login, the system has to be able to differentiate between a
patient and a doctor. Depending on the type of user separate windows and functionalities are
provided. REQ3a has a high priority because our application can only take files which are in (.xls or
excel) format. REQ4c has the least priority since the patient being able to save the report to this pc
is not our main agenda. REQ9 has been given a lower priority as we may have to include its
functionality depending on the time and resources available. REQ10 implements that the users
should not be able to change the data as it would result in the incorrect analysis of the patient
information.
THE NOT LIST-What This Project is not about-In this project we only work on the information
captured by the health monitoring device. We are not concerned with how the device works or
how the user actually manages to upload his data onto the system. We also do not pass the patient
record to all the registered doctors. Only the doctor whose name has been entered by the patient
gets the patient record. The doctor does not receive an alert on his mobile phone whenever a
patient uploading his data, references that particular doctor. He only gets to know about it when he
logs into his account.
Business Policy:
TTT-BP01: No more than one patient data can be viewed at a time by a doctor.
Biometric Health Monitoring 16:332:567
13
While the doctor is viewing a patient’s record, he must not be allowed to open another patient’s
record. Only after the doctor has given his feedback for the current patient can he access the next
patient’s record.
TTT-BP02: The patient can view the feedback only after the doctor uploads it.
If the doctor still has not prescribed his medication then the patient should see “no comments
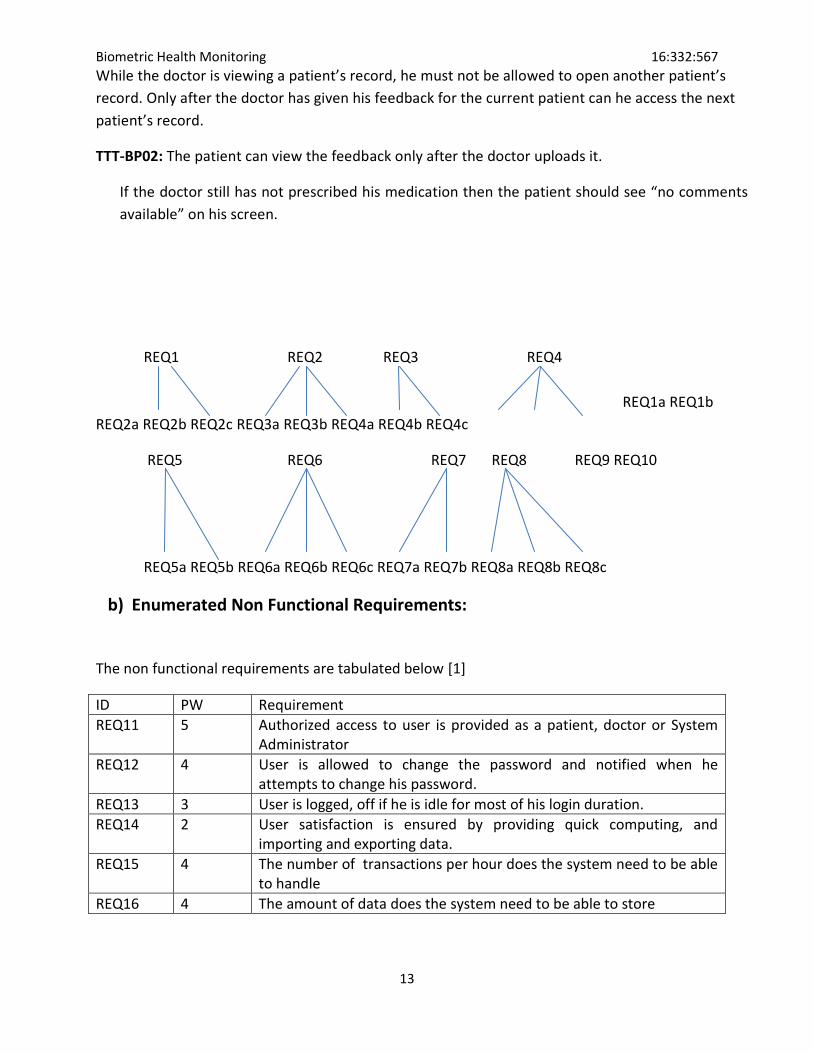
The non functional requirements are tabulated below [1]
ID PW Requirement
REQ11 5 Authorized access to user is provided as a patient, doctor or System Administrator
REQ12 4 User is allowed to change the password and notified when he attempts to change his password.
REQ13 3 User is logged, off if he is idle for most of his login duration.
REQ14 2 User satisfaction is ensured by providing quick computing, and importing and exporting data.
REQ15 4 The number of transactions per hour does the system need to be able to handle
REQ16 4 The amount of data does the system need to be able to store
Biometric Health Monitoring 16:332:567
14
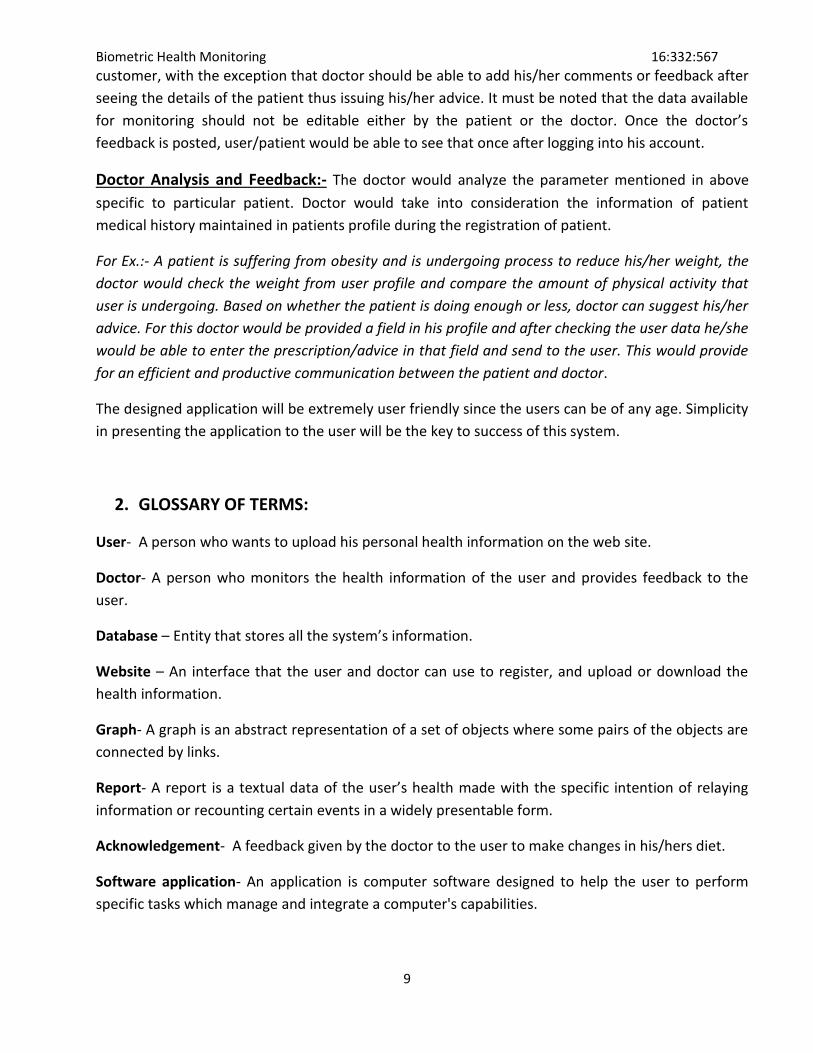
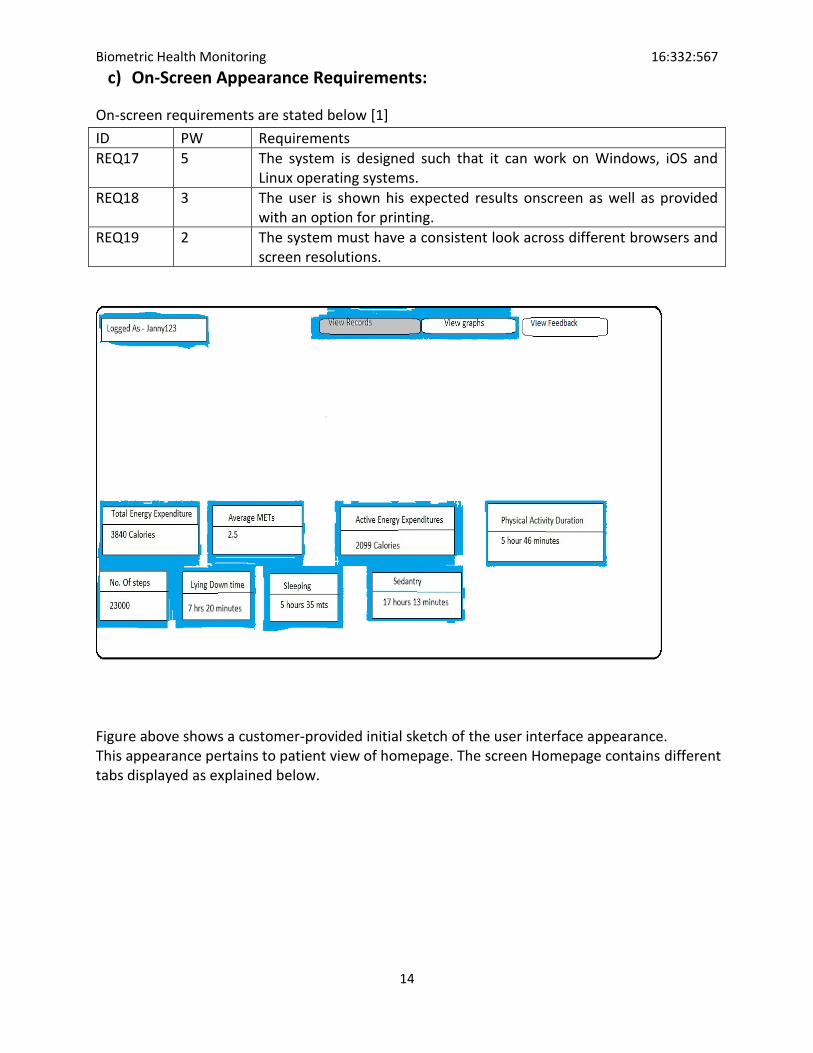
c) On-Screen Appearance Requirements:
On-screen requirements are stated below [1]
ID PW Requirements
REQ17 5 The system is designed such that it can work on Windows, iOS and Linux operating systems.
REQ18 3 The user is shown his expected results onscreen as well as provided with an option for printing.
REQ19 2 The system must have a consistent look across different browsers and screen resolutions.
Figure above shows a customer-provided initial sketch of the user interface appearance. This appearance pertains to patient view of homepage. The screen Homepage contains different tabs displayed as explained below.
Biometric Health Monitoring 16:332:567
15
Tabs:-
1. View Records : - This tab will enable the user to see the records in tabular
form. This is also the default view and the records would be displayed in this
form until the user choose to go to graphical form.
2. View Graphs : -This tab will show the user parameters in graphical form to
provide a better idea of user activity over a larger span of time.
3. View feedback :- This button is used by the patient for viewing the feedback
of the doctor on his reports.
d) Acceptance Tests
Acceptance test case for REQ1a:
ATC 1a.01: Ensure connectivity between user and network which hosts the webpage.
ATC 1a.02: Ensure connectivity remains intact until registration of user completes.
This is imperative as connectivity has to be maintained so that the user can upload his data. We
assign users with a specific session which makes sure that if the user is unresponsive for a long time
then he is logged out.
Acceptance test case for REQ1b:
ATC 1b.01: The system must make sure that all the required fields are filled up the registering user.
Acceptance test for REQ2a:
ATC 2a.01: Every user (patient or doctor) should be assigned with a unique Login ID to prevent
overlapping of login information.
ATC 2a.02: Ensure that the user’s password is associated with his respective Login ID.
It should be made sure that same user id is not given to two users. The database has to be checked
to make sure that the id being entered by the user is not already taken.
Biometric Health Monitoring 16:332:567
16
Acceptance test for REQ2b:
ATC 2b.01: Differentiate between a Doctor, a User or an Administrator during login.
Acceptance test for REQ2c:
ATC2c.01: After login ensure that correct user profile is selected based on login information.
Acceptance test for REQ3a:
ATC 3a.01: Ensure every user can upload his data in excel and process the needed parameters from
the user interface.
ATC 3a.02: Ensure that the data uploaded by a user is associated with his profile.
Our application only accepts files of .xls format and the file format is checked before the file can be
uploaded. This prevents non .xls files to be present in the system.
Note that the process in ATC 5.01 can be a process like check how many hours of sleep the user had
or keep a tab on sedentary work hours. The profile of user in ATC 5.02 is his registration
information.
Acceptance test for REQ3b:
ATC 3b.01: Ensure that the data from excel is entered into the database where it is stored for
analysis.
Acceptance test for REQ4a:
ATC 4a.01: Ensure validity of data stored display it to user and get confirmation from the user.
ATC 4a.01 can be a simple test where the user confirms that the data entered by him which was
later transferred to the database is the same and correct data.
Acceptance test for REQ4b:
ATC 4b.01: Ensure correct graphical representation by displaying graphs of parameters requested by
the user.
Acceptance test for REQ4c:
ATC 4c.01: Ensure backup of the data by allowing user to have one, for future references.
Acceptance test for REQ5a:
ATC 5a.01: Ensure that the doctor associated with users profile receives the data when user sends it.
Biometric Health Monitoring 16:332:567
17
Acceptance test for REQ5b:
ATC 5b.01: Ensure that the patient selects the doctor name from the drop down menu.
The patient has to enter the doctor that he wants to be mapped to while registering. This makes
sure that only that particular doctor can view the patient data.
Acceptance test for REQ6a:
ATC 6a.01: Ensure that the list of users handled by a doctor is updated every time there’s a new
registration with the same doctor.
ATC 6a.02: The Doctor should be able to view any of his user’s (patient’s) data.
Acceptance test for REQ6b:
ATC 6b.01: Ensure that the patient data is received by only one doctor.
ATC 6b.02: The doctor’s comments are unique to that patient so only one doctor shall comment for
a particular patient.
Acceptance test for REQ6c:
ATC 6c.01: Ensure that only one patient data can be accessed at a time by the doctor.
ATC 6c.02: The doctor should write his comments to the current patient before being allowed to
access the next patient.
Acceptance test for REQ7a, REQ7b:
ATC 7.01: Ensure that the doctor is viewing the data of the correct user.
ATC 7.02: Doctor should be able to choose whether to view data in tabular format or graphical
format.
Acceptance test for REQ8a:
ATC 8.01: Ensure that the doctor gives feedback to the correct user.
The test confirms that the comments made by doctor on profile he is currently working on are linked
to the correct user.
Acceptance test for REQ8b:
ATC 8a.01: Ensure that feedback provided by doctor is associated with user under observation.
Biometric Health Monitoring 16:332:567
18
Acceptance test for REQ8c:
ATC 8c.01: Ensure that user gets the feedback provided by the doctor.
Acceptance test for REQ10:
ATC 9.01: Ensure that data is not altered once stored on the database either by the patient (user) or
by the doctor.
4. Functional Requirement Specifications
a) Stakeholders
Patient
Doctor
Administrator
Emergency Services
Web page designers
Database Managers
b) Actors and Goals:
Patient
Performs his daily routines with a device attached to his body.
Registers himself with the acknowledgment from administrator.
Uploads the data collected by the device into the database.
Views his health readings.
Views the suggestions prescribed by doctor.
Doctor
Registers himself with the acknowledgment from administrator.
Views the patient record uploaded.
Monitors if the patient condition is improving or not.
Prescribes solution to the patient by writing a report.
Administrator
Stores patient and doctor details while registering.
Creates the database tables
Upgrades the application
Monitors the application
Biometric Health Monitoring 16:332:567
19
Participating:
Device
Captures the patient activity and stores it in the form of data.
Web Page
Allows the doctor and patient to register with the system.
Allows the doctor and patient to interact.
Database
Maintains a record of the patient registration.
Maintains a record of the doctor registration.
Maintains a record of the patient data and doctor feedback.
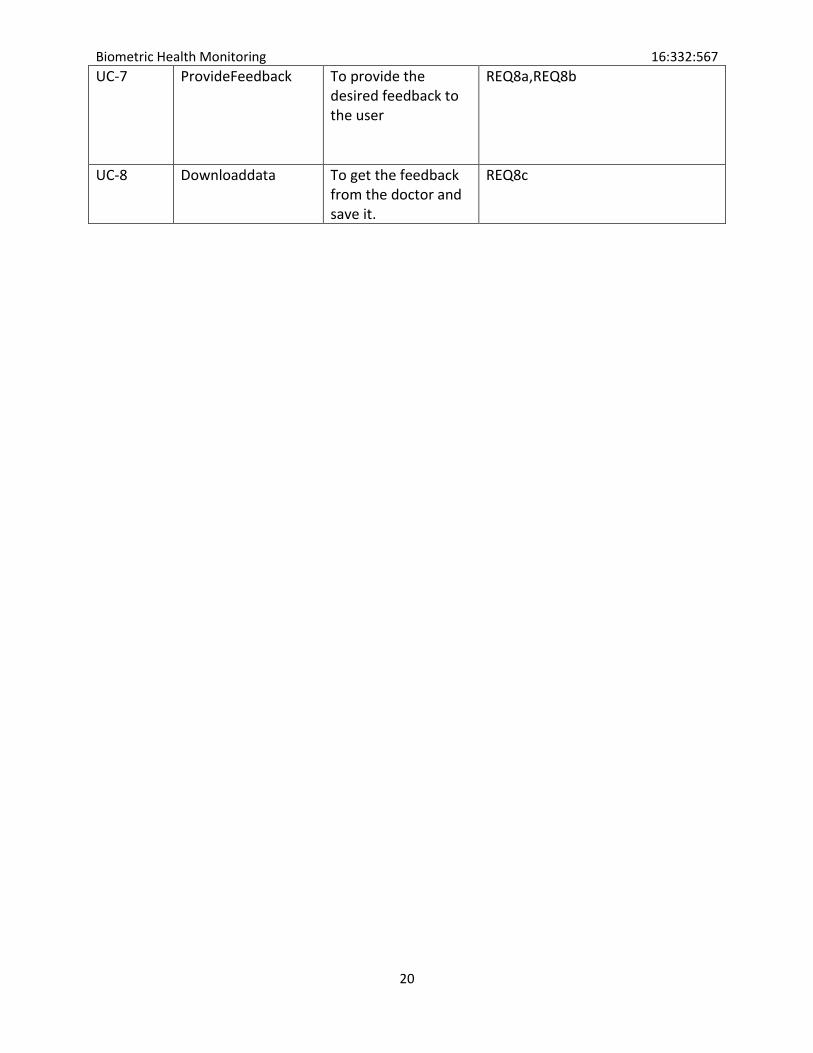
c) Use Cases
Use cases [1] planned for our project are described below
i. Casual Description:
Use Case Name Description Requirement
UC-1 Register/login To Register a user/doctor to the website
scenario. Three participating actors (User, Database,
web server).
Simple 5
Biometric Health Monitoring 16:332:567
45
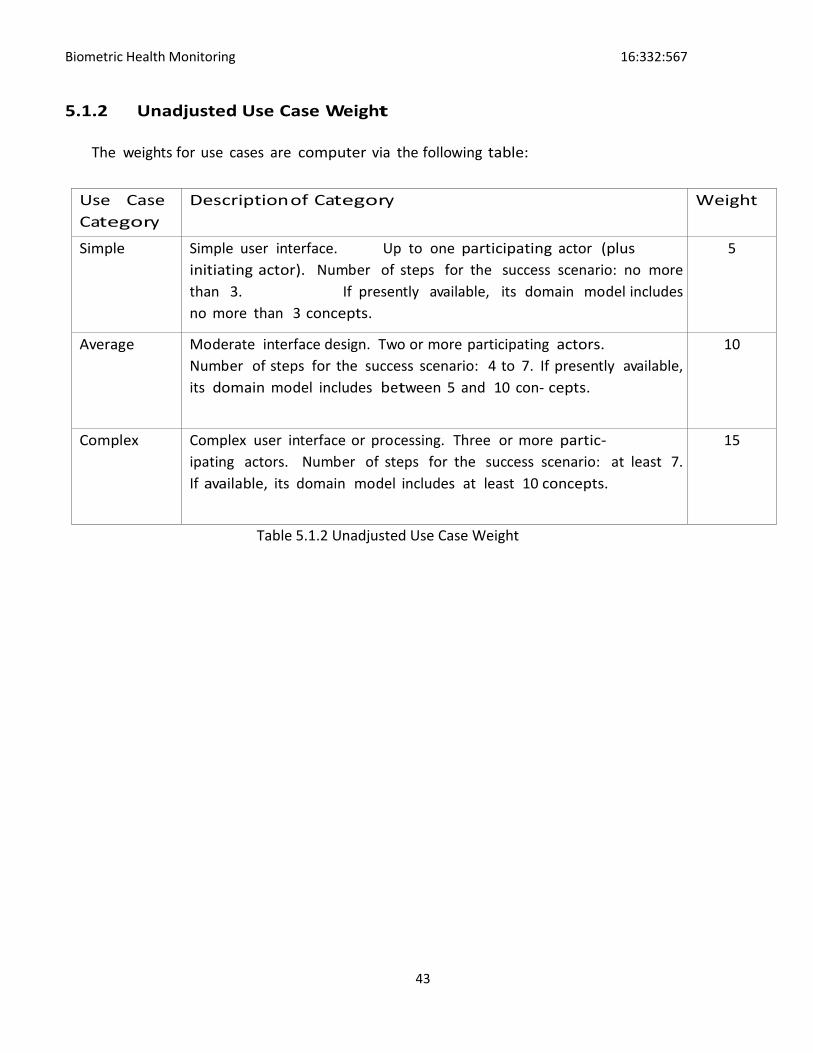
5.2 Technical Complexity Factor
Technical Complexity Factor (TCF) is computed using thirteen standard techni- cal factors to
estimate the impact of productivity of the nonfunctional requirements for the application. We
then need to assess the perceived complexity of each tech- nical factor in the context of the
project. A perceived complexity value is between
0 and 5, with 0 meaning trivial effort, 3 meaning average effort and 5 meaning major effort.
Each factors weight is then multiplied by perceived complexity factor to produce calculated
factor. Two constants are used with TCF. The constants utilized are C1 = 0.6 and C2 = 0.01.
13
T C F = C onstant1 + C onstant2 × Technical Factor Total = C1 + C2 · X
Wi · Fi
i=1
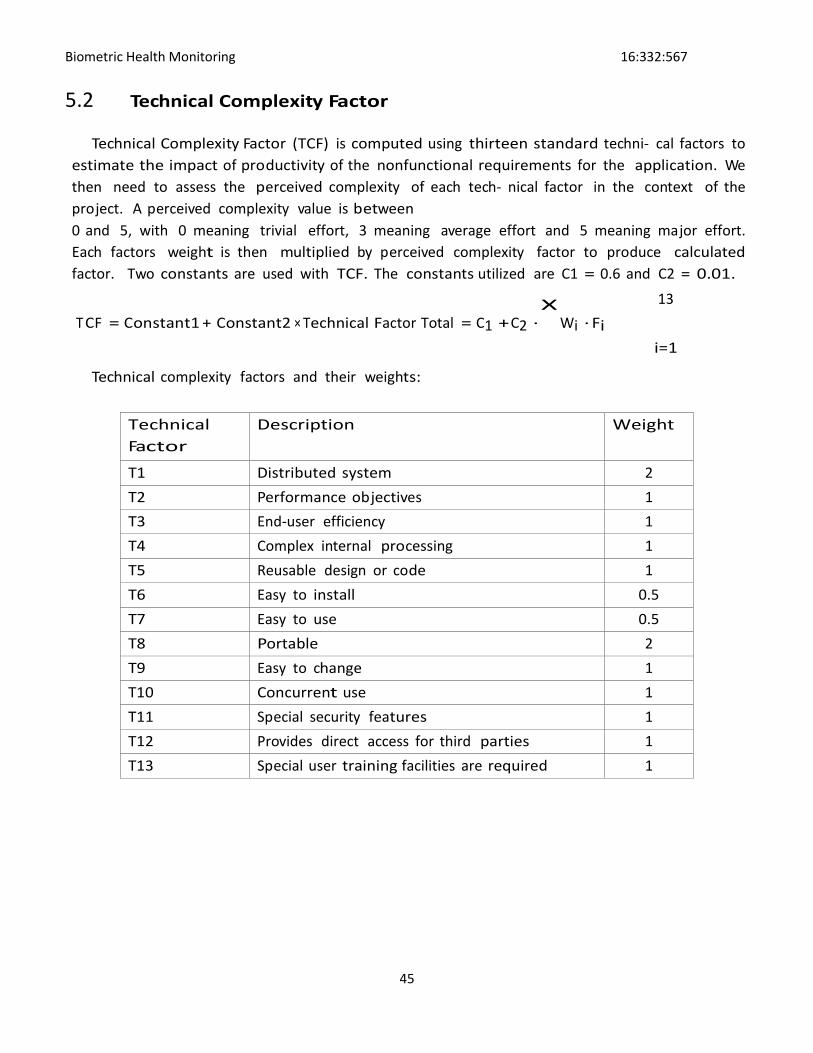
Technical complexity factors and their weights:
Technical
Factor
Description Weight
T1 Distributed system 2
T2 Performance objectives 1
T3 End-user efficiency 1
T4 Complex internal processing 1
T5 Reusable design or code 1
T6 Easy to install 0.5
T7 Easy to use 0.5
T8 Portable 2
T9 Easy to change 1
T10 Concurrent use 1
T11 Special security features 1
T12 Provides direct access for third parties 1
T13 Special user training facilities are required 1
Biometric Health Monitoring 16:332:567
46
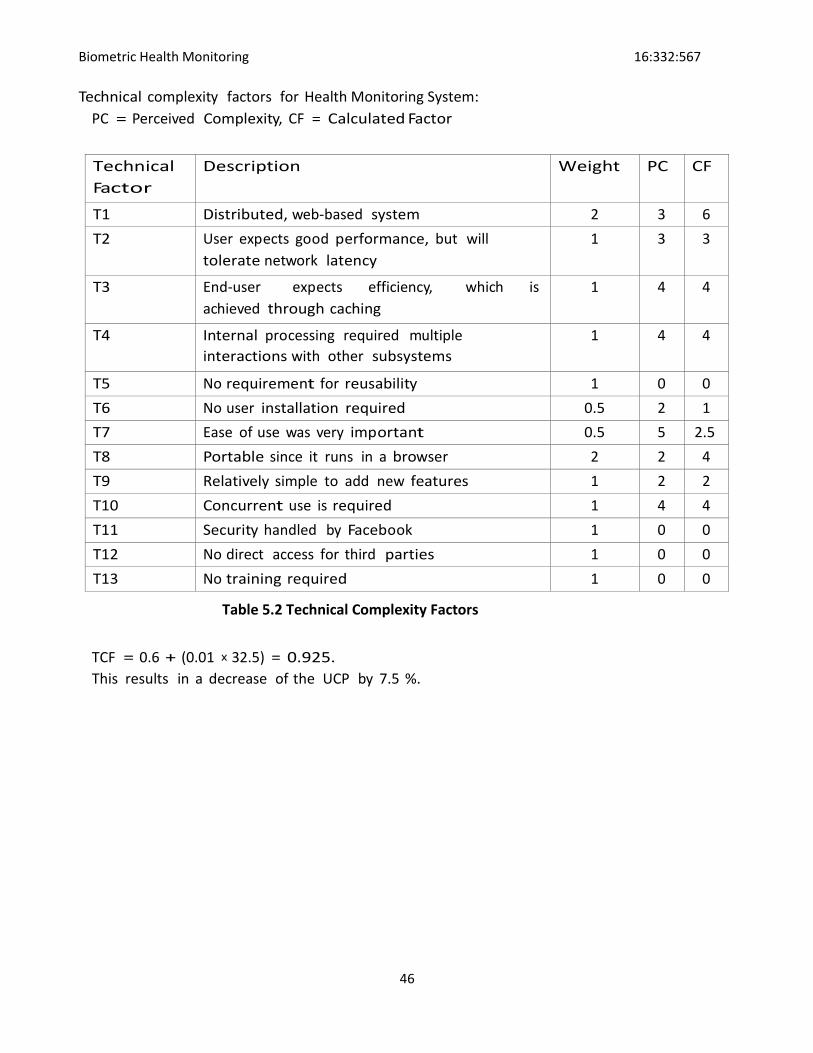
Technical complexity factors for Health Monitoring System:
PC = Perceived Complexity, CF = Calculated Factor
Technical
Factor
Description Weight PC CF
T1 Distributed, web-based system 2 3 6
T2 User expects good performance, but will
tolerate network latency
1 3 3
T3 End-user expects efficiency, which is
achieved through caching
1 4 4
T4 Internal processing required multiple
interactions with other subsystems
1 4 4
T5 No requirement for reusability 1 0 0
T6 No user installation required 0.5 2 1
T7 Ease of use was very important 0.5 5 2.5
T8 Portable since it runs in a browser 2 2 4
T9 Relatively simple to add new features 1 2 2
T10 Concurrent use is required 1 4 4
T11 Security handled by Facebook 1 0 0
T12 No direct access for third parties 1 0 0
T13 No training required 1 0 0 Table 5.2 Technical Complexity Factors
TCF = 0.6 + (0.01 × 32.5) = 0.925.
This results in a decrease of the UCP by 7.5 %.
Biometric Health Monitoring 16:332:567
47
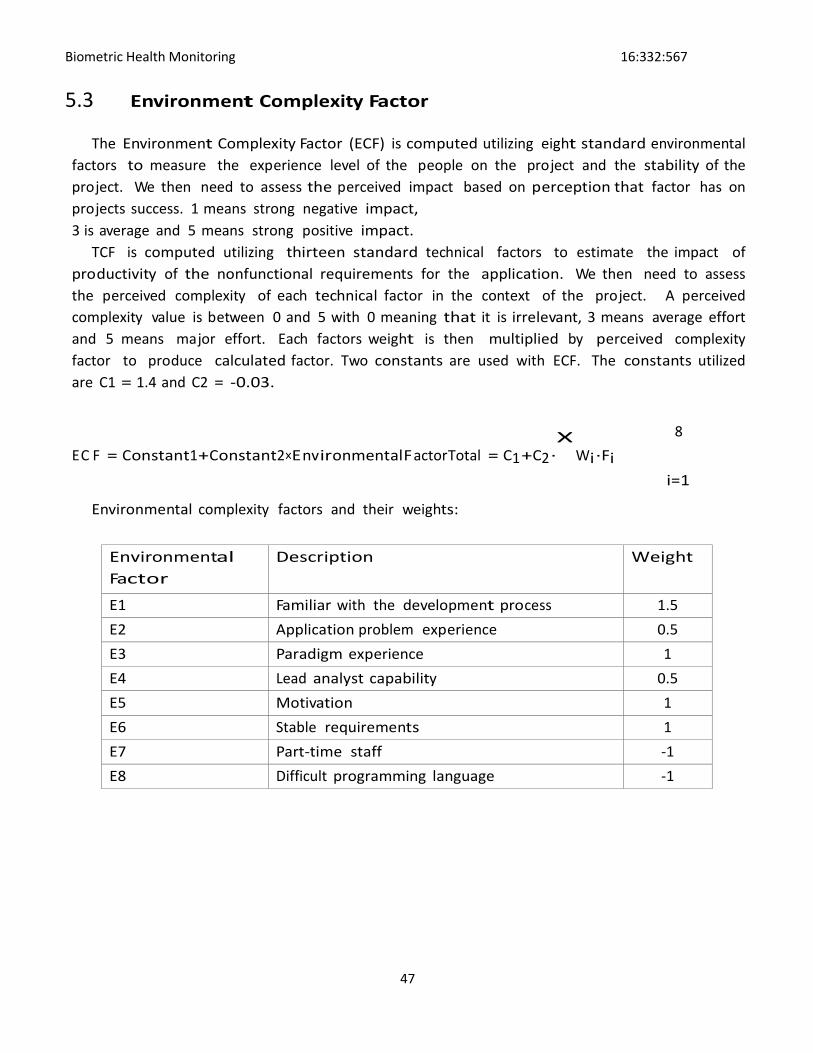
5.3 Environment Complexity Factor
The Environment Complexity Factor (ECF) is computed utilizing eight standard environmental
factors to measure the experience level of the people on the project and the stability of the
project. We then need to assess the perceived impact based on perception that factor has on
projects success. 1 means strong negative impact,
3 is average and 5 means strong positive impact.
TCF is computed utilizing thirteen standard technical factors to estimate the impact of
productivity of the nonfunctional requirements for the application. We then need to assess
the perceived complexity of each technical factor in the context of the project. A perceived
complexity value is between 0 and 5 with 0 meaning that it is irrelevant, 3 means average effort
and 5 means major effort. Each factors weight is then multiplied by perceived complexity
factor to produce calculated factor. Two constants are used with ECF. The constants utilized
are C1 = 1.4 and C2 = -0.03.
8
EC F = C onstant1+C onstant2×EnvironmentalF actorTotal = C1 +C2 ·X
Wi ·Fi
i=1
Environmental complexity factors and their weights:
Environmental
Factor
Description Weight
E1 Familiar with the development process 1.5
E2 Application problem experience 0.5
E3 Paradigm experience 1
E4 Lead analyst capability 0.5
E5 Motivation 1
E6 Stable requirements 1
E7 Part-time staff -1
E8 Difficult programming language -1
Biometric Health Monitoring 16:332:567
48
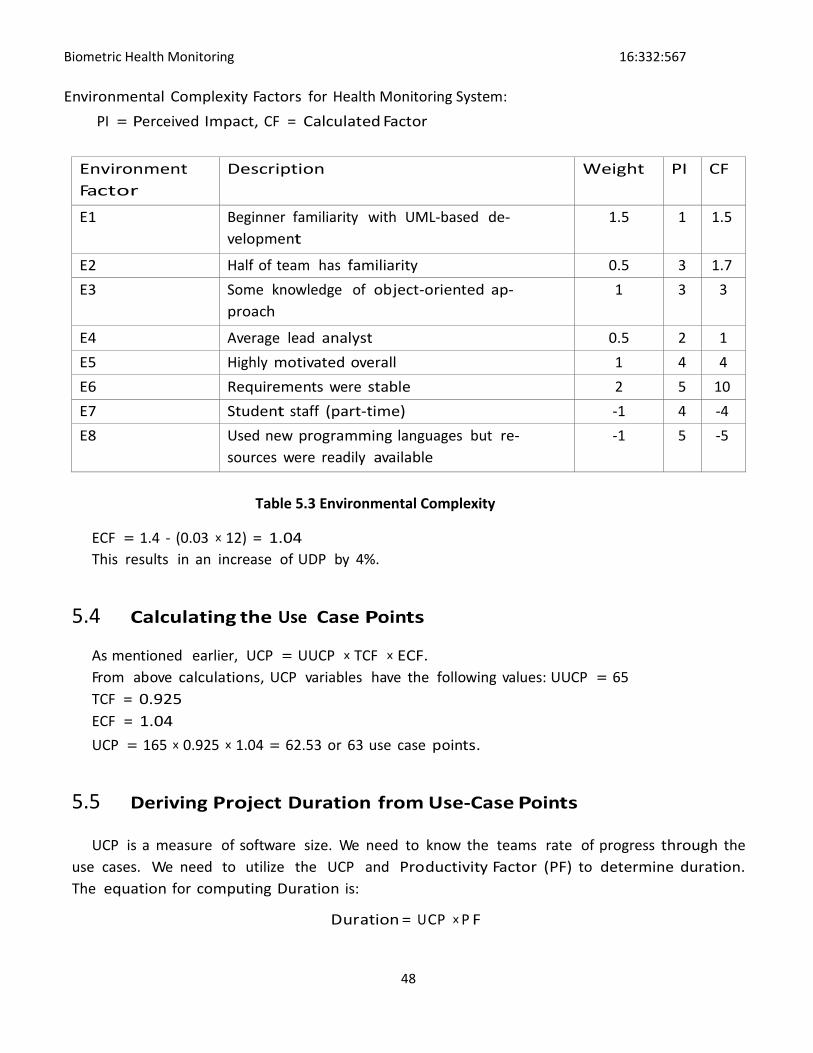
Environmental Complexity Factors for Health Monitoring System:
PI = Perceived Impact, CF = Calculated Factor
Environment
Factor
Description Weight PI CF
E1 Beginner familiarity with UML-based de-
velopment
1.5 1 1.5
E2 Half of team has familiarity 0.5 3 1.7
E3 Some knowledge of object-oriented ap-
proach
1 3 3
E4 Average lead analyst 0.5 2 1
E5 Highly motivated overall 1 4 4
E6 Requirements were stable 2 5 10
E7 Student staff (part-time) -1 4 -4
E8 Used new programming languages but re-
sources were readily available
-1 5 -5
Table 5.3 Environmental Complexity
ECF = 1.4 - (0.03 × 12) = 1.04
This results in an increase of UDP by 4%.
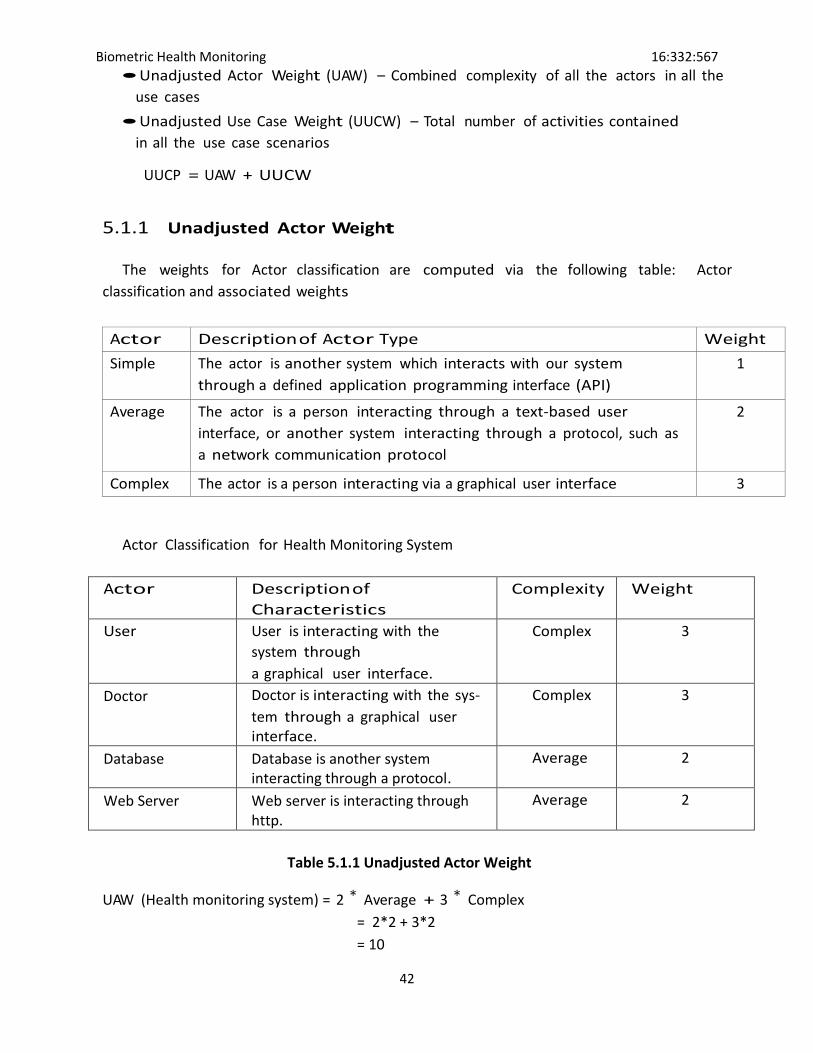
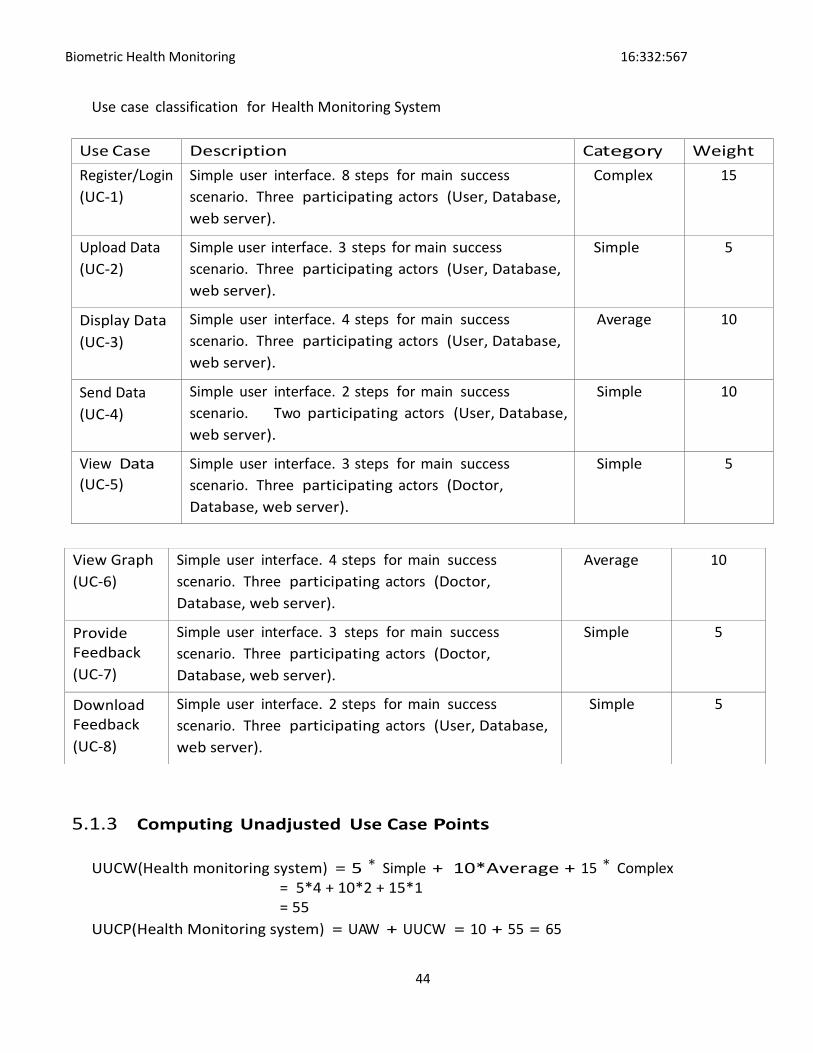
5.4 Calculating the Use Case Points
As mentioned earlier, UCP = UUCP × TCF × ECF.
From above calculations, UCP variables have the following values: UUCP = 65
TCF = 0.925
ECF = 1.04
UCP = 165 × 0.925 × 1.04 = 62.53 or 63 use case points.
5.5 Deriving Pro ject Duration from Use-Case Points
UCP is a measure of software size. We need to know the teams rate of progress through the
use cases. We need to utilize the UCP and Productivity Factor (PF) to determine duration.
The equation for computing Duration is:
Duration = U C P × P F
Biometric Health Monitoring Software Engineering
49
Productivity Factor is the ratio of development person-hours needed per use case
point. Assuming a PF = 28, the duration of our system is computed as follows:
Duration = U C P X P F = 63 ∗ 28 = 1764 1764 person-hours for the development of the system.
This does not imply that the project will be completed in 1764/24 = 74 days. A reasonable assumption is that each developer on average spent 10 hours per week on project tasks. With a team of six developers, this means the team makes 6 *15 = 90 hours per week. Dividing 1764 person-hours by 90 hours per week, we obtain the total of approximately 20 weeks to complete this project. We have spent 16 weeks approximately on the project so far which gives us 4 weeks left to complete this project according to our estimation. The reason for the large estimate is due to the highly over-estimated productivity factor.
Biometric Health Monitoring Software Engineering
50
6. Domain Analysis
a) Domain Model:-
Biometric Health Monitoring Software Engineering
51
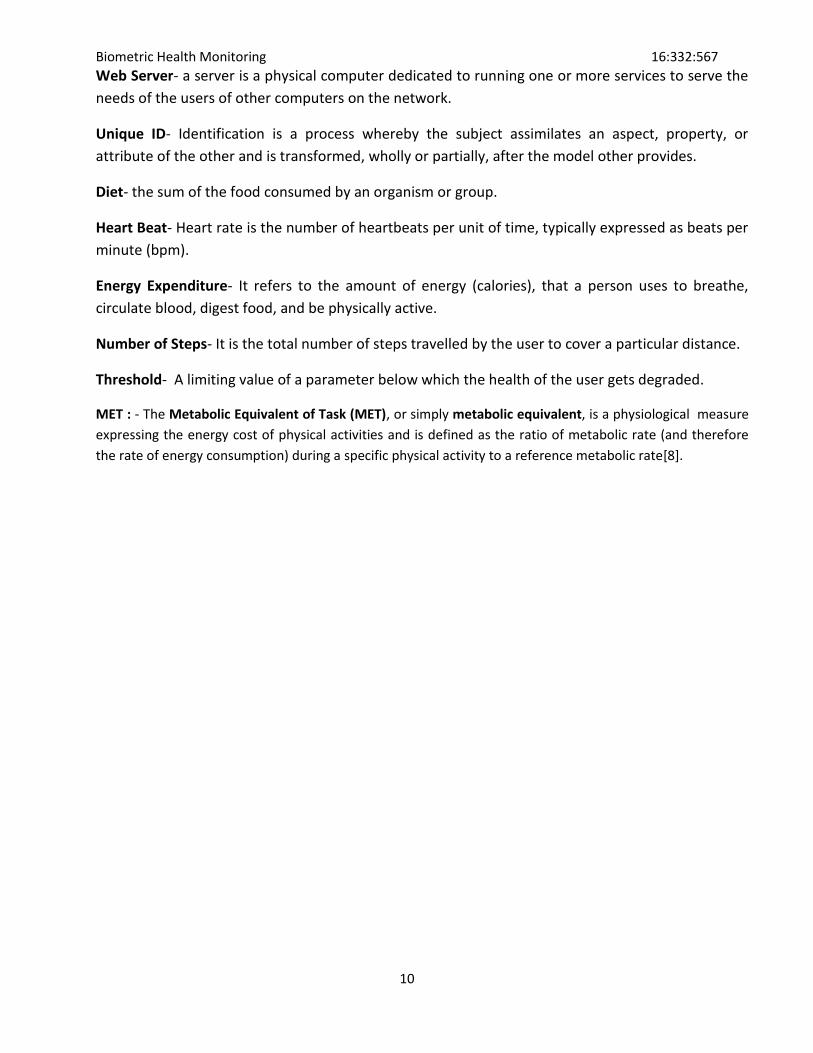
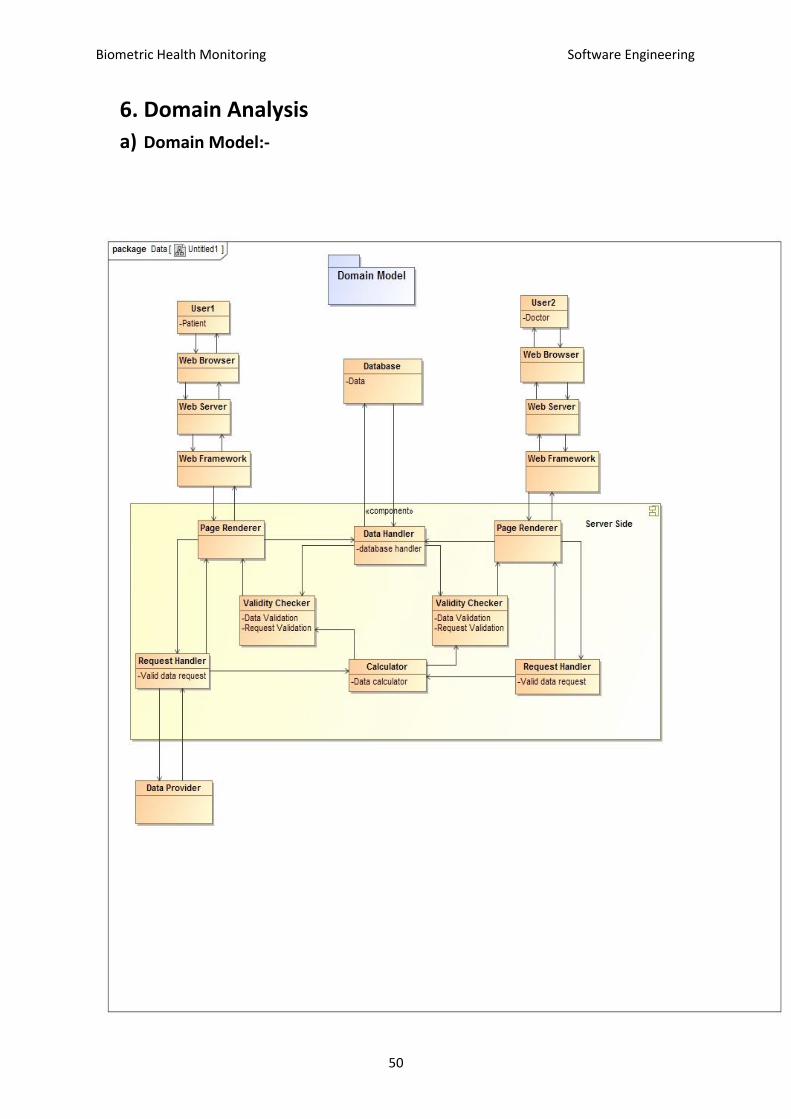
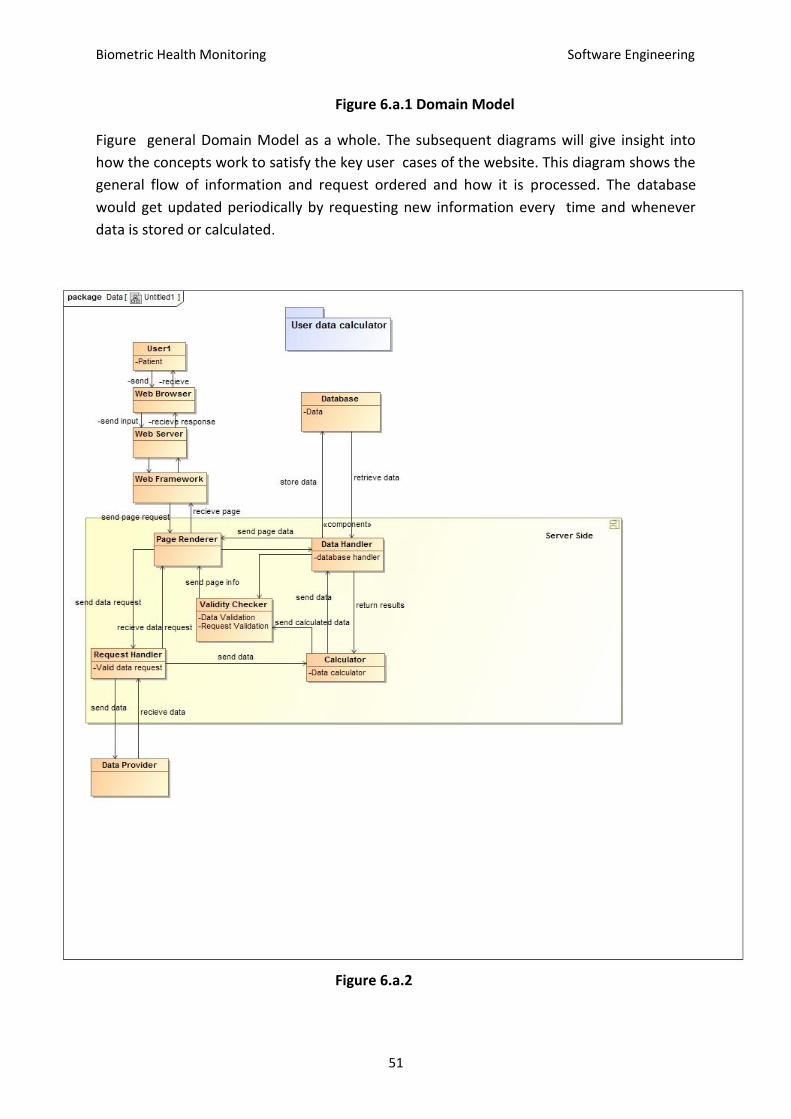
Figure 6.a.1 Domain Model
Figure general Domain Model as a whole. The subsequent diagrams will give insight into
how the concepts work to satisfy the key user cases of the website. This diagram shows the
general flow of information and request ordered and how it is processed. The database
would get updated periodically by requesting new information every time and whenever
data is stored or calculated.
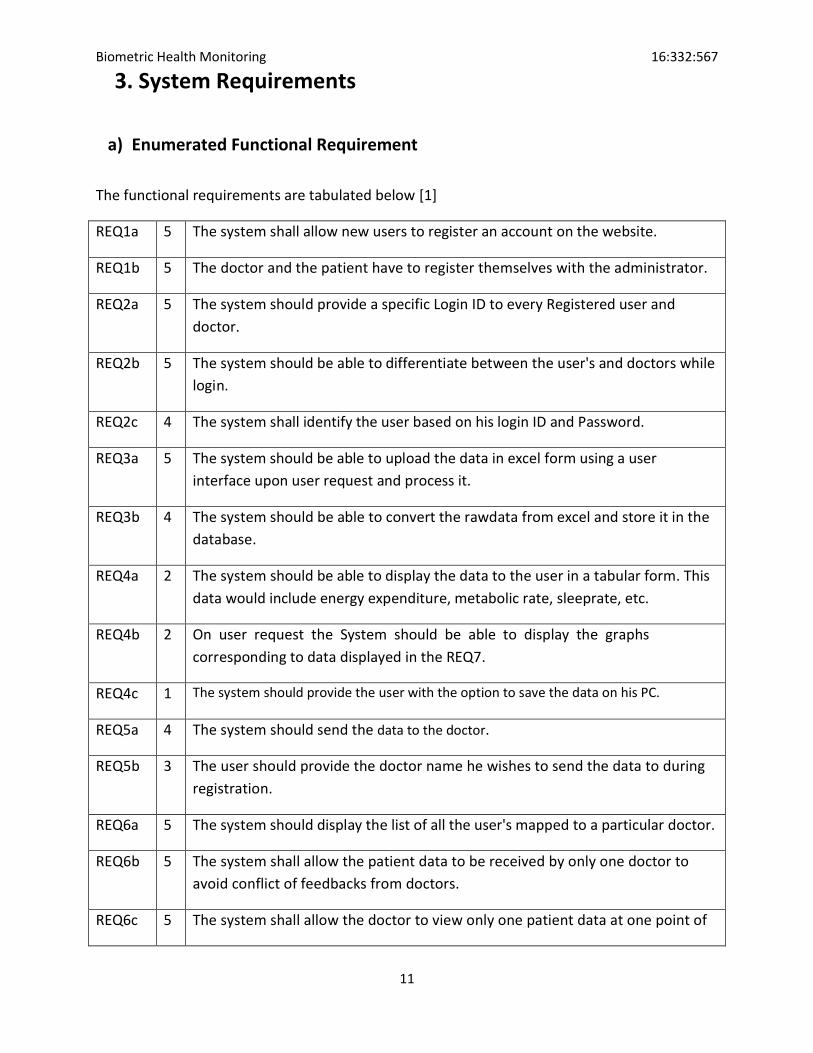
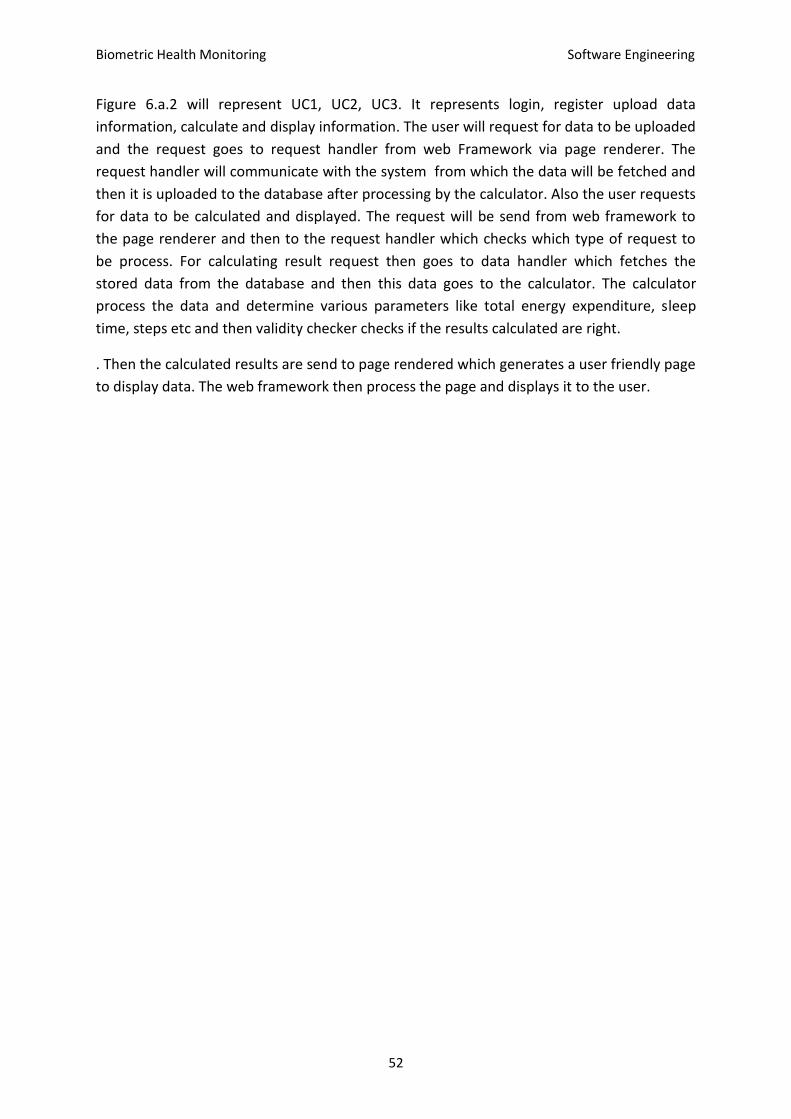
Figure 6.a.2
Biometric Health Monitoring Software Engineering
52
Figure 6.a.2 will represent UC1, UC2, UC3. It represents login, register upload data
information, calculate and display information. The user will request for data to be uploaded
and the request goes to request handler from web Framework via page renderer. The
request handler will communicate with the system from which the data will be fetched and
then it is uploaded to the database after processing by the calculator. Also the user requests
for data to be calculated and displayed. The request will be send from web framework to
the page renderer and then to the request handler which checks which type of request to
be process. For calculating result request then goes to data handler which fetches the
stored data from the database and then this data goes to the calculator. The calculator
process the data and determine various parameters like total energy expenditure, sleep
time, steps etc and then validity checker checks if the results calculated are right.
. Then the calculated results are send to page rendered which generates a user friendly page
to display data. The web framework then process the page and displays it to the user.
Biometric Health Monitoring Software Engineering
53
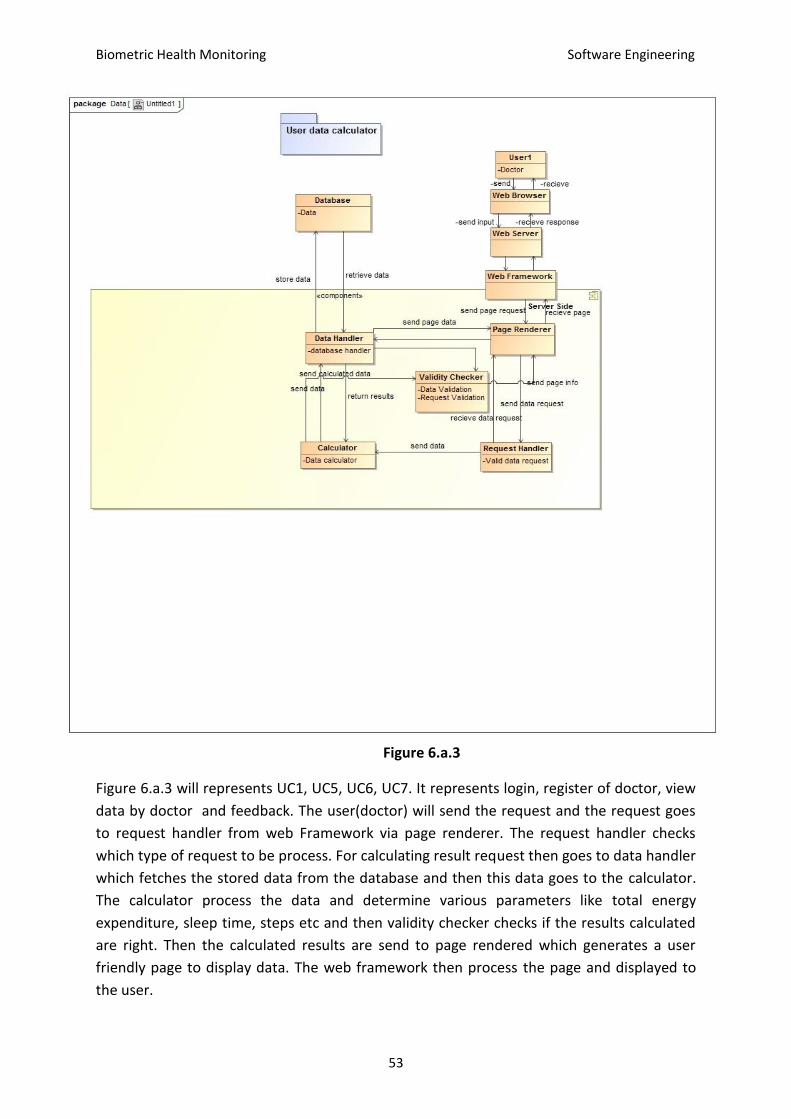
Figure 6.a.3
Figure 6.a.3 will represents UC1, UC5, UC6, UC7. It represents login, register of doctor, view
data by doctor and feedback. The user(doctor) will send the request and the request goes
to request handler from web Framework via page renderer. The request handler checks
which type of request to be process. For calculating result request then goes to data handler
which fetches the stored data from the database and then this data goes to the calculator.
The calculator process the data and determine various parameters like total energy
expenditure, sleep time, steps etc and then validity checker checks if the results calculated
are right. Then the calculated results are send to page rendered which generates a user
friendly page to display data. The web framework then process the page and displayed to
the user.
Biometric Health Monitoring Software Engineering
54
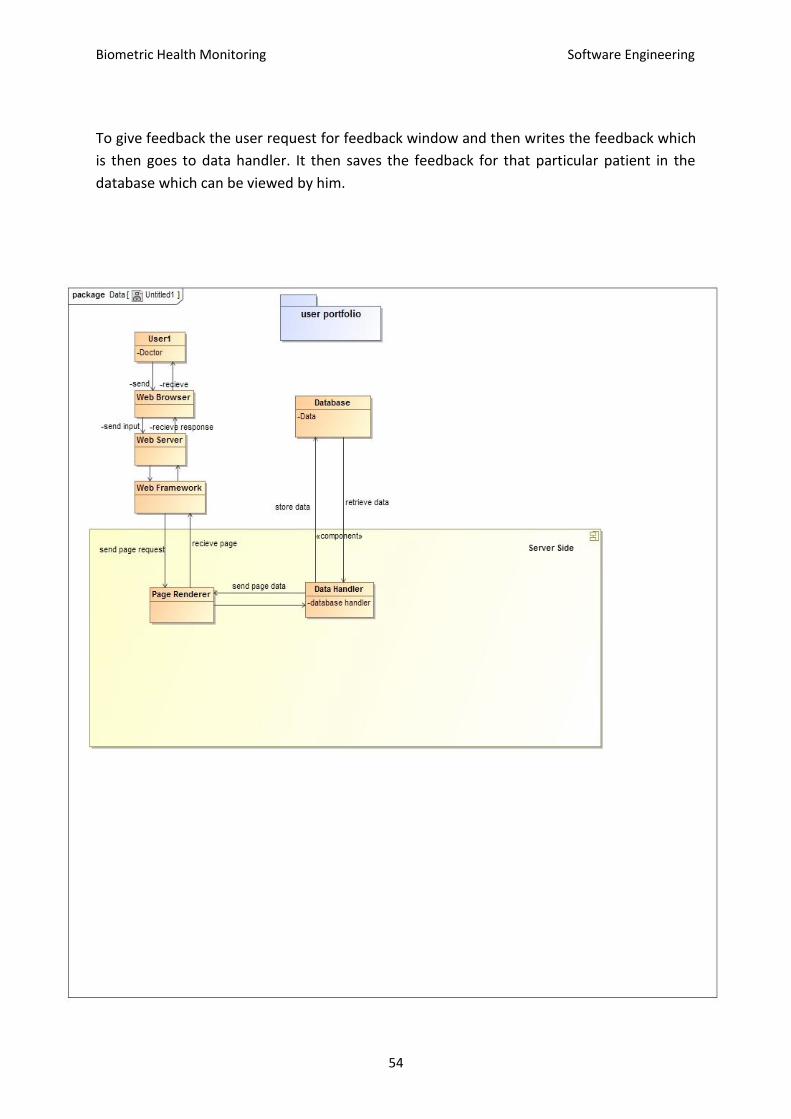
To give feedback the user request for feedback window and then writes the feedback which
is then goes to data handler. It then saves the feedback for that particular patient in the
database which can be viewed by him.
Biometric Health Monitoring Software Engineering
55
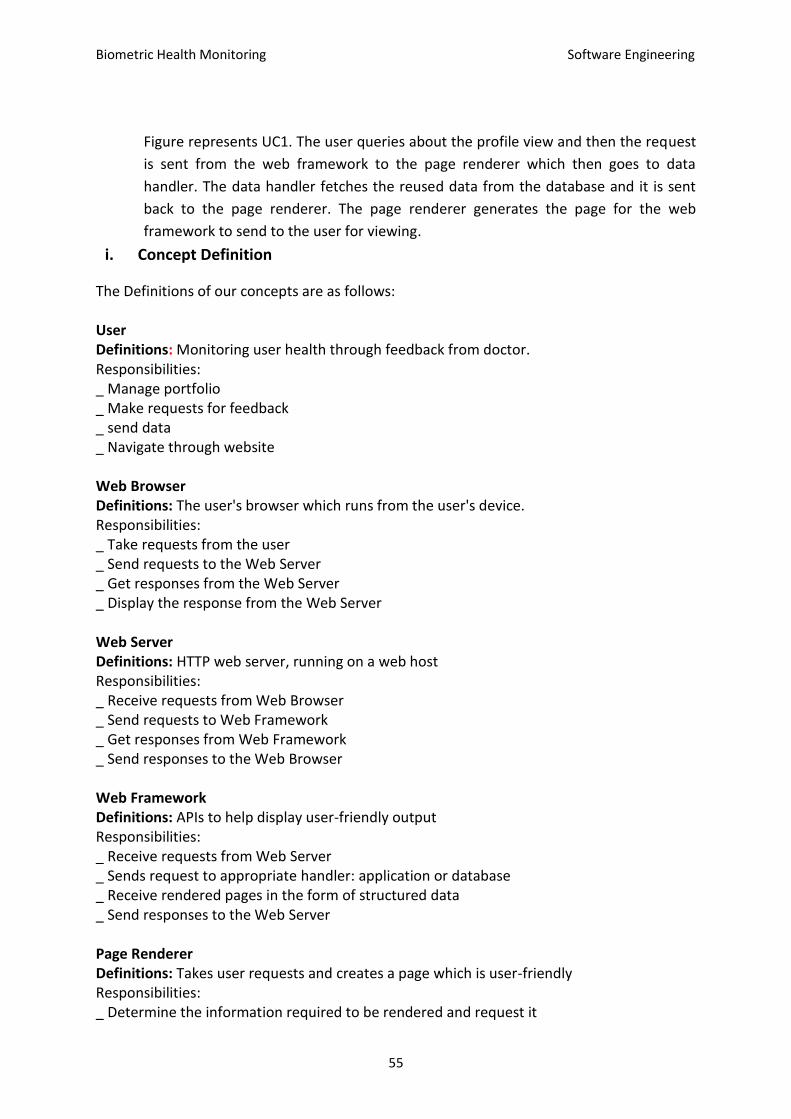
Figure represents UC1. The user queries about the profile view and then the request
is sent from the web framework to the page renderer which then goes to data
handler. The data handler fetches the reused data from the database and it is sent
back to the page renderer. The page renderer generates the page for the web
framework to send to the user for viewing.
i. Concept Definition
The Definitions of our concepts are as follows: User Definitions: Monitoring user health through feedback from doctor. Responsibilities: _ Manage portfolio _ Make requests for feedback _ send data _ Navigate through website Web Browser Definitions: The user's browser which runs from the user's device. Responsibilities: _ Take requests from the user _ Send requests to the Web Server _ Get responses from the Web Server _ Display the response from the Web Server Web Server Definitions: HTTP web server, running on a web host Responsibilities: _ Receive requests from Web Browser _ Send requests to Web Framework _ Get responses from Web Framework _ Send responses to the Web Browser Web Framework Definitions: APIs to help display user-friendly output Responsibilities: _ Receive requests from Web Server _ Sends request to appropriate handler: application or database _ Receive rendered pages in the form of structured data _ Send responses to the Web Server Page Renderer Definitions: Takes user requests and creates a page which is user-friendly Responsibilities: _ Determine the information required to be rendered and request it
Biometric Health Monitoring Software Engineering
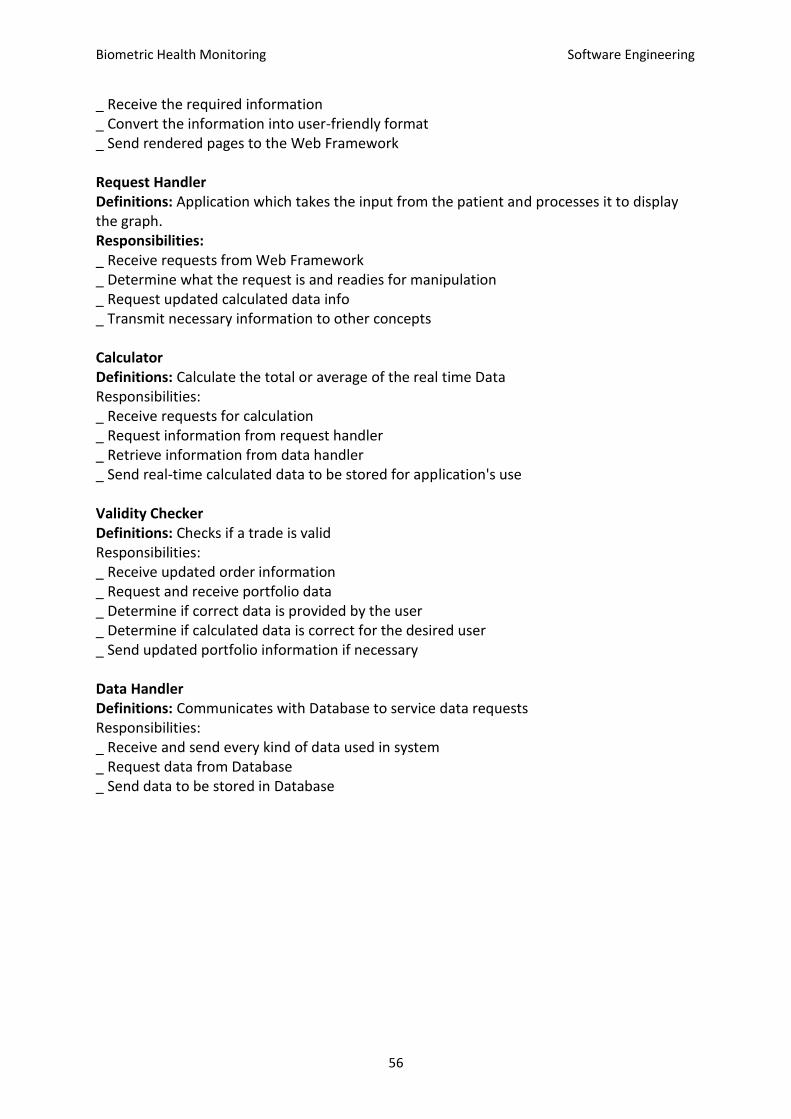
56
_ Receive the required information _ Convert the information into user-friendly format _ Send rendered pages to the Web Framework Request Handler Definitions: Application which takes the input from the patient and processes it to display the graph. Responsibilities: _ Receive requests from Web Framework _ Determine what the request is and readies for manipulation _ Request updated calculated data info _ Transmit necessary information to other concepts Calculator Definitions: Calculate the total or average of the real time Data Responsibilities: _ Receive requests for calculation _ Request information from request handler _ Retrieve information from data handler _ Send real-time calculated data to be stored for application's use Validity Checker Definitions: Checks if a trade is valid Responsibilities: _ Receive updated order information _ Request and receive portfolio data _ Determine if correct data is provided by the user _ Determine if calculated data is correct for the desired user _ Send updated portfolio information if necessary Data Handler Definitions: Communicates with Database to service data requests Responsibilities: _ Receive and send every kind of data used in system _ Request data from Database _ Send data to be stored in Database
Biometric Health Monitoring Software Engineering
57
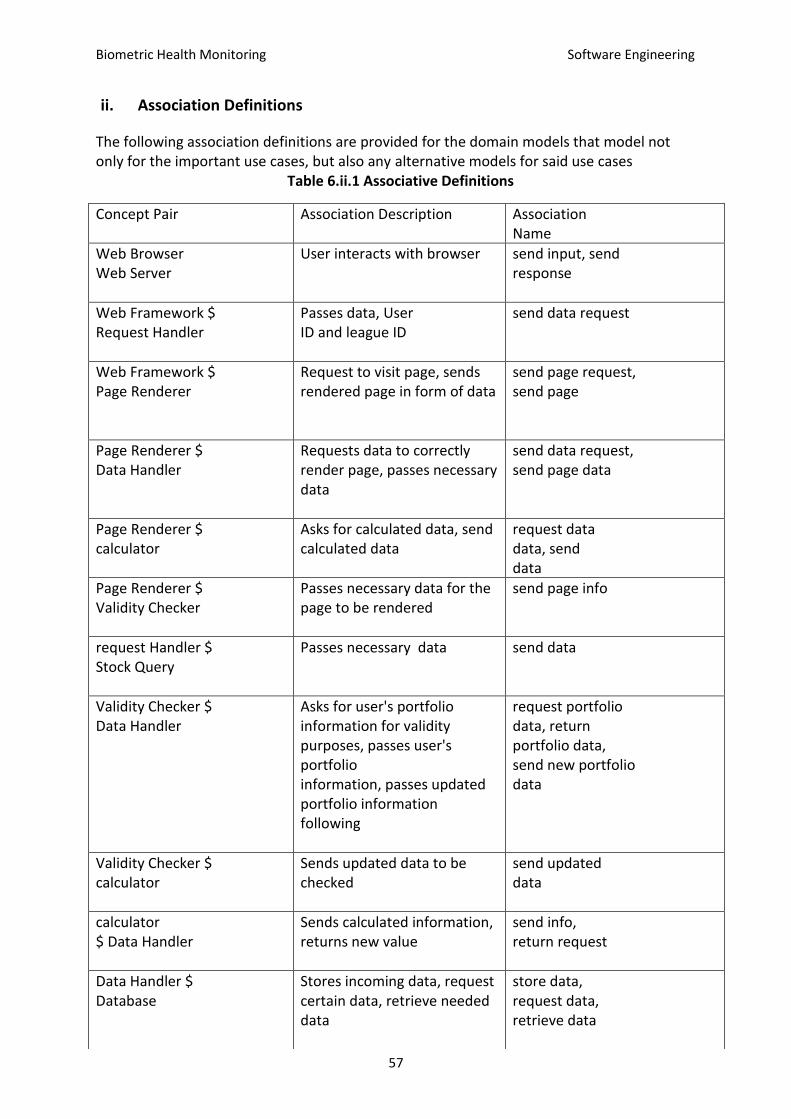
ii. Association Definitions
The following association definitions are provided for the domain models that model not only for the important use cases, but also any alternative models for said use cases
Table 6.ii.1 Associative Definitions
Concept Pair
Association Description
Association Name
Web Browser Web Server
User interacts with browser send input, send response
Web Framework $ Request Handler
Passes data, User ID and league ID
send data request
Web Framework $ Page Renderer
Request to visit page, sends rendered page in form of data
send page request, send page
Page Renderer $ Data Handler
Requests data to correctly render page, passes necessary data
send data request, send page data
Page Renderer $ calculator
Asks for calculated data, send calculated data
request data data, send data
Page Renderer $ Validity Checker
Passes necessary data for the page to be rendered
send page info
request Handler $ Stock Query
Passes necessary data send data
Validity Checker $ Data Handler
Asks for user's portfolio information for validity purposes, passes user's portfolio information, passes updated portfolio information following
request portfolio data, return portfolio data, send new portfolio data
Validity Checker $ calculator
Sends updated data to be checked
send updated data
calculator $ Data Handler
Sends calculated information, returns new value
send info, return request
Data Handler $ Database
Stores incoming data, request certain data, retrieve needed data
store data, request data, retrieve data
Biometric Health Monitoring Software Engineering
58
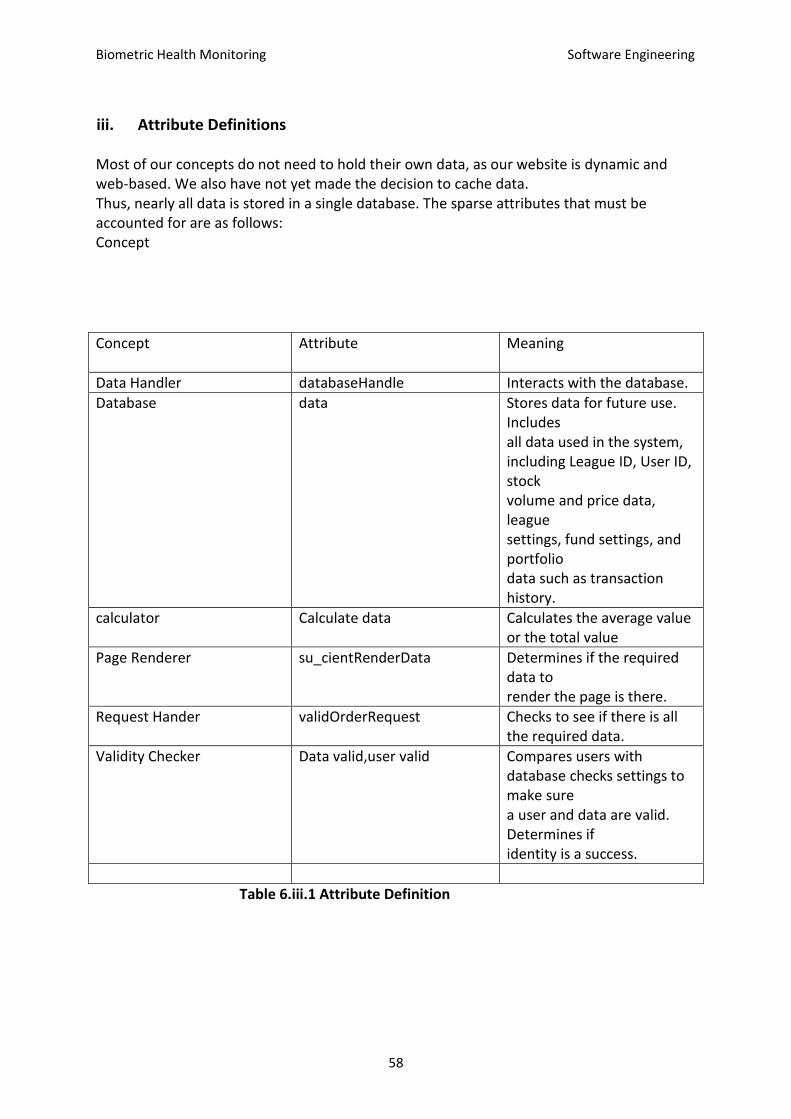
iii. Attribute Definitions Most of our concepts do not need to hold their own data, as our website is dynamic and web-based. We also have not yet made the decision to cache data. Thus, nearly all data is stored in a single database. The sparse attributes that must be accounted for are as follows: Concept
Concept Attribute Meaning
Data Handler databaseHandle Interacts with the database.
Database
data Stores data for future use. Includes all data used in the system, including League ID, User ID, stock volume and price data, league settings, fund settings, and portfolio data such as transaction history.
calculator Calculate data Calculates the average value or the total value
Page Renderer
su_cientRenderData Determines if the required data to render the page is there.
Request Hander
validOrderRequest Checks to see if there is all the required data.
Validity Checker
Data valid,user valid Compares users with database checks settings to make sure a user and data are valid. Determines if identity is a success.
Table 6.iii.1 Attribute Definition
Biometric Health Monitoring Software Engineering
59
iv. Traceability Matrix
UC PW User Patient
User Doctor
Web Browser
Web Server
Web Framework
Page Renderer
Request Handler
Calculator Data Handler
UC01-03 35 X X X X X X X X
UC05-07 17 X X X X X X X
UC08 35 X X X X X X
Table 6.iv. 1 Traceability Matrix
b) System Operation Contracts
i. Register User:
Preconditions: None
Postconditions:
User has a profile linked to database and every user has a doctor who will
review his profile.
Database keeps track of user’s information.
ii. Upload Data:
Preconditions:
Make sure enough space is available on in database.
User is logged in.
Postconditions:
Data is updated to database.
iii. Display data:
Preconditions:
Database has valid information.
Parameters have been calculated.
Postconditions:
Data is displayed in user friendly version.
Graphical representation is used for easy understanding.
Biometric Health Monitoring Software Engineering
60
iv. Send to Doctor:
Preconditions:
Doctor is logged in.
Parameters have been calculated.
User has requested a review from his Doctor.
Postconditions:
Data is sent to the doctor specified by the user during registration.
v. Feedback:
Preconditions:
Doctor has received data pertaining to user who has requested areview.
Doctor has viewed all graphical charts of user.
Postconditions:
Doctor writes comments for user based on his report.
Feedback is uploaded to the database.
vi. Graphical Representation:
Precondition:
User/Doctor is logged in.
Valid information is present in the database.
Postcondition:
Graphical version of the user information is generated.
vii. Feedback to User:
Precondition:
User is logged in.
Doctor has updated feedback to the database for user.
Biometric Health Monitoring Software Engineering
61
Postcondition:
User gets the feedback meant for him/her from the database.
viii. Downloadable Feedback:
Precondition:
Database contains the information requested by the user.
Postcondition:
Information is downloaded and saved on user’s system.
ix.
View and Edit Information:
Precondition:
User/Doctor is logged in.
Postcondition:
Profile Information is modified and updated in database.
Biometric Health Monitoring Software Engineering
62
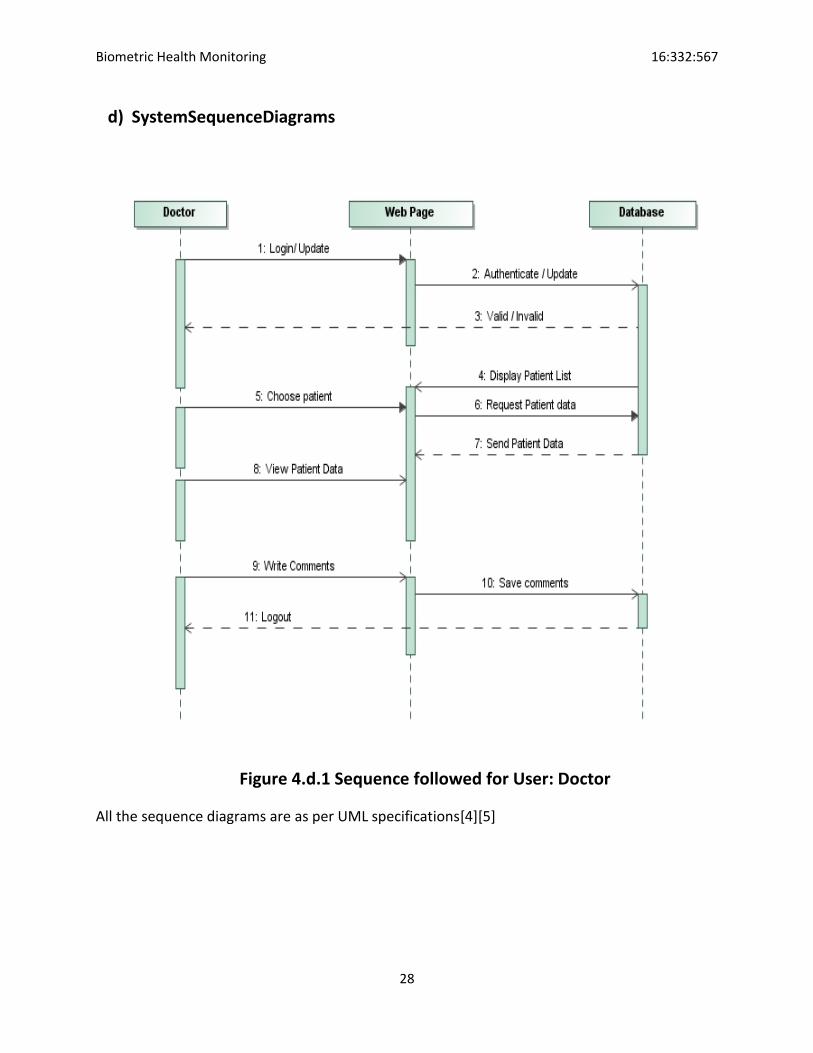
7. Interaction Diagrams:-
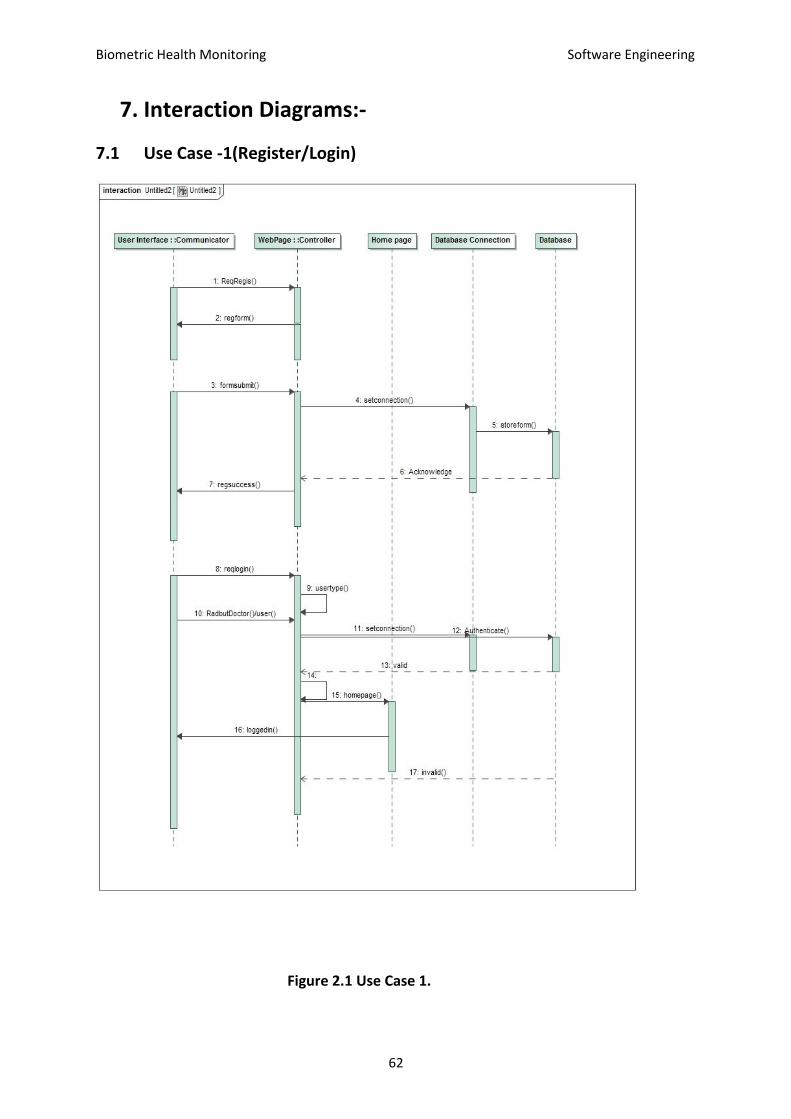
7.1 Use Case -1(Register/Login)
Figure 2.1 Use Case 1.
Biometric Health Monitoring Software Engineering
63
The above interaction diagram(Figure2.1) is for the first use case. The user sends a
Reqregis() via the user interface to the webpage communicator. After the user requests for
the first time to get registered, the web page controller sends back the form to user via
regform(). Now, the user submits his form(formsubmit()) and then a connection is set up
with the database. After this the form submitted by the user is stored via storeform() into
the database. The user then receives an acknowledge reply from the database. If an existing
user wishes to login then usertype() has to be chosen via a radio button. Again the
setconnection() method is called and the database connection is set up. After this the
database validates and sends a response to the webpage controller. If valid then it displays
the home screen to the user via loggedin() method. If database doesn’t validate then an
invalid() method is sent to the web page controller. All Interaction Diagrams are as per UML
specifications[4][5].
Biometric Health Monitoring Software Engineering
64
7.2Use case 2 (Upload Data)
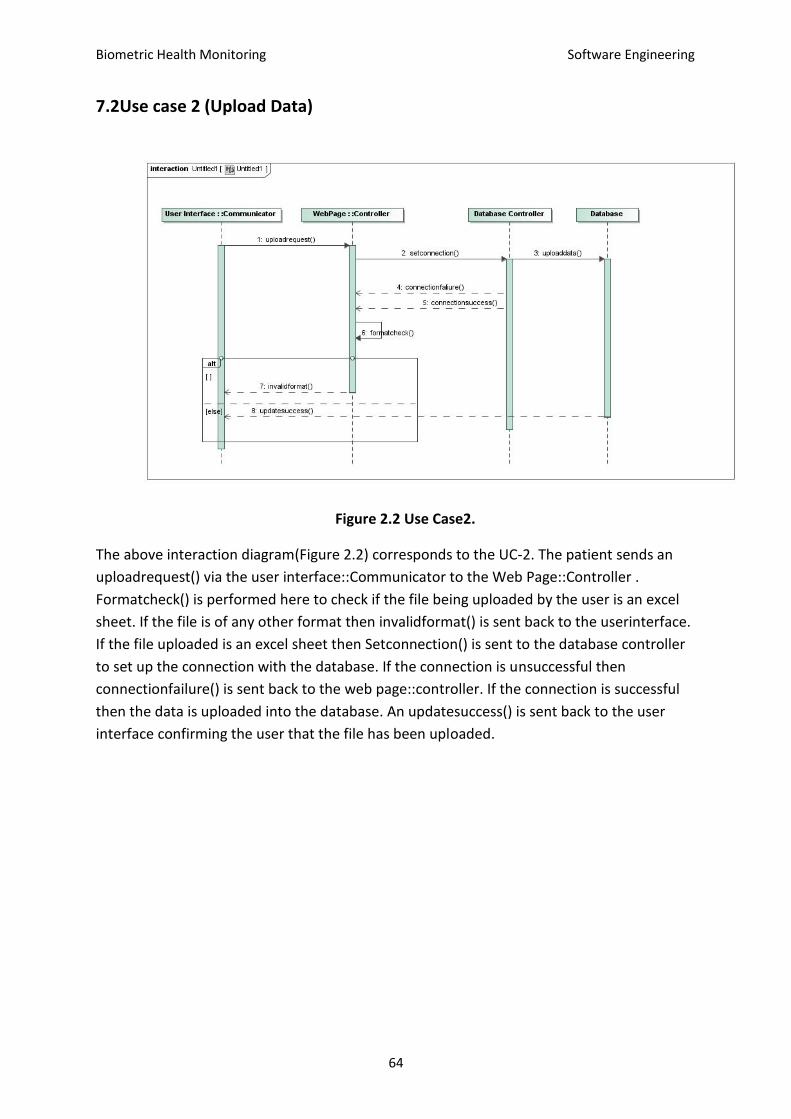
Figure 2.2 Use Case2.
The above interaction diagram(Figure 2.2) corresponds to the UC-2. The patient sends an
uploadrequest() via the user interface::Communicator to the Web Page::Controller .
Formatcheck() is performed here to check if the file being uploaded by the user is an excel
sheet. If the file is of any other format then invalidformat() is sent back to the userinterface.
If the file uploaded is an excel sheet then Setconnection() is sent to the database controller
to set up the connection with the database. If the connection is unsuccessful then
connectionfailure() is sent back to the web page::controller. If the connection is successful
then the data is uploaded into the database. An updatesuccess() is sent back to the user
interface confirming the user that the file has been uploaded.
Biometric Health Monitoring Software Engineering
65
2.2 Use case 3 & 4(Display Data/Send Data)
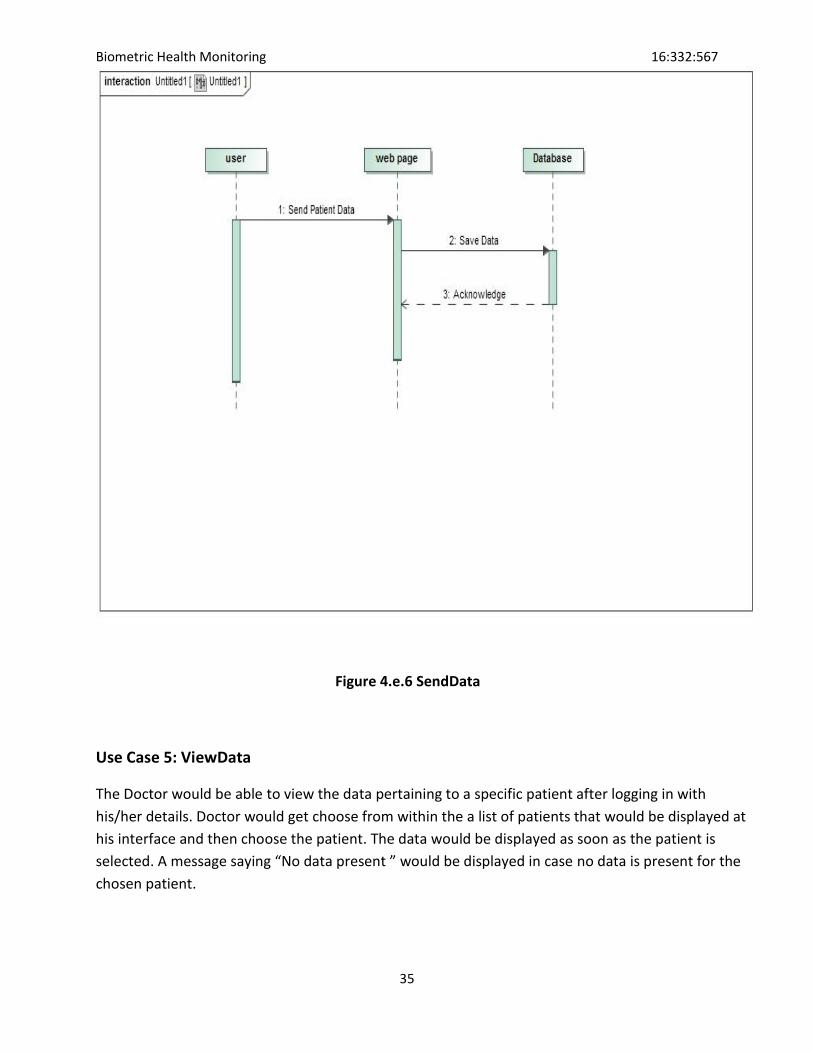
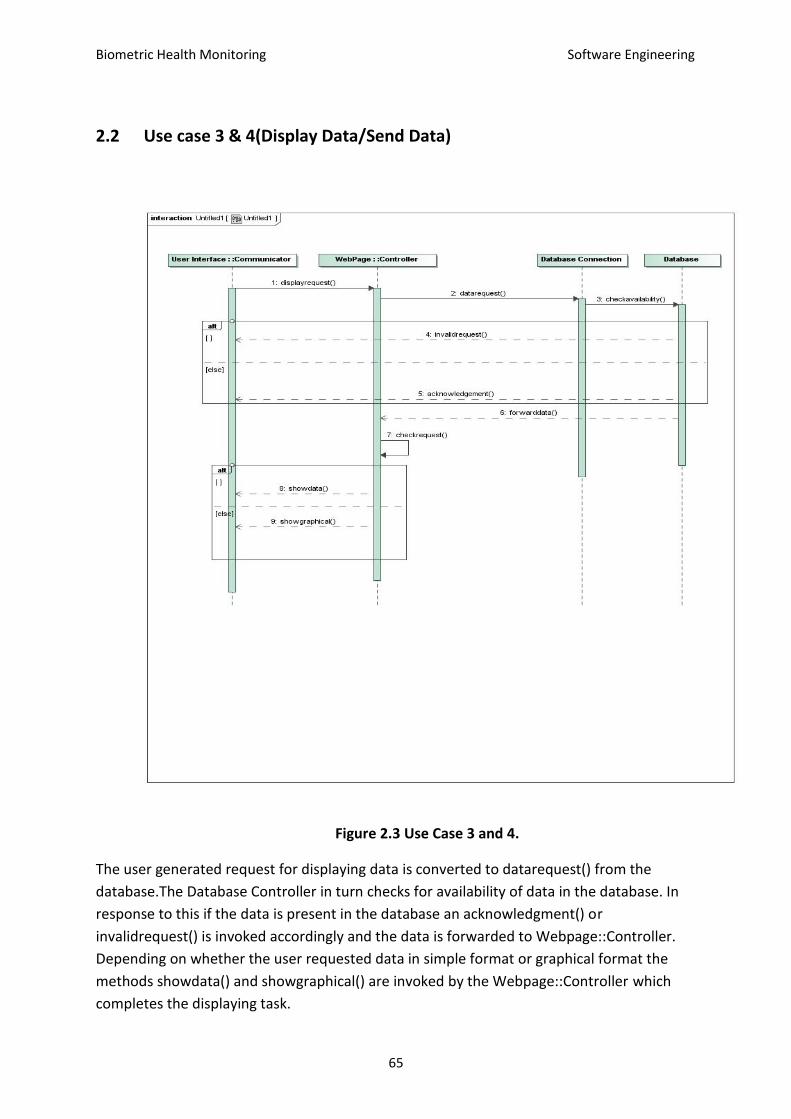
Figure 2.3 Use Case 3 and 4.
The user generated request for displaying data is converted to datarequest() from the
database.The Database Controller in turn checks for availability of data in the database. In
response to this if the data is present in the database an acknowledgment() or
invalidrequest() is invoked accordingly and the data is forwarded to Webpage::Controller.
Depending on whether the user requested data in simple format or graphical format the
methods showdata() and showgraphical() are invoked by the Webpage::Controller which
completes the displaying task.
Biometric Health Monitoring Software Engineering
66
7.3 Use case 5 (View Data)
Figure 2.4 Use Case 5.
Biometric Health Monitoring Software Engineering
67
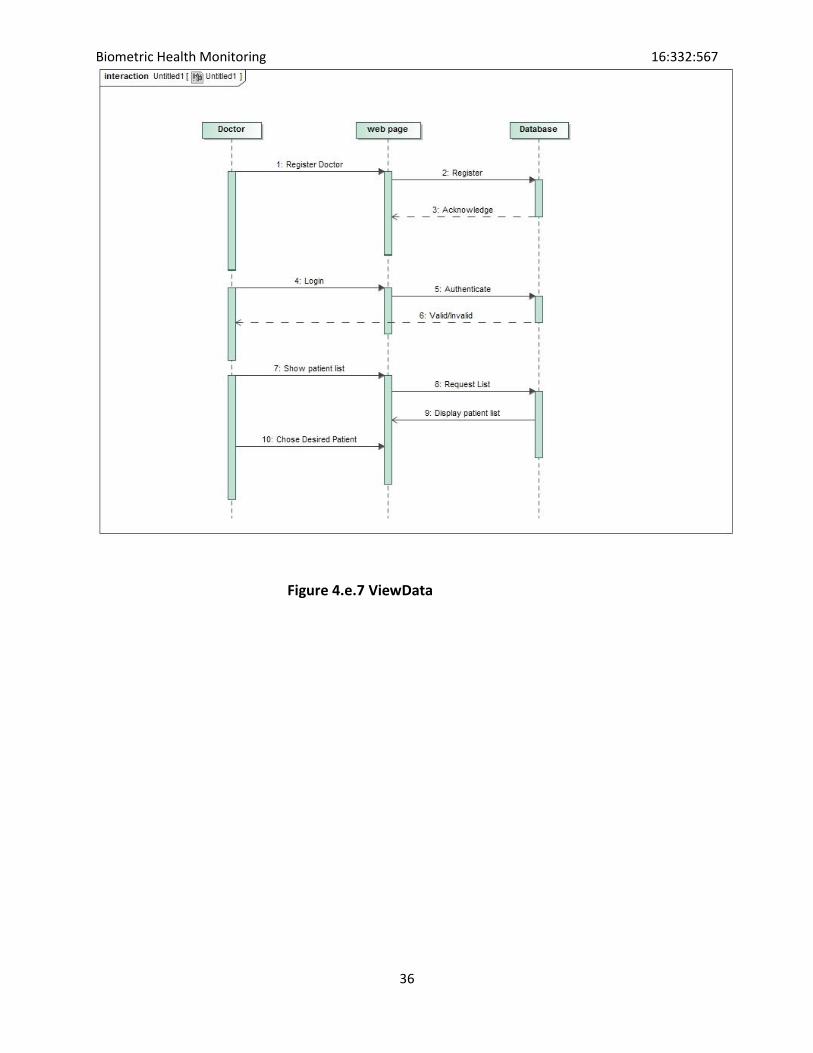
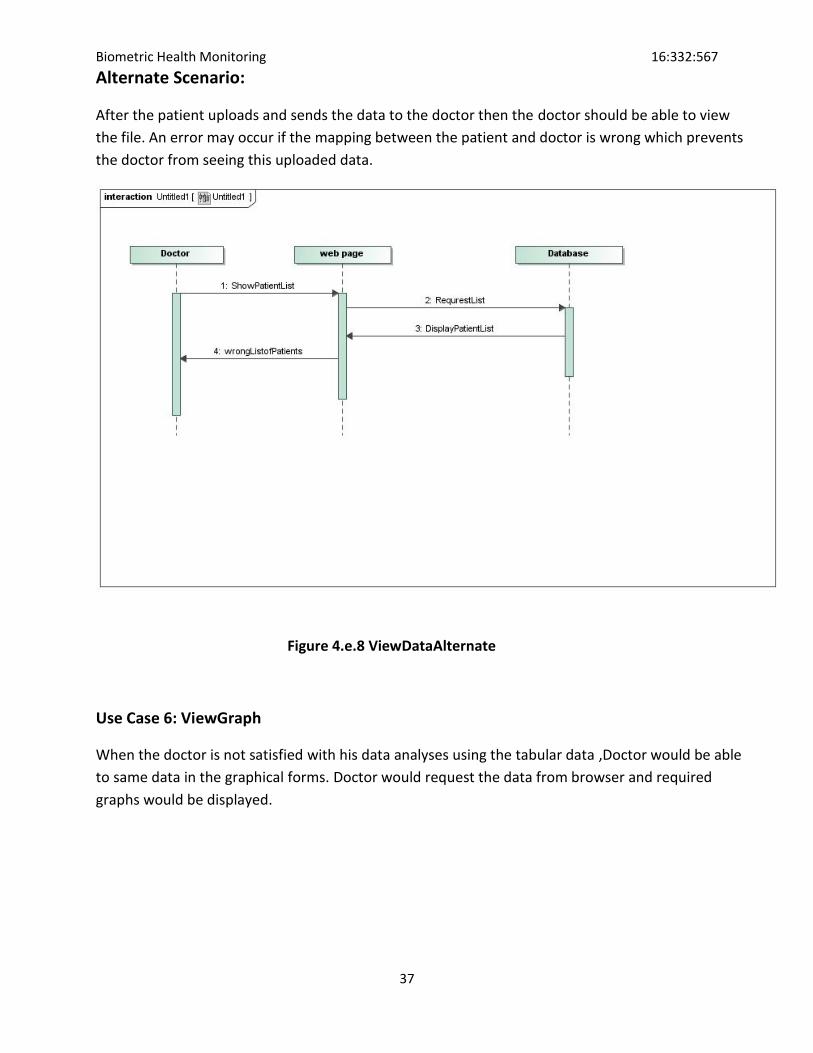
In this scenario,the doctor wants to see the list of patients attached/mapped to this doctor
account and the choose a patient accordingly to view his/her monitored data.
User Interface:-This object constitutes the most important part for user i.e doctor in this
case.All the communications with the system are done through this object only,Doctor
when wishes to see the patients mapped to his account send a request to view the patient
list as shown. Also it shows the patient list system communicated with database and in case
no patient mapped it displays an error message.This part is also responsible for the user
sending the request for patient data and then getting the data displayed to the doctor for
analysis
Webpage/controller:-this object controls all the communications ,requests and responses
from user interface and is responsible for link between database and the user-interface. In
case of request for patient list, webpage parses this request to the database and sends the
response/acknowledgement back to the use-interface.
Database Connection:-Database connection is established whenever any data is required to
be fetched from the database and presented to user or webpage for further processing. The
connection when establishes allow the communication between database and webpage. It
is closes as soon as the response/acknowledgement is sent until next request.
Database:- It stores all the information pertaining to which doctor is mapped to which all
patients and when it receives the request for providing certain list of patients ,it fetches the
desired records and sends the response accordingly to the webpage.
Biometric Health Monitoring Software Engineering
68
7.4 Use Case 6&7(View Graph / Provide FeedBack)
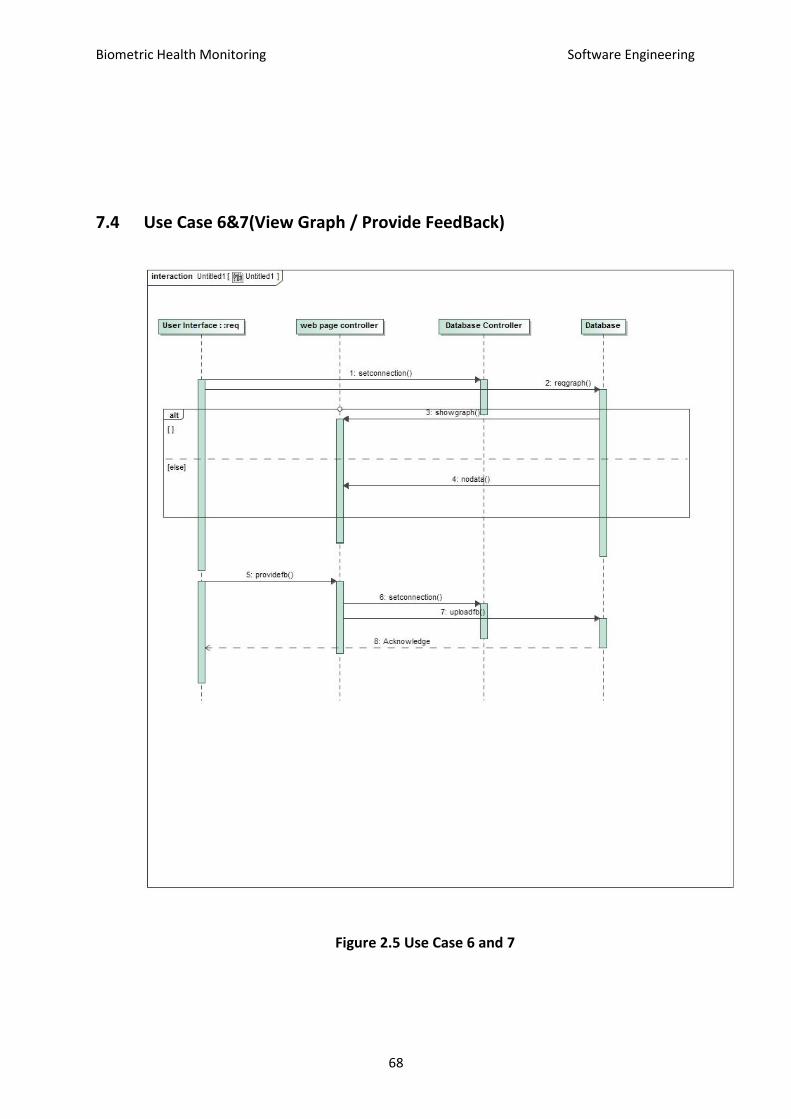
Figure 2.5 Use Case 6 and 7
Biometric Health Monitoring Software Engineering
69
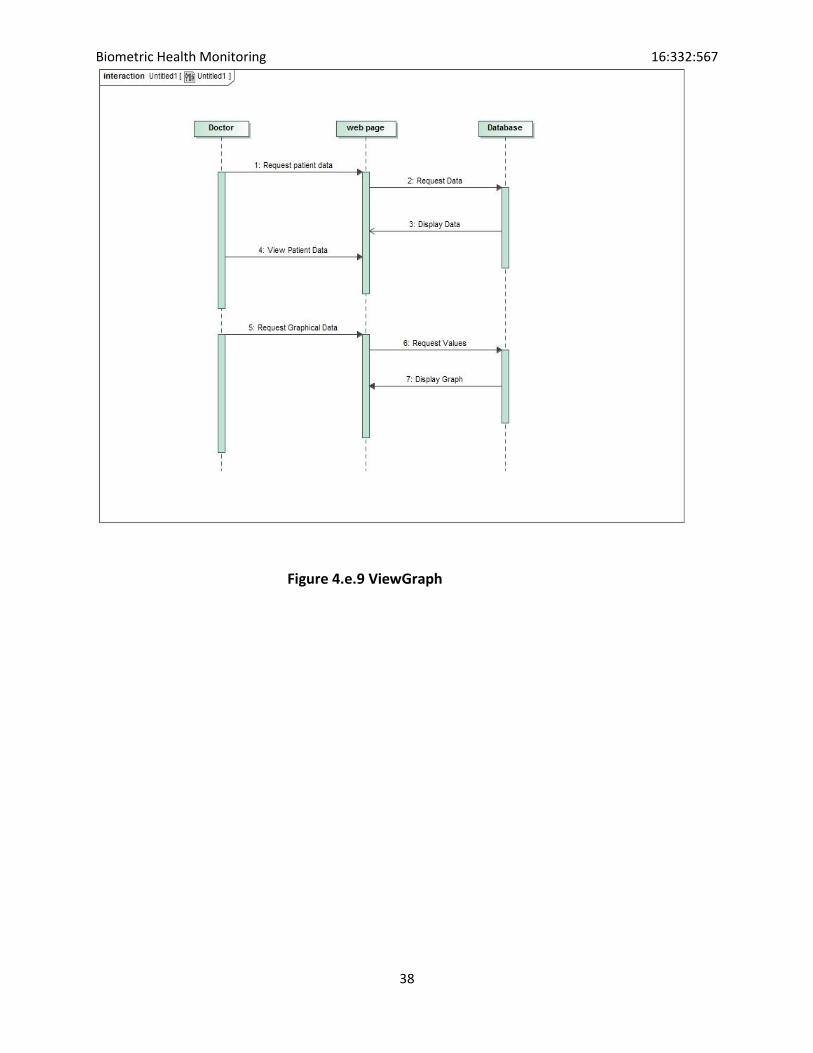
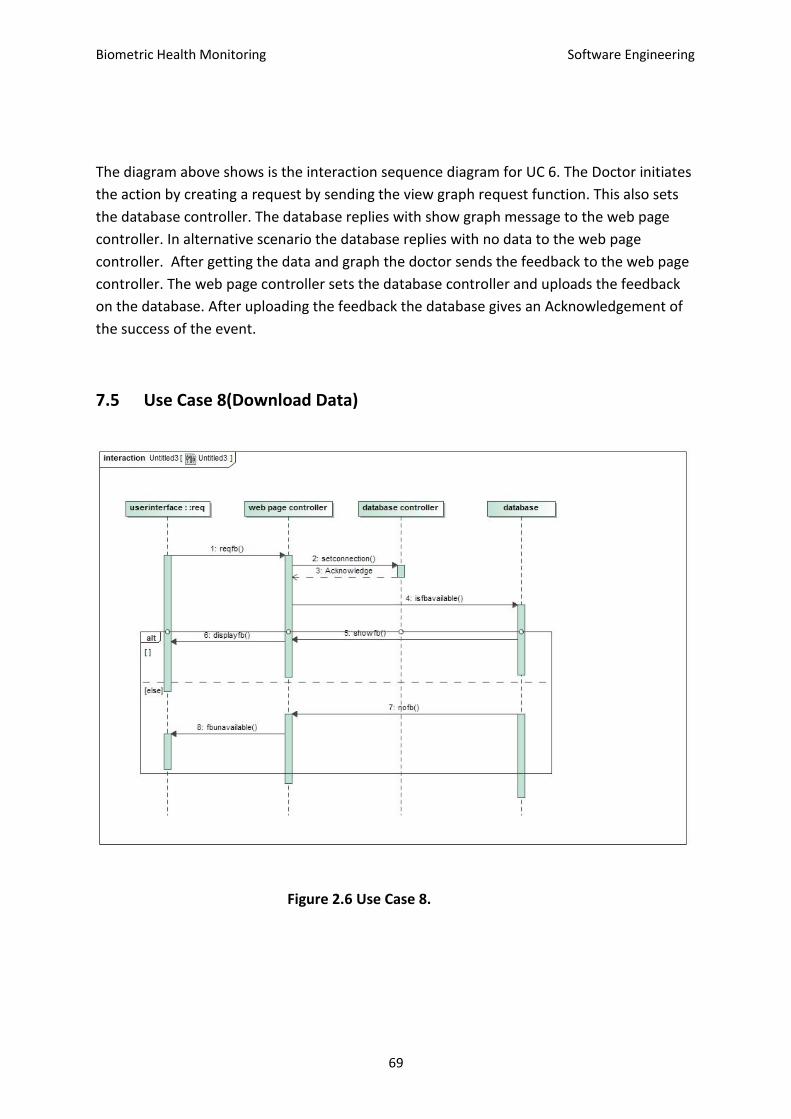
The diagram above shows is the interaction sequence diagram for UC 6. The Doctor initiates
the action by creating a request by sending the view graph request function. This also sets
the database controller. The database replies with show graph message to the web page
controller. In alternative scenario the database replies with no data to the web page
controller. After getting the data and graph the doctor sends the feedback to the web page
controller. The web page controller sets the database controller and uploads the feedback
on the database. After uploading the feedback the database gives an Acknowledgement of
the success of the event.
7.5 Use Case 8(Download Data)
Figure 2.6 Use Case 8.
Biometric Health Monitoring Software Engineering
70
User-Interface:-It allows the feedback provided by the doctor to be viewed by the patient
.Patient request the same by clicking a button “View feedback. If feedback is present user is
able to see that otherwise a message props up displaying that no feedback comments are
available.
Web-Page Controller:- webpage controller gets the request form the user for viewing the
feedback and parses this request to database. It is also responsible for requesting a
connection to the database and proceeding when successful. The connection closing part is
also handled at this stage.
Database connection:- Request from web-page controller for a database connection is
checked for correct credential. This part makes sure that only the intended webpage with
credentials of database is allowed to set up a connection and retrieve the records. If
successful result in the database connection for communication between user and the
database.
Database:- stores the feedback if available in the form of text. when receives the request it
checks against the particular doctor-patient record and see if the feedback is presents,
sends the feedback and connection is closed thereafter by controller.
Design Pattern In the diagrams above we employed the MVC (Model View Controller) pattern[8], which allows for a
modular and scalable approach to software development. The view is the interface the user
interacts with (for example, by entering the user action like viewing data, graphs). The controller
handles the input event from the user interface, often via a registered call back and converts the
event into an appropriate user action, understandable for the model. The controller then notifies the
model of the user action, possibly resulting in a change in the model's state. A view queries the
model in order to generate an appropriate user interface. The user interface waits for further user
interactions, which restarts the control flow cycle. This pattern makes agile development easier and
allows for a more secure deployment.
Biometric Health Monitoring Software Engineering
71
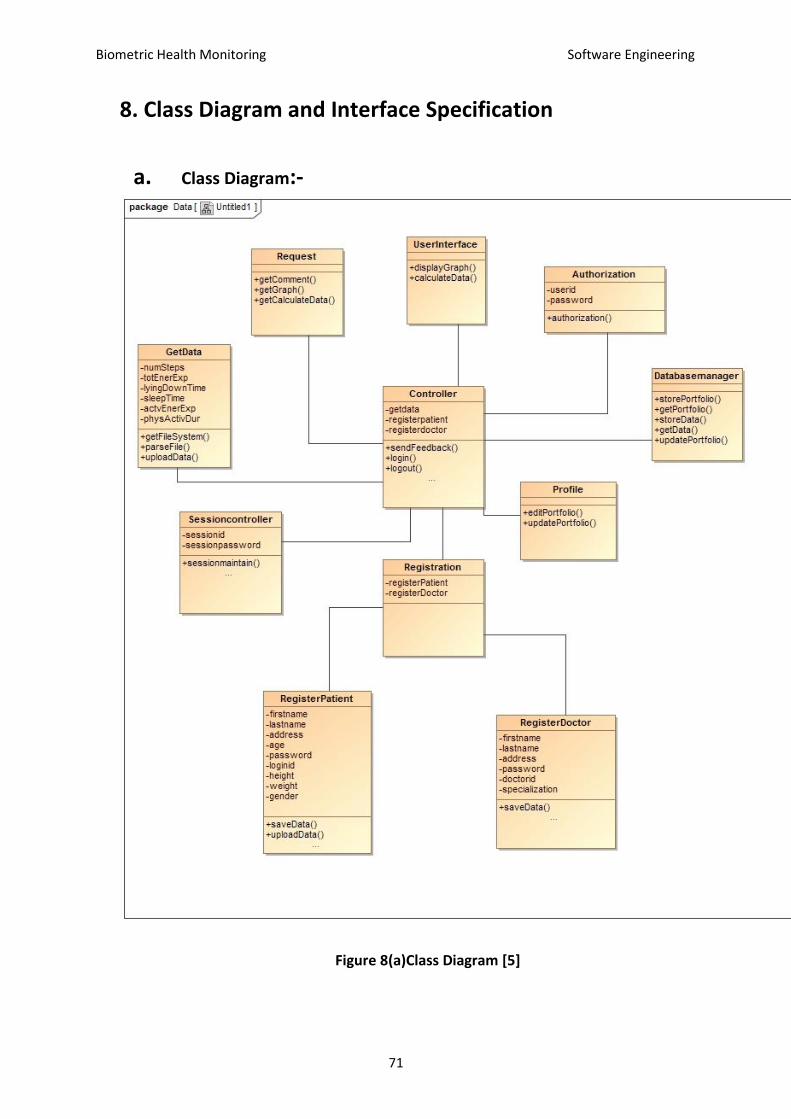
8. Class Diagram and Interface Specification
a. Class Diagram:-
Figure 8(a)Class Diagram [5]
Biometric Health Monitoring Software Engineering
72
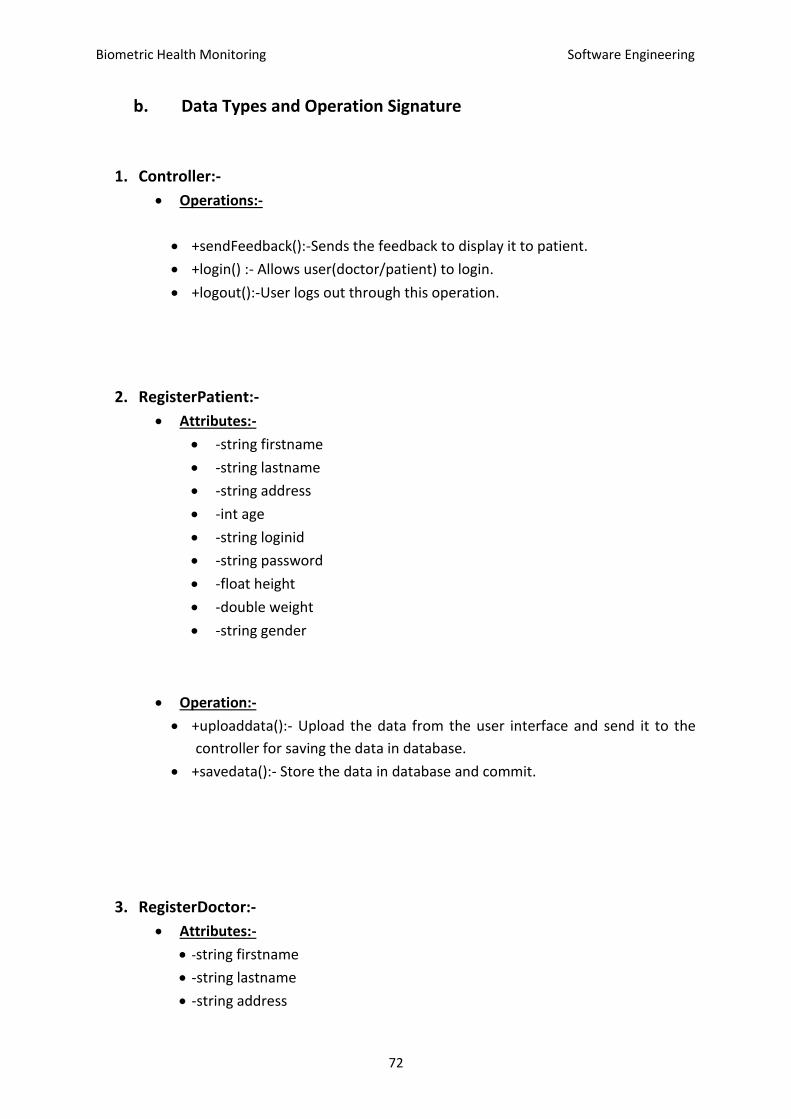
b. Data Types and Operation Signature
1. Controller:-
Operations:-
+sendFeedback():-Sends the feedback to display it to patient.
+login() :- Allows user(doctor/patient) to login.
+logout():-User logs out through this operation.
2. RegisterPatient:-
Attributes:-
-string firstname
-string lastname
-string address
-int age
-string loginid
-string password
-float height
-double weight
-string gender
Operation:-
+uploaddata():- Upload the data from the user interface and send it to the
controller for saving the data in database.
+savedata():- Store the data in database and commit.
3. RegisterDoctor:-
Attributes:-
-string firstname
-string lastname
-string address
Biometric Health Monitoring Software Engineering
73
-string password
-string Doctorid
-string specialization
Operation:-
+savedata():- Store the data in database and commit.
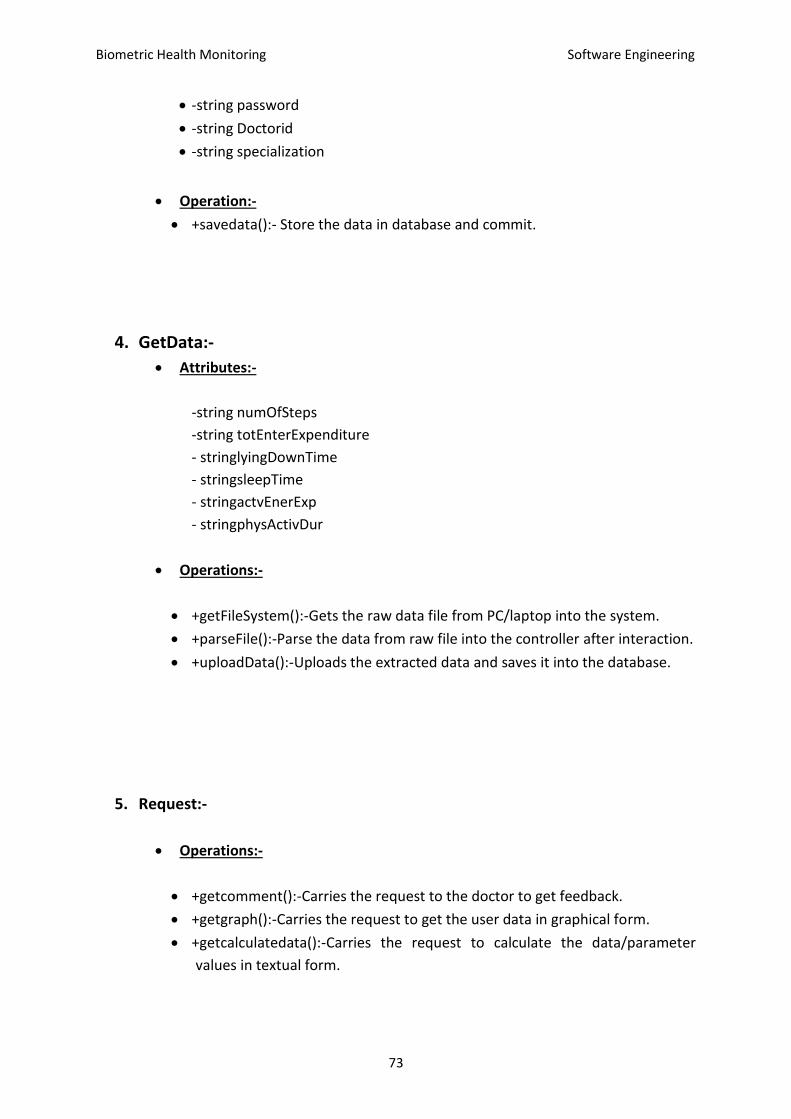
4. GetData:-
Attributes:-
-string numOfSteps
-string totEnterExpenditure
- stringlyingDownTime
- stringsleepTime
- stringactvEnerExp
- stringphysActivDur
Operations:-
+getFileSystem():-Gets the raw data file from PC/laptop into the system.
+parseFile():-Parse the data from raw file into the controller after interaction.
+uploadData():-Uploads the extracted data and saves it into the database.
5. Request:-
Operations:-
+getcomment():-Carries the request to the doctor to get feedback.
+getgraph():-Carries the request to get the user data in graphical form.
+getcalculatedata():-Carries the request to calculate the data/parameter
values in textual form.
Biometric Health Monitoring Software Engineering
74
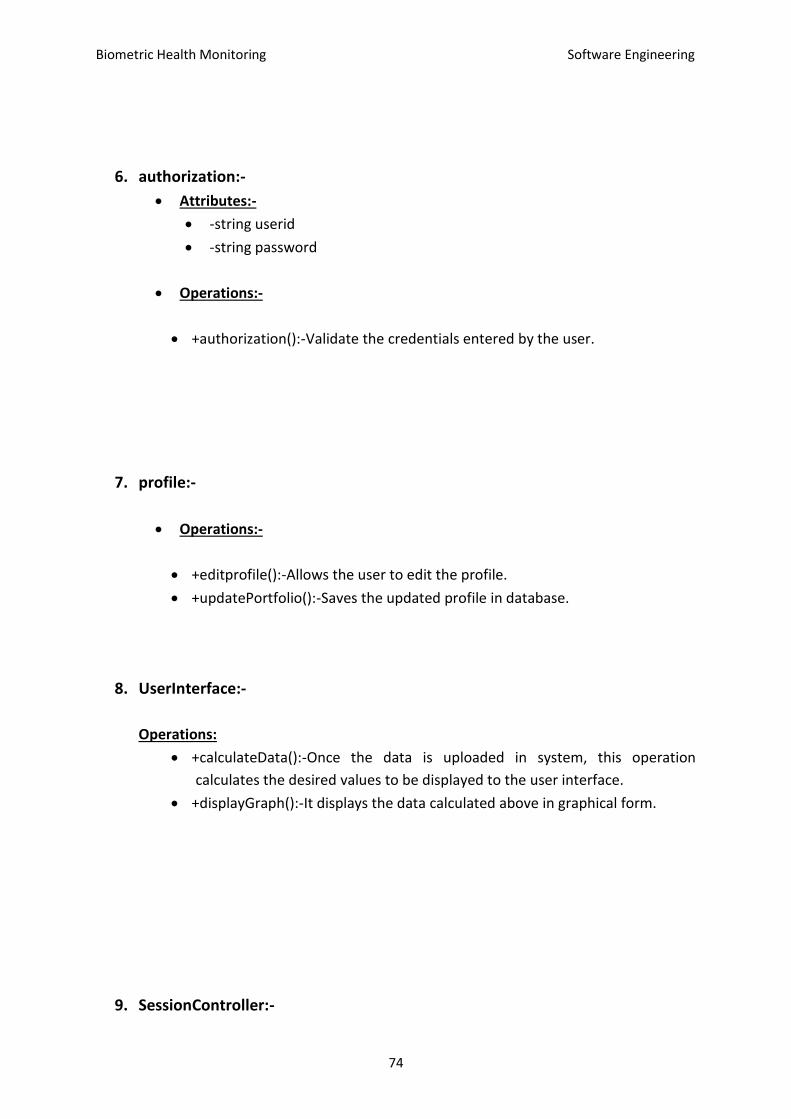
6. authorization:-
Attributes:-
-string userid
-string password
Operations:-
+authorization():-Validate the credentials entered by the user.
7. profile:-
Operations:-
+editprofile():-Allows the user to edit the profile.
+updatePortfolio():-Saves the updated profile in database.
8. UserInterface:-
Operations:
+calculateData():-Once the data is uploaded in system, this operation
calculates the desired values to be displayed to the user interface.
+displayGraph():-It displays the data calculated above in graphical form.
9. SessionController:-
Biometric Health Monitoring Software Engineering
75
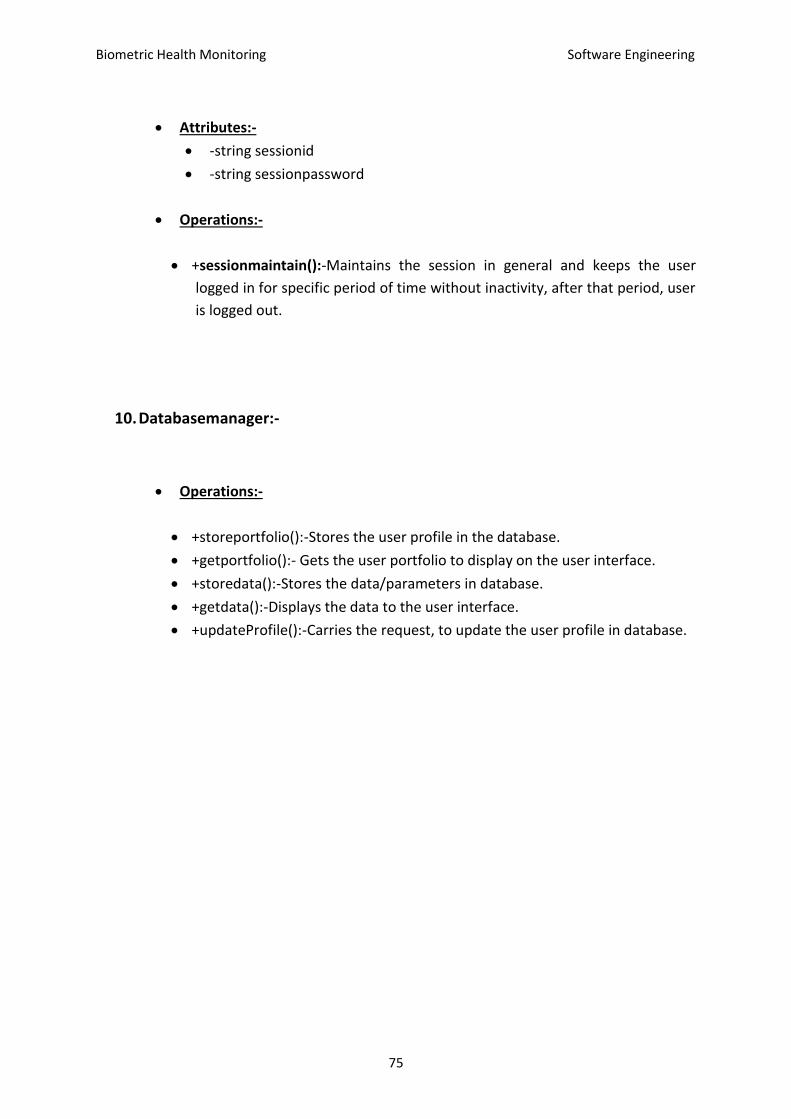
Attributes:-
-string sessionid
-string sessionpassword
Operations:-
+sessionmaintain():-Maintains the session in general and keeps the user
logged in for specific period of time without inactivity, after that period, user
is logged out.
10. Databasemanager:-
Operations:-
+storeportfolio():-Stores the user profile in the database.
+getportfolio():- Gets the user portfolio to display on the user interface.
+storedata():-Stores the data/parameters in database.
+getdata():-Displays the data to the user interface.
+updateProfile():-Carries the request, to update the user profile in database.
Biometric Health Monitoring Software Engineering
76
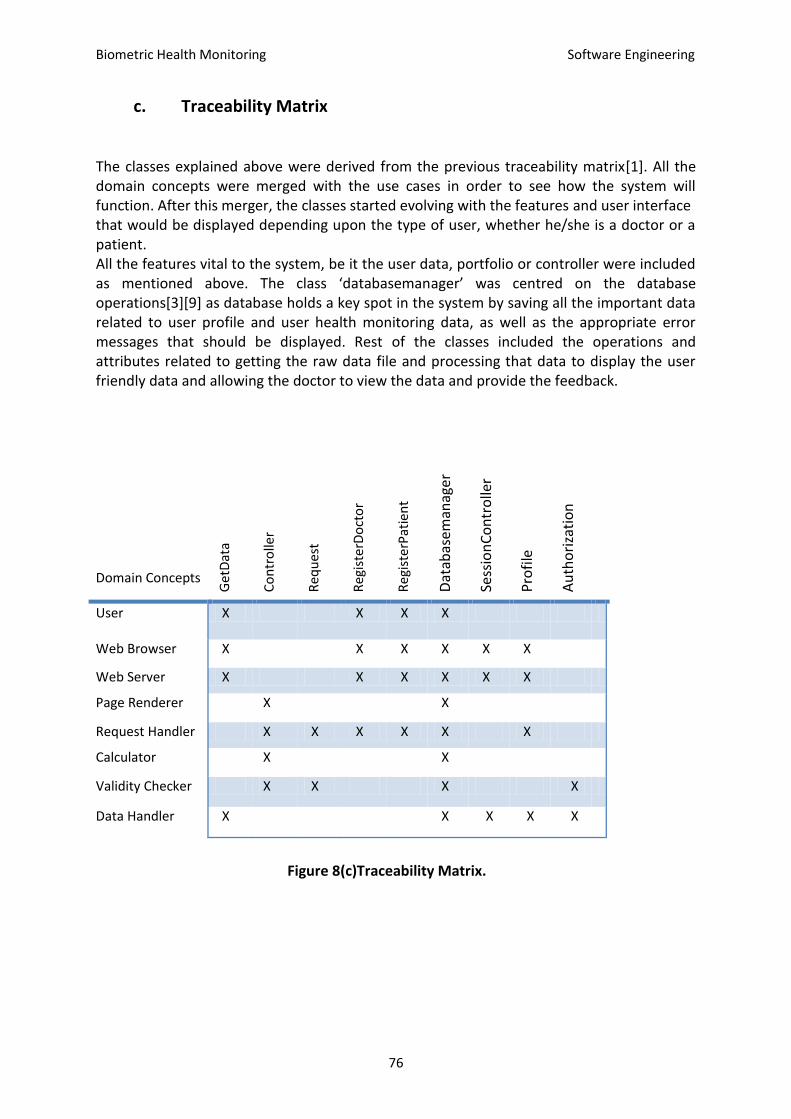
c. Traceability Matrix
The classes explained above were derived from the previous traceability matrix[1]. All the domain concepts were merged with the use cases in order to see how the system will function. After this merger, the classes started evolving with the features and user interface that would be displayed depending upon the type of user, whether he/she is a doctor or a patient. All the features vital to the system, be it the user data, portfolio or controller were included as mentioned above. The class ‘databasemanager’ was centred on the database operations[3][9] as database holds a key spot in the system by saving all the important data related to user profile and user health monitoring data, as well as the appropriate error messages that should be displayed. Rest of the classes included the operations and attributes related to getting the raw data file and processing that data to display the user friendly data and allowing the doctor to view the data and provide the feedback.
Domain Concepts
Get
Dat
a
Co
ntr
olle
r
Req
ues
t
Reg
iste
rDo
cto
r
Reg
iste
rPat
ien
t
Dat
abas
eman
ager
Sess
ion
Co
ntr
olle
r
Pro
file
Au
tho
riza
tio
n
User
X X X X
Web Browser X X X X X X
Web Server X X X X X X
Page Renderer X X
Request Handler X X X X X X
Calculator X X
Validity Checker X X X X
Data Handler X X X X X
Figure 8(c)Traceability Matrix.
Biometric Health Monitoring Software Engineering
77
During our first understanding of system to be, we developed the concept of
WebFramework, however while working on the system we realized that most of the task
involved could be managed by making some changes to concepts like WebServer, Controller
and request handler hence that concept is not shown in the traceability matrix. From the
traceability matrix we prioritized the classes and organized the functions in each class
accordingly. From the traceability matrix it was found out that databasemanager class was
the most important or the highest priority class and the rest were surrounded around it to
support its functioning.
Design Patterns We employed several design patters in different sections of our code. For the most part, we used the Command Pattern and Delegation in the way that any click of button in the GUI would delegate the next responsibility to some other class via a method call, and that would sometimes delegate to yet another class. The command pattern is also used in Update in the way that it is ‘commanded’ to update certain variables/parameters. Furthermore, we use direct Request-Based communication in two ways: method calls to the class Update return nothing but they update variables in various objects throughout the program whereas method calls to Compute do not change any parameters, it simply reads certain data to produce graphs so each method in Compute returns a graph. Some of these patterns arose out of our initial intention of how the program should be structured. Others were seen as more advantageous as time went on and were then implemented by changing the way we had originally designed it.
Object Constrained Language (OCL) Contract Specifications
Controller:-
Invariant :- co-ordinates all the actions like registration ,getting data from file and displaying
the graphical and user data as well as saving and displaying the feedback.
Pre-Condition:- Application should be opened in User machine.
Post Conditions:- The user is able to register, viewdata or view feedback if use is Patient and
should be able to submit feedback as well if user is Doctor. Session Maintenance is also
present.
Request:-
Invariant:-User request for viewing doctor feedback , view graph or calculating the data.
User should be a valid patient or Doctor
Biometric Health Monitoring Software Engineering
78
contextController inv:
user == valid(doctor) || valid(patient)
Pre-Condition:-User must be a logged in the system.
Post Condition :- The User request is passed to the concerned event handler depending
upon the request.
GetData:-
Invariant:-Must be a valid file type as mentioned in User requirement Section
contextController inv:
filetype == valid(excel)
Pre-Condition:-The file to be uploaded should placed in the system and must contain data in
valid format as specified in User requirements.
Post Condition :-Data from Excel file is parsed into the system and saved in the database.
SessionController:-
Invariant :-should receive a request for logoff, must track the time user is logged into the
system and request for log- off generated after specified period of inactivity.
Pre-Condition:- User is logged into the system.
Post-Condition :-User Session should be logged out after inactivity of 15 minutes and
maintained otherwise until requested log-off
Registration:-
Invariant :-User must be an unregistered user with the system.
Pre-Condition:- All the mandatory personal details asked should be entered by the user,
additionally in case of Patient, the doctor(consultant mapped) name must be entered.
Post-Condition :-User gets registered with the system and is ready to proceed with his/her
health monitoring.
Authorization:-
Invariant:- User must be an registered user with the system.
contextController inv:
Biometric Health Monitoring Software Engineering
79
User == valid;
Pre-Condition:- User enters a valid username and password
Post-Condition:- User is logged into the system.
DatabaseManager:-
Invariant:-should create a connection with database only if correct DB credentials are
passed.
contextController inv:
DBusenamr == valid;
DBpassword == valid;
Pre-Condition:- Request sent to fectch or save userinformation,userdata or feedback into
the database.
Post-Condition:- Requested data is sent to the Controller.
Profile:-
Invariant:-User must be a registered user with the system and must be logged in system.
contextController inv:
user == valid;
Pre-Condition:- Request for viewing or editing profile data.
Post-Condition:- Profile is edited and changes are saved in the database.
UserInterface:-
Invariant:-User must be logged in to receive a request to display profile, calculate data or
view graph.
Pre-Condition:-A request is made in user profile for ex. View graphs.
contextController pre:
Bool req_viewgraphs;
If(Bool)
Post-Condition:- Graphs are displayed on the user Interface.
Biometric Health Monitoring Software Engineering
80
9. System Architecture and System Design
a. Architectural Styles
Before speaking of the kinds of architectural styles[1], it is useful to provide a definition of
an architectural style. “An architectural style …defines a family of systems in terms of a
pattern of structural organization. More specifically, an architectural style determines the
vocabulary of components and connectors that can be used in instances of that style,
together with a set of constraints on how they can be combined. Web applications usually
combine a mix of architectural styles. The frontend design uses the Model-View-Controller
architecture[8], which is considered to be a Separated-Presentation architectural style[8].
The separated-presentation architectural style describes the separation of presentation
code from internal logic code. It is also using the client/server architectural style. All of the
data to run the application is stored centrally on the BHM server, but many clients can
access the web application from different places around the world through many different
Internet browsers. Both the frontend and the backend are using the component-based
architectural style by using design and development languages that allows them to run,
independent of the platform they are on. In this way, the code gets great reusability and
allows for growth and scalability. Sometimes, the Representational State Transfer (REST) is
described as an architectural style when it is thought of as being comprised of a uniform
interface and a layered architectural style.
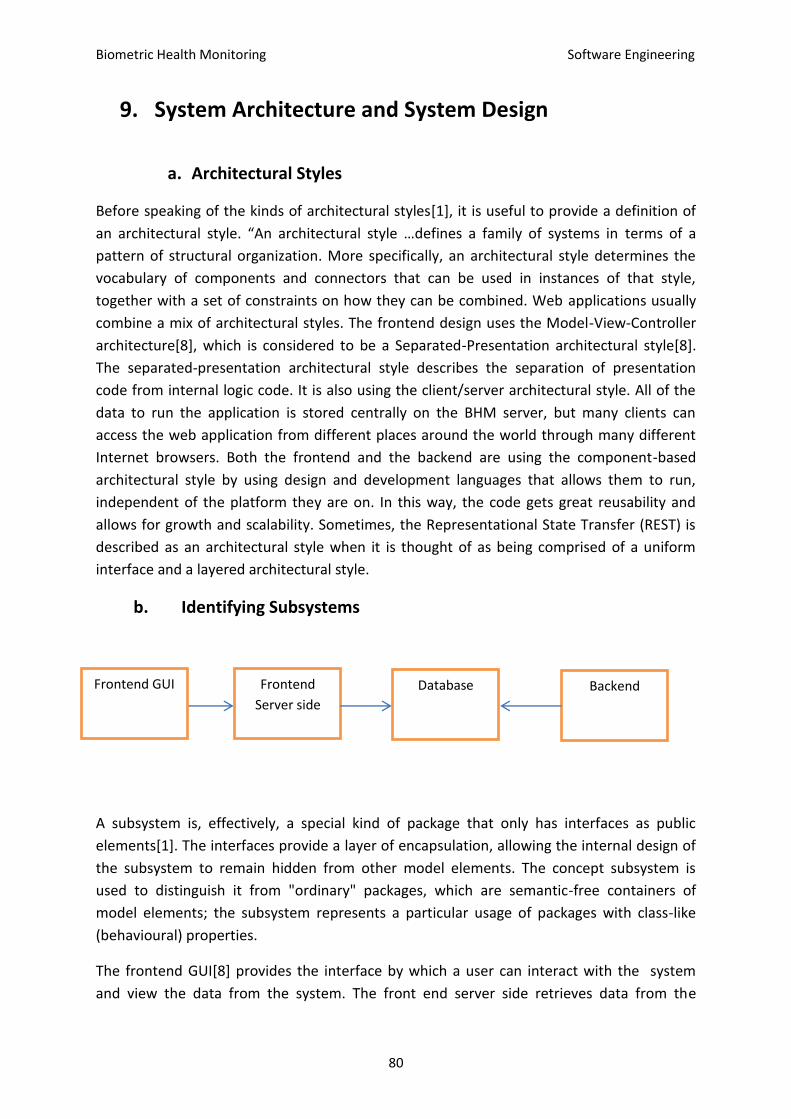
b. Identifying Subsystems
A subsystem is, effectively, a special kind of package that only has interfaces as public
elements[1]. The interfaces provide a layer of encapsulation, allowing the internal design of
the subsystem to remain hidden from other model elements. The concept subsystem is
used to distinguish it from "ordinary" packages, which are semantic-free containers of
model elements; the subsystem represents a particular usage of packages with class-like
(behavioural) properties.
The frontend GUI[8] provides the interface by which a user can interact with the system
and view the data from the system. The front end server side retrieves data from the
Backend Database Frontend
Server side
Frontend GUI
Biometric Health Monitoring Software Engineering
81
database and presents it to the user via the frontend GUI. It also stores new data of patient
in the database. The database holds all the persistent information such as user info,
portfolios, the data history. The backend handles doctor notifications of provided feedback
and updates user information and data histories appropriately.
c. Mapping Subsystems to Hardware
While the server is contained to one machine, the system as a whole is spread across
different machines. The system is effectively split into two separate and fairly independent
sections, a frontend and a backend, with the database (residing on the server) acting as the
intermediary between the two. The frontend is further subdivided into a GUI component
which runs within a web browser on a client computer (or realistically, many clients’
computers) is providing a rich interactive experience and the server side portion runs within
the web server process on the server. The server side frontend handles interaction between
the GUI and the database, such as retrieving profile and ensuring data is properly and
legitimately entered into the database. The backend process runs on the server alongside
the database and the server side half of the frontend.
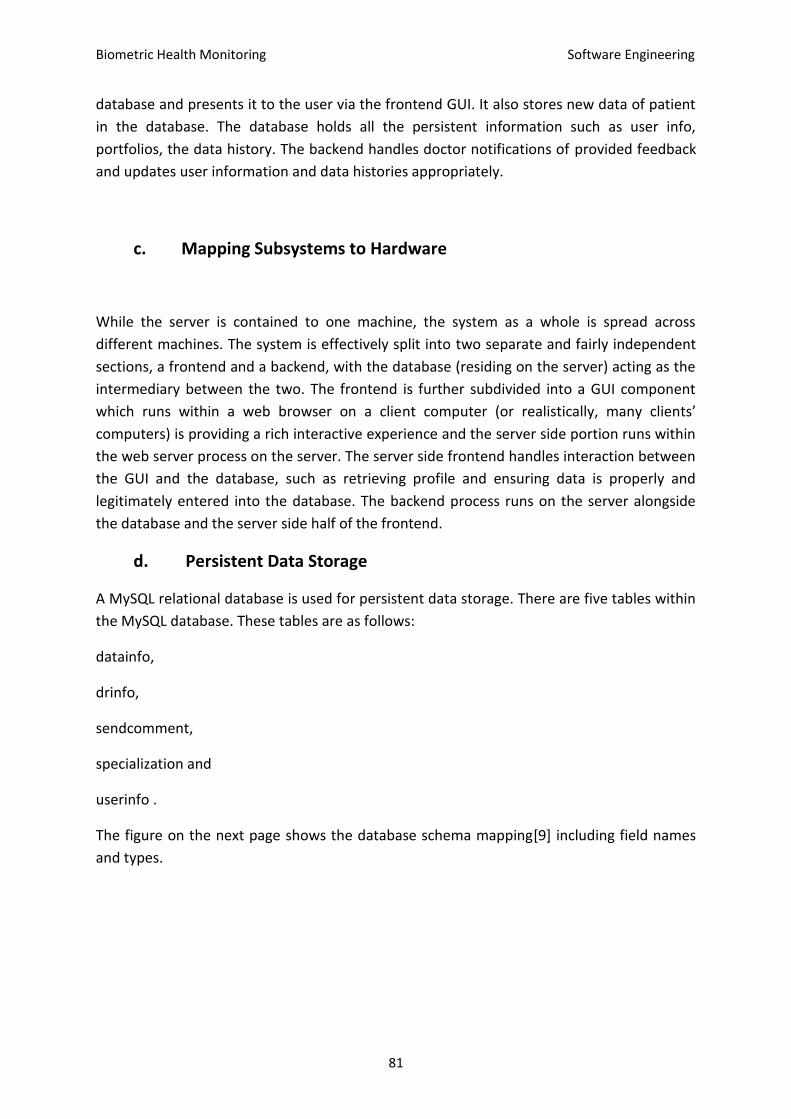
d. Persistent Data Storage
A MySQL relational database is used for persistent data storage. There are five tables within
the MySQL database. These tables are as follows:
datainfo,
drinfo,
sendcomment,
specialization and
userinfo .
The figure on the next page shows the database schema mapping[9] including field names
and types.
Biometric Health Monitoring Software Engineering
82
Figure 9.d.1 Database tables
The docinfo and userinfo table stores the user's and doctors’ information such as username,
password (encrypted), email, address, age, sex, specialization, height, weight etc. These
tables also holds the primary key based on user and doctor which are use_id and doc_id
respectively. Each user has a unique ‘id’ associated with their account. This id is the primary
key. The datainfo table stores the docid, userid and other data of user like, number of steps,
lying down time, sleep time, energy expenditure, physical activity duration, etc.
Biometric Health Monitoring Software Engineering
83
e. Network Protocol
The BHM is self-contained to one server. Running on the localhost, there is a MySQL
database server and an Apache web server[18]. The client is comprised of html, JSP[12][13]
and will interact with user having these services. There are different external connections
needed for the server. First, the website is accessed via incoming HTTP requests on port 80,
this is an Internet standard, all user interactions happen over the frontend web interface.
Both the backend and frontend make outgoing HTTP requests to gather the data and
calculate the required information to be provided. Internally, there are different
connections needed for application communication. The frontend relies on JSP's internal
drivers to connect to a MYSQL database for access to the persistent data and JAVA for core
calculation[15]. The backend uses the JDBC driver to connect to the MySQL database[18].
f. Global Control Flow
Our system is event-driven in that it waits for users’ input and acts according to it. User
interaction is required in frontend features like logging in, placing a data, etc. The system
does not log anyone in until the initial event is driven by an external request. Also, we have
a timer run in our backend program to fetch user Information and Data. For time
dependency, the backend of our system periodically processes pending data. The system
has multiple threads to support multiple users operating at the same time and upload data
whenever user wants.
g. Hardware Requirements
Server-Side
Note that a complete scalability analysis has not been performed, so the server- side
hardware requirements are based on the needs of the current website.
A WLAN connection is required so necessary hardware includes a network card. This
hardware profile is everything needed for server maintenance and administration on the
current server.
Client-Side
Biometric Health Monitoring Software Engineering
84
On the client side, the client needs to have a monitor to view the GUI Display. In addition,
since a web browser is required, the other hardware that comprises a computer is required
such as CPU, Graphics Card, RAM, keyboard, mouse, etc. A web connection is also required,
so the computer must contain a network card (whether wireless or Ethernet).
10. Algorithms and Data Structures
Algorithms
BMI:- The body mass index (BMI)[8], or Quetelet index[8], is a heuristic proxy for estimating
human body fat based on an individual's weight and height.
BMI = ( mass(in lbs)/(height(in inch))^2 ) * 703
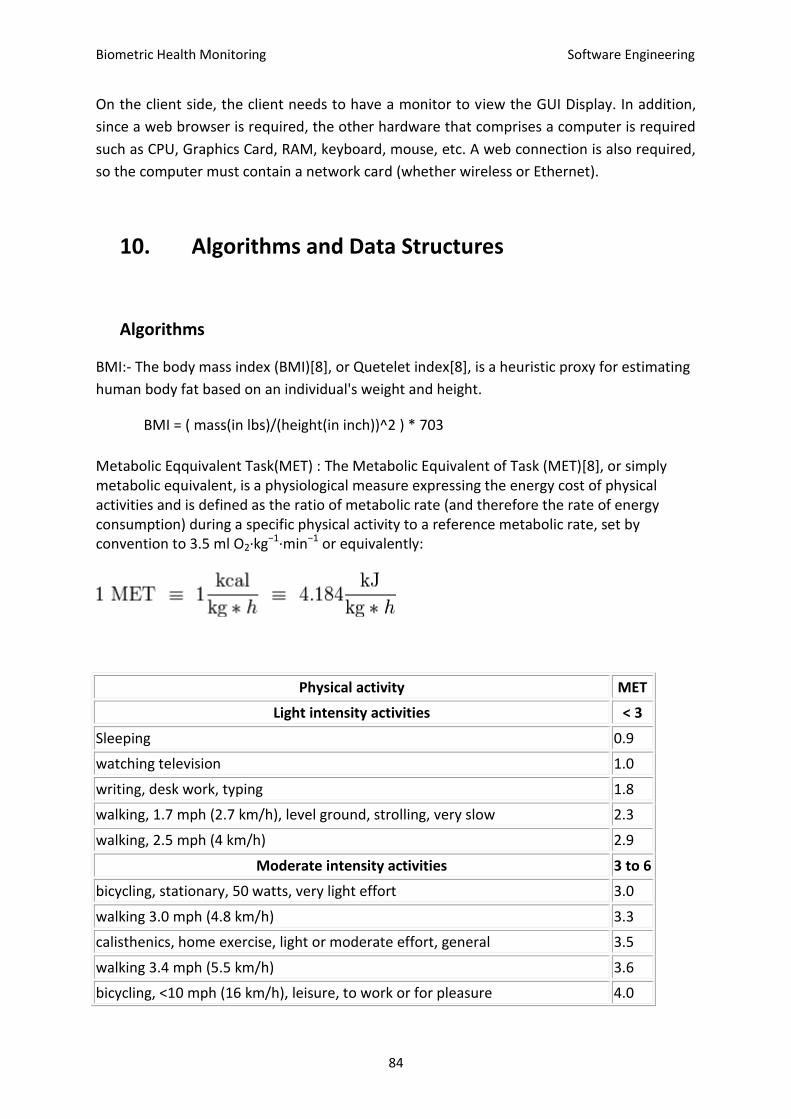
Metabolic Eqquivalent Task(MET) : The Metabolic Equivalent of Task (MET)[8], or simply metabolic equivalent, is a physiological measure expressing the energy cost of physical activities and is defined as the ratio of metabolic rate (and therefore the rate of energy consumption) during a specific physical activity to a reference metabolic rate, set by convention to 3.5 ml O2·kg−1·min−1 or equivalently:
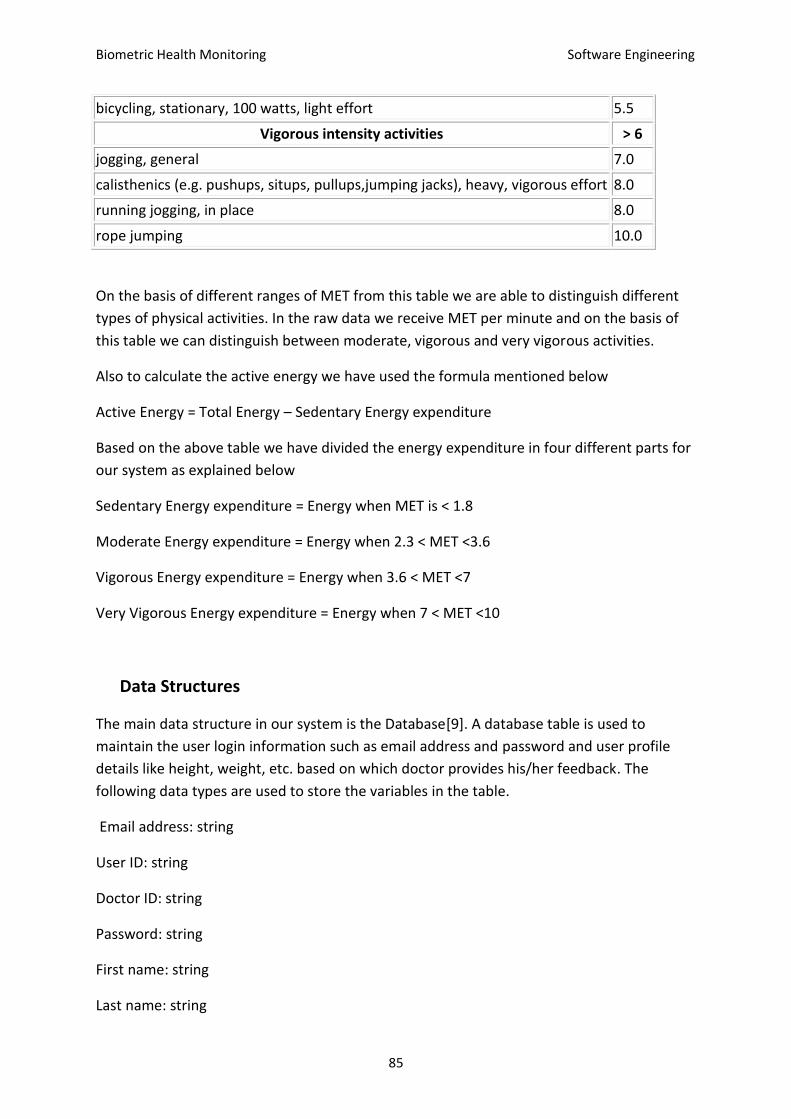
On the basis of different ranges of MET from this table we are able to distinguish different
types of physical activities. In the raw data we receive MET per minute and on the basis of
this table we can distinguish between moderate, vigorous and very vigorous activities.
Also to calculate the active energy we have used the formula mentioned below
Active Energy = Total Energy – Sedentary Energy expenditure
Based on the above table we have divided the energy expenditure in four different parts for
our system as explained below
Sedentary Energy expenditure = Energy when MET is < 1.8
Moderate Energy expenditure = Energy when 2.3 < MET <3.6
Vigorous Energy expenditure = Energy when 3.6 < MET <7
Very Vigorous Energy expenditure = Energy when 7 < MET <10
Data Structures
The main data structure in our system is the Database[9]. A database table is used to
maintain the user login information such as email address and password and user profile
details like height, weight, etc. based on which doctor provides his/her feedback. The
following data types are used to store the variables in the table.
Email address: string
User ID: string
Doctor ID: string
Password: string
First name: string
Last name: string
Biometric Health Monitoring Software Engineering
86
Date of birth: date
Sex: string
Weight: float
Height: float
Occupation: string
A database table[9] is used to maintain the data information regarding various patients’
health parameters parsed from the file uploaded by the user. The following data types are
used to store the variables in the table.
Doc id: string
User id: string
Total energy expenditure: float
Number of steps: int
Lying down time: float
Sleep time: float
Active energy expenditure: float
Physical activity duration: float
A database table is used to maintain the feedback information sent by the doctor to the
patients. The following data types are used to store the variables in the table.
Comment: string
Doc id: string
User id: string
Date: date
Other than the data structures stated above our system doesn’t use any other complex data
structures.
11. User Interface Design and Implementation
Biometric Health Monitoring Software Engineering
87
Login Page:
Figure 11.1 Login Page
In the User Interface design[16], In login Screen User can login the application using
unique username and password provided during registration. If the user has not
registered yet he can go with sign up option where the User has to enter all the
information related to him and should specify the doctors’ name while registering. This
Doctor is then associated with his profile and any review request from this user will be
directed to him. Unlike many user interfaces this promises to be more effective because
of its simplicity since usually patients are made to enter too many private details like
SSN, Nationality, Race, which don’t have anything to do with users’ diagnosis with which
the user may not be comfortable answering. After the registration the user can feel free
to access his account with his ID anytime.
Home page:
Biometric Health Monitoring Software Engineering
88
The initially proposed home screen was little dull and lacked a logo and picture. The tabs
were also altered and categorized. Each of the “tabs” in the above screen is a hover-
style menu, unlike the initial design. JSP and html were used to create these menus.
User home page:
Fig 11.2 Home Page
The Homepage as shown in Fig11. 2 provides new menus tabs on the screen. Managing
user account, uploading data, calculate, contact information and logout can be found in
tab on the home screen. We felt this is an easy and user friendly way to integrate most
of the functionality on a single page. The file upload option from the system has also
been provided on the same page to reduce the user effort for these functions.
Data Interpretation Using Graphs :-
Biometric Health Monitoring Software Engineering
89
Number of Steps:-
Fig 11.3 Number of Steps
The graph in Fig 11.3 depicts the number of steps taken by the patient over the period of
time for which data is requested by the user. The x-axis of graph displays the time
duration and y-axis the number of steps. The x-axis is divided into six equal parts of the
total time duration chosen. For ex. If data is requested for 24 hours, each bar will depict
the steps taken in each four hour duration window. In above graph, we see around 350
steps taken in first 4 hours.
Energy Expenditure Graph:-
Biometric Health Monitoring Software Engineering
90
Fig 11.4 Energy in calories per minute
The graph in fig 11.4 depicts the Energy expenditure per minute of the patient over the
given period of time for which data request is made. The x-axis shows the duration and
y-axis shows the energy spent in calories per minute. The red color depicts the increase
in energy expenditure from past minute reading while black color shows the fall in
energy expenditure as compared to previous minute reading.
Total and Active Energy Expenditure:-
Fig 11.5 Total and Active Energy
In Fig 11.5, the first meter graph shows the total energy expenditure in calories for the
whole duration chosen by the user, while the meter on Right hand side shows the active
energy expenditure of the patient for the complete duration. Here Active energy means
the energy spent while doing some actual physical activity and does not include the
sedentary energy expenditure.
Total Physical activity Duration:-
Fig 11.6 Total Physical activity Duration
The meter graph in Fig11. 6 displays the total time spent in hours while doing a physical
activity[8] by the user. This physical activity can be of four different types sedentary,
Biometric Health Monitoring Software Engineering
91
vigorous, very vigorous and moderate .For ex. In above graph time spent is almost 3
hours.
Percentage duration per activity:-
Fig 11.7 Percentage duration
The fig 11.7 graph shows the percentage breakdown of duration for different types of
physical activities as explained above. Another feature that we added is that upon
clicking on any activity section, we can see the total energy spent in calories while doing
that activity.
Sleep Duration:-
Biometric Health Monitoring Software Engineering
92
Fig 11.8 Sleep Duration
The graph in figure 11.8 shows the sleep pattern of a patient for past one week. The x-
axis shows the time at which a user starts his sleep and y-axis shows the number of
minutes the user sleeps for. An important feature that can distinguish this application
from other standard software's is that in sleeping time, lying down time (i.e. person lying
down but not sleeping) is not included in the sleeping time. Every bar will break as the
patient gets awakened and starts again as the patient sleeps again. Regular
discontinuous small bars depicts that the patient is suffering from some kind of
insomnia.
Lying Down Time:-
Biometric Health Monitoring Software Engineering
93
Fig11. 9 Lying down time
Figure 11.9 displays the lying down pattern similar to the sleeping time depicted and
explained above in figure 11.8.In this lying down time, sleep time is not included. For
instance, long bars show that the person has been doing rest for longer durations.
12. Design of Tests:-
These are test cases for determining the correctness of implemented structures in the
program [1][8]
1. Test case id: Login_TC
Unit to test: User/Doctor Login
Assumptions: The program has displayed the input Login screen and is waiting for user
Action
Input values Expected Results
Pass/Fail Comments
Valid userid, valid password
Login Succesfully
Pass if result meets the expected result.
This test case shows that system is allowing valid/existing users to log in.
Biometric Health Monitoring Software Engineering
94
Invalid UserID/Password
Display error (Eg. “Invalid User ID/Pssword”)
Pass if result meets the expected result.
This test case shows that system displays invalid user message for unregistered users or registered users entering incorrect log in information.
Table 12.1 Login_TC
2. Test case id: Register_TC
Unit to test: User/Doctor Register
Assumptions: The program has displayed the input Login/Register screen and is waiting for
user
Action
Input values Expected Results Pass/Fail Comments
User information with an existing user-id field
Display error in registration.(Eg.”User ID already in use.Pleaseselect a different ID”).
Pass if result meets the expected result.
This test case shows that user doesn’t allow same user-id to be used twice.
User information with an unique user-id field
Register Successful Pass if result meets the expected result.
This test case shows that new user is successfully registered.
Table 12.2 Register_TC
3. Test case id: Upload_TC
Unit to test: file type
Assumptions: The program has displayed the user homepage and user wants to upload his
data
Action
Input values Expected Results Result Comments
User uploads a file with .xls extension with desired data format.
The file should be successfully uploaded
Pass if result meets the expected result.
This test case shows that user sends a proper.xls file to upload.
Biometric Health Monitoring Software Engineering
95
User uploads a file with .xls extension with random data format.
Proper error should be displayed.(Eg. “Wrong file selected”).
Pass if result meets the expected result.
This test case shows that .xls file with improper format is will not be allowed to upload.
User tries to upload a file other than .xls extension.
Error should be displayed that file format is not proper. (Eg.”Invalid Format ”).
Pass if result meets the expected result.
Only .xls files are allowed to be uploaded.
Table 12.3 Upload_TC
4. Test case id: Mapping-TC
Unit to test: Database and User-profile consistency
Assumptions: The correct .xls has been uploaded and data has been extracted from the file
and stored in the database.
Input values Expected Results Result Comments
Extracted data from the .xls file.
The extracted data is mapped to the correct user.
Pass This test shows that the consistency between database and User records is maintained.
Table 12.4 Mapping_TC
5. Test case id: UserReview_TC
Unit to test: User request
Assumptions: The User has logged in and needs a review of his profile from doctor.
Input values Expected Results Result Comments
User saves the data shown above to the doctor.
Appropriate Doctor is able to see that patients data and profile.
Pass if result meets the expected result.
This test ensures correct mapping between users and doctor.
Table 12.5 UserReview_TC
Biometric Health Monitoring Software Engineering
96
6. Test case id: EditProfile_TC
Unit to test: Profile information
Assumptions: User already has created a profile and has a valid user id.
Input values Expected Results Result Comments
Update new valid profile information.
Profile update successful.
Pass if result meets the expected result.
This test shows that user has entered expected format for the profile information.
Updates new information but with incorrect format.
Profile update unsuccessful.
Pass if result meets the expected result.
This shows that profile information format validity is ensured.
Table 12.6 EditProfile_TC
7. Test case id: ViewInfo_TC
Unit to test: Information in database
Assumptions: User has uploaded valid .xls file and data has been extracted and stored in
the database.
Input values Expected Results Result Comments
User enters valid date and time.
Data pertaining to that period is displayed.
Pass if result meets the expected result.
This shows that user has the option to view the data of particular day and particular time.
User enters invalid date and time.
Display appropriate error information. (Eg.”Check your date and time”).
Pass if result meets the expected result.
This test shows that user cannot request information that is not present in the database.
Table 12.7 ViewInfo_TC
Biometric Health Monitoring Software Engineering
97
8. Test case id: Viewformat-TC
Unit to test: User view format
Assumptions: User has requested information for valid duration.
Input values Expected Results Result Comments
User requests information in tabular format.
Data pertaining to that request is displayed in tabular format.
Pass if result meets the expected result.
This shows that user has the option to view the data in tabular format.
User requests information in graphical format.
Data pertaining to that request is displayed in graphical format.
Pass if result meets the expected result.
This shows that user has the option to view the data in graphical format.
Table 12.8 Viewformat-TC
9. Test case id: DoctorFeedback-TC
Unit to test: Feedback
Assumptions: Doctor has reviewed user profile and provided comment.
Input values Expected Results Result Comments
Doctor enters feedback.
Feedback is stored in the database and mapped to the particular user.
Pass if result meets the expected result.
This test case shows that user gets correct feedback.
Table 12.9 DoctorFeedback_TC
10. Test case id: ViewFeedback-TC
Unit to test: Feedback
Assumptions: Doctor has given feedback.
Input values Expected Results Result Comments
User (patient) requests to view feedback.
Appropriate Feedback is displayed to the user.
Pass if result meets the expected result.
This test case shows that user gets correct feedback.
User (patient) requests to view feedback while it is not provided by the doctor.
Displays the latest feedback available i.e. feedback upto the last calculated values.
Pass if result meets the expected result.
This test case shows that when doctor has not sent the feedback, the latest available feedback is present.
Table 12.10 ViewFeedback_TC
Biometric Health Monitoring Software Engineering
98
These above tests cover all of the high level/user testing that can be done. Other testing such as determining correctness of every single line of code will be carried out/has already been carried out by each software developer as they are writing each section of code. As far as integration testing goes, as we combine the modules and separate code of each developer, we will make sure that any discrepancies that arise are flattened out in an orderly manner. Commenting our code excessively around places where other people’s implementations fit in is what will help the process of combining everything together go much more smoothly than if we just handed each other pure code. Each section of code will be double checked for correctness of implementation and also correctness of the actual algorithms being employed. If any vague or nonstandard implementations are used, they must first be justified by an explanation in comments in order to pass the correctness test each person writing code will perform. Vague or nonstandard means structures that don’t show their purpose or function in a manner that is obvious enough to a proficient user of the programming language in which we are working.
Biometric Health Monitoring Software Engineering
99
13. History of Work, Current Status, and Future Work
We started this project with an novel idea that we all as team members believed can be
really innovative and useful in the field of Biometric healthcare Monitoring. Considering the
challenges and opportunity that it presented ,we were very confident from the beginning
that we have a great deal to learn through this project .There were a lot of key
accomplishments and milestones that occurred throughout the duration of the creation of
the project. Even some of the smallest feats were actually huge accomplishments toward
the success of the overall project. Getting two functions to work together was a milestone
each and every time it worked without failure. Seeing a code compile without any runtime
or exceptions for the first time was also a big deal each time it happened. Each little thing
that worked correctly contributed to the overall success of the project and with one
miniscule error, the whole project could have potentially not worked or just flat out crashed
altogether.
We started our project work by searching for a health monitoring device by contacting the
various firms to get details about their product. Initially we faced this problem that most of
the companies were not willing to share the details about their products at the research
level. Then we came across this sensewear band and after we communicated with their
product department they agreed to provide us the patient data to work-on, However they
insisted upon buying the licence in case we required the information and decoding
algorithms to obtain that data from device. But, once we talked about this with Professor
Marsic, he assured it would be fine and novel idea if we can develop an application using the
raw data provided by the company. It made sense as primarily our project was a software
project and our project proposal contained lot of Software engineering implementation
challenges.
We submitted our proposal on September 22 and formed a schedule of meeting twice in a
week for discussing the progress and problems faced in our assigned responsibilities.
Although most of the team members were good at programming Since not all were familiar
with JSP MVC framework (we felt it was best web framework to work on in our project), we
assigned the responsibilities accordingly. All the team members were very committed and
dedicated from the very first day and most of the times we were able to meet the
submission deadlines by days in ahead. However as is always in case of challenging project,
we were bound to face challenges.
Merging the Contributions from Individual Team Members One of the first problems we
encountered was that when we had done our specified parts, everyone had their own part
on a separate Microsoft word document for example. To combat this headache, one person
suggested that we use Google documents. Only a few of the group members had experience
with Google Docs, so the rest of us had to learn how to share documents, a specific part for
example with the rest of the group. A problem we were having was that Google Docs is still
not as good for formatting etc. and missing some specific actions we constantly rely on in
Biometric Health Monitoring Software Engineering
100
Microsoft word. For example, the ability to work with tables in Google Docs is fairly limited
in manipulating them. To handle this, we relied on importing the finished Report to
Microsoft Word to add the finishing touches and do what we cannot in Google Docs before
submitting our work. Another reason we relied on Google Docs is version control. Here on
the web everyone has access to the same document and can edit at will. Not that this also
caused some problems where editing set us back when something was edited in the wrong
way, but it has done more right than wrong. Finally, a really good point about using Google
Docs for this semester long project was that everyone can keep track of each others’
progress.
Also since most of our other courses were different, so managing our schedules was really
tough, however we solved this problem by following a proper schedule decided earlier and
strictly following it. We prepared the Customer requirements after careful analyses of the
problem at our hand from the user’s perspective and we arrived at the conclusion that we
would require about 10 Use cases to wholly cover the problem domain. However, later on
we came to decision that we can complete the project in a modular way by using 8 Use
cases. Domain Analyses and System Sequence diagrams were completed on October 9 We
submitted our First project report on October 14,2012.
While we started working on our project demo and report 2, we started receiving the report
1 reviews from professor and other groups. Most of the reviews, except few, were really
encouraging, helpful and thorough in appreciating the workdone by our group and also in
pointing out the scope for improvements in our report. So we divided each section of report
1 between each member and we made sure that all parts were updated and corrected
wherever required according to the reviews and our own understanding. We had decided to
implement the MVC software architecture (using JSP). The class structure that evolved from
domain concepts gave us a clear idea that we were heading towards the right direction. It
also gave us the confidence that we would be able to meet all the use cases and even
exceed in providing some functionality in some cases. For example, in case of displaying the
sleep graph, initially we had planned to display the bar graph showing the only the total
sleep hours per day. But after some brainstorming we came with a novel idea (i.e. presently
implemented, refer Userinterface) that would allow a lot more useful information to be
extracted from the graphical data.
Since most of our work was always complete well ahead in time, we were relatively less
affected by the disruptions caused by the Sandy Disaster that also caused the delay in class
first project demo. We had already submitted the first part of report two until before our
demo. We presented our first demo on October 9 and were able to implement almost half
of the use-cases by then.
The last one month was really hectic as we hurried up towards completing the integration
testing of all the test cases. Since our project included lot of graphical data and not all
members were familiar with this development platform, we encountered few issues as
Biometric Health Monitoring Software Engineering
101
sometimes the graphs would not come up even while entering the correct date values.
However careful insight into the issues and constant never ending debugging allowed us to
move ahead each such issue.
Our coding and Unit testing was completed in first week of the December, however after
integrating the code we found out few of the modules were not working proper. It took us
one week to test the integrated code and solve all issues associated.
We were able to complete our project by 10th of December with complete coding effort and
integration testing of all the test cases. In Overall we completely implemented all the test
cases that we presented in the first report and our application met most of the
requirements that we identified after customer requirement analyses. We believe we have
been able lay a very good base for a research project at a large scale with lot of future scope
and possibilities of implementations with innumerable enhanced features.
Future work:-
We started working on this project with an eye on developing an application for long term
benefits. As of now, lot of useful features have already been incorporated into this
application and we feel it has met its primary objective of saving time and unnecessary
botheration by communicating timely diagnoses and feedback from doctor to the patient.
However we feel that still there are lot many features that can be included in this
application in the long run. Some features that we plan to implement in near future are
allowing the direct communication from patient to doctor(like feedback is present from
doctor to patient) and the as advised by Professor Marsic changing the sleep and sedentary
time bar graphs where we can display one discontinuous bar per day where the gaps in bar
would show time the user is not sleeping.
This application can be extended into an android application that can provide enhanced
mobility to the user as well as doctor. As they say “there is nothing called free lunch” there
are few doctors who are not willing to provide their services free of cost. Hence we plan to
include the PayPal system in this application so that user can be provided with wide range of
specialized doctors.
As of now the application provides and analyses the data in static mode. We can extend its
application for the scenarios when user is wearing the device armband and he/she will be
provided with the current progress and statistical indicators of his activity/health.
Biometric Health Monitoring Software Engineering
102
Biometric Health Monitoring Software Engineering
103
Biometric Health Monitoring Software Engineering
104
14. References
1. Marsic, Ivan. Software Engineering. 2012.
2. ruegge, Bernd, and Allen H. Dutoit. Object-oriented Software Engineering: Using UML, Patterns, and Java. Boston: Prentice Hall, 2010
Biometric Health Monitoring Software Engineering
105
3. Bardi, James A. Hotel Front Office Management. Hoboken, NJ: John Wiley & Sons Inc., 2007.