Biometric Tendency Recognition and Classification System: An Artistic Approach Carlos Castellanos School of Interactive Arts and Technology Simon Fraser University Surrey, B.C., Canada [email protected]Philippe Pasquier School of Interactive Arts and Technology Simon Fraser University Surrey, B.C., Canada [email protected]Luther Thie Interaction Design Institute Ivrea, Italy [email protected]Kyu Che Symbionic Design Studio San Francisco, CA, USA [email protected]ABSTRACT The Biometric Tendency Recognition and Classification System is a software application that continuously measures a participant’s physiological responses to a given image and runs a statistical classification algorithm on the measured data that then classifies the participant into one of four categories: passive, aggressive, loyal and subversive. The system is part of an interactive art project that explores issues of authority, privacy and security in relation to biometric technologies. In this paper, we demonstrate the development of this system that exemplifies the use of biometrics within the context of art. Categories and Subject Descriptors J.5 [Arts and Humanities]: fine arts. General Terms Algorithms, Performance, Design, Experimentation, Security, Human Factors. Keywords Biometrics, Biofeedback, Physiological Monitoring, Interactive Art, Machine Learning, K-Nearest Neighbor. 1. INTRODUCTION As biometric technologies become more prominent and accepted as part of everyday life, bio-data is becoming a legitimate source of identity detection, classification and assessment. What is an individuals relationship to this technology? How private is one's physiological data? How much are we willing to give up to intelligent machines in the name of safety or convenience? From another perspective, what happens when the human body and its emotional and cognitive responses become part of a sophisticated information system? In this paper, we present the Biometric Tendency Recognition and Classification System (henceforth referred to as BTRCS). This system is part of the technological foundation for Project Naos, an interactive art project that explores the use of physiological and biometric data in society. The approach taken with BTRCS is that of a hybrid art/science research project. In systems where there is a high degree of uncertainty and subjectivity, where specific goals are not well defined (or are constantly changing), we believe that new approaches to knowledge generation become necessary. In the case of data mining and machine learning techniques, which attempt to quantitatively ascertain qualitative and highly subjective characteristics, the opportunity for interpretation, manipulation and even distortion seem endless. Thus, opportunities for artistic “intervention” are high. The remainder of this paper is structured as follows. First, a general overview of Project Naos is provided and related works are discussed. We then present the system’s functionality, a description of the physiological parameters being measured, a discussion of the image database and a description of the classification algorithm used. A software implementation is also discussed which illustrates the use of the system in classifying participants based on their responses to the images displayed. We then explain the uses and limitations of the system and conclude with some possible future directions. 2. PROJECT NAOS 1 Project Naos is an interactive art project that explores possible future scenarios where the cognitive and emotional states of humans are monitored, profiled and classified based on their physiologial states. Building on the success of the Acclair project [1], of which it is an extension, Project Naos takes its inspiration from the various data mining and machine learning technologies that for example, attempt to determine categories of consumers, or to ascertain if one is a “security threat”. As shown in Figure 1, the installation consists of a “bio-pod” structure that participants enter and have their physiological responses to media measured in order to determine their social value and security status. A typical participant experience of the artwork is as follows: the participant approaches the Project Naos service station where an attendant greets him or her and explains how the process works. The participant is then directed into the bio-pod where he or she is connected to the physiological monitoring equipment. Once the participant is placed (un)comfortably inside the bio-pod, the 1 “Naos” is taken from the Pinyin spelling of the Mandarin word nao3, which means “brain”. Permission to make digital or hard copies of all or part of this work for personal or classroom use is granted without fee provided that copies are not made or distributed for profit or commercial advantage and that copies bear this notice and the full citation on the first page. To copy otherwise, or republish, to post on servers or to redistribute to lists, requires prior specific permission and/or a fee. DIMEA’08, September 10–12, 2008, Athens, Greece. Copyright 2008 ACM 978-1-60558-248-1/08/09…$5.00.
Transcript
Biometric Tendency Recognition and Classification System: An Artistic Approach
ABSTRACTThe Biometric Tendency Recognition and Classification System is a software application that continuously measures a participant’s physiological responses to a given image and runs a statistical classification algorithm on the measured data that then classifies the participant into one of four categories: passive, aggressive, loyal and subversive. The system is part of an interactive art project that explores issues of authority, privacy and security in relation to biometric technologies. In this paper, we demonstrate the development of this system that exemplifies the use of biometrics within the context of art.
Categories and Subject DescriptorsJ.5 [Arts and Humanities]: fine arts.
General TermsAlgorithms, Performance, Design, Experimentation, Security, Human Factors.
1. INTRODUCTIONAs biometric technologies become more prominent and accepted as part of everyday life, bio-data is becoming a legitimate source of identity detection, classification and assessment. What is an individuals relationship to this technology? How private is one's physiological data? How much are we willing to give up to intelligent machines in the name of safety or convenience? From another perspective, what happens when the human body and its emotional and cognitive responses become part of a sophisticated information system?
In this paper, we present the Biometric Tendency Recognition and Classification System (henceforth referred to as BTRCS). This system is part of the technological foundation for Project Naos, an interactive art project that explores the use of physiological and biometric data in society.
The approach taken with BTRCS is that of a hybrid art/science research project. In systems where there is a high degree of uncertainty and subjectivity, where specific goals are not well defined (or are constantly changing), we believe that new approaches to knowledge generation become necessary. In the case of data mining and machine learning techniques, which attempt to quantitatively ascertain qualitative and highly subjective characteristics, the opportunity for interpretation, manipulation and even distortion seem endless. Thus, opportunities for artistic “intervention” are high.
The remainder of this paper is structured as follows. First, a general overview of Project Naos is provided and related works are discussed. We then present the system’s functionality, a description of the physiological parameters being measured, a discussion of the image database and a description of the classification algorithm used. A software implementation is also discussed which illustrates the use of the system in classifying participants based on their responses to the images displayed. We then explain the uses and limitations of the system and conclude with some possible future directions.
2. PROJECT NAOS1
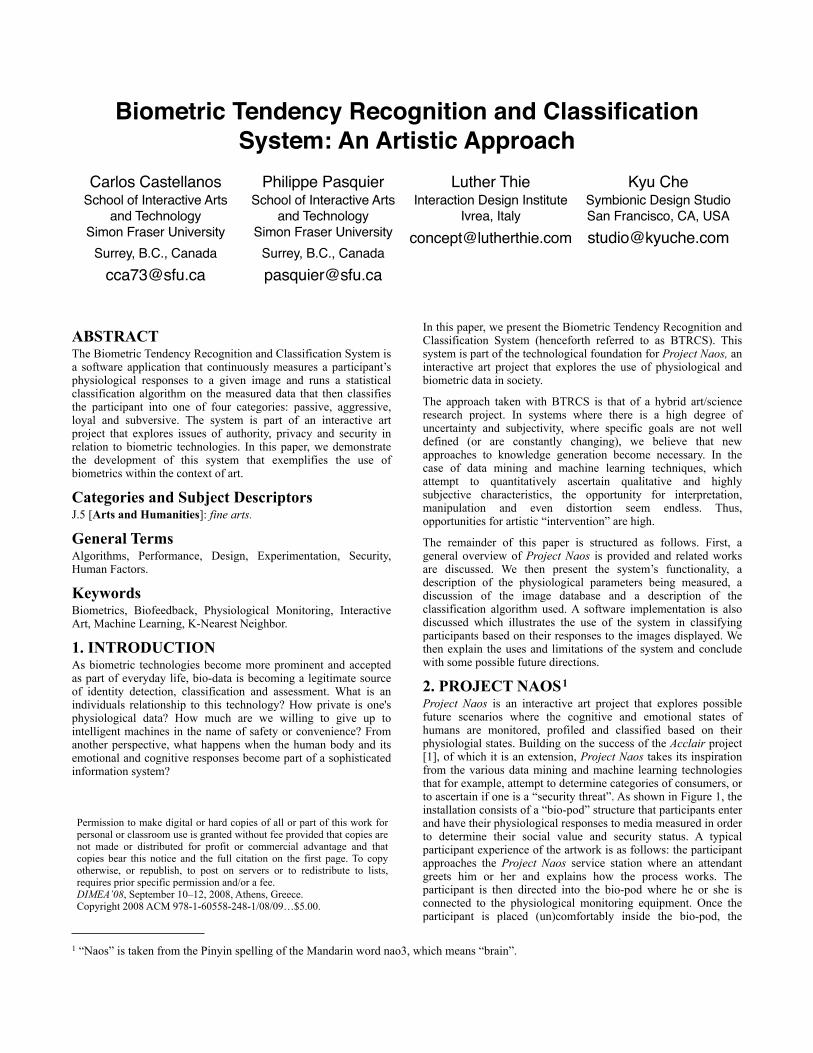
Project Naos is an interactive art project that explores possible future scenarios where the cognitive and emotional states of humans are monitored, profiled and classified based on their physiologial states. Building on the success of the Acclair project [1], of which it is an extension, Project Naos takes its inspiration from the various data mining and machine learning technologies that for example, attempt to determine categories of consumers, or to ascertain if one is a “security threat”. As shown in Figure 1, the installation consists of a “bio-pod” structure that participants enter and have their physiological responses to media measured in order to determine their social value and security status. A typical participant experience of the artwork is as follows: the participant approaches the Project Naos service station where an attendant greets him or her and explains how the process works. The participant is then directed into the bio-pod where he or she is connected to the physiological monitoring equipment. Once the participant is placed (un)comfortably inside the bio-pod, the
1 “Naos” is taken from the Pinyin spelling of the Mandarin word nao3, which means “brain”.
Permission to make digital or hard copies of all or part of this work for personal or classroom use is granted without fee provided that copies are not made or distributed for profit or commercial advantage and that copies bear this notice and the full citation on the first page. To copy otherwise, or republish, to post on servers or to redistribute to lists, requires prior specific permission and/or a fee.DIMEA’08, September 10–12, 2008, Athens, Greece.Copyright 2008 ACM 978-1-60558-248-1/08/09…$5.00.
system is activated. After first gauging the participant’s physiological data for five seconds, in order to establish baseline readings, an image is shown on a large LCD screen. As explained in later sections, the participant’s physiological response to the image is measured, and then via statistical classification, placed into one of the four classes: passive, aggressive, loyal and subversive. A textual message is then displayed which provides the participant with some information on their readings and hints at their current classification, without stating it explicitly. For instance, if the participant is classified as aggressive, the system will display a message saying “You seem a bit excited.” A classification of loyal may display a message such as “You seem trustworthy and dependable.”2 Finally, another image whose data is closest to the measured physiological data, and is of the same class as the one just assigned, is shown.The loop continues in an attempt to achieve “equilibrium” - a point where the image’s expected physiological response and classification and the participant’s actual response and classification are the same. Thus, in a circular relationship, the system influences the participant's body and brain which in turn, influence the system. At the end of the process, the participant is given a “souvenir”, which consists of a snapshot of their physiological readings along with their resulting classification.The artistic motivation behind the project is centered not so much around researching new techniques for effective classification, but with examining and exploring the very techniques themselves. Project Naos creates a situation where an individual is interfaced with biometric technologies and confronted with the issues mentioned in the introduction, thus making it a very real and tangible experience.
3. BACKGROUND AND RELATED WORKMany interactive or “new media” art works involve the mapping of some data from the physical world onto a system that generates and/or manipulates various media elements such as sound or images. Some pieces take real-time data and use it to influence elements in a simulated environment. An example of this is The Garden of Chances [2], a piece that utilizes real meteorological conditions as the basis for the evolution of a virtual ecosystem consisting of various colored shapes that resemble plants.
Other pieces require some form of interaction or participation. Here, the participant typically affects the visual or sonic elements via some form of novel interface such as motion or gesture. Some artists, such as Diane Gromala, have utilized physiological monitoring in their projects. In Biomorphic Typography [3], Gromala created a set of typographic fonts that continuously morph and evolve in real-time based on a participant’s physiological states. Font’s “throb” in response to heart rate and expand and contract as the participant breathes. Divided By Resistance [4], a performance/installation by Bruce Gilchrist and Jonny Bradley featured the real-time brain wave output of a sleeping performer. The signals were analyzed and used to “remix” videos and narrative text. Participants could also communicate with the performer by administering a series of codified questions and statements in the form of mild electrical stimulation. Since the 1960s, composer/musician David Rosenboom has pursued a line of inquiry focused on interfacing brain wave signals and music generation systems [5]. More recently, Eduardo Reck Miranda has also investigated the use of physiological signals as musical interfaces [6].
Like the projects mentioned above, BTRCS utilizes data obtained from the physical world, specifically physiological data, and utilizes it in an arts context. However in our case, the data is not used (primarily) to generate or manipulate media elements in response to a participant’s readings, rather it utilizes the data to perform a statistical classification of the participant.
A related field, that of Affective Computing [7], attempts to develop systems and models for the recognition of human emotion and affect. Typically, this involves some form statistical modeling and classification and measures various physiological parameters that often provide cues as to one’s emotional state. Common measurements include heart rate, galvanic skin response, facial tension and patterns of bodily movement. Generally, the goal of this field is to develop systems that can better serve humans by sensing how they are feeling at a particular moment, thus better anticipating their needs. While our project also deals with subjective elements like emotion and affect, it raises questions about the legitimacy of the systematic and institutionalized use of these often intrusive technologies.
Project Naos and the BTRCS component, are extensions of Acclair, a conceptual art project that features a fictitious corporation that offers brain testing services as part of an exclusive security clearance program for air travelers [8]. In the project’s scenario, participants submit to an invasive brain scanning process in order to attain financial rewards and greater social status. It features what is known as a “brain fingerprinting” (BFP) test, an EEG-based technique (discussed in section 4.1) where a participant’s brain waves are measured in order to record reactions to certain images. This helps to assess
2 Sound is also generated that corresponds to the participant’s physiological readings. For ease of presentation, the sound component is ignored in the rest of this paper.
Figure 1. Diagram of Project Naos
EEG
EMG
GSR
DisplayImage
Determine Classi!cation
Select new imagebased on classi!cation
Display textual message
DetermineClosest Matching
Images
imagedb
KNN Algorithm
their risk level as well as their consumer habits and preferences. The Acclair service is presented as an exclusive club for “preferred” travelers, allowing them to become members of a “trusted class”.
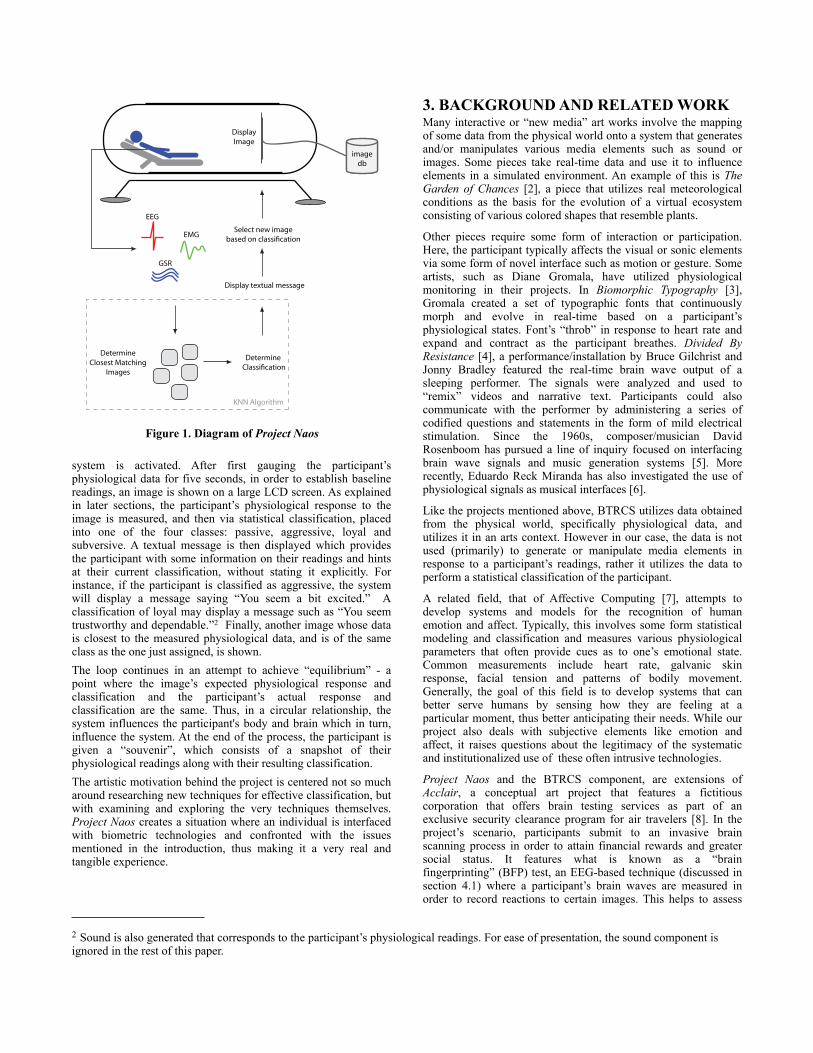
4. SYSTEM DESCRIPTIONAs can be seen in Figure 2, the system functions in a simple loop of image presentation - physiological response recording - classification - textual message - new image. It first gauges the participant’s physiological data for five seconds in order to establish baseline readings. The participant is then presented with a randomly selected image. His physiological response to the image is measured and any deviation from the established baselines is noted. Next, the classification algorithm is applied and the participant is assigned to one of four predetermined categories: passive, aggressive, loyal and subversive. The textual message is then shown. Next, the image whose data is closest to the measured physiological data, and is of the same class as the one just assigned is shown. This loop continues, as stated previously, in an attempt to achieve “equilibrium” - a point where the image’s expected physiological response and the actual response are the same. The following subsections detail each of these steps.
4.1 Physiological Data AcquisitionIn our system, physiological signals are acquired via the Thought Technologies ProComp Infiniti encoding system [9]. The system measures brain waves via electroencephalography (EEG), muscle tension via electromyography (EMG) and skin conductivity via galvanic skin response (GSR). Signals are measured via custom software that was written to interface with the device and retrieve the raw voltage values. When the system is first activated, the
voltage is gathered and baseline values are established. As each of the physiological parameters produce voltages in different ranges, all values are scaled to between 0 and 255 in order to allow for greater ease and simplicity of calculation. As the participant is presented with an image, deviation from these baselines are measured and sent to the classification algorithm.
4.1.1 Electroencephalography (EEG)Electroencephalography (EEG) is the measurement of electrical activity produced by the brain as recorded from electrodes placed on the scalp or forehead. EEG is used in many clinical and research settings such as the diagnosing of epileptic patients [10], or the study of sleep disorders [11]. A common EEG technique is the event-related potential (ERP). An ERP is simply a response or “spike” in amplitude (voltage) as a direct result of specific cognitive processes [12]. BTRCS makes use of the ERP technique to measure the level of stimulus brought about by a particular image. Specifically, it measures the participants P300 signal level. The P300 [13] is an ERP which is measured as a postive surge in voltage occuring with roughly 300 milliseconds of latency. Because of its high levels of reproducibility, the P300 has often been used in lie detection or “guilty knowledge” tests. For example, Brain Fingerprinting (BFP) is a scientific methodology based on an EEG test that determines one’s knowledge or non-knowledge of a particular event [14]. Developed by Dr. Lawrence Farwell at the University of Iowa, the BFP test detects fluctuations in P300 levels. A typical BFP test consists of a series of visual and auditory stimuli (referred to as probes) that pertain to a specific event. Interspersed along with irrelvant stimuli (which are used as a reference and a means to calibrate the system) are stimuli which actually depict the event in question. The subject’s responses to these two types of stimuli help determine if the measured brain responses to test stimuli, are more similar to the relevant or irrelevant response. Farwell’s technique, for which he claims near 100% accuracy, uses what he calls the MERMER (“Memory and Encoding Related Multifaceted Electroencephalographic Response”) response to detect familiarity reaction [15]. Farwell’s patented procedure has been highly criticized by other researchers. According to Dr. Emanuel Donchin of the University of Illinois at Urbana-Champaign, the “presentation of the specific probes is the point at which science ends and art begins” [16].
Our system looks for the P300 signal and measures its relative amplitude. A higher amplitude is interpreted as a stronger response to stimuli. Unlike Farwell’s test, we are not looking for “guilty knowledge” but rather for tendencies or general trends towards certain attributes such as passiveness or assertiveness. We are interested in exploring this area where the “art begins”. For example, knowledge versus desire, versus familiarity, versus sympathy with certain ideologies as opposed to specific events. This could prove to be an interesting creative “distortion” of the BFP method.
4.1.2 Electromyography (EMG)Electromyography (EMG) is a technique for measuring the physiological properties of muscles. EMG tests measure the electrical potential generated by muscle cells as they contract and when they are at rest. EMG is often used to diagnose stress or nerve related muscle injuries such as carpal tunnel syndrome, assessing pain and diagnosing an treating muscle disorders [17]. EMG (particularly, facial EMG) has also been used to gauge emotional responses to various expressive displays (such as facial expressions) [18]. This is of great relevance to our project, which primarily looks for an increase in muscle tension that occurs in relation to an emotional response to an image.
Figure 2. System overview
Image db
Display image
Read physiological
response
Determine closest matching
images
Determine classication
Determine new image from
classication
Display textual message
4.1.3 Galvanic Skin Response (GSR)Galvanic skin response (GSR), also known as electrodermal response (EDR) or skin conductance response (SCR) is a measure of the electrical resistance of the skin. GSR levels are quite easily acquired by attaching two leads to the skin (usually on the fingers) and sending a very small current. Changes in voltage on the skin surface are then measured. Many tests look for sharp, instant fluctuations in GSR levels (i.e. - “spikes”) [19]. While there is not a clear measure of what exactly a GSR measurement reflects, it is clear that the more emotionally aroused one is the lower their skin’s resistance will be, and thus the higher the GSR level. Fear, anger, surpise, and sexual feelings are all among the emotions which may produce similar GSR responses. GSR can also be used as a general measure of stress and cognitive or emotional engagament [20]. GSR measurments have been shown to have very good repeatability and are often measured in conjunction
with EEG signals [21]. This, coupled with its simplicity of measurement, make GSR a useful method for examining autonomic nervous system function. Some common uses of GSR include polygraph (lie detector) tests, stress reduction training, and affective computing research. It is also becoming quite common in hypnotherapy and psychotherapy practice [22]. In line with traditional interpretations of GSR readings, our system views any instant fluctuations, regardless of the emotion illicited, as a heightened level of “emotional investment”.
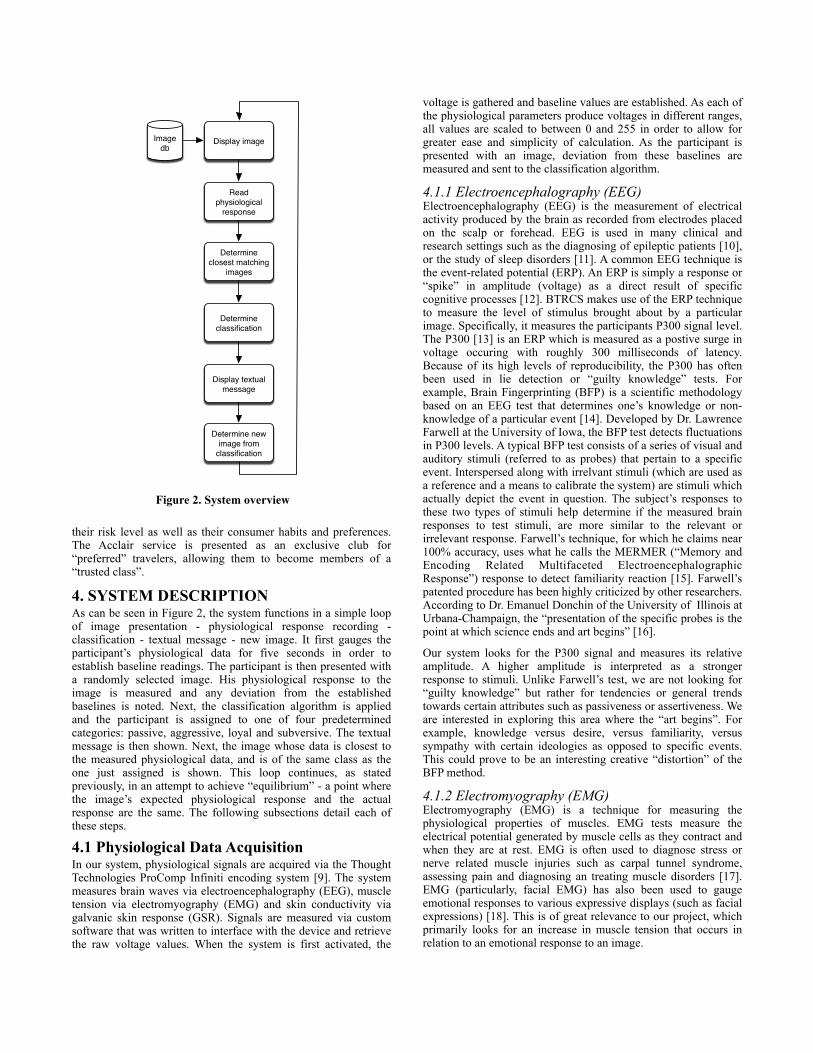
4.2 Image DatabaseThe current image database consists of set of 100 pre-selected images along with their expected physiological responses. Images were selected that contained what could be described as either “violent”, “religious” or “patriotic” content. In order to create the training set, the images were first heuristically rated on scale of 1
Figure 3. Heuristic mappings of image attributes to their expected physiological responses
to 10 according to the perceived amount of each attribute. For example, an image may have a violence rating of 9, a religion rating of 2 and a patriotism rating of 8. The images were then given features that correspond to the expected physiological responses they would generate (the features being EEG, EMG and GSR). A heuristic mapping, shown in Figure 3, was then created that correlates the ratings to these features. As the figure demonstrates, high ratings of certain attributes may trigger high levels of a certain physiological attribute, whereas high ratings of others do not. For example, high violence ratings correspond to high EMG levels, whereas high patriotism ratings do not.
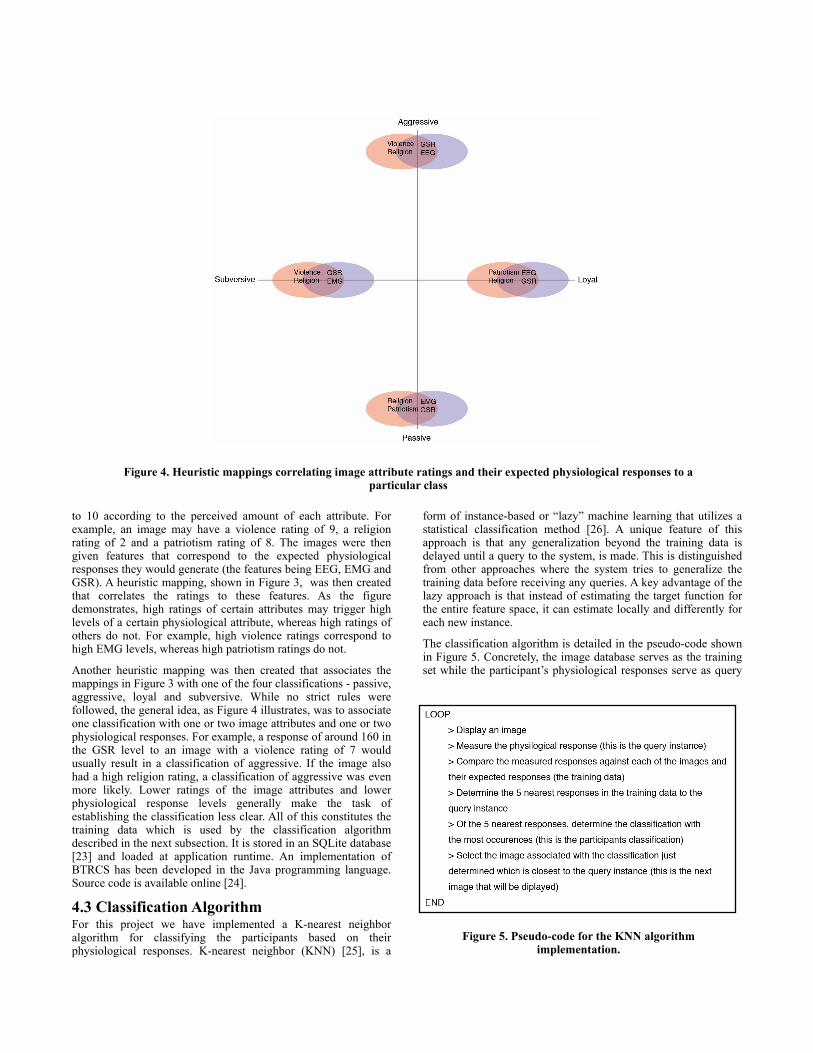
Another heuristic mapping was then created that associates the mappings in Figure 3 with one of the four classifications - passive, aggressive, loyal and subversive. While no strict rules were followed, the general idea, as Figure 4 illustrates, was to associate one classification with one or two image attributes and one or two physiological responses. For example, a response of around 160 in the GSR level to an image with a violence rating of 7 would usually result in a classification of aggressive. If the image also had a high religion rating, a classification of aggressive was even more likely. Lower ratings of the image attributes and lower physiological response levels generally make the task of establishing the classification less clear. All of this constitutes the training data which is used by the classification algorithm described in the next subsection. It is stored in an SQLite database [23] and loaded at application runtime. An implementation of BTRCS has been developed in the Java programming language. Source code is available online [24].
4.3 Classification AlgorithmFor this project we have implemented a K-nearest neighbor algorithm for classifying the participants based on their physiological responses. K-nearest neighbor (KNN) [25], is a
form of instance-based or “lazy” machine learning that utilizes a statistical classification method [26]. A unique feature of this approach is that any generalization beyond the training data is delayed until a query to the system, is made. This is distinguished from other approaches where the system tries to generalize the training data before receiving any queries. A key advantage of the lazy approach is that instead of estimating the target function for the entire feature space, it can estimate locally and differently for each new instance.
The classification algorithm is detailed in the pseudo-code shown in Figure 5. Concretely, the image database serves as the training set while the participant’s physiological responses serve as query
Figure 5. Pseudo-code for the KNN algorithm implementation.
Figure 4. Heuristic mappings correlating image attribute ratings and their expected physiological responses to a particular class
instances. Classification is accomplished by calculating the Euclidian distance between the query instance and all the elements of the training set. The five (in our case k = 5) images closest to the participant’s response are selected. The class with the most frequent occurrences within these 5 closest neighbors is then attributed to the query instance. Any ties can be broken at random.
As mentioned before, a textual message is selected and displayed based on this class. Finally, the next image is selected. Of the images within this “winning” classification, the nearest to the query instance is the one selected as the next image to display, thus closing the loop.
One of the unique aspects of our project is that while traditional machine learning and statistical classification techniques typically compare elements of the same kind (e.g. - a machine learning system that classifies dogs by comparing new dogs to dogs in the training set), our project does not, as the query instances and the training set are each of a different kind (but are still described using the same attributes).
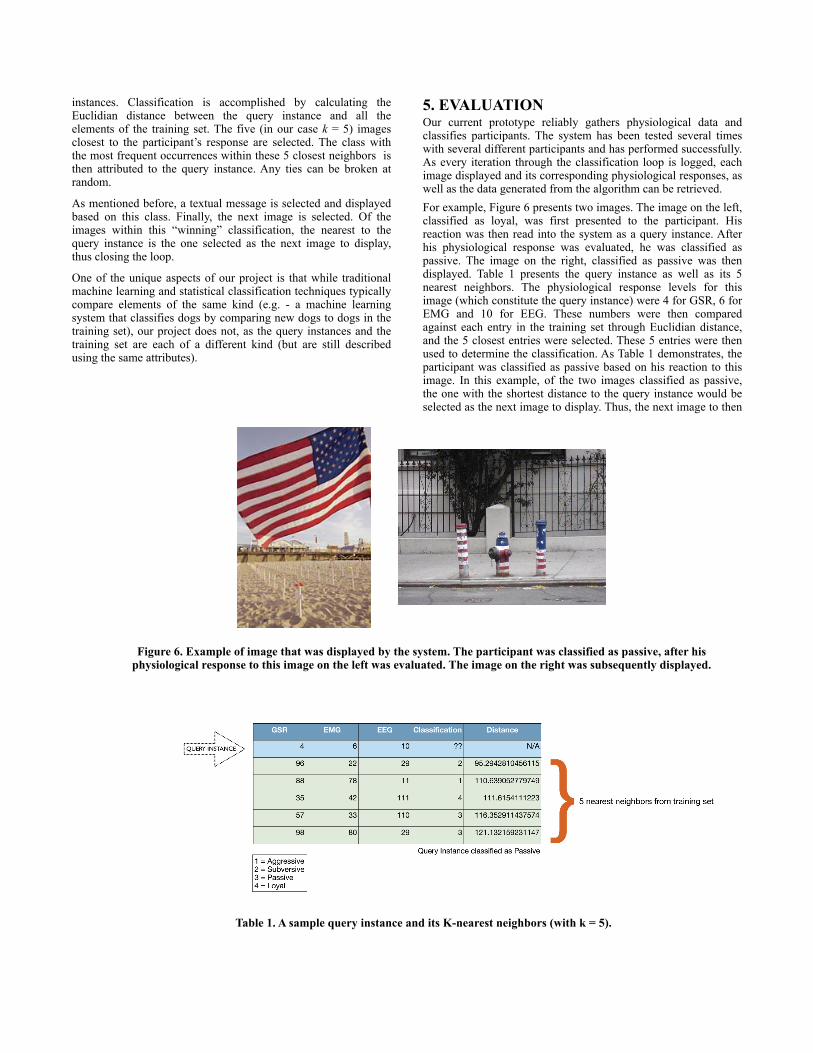
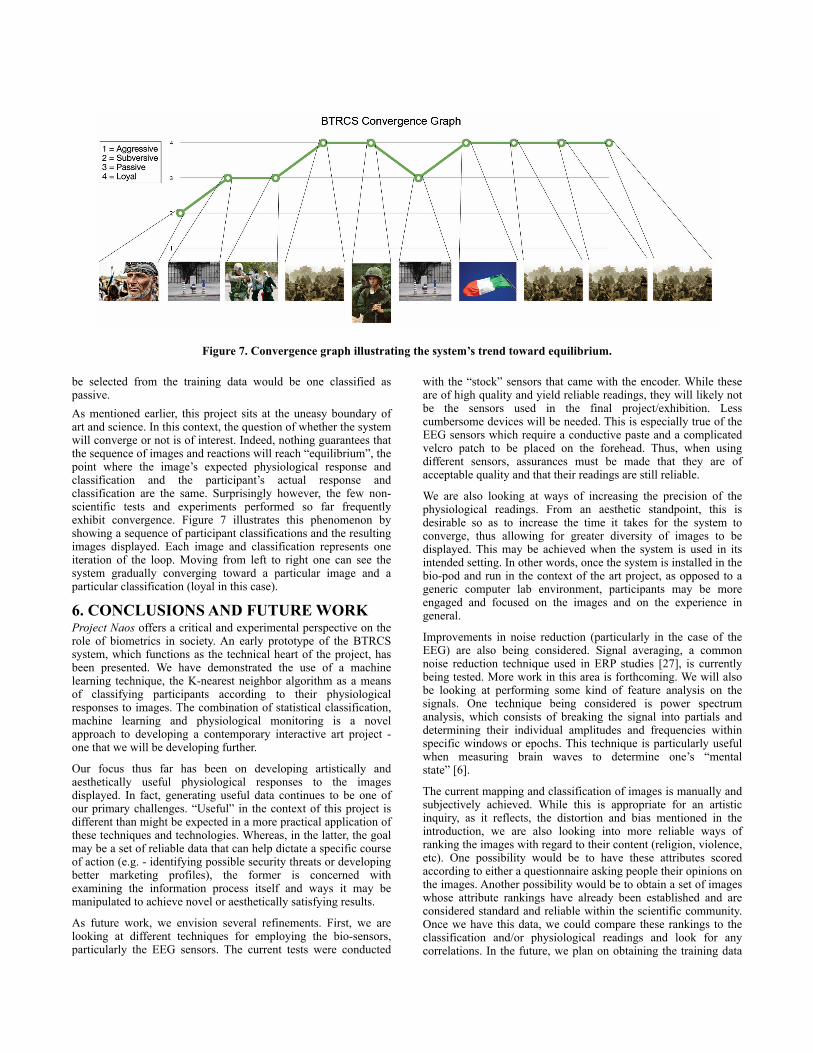
5. EVALUATIONOur current prototype reliably gathers physiological data and classifies participants. The system has been tested several times with several different participants and has performed successfully. As every iteration through the classification loop is logged, each image displayed and its corresponding physiological responses, as well as the data generated from the algorithm can be retrieved.For example, Figure 6 presents two images. The image on the left, classified as loyal, was first presented to the participant. His reaction was then read into the system as a query instance. After his physiological response was evaluated, he was classified as passive. The image on the right, classified as passive was then displayed. Table 1 presents the query instance as well as its 5 nearest neighbors. The physiological response levels for this image (which constitute the query instance) were 4 for GSR, 6 for EMG and 10 for EEG. These numbers were then compared against each entry in the training set through Euclidian distance, and the 5 closest entries were selected. These 5 entries were then used to determine the classification. As Table 1 demonstrates, the participant was classified as passive based on his reaction to this image. In this example, of the two images classified as passive, the one with the shortest distance to the query instance would be selected as the next image to display. Thus, the next image to then
Figure 6. Example of image that was displayed by the system. The participant was classified as passive, after his physiological response to this image on the left was evaluated. The image on the right was subsequently displayed.
Table 1. A sample query instance and its K-nearest neighbors (with k = 5).
be selected from the training data would be one classified as passive.As mentioned earlier, this project sits at the uneasy boundary of art and science. In this context, the question of whether the system will converge or not is of interest. Indeed, nothing guarantees that the sequence of images and reactions will reach “equilibrium”, the point where the image’s expected physiological response and classification and the participant’s actual response and classification are the same. Surprisingly however, the few non-scientific tests and experiments performed so far frequently exhibit convergence. Figure 7 illustrates this phenomenon by showing a sequence of participant classifications and the resulting images displayed. Each image and classification represents one iteration of the loop. Moving from left to right one can see the system gradually converging toward a particular image and a particular classification (loyal in this case).
6. CONCLUSIONS AND FUTURE WORKProject Naos offers a critical and experimental perspective on the role of biometrics in society. An early prototype of the BTRCS system, which functions as the technical heart of the project, has been presented. We have demonstrated the use of a machine learning technique, the K-nearest neighbor algorithm as a means of classifying participants according to their physiological responses to images. The combination of statistical classification, machine learning and physiological monitoring is a novel approach to developing a contemporary interactive art project - one that we will be developing further.
Our focus thus far has been on developing artistically and aesthetically useful physiological responses to the images displayed. In fact, generating useful data continues to be one of our primary challenges. “Useful” in the context of this project is different than might be expected in a more practical application of these techniques and technologies. Whereas, in the latter, the goal may be a set of reliable data that can help dictate a specific course of action (e.g. - identifying possible security threats or developing better marketing profiles), the former is concerned with examining the information process itself and ways it may be manipulated to achieve novel or aesthetically satisfying results.
As future work, we envision several refinements. First, we are looking at different techniques for employing the bio-sensors, particularly the EEG sensors. The current tests were conducted
with the “stock” sensors that came with the encoder. While these are of high quality and yield reliable readings, they will likely not be the sensors used in the final project/exhibition. Less cumbersome devices will be needed. This is especially true of the EEG sensors which require a conductive paste and a complicated velcro patch to be placed on the forehead. Thus, when using different sensors, assurances must be made that they are of acceptable quality and that their readings are still reliable.
We are also looking at ways of increasing the precision of the physiological readings. From an aesthetic standpoint, this is desirable so as to increase the time it takes for the system to converge, thus allowing for greater diversity of images to be displayed. This may be achieved when the system is used in its intended setting. In other words, once the system is installed in the bio-pod and run in the context of the art project, as opposed to a generic computer lab environment, participants may be more engaged and focused on the images and on the experience in general.
Improvements in noise reduction (particularly in the case of the EEG) are also being considered. Signal averaging, a common noise reduction technique used in ERP studies [27], is currently being tested. More work in this area is forthcoming. We will also be looking at performing some kind of feature analysis on the signals. One technique being considered is power spectrum analysis, which consists of breaking the signal into partials and determining their individual amplitudes and frequencies within specific windows or epochs. This technique is particularly useful when measuring brain waves to determine one’s “mental state” [6].
The current mapping and classification of images is manually and subjectively achieved. While this is appropriate for an artistic inquiry, as it reflects, the distortion and bias mentioned in the introduction, we are also looking into more reliable ways of ranking the images with regard to their content (religion, violence, etc). One possibility would be to have these attributes scored according to either a questionnaire asking people their opinions on the images. Another possibility would be to obtain a set of images whose attribute rankings have already been established and are considered standard and reliable within the scientific community. Once we have this data, we could compare these rankings to the classification and/or physiological readings and look for any correlations. In the future, we plan on obtaining the training data
Figure 7. Convergence graph illustrating the system’s trend toward equilibrium.
automatically, based on a “pre-test” given to participants, as opposed to the current “ad-hoc” method. We are also investigating different methods of implementing the KNN algorithm itself. For instance, implementing a weighted distance version, where the item closest to the query instance is given more significance [26].
Finally, it is important to reiterate that this system is intended to be utilized as part of an interactive art project that offers a critical and experimental perspective on the role of biometrics in society. Our heuristic mappings mirror the way society classifies persons based on subjective culturally and socially constructed factors such as skin color, religion or national origin. While we are using the same techniques of probing and classification that one might find in practical applications of these technologies, such as in the fields of medicine or law enforcement, the focus here is not on the results but on the very experience of being probed, classified and categorized by the very space one inhabits. While already quite popular in the medical world and in security-related domains, Daniel Carlat, a psychiatrist at Tufts University School of Medicine has stated that the techniques currently in use for developing one’s mental profile via brain scanning technologies are sometimes akin to those of a “shrewd palm reader” [28]. We are the palm readers.
7. ACKNOWLEDGEMENTSWe thank all of our colleagues at the Feral Computing Lab and the School of Interactive Arts and Technology (SIAT), Simon Fraser University, Surrey.
8. REFERENCES[1] Thie, L. and Fried, E. 2004. Acclair, http://
www.acclair.co.uk/, accessed May 10, 2008[2] Hutzler, G., Gortais, B., and Drogoul, A. 2000. The Garden
of Chance: A Visual Ecosystem, Leonardo, Vol. 33, No. 2 (Apr. 2000), 101-106.
[3] Gromala, D. 2003. Biomorphic Typography, TypeO Exhibition, FACT (Foundation for Art & Creative Technology), Liverpool, England.
[4] Gilchrist, B. and Bradley, J. 1996. Divided by Resistance. http://www.artemergent.org.uk/dbr/dbr.html, acessed June 29, 2008.
[5] Rosenboom, D. 1976. Biofeedback and the Arts. Vancouver: A.R.C. Publications.
[6] Miranda, E. R., 2006. Biosignal Interfaces. In New Digital Musical Instruments: Control And Interaction Beyond the Keyboard. A-R Editions, Middleton, WI, 173-217.
[7] Picard, R. W. 1995. Affective Computing, M.I.T Media Laboratory Perceptual Computing Section Technical Report No. 321.
[8] Thie, L., and Fried, E. 2005. Acclairism: questioning biometric technology through an airport security clearance system. CHI '05 extended abstracts on Human factors in computing systems. Portland, OR, USA: ACM, 1148-1149.
[9] Thought technology Ltd. http://www.thoughttechnology.com/, accessed May 6, 2008
[10] Ebersole, J. S. 1991. EEG dipole modeling in complex partial epilepsy. Brain Topography, Volume 4, Number 2 (Dec. 1991), 113-123.
[11] Drake, M. E., Pakalnis, A., Andrews, J. M., and Bogner, J. E. 1990. Nocturnal Sleep Recording with Cassette EEG in
Chronic Headaches. Headache: The Journal of Head and Face Pain, Volume 30, Issue 9 (Sep. 1990), 600-603.
[12] Luck, S. J. 2005. An Introduction to the Event-Related Potential Technique. The MIT Press, Cambridge, MA.
[13] Sutton, S., Braren, M., Zubin, J., and John, E. R. 1965. Evoked-Potential Correlates of Stimulus Uncertainty. Science, 150 (3700), 1187-1188.
[14] Farwell, L. A. and Donchin, E. 1989. Detection of Guilty Knowledge with ERPs. Psychophysiology, 26:58. (Abstract of an address presented at the Twenty-Eighth Annual Meeting of the Society for Psychophysiological Research, Oct. 1989).
[15] Farwell, L. A. 1993. Brain MERMERs: Detection of FBI Agents and Crime-Relevant Information with the Farwell MERA System. Proceedings of the International Security Systems Symposium, Washington, D.C.
[16] Makeig, T. H., counsel to Dr. Lawrence A. Farwell. Brain Fingerprinting Testing in the case of Harrington v. State, http://www.brainwavescience.com/LegalIssuesinAdmissibility.php, accessed May 5, 2008
[17] Cram, J. R., Kasman, G.S., and Holtz, J. 1998. Introduction to Surface Electromyography. Aspen Publishers Inc.; Gaithersburg, Maryland.
[18] Dimberg, U. 1997. Social fear and expressive reactions to social stimuli. Scandinavian Journal of Psychology, Volume 38, Issue 3 (Sep. 1997), 171–174.
[19] Shaver, B.A. Jr, Brusilow, S.W., and Cooke, R.E. 1962. Origin of the galvanic skin response. Proceedings of the Society for Experimental Biology and Medicine, 110 (Jul. 1962), 559-564.
[20] Fenz, W. D. and Epstein, S. 1967. Gradients of Physiological Arousal in Parachutists as a Function of an Approaching Jump. Psychosomatic Medicine, 29, 33-51.
[21] Ranta-aho, P. O., Tarvainen M.P., Valkonen-Korhonen M., Georgiadis S.D., Lehtonen J., Niskanen J-P, and Karjalainen P.A. 2006. On Correlation Between Single-Trial ERP and GSR Responses: a Principal Component Regression Approach. 28th Annual International Conference of the IEEE Engineering in Medicine and Biology Society, New York, August 30-September 3, 2006.
[22] Gruzelier, J.H., and Brow T.D. 1985. Psychophysiological evidence for a state theory of hypnosis and susceptibility. Journal of Psychosomatic Research, Volume 29, Issue 3, 287-302.
[23] SQLite. http://www.sqlite.org, accessed May 10, 2008.[24] BTRCS. http://www.sfu.ca/~cca73/batrcs_src.zip, accessed
June 29, 2008.[25] Cover, T. and Hart, P. 1967. Nearest Neighbor Pattern
Classification. IEEE Transactions on Information Theory. Volume 13, Issue 1 (Jan. 1967), 21-27.
[26] Mitchell, T. M. 1997. Instance-based Learning. In Machine Learning. McGraw-Hill, Boston, MA, 230-240.
[27] Luck, S. J. 2005. Averaging, Artifact Rejection, and Artifact Correction. In An Introduction to the Event-Related Potential Technique. The MIT Press, Cambridge, MA, 131-174.
[28] Carlat, D. 2008. Mind Readers. In Wired Magazine (Jun. 2008), 120-128.


![Biometric Standards documents/Standards... · Biometric Profiles Biometric [Application] Profile – a conforming subset or combination of base standards used to effect specific biometric](https://static.documents.pub/doc/80x56/5f711372ce578d4ee02aea91/biometric-standards-documentsstandards-biometric-profiles-biometric-application.jpg)


