206
Biometrics and Biosecurity Guest Editors: Tai-hoon Kim, Sabah Mohammed, Carlos Ramos, Osvaldo Gervasi, Wai-Chi Fang, and Adrian Stoica Journal of Biomedicine and Biotechnology

Biometrics and Biosecurity
Guest Editors: Tai-hoon Kim, Sabah Mohammed, Carlos Ramos, Osvaldo Gervasi, Wai-Chi Fang, and Adrian Stoica
Journal of Biomedicine and Biotechnology

Biometrics and Biosecurity

Journal of Biomedicine and Biotechnology
Biometrics and Biosecurity
Guest Editors: Tai-hoon Kim, Sabah Mohammed, Carlos Ramos,Osvaldo Gervasi, Wai-Chi Fang, and Adrian Stoica

Copyright © 2012 Hindawi Publishing Corporation. All rights reserved.
This is a speacial issue published in “Journal of Biomedicine and Biotechnology.” All articles are open access articles distributed underthe Creative Commons Attribution License, which permits unrestricted use, distribution, and reproduction in any medium, providedthe original work is properly cited.

Editorial BoardThe editorial board of the journal is organized into sections that correspond to
the subject areas covered by the journal.
Agricultural Biotechnology
Ahmad Zuhairi Abdullah, MalaysiaGuihua H. Bai, USAChristopher P. Chanway, CanadaRavindra N. Chibbar, CanadaAdriana S. Franca, BrazilIan Godwin, Australia
Hari B. Krishnan, USACarol A. Mallory-Smith, USAXiaoling Miao, ChinaDennis P. Murr, CanadaRodomiro Ortiz, SwedenEncarnacion Ruiz, Spain
B. C. Saha, USAAbdurrahman Saydut, TurkeyMariam B. Sticklen, USAKok Tat Tan, MalaysiaChiu-Chung Young, Taiwan
Animal Biotechnology
E. S. Chang, USABhanu P. Chowdhary, USANoelle E. Cockett, USAPeter Dovc, SloveniaScott C. Fahrenkrug, USADorian J. Garrick, USAThomas A. Hoagland, USA
Tosso Leeb, SwitzerlandJames D. Murray, USAAnita M. Oberbauer, USAJorge A. Piedrahita, USADaniel Pomp, USAKent M. Reed, USALawrence Reynolds, USA
Lawrence B. Schook, USAMari A. Smits, The NetherlandsLeon Spicer, USAJ. Verstegen, USAMatthew B. Wheeler, USAKenneth L. White, USA
Biochemistry
Robert Blumenthal, USADavid Ronald Brown, UKSaulius Butenas, USAVittorio Calabrese, ItalyMiguel Castanho, PortugalFrancis J. Castellino, USARoberta Chiaraluce, ItalyD. M. Clarke, CanadaFrancesca Cutruzzola, Italy
Paul W. Doetsch, USAHicham Fenniri, CanadaNick V. Grishin, USAJ. Guy Guillemette, CanadaPaul W. Huber, USAChen-Hsiung Hung, TaiwanMichael Kalafatis, USAB. E. Kemp, AustraliaPhillip E. Klebba, USA
Wen-Hwa Lee, USARichard D. Ludescher, USAGeorge Makhatadze, USALeonid Medved, USASusan A. Rotenberg, USAJason Shearer, USAAndrei Surguchov, USAJohn B. Vincent, USAY. George Zheng, USA
Bioinformatics
T. Akutsu, JapanMiguel A. Andrade, GermanyMark Y. Borodovsky, USARita Casadio, ItalyArtem Cherkasov, CanadaDavid Corne, UKSorin Draghici, USA
Stavros J. Hamodrakas, GreecePaul Harrison, USAGeorge Karypis, USAGuohui Lin, CanadaSatoru Miyano, JapanZoran Obradovic, USAFlorencio Pazos, Spain
Zhirong Sun, ChinaYing Xu, USAAlexander Zelikovsky, USAAlbert Zomaya, Australia

Biophysics
Miguel Castanho, PortugalP. Bryant Chase, USAKuo-Chen Chou, USARizwan Khan, India
Ali A. Khraibi, Saudi ArabiaRumiana Koynova, USASerdar Kuyucak, AustraliaJianjie Ma, USA
S. B. Petersen, DenmarkPeter Schuck, USAClaudio M. Soares, Portugal
Cell Biology
Omar Benzakour, FranceSanford I. Bernstein, USAPhillip I. Bird, AustraliaEric Bouhassira, USAMohamed Boutjdir, USAChung-Liang Chien, TaiwanRichard Gomer, USAPaul J. Higgins, USAPavel Hozak, Czech Republic
Xudong Huang, USAAnton M. Jetten, USASeamus J. Martin, IrelandManuela Martins-Green, USAShoichiro Ono, USAGeorge Perry, USAM. Piacentini, ItalyGeorge E. Plopper, USALawrence Rothblum, USA
Michael Sheetz, USAJames L. Sherley, USAG. S. Stein, USARichard Tucker, USAThomas van Groen, USAAndre Van Wijnen, USASteve Winder, UKChuanyue Wu, USABin-Xian Zhang, USA
Genetics
Adewale Adeyinka, USAClaude Bagnis, FranceJ. Birchler, USASusan Blanton, USABarry J. Byrne, USAR. Chakraborty, USADomenico Coviello, ItalySarah H. Elsea, USACelina Janion, PolandJ. Spencer Johnston, USA
M. Ilyas Kamboh, USAFeige Kaplan, CanadaManfred Kayser, The NetherlandsBrynn Levy, USAXiao Jiang Li, USAThomas Liehr, GermanyJames M. Mason, USAMohammed Rachidi, FranceRaj S. Ramesar, South AfricaElliot D. Rosen, USA
Dharambir K. Sanghera, USAMichael Schmid, GermanyMarkus Schuelke, GermanyWolfgang Arthur Schulz, GermanyJorge Sequeiros, PortugalMouldy Sioud, NorwayGary S. Stein, USARongjia Zhou, China
Genomics
Vladimir Bajic, Saudi ArabiaMargit Burmeister, USASettara Chandrasekharappa, USAYataro Daigo, Japan
J. Spencer Johnston, USAVladimir Larionov, USAThomas Lufkin, SingaporeJohn L. McGregor, France
John V. Moran, USAYasushi Okazaki, JapanGopi K. Podila, USAMomiao Xiong, USA

Immunology
Hassan Alizadeh, USAPeter Bretscher, CanadaRobert E. Cone, USATerry L. Delovitch, CanadaAnthony L. DeVico, USANick Di Girolamo, AustraliaDon Mark Estes, USASoldano Ferrone, USAJeffrey A. Frelinger, USAJohn Robert Gordon, Canada
James D. Gorham, USASilvia Gregori, ItalyThomas Griffith, USAYoung S. Hahn, USADorothy E. Lewis, USABradley W. McIntyre, USAR. Lee Mosley, USAMarija Mostarica-Stojkovic, SerbiaHans Konrad Muller, AustraliaAli Ouaissi, France
Kanury V. S. Rao, IndiaYair Reisner, IsraelHarry W. Schroeder, USAWilhelm Schwaeble, UKNilabh Shastri, USAYufang Shi, ChinaPiet Stinissen, BelgiumHannes Stockinger, AustriaGraham R. Wallace, UK
Microbial Biotechnology
Suraini Abd-Aziz, MalaysiaJozef Anne, BelgiumNuri Azbar, TurkeyYoav Bashan, MexicoMarco Bazzicalupo, ItalyHakan Bermek, TurkeyNico Boon, BelgiumJose Luis Campos, SpainYinguang Chen, ChinaLuca Simone Cocolin, Italy
Peter Coloe, AustraliaDaniele Daffonchio, ItalyHan de Winde, The NetherlandsRaf Dewil, BelgiumJose Domingos Fontana, BrazilPetros Gikas, GreeceTom Granstrom, FinlandIsmail Kiran, TurkeyHongjuan Liu, ChinaYanhe Ma, China
Paula Loureiro Paulo, BrazilBernd H. A. Rehm, New ZealandAlberto Reis, PortugalMuthuswamy Sathishkumar, SingaporeRamkrishna Sen, IndiaAngela Sessitsch, AustriaYa-Jie Tang, ChinaOrhan Yenigun, TurkeyEileen Hao Yu, UK
Microbiology
D. Beighton, UKSteven R. Blanke, USAStanley Brul, The NetherlandsIsaac K. O. Cann, USAStephen K. Farrand, USAAlain Filloux, UKGad Frankel, UK
Roy Gross, GermanyHans-Peter Klenk, GermanyAbdelwahab Omri, CanadaTanya Parish, UKGopi K. Podila, USAFrederick D. Quinn, USADidier A. Raoult, France
Isabel Sa-Correia, PortugalP. L. C. Small, USAMichael Thomm, GermanyH. C. van der Mei, The NetherlandsSchwan William, USA
Molecular Biology
Rudi Beyaert, BelgiumMichael Bustin, USADouglas Cyr, USAK. Iatrou, GreeceLokesh Joshi, Ireland
David W. Litchfield, CanadaWuyuan Lu, USAPatrick Matthias, SwitzerlandJohn L. McGregor, FranceS. L. Mowbray, SwedenYasushi Okazaki, Japan
Elena Orlova, UKYeon-Kyun Shin, USAWilliam S. Trimble, CanadaLisa Wiesmuller, GermanyMasamitsu Yamaguchi, Japan

Oncology
Colin Cooper, UKF. M. J. Debruyne, The NetherlandsNathan Ames Ellis, USADominic Fan, USAGary E. Gallick, USADaila S. Gridley, USAXin-yuan Guan, Hong KongAnne Hamburger, USAManoor Prakash Hande, SingaporeBeric Henderson, Australia
Daehee Kang, Republic of KoreaAbdul R. Khokhar, USARakesh Kumar, USAMacus Tien Kuo, USAEric W. Lam, UKSue-Hwa Lin, USAKapil Mehta, USAOrhan Nalcioglu, USAP. J. Oefner, GermanyAllal Ouhtit, Oman
Frank Pajonk, USAWaldemar Priebe, USAF. C. Schmitt, PortugalSonshin Takao, JapanAna Maria Tari, USAHenk G. Van Der Poel, The NetherlandsHaodong Xu, USADavid J. Yang, USA
Pharmacology
Abdel A. Abdel-Rahman, USAM. Badr, USAStelvio M. Bandiera, CanadaRonald E. Baynes, USAR. Keith Campbell, USAHak-Kim Chan, AustraliaMichael D. Coleman, UKJ. Descotes, FranceDobromir Dobrev, Germany
Ayman El-Kadi, CanadaJeffrey Hughes, USAKazim Husain, USAFarhad Kamali, UKMichael Kassiou, AustraliaJoseph J. McArdle, USAMark J. McKeage, New ZealandDaniel T. Monaghan, USAT. Narahashi, USA
Kennerly S. Patrick, USAVickram Ramkumar, USAMichael J. Spinella, USAQuadiri Timour, FranceTodd W. Vanderah, USAVal J. Watts, USADavid J. Waxman, USA
Plant Biotechnology
Prem L. Bhalla, AustraliaJ. R. Botella, AustraliaElvira G. De Mejia, USAShi-You Ding, USA
Metin Guru, TurkeyH. M. Haggman, FinlandLiwen Jiang, Hong KongPulugurtha B. Kirti, India
Yong Pyo Lim, Republic of KoreaGopi K. Podila, USARalf Reski, GermanySudhir Sopory, India
Toxicology
Michael Aschner, USAJuergen Buenger, GermanyMichael L. Cunningham, USALaurence D. Fechter, USA
Hartmut Jaeschke, USAYoumin James Kang, USAM. Firoze Khan, USAPascal Kintz, France
Qaisar Mahmood, PakistanR. S. Tjeerdema, USAKenneth Turteltaub, USABrad Upham, USA

Virology
Nafees Ahmad, USAEdouard Cantin, USAEllen Collisson, USAKevin M. Coombs, CanadaNorbert K. Herzog, USATom Hobman, CanadaShahid Jameel, India
Fred Kibenge, CanadaFenyong Liu, USAEric Rassart, CanadaGerald G. Schumann, GermanyY.-C. Sung, Republic of KoreaGregory Tannock, Australia
Ralf Wagner, GermanyJianguo Wu, ChinaDecheng Yang, CanadaJiing-Kuan Yee, USAXueping Zhou, ChinaWen-Quan Zou, USA

Contents
Biometrics and Biosecurity, Tai-hoon Kim, Sabah Mohammed, Carlos Ramos, Osvaldo Gervasi,Wai-Chi Fang, and Adrian StoicaVolume 2012, Article ID 684815, 3 pages
A Privacy-Preserved Analytical Method for eHealth Database with Minimized Information Loss,Ya-Ling Chen, Bo-Chao Cheng, Hsueh-Lin Chen, Chia-I Lin, Guo-Tan Liao, Bo-Yu Hou,and Shih-Chun HsuVolume 2012, Article ID 521267, 9 pages
Anatomy of Biometric Passports, Dominik Malcık and Martin DrahanskyVolume 2012, Article ID 490362, 8 pages
Advanced Pulse Oximetry System for Remote Monitoring and Management,Ju Geon Pak and Kee Hyun ParkVolume 2012, Article ID 930582, 8 pages
A Collaborative Molecular Modeling Environment Using a Virtual Tunneling Service, Jun Lee,Jee-In Kim, and Lin-Woo KangVolume 2012, Article ID 546521, 7 pages
A Classification Method of Normal and Overweight Females Based on Facial Features for AutomatedMedical Applications, Bum Ju Lee, Jun-Hyeong Do, and Jong Yeol KimVolume 2012, Article ID 834578, 9 pages
A New Method of Diagnosing Constitutional Types Based on Vocal and Facial Features for PersonalizedMedicine, Bum Ju Lee, Boncho Ku, Kihyun Park, Keun Ho Kim, and Jong Yeol KimVolume 2012, Article ID 818607, 8 pages
An Integrated Gateway for Various PHDs in U-Healthcare Environments, KeeHyun Park and JuGeon PakVolume 2012, Article ID 954603, 7 pages
Security Analysis and Enhancements of an Effective Biometric-Based Remote User AuthenticationScheme Using Smart Cards, Younghwa AnVolume 2012, Article ID 519723, 6 pages
A Hybrid Technique for Medical Image Segmentation, Alamgir Nyma, Myeongsu Kang, Yung-Keun Kwon,Cheol-Hong Kim, and Jong-Myon KimVolume 2012, Article ID 830252, 7 pages
Construction of a Smart Medication Dispenser with High Degree of Scalability and RemoteManageability, JuGeon Pak and KeeHyun ParkVolume 2012, Article ID 381493, 10 pages
Real-Time Clinical Decision Support System with Data Stream Mining, Yang Zhang, Simon Fong,Jinan Fiaidhi, and Sabah MohammedVolume 2012, Article ID 580186, 8 pages
A Survey and Proposed Framework on the Soft Biometrics Technique for Human Identification inIntelligent Video Surveillance System, Min-Gu Kim, Hae-Min Moon, Yongwha Chung, and Sung Bum PanVolume 2012, Article ID 614146, 7 pages

Bayesian Integration of Isotope Ratio for Geographic Sourcing of Castor Beans,Bobbie-Jo Webb-Robertson, Helen Kreuzer, Garret Hart, James Ehleringer, Jason West, Gary Gill,and Douglas DuckworthVolume 2012, Article ID 450967, 8 pages
Secure Remote Health Monitoring with Unreliable Mobile Devices, Minho ShinVolume 2012, Article ID 546021, 5 pages
Criminal Genomic Pragmatism: Prisoners’ Representations of DNA Technology and Biosecurity,Helena Machado and Susana SilvaVolume 2012, Article ID 592364, 5 pages
Comparison of Two Suspension Arrays for Simultaneous Detection of Five Biothreat Bacterial in PowderSamples, Yu Yang, Jing Wang, Haiyan Wen, and Hengchuan LiuVolume 2012, Article ID 831052, 8 pages
Finger Vein Recognition Based on (2D)2 PCA and Metric Learning, Gongping Yang, Xiaoming Xi,and Yilong YinVolume 2012, Article ID 324249, 9 pages
Influence of Skin Diseases on Fingerprint Recognition, Martin Drahansky, Michal Dolezel,Jaroslav Urbanek, Eva Brezinova, and Tai-hoon KimVolume 2012, Article ID 626148, 14 pages
Using Hierarchical Time Series Clustering Algorithm and Wavelet Classifier for Biometric VoiceClassification, Simon FongVolume 2012, Article ID 215019, 12 pages
FGF Receptor-Mediated Gene Delivery Using Ligands Coupled to PEI-β-CyD, Yiping Hu,Guping Tang, Jun Liu, Wenxiang Cheng, Ye Yue, Jinchao Li, and Peng ZhangVolume 2012, Article ID 989235, 7 pages
Using Medical History Embedded in Biometrics Medical Card for User Identity Authentication: PrivacyPreserving Authentication Model by Features Matching, Simon Fong and Yan ZhuangVolume 2012, Article ID 403987, 11 pages
Using Medical History Embedded in Biometrics Medical Card for User Identity Authentication: DataRepresentation by AVT Hierarchical Data Tree, Simon Fong and Yan ZhuangVolume 2012, Article ID 539395, 11 pages
Antilisterial Activity of Nisin-Like Bacteriocin-Producing Lactococcus lactis subsp. lactis Isolated fromTraditional Sardinian Dairy Products, Sofia Cosentino, Maria Elisabetta Fadda, Maura Deplano,Roberta Melis, Rita Pomata, and Maria Barbara PisanoVolume 2012, Article ID 376428, 8 pages
Hindawi Publishing CorporationJournal of Biomedicine and BiotechnologyVolume 2012, Article ID 684815, 3 pagesdoi:10.1155/2012/684815
Editorial
Biometrics and Biosecurity
Tai-hoon Kim,1 Sabah Mohammed,2 Carlos Ramos,3 Osvaldo Gervasi,4
Wai-Chi Fang,5 and Adrian Stoica6
1 GVSA and University of Tasmania, 20 Virgina Court, Sandy Bay, Tasmania, Australia2 Lakehead University, 955 Oliver Road, Thunder Bay, ON, Canada P7B 5E13 Instituto Superior de Engenharia do Porto GECAD, 4200-072 Porto, Portugal4 University of Perugia, Via Vanvitelli 1, I-06123 Perugia, Italy5 National Chiao Tung University, 1001 Ta Hsueh Road, Hsinchu 300, Taiwan6 JPL NASA, The California Institute of Technology, Le Canada Flintridge, CA 91011, USA
Correspondence should be addressed to Tai-hoon Kim, [email protected]
Received 9 August 2012; Accepted 9 August 2012
Copyright © 2012 Tai-hoon Kim et al. This is an open access article distributed under the Creative Commons Attribution License,which permits unrestricted use, distribution, and reproduction in any medium, provided the original work is properly cited.
We are very happy to publish this special issue of a Journalof Biomedicine and Biotechnology published by HindawiPublishing Corporation.
This special issue contains 23 articles among totally 192papers accepted in the BSBT 2011, AITS 2012, ISA 2012,and UCMA 2012 postsubmission. Achieving such a highquality of papers would have been impossible without thehuge work that was undertaken by the International ProgramCommittee members and external reviewers. We take thisopportunity to thank them for their great support andcooperation.
Biometrics and Biosecurity focused on the variousaspects of advances in Biometrics and Biosecurity. Thisspecial issue will provide a chance for academic and industryprofessionals to discuss recent progress, problems, andsolutions in the area of biometrics and its application, biose-curity measures, biosafety protocols, including development,implementation, strategies, and policies.
In “Anatomy of biometric passports,” authors summed uprelevant details of the electronic passports implementation inthe Czech Republic. This work will be used as a basis for thenext steps in an analysis of hardware (microscopic analysis,side channel analysis, etc.) and software (protocols analysis,firmware analysis, etc.) of such passports (in fact of the RFIDchips) that will be performed soon.
In “Security analysis and enhancements of an effectivebiometric-based remote User authentication scheme usingsmart cards,” authors analyzed the security of Das’s scheme.
Authors have shown that Das’s scheme is not secure againstthe various attacks and fails to provide mutual authenticationbetween the user and the server. Also, authors proposed theenhanced scheme to overcome these security weaknesses,while preserving all their merits, even if the secret informa-tion stored in the smart card is revealed.
Paper “Advanced pulse oximetry system for remote moni-toring and management” proposes an advanced pulse oxime-try system for remote monitoring and management. Thesystem consists of a networked pulse oximeter and a personalmonitoring server. The proposed pulse oximeter measures apatient’s pulse oximetry data and transmits the data to thepersonal monitoring server.
In “Real-time clinical decision support system with datastream mining,” a new system is introduced that can analyzemedical data streams and can make real-time prediction.This system is based on stream mining algorithm calledVFDT. The VFDT is extended with the capability usingpointers to allow the decision tree to remember themapping relationship between leaf nodes and the historyrecords.
The paper “Construction of a smart medication dispenserwith high degree of scalability and remote manageability,”proposed a smart medication dispenser having a high degreeof scalability and remote manageability. Authors constructedthe dispenser to have extensible hardware architecture forachieving scalability, and we install an agent program in itfor achieving remote manageability.
2 Journal of Biomedicine and Biotechnology
The paper “A hybrid technique for medical image segmen-tation,” proposed a hybrid method for magnetic resonance(MR) image segmentation. Authors first removed impulsivenoise inherent in MR images by utilizing a vector medianfilter. Subsequently, Otsu thresholding was used as an initialcoarse segmentation method that finds the homogeneousregions of the input image. Finally, an enhanced suppressedfuzzy c-means was used to partition brain MR images intomultiple segments, which employed an optimal suppressionfactor for the perfect clustering in the given data set.
In the paper, “A survey and proposed framework onthe soft biometrics technique for human identification inintelligent video surveillance system,” the identification tech-nique using biometrics suitable for video surveillance systemwas analyzed. In addition, the framework was proposedto complement the problems of decreasing recognitionperformance due to lighting, occlusion, and shadow.
In the paper, “A classification method of normal andoverweight females based on facial features for automatedmedical applications,” authors demonstrated that it is pos-sible to predict body mass index (BMI) status using facialcharacteristics. Authors’ research results provided usefulinformation for studies of obesity and facial characteristicsand might provide useful clues in the development ofapplications for alternative diagnosis of obesity in remotehealthcare.
The aim of this paper, “A new method of diagnosingconstitutional types based on vocal and facial features forpersonalized medicine” is to develop an accurate constitutiondiagnostic method based solely on the individual’s physicalcharacteristics, irrespective of psychologic traits, characteris-tics of clinical medicine, and genetic factors. In this paper,authors suggested a novel method for diagnosing constitu-tional types using only speech and face characteristics.
In “Secure remote health monitoring with unreliablemobile devices,” authors designed a framework for secureremote health-monitoring systems. Specifically, authors (i)built a realistic risk model for sensor-data quality by inter-acting with health professionals, (ii) developed protocols andmechanisms for data protection and quality assurance, and(iii) proposed a new health-monitoring architecture that issecure despite the weaknesses of common personal devices.
The paper, “A collaborative molecular modeling environ-ment using a virtual tunneling service” proposed a collabora-tive molecular modeling environment to integrate differentmolecule modeling systems using a virtual tunneling service.Authors integrated Co-Coot, which is a collaborative crys-tallographic object-oriented toolkit, with VRMMS, whichis a virtual reality molecular modeling system, through acollaborative tunneling system.
The paper, “A privacy-preserved analytical method foreHealth database with minimized information loss” proposedthe Hiatus Tailor (HT) system. By using the executionchain graph (ECG) to progressively deidentify data, people’sprivacy can be protected. The name Hiatus Tailor refers tothe fact that the proposed system is capable of identifying themissing element within the system and fixing it.
In “An integrated gateway for various PHDs in u-healthcare environments,” authors proposed an integrated
gateway for various personal health devices (PHDs). Theevaluation results showed that the size of separate messagesfrom various PHDs is reduced through the integrationprocess, and the process does not require much time; theintegration time is negligible.
The paper “Criminal genomic pragmatism: prisoners’ rep-resentations of DNA technology and biosecurity,” explores therelationship between biometrics (specifically DNA material)and biosecurity (the risks and benefits of DNA technology)in forensic applications from the point of view of convictedoffenders.
In the paper, “Bayesian integration of isotope ratio forgeographic sourcing of castor beans,” authors investigated twosources of isotope ratio (IR) data that may provide insightinto the region of origin for castor beans; (i) light element (C,N, O, and H) stable isotope ratios (LeIR) and (ii) Sr isotoperatios (SrIR). Both data types have been used to associateplant and animal material with regions of origin.
In the paper “Influence of skin diseases on fingerprintrecognition,” authors prepared a new collection of finger-prints with skin diseases from patients, oriented not only ondactyloscopic fingerprints, but also on live fingerprint imagesfrom different fingerprint scanners. The resulting imageswill be used for quality assessment, if the quality will beacceptable for minutiae extraction and comparison based onminutiae.
In the paper, “Finger-vein recognition based on (2D) 2PCAand metric learning,” (2D)2 PCA is applied to extract featuresof finger veins, based on a new recognition method whichis proposed in conjunction with metric learning. It learns aKNN classifier for each individual, which is different fromthe traditional methods where a fixed threshold is employedfor all individuals.
In “Using hierarchical time series clustering algorithm andwavelet classifier for biometric voice classification,” a collectionof computational algorithms are proposed to support voiceclassification; the algorithms are a combination of hierarchi-cal clustering, dynamic time wrap transform, discrete wavelettransform, and decision tree.
In “Using medical history embedded in biometrics medicalcard for user identity authentication: a privacy preservingauthentication model by features matching,” authors advo-cated a novel type of user authentication by using a user’smedical history which can be electronically stored in abiometric security card.
In the paper “FGF receptor-mediated gene deliveryusing ligands coupled to PEI- β-CyD,” authors’ currentresearch indicated that the synthesized nonviral vector showsimproved gene delivery efficiency and targeting specificityin FGFR-positive cells, indicating that it may have potentialapplications in cancer gene therapy.
In the paper, “Using medical history embedded in bio-metrics medical card for user identity authentication: datarepresentation by AVT hierarchical data tree,” a new methodwas proposed for abstracting the medical data by usingattribute value taxonomies, into a hierarchical data tree (h-Data).
In comparison of two “Suspension arrays for simultaneousdetection of five biothreat bacterial in powder samples,”

Journal of Biomedicine and Biotechnology 3
authors reported a suspension array based on the 16S rDNAgene amplified by universal primers, which is also calleduniversal primer PCR-based array.
In the paper, “antilisterial activity of nisin-like bacteriocin-producing Lactococcus lactis subsp. lactis isolated from tra-ditional Sardinian dairy products” authors reported theisolation of bacteriocin-like inhibitory substances from LABstrains isolated from artisanal Sardinian dairy products.
Tai-hoon KimSabah Mohammed
Carlos RamosWai-Chi Fang
Osvaldo GervasiAdrian Stoica
Hindawi Publishing CorporationJournal of Biomedicine and BiotechnologyVolume 2012, Article ID 521267, 9 pagesdoi:10.1155/2012/521267
Research Article
A Privacy-Preserved Analytical Method for eHealth Databasewith Minimized Information Loss
Ya-Ling Chen,1 Bo-Chao Cheng,2 Hsueh-Lin Chen,1 Chia-I Lin,1 Guo-Tan Liao,2
Bo-Yu Hou,2 and Shih-Chun Hsu2
1 Service Systems Technology Center, Industrial Technology Research Institute (ITRI), Hsinchu 31040, Taiwan2 Department of Communications Engineering, National Chung Cheng University, Chiayi 62145, Taiwan
Correspondence should be addressed to Guo-Tan Liao, [email protected]
Received 17 May 2012; Revised 18 July 2012; Accepted 19 July 2012
Academic Editor: Tai Hoon Kim
Copyright © 2012 Ya-Ling Chen et al. This is an open access article distributed under the Creative Commons Attribution License,which permits unrestricted use, distribution, and reproduction in any medium, provided the original work is properly cited.
Digitizing medical information is an emerging trend that employs information and communication technology (ICT) to managehealth records, diagnostic reports, and other medical data more effectively, in order to improve the overall quality of medicalservices. However, medical information is highly confidential and involves private information, even legitimate access to dataraises privacy concerns. Medical records provide health information on an as-needed basis for diagnosis and treatment, andthe information is also important for medical research and other health management applications. Traditional privacy riskmanagement systems have focused on reducing reidentification risk, and they do not consider information loss. In addition,such systems cannot identify and isolate data that carries high risk of privacy violations. This paper proposes the Hiatus Tailor(HT) system, which ensures low re-identification risk for medical records, while providing more authenticated information todatabase users and identifying high-risk data in the database for better system management. The experimental results demonstratethat the HT system achieves much lower information loss than traditional risk management methods, with the same risk of re-identification.
1. Introduction
Electronic medical records and cloud storage have beenintroduced in hospitals in recent years. Medical institutionsare required to store electronic records in a database andprovide access for doctors and researchers. Digital records[1, 2] provide convenience, but such a system also introducesthe new challenge of storing personal information securely.The issue of privacy [3] has received much public attentionrecently. Based on personal information, a specific personcan be identified directly or indirectly. Information thatcan be used to directly identify a particular person iscalled personally identifiable information (PII). Accordingto the definition given by the United States Office ofManagement and Budget, full name, Social Security Number,face, fingerprints, and genetic information are all categorizedas PII.
According to NIST IR7628, personal information privacymeans a person has the right to decide when and whereto disclose their personal information. It also says that thestorage and access of personal information and PII mustbe secure. Three personal information security measureshave been proposed in NIST SP800-122: (1) minimizing theuse, collection, and retention of PII, (2) conducting privacyimpact assessments, and (3) deidentifying information.
Medical institutions save large amounts of personalinformation in databases whose contents can be divided intothree categories: Direct Identifiers (DID), Quasi-identifiers(QID), and Sensitive Information (SI). Information thatallows direct identification, such as the Social SecurityNumber, is called DID. Details such as date of birth, levelof education, and postcode, which can be combined toidentify a person, are QID. Information that is private andconfidential, such as medical conditions, is categorized as
2 Journal of Biomedicine and Biotechnology
SI. To provide security of personal information, medicalinstitutions are required to check information before releaseto prevent any violation of patient privacy.
When eHealth practitioners (such as service provider,insurance company and other health researcher) want toaccess medical records, the hospital can de-identify thedatabase to protect patient privacy. However, when multipleusers need to access the database, they would each haveunique requirements. The hospital must release several de-identified databases, which are then difficult to manage. Inaddition, the de-identified database differs from the originaldatabase. In other words, the de-identified database willbe altered and the degree of alteration is represented bythe information loss (IL). As the database provider, thehospital prefers high IL to protect patient privacy and lowerthe possibility of re-identification of the information. Incontrast, researchers prefer databases with low IL for theirwork. Therefore, the challenge is to strike a balance betweenthe two interests.
An information management procedure has been pro-posed [4] to manage research-oriented electronic medicalrecords. The aim is to minimize the probability of disclosureof personal information. The procedure is as follows.
(1) The information owner must check the legitimacy ofthe reason for requiring access to the database.
(2) A risk assessment must be conducted based on theuser’s requirements.
(3) Decide whether de-identification is needed based onthe risk associated. Execute various de-identificationmethods.
(4) Release the database to a user once the risk of re-identification is acceptable.
De-identification [5, 6] is the primary method of pro-tecting private information, where the original databaseis modified to prevent direct identification of a personthrough their records even if multiple databases are com-bined. Some common de-identification techniques are datareduction, data modification, data suppression, perturba-tion, and pseudonymisation [7]. The k-anonymity model[8–10] is commonly used to assess the performance ofa de-identification technique in reducing the risk of re-identification. When users search the database after adatabase is de-identified, one of every k results is authentic.However, the other k − 1 results also appear in the searchresults. Usually, the authenticity of the results cannot bedetermined, which means the higher the k value is, the lowerthe risk of re-identification is [11].
Currently, numerous privacy-preserving administrationtools are commercially available on the market, five ofwhich are markedly popular [12]: the PARAT, μ-Argus,CAT, UTD Toolbox, and sdMicro. Among them, the UTDToolbox and CAT are based on the k-anonymity algorithm.The UTD Toolbox does not provide active support for itsproducts, despite its functions designed from the developer’sperspective. The CAT suffers from usability difficulties.For example, because the k value of k-anonymity cannotbe defined using the CAT, this tool operates unstably.
In contrast to the CAT, the sdMicro is unable to processlarge datasets; furthermore, it crashes frequently. Currently,the tool receiving the most support is the PARAT, which issuperior to CAT regarding the k-anonymity algorithm, andoutperforms the μ-Argus in resulting precision level.
Some previous studies have focused on reducing therisk of re-identification. However, limited research effort hasbeen spent on safeguarding privacy while minimizing datadistortion. El Emam et al. [13] proposed a set of programsthat balance the risk and the extent of data distortion. Ifthe risk exceeds the preset threshold value, the system testsvarious de-identification techniques to try and limit datadistortion to the required level. However, such a system isunable to identify the data that is responsible for the higherrisk effectively; it spends a lot of time on the trial-and-errorprocess.
In this study, we propose the Hiatus Tailor (HT) system.By using the Execution Chain Graph (ECG) to progressivelyde-identify data, people’s privacy can be protected. The nameHiatus Tailor refers to the fact that the proposed systemis capable of identifying the missing element within thesystem and fixing it. It uses progressive risk assessment andmitigation, and is able to balance the risk of re-identificationand data distortion. Among the scenarios where the re-identification risk requirement is satisfied, the proposedmethod chooses the one that minimizes the distortion level.The main contributions of this paper are summarized asfollows.
(i) In contrast to other de-identification methods thatde-identify the entire database once, resulting inhigh IL, the HT system not only meets the privacyprotection requirements, but also categorizes datainto QID blocks using ECG. The risk is assessed pro-gressively for each block. Based the re-identificationrisk estimated by this assessment, an optimal de-identification method is selected. As de-identificationis not required at every node, the HT system iscapable of reducing IL.
(ii) Tradition risk assessment methods can only indicatewhether the risk is high or low. However, for mostdatabases, the source of the risk cannot be identified.Therefore, the process of identifying the source ofthe increased risk is time consuming. The HT sys-tem uses QID and progressively assesses risk for adatabase. ECG allows an examination of the entiresystem and assists medical institutions in evaluatingwhether the target system satisfies privacy safeguardrequirements. If the system is found to have a highlevel of risk, it is easier to identify and handle the QIDdata block that is responsible for the high-risk level.
2. HT System Architecture andOperation Method
The two main components of the HT system architectureare the Execution Chain Graph Composer (ECG Composer)and the Privacy Tailor. Based on various user requirements,the ECG composer creates the Execution Chain Graph and

Journal of Biomedicine and Biotechnology 3
Privacy Tailor
ECG composer
Risk assessment
Databaseschema
Privacy policy
Application context
Execution chain graph
HT system De-identification
Figure 1: HT system architecture.
sends it to the Privacy Tailor. As the Privacy Tailor receivesthe Execution Chain Graphs from the ECG Composer atdifferent nodes of execution, it assesses the risk of QIDcombinations in the database. If the risk is too high, it de-identifies the identifiable information with less informationloss in the database.
2.1. Architecture. The HT system architecture consists of twomajor components: ECG Composer and the Privacy Tailor(as shown in Figure 1). ECG Composer compiles the infor-mation obtained from users’ requirements and generates theExecution Chain Graph, which is sent to the Privacy Tailorfor further processing and risk assessment.
The operation of the ECG Composer is based oninformation from the following elements.
(i) Database schema: defines the properties of thedatabase, such as the type of the tables in the databaseand the attributes of the table. From the databaseschema, the data types of the stored data can beidentified.
(ii) Application context: includes components relatedto SQL query statements, which is performed withthe SELECT statement to retrieve a list of columns(including QIDs and other regular data) from one ormore queried tables with the optional WHERE clauseonly returning the rows for which the comparisonpredicate evaluates to True. These SQL query state-ments are the details relevant to the user application.The order in which the application accesses QIDsdetermines which QIDs are analyzed by ECG indifferent nodes.
(iii) Privacy policy: defines the privacy policy associatedwith the user or company, such as the threshold k(k-anonymity) for the QID. The privacy policy ismodeled as (U, Q, K, G, and F), for different users(U), the administrator can specify the QID(Q) list,the threshold k (K) to be satisfied for k-anonymity,and the de-identification technique (G). The file (F)of the de-id technique contains the de-id policy wherewe adopt the taxonomy tree approach described
in [14]. The de-identification technique (G) mayinclude Data Reduction, Data Modification, DataSuppression, Pseudonymisation, and Generalization.Each de-identification technique has its own specifi-cation which is described in the file (F). For instance,Generalization technique will revise the attributesin a hierarchy manner based on the taxonomy treestructure described in file (F). Take the field “countryof origin” as a Generalization technique example.USA and Canada are part of North-America. Ifthey are generalized, both USA and Canada will berepresented as North America.
Based on user requirements, ECG Composer compilesthe information obtained from these components andgenerates the Execution Chain Graph, which is sent to thePrivacy Tailor for further processing and risk assessment.
Privacy Tailor is analogous to a privacy managementdepartment. Its operation can be described as two stages: (1)risk assessment: executes the risk assessment procedure andestimates the re-identification risk of the current assessmentphase. (2) Deidentification: on completing the risk assess-ment, if the re-identification risk is higher than the threshold,Privacy Tailor identifies the tuples that has relatively high riskand needs to be de-identified. The re-identification risk iscalculated as described in [15] (as shown in (1)):
R = 1
Min j
(Fj
) , (1)
where Fj is the size of an equivalence class.An equivalence class is the set of records in the database
which have the same values on all quasi-identifier attributes.When an equivalence classes has the smallest value, wehave the highest probability of re-identification and use itas our re-identification risk. As such, the Risk Assessmentcomponent will scan the database based on various de-identified QID combinations to find the size for eachequivalence class and obtain the re-identification risk.
ECG Composer uses the contents of the Database schemaprovided by the user, the operations defined in Applicationcontext, and the privacy policy associated with the user, to

4 Journal of Biomedicine and Biotechnology
generate a series of Execution Chain Graphs and forwardthem to Privacy Tailor. The Execution Chain Graph willbe described in the next section. Both Privacy Tailor andExecution Chain Graph node use a node as their unit and aredivided based on several levels of re-identification risk of theQID combination in the required database table. When there-identification risk is below the privacy policy threshold,no operations are required; Privacy Tailor continues to thenext node. When the re-identification value is larger thanthe privacy policy threshold, identification is performed atthat level by comparing the re-identification risk value fordifferent combinations of QID to find the most suitablescheme.
2.2. Execution Chain Graph (ECG). Database access taskexecution is modeled and structured in various stages aimedat clients in several nodes of database retrievals. As describedearlier, the ECG Composer compiles the user requirements,consisting of the Database Schema, Application Context,and Privacy Policy, and then generates the Execution ChainGraph in which each node represents a “stored procedure”that accesses database system, and the directed edge denotesexecution sequence (or caller to caller relations). Each stageconsists of several atomic “stored procedure” nodes whichhave a set of associated attributes as follows.
(i) Information loss: the magnitude of the differencebetween the original database and the database afterde-identification.
(ii) Re-identification risk: the possibility of identifying aspecific entity directly or indirectly with various de-identified QID combinations.
(iii) Table access: the table name where information isstored and accessed.
(iv) QID: quasi-identifier, which is a subset of attributesthat can indirectly identify a specific entity in a table.
(v) Condition: the relevant WHERE clause of the SQLstatement is used to extract the records which satisfya specified criterion.
These properties can be further classified as Local andAggregate. The Local value is the result of evaluating the QIDcombination of the current node. Aggregate value is theresult of adding the evaluation of all QID combinations ofall previous nodes.
2.3. ECG Composer. This section describes the ECG com-poser process. The ECG composer requires users to providerelevant data as input. When the system receives datafrom the admin, it will output an Execution Chain Graphaccording to requirements, and each node will have aform to record relevant data. The input to ECG composerconsists of the Database Schema Ω; Application ContextΨ; and QID List Γ. Algorithm 1 shows the algorithm ofECG composer, which creates a node set S based on theuser’s Application Context. Every node has an associatedform that records node information. The order in which theapplication accesses QIDs determines the execution order
which represents a direct edge from Si to its successor, Sj .It will retrieve the specified table, attribute list (AL), andconditions for the data from the Application Context. ECGcomposer compares the AL with the QID list (QL). If there isan intersection, the QIDs in the intersection will be assessedaccording to the privacy policy, in the order of applicationaccess. In each node, node information will be updated tocomplete ECG generation.
Figure 2 shows an example for the operations of ECGcomposer. Supposedly, we have QID List (Γ = age, region,sex, and education) and Application Context Ψ listed asbelow:
SELECT age FROM E table WHERE age ≥30,
SELECT region FROM E table WHERE age ≥30,
SELECT sex FROM E table WHERE age ≥30.
Database Schema defines the data types for age, region,and sex as integer, varchar, varchar, respectively. Based online 5 and 6 in Algorithm 1, ECG composer creates a node setS with 3 nodes (S1, S2, and S3) and connects the 3 nodes. Eachnode has an empty node information form that specifiesinformation loss, re-id risk, and table access. This is theinitial ECG. For each node, ECG executes line 08 statementto extract the (Table, AL, Condition) from Ψ. For example,(E table, age, age ≥ 30) is extracted from the SQL statement“SELECT age FROM E table WHERE age≥ 30” for S1 . Next,ECG composer will compute the intersection of the attributelist (e.g., AL = age for S1) and the QID List (Γ = age, region,sex, and education). If the intersection (QL) is not emptythen ECG performs two steps (line 11 and line 12) as follows:(1) updates node information form (TABLE, QL, Condition)for Si; and (2) assesses risk for the current node Si locally.
In our example, according to the order of applicationaccess, the system will assess age, region and sex in S1, S2,and S3 one by one. The assessment is based on the thresholdk defined in the input privacy policy. For example, in nodeS1, according to SQL statement (SELECT age FROM E tableWHERE age ≥ 30), the age data from E table satisfyingage ≥ 30 will be selected and by the definition in databaseschema, age is an integer value. After risk assessment, there-id risk is calculated to be 0.03. Initially, as the data hasnot been processed yet, the value of IL is 0. When nodeinformation is updated, IL = 0, re-id risk = 0.03, TableAccess = E table, QID = age, and Condition = age ≥ 30will be recorded in the node information. On the other hand,when the intersection (QL) is empty which means this SQLstatement has no risk due to no QID access, we will skip thenode Si.
2.4. Privacy Tailor. Algorithm 2 represents the Privacy Tailoralgorithm. After the ECG composer creates the Execu-tion Chain Graph, Privacy Tailor will calculate the re-identification risk and extent of data alteration at the levelof the node and record it in the node data. If the risk valueis higher than the threshold, Privacy Tailor will first evaluateand analyze each node to estimate re-identification risk andchoose the most appropriate data for identification.

Journal of Biomedicine and Biotechnology 5
(1) Given: Database schema Ω; Application Context Ψ;QID List Γ;
(2) AL: Attribute list;(3) QL: Target QID list;(4) S: node set;
//Create ECG(5) S = Construct the node set from Ψ;(6) Build the direct edge set for each pair of (Si, Si) based on the order of the QID accesses in Ψ;(7) For each node Si{ //Si ∈ S (i: number of node);(8) Extract the corresponding (Table, AL, Condition);(9) QL = ∩ AL;(10) If (QL != Φ) {(11) Update (TABLE, QL, Condition) for Si;(14) Assess risk for Si;(15) }(16) }
Algorithm 1: ECG composer algorithm.
Attributes Local Aggregate
Information loss 0
Re-identification risk 0.03Table access E Table
QID
age
Condition
Node information in S1
k = 2(risk = 0.5)
No. SQL statement
1 SELECT age FROM E table WHERE age ≥30
2 SELECT region FROM E table WHERE age ≥30
3 SELECT sex FROM E table WHERE age ≥30
QID
Type
age Integer
region Varchar
sex Varchar
ECG composer
Execution chain graph
Database schema Application context
age ≥30
Threshold k
Privacy policy
S1S2S3
Figure 2: ECG composer operation.
However, after knowing the identification information,the re-identification risk value will change. Therefore, thePrivacy Tailor must reanalyze based the new information.If the calculated risk value does not exceed the threshold,it proceeds to the next node for analysis. When the re-identification value at each node is below the threshold, thePrivacy Tailor completes execution.
Continuing the example from Figure 2, the ExecutionChain Graph can be divided into three levels, node in termsof nodes S1, S2, and S3 (as shown in Figure 3). Using S1
as an example, re-identification of node information showsno value initially. Next, the Privacy Tailor performs an
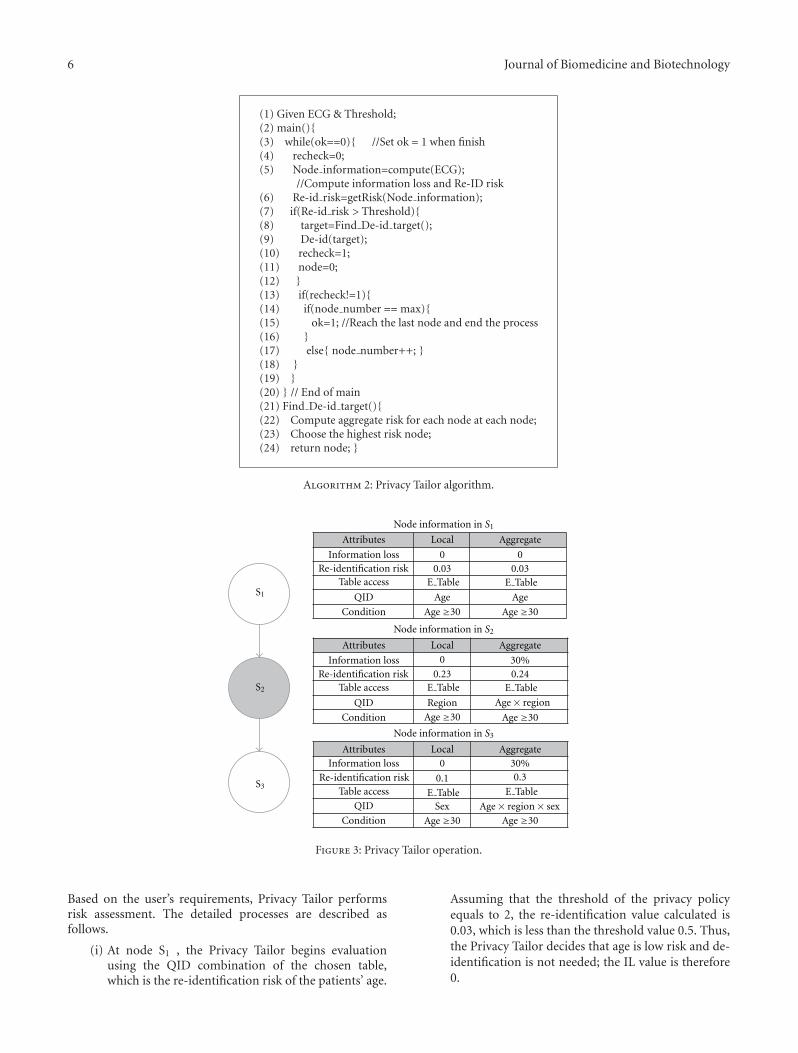
evaluation and fills in the current node information. In nodeS1, all QIDs belong to E table, the Age data. It satisfiesthe Conditions (comparison predicate) restricting the rowsreturned by the query (e.g., age ≥ 30), as the re-identificationrisk is 0.03. Thus, de-identification is no required and datadistortion is zero. In addition, if risk value is larger than theuser-specified threshold, the user specified de-identificationmethod will be used and privacy model classes will be createdaccording to the de-identification file.
Assume that a user requires access to information storedin the electronic hospital records database. The informationin the database may include patients’ age, region, and gender.
6 Journal of Biomedicine and Biotechnology
(1) Given ECG & Threshold;(2) main(){(3) while(ok==0){ //Set ok = 1 when finish(4) recheck=0;(5) Node information=compute(ECG);
//Compute information loss and Re-ID risk(6) Re-id risk=getRisk(Node information);(7) if(Re-id risk > Threshold){(8) target=Find De-id target();(9) De-id(target);(10) recheck=1;(11) node=0;(12) }(13) if(recheck!=1){(14) if(node number == max){(15) ok=1; //Reach the last node and end the process(16) }(17) else{ node number++; }(18) }(19) }(20) } // End of main(21) Find De-id target(){(22) Compute aggregate risk for each node at each node;(23) Choose the highest risk node;(24) return node; }
Algorithm 2: Privacy Tailor algorithm.
Attributes Local Aggregate
Information loss 0 0Re-identification risk 0.03 0.03
Table access E Table
E Table E Table
E Table
E Table
E Table
QID Age Age
Condition
Information lossRe-identification risk
Table access
QID
Condition
Information loss
Re-identification riskTable access
QID
Condition
Age ≥30 Age ≥30
Age ≥30Age ≥30
Age ≥30Age ≥30
Attributes Local Aggregate
Attributes Local Aggregate
0 30%0.23 0.24
Region
0 30%
0.1 0.3
Sex
Node information in S1
Node information in S2
Node information in S3
Age× region
Age× region× sex
S2
S3
S1
Figure 3: Privacy Tailor operation.
Based on the user’s requirements, Privacy Tailor performsrisk assessment. The detailed processes are described asfollows.
(i) At node S1 , the Privacy Tailor begins evaluationusing the QID combination of the chosen table,which is the re-identification risk of the patients’ age.
Assuming that the threshold of the privacy policyequals to 2, the re-identification value calculated is0.03, which is less than the threshold value 0.5. Thus,the Privacy Tailor decides that age is low risk and de-identification is not needed; the IL value is therefore0.

Journal of Biomedicine and Biotechnology 7
(ii) After evaluating S1, node S2 is evaluated, whichinvolves calculating the re-identification risk of thecombination of age and region (age × region). Sup-posedly, the result obtained is 0.73, which exceeds thethreshold. Therefore, the Privacy Tailor must proceedwith de-identification at this level. There are threepossible de-identification ways (age, region, and age×region), each associated with re-identification riskand information loss (as shown in Table 1). Aftercalculating the results for the three different de-identification approaches, the Privacy Tailor willchoose to perform de-identification on “region”because it has a relatively low re-identification riskand the lowest data distortion level. After finishingthis step, the Local re-identification risk will changefrom 0.73 to the after de-identification risk value0.23. The Aggregate risk value will union S1 to S2.In other words, it rescans the QIDs in the union of S1
and S2 to obtain an aggregate risk value of 0.24; LocalIL equals 30%, and Aggregate IL equals the sum of ILand that for S1 , which is 0% plus 30%, equals 30%.
(iii) After finishing the assessment of S2, it will calculatethe re-identification risk of the (age × region ×sex) combination at S3, and the result obtained is0.1, which is lower than the threshold value. Afterrescanning the union of QIDs in the 3 nodes fromS1 to S3, the aggregate risk value becomes 0.3 (lessthan the threshold 0.5). Therefore, the Privacy Tailorwill stop de-identification at this level.
This example demonstrates that the Privacy Tailordecides whether to perform de-identification based on therisk level, and then locate the optimal QID information com-bination from different conditions; de-identification is notperformed on all QID information. This multilevel methodonly needs to deal with local information combinations mostof the time and therefore can effectively reduce IL value. Inaddition, it can also identify the high-risk data in a databaseand help improve privacy safeguards.
3. Simulation and Results
This section presents a discussion of the experimentsperformed. The environment developed in C language isused to simulate the workflow of the HT system. Weused two datasets in the experiment. The first dataset issourced from the Microdata (demodata.asl) and Macrodata(demodata.rda) of μ-Argus [16], and is called Dataset 1(shown with solid lines). The second dataset is sourcedfrom the adult data set of the UCI Machine LearningRepository [17], and is called Dataset 2 (shown using dashedlines). Under the considerations of the re-identification riskthreshold between k = 2 and k = 15, the target attributes areage, address, and income.
Based on assumptions above, the ECG composer out-puts an Execution Chain Graph with accessing three QIDattributes: age, address, and income. In each node, thePrivacy Tailor assesses whether the re-identification risk ishigher than the threshold. If the risk is within an acceptable
Table 1: Different cases in re-indemnification process.
Case Re-indemnification risk Information loss
Age 0.55 50%
Region 0.23 30%
Age × Region 0.36 70%
range, the information will be passed to the next nodewithout de-identifying the attribute. In our experiment, therisk values assessed in node one and node two are lowerthan the threshold, while the node three assessment resultis higher than the threshold. Therefore, an appropriate de-identification method combination is required.
Firstly, the risk of each de-identification combination ofthe attributes needs to be assessed. There are seven pos-sible de-identification combinations: address, age, income,address × age, age × income, address × income, andaddress × age × income. When the risk values of allnodes are lower than the threshold, we perform data de-identification with only some of the attributes, which resultin low information distortion. The following paragraphspresent the results plotted from the experiments. The HTsystem uses the same de-identification techniques as μ-Argus. With the same re-identification risk threshold (k), wecompared the distortion levels between de-identifying withthe optimal combination of HT and de-identifying with theentire dataset of μ-Argus. The distortion level is representedby Modification Rate (MR) and Extended Bias In Mean(EBIM).
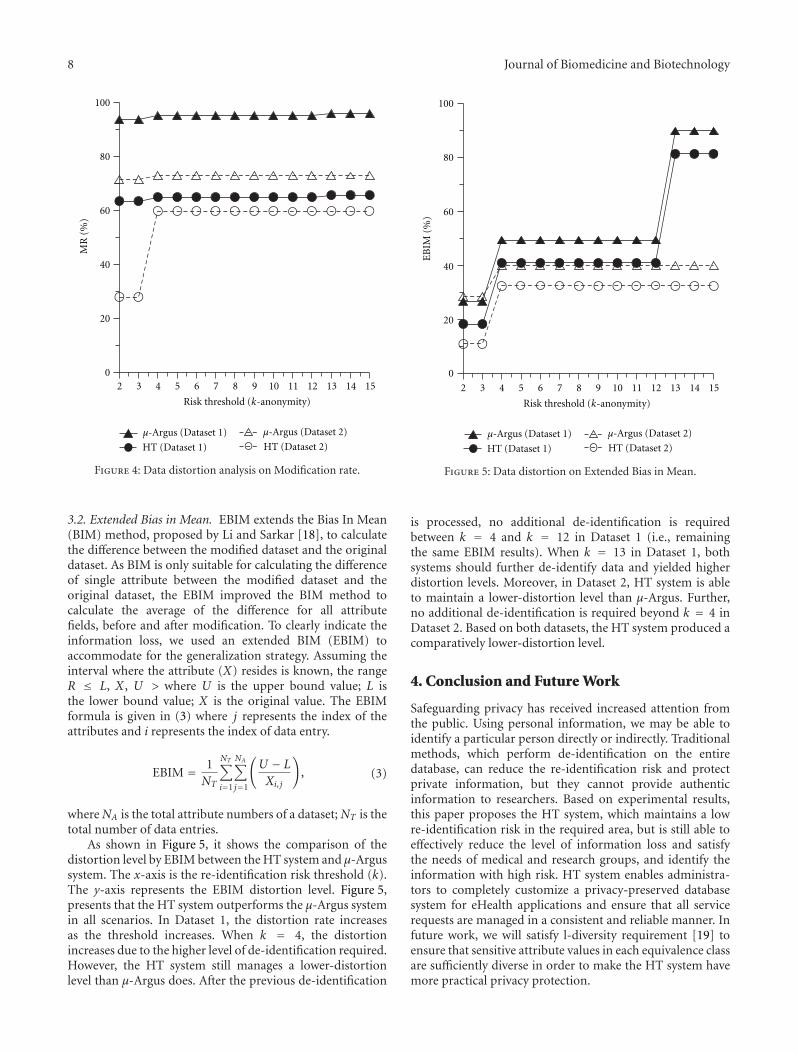
3.1. Modification Rate. MR represents the distortion levelbased on the amount of data being modified. The ideahere is that when executing a de-identification procedure, aportion of the data is modified, which causes data distortion.Equation (2) is to calculate the ratio between the numbers ofmodified attributes and the total attribute numbers.
MR = NA
NT, (2)
where NA is the number of modified attributes of a dataset,and NT is the total number of attributes in the dataset.
Figure 4 demonstrates the MR of both the HT systemand the μ-Argus system. The x-axis represents the re-identification risk k, and the y-axis represents the MR of thede-identified dataset. As shown in the figure, for Dataset 1,the amount of data that needs to be modified is 65% and95% for the HT system and μ-Argus system, respectively.According to (2), the distortion level is determined by theamount of data that is modified. Thus, the distortion level ofthe HT system is 30% lower than that of the μ-Argus system.For Dataset 2, we find that when k = 2, the amount of datathat needs to be modified is 28% and 70% for the HT systemand μ-Argus system, respectively. As the threshold increases,a larger part of dataset needs to be modified, and our systemmaintains a relatively low-distortion level. Even when k = 4,the MR of HT system increases, but remains lower than μ-Argus. Therefore, in terms of MR, the HT system is superior.
8 Journal of Biomedicine and Biotechnology
MR
(%
)
100
80
60
40
20
02 3 4 5 6 7 8 9 10 11 12 13 14 15
μ-Argus (Dataset 1) μ-Argus (Dataset 2)
HT (Dataset 1) HT (Dataset 2)
Risk threshold (k-anonymity)
Figure 4: Data distortion analysis on Modification rate.
3.2. Extended Bias in Mean. EBIM extends the Bias In Mean(BIM) method, proposed by Li and Sarkar [18], to calculatethe difference between the modified dataset and the originaldataset. As BIM is only suitable for calculating the differenceof single attribute between the modified dataset and theoriginal dataset, the EBIM improved the BIM method tocalculate the average of the difference for all attributefields, before and after modification. To clearly indicate theinformation loss, we used an extended BIM (EBIM) toaccommodate for the generalization strategy. Assuming theinterval where the attribute (X) resides is known, the rangeR ≤ L, X , U > where U is the upper bound value; L isthe lower bound value; X is the original value. The EBIMformula is given in (3) where j represents the index of theattributes and i represents the index of data entry.
EBIM = 1NT
NT∑i=1
NA∑j=1
(U − L
Xi, j
), (3)
where NA is the total attribute numbers of a dataset; NT is thetotal number of data entries.
As shown in Figure 5, it shows the comparison of thedistortion level by EBIM between the HT system and μ-Argussystem. The x-axis is the re-identification risk threshold (k).The y-axis represents the EBIM distortion level. Figure 5,presents that the HT system outperforms the μ-Argus systemin all scenarios. In Dataset 1, the distortion rate increasesas the threshold increases. When k = 4, the distortionincreases due to the higher level of de-identification required.However, the HT system still manages a lower-distortionlevel than μ-Argus does. After the previous de-identification
μ-Argus (Dataset 1) μ-Argus (Dataset 2)
HT (Dataset 1) HT (Dataset 2)
100
80
60
40
20
0
2 3 4 5 6 7 8 9 10 11 12 13 14 15
Risk threshold (k-anonymity)
EB
IM (
%)
Figure 5: Data distortion on Extended Bias in Mean.
is processed, no additional de-identification is requiredbetween k = 4 and k = 12 in Dataset 1 (i.e., remainingthe same EBIM results). When k = 13 in Dataset 1, bothsystems should further de-identify data and yielded higherdistortion levels. Moreover, in Dataset 2, HT system is ableto maintain a lower-distortion level than μ-Argus. Further,no additional de-identification is required beyond k = 4 inDataset 2. Based on both datasets, the HT system produced acomparatively lower-distortion level.
4. Conclusion and Future Work
Safeguarding privacy has received increased attention fromthe public. Using personal information, we may be able toidentify a particular person directly or indirectly. Traditionalmethods, which perform de-identification on the entiredatabase, can reduce the re-identification risk and protectprivate information, but they cannot provide authenticinformation to researchers. Based on experimental results,this paper proposes the HT system, which maintains a lowre-identification risk in the required area, but is still able toeffectively reduce the level of information loss and satisfythe needs of medical and research groups, and identify theinformation with high risk. HT system enables administra-tors to completely customize a privacy-preserved databasesystem for eHealth applications and ensure that all servicerequests are managed in a consistent and reliable manner. Infuture work, we will satisfy l-diversity requirement [19] toensure that sensitive attribute values in each equivalence classare sufficiently diverse in order to make the HT system havemore practical privacy protection.

Journal of Biomedicine and Biotechnology 9
References
[1] J.-H. Kao, C.-Y. Hsu, Y.-P. Sung, and W. P. Liao, “DICOM-based multi-center electronic medical records managementsystem,” International Journal of Bio-Science and Bio-Tech-nology, vol. 2, no. 2, pp. 11–22, 2010.
[2] S.-H. Lin, Y.-C. G. Lee, and C.-Y. Hsu, “Data warehouseapproach to build a decision-support platform for orthopedicsbased on clinical and academic requirements,” InternationalJournal of Bio-Science and Bio-Technology, vol. 2, no. 1, pp. 1–12, 2010.
[3] J. Pedraza, M. A. Patricio, A. de Asıs, and J. M. Molina,“Privacy and legal requirements for developing biometricidentification software in context-based applications,” Inter-national Journal of Bio-Science and Bio-Technology, vol. 2, no.1, pp. 13–24, 2010.
[4] Health System Use Technical Advisory Committee—Data De-Identification Working Group, “‘Best Practice’ Guidelinesfor Managing the Disclosure of De-Identified Health Informa-tion,” Ottawa, Canada, Canadian Institute for Health Informa-tion, 2010.
[5] K. El Emam, “Risk-based de-identification of health data,”IEEE Security and Privacy, vol. 8, no. 3, pp. 64–67, 2010.
[6] K. El Emam, “Heuristics for de-identifying health data,” IEEESecurity and Privacy, vol. 6, no. 4, pp. 58–61, 2008.
[7] A. Appari and M. E. Johnson, “Information security andprivacy in healthcare: current state of research,” InternationalJournal of Internet and Enterprise Management, vol. 6, no. 4,2010.
[8] L. Sweeney, “k-anonymity: a model for protecting privacy,”International Journal of Uncertainty, Fuzziness and Knowlege-Based Systems, vol. 10, no. 5, pp. 557–570, 2002.
[9] L. Sweeney, “Achieving k-anonymity privacy protection usinggeneralization and suppression,” International Journal ofUncertainty, Fuzziness and Knowlege-Based Systems, vol. 10, no.5, pp. 571–588, 2002.
[10] K. El Emam and F. K. Dankar, “Protecting Privacy Usingk-Anonymity,” Journal of the American Medical InformaticsAssociation, vol. 15, no. 5, pp. 627–637, 2008.
[11] P. Samarati and L. Sweeney, “Protecting privacy when disclos-ing information: k-anonymity and its enforcement throughgeneralization and suppression,” in Proceedings of the IEEESymposium on Research in Security and Privacy, Oakland, Calif,USA, May 1998.
[12] R. Fraser and D. Willison, “Tools for De-Identification of Per-sonal Health Information,” Pan Canadian Health InformationPrivacy (HIP) Group, 2009.
[13] K. El Emam, F. K. Dankar, R. Vaillancourt, T. Roffey, and M.Lysyk, “Evaluating the risk of re-identification of patients fromhospital prescription records,” Canadian Journal of HospitalPharmacy, vol. 62, no. 4, pp. 307–319, 2009.
[14] B. C. M. Fung, K. Wang, and P. S. Yu, “Top-down specializa-tion for information and privacy preservation,” in Proceedingsof the 21st International Conference on Data Engineering (ICDE’05), pp. 205–216, Tokyo, Japan, April 2005.
[15] F. K. Dankar and K. El Emam, “A method for evaluating mar-keter re-identification risk,” in Proceedings of the EDBT/ICDTWorkshops, Lausanne, Switzerland, March 2010.
[16] Voorburg Group, “μ-Argus version 4.2 Software and User’sManual,” Netherlands Statistical Office, 2008.
[17] A. Frank and A. Asuncion, “UCI Machine Learning Repos-itory,” University of California, School of Information andComputer Science, 2010, http://archive.ics.uci.edu/ml.
[18] X. B. Li and S. Sarkar, “A tree-based data perturbationapproach for privacy-preserving data mining,” IEEE Transac-tions on Knowledge and Data Engineering, vol. 18, no. 9, pp.1278–1283, 2006.
[19] A. Machanavajjhala, D. Kifer, J. Gehrke, and M. Venkitasub-ramaniam, “�-diversity: privacy beyond k-anonymity,” ACMTransactions on Knowledge Discovery from Data, vol. 1, no. 1,Article ID 1217302, 2007.
Hindawi Publishing CorporationJournal of Biomedicine and BiotechnologyVolume 2012, Article ID 490362, 8 pagesdoi:10.1155/2012/490362
Research Article
Anatomy of Biometric Passports
Dominik Malcık and Martin Drahansky
Faculty of Information Technology, Brno University of Technology, Bozetechova 2, 61266 Brno, Czech Republic
Correspondence should be addressed to Dominik Malcık, [email protected]
Received 25 May 2012; Accepted 18 July 2012
Academic Editor: Tai Hoon Kim
Copyright © 2012 D. Malcık and M. Drahansky. This is an open access article distributed under the Creative CommonsAttribution License, which permits unrestricted use, distribution, and reproduction in any medium, provided the original work isproperly cited.
Travelling is becoming available for more and more people. Millions of people are on a way every day. That is why a bettercontrol over global human transfer and a more reliable identity check is desired. A recent trend in a field of personal identificationdocuments is to use RFID (Radio Frequency Identification) technology and biometrics, especially (but not only) in passports. Thispaper provides an insight into the electronic passports (also called e-passport or ePassport) implementation chosen in the CzechRepublic. Such a summary is needed for further studies of biometric passports implementation security and biometric passportsanalysis. A separate description of the Czech solution is a prerequisite for a planned analysis, because of the uniqueness of eachimplementation. (Each country can choose the implementation details within a range specified by the ICAO (International CivilAviation Organisation); moreover, specific security mechanisms are optional and can be omitted).
1. Introduction
Nowadays it is still more necessary to be able to perform theidentity check of passengers quickly and reliably—to prevent,for example, unauthorized border crossing, or to avoid anyattempts of terrorist attacks, and so forth.
The idea of a better passport system incorporating bio-metrics has been alive for more than 20 years. However, ithas taken considerable time to prepare all aspects for the newtechnology. Using biometrics to improve the system of traveldocuments is undoubtedly a crucial milestone. Naturally,there are security threats due to the fact that all biometricfeatures are usually very sensitive information that has to beappropriately treated.
2. Motivation
After the incidents of the 11th September 2001 in New York,USA, a strong need for a better type of security at airportsand borders all over the world was rising. This idea hadexisted before 11th September 2001. However, that particularterrorist attack can be considered as a strong impulse to startimplementing a new security policy [1].
The reason for introducing the new security policy im-plementing electronic and biometric elements was not only
an outcome of the terrorism. A better control over migrationprocess with a lower number of illegal immigrants was alsodemanded. Another item on the list was an aggravation ofthe processes leading to faking documents. Last but not least,the target was to achieve a simpler, faster and a more accurateidentity check process.
Use of technologies based on biometric features ensuresalmost all the aforementioned aspects. Security of storingand handling biometric information has to be treated inthe best possible way, because this information can be easilymisused.
3. Responsibility for the Global Passports’Evolution
A worldwide cooperation on unification of travel documentsis under the auspices of the ICAO (http://www.icao.int/)(International Civil Aviation Organisation) with a mandategranted by the UN (http://www.un.org/) (United Nations)in 1947. With respect to the mandate of the UN, the ICAOissues recommendations and standards for employing newtechnologies in the field of travel documents (recently, theimplementation of biometrics).

2 Journal of Biomedicine and Biotechnology
MRZ
RFID chip with the antenna isintegrated into the data page.
Figure 1: On the left: a Czech biometric passport specimen with circled international logo of electronic passports; top right: RFID chipwithout and with antenna; bottom right: data page with labelled MRZ (source: [1]).
The elements introduced by the ICAO, for example,unified passport data page or Machine Readable Zone (MRZ),can be seen in current versions of passports across the world.This can be, unquestionably, considered as a tangible resultof the ICAO’s work [1].
4. RFID Technology
Radio Frequency Identification is currently a widely usedwireless identification technology. It is massively used simplyfor identification (chain supplement, personal identificationcards, access cards, etc.), but its capabilities are much greater.It always depends on the type of the chip—some of themhave only few bytes of ROM memory, but on the otherhand, modern trend is to integrate various functions withsufficient amount of writeable memory. In the case ofePassports (all the electronic passports are labelled with aninternational logo—see the red circle in Figure 1) we can talkabout cryptographic functions and r/w memory modulesaccompanied with memory modules that are readable onlyfor the tag itself (no information from these memory cellscan be retrieved out of the device).
RFID technology is based on two main devices—RFIDtag (also known as the RFID transponder) and the RFIDreader that has, in fact, usually also a writing ability, so theterm “RFID reader” can be misleading. RFID tag can beeither active or passive. The tag is commonly connected toan antenna. Active tags have onboard power supply (usuallya battery) and active transmitter. Analogically to the activetags, the passive tags have no integrated power source andno active transmitter. The biggest difference between activeand passive tags is the price and the operating range—passivetags’ range is given in centimetres or tens of centimetres(ePassports incorporate passive RFID tags), in contrast to
that, the active tags can communicate for up to kilometres[2].
All wireless technologies bring many advantages, but alsodisadvantages—in the scope of travel documents the biggestissue is security. It is clear that all wireless transfers canbe eavesdropped or exposed to other known attacks—themanner of use of biometric passports can prevent someattacks like, for example, “man in the middle,” because thereader is in close distance to the passport. That is why allcommunication transferring sensitive information has to besecurely encoded.
For the ePassport RFID chips was chosen standard com-pliant with ISO 14443 with modulation A or B frequency fortransmissions is 13,56 MHz with a short range (max. 15 cm)[19].
5. Passport Chip Memory
The memory is logically divided into two main regions—oneis accessible from outside of the chip (via wireless communi-cation), the second one provides a part of security by hidingits content—the hidden content is available only for internalfunctions of the chip.
The part of memory available for reading provides six-teen separated data groups (labelled as DG1, DG2, ,DG16—see Figure 2). Each group incorporates differentdata. Dissimilar types of protection are used over the groupsof the stored data. The data groups DG1, DG2, DG3 andDG5 are important within the scope of the biometric pass-ports, because these groups are used for storing informationrelated to the identity check [3].
Data Group 1. DG1 stores exactly the same informationas those presented at the data page of the passport (see thebottom right part of Figure 1)—basic personal information

Journal of Biomedicine and Biotechnology 3
Detail(s)recorded
inMRZ
DG1
Document type
Issuing state or organization
Name (of holder)
Document number
Check digit doc number
Nationality
Date of birth
Check digit DOB
Sex
Data of expiry or vaild until date
Check digit DOE/VUD
Optional data
Check digit optional data field
Composite check digit
Encodedidentification
feature(s)
Global interchangefeature
Additionalfeature(s)
DG2
DG3
DG4
Encoded face
Encoded finger(s)
Encoded eye(s)
DG5
DG6
DG7
DG8
DG9
DG10
DG11
DG12
DG13
DG14
DG15
DG16
Displayed portrait
Reserved for future use
Displayed signature or usual mark
Data feature(s)
Structure feature(s)
Substance feature(s)
Additional personal detail(s)
Additional document detail(s)
Optional detail(s)
Reserved for future use
Active authentication puplic key info
Person(s) to notify
Displayedidentification
feature(s)
Encodedsecurity
feature(s)
Figure 2: Memory data groups of passport RFID chip. Please notice especially the description of DG1–DG5 (source: [3]).
like name, date and place of birth, sex, date of expiration, andso forth.
Data Group 2. This data group is dedicated to a digitalform of a facial photograph. Size limit is set to 15 kilobytes.
Data Group 3. The most recent security element of pass-ports—fingerprint(s)—is stored in the DG5. Size limit is setto 15 kilobytes per fingerprint.
Data Group 4. Data group 4 should contain encoded irisdata, but this feature has not been used yet.
Data Group 5. The last important data group (withrespect to the biometrics) stores a photo of an owner thatis depicted on the data page.
6. Introduction to Biometrics
Techniques based on biometric features are being widelydeployed especially in the spheres, where a higher level ofsecurity or a precise identification is desired. However, allthe technologies are becoming affordable for more ordinarypurposes, as well. Therefore, we can expect a massive use ofbiometric-based products in the following decades.
A proper biometric feature should be unique for eachperson and it should be invariable in time (usually froma specific age); given in the simplest possible way—it isan unambiguous identifier of a person. Moreover, some ofthe biometric features are well proven and have been evenpractically used for a long period of time—for example,fingerprints in criminalistics. On the other hand, many ofthe biometric features have been explored relatively recently.As it is not possible to give an exhaustive overview ofbiometrics, let us focus on the features that are important forcontemporary passport implementation—2D facial photoand fingerprints (the use of iris can be expected in the nearfuture) [4].
6.1. Facial Photograph. Facial photograph of an applicant isemployed as a basic security element. This type of securityis well known also from older types of documents. In classic
Figure 3: On the top left: an example of ideal facial photo withmeasures; top right: the Czech endpoint station from the officers’view; bottom: unacceptable facial photos (sources: [5, 6]).
paper documents, the facial photo primarily serves for visualidentification by officers. Despite the officers’ training andtheir ability to recognise a person even if there is some changein an applicant’s appearance (moustache, haircut, glasses,etc.), the case of similar individuals (twins, siblings or evendoubles) could lead to identity mismatch. If the facial photois treated from a biometric point of view (not just as a pictureof a person) —the face contains information that is invariantin time and can be measured (see Figure 3), for example, thedistance between eyes, position of chin, position of nose, andso forth. These factors can affect the recognition process byproviding additional information to the officer. Nonetheless,the twins will still look similar. That is why an absolutelydifferent security component is needed (see Section 6.2)[4].
Picture Data Storage. The picture data (facial photo) istaken according to specifications in ISO19794-5 that definesconditions for acquirement of this type of data: format,scene, picture properties, and so forth. The picture data is

4 Journal of Biomedicine and Biotechnology
Figure 4: Examples of fingerprint fakes of different materials.
stored on the chip twice (DG2 and DG5—see Figure 2), bothin JPEG/JPEG 2000 format.
The first occurrence is designated for laser engraving withfollowing properties—grayscale, 60px distance between eyes,resolution of 620× 796, stored in DG5. The second picture isencoded and stored in DG2 in full colour, resolution of 240× 320 with max. size of 15 kilobytes. This smaller image isused for biometric identity check [3, 6, 7].
6.2. Fingerprints. With respect to the facts introduced inthe second paragraph of Section 6 the need for new reliablemeans of identity verification has been solved by introducingfingerprints. It has been proven that even fingerprints ofmonozygotic twins are significantly different. That meansthe two identities of twins can be undoubtedly distinguishedby matching the corresponding fingerprint with its storeddigital representation (of course, not only with the digitalrepresentation of the fingerprint, but also with, e.g, a paperrecord of that fingerprint—however, this variant is not dealtwith in this paper). Even so, there still exist possibilities forcounterfeiting fingerprints. Nevertheless, the fraudsters haveto face the problems with tricking the fingerprint scanners,because the scanners are being more often equipped withsophisticated liveness detection—especially when a securityrisk is expected. Sometimes it is simply almost impossibleto cheat the fingerprint checking, because of a presence ofan officer. Adopting this measure naturally does not resultin an absolutely perfect protection against unwanted actions(Absolute security does not exist). Nonetheless, the securitylevel has rapidly increased with incorporating a fingerprintcheck [4].
Here might be considered that a potential attacker canuse finger fakes to circumvent the fingerprint reader. Secur-ing automated and unsupervised fingerprint recognitionsystems used for the access control is one of the most criticaland most challenging tasks in real world scenarios. Basicthreats for a fingerprint recognition system are repudiation,coercion, contamination, and circumvention [8]. A varietyof methods can be used to get an unauthorized access toa system based on the automated fingerprint recognition.If we neglect attacks on the algorithm, data transport, andhardware (all these attacks demand good IT knowledge),one of the simplest possibilities is to produce an artificialfingerprint using soft silicon, gummy and plastic material, orsimilar substances [8–10]—see Figure 4. One example of theuse of an artificial finger is shown in Figure 5, where you cansee the fingerprint from a rubber stamp in comparison withthe fingerprint from a real finger. For a really big amountof sensors, there is no difference between them, that is,the artificial fingerprint is processed and recognized as oneconcreter enrolled user from the database. To discourage
(a) (b)
Figure 5: Difference between a rubber stamp fingerprint (a) and afingerprint from a real finger (b).
• Histopathological changes
• Skin discoloration
• Histopathological changes and skin discoloration
Figure 6: Examples of histopathological changes (upper row), skindiscoloration (middle row) and a combination of both previouscategories (lower row).
potential attackers from presenting a fake finger (i.e., animitation of the fingertip and the papillary lines) or, evenworse, to hurt a person to gain access, the system mustbe augmented by a liveness detection component [8, 11,12]. To prevent false acceptance we have to recognize ifthe finger on the plate of the fingerprint sensor (alsoreferred to as fingerprint scanner) is alive or not. There existthe following liveness detection methods [8]: perspiration,spectroscopic characteristics, ultrasonic technology, physicalcharacteristics—temperature, hot and cold stimulus, pres-sure stimulus, electrical properties, bio-impedance, pulse,blood oxygenation, and some other not very reliable meth-ods.
The second often neglected problem are skin diseasesand their influence on fingerprint recognition [13–15]. Theseskin diseases (attacking fingers or generally hands) could bedivided into three main groups [13, 14]: histopathologicalchanges, skin discoloration, combination of histopatholog-ical changes and skin discoloration—see examples in theFigure 6. Histopathological changes mean that the structureof papillary lines is changed and the biometric system isnot able to detect the separate papillary lines and valleysamong them. Most of the sensors are based on physicalprinciples, which do not allow acquiring of a fingerprintwith a histopathological skin disease. The second group

Journal of Biomedicine and Biotechnology 5
Voice
Face
Hand shapeFingerprint
Iris
Finger vein
Security
Usa
bilit
y
Figure 7: A simple comparison of biometric features with high-lighted features proposed for future use in passports (source: [17]).
contains skin discoloration, that is, only the colour of theskin is changed, but the structure of papillary lines is keptunchanged. The most of sensors for fingerprint acquirementare not prone to this type of skin diseases. The last categorycombines both previous types. This category is very difficultfor almost all of fingerprint sensors, because the combinationof change of the structure of papillary lines and change oftheir colour is often resulting in a structure and colour, whichis not recognizable as a fingerprint for further processing.In [13, 14], you can find not only more closer descriptionof these skin disease categories including concrete diseaseexamples, but basic information how you can evaluate thequality of a fingerprint, that is, recognize if the skin is affectedby such a distortion, which does not allow to acquire and/orprocess the acquired fingerprint.
Fingerprint Data Storage. Fingerprints are taken in com-pliance with ISO/IEC FCD 19794-4 and ANSI/NIST-ITL1-2000 IS standards. The quality of the stored fingerprinthas to be marked with NFIQ (NIST Fingerprint ImageQuality) equal to 3 or a better grade. In Figure 2 can beseen that a DG3 has been designed to hold fingerprint data.Maximal data size of one fingerprint is 15 kB in compressedformat WSQ (Wavelet Scalar Quantization) specified indocument IAFIS-0110 (V3), precisely according to the Gray-scale Fingerprint Image Compression Specification 1997[1, 7].
6.3. Proposal for Further Use of Biometrics in Passports. Withrespect to the latest results in the sphere of biometrics, itis convenient to incorporate more biometric features intoone device to ensure the quality of an automatic processingof personal identities and to prevent frauds in this area.Proposed features for a future use are primarily based on aniris recognition (use of the iris recognition has been alreadyprepared in current passports, however the real application isstill not common), veins of fingers recognition and especiallycombinations of these features with time-proven fingerprints(for a better illustration see Figure 7). A correctly imple-mented combination of aforementioned biometric featuresshould be robust enough to provide all demanded properties
of a passport system. Moreover, scanning of veins of a fingerduring a fingerprint scanning process should also provideliveness detection at the same time—that is a very importantaspect in a fake fingerprint detection [8, 12, 16].
7. The Czech Implementation
The Czech electronic passport was introduced as a seconddevice of this type in the EU (the passport system architec-ture can be seen in Figure 8). Since that time new types ofsecurity have been already introduced, however due to thebackward compatibility of all solutions across the world andgiven minimal requirements of the ICAO, the former threatswill be still present.
Despite particular rules were set by either the ICAOor consequently by the EU, there is still enough space forcountry-specific modifications. This results in a variety ofsolutions across the world that are different, but (mostly)compatible at the same time. The necessity for variability oflocal solutions rises from the fact that each country has itseffective law and implemented related technologies that hasto be incorporated into the passport employment.
7.1. Legislative Framework for Passports in the Czech Republic.A relevant legislative background for implementation ofthe mentioned security technologies was established by theEuropean Union as a reaction to the 11th September 2001terrorist attacks (This date is probably mentioned too often,however, consequence of this event was undoubtedly a verystrong argument for employing a more sophisticated traveldocuments technology). To be more precise, a preparation ofsuch a technology started much earlier, in 1981. The originalproposals were set by the ICAO organisation and the EUregulations proceed from these recommendations.
Let us consider a coherent approach of the EU (2003) asa first important document for this paper. A brief sequenceof milestones with respect to the Czech Republic implemen-tation then came into being as follows [18].
20th June 2003. A coherent approach in biometricsimplementation for biometric documents and data forthe EU citizens, third country nationals and informationsystems.
13th December 2004. The council regulation No. 2252/2004 concerning standards for security features and biomet-rics in passports was issued by the Council of the EuropeanUnion.
28th February 2005. The EU Commission DecisionC(2005) 409 established the technical specifications on thestandards for security features and biometrics in passportsand travel documents.
15th June 2005. Government of the Czech Republic issuesthe ruling Nr. 740 that approves the process of implemen-tation of the European Council regulations in the CzechRepublic.
23rd December 2005. Signature of a contract with provid-er, STC, s.p. (National Printer of valuables).1st September 2006. Launch of the first stage of the project—testing of the whole process with regular data.

6 Journal of Biomedicine and Biotechnology
Operation of CSmonitoring
helpdesk
227 + 8contact places
Centralevidence
Central system (CS)Ministry of the Interior
Courier
Issuer of passports
STC, s.p.
Transport of passports to ministry of the interiorand from Ministry of the Interior to contact places
Figure 8: The Czech passport system architecture (source: Ministry of the Interior of the Czech Republic).
1st April 2009. Launch of the second stage of theproject—implementation of fingerprints (as the secondcountry in the EU, after Germany).
7.2. Security. The main goal of the whole ePassport project isto preserve privacy of the personal data and prevent forgeryof the travel documents. Different measures are used withrespect to the importance of the particular aspect.
During the process of biometric passsport implementa-tion (from assignment to the final product) several securityaspects were treated, especially:
(i) A process security in general.
(ii) A security of involved buildings.
(iii) Mechanical and optical security elements.
(iv) Public key infrastructure (PKI).
(v) Fulfilment of international standards and recommen-dations.
(vi) Digital communication encryption.
(vii) Incorporation of biometrics.
Mechanical and Optical Elements. Security elements of thistype are often used not only in passports (but also, e.g, banknotes, other types of personal documents, etc.). Althoughwe do not aim at this type of security, let us mention atleast some of them (not all of the listed items have to benecessarily employed in the last passport revision of theCzech Republic): serial numbers, fluorescent elements, reliefstamping, engraving, guilloches, holograms, laser perfora-tions, mechanic perforations, watermarks and many more.Basic Access Control (BAC). A very simple mechanism usedfor protection of information stored in DG1 and DG5 (seeSection 5). The BAC technique is based on two crucial prin-ciples—the first: data can be read only in case the passport isopened on the data page (if not, the RFID chip is shielded—a communication cannot be technically established); the
second, the MRZ contains information which is used for thetransmission password derivation. Actually, the data in DG1and DG5 are the same as the information on the passportdata page (see the right bottom part of Figure 1), that is whyin the case the attacker has the ability to open the passporton the data page and read the MRZ, the information fromthe data page (and also from the DG1 and DG5) is not secretanymore.
The keys for the BAC are derived by SHA-1 (It is possibleto use SHA-1 or SHA-2 (SHA224, SHA256, SHA384, andSHA512)) from the MRZ, precisely from the passport serialnumber (9 characters), owner’s date of birth (6 characters)and the date of expiry (6 characters). The result of the hashfunction is truncated to 16 bytes and divided into two pass-ports (key A: 0th–7th byte; key B: 8th–15th byte) for 3DES. Akey for the main communication is then established via 3DESencoded messages [1, 5, 6, 19].Active Authentication (AA). The active authentication servesas a protection against passport cloning. A couple of keys(private and public) is generated during the process ofpersonalization of a new passport. The private key is storedin a part of memory that is inaccessible from outside of thechip (it is provided only in the hardware of the chip). Thepublic key is freely available in DG15 [3].
The principle is then based on the asymmetric cryptogra-phy. Random data are generated and sent to a passport chipby a reader. The data are signed internally with the private keystored in the chip and sent back to the reader. In the last step,the reader verifies compatibility of the key pair and emits aresult about authenticity of the private key [1, 6].
7.2.1. Extended Access Control (EAC). The aforementionedBAC is definitely too weak to secure the sensitive biometricdata—the fingerprints (DG3), in the future also the iris(DG4). Therefore, a new security specification was made.The EAC was specified in technical report BSI TR-03110(Advanced Security Mechanism for Machine Readable Travel
Journal of Biomedicine and Biotechnology 7
Documents—Extended Access Control). The EAC has beenused in the Czech Republic since April 1, 2009 (it wasbrought to light together with incorporation of the finger-prints) [1, 6, 19].
Two cryptographic mechanisms are being used withinEAC.
Chip Authentication (CA, based on Diffie-Hellman). Itis an alternative to active authentication (protection againstchip cloning). In contrast to the active authentication, theCA does not suffer from so called challenge semantics. Thechallenge semantics can cause tracking of the owner’s trans-fer in a specific case. That is why Germany did not includeAA into their implementation of ePassport. After the DHprocess a cryptographically strong shared secret is availablefor encoding the following communication [19].
Terminal Authentication (TA, based on PKI). Only ap-proved terminals have permission to access the data groupswith biometric data. The terminal has to be equipped witha valid certificate of a particular country to access the data.Each terminal is set to a specific self-destruction time period.The length of this period depends strictly on conditions ofuse of each terminal (from 1 shift to 1 month max.). Eachterminal is labelled with unambiguous ID and can be blocked[1, 6].
7.3. Introducing of New Security Principles. Generally, it isalways important to employ contemporary standards, forexample, cryptographic standards, to ensure resistance toattacks against algorithms, protocols, hardware, and so forth.Use of new techniques is recommended also in the area oftravel documents by the ICAO. Nevertheless, the introduc-tion of technologies capable to handle such new versions ofpassports—with new algorithms and security principles—takes a certain time (in some countries less, in some countriesmore). However, till the time the old passport securitymechanisms as, for example, BAC or manual identity checksupported as regular principles, it will be possible to performattacks against these poor mechanisms at least at placeswhere the more secure mechanisms of current passports(fingerprints, iris) have not been implemented.
The best solution of this situation would be to preparea completely new revision of passports with employing onlycontemporary secure mechanisms, but how to assure that allcountries would be able to adopt new technologies necessaryfor handling the new passports? (And what about the com-patibility with local law and regulations?). This is the biggestissue that cannot be easily solved, and so the backwardcompatibility will always open possibilities for attackers andfraudsters.
An absolutely different issue is the hardware designsecurity. The hardware design of the Czech biometric pass-ports has not been examined yet. That is why we cannotpredict the current status of the hardware design now(of course there exist some general recommendations fordesigning secure hardware to prevent side channel attacks ormicroscopic analysis) (It is convenient to study these mech-anisms especially from the area of smart cards where newcountermeasures are usually introduced first).
A complete hardware analysis (including microscopicanalysis, side channel analysis, etc.) is the aim of our futurework—results and proposals for better implementation willbe published in our future texts.
8. Conclusion
This paper sums up relevant details of the electronicpassports implementation in the Czech Republic. This workwill be used as a basis for the next steps in an analysis ofhardware (microscopic analysis, side channel analysis, etc.)and software (protocols analysis, firmware analysis, etc.) ofsuch passports (in fact of the RFID chips) that will beperformed within the next months.
Acknowledgments
This work is partially supported by the research plan“Security-Oriented Research in Information Technology”,MSM0021630528 (CZ), by the grant “Advanced secured,reliable and adaptive IT,” FIT-S-11-1 (CZ), by the grant“Information Technology in Biomedical Engineering,” GD102/09/H083, and by the European Regional DevelopmentFund in the IT4Innovations Centre of Excellence project(CZ.1.05/1.1.00/02.0070).
References
[1] T. Holenda, Prezentace Projektu ePas pro Odbornou KonferenciSystemova Integrace-Presentation of the Project ePassport forConference System Integration, Presentation, Ministry of TheInterior of the Czech Republic, Holesovice, Czech Republic,2009.
[2] S. She, “Technical analysis of security mechanisms used inRFID E-passport, related threats, security and privacy issues,”Viterbi School of Engineering, University of Southern Califor-nia.
[3] The International Civil Aviation Organisation, Machine Read-able Travel Documents (Part 1, Volume 2), ICAO, Montreal,Canada, 2006.
[4] M. Drahansky, F. Orsag, M. Dolezel et al., Biometrie (Biomet-rics), Computer Press, Brno, Czech Republic, 2011.
[5] T. Holenda, Odborna konference Quality & Security-ConferenceQuality & Security, Presentation, Ministry of The Interior ofthe Czech Republic, Holesovice, Czech Republic, 2007.
[6] P. Mayer, Biometricke pasy v Ceske republice-Biometric pass-ports in the Czech Republic, presentation, Siemens CR, Praha,Czech Republic, 2007.
[7] F. Malec, Druha Generace Elektronickych Pasu a Nova GeneraceElektronickych prukazu o Povoleny k Pobytu (The second gener-ation of electronic passports and a new generation of electronicdocuments), Presentation, SmartCard Forum, London, UK,2010.
[8] M. Drahansky, Liveness Detection in Biometrics, Book-Ad-vanced Biometric Technologies, InTech, Rijeka, Croatia, 2011.
[9] T. Matsumoto, H. Matsumoto, K. Yamada, and S. Hoshino,“Impact of artificial “Gummy” fingers on fingerprint systems,”in Proceedings of the Optical Security and Counterfeit Deter-rence Techniques IV (SPIE ’02), vol. 4677, pp. 275–289, usa,January 2002.
8 Journal of Biomedicine and Biotechnology
[10] B. Tan, A. Lewicke, and S. Schuckers, “Novel methods forfingerprint image analysis detect fake fingers,” in Proceedingsof the Optical Security and Counterfeit Deterrence Techniques(SPIE ’08), p. 3, 2008.
[11] M. Drahansky and D. Lodrova, “Liveness detection for bio-metric systems based on papillary lines,” International Journalof Security and Its Applications, vol. 2, no. 4, pp. 29–37, 2008.
[12] M. Drahansky, Fingerprint recognition technology: liveness de-tection, image quality and skin diseases [Habilitation thesis],BUT, Brno, Czech Republic, 2010.
[13] M. Drahansky, M. Dolezel, J. Urbanek, E. Brezinova, and T.Kim, “Influence of skin diseases on fingerprint recognition,”Journal of Biomedicine and Biotechnology, vol. 2012, Article ID626148, 14 pages, 2012.
[14] M. Drahansky, Fingerprint Recognition Technology-RelatedTopics, LAP, Saarbrcken, Germany, 2011.
[15] M. Drahansky, E. Brezinova, F. Orsag, and D. Lodrova, “Clas-sification of skin diseases and their impact on fingerprintrecognition,” in Proceedings of the Special Interest Group onBiometrics and Electronic Signatures, pp. 173–176, GI, Darm-stadt, Germany, 2009.
[16] K. Dileep and R. Yeonseung, “A brief introduction of bio-metrics and fingerprint payment technology,” InternationalJournal of Advanced Science and Technology, vol. 4, pp. 25–38,2009.
[17] Hitachi, Ltd.: About Finger Vein, http://www.hitachi-ics.co.jp/product/english/about fv.htm.
[18] European Commission: Borders & Visas-Document security,http://ec.europa.eu/home-affairs/doc centre/borders/bordersdoc en.htm, 2012.
[19] L. Rasek, “Elektronicke pasy-jak fungujı (Electronic passports-how it works),” in proceeding of the Czech Open System UsersfGroup, Viterbi School of Engineering, 2006.
Hindawi Publishing CorporationJournal of Biomedicine and BiotechnologyVolume 2012, Article ID 930582, 8 pagesdoi:10.1155/2012/930582
Research Article
Advanced Pulse Oximetry System for RemoteMonitoring and Management
Ju Geon Pak and Kee Hyun Park
Computer Engineering Department, Keimyung University, Sindang-dong, Dalseo-gu, Daegu 704-701, Republic of Korea
Correspondence should be addressed to Kee Hyun Park, [email protected]
Received 24 May 2012; Accepted 6 June 2012
Academic Editor: Sabah Mohammed
Copyright © 2012 J. Pak and K. Park. This is an open access article distributed under the Creative Commons Attribution License,which permits unrestricted use, distribution, and reproduction in any medium, provided the original work is properly cited.
Pulse oximetry data such as saturation of peripheral oxygen (SpO2) and pulse rate are vital signals for early diagnosis of heartdisease. Therefore, various pulse oximeters have been developed continuously. However, some of the existing pulse oximetersare not equipped with communication capabilities, and consequently, the continuous monitoring of patient health is restricted.Moreover, even though certain oximeters have been built as network models, they focus on exchanging only pulse oximetry data,and they do not provide sufficient device management functions. In this paper, we propose an advanced pulse oximetry systemfor remote monitoring and management. The system consists of a networked pulse oximeter and a personal monitoring server.The proposed pulse oximeter measures a patient’s pulse oximetry data and transmits the data to the personal monitoring server.The personal monitoring server then analyzes the received data and displays the results to the patient. Furthermore, for devicemanagement purposes, operational errors that occur in the pulse oximeter are reported to the personal monitoring server, and thesystem configurations of the pulse oximeter, such as thresholds and measurement targets, are modified by the server. We verify thatthe proposed pulse oximetry system operates efficiently and that it is appropriate for monitoring and managing a pulse oximeterin real time.
1. Introduction
Nowadays, various personal health devices (PHDs) arereleased on a continual basis in recognition of the necessityfor healthcare technologies at home. A PHD is a device thatmeasures data on the health of its user, for instance, a pulseoximeter, activity monitor, or medication reminder. Amongthe various PHDs, the pulse oximeter, which measures pulseoximetry data (e.g., saturation of peripheral oxygen (SpO2)and pulse rate), has become one of the most important PHDsfor early diagnosis of heart disease [1, 2].
However, some of the existing pulse oximeters are notequipped with communication capabilities, and conse-quently, the continuous monitoring of patient health is res-tricted. Moreover, even though certain oximeters have beenbuilt as network models, they focus on exchanging onlypulse oximetry data and they do not provide sufficient devicemanagement functions.
Meanwhile, in a situation, where networked PHDs arebeing applied to various u-health services, the standard-ization of diverse PHDs is very important to guaranteeinteroperability between u-health services [3, 4]. As a result,ISO/IEEE 11073 [5] was proposed to define how personalhealth data should be exchanged between a PHD and amonitor and what format should be used for the data.
Despite the ISO/IEEE 11073 Committee efforts to stan-dardize various PHDs, many existing PHDs are nonstandard.Many manufacturers of PHDs for u-health service providersstill use their own protocols, and consequently their PHDscannot be regarded as interoperable. This causes increasesin maintenance costs and prevents an integrated u-healthservice.
In this paper, we propose an advanced pulse oximetrysystem for remote monitoring and management. The systemconsists of a networked pulse oximeter and a personalmonitoring server. The proposed pulse oximeter measures

2 Journal of Biomedicine and Biotechnology
PHD (agent) Manager
Association request (sys. ID, conf. ID)
Checksys. ID,conf. ID
Store conf.
Remote operation invoke | get (object, attribute)
Remote operation invoke | response (value of attribute)
Remote operation invoke | response (response)
Remote operation invoke | response (response)
Store data
Association release request (reason)
Association release response (reason)
Remote operation invoke | set (object, attribute, new value)
Extractconf.
Extractmeasurements,
errors
Extractvalue ofattribute
Modifyvalue ofattribute
Association phase
Association response (response)
Configuration phase
Remote operation invoke | confirmed event report (conf.)
Remote operation invoke | confirmed event report
Remote operation response | confirmed event report (response)
Operation phase
Disassociation phase
(value of SpO2, pulse rate, errors )
Figure 1: Communication procedure.
a patient’s pulse oximetry data and transmits the data to thepersonal monitoring server. For the proposed system tosupport remote monitoring and management functions, weimplement a PHD agent and manager on the basis of ourprevious design study [6]. The PHD agent is placed in thepulse oximeter, and the PHD manager is placed in the per-sonal monitoring server.
The PHD agent converts pulse oximetry data andoperational errors that occur in the pulse oximeter to an ISO/IEEE 11073 message format and transmits them to thepersonal monitoring server. In the proposed system, thepulse oximeter measures SpO2 and pulse rate and detectsfour operational errors: sensor disconnected, sensor off, sig-nal non-detected, and signal inadequate. The PHD managerextracts the pulse oximetry data and operational errors fromthe received messages. It also manages two componentsof the system configuration of the pulse oximeter: thethresholds for SpO2 and pulse rate and measurement targets.
We verify that the proposed pulse oximetry systemoperates efficiently and that it is appropriate for monitoringand managing a pulse oximeter in real time; the averageresponse time for transmitting pulse oximetry data or errorsis 251 ms.
The rest of this paper is organized as follows: Section 2introduces the ISO/IEEE 11073 standard as backgroundinformation. Section 3 describes the pulse oximetry system
in detail. Section 4 presents the results of implementationand evaluation of the system. Finally, Section 5 draws con-clusions and discusses some future directions for research.
2. ISO/IEEE 11073
ISO/IEEE 11073 was proposed on May 2006, to guaranteeinteroperability between various PHDs. It specifies howpersonal health data should be exchanged between a PHDand a monitor and what format should be used for thedata. The 11073-20601 Optimized Exchange Protocol [5] wasproposed to define the communication procedure and inter-operable transmission format. Figure 1 shows the commu-nication procedures between PHD (or agent) and manager.Communication procedure can be divided into four phasesas follows.
(i) Association Phase. In this phase, an agent sends anassociation request message including associationinformation (e.g., system ID and configuration ID) toa manager to establish a session. The manager ana-lyzes the message and checks the configuration of theagent. If the manager can recognize the configu-ration, the manager responds with an “accepted”parameter (i.e., the association was accepted). In thiscase, the operation phase is initiated. Alternatively,

Journal of Biomedicine and Biotechnology 3
SpO2
0x0001 ScanReporfInfoFixed.obs-scan-fixedvalue[0].obj-handle=1
0x0001 ScanReporfInfoFixed.obs-scan-fixed.value[0].obj-val-data.length=10
0x0062 Basic-Nu-Obserlved-Value=98(%)
0x2007 12 06 12 10 00 00 Absolute-Time-Stamp=2007-12-06T12:10:0000
Pulse rate
0x000A ScanReporflnfoFix.obs-scan-fixed.value[0].obj-handle=10
0x0001 ScanReporfInfoFixed.obs-scan-fixed.value[0].obj-val-data.length=10
0x0048 Simple-Nu-Observed-VaIue=72(beats/min)
0x2007 12 06 12 10 00 00 Absolute-Time-Stamp=2007-12-06T12:10:0000
Figure 2: Standard message for transmitting SpO2 and pulse rate.
if the manager does not recognize the configuration,the manager responds with an “accepted-unknown-config” parameter (i.e., the association was acceptedbut the configuration needs transmitted). In this case,the configuration phase is initiated.
(ii) Configuration Phase. During this phase, the agentsends its configuration to the manager. The man-ager stores the configuration and responds with an“accepted” parameter to prompt the agent into theoperation phase.
(iii) Operation Phase. During this phase, the agent trans-mits personal health data and device information tothe manager. The personal health data are transmit-ted periodically or whenever the agent takes healthdata from a PHD. In contrast, device informationis transmitted at the request of the manager, whichsends a “Get” method to retrieve the device informa-tion.
(iv) Disassociation Phase. If the agent or manager doesnot have any more messages to transfer, this phaseis initiated to release the established session. Duringthis phase, association release request and responsemessages are exchanged, with a “disassociation”reason.
The ISO/IEEE 11073 Standard also specifies device spe-cialization protocols considering the characteristics of eachPHD, such as 11073-10404 (pulse oximeter) [7], 11073-10407 (blood pressure monitor) [8], 11073-10408 (ther-mometer) [9], and 11073-10417 (glucose meter) [10]. Eachspecialization protocol details how a PHD works and acts asa description for creating a specific type of agent.
Among the protocols, 10404 describes pulse oximeters indetail. This protocol defines objects to represent data thatare measured or estimated by pulse oximeters (e.g., SpO2,pulse rate, and pulsatility). Of these, SpO2 and pulse rate aremandatory objects. Figure 2 depicts the standard messagesfor transmitting SpO2 and pulse rate.
Despite the ISO/IEEE 11073 Committee efforts to stan-dardize various PHDs, many existing PHDs are nonstandard.
Many manufacturers of PHDs for u-health service providersstill use their own protocols, and consequently their PHDscannot be regarded as interoperable. This causes increasesin maintenance costs and prevents an integrated u-healthservice.
3. Proposed Pulse Oximetry System
In this section, we describe the proposed pulse oximetrysystem in detail. The system consists of a networked pulseoximeter and a personal monitoring server. The proposedpulse oximeter measures a patient’s pulse oximetry data andtransmits the data to the personal monitoring server. For theproposed system to support remote monitoring and manage-ment functions, we implement a PHD agent and manager onthe basis of our previous design study [6]. The PHD agent isplaced in the pulse oximeter, and the PHD manager is placedin the personal monitoring server.
The PHD agent converts pulse oximetry data andoperational errors that occur in the pulse oximeter to anISO/IEEE 11073 message format and transmits them to thepersonal monitoring server. The PHD manager extracts thepulse oximetry data and operational errors from the receivedmessages. It also manages the system configuration of thepulse oximeter.
3.1. Pulse Oximeter. The pulse oximeter is developed tomeasure patient pulse oximetry data. The pulse oximeterarchitecture is shown in Figure 3.
(i) SpO2 Sensor. This measures SpO2 and pulse rateusing an infrared LED, a red LED, and a light sensorphoto (PIN) diode. Infrared light and red light arepassed through the user’s finger the PIN diode.
(ii) Amplifier. This amplifies the input signal.
(iii) Analog Filter. This decoupled the high-frequencynoise.
(iv) ADC. This converts a continuous signal to discretesignal.
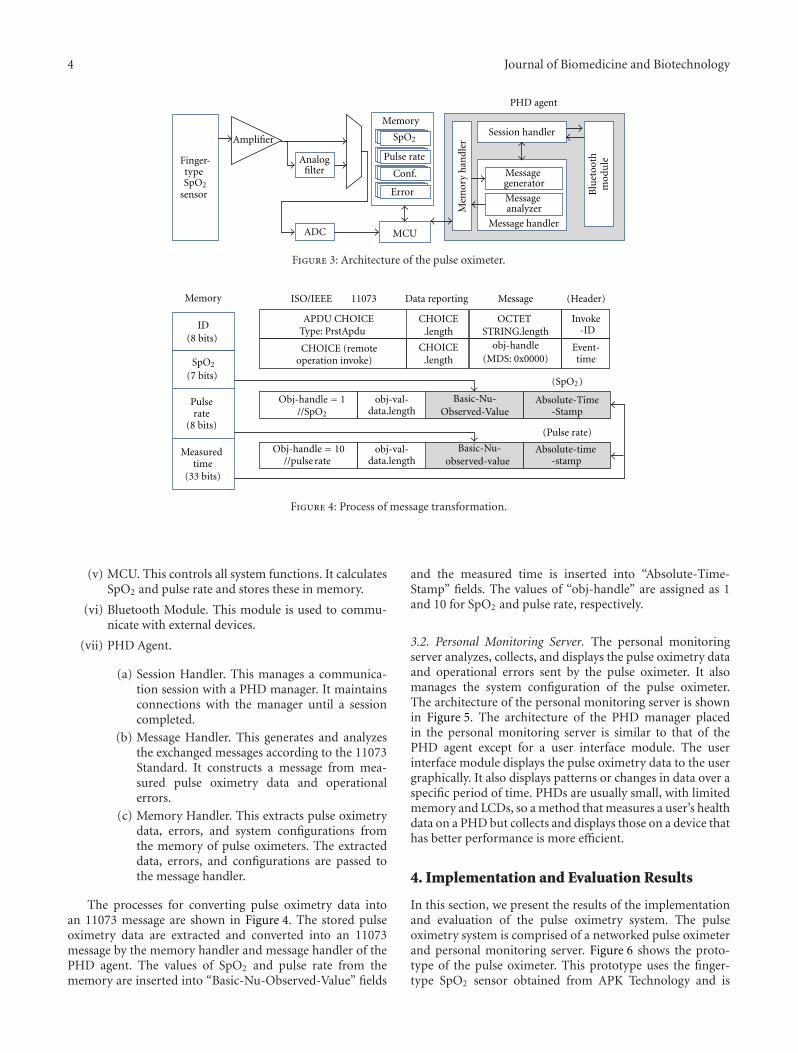
4 Journal of Biomedicine and Biotechnology
Session handler
Message handler
Mem
ory
han
dler
Message generator
Message analyzer
Blu
etoo
thm
odu
le
PHD agent
Amplifier
Analogfilter
ADC
Memory
MCU
Pulse rate
Conf.
Error
Finger-type
sensorSpO2
SpO2
Figure 3: Architecture of the pulse oximeter.
IDCHOICE
.length
CHOICE.length
OCTET STRING.length
CHOICE (remoteoperation invoke)
(Header)
(Pulse rate)
ISO/IEEE 11073 Data reporting Memory
(8 bits)
Pulserate
(8 bits)
(7 bits) SpO2
Measured time
(33 bits)
Message
APDU CHOICEType: PrstApdu
Invoke-ID
timeEvent-
(SpO2)
obj-handle(MDS: 0x0000)
data.lengthobj-val-
data.lengthobj-val-
Basic-Nu-Observed-Value
Basic-Nu-observed-value
Absolute-Time-Stamp
Absolute-time-stamp
//SpO2
Obj-handle = 10
Obj-handle = 1
//pulse rate
Figure 4: Process of message transformation.
(v) MCU. This controls all system functions. It calculatesSpO2 and pulse rate and stores these in memory.
(vi) Bluetooth Module. This module is used to commu-nicate with external devices.
(vii) PHD Agent.
(a) Session Handler. This manages a communica-tion session with a PHD manager. It maintainsconnections with the manager until a sessioncompleted.
(b) Message Handler. This generates and analyzesthe exchanged messages according to the 11073Standard. It constructs a message from mea-sured pulse oximetry data and operationalerrors.
(c) Memory Handler. This extracts pulse oximetrydata, errors, and system configurations fromthe memory of pulse oximeters. The extracteddata, errors, and configurations are passed tothe message handler.
The processes for converting pulse oximetry data intoan 11073 message are shown in Figure 4. The stored pulseoximetry data are extracted and converted into an 11073message by the memory handler and message handler of thePHD agent. The values of SpO2 and pulse rate from thememory are inserted into “Basic-Nu-Observed-Value” fields
and the measured time is inserted into “Absolute-Time-Stamp” fields. The values of “obj-handle” are assigned as 1and 10 for SpO2 and pulse rate, respectively.
3.2. Personal Monitoring Server. The personal monitoringserver analyzes, collects, and displays the pulse oximetry dataand operational errors sent by the pulse oximeter. It alsomanages the system configuration of the pulse oximeter.The architecture of the personal monitoring server is shownin Figure 5. The architecture of the PHD manager placedin the personal monitoring server is similar to that of thePHD agent except for a user interface module. The userinterface module displays the pulse oximetry data to the usergraphically. It also displays patterns or changes in data over aspecific period of time. PHDs are usually small, with limitedmemory and LCDs, so a method that measures a user’s healthdata on a PHD but collects and displays those on a device thathas better performance is more efficient.
4. Implementation and Evaluation Results
In this section, we present the results of the implementationand evaluation of the pulse oximetry system. The pulseoximetry system is comprised of a networked pulse oximeterand personal monitoring server. Figure 6 shows the proto-type of the pulse oximeter. This prototype uses the finger-type SpO2 sensor obtained from APK Technology and is
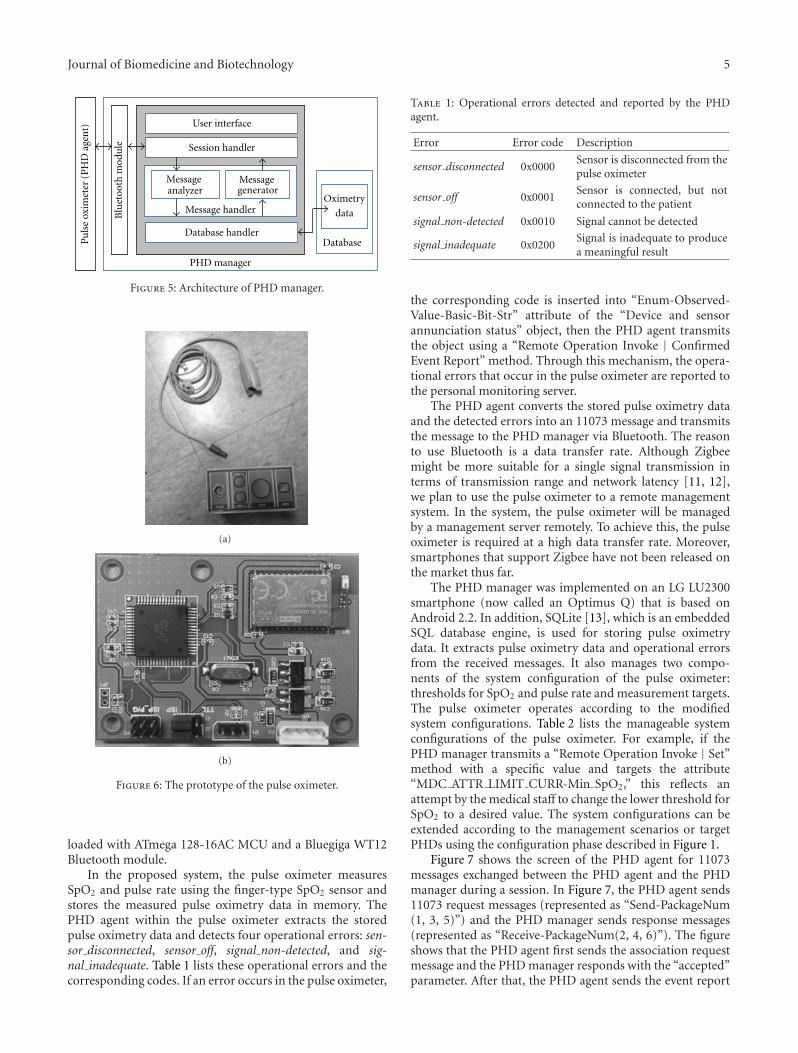
Journal of Biomedicine and Biotechnology 5
Blu
etoo
th m
odu
leUser interface
Session handler
Message handler
Message generator
Message analyzer
Database handlerDatabase
Oximetry
data
PHD manager
Pu
lse
oxim
eter
(P
HD
age
nt)
Figure 5: Architecture of PHD manager.
(a)
(b)
Figure 6: The prototype of the pulse oximeter.
loaded with ATmega 128-16AC MCU and a Bluegiga WT12Bluetooth module.
In the proposed system, the pulse oximeter measuresSpO2 and pulse rate using the finger-type SpO2 sensor andstores the measured pulse oximetry data in memory. ThePHD agent within the pulse oximeter extracts the storedpulse oximetry data and detects four operational errors: sen-sor disconnected, sensor off, signal non-detected, and sig-nal inadequate. Table 1 lists these operational errors and thecorresponding codes. If an error occurs in the pulse oximeter,
Table 1: Operational errors detected and reported by the PHDagent.
Error Error code Description
sensor disconnected 0x0000Sensor is disconnected from thepulse oximeter
sensor off 0x0001Sensor is connected, but notconnected to the patient
signal non-detected 0x0010 Signal cannot be detected
signal inadequate 0x0200Signal is inadequate to producea meaningful result
the corresponding code is inserted into “Enum-Observed-Value-Basic-Bit-Str” attribute of the “Device and sensorannunciation status” object, then the PHD agent transmitsthe object using a “Remote Operation Invoke | ConfirmedEvent Report” method. Through this mechanism, the opera-tional errors that occur in the pulse oximeter are reported tothe personal monitoring server.
The PHD agent converts the stored pulse oximetry dataand the detected errors into an 11073 message and transmitsthe message to the PHD manager via Bluetooth. The reasonto use Bluetooth is a data transfer rate. Although Zigbeemight be more suitable for a single signal transmission interms of transmission range and network latency [11, 12],we plan to use the pulse oximeter to a remote managementsystem. In the system, the pulse oximeter will be managedby a management server remotely. To achieve this, the pulseoximeter is required at a high data transfer rate. Moreover,smartphones that support Zigbee have not been released onthe market thus far.
The PHD manager was implemented on an LG LU2300smartphone (now called an Optimus Q) that is based onAndroid 2.2. In addition, SQLite [13], which is an embeddedSQL database engine, is used for storing pulse oximetrydata. It extracts pulse oximetry data and operational errorsfrom the received messages. It also manages two compo-nents of the system configuration of the pulse oximeter:thresholds for SpO2 and pulse rate and measurement targets.The pulse oximeter operates according to the modifiedsystem configurations. Table 2 lists the manageable systemconfigurations of the pulse oximeter. For example, if thePHD manager transmits a “Remote Operation Invoke | Set”method with a specific value and targets the attribute“MDC ATTR LIMIT CURR-Min SpO2,” this reflects anattempt by the medical staff to change the lower threshold forSpO2 to a desired value. The system configurations can beextended according to the management scenarios or targetPHDs using the configuration phase described in Figure 1.
Figure 7 shows the screen of the PHD agent for 11073messages exchanged between the PHD agent and the PHDmanager during a session. In Figure 7, the PHD agent sends11073 request messages (represented as “Send-PackageNum(1, 3, 5)”) and the PHD manager sends response messages(represented as “Receive-PackageNum(2, 4, 6)”). The figureshows that the PHD agent first sends the association requestmessage and the PHD manager responds with the “accepted”parameter. After that, the PHD agent sends the event report

6 Journal of Biomedicine and Biotechnology
Table 2: System configurations of the pulse oximeter managed by PHD manager.
Configuration Value Description
MDC ATTR LIMIT CURRMin SpO2 Integer Lower threshold for SpO2
Max PulseRate Integer Higher threshold for pulse rate
Min PulseRate Integer Lower threshold for pulse rate
MDC ATTR MSMT TARGET OBJ Measurement target0x0000 SpO2 but no pulse rate is measured
0x0001 Pulse rate but no SpO2 is measured
0x0002 Both SpO2 and pulse rate are measured
Association request Configuration IDSystem ID
Association response Accepted
Event reportMeasured time Pulse rate
Event report response
Release request
Release response
SpO2Value of SpO2, pulse rate
Reason = normal
Reason = normal
Figure 7: 11073 messages exchanged between PHD agent and PHD manager.
message to transmit the measured SpO2 and pulse rate, andthe PHD manager responds to the report. Finally, the PHDagent sends the association release request message and thePHD manager responds to the request. Based on this figure,the PHD agent and PHD manager exchange 11073 messagesproperly.
Figure 8 shows three screenshots of the PHD manager.The patient can monitor pulse oximetry data through theGUI. In Figure 8(a), the pulse oximetry data transmitted
from the PHD agent is displayed on the screen of thesmartphone. The PHD manager provides a function to alertusers to the detection of a low- or high-limit violation basedon the predetermined threshold. A green background rep-resents a normal level and a red background represents anabnormal level. Based on Figure 8(a), the SpO2 of 97% isa normal level, but the pulse rate of 107 beats/min is anabnormal level. The PHD manager also identifies patterns orchanges in pulse oximetry data over a specific period of time,
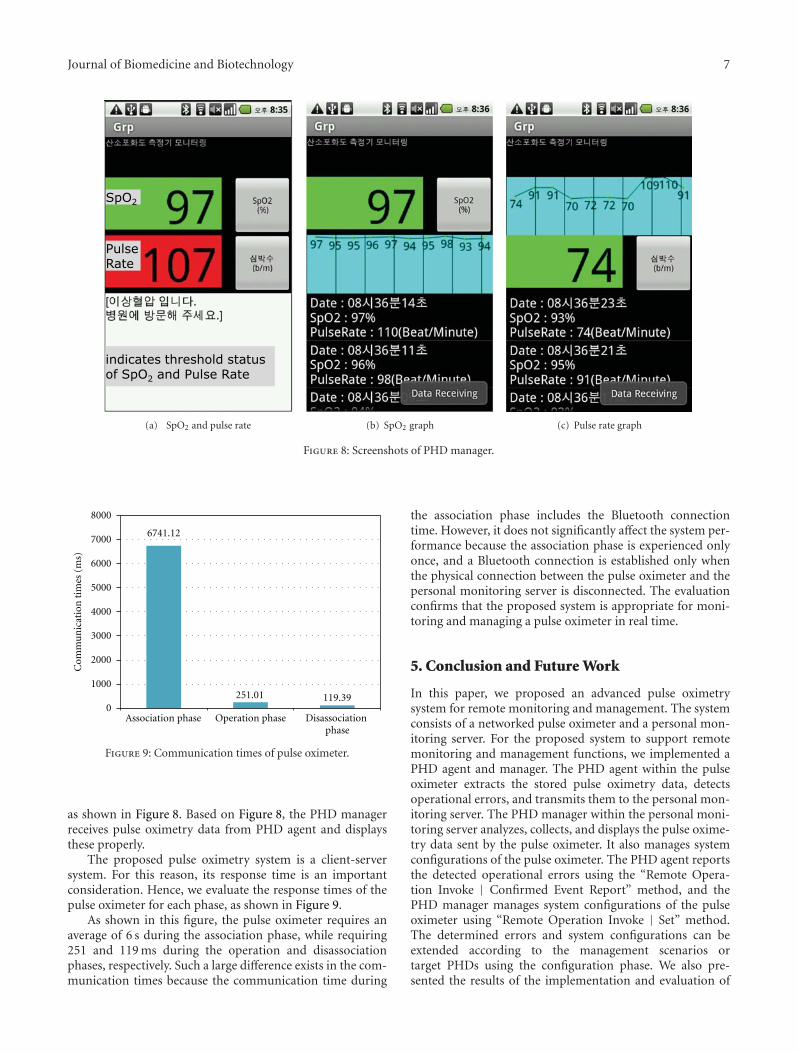
Journal of Biomedicine and Biotechnology 7
PulseRate
SpO2
indicates threshold status of SpO2 and Pulse Rate
(a) SpO2 and pulse rate (b) SpO2 graph (c) Pulse rate graph
Figure 8: Screenshots of PHD manager.
0
1000
2000
3000
4000
5000
6000
7000
8000
Association phase Operation phase Disassociation phase
Com
mu
nic
atio
n t
imes
(m
s)
251.01 119.39
6741.12
Figure 9: Communication times of pulse oximeter.
as shown in Figure 8. Based on Figure 8, the PHD managerreceives pulse oximetry data from PHD agent and displaysthese properly.
The proposed pulse oximetry system is a client-serversystem. For this reason, its response time is an importantconsideration. Hence, we evaluate the response times of thepulse oximeter for each phase, as shown in Figure 9.
As shown in this figure, the pulse oximeter requires anaverage of 6 s during the association phase, while requiring251 and 119 ms during the operation and disassociationphases, respectively. Such a large difference exists in the com-munication times because the communication time during
the association phase includes the Bluetooth connectiontime. However, it does not significantly affect the system per-formance because the association phase is experienced onlyonce, and a Bluetooth connection is established only whenthe physical connection between the pulse oximeter and thepersonal monitoring server is disconnected. The evaluationconfirms that the proposed system is appropriate for moni-toring and managing a pulse oximeter in real time.
5. Conclusion and Future Work
In this paper, we proposed an advanced pulse oximetrysystem for remote monitoring and management. The systemconsists of a networked pulse oximeter and a personal mon-itoring server. For the proposed system to support remotemonitoring and management functions, we implemented aPHD agent and manager. The PHD agent within the pulseoximeter extracts the stored pulse oximetry data, detectsoperational errors, and transmits them to the personal mon-itoring server. The PHD manager within the personal moni-toring server analyzes, collects, and displays the pulse oxime-try data sent by the pulse oximeter. It also manages systemconfigurations of the pulse oximeter. The PHD agent reportsthe detected operational errors using the “Remote Opera-tion Invoke | Confirmed Event Report” method, and thePHD manager manages system configurations of the pulseoximeter using “Remote Operation Invoke | Set” method.The determined errors and system configurations can beextended according to the management scenarios ortarget PHDs using the configuration phase. We also pre-sented the results of the implementation and evaluation of

8 Journal of Biomedicine and Biotechnology
the pulse oximetry system. The results confirmed that theproposed system is appropriate for monitoring and manag-ing a pulse oximeter in real time.
As future work, we plan to apply the product to otheru-health services. We also plan to apply various protocols toconnect between the personal monitoring server and healthservice providers.
Acknowledgment
This research was supported by the Basic Science ResearchProgram through the National Research Foundation of Korea(NRF), funded by the Ministry of Education, Science andTechnology (no. 2012-013549).
References
[1] J. W. Severinghaus and J. F. Kelleher, “Recent developments inpulse oximetry,” Anesthesiology, vol. 76, no. 6, pp. 1018–1038,1992.
[2] T. Pedersen, P. B. Dyrlund, and A. M. Meller, “Pulse oximetryfor perioperative monitoring,” Cochrane Database of System-atic Reviews, no. 4, Article ID CD002013, 2009.
[3] L. Schmitt, T. Falck, F. Wartena, and D. Simons, “NovelISO/IEEE 11073 standards for personal telehealth systemsinteroperability,” in Proceedings of the Joint Workshop on HighConfidence Medical Devices, Software, and Systems and MedicalDevice Plug-and-Play Interoperability (HCMDSS/MDPnP’07),pp. 146–148, Boston, Mass, USA, June 2007.
[4] M. Galarraga, L. Serrano, I. Martinez, P. de Toledo, and M.Reynolds, “Telemonitoring systems interoperability challenge:an updated review of the applicability of ISO/IEEE 11073 stan-dards for interoperability in telemonitoring,” in Proceedingsof the 29th Annual International Conference of IEEE-EMBS,Engineering in Medicine and Biology Society (EMBC’07), pp.6161–6165, Lyon, France, August 2007.
[5] IEEE Std., Health Informatics—Personal Health Device Com-munication—Application Pro-file—Optimized ExchangeProtocol, 11073-20601TM , 2008.
[6] J. G. Pak and K. H. Park, “Pulse Oximeter Monitor for u-health Service,” in Proceedings of the International Conferenceon Computer and Applications (CCA’12), p. 61, March 2012.
[7] IEEE Std., Health Informatics—Personal Health DeviceCommunication—Device speciali-zation Pulse oximeter,11073-10404 TM , 2008.
[8] IEEE Std., Health Informatics—Personal Health Device Com-munication—Device speciali-zation Blood Pressure Monitor,11073-10407 TM , 2008.
[9] IEEE Std., Health Informatics—Personal Health Device Com-munication—Device speciali-zation Thermometer, 11073-10408 TM , 2008.
[10] IEEE Std., Health Informatics—Personal Health Device Com-munication—Device speciali-zation Glucose Meter, 11073-10417 TM , 2008.
[11] J. S. Lee, Y. W. Su, and C. C. Shen, “A comparative study ofwireless protocols: Bluetooth, UWB, ZigBee, and Wi-Fi,” inProceedings of the 33rd Annual Conference of the IEEE IndustrialElectronics Society (IECON’07), pp. 46–51, Taipei, Taiwan,November 2007.
[12] S. N. Ramli and R. Ahmad, “Surveying the wireless bodyarea network in the realm of wireless communication,” inProceedings of the 7th International Conference on InformationAssurance and Security (IAS’11), pp. 58–61, December 2011.
[13] SQLite, http://sqlite.org/.

Hindawi Publishing CorporationJournal of Biomedicine and BiotechnologyVolume 2012, Article ID 546521, 7 pagesdoi:10.1155/2012/546521
Research Article
A Collaborative Molecular Modeling Environment Usinga Virtual Tunneling Service
Jun Lee, Jee-In Kim, and Lin-Woo Kang
Department of Advanced Technology Fusion, Konkuk University, Seoul 143-701, Republic of Korea
Correspondence should be addressed to Jee-In Kim, [email protected]
Received 17 May 2012; Accepted 8 July 2012
Academic Editor: Tai Hoon Kim
Copyright © 2012 Jun Lee et al. This is an open access article distributed under the Creative Commons Attribution License, whichpermits unrestricted use, distribution, and reproduction in any medium, provided the original work is properly cited.
Collaborative researches of three-dimensional molecular modeling can be limited by different time zones and locations. Anetworked virtual environment can be utilized to overcome the problem caused by the temporal and spatial differences. However,traditional approaches did not sufficiently consider integration of different computing environments, which were characterized bytypes of applications, roles of users, and so on. We propose a collaborative molecular modeling environment to integrate differentmolecule modeling systems using a virtual tunneling service. We integrated Co-Coot, which is a collaborative crystallographicobject-oriented toolkit, with VRMMS, which is a virtual reality molecular modeling system, through a collaborative tunnelingsystem. The proposed system showed reliable quantitative and qualitative results through pilot experiments.
1. Introduction
A networked virtual environment (NVE) is a computer-supported collaborative work (CSCW) environment wheremultiple participants can interact with each other throughcomputer networks for enhancing performances of theircollaborations. Since, NVE can overcome limit of time andspace differences during face-to-face collaborations, NVEhas been widely researched for collaborative computer-aided design [1, 2]. In a collaborative three-dimensional(3D) computer-aided design (CAD) system, distributed par-ticipants can work together in order for creating or modify-ing a 3D model in a virtual environment. A 3D biomolecularmodeling system is one of promising collaborative appli-cations, and it has also been popularly researched and devel-oped by various research groups.
In order to design new materials and new drugs, weneed to understand functions of proteins through analysisof a 3D protein structure at atomic resolution. First, it isgenerally determined by X-ray crystallography or NMR. Sec-ond, we can simulate the behaviors of the 3D moleculeswith equations of quantum and physics through computersimulations. Third, the 3D model of an enzyme, which is acandidate material or drug, can be used to design a higher
binding affinity inhibitor against a target enzyme. Last,we can simulate the designed enzyme to have better char-acteristics such as higher activity and stability for industrialpurpose [3, 4].
Since molecular modeling is a large and complicated pro-cess, its participants generally collaborate together accordingto their roles and familiar applications. If all participantsuse a same molecular system, it would work well. However,it is not a case in a real world. The participating biologistsgenerally use their own favorite molecular modeling systemsamong many available systems. Therefore, real-time collabo-rations of the participating biologists using NVE systems arenot smoothly realized in general.
In this paper, we propose a collaborative experimentenvironment with different molecular modeling systems.The environment consists of two collaborative systems,VRMMS (virtual reality molecular modeling system) [5–7]and Co-Coot [8]. Since the biologists can use their favoritesystems with their designated roles, the proposed environ-ment provides with a tunneling service for integrating thedifferent collaborative applications. The proposed environ-ment can reduce extra expenses for collaborations amongmultiple biologists.
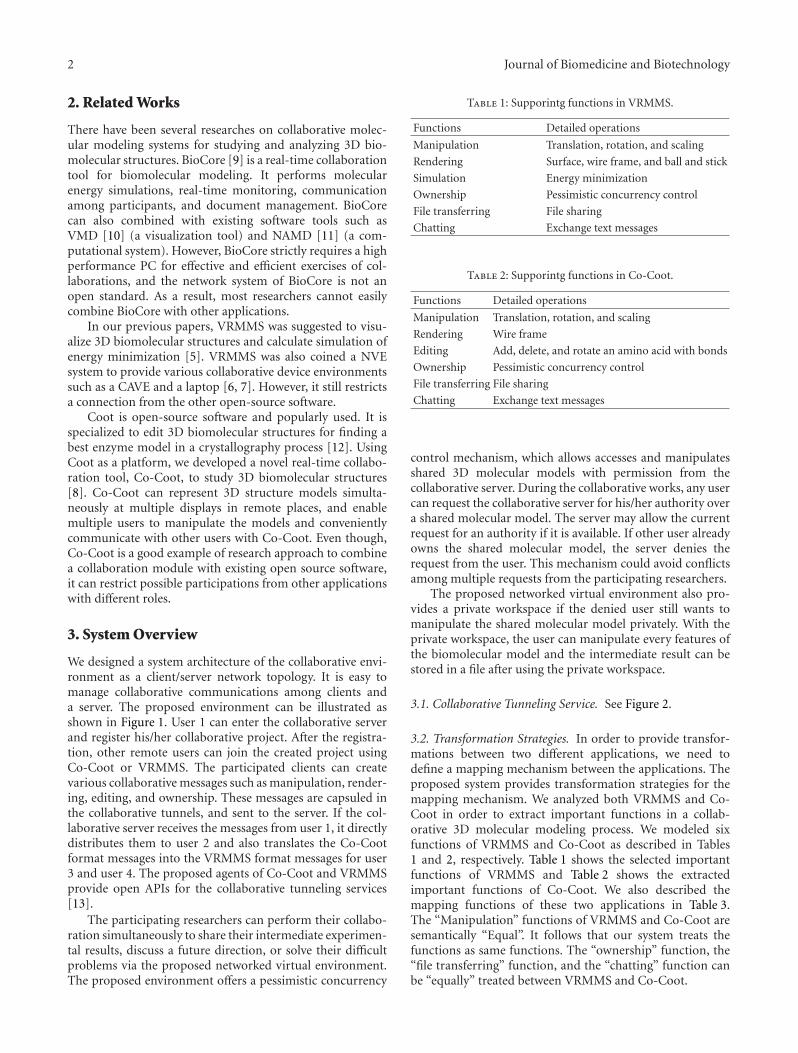
2 Journal of Biomedicine and Biotechnology
2. Related Works
There have been several researches on collaborative molec-ular modeling systems for studying and analyzing 3D bio-molecular structures. BioCore [9] is a real-time collaborationtool for biomolecular modeling. It performs molecularenergy simulations, real-time monitoring, communicationamong participants, and document management. BioCorecan also combined with existing software tools such asVMD [10] (a visualization tool) and NAMD [11] (a com-putational system). However, BioCore strictly requires a highperformance PC for effective and efficient exercises of col-laborations, and the network system of BioCore is not anopen standard. As a result, most researchers cannot easilycombine BioCore with other applications.
In our previous papers, VRMMS was suggested to visu-alize 3D biomolecular structures and calculate simulation ofenergy minimization [5]. VRMMS was also coined a NVEsystem to provide various collaborative device environmentssuch as a CAVE and a laptop [6, 7]. However, it still restrictsa connection from the other open-source software.
Coot is open-source software and popularly used. It isspecialized to edit 3D biomolecular structures for finding abest enzyme model in a crystallography process [12]. UsingCoot as a platform, we developed a novel real-time collabo-ration tool, Co-Coot, to study 3D biomolecular structures[8]. Co-Coot can represent 3D structure models simulta-neously at multiple displays in remote places, and enablemultiple users to manipulate the models and convenientlycommunicate with other users with Co-Coot. Even though,Co-Coot is a good example of research approach to combinea collaboration module with existing open source software,it can restrict possible participations from other applicationswith different roles.
3. System Overview
We designed a system architecture of the collaborative envi-ronment as a client/server network topology. It is easy tomanage collaborative communications among clients anda server. The proposed environment can be illustrated asshown in Figure 1. User 1 can enter the collaborative serverand register his/her collaborative project. After the registra-tion, other remote users can join the created project usingCo-Coot or VRMMS. The participated clients can createvarious collaborative messages such as manipulation, render-ing, editing, and ownership. These messages are capsuled inthe collaborative tunnels, and sent to the server. If the col-laborative server receives the messages from user 1, it directlydistributes them to user 2 and also translates the Co-Cootformat messages into the VRMMS format messages for user3 and user 4. The proposed agents of Co-Coot and VRMMSprovide open APIs for the collaborative tunneling services[13].
The participating researchers can perform their collabo-ration simultaneously to share their intermediate experimen-tal results, discuss a future direction, or solve their difficultproblems via the proposed networked virtual environment.The proposed environment offers a pessimistic concurrency
Table 1: Supporintg functions in VRMMS.
Functions Detailed operations
Manipulation Translation, rotation, and scaling
Rendering Surface, wire frame, and ball and stick
Simulation Energy minimization
Ownership Pessimistic concurrency control
File transferring File sharing
Chatting Exchange text messages
Table 2: Supporintg functions in Co-Coot.
Functions Detailed operations
Manipulation Translation, rotation, and scaling
Rendering Wire frame
Editing Add, delete, and rotate an amino acid with bonds
Ownership Pessimistic concurrency control
File transferring File sharing
Chatting Exchange text messages
control mechanism, which allows accesses and manipulatesshared 3D molecular models with permission from thecollaborative server. During the collaborative works, any usercan request the collaborative server for his/her authority overa shared molecular model. The server may allow the currentrequest for an authority if it is available. If other user alreadyowns the shared molecular model, the server denies therequest from the user. This mechanism could avoid conflictsamong multiple requests from the participating researchers.
The proposed networked virtual environment also pro-vides a private workspace if the denied user still wants tomanipulate the shared molecular model privately. With theprivate workspace, the user can manipulate every features ofthe biomolecular model and the intermediate result can bestored in a file after using the private workspace.
3.1. Collaborative Tunneling Service. See Figure 2.
3.2. Transformation Strategies. In order to provide transfor-mations between two different applications, we need todefine a mapping mechanism between the applications. Theproposed system provides transformation strategies for themapping mechanism. We analyzed both VRMMS and Co-Coot in order to extract important functions in a collab-orative 3D molecular modeling process. We modeled sixfunctions of VRMMS and Co-Coot as described in Tables1 and 2, respectively. Table 1 shows the selected importantfunctions of VRMMS and Table 2 shows the extractedimportant functions of Co-Coot. We also described themapping functions of these two applications in Table 3.The “Manipulation” functions of VRMMS and Co-Coot aresemantically “Equal”. It follows that our system treats thefunctions as same functions. The “ownership” function, the“file transferring” function, and the “chatting” function canbe “equally” treated between VRMMS and Co-Coot.

Journal of Biomedicine and Biotechnology 3
Information mappingCollaborative server
User 2-Co-Coot
User 3-VRMMS
Co-Coot VRMMS
VRMMS clients
Collaborative tunnel
Collabora
tive t
unnel Collaborative tunnel
Collaborative tunnel
User 4-VRMMS
User 1-Co-Coot Co-Coot clients
ManipulationManipulation
Wire frame
EditingNormal
Ownership Ownership
Surface
MonitoringStereoscopic
Figure 1: System overview.
VRMMS client 1 VRMMS client 2
Collaborationdata
collaboration
collaboration
data
Collaborative serverenvironment
VRMMS server
1
2 3
4
5
Col
labo
rati
vetu
nn
el
VRMMSprotocolheader
Co-Coot client 1 Co-Coot client 2
Co-Coot environment
Co-Cootprotocolheader
Converted
Converted
VRMMS environment
Collaborationdata
data
Co-Coot server
7 7
6
Figure 2: Collaborative tunneling service.
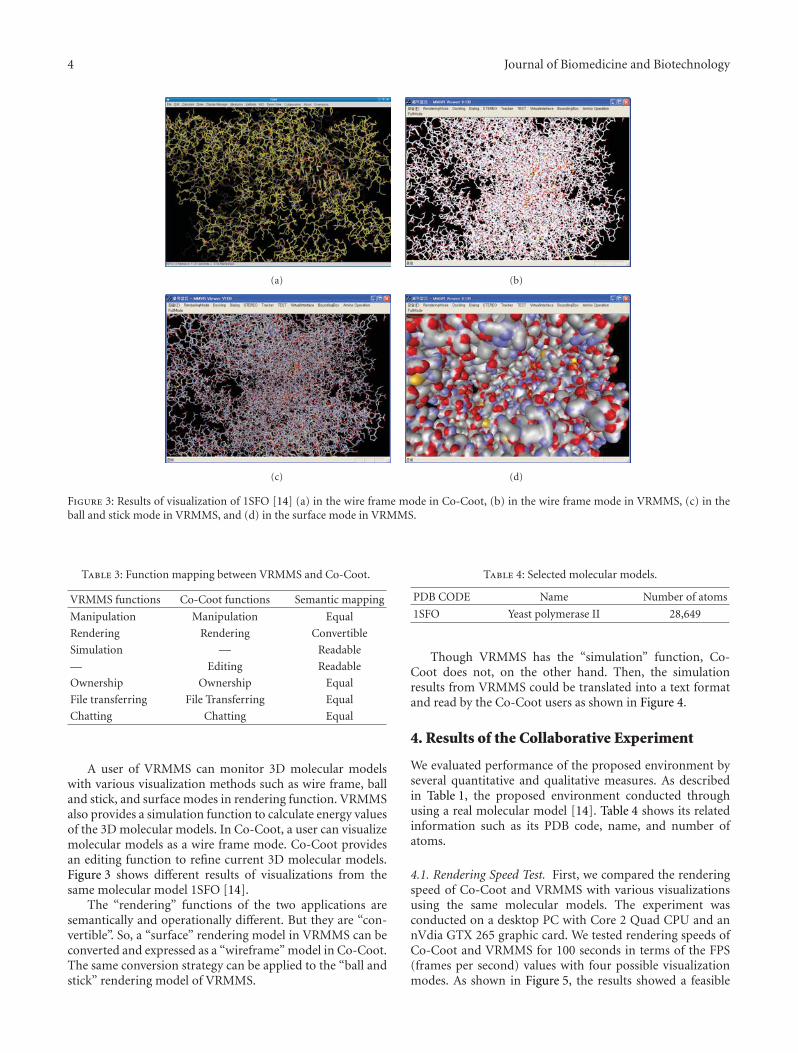
4 Journal of Biomedicine and Biotechnology
(a) (b)
(c) (d)
Figure 3: Results of visualization of 1SFO [14] (a) in the wire frame mode in Co-Coot, (b) in the wire frame mode in VRMMS, (c) in theball and stick mode in VRMMS, and (d) in the surface mode in VRMMS.
Table 3: Function mapping between VRMMS and Co-Coot.
VRMMS functions Co-Coot functions Semantic mapping
Manipulation Manipulation Equal
Rendering Rendering Convertible
Simulation — Readable
— Editing Readable
Ownership Ownership Equal
File transferring File Transferring Equal
Chatting Chatting Equal
A user of VRMMS can monitor 3D molecular modelswith various visualization methods such as wire frame, balland stick, and surface modes in rendering function. VRMMSalso provides a simulation function to calculate energy valuesof the 3D molecular models. In Co-Coot, a user can visualizemolecular models as a wire frame mode. Co-Coot providesan editing function to refine current 3D molecular models.Figure 3 shows different results of visualizations from thesame molecular model 1SFO [14].
The “rendering” functions of the two applications aresemantically and operationally different. But they are “con-vertible”. So, a “surface” rendering model in VRMMS can beconverted and expressed as a “wireframe” model in Co-Coot.The same conversion strategy can be applied to the “ball andstick” rendering model of VRMMS.
Table 4: Selected molecular models.
PDB CODE Name Number of atoms
1SFO Yeast polymerase II 28,649
Though VRMMS has the “simulation” function, Co-Coot does not, on the other hand. Then, the simulationresults from VRMMS could be translated into a text formatand read by the Co-Coot users as shown in Figure 4.
4. Results of the Collaborative Experiment
We evaluated performance of the proposed environment byseveral quantitative and qualitative measures. As describedin Table 1, the proposed environment conducted throughusing a real molecular model [14]. Table 4 shows its relatedinformation such as its PDB code, name, and number ofatoms.
4.1. Rendering Speed Test. First, we compared the renderingspeed of Co-Coot and VRMMS with various visualizationsusing the same molecular models. The experiment wasconducted on a desktop PC with Core 2 Quad CPU and annVdia GTX 265 graphic card. We tested rendering speeds ofCo-Coot and VRMMS for 100 seconds in terms of the FPS(frames per second) values with four possible visualizationmodes. As shown in Figure 5, the results showed a feasible

Journal of Biomedicine and Biotechnology 5
(a) (b)
(c) (d)
Figure 4: Results of editing operations: (a) an original model on Co-Coot, (b) a changed model on Co-Coot, (c) the original model onVRMMS, and (d) the changed model on VRMMS.
45
40
35
30
25
20
15
10
5
01 6 11 16 21 26 31 36 41 46 51 56 61 66 71 76 81 86 91 96
AB
CD
Figure 5: Results of various visualization tests: (A) wire framemode in VRMMS (40.9 fps), (B) ball and stick mode in VRMMS(22.8 fps), (C) wire frame mode in Co-Coot (18.8 fps), and (D)surface mode in VRMMS (16.4 fps).
rendering speed even though it is dependent on visualizationmodes or modeling systems.
4.2. Collaborative Tunneling Test. Second, we measured thenumber of transformations and average delivering times. Inorder to measure the values, we conducted a collaborativemolecular design process within different environments
through network connections as shown in Figure 6. Thedesign computers were placed in different locations, and con-nected by a 10 Mbps LAN. We selected two experts who haveexperiences of using VRMMS and Co-coot. They conductedthe collaborative design tasks as described in Tables 1 and 2for 40 minutes.
Figure 6 shows the results of the experiments for the pro-posed collaborative environments. A total number of trans-formed operations was 1004, and most occurred trans-formations were manipulation and chatting as shown inFigure 7(a). As shown in Figure 7(b), the proposed trans-formation strategies as described in Table 3 showed differ-ent delivering performances. Manipulation, ownership, filetransferring, and chatting showed fast delivery times. SinceModification needs more times to convert different data,the average delivering time of rendering showed mediumperformances. Simulation and editing generally showed theworst performances in the experiment because the proposedenvironment consumed lots of times to transform theoperations.
4.3. User Interviews for Acceptance Test. We conducted userinterviews with the two subjects after conducting the pre-vious experiments. The participants answered that the pro-posed environment was generally satisfied. However, theyrequired more collaborative tunneling services such as avoice chatting and a sharing movie. They also answeredif the proposed environment could be applied to support

6 Journal of Biomedicine and Biotechnology
(a) (b)
Figure 6: Collaborative molecular modeling: (a) a user is using Co-Coot; (b) another user is using VRMMS.
Manipulation-430Rendering-98Simulation-23Editing-34
Ownership-67File transferring-12Chatting-340
Total-1004
(a)
60
50
40
30
20
10
0
(ms) 32.3
4248.4 49.5
33.336.6 35.7
39.68571
Man
ipu
lati
on
Ren
deri
ng
Sim
ula
tion
Edi
tin
g
Ow
ner
ship
Ch
atti
ng
Tota
l
File
tra
nsf
erri
ng
(b)
Figure 7: Results of trcollaborative tunneling test: (a) numbers of transformed data according to transformer strategies; (b) average deliver-ing times.
other famous molecular modeling systems, then it wouldbe feasible to utilize the proposed environment in the realcollaborative molecular modeling processes.
5. Conclusions and Future Works
In this paper, we propose a new collaborative molecularmodeling environment to connect different modeling sys-tems based on an approach with a collaborative tunneling
service and transformation strategies. With our approach,multiple users can collaborative together even though theyare manipulating different modeling systems.
The proposed environment showed feasible renderingperformances in target applications with various visual-izations. The results of another performance evaluationof the pilot tests showed that the proposed environmentcould successfully transform collaboration data with stabledelivering times through network.
Journal of Biomedicine and Biotechnology 7
An additional user study showed that the participantswould like to adopt the proposed system in their collabora-tive molecular modeling environment. For our future works,we will expand the tunneling services to the other popularmolecular modeling systems using ontology to supportsemantic transformation strategies. We also plan to enhancea concurrency control mechanisms with different roles andapplications.
Acknowledgment
This paper was supported by Konkuk University in 2011.
References
[1] C. Joslin, T. Di Giacomo, and N. Magnenat-Thalmann, “Col-laborative virtual environments: from birth to standardiza-tion,” IEEE Communications Magazine, vol. 42, no. 4, pp. 28–33, 2004.
[2] H. Y. Kan, V. G. Duffy, and C. J. Su, “An Internet virtual realitycollaborative environment for effective product design,” Com-puters in Industry, vol. 45, no. 2, pp. 197–213, 2001.
[3] A. R. Leach, Molecular Modelling: Principles and Applications,2001.
[4] K. I. Ramachandran, G. Deepa, and K. Namboori, Computa-tional Chemistry and Molecular Modeling: Principles and Appli-cations, 2008.
[5] J. I. Kim, S. Park, J. Lee, Y. Choi, and S. Jung, “Development ofa gesture-based molecular visualization tool based on virtualreality for molecular docking,” Bulletin of the Korean ChemicalSociety, vol. 25, no. 10, pp. 1571–1574, 2004.
[6] S. Park, J. Lee, and J. I. Kim, “A collaborative virtual realityenvironment for molecular modeling,” Advances in ArtificialReality and Tele-Existence, vol. 4282, pp. 324–333, 2006.
[7] J. Lee, P. Quy, J. I. Kim, L. W. Kang, A. Seo, and H. Kim, “A col-laborative virtual reality environment for molecular biology,”in Proceedings of the International Symposium on UbiquitousVirtual Reality (ISUVR ’09), pp. 68–71, July 2009.
[8] J. Lee, L. W. Kang, H. Kim, and J. I. Kim, “Co-Coot: a real-timecollaborative tool for bio-molecular modeling and visualiza-tion,” in Proceedings of the IEEE International Symposium onVirtual Reality Innovations (ISVRI ’110, pp. 281–286, March2011.
[9] J. Bhandarkar, G. Budescu, W. F. Humphrey et al., “BioCoRE: acollaboratory for structural biology,” in Proceedings of the SCSInternational Conference on Web-Based Modeling and Simu-lation, pp. 242–251, 1999.
[10] W. Humphrey, A. Dalke, and K. Schulten, “VMD: visual mole-cular dynamics,” Journal of Molecular Graphics, vol. 14, no. 1,pp. 33–38, 1996.
[11] L. V. Kale, M. Bhandarkar, R. Brunner, N. Krawetz, J. Phillips,and A. Shinozaki, “NAMD: a case study in multilingual paral-lel programming,” in Proceedings of the 10th InternationalWorkshop on Languages and Compilers for Parallel Computing,pp. 367–381, 1999.
[12] P. Emsley and K. Cowtan, “Coot: model-building tools formolecular graphics,” Acta Crystallographica Section D, vol. 60,no. 12, pp. 2126–2132, 2004.
[13] Open API, http://en.wikipedia.org/wiki/Open API.[14] K. D. Westover, D. A. Bushnell, and R. D. Kornberg, “Struc-
tural basis of transcription: separation of RNA from DNA byRNA polymerase II,” Science, vol. 303, no. 5660, pp. 1014–1016, 2004.

Hindawi Publishing CorporationJournal of Biomedicine and BiotechnologyVolume 2012, Article ID 834578, 9 pagesdoi:10.1155/2012/834578
Research Article
A Classification Method of Normal and Overweight FemalesBased on Facial Features for Automated Medical Applications
Bum Ju Lee, Jun-Hyeong Do, and Jong Yeol Kim
Division of Constitutional Medicine Research, Korea Institute of Oriental Medicine, Deajeon 305-811, Republic of Korea
Correspondence should be addressed to Jong Yeol Kim, [email protected]
Received 22 May 2012; Accepted 30 May 2012
Academic Editor: Sabah Mohammed
Copyright © 2012 Bum Ju Lee et al. This is an open access article distributed under the Creative Commons Attribution License,which permits unrestricted use, distribution, and reproduction in any medium, provided the original work is properly cited.
Obesity and overweight have become serious public health problems worldwide. Obesity and abdominal obesity are associated withtype 2 diabetes, cardiovascular diseases, and metabolic syndrome. In this paper, we first suggest a method of predicting normaland overweight females according to body mass index (BMI) based on facial features. A total of 688 subjects participated in thisstudy. We obtained the area under the ROC curve (AUC) value of 0.861 and kappa value of 0.521 in Female: 21–40 (females aged21–40 years) group, and AUC value of 0.76 and kappa value of 0.401 in Female: 41–60 (females aged 41–60 years) group. In twogroups, we found many features showing statistical differences between normal and overweight subjects by using an independenttwo-sample t-test. We demonstrated that it is possible to predict BMI status using facial characteristics. Our results provide usefulinformation for studies of obesity and facial characteristics, and may provide useful clues in the development of applications foralternative diagnosis of obesity in remote healthcare.
1. Introduction
Obesity and overweight have become major health issues,because the prevalence of obesity has rapidly risenworldwide. The causes of this phenomenon are excessiveingestion of food, lack of physical activity, and environmentaland genetic factors [1, 2]. Obesity and abdominal obesityare potential risk factors for insulin resistance and type2 diabetes, cardiovascular diseases, stroke, ischemic heartdisease, and metabolic syndrome [3–6], and many studieshave investigated the relationship between obesity, disease,and body mass index (BMI) [7–13]. In the medical fieldand public health, BMI is commonly used as an indicator ofoverall adiposity. So, BMI is essential medical informationfor the prognostic prediction of diseases and clinical therapy.The principal cutoff points for underweight (<18.50 kg/m2),normal range (18.50–24.99 kg/m2), overweight or preobese(25.00–29.99 kg/m2), and obese (≥30.00 kg/m2) have beenset by the World Health Organization (WHO).
A large number of studies on human face have focusedon facial morphology, face recognition, and medicine [14–23]. Facial characteristics provide clinical information onthe present or future health conditions of patients. For
example, the status of cheeks, neck circumference, andcraniofacial morphology are associated with health compli-cations, such as type 2 diabetes, hypertension, and sleepapnea [18]. Using computed tomographic (CT) scanning,Levine et al. [19] showed that the quantity of buccal fatis strongly related to visceral abdominal fat accumulation,based on the fact that patients with chubby facial cheekstend to have upper-body obesity, and argued that plumpcheeks of patients may be a high potential risk factor formetabolic complications related to obesity. Further, usingfacial measurements, Sadeghianrizi et al. [20] showed thatcraniofacial morphology is significantly different betweennormal and obese adolescents. They suggested that facialskeletal structures of obese adolescents tended to be relativelylarge, and that obesity was associated with bimaxillaryprognathism.
The motivation for this study is conveyed by thefollowing 2 questions: which features or facial charac-teristics are associated with overweight and normal BMIstatus? If we identify facial features that differ betweennormal and overweight, how accurately can we identifynormal and overweight using these features? Contributionsof this study are as follows. We first propose a method
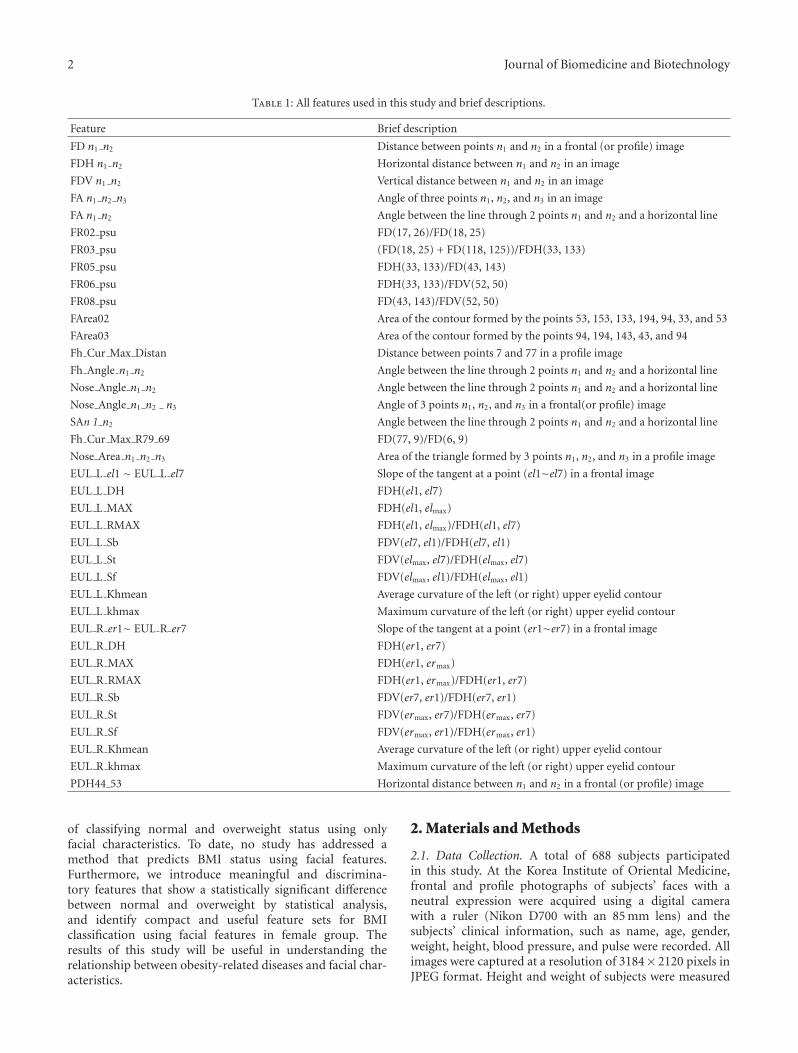
2 Journal of Biomedicine and Biotechnology
Table 1: All features used in this study and brief descriptions.
Feature Brief description
FD n1 n2 Distance between points n1 and n2 in a frontal (or profile) image
FDH n1 n2 Horizontal distance between n1 and n2 in an image
FDV n1 n2 Vertical distance between n1 and n2 in an image
FA n1 n2 n3 Angle of three points n1, n2, and n3 in an image
FA n1 n2 Angle between the line through 2 points n1 and n2 and a horizontal line
FR02 psu FD(17, 26)/FD(18, 25)
FR03 psu (FD(18, 25) + FD(118, 125))/FDH(33, 133)
FR05 psu FDH(33, 133)/FD(43, 143)
FR06 psu FDH(33, 133)/FDV(52, 50)
FR08 psu FD(43, 143)/FDV(52, 50)
FArea02 Area of the contour formed by the points 53, 153, 133, 194, 94, 33, and 53
FArea03 Area of the contour formed by the points 94, 194, 143, 43, and 94
Fh Cur Max Distan Distance between points 7 and 77 in a profile image
Fh Angle n1 n2 Angle between the line through 2 points n1 and n2 and a horizontal line
Nose Angle n1 n2 Angle between the line through 2 points n1 and n2 and a horizontal line
Nose Angle n1 n2 n3 Angle of 3 points n1, n2, and n3 in a frontal(or profile) image
SAn 1 n2 Angle between the line through 2 points n1 and n2 and a horizontal line
Fh Cur Max R79 69 FD(77, 9)/FD(6, 9)
Nose Area n1 n2 n3 Area of the triangle formed by 3 points n1, n2, and n3 in a profile image
EUL L el1 ∼ EUL L el7 Slope of the tangent at a point (el1∼el7) in a frontal image
EUL L DH FDH(el1, el7)
EUL L MAX FDH(el1, elmax)
EUL L RMAX FDH(el1, elmax)/FDH(el1, el7)
EUL L Sb FDV(el7, el1)/FDH(el7, el1)
EUL L St FDV(elmax, el7)/FDH(elmax, el7)
EUL L Sf FDV(elmax, el1)/FDH(elmax, el1)
EUL L Khmean Average curvature of the left (or right) upper eyelid contour
EUL L khmax Maximum curvature of the left (or right) upper eyelid contour
EUL R er1∼ EUL R er7 Slope of the tangent at a point (er1∼er7) in a frontal image
EUL R DH FDH(er1, er7)
EUL R MAX FDH(er1, ermax)
EUL R RMAX FDH(er1, ermax)/FDH(er1, er7)
EUL R Sb FDV(er7, er1)/FDH(er7, er1)
EUL R St FDV(ermax, er7)/FDH(ermax, er7)
EUL R Sf FDV(ermax, er1)/FDH(ermax, er1)
EUL R Khmean Average curvature of the left (or right) upper eyelid contour
EUL R khmax Maximum curvature of the left (or right) upper eyelid contour
PDH44 53 Horizontal distance between n1 and n2 in a frontal (or profile) image
of classifying normal and overweight status using onlyfacial characteristics. To date, no study has addressed amethod that predicts BMI status using facial features.Furthermore, we introduce meaningful and discrimina-tory features that show a statistically significant differencebetween normal and overweight by statistical analysis,and identify compact and useful feature sets for BMIclassification using facial features in female group. Theresults of this study will be useful in understanding therelationship between obesity-related diseases and facial char-acteristics.
2. Materials and Methods
2.1. Data Collection. A total of 688 subjects participatedin this study. At the Korea Institute of Oriental Medicine,frontal and profile photographs of subjects’ faces with aneutral expression were acquired using a digital camerawith a ruler (Nikon D700 with an 85 mm lens) and thesubjects’ clinical information, such as name, age, gender,weight, height, blood pressure, and pulse were recorded. Allimages were captured at a resolution of 3184× 2120 pixels inJPEG format. Height and weight of subjects were measured

Journal of Biomedicine and Biotechnology 3
17
26
117
1261825
43 143
53 153
94 194
118 125
36 136
33 13352
50
81
38 138
90 91
FArea02
FArea03
(a)
777
6
9
12
2114
44
53
72
73
71
90 91
1 cm1 cm1 cm
(b)
ermax
er7
er6er5 er4 er3
er2
er1
(c)
elmax
el7
el6el5el4el3el2
el1
(d)
Figure 1: All points in a facial image for feature extraction ((a): points and areas in frontal image; (b): points in profile image; (c): points inright eye; (d): point in left eye). Distance, angle, and area measurements were done based on self-made tool using MATLAB on Window XP.
Table 2: Subject characteristics and basic statistics (data are presented as mean (standard deviation); N: number of subjects, BMI: bodymass index).
Class Female: 21–40 Female: 41–60
NormalN 189 193
Age 32.1 (5.64) 50.0 (5.42)
BMI 22.2 (2.97) 23.6 (2.86)
OverweightN 77 229
Age 32.91 (5.29) 50.31 (5.44)
BMI 26.0 (2.75) 25.6 (2.31)
by a digital scale (GL-150; G Tech International Co., Ltd,Republic of Korea).
Based on identifiable feature points from the frontand profile images of subjects, a total of 86 features wereextracted. The extracted features included distance betweenpoints n1 and n2 in a frontal (or profile) image, verticaldistance between n1 and n2 in a frontal (or profile) image,angles of 3 points n1, n2, and n3 in a frontal (or profile)image, area of the triangle formed by the 3 points n1, n2, andn3 in a profile image, and so forth. All points in a front andprofile image are showed in Figure 1, and all the extractedfeatures and brief descriptions are given in Table 1.
2.2. Normal and Overweight Cutoff Points. BMI was calcu-lated as weight (kg) divided by the square of height (m)of the individual. Health consequences and BMI ranges ofoverweight and obesity are open to dispute [10, 24]. Thereis natural consequence. Physiological and environmentalfactors of race are associated with differences in BMI valuesand the assignment of BMI values for obesity and over-weight depends on various factors, such as ethnic groups,national economic statuses, and rural/urban residence [8].For instance, BMI values of a population in an Asian regiontend to be lower than those of a population in a Westernregion; however, Asians have risk factors for cardiovascular
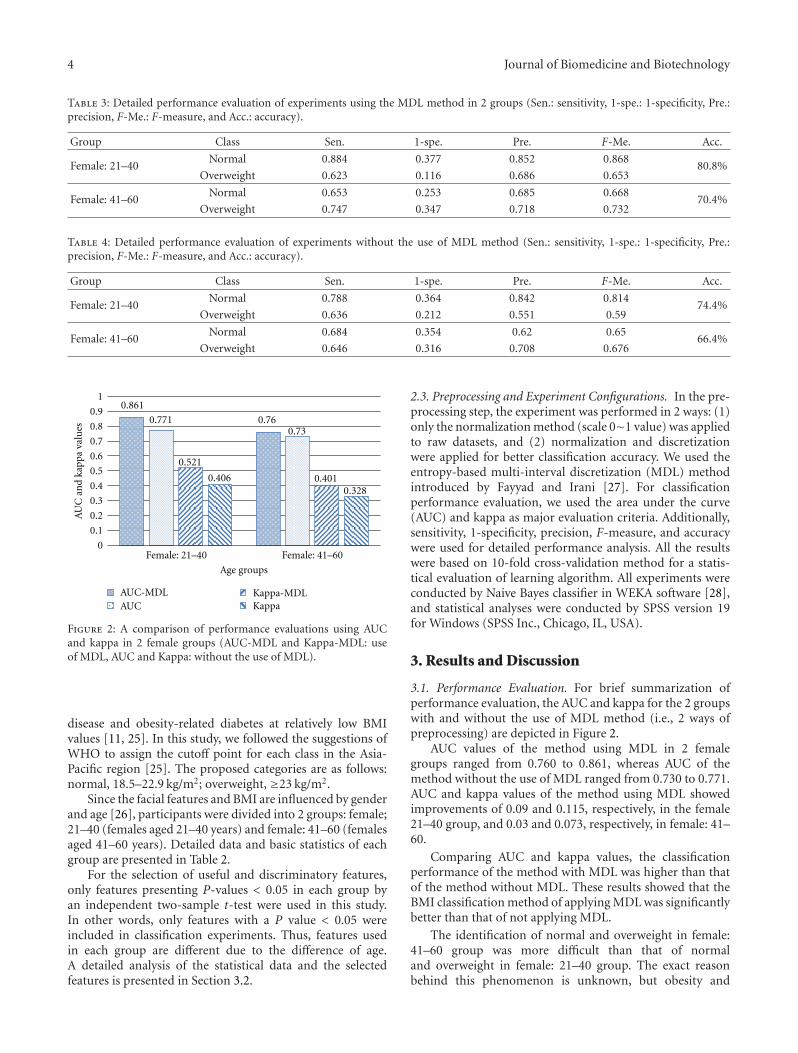
4 Journal of Biomedicine and Biotechnology
Table 3: Detailed performance evaluation of experiments using the MDL method in 2 groups (Sen.: sensitivity, 1-spe.: 1-specificity, Pre.:precision, F-Me.: F-measure, and Acc.: accuracy).
Group Class Sen. 1-spe. Pre. F-Me. Acc.
Female: 21–40Normal 0.884 0.377 0.852 0.868
80.8%Overweight 0.623 0.116 0.686 0.653
Female: 41–60Normal 0.653 0.253 0.685 0.668
70.4%Overweight 0.747 0.347 0.718 0.732
Table 4: Detailed performance evaluation of experiments without the use of MDL method (Sen.: sensitivity, 1-spe.: 1-specificity, Pre.:precision, F-Me.: F-measure, and Acc.: accuracy).
Group Class Sen. 1-spe. Pre. F-Me. Acc.
Female: 21–40Normal 0.788 0.364 0.842 0.814
74.4%Overweight 0.636 0.212 0.551 0.59
Female: 41–60Normal 0.684 0.354 0.62 0.65
66.4%Overweight 0.646 0.316 0.708 0.676
AUC Kappa
AU
C a
nd
kapp
a va
lues
0
0.1
0.2
0.3
0.4
0.5
0.6
0.7
0.8
0.9
10.861
0.760.7710.73
0.521
0.4010.4060.328
Female: 21–40 Female: 41–60
Age groups
AUC-MDL Kappa-MDL
Figure 2: A comparison of performance evaluations using AUCand kappa in 2 female groups (AUC-MDL and Kappa-MDL: useof MDL, AUC and Kappa: without the use of MDL).
disease and obesity-related diabetes at relatively low BMIvalues [11, 25]. In this study, we followed the suggestions ofWHO to assign the cutoff point for each class in the Asia-Pacific region [25]. The proposed categories are as follows:normal, 18.5–22.9 kg/m2; overweight, ≥23 kg/m2.
Since the facial features and BMI are influenced by genderand age [26], participants were divided into 2 groups: female;21–40 (females aged 21–40 years) and female: 41–60 (femalesaged 41–60 years). Detailed data and basic statistics of eachgroup are presented in Table 2.
For the selection of useful and discriminatory features,only features presenting P-values < 0.05 in each group byan independent two-sample t-test were used in this study.In other words, only features with a P value < 0.05 wereincluded in classification experiments. Thus, features usedin each group are different due to the difference of age.A detailed analysis of the statistical data and the selectedfeatures is presented in Section 3.2.
2.3. Preprocessing and Experiment Configurations. In the pre-processing step, the experiment was performed in 2 ways: (1)only the normalization method (scale 0∼1 value) was appliedto raw datasets, and (2) normalization and discretizationwere applied for better classification accuracy. We used theentropy-based multi-interval discretization (MDL) methodintroduced by Fayyad and Irani [27]. For classificationperformance evaluation, we used the area under the curve(AUC) and kappa as major evaluation criteria. Additionally,sensitivity, 1-specificity, precision, F-measure, and accuracywere used for detailed performance analysis. All the resultswere based on 10-fold cross-validation method for a statis-tical evaluation of learning algorithm. All experiments wereconducted by Naive Bayes classifier in WEKA software [28],and statistical analyses were conducted by SPSS version 19for Windows (SPSS Inc., Chicago, IL, USA).
3. Results and Discussion
3.1. Performance Evaluation. For brief summarization ofperformance evaluation, the AUC and kappa for the 2 groupswith and without the use of MDL method (i.e., 2 ways ofpreprocessing) are depicted in Figure 2.
AUC values of the method using MDL in 2 femalegroups ranged from 0.760 to 0.861, whereas AUC of themethod without the use of MDL ranged from 0.730 to 0.771.AUC and kappa values of the method using MDL showedimprovements of 0.09 and 0.115, respectively, in the female21–40 group, and 0.03 and 0.073, respectively, in female: 41–60.
Comparing AUC and kappa values, the classificationperformance of the method with MDL was higher than thatof the method without MDL. These results showed that theBMI classification method of applying MDL was significantlybetter than that of not applying MDL.
The identification of normal and overweight in female:41–60 group was more difficult than that of normaland overweight in female: 21–40 group. The exact reasonbehind this phenomenon is unknown, but obesity and

Journal of Biomedicine and Biotechnology 5
Table 5: Statistical analysis of female: 21–40 group by an independent two-sample t-test (Std.: standard deviation).
Feature Class Mean (Std.) t P-value
FD17 26Normal 9.473 (1.317)
3.118 0.002Overweight 8.941 (1.115)
FD117 126Normal 9.483 (1.303)
3.319 0.001Overweight 8.904 (1.257)
FDH25 125Normal 96.53 (5.116) −2.69 0.0076
Overweight 98.52 (6.32)
FDH36 136Normal 23.57 (2.469) −2.75 0.0064
Overweight 24.46 (2.191)
FD18 25Normal 29.94 (2.675) −2.036 0.0428
Overweight 30.68 (2.753)
FD43 143Normal 125.2 (7.101) −8.625 0.0000
Overweight 133.6 (7.384)
FD53 153Normal 145.4 (5.941) −5.991 0.0000
Overweight 150.7 (7.642)
FD94 194Normal 140.1 (6.022) −8.875 0.0000
Overweight 147.6 (6.934)
FDH33 133Normal 147.2 (5.63) −7.261 0.0000
Overweight 153.1 (7.02)
FA18 17 25Normal 126.2 (6.591) −2.684 0.0077
Overweight 128.6 (6.75)
FA118 117 125Normal 125 (7.339) −3.56 0.0004
Overweight 128.3 (6.199)
FA18 25 43Normal 95.38 (5.104) −3.722 0.0002
Overweight 97.91 (4.896)
FA118 125 143Normal 96.16 (4.753) −3.396 0.0008
Overweight 98.39 (5.082)
FA18 17 43Normal 76.97 (6.255) −4.39 0.0000
Overweight 80.66 (6.108)
FA118 117 143Normal 76.82 (6.824) −4.644 0.0000
Overweight 80.9 (5.583)
FA117 125Normal 21.24 (3.645)
3.983 0.0001Overweight 19.19 (4.142)
FA17 18Normal 34.01 (5.091)
2.002 0.0463Overweight 32.61 (5.32)
FR02 psuNormal 0.318 (0.044)
4.199 0.0000Overweight 0.293 (0.041)
FR05 psuNormal 1.178 (0.055)
4.183 0.0000Overweight 1.148 (0.048)
FR06 psuNormal 2.039 (0.117) −5.334 0.0000
Overweight 2.123 (0.115)
FR08 psuNormal 1.736 (0.151) −5.783 0.0000
Overweight 1.854 (0.147)
FArea02Normal 6470 (644.4) −2.106 0.0362
Overweight 6654 (652.2)
FArea03Normal 3596 (364.9) −5.637 0.0000
Overweight 3873 (361.9)
Fh Cur Max DistanNormal 3.654 (1.564)
1.984 0.0483Overweight 3.233 (1.585)
FDH12 14Normal 18.58 (2.713) −3.006 0.0029
Overweight 19.69 (2.817)

6 Journal of Biomedicine and Biotechnology
Table 5: Continued.
Feature Class Mean (Std.) t P-value
Nose Angle 14 12Normal 61.07 (4.611)
2.946 0.0035Overweight 59.29 (4.108)
Nose Angle 12 14 21Normal 106.7 (4.634)
2.397 0.0172Overweight 105.1 (5.237)
EUL L el2Normal −0.637 (0.095) −3.135 0.0019
Overweight −0.597 (0.087)
EUL L el3Normal −0.22 (0.118) −3.206 0.0015
Overweight −0.17 (0.11)
EUL L el6Normal 0.483 (0.105)
3.473 0.0006Overweight 0.432 (0.113)
EUL L DHNormal 3.178 (0.248) −2.53 0.0120
Overweight 3.268 (0.292)
EUL L SfNormal 0.408 (0.106)
2.442 0.0153Overweight 0.371 (0.132)
EUL R er2Normal −0.63 (0.087) −3.957 0.0001
Overweight −0.582 (0.095)
EUL R er3Normal −0.208 (0.112) −2.822 0.0051
Overweight −0.167 (0.1)
EUL R er6Normal 0.466 (0.106)
2.492 0.0133Overweight 0.43 (0.111)
EUL R er7Normal 0.647 (0.235)
2.432 0.0165Overweight 0.556 (0.29)
EUL R DHNormal 3.188 (0.226) −4.292 0.0000
Overweight 3.322 (0.241)
EUL R RMAXNormal 0.443 (0.069)
2.061 0.0403Overweight 0.424 (0.066)
EUL R StNormal −0.633 (0.117) −2.525 0.0122
Overweight −0.592 (0.123)
EUL R SfNormal 0.395 (0.106)
2.452 0.0149Overweight 0.36 (0.104)
EUL R KhmeanNormal 0.024 (0.007)
2.868 0.0045Overweight 0.022 (0.007)
PDH44 53Normal 89.38 (6.081) −3.017 0.0028
Overweight 91.79 (5.527)
menopause-related research studies offer some clues [29–31]. Menopause leads to changes in fat tissue distribution,body composition, waist-to-hip ratio (WHR), and waist-to-height (W/Ht) in females. For instance, Douchi et al.[29] demonstrated that the lean mass of the head of pre-menopausal and postmenopausal females were not different,while trunk and legs were altered following menopause.Detailed results of the performance evaluation of each classand group are described in Tables 3 and 4. We think thatthese results imply the possibility of predicting normal andoverweight status using human face information.
3.2. Statistical Analysis of Facial Features. Statistical analysisof the comparison between normal and overweight classeswas performed using an independent two-sample t-test,and a P-value < 0.05 was considered statistically significant.
Features with a P-value < 0.05 in each group are described inTables 5 and 6.
In female: 21–40, 42 features were significantly differentbetween normal and overweight classes (P < 0 05), and11 of these features exhibited highly significant differences(P < 0 0000). Four features concerning distances betweenn1 and n2 points in a frontal image (FD43 143, FD53 153,FD94 194, and FDH33 133 related to the mandibular widthor face width) exhibited particularly significant differences.The features FA18 17 43 and FA118 117 143 representingthe angles between three points n1 (medial canthus),n2 (midpoint of the upper eyelid), and n3 (mandibularramus) in a frontal image were highly significantly different.Comparing female: 21–40 and female: 41–60 groups, manyfeatures related to the eyelid were found in female: 21–40, butthe features were not found in Female: 41–60. For instance,

Journal of Biomedicine and Biotechnology 7
Table 6: Statistical analysis of female: 41–60 group by an independent two-sample t-test (Std.: standard deviation).
Feature Class Mean (Std.) t P-value
FDH25 125Normal 94.63 (5.466) −3.097 0.0021
Overweight 96.29 (5.493)
FDH36 136Normal 24.84 (2.283) −2.055 0.0405
Overweight 25.36 (2.805)
FD18 25Normal 29.37 (3.287) −2.199 0.0284
Overweight 30.04 (2.923)
FD17 25Normal 17.83 (2.717) −2.076 0.0385
Overweight 18.36 (2.471)
FD43 143Normal 127.4 (6.471) −8.184 0.0000
Overweight 133.1 (7.721)
FD53 153Normal 143.9 (6.343) −4.848 0.0000
Overweight 147.2 (7.141)
FD94 194Normal 141.8 (6.01) −8.385 0.0000
Overweight 146.9 (6.485)
FDH33 133Normal 146.8 (6.057) −6.615 0.0000
Overweight 150.9 (6.582)
FA18 25 43Normal 99.88 (5.308) −2.589 0.0100
Overweight 101.2 (4.954)
FA118 125 143Normal 99.74 (4.776) −4.343 0.0000
Overweight 101.9 (5.373)
FA117 125 143Normal 124.7 (5.38) −2.438 0.0152
Overweight 126 (5.471)
FA18 17 43Normal 81.11 (6.753) −2.676 0.0077
Overweight 82.85 (6.574)
FA118 117 143Normal 80.69 (6.449) −3.632 0.0003
Overweight 83.16 (7.35)
FR02 psuNormal 0.295 (0.044)
2.182 0.0297Overweight 0.285 (0.051)
FR05 psuNormal 1.154 (0.046)
3.966 0.0001Overweight 1.135 (0.049)
FR06 psuNormal 2.006 (0.104) −5.688 0.0000
Overweight 2.068 (0.121)
FR08 psuNormal 1.743 (0.134) −5.935 0.0000
Overweight 1.827 (0.157)
FArea02Normal 6358 (618.3) −2.212 0.0275
Overweight 6501 (696.7)
FArea03Normal 3886 (397.6) −4.245 0.0000
Overweight 4052 (402.6)
FDV12 14Normal 33.85 (3.313)
2.516 0.0123Overweight 33 (3.571)
FDH14 21Normal 12.9 (1.633)
2.163 0.0311Overweight 12.53 (1.889)
Nose Angle 14 21Normal 45.73 (4.983) −2.402 0.0168
Overweight 46.98 (5.765)
EUL R DH (horizontal distance from er1 to er7 in the eyeimage) was highly significantly different between the normaland overweight classes. The means of EUL R DH in normaland overweight status were 3.188 (0.226) and 3.322 (0.241)(t = −4 292, P = 0 0000). In female: 41–60, a total of21 features were significantly different between the normal
and overweight classes, and 8 of these features were highlysignificantly different (FD43 143, FD53 153, FD94 194,FDH33 133, FA118 125 143, FR06 psu, FR08 psu, andFArea03; P < 0 0000).
Many features that were significantly different betweenthe normal and overweight classes in particular age

8 Journal of Biomedicine and Biotechnology
group were identified. 25 features such as EUL R St,FD117 126, Fh Cur Max Distan, FDH12 14, EUL R DH,and EUL R Khmean were found only in the female: 21–40 group, while the features FD17 25, FA117 125 143,FDV12 14, FDH14 21, and Nose Angle 14 21 were onlyfound in female: 41–60.
3.3. Medical Applications and Limitations. Patients or poten-tial patients with obesity-related diseases must constantlycheck their own BMI based on their weight. Measurementsusing calibrated scales and ruler are ideal, but may not alwaysbe possible in the critically ill [32] and in telemedicine oremergency medical services in real time in remote locations.Our method was designed under the prerequisite that abovemethod cannot be used in situations such as elderly traumaor intensive care in emergency medicine, remote healthcare,and so forth.
Several studies have been performed on patient BMIand weight estimation in emergency medical service andtelemedicine [32–35]. These are important to enable accuratedrug dosage, counter shock voltage calculation, or treatment,particularly in situations of serious illness, such as elderlytrauma or intensive care [33, 34]. On the one hand, mostpatients are not aware of their body weight because the bodyweight of many individuals changes over time. For example,although patient self-estimates of weight are better thanestimates by residents and nurses in emergency departments,22% of patients do not estimate their own weight within 5 kg[34]. The method described herein can provide clues to thedevelopment of alternative methods for BMI estimation inthe above situations or telemedicine, and the developmentof medical fields because facial characteristics provide sub-stantial clinical information on the present or future healthconditions of patients [18, 19].
4. Conclusions
The relationship between obesity, diseases, and face that areassociated with health complications has been researchedfor a long time. Here, we have proposed and demonstratedthe possibility of identifying normal and overweight statususing only facial characteristics, and found statisticallysignificant differences between the 2 classes in 2 femalegroups. Although there are still problems to be solved forthe complete classification of BMI status, this method wouldprovide basic information and benefits to studies in facerecognition, obesity, facial morphology, medical science,telemedicine, and emergency medicine.
Acknowledgment
This work was supported in part by National ResearchFoundation of Korea (NRF) Grant funded by the KoreaGovernment (MEST) (20110027738).
References
[1] O. H. James and J. C. Peters, “Environmental contributions tothe obesity epidemic,” Science, vol. 280, no. 5368, pp. 1371–1374, 1998.
[2] A. G. Comuzzie and D. B. Allison, “The search for humanobesity genes,” Science, vol. 280, no. 5368, pp. 1374–1377,1998.
[3] J. P. Despres and I. Lemieux, “Abdominal obesity andmetabolic syndrome,” Nature, vol. 444, no. 7121, pp. 881–887,2006.
[4] H. Hirose, T. Takayama, S. Hozawa, T. Hibi, and I. Saito,“Prediction of metabolic syndrome using artificial neuralnetwork system based on clinical data including insulinresistance index and serum adiponectin,” Computers in Biologyand Medicine, vol. 41, no. 11, pp. 1051–1056, 2011.
[5] L. L. Yan, M. L. Daviglus, K. Liu et al., “BMI and health-relatedquality of life in adults 65 years and older,” Obesity Research,vol. 12, no. 1, pp. 69–76, 2004.
[6] C. Ni Mhurchu, A. Rodgers, W. H. Pan et al., “Body massindex and cardiovascular disease in the Asia-Pacific Region:an overview of 33 cohorts involving 310 000 participants,”International Journal of Epidemiology, vol. 33, no. 4, pp. 751–758, 2004.
[7] T. Haas, S. Svacina, J. Pav, R. Hovorka, P. Sucharda, andJ. Sonka, “Risk calculation of type 2 diabetes,” ComputerMethods and Programs in Biomedicine, vol. 41, no. 3-4, pp.297–303, 1994.
[8] C. M. Y. Lee, S. Colagiuri, M. Ezzati, and M. Woodward, “Theburden of cardiovascular disease associated with high bodymass index in the Asia-Pacific region,” Obesity Reviews, vol.12, no. 501, pp. e454–e459, 2011.
[9] L. Li, A. P. De Moira, and C. Power, “Predicting cardiovasculardisease risk factors in midadulthood from childhood bodymass index: utility of different cutoffs for childhood body massindex,” American Journal of Clinical Nutrition, vol. 93, no. 6,pp. 1204–1211, 2011.
[10] E. Anuurad, K. Shiwaku, A. Nogi et al., “The new BMI criteriafor Asians by the regional office for the Western Pacific regionof WHO are suitable for screening of overweight to preventmetabolic syndrome in elder japanese workers,” Journal ofOccupational Health, vol. 45, no. 6, pp. 335–343, 2003.
[11] S. P. Hye, S. Y. Yeong, Y. P. Jung, S. K. Young, and M. C. Joong,“Obesity, abdominal obesity, and clustering of cardiovascularrisk factors in South Korea,” Asia Pacific Journal of ClinicalNutrition, vol. 12, no. 4, pp. 411–418, 2003.
[12] J. Y. Kim, H. M. Chang, J. J. Cho, S. H. Yoo, and S. Y. Kim,“Relationship between obesity and depression in the Koreanworking population,” Journal of Korean Medical Science, vol.25, no. 11, pp. 1560–1567, 2010.
[13] H. Fonseca, A. M. Silva, M. G. Matos et al., “Validity of BMIbased on self-reported weight and height in adolescents,” ActaPaediatrica, International Journal of Paediatrics, vol. 99, no. 1,pp. 83–88, 2010.
[14] K. Sobottka and I. Pitas, “A novel method for automatic facesegmentation, facial feature extraction and tracking,” SignalProcessing: Image Communication, vol. 12, no. 3, pp. 263–281,1998.
[15] Y. Wang, C. S. Chua, and Y. K. Ho, “Facial feature detectionand face recognition from 2D and 3D images,” PatternRecognition Letters, vol. 23, no. 10, pp. 1191–1202, 2002.
[16] C. L. Huang and Y. M. Huang, “Facial Expression RecognitionUsing Model-Based Feature Extraction and Action ParametersClassification,” Journal of Visual Communication and ImageRepresentation, vol. 8, no. 3, pp. 278–290, 1997.
[17] M. H. Yang, D. J. Kriegman, and N. Ahuja, “Detecting facesin images: a survey,” IEEE Transactions on Pattern Analysis andMachine Intelligence, vol. 24, no. 1, pp. 34–58, 2002.
Journal of Biomedicine and Biotechnology 9
[18] E. N. Reither, R. M. Hauser, and K. C. Swallen, “Predictingadult health and mortality from adolescent facial characteris-tics in yearbook photographs,” Demography, vol. 46, no. 1, pp.27–41, 2009.
[19] J. A. Levine, A. Ray, and M. D. Jensen, “Relation betweenchubby cheeks and visceral fat,” New England Journal ofMedicine, vol. 339, no. 26, pp. 1946–1947, 1998.
[20] A. Sadeghianrizi, C. M. Forsberg, C. Marcus, and G. Dahllof,“Craniofacial development in obese adolescents,” EuropeanJournal of Orthodontics, vol. 27, no. 6, pp. 550–555, 2005.
[21] C. Frowd, C. Lee, A. Petkovic, K. Nawaz, and Y. Bashir,“Further automating and refining the construction and recog-nition of facial composite images,” International Journal of Bio-Science and Bio-Technology, vol. 1, no. 1, pp. 59–74, 2009.
[22] C. D. Frowd, S. Ramsay, and P. J. B. Hancock, “The influenceof holistic interviewing on hair perception for the productionof facial composites,” International Journal of Bio-Science andBio-Technology, vol. 3, no. 3, pp. 55–64, 2011.
[23] M. Soltane, N. Doghmane, and N. Guersi, “Face and speechbased multi-modal biometric authentication,” InternationalJournal of Advanced Science and Technology, vol. 21, no. 6, pp.41–56, 2010.
[24] World Health Organisation, International Association forthe Study of Obesity, International Obesity TaskForce, andThe Asia-Pacific Perspective, “Redefining obesity and itstreatment,” Health Communications, Sydney, Australia, 2000.
[25] C. Barba, T. Cavalli-Sforza, J. Cutter et al., “Appropriate body-mass index for Asian populations and its implications forpolicy and intervention strategies,” Lancet, vol. 363, no. 9403,pp. 157–163, 2004.
[26] D. D. Pham, J. H. Do, B. Ku, H. J. Lee, H. Kim, and J. Y.Kim, “Body mass index and facial cues in Sasang typology foryoung and elderly persons,” Evidence-Based Complementaryand Alternative Medicine, vol. 2011, Article ID 749209, 9 pages,2011.
[27] U. M. Fayyad and K. B. Irani, “Multi-interval discretizationof continuous-valued attributes for classification learning,”in Proceedings of the 13th International Joint Conference onUncertainty in Artificial Intelligence, vol. 2, pp. 1022–1027,1993.
[28] M. Hall, E. Frank, G. Holmes, B. Pfahringer, P. Reutemann,and I. H. Witten, “The WEKA data mining software: anupdate,” SIGKDD Explorations, vol. 11, pp. 10–18, 2009.
[29] T. Douchi, S. Yamamoto, S. Nakamura et al., “The effect ofmenopause on regional and total body lean mass,” Maturitas,vol. 29, no. 3, pp. 247–252, 1998.
[30] M. Skrzypczak and A. Szwed, “Assessment of the body massindex and selected physiological parameters in pre- and post-menopausal women,” HOMO- Journal of Comparative HumanBiology, vol. 56, no. 2, pp. 141–152, 2005.
[31] Q. Wang, C. Hassager, P. Ravn, S. Wang, and C. Chris-tiansen, “Total and regional body-composition changes inearly postmenopausal women: age-related or menopause-related?” American Journal of Clinical Nutrition, vol. 60, no.6, pp. 843–848, 1994.
[32] D. Krieser, K. Nguyen, D. Kerr, D. Jolley, M. Clooney, and A.M. Kelly, “Parental weight estimation of their child’s weightis more accurate than other weight estimation methods fordetermining children’s weight in an emergency department?”Emergency Medicine Journal, vol. 24, no. 11, pp. 756–759, 2007.
[33] T. R. Coe, M. Halkes, K. Houghton, and D. Jefferson, “Theaccuracy of visual estimation of weight and height in
pre-operative supine patients,” Anaesthesia, vol. 54, no. 6, pp.582–586, 1999.
[34] W. L. Hall, G. L. Larkin, M. J. Trujillo, J. L. Hinds, andK. A. Delaney, “Errors in weight estimation in the emer-gency department: comparing performance by providers andpatients,” Journal of Emergency Medicine, vol. 27, no. 3, pp.219–224, 2004.
[35] S. Menon and A. M. Kelly, “How accurate is weight estimationin the emergency department?” Emergency Medicine Australa-sia, vol. 17, no. 2, pp. 113–116, 2005.

Hindawi Publishing CorporationJournal of Biomedicine and BiotechnologyVolume 2012, Article ID 818607, 8 pagesdoi:10.1155/2012/818607
Research Article
A New Method of Diagnosing Constitutional Types Based onVocal and Facial Features for Personalized Medicine
Bum Ju Lee, Boncho Ku, Kihyun Park, Keun Ho Kim, and Jong Yeol Kim
Division of Constitutional Medicine Research, Korea Institute of Oriental Medicine, 1672 Yuseongdae-ro, Yuseong-gu,Deajeon 305-811, Republic of Korea
Correspondence should be addressed to Jong Yeol Kim, [email protected]
Received 21 May 2012; Accepted 30 May 2012
Academic Editor: Sabah Mohammed
Copyright © 2012 Bum Ju Lee et al. This is an open access article distributed under the Creative Commons Attribution License,which permits unrestricted use, distribution, and reproduction in any medium, provided the original work is properly cited.
The aim of the present study is to develop an accurate constitution diagnostic method based solely on the individual’s physicalcharacteristics, irrespective of psychologic traits, characteristics of clinical medicine, and genetic factors. In this paper, we suggest anovel method for diagnosing constitutional types using only speech and face characteristics. Based on 514 subjects, the area underthe receiver operating characteristics curve (AUC) values of classification models in age and gender groups ranged from 0.64to 0.89. We identified significant features showing statistical differences among three constitutional types by performing statisticalanalysis. Also, we selected a compact and discriminative feature subset for constitution diagnosis in each age and gender group. Ourmethod may support the direction of improved diagnosis prediction and will serve to develop a personal and automatic constitu-tion diagnosis software for improvement of the effectiveness of prescribed medications and development of personalized medicine.
1. Introduction
Due to the development of medicine and advances ofbiotechnology and information technology, the midpointof medical treatment has shifted away from commontreatments of a certain disease to personalized medicine[1–8]. Consistent with this paradigm, there has been anexplosion of interest in alternative oriental medicines and ina fusion of oriental and western medicines [9–16]. One ofthe core research areas of personalized medicine in westernand oriental medicine is to understand the psychologicalcharacteristics, morphological traits, genetic characteristics,and constitution of individuals. The human constitution hasbeen researched in western and oriental medicine for a longtime. For example, Hippocrates suggested that the humanconstitution could be attributed to four kinds of substances(blood, phlegm, choler, and black bile) [4]. Wang classifiedhumans into seven constitutional groups using physiologicaland physical status [4, 17]. Similarly, Lee classified humansinto four Sasang constitutional types as TE (Teaeumin),TY (Taeyangin), SE (Soeumin), and SY (Soyangin) basedon physiological, psychological, and physical characteristics[2, 11–13, 15].
Personal constitution diagnosis is important for severalreasons. Firstly, people have vulnerability to particulardiseases according to their individual psychological char-acteristics, genetic characteristics, and morphological traits.Therefore, risk factors for particular diseases can be iden-tified according to an individual’s constitution in the earlystages of disease progression [18]. Secondly, drug responseto prescribed medicine varies with personal constitution[11]. As such, the efficiency of prescribed medicine can beimproved if we know the patient’s constitution.
Many studies on Sasang constitution have been con-ducted. For the association of Sasang constitutions anddiseases and the difference of constitutional types, manyresearchers introduced constitution analysis methods [1, 4,5, 8, 12, 13, 15, 18–23]. Song et al. [22] classified TE andSE among the constitutional types using skin elasticity ofthe hand and proved that elasticity of the TE type washigher than that of the SE type. Their constitution diagnosismeasured hand skin elasticity based on a questionnairesurvey of thickness and elasticity of the skin. The limitationsof the study were that experiments were performed in onlyTE and SE types and not in the TY and SY types, andelasticity measurements were performed only on the back of
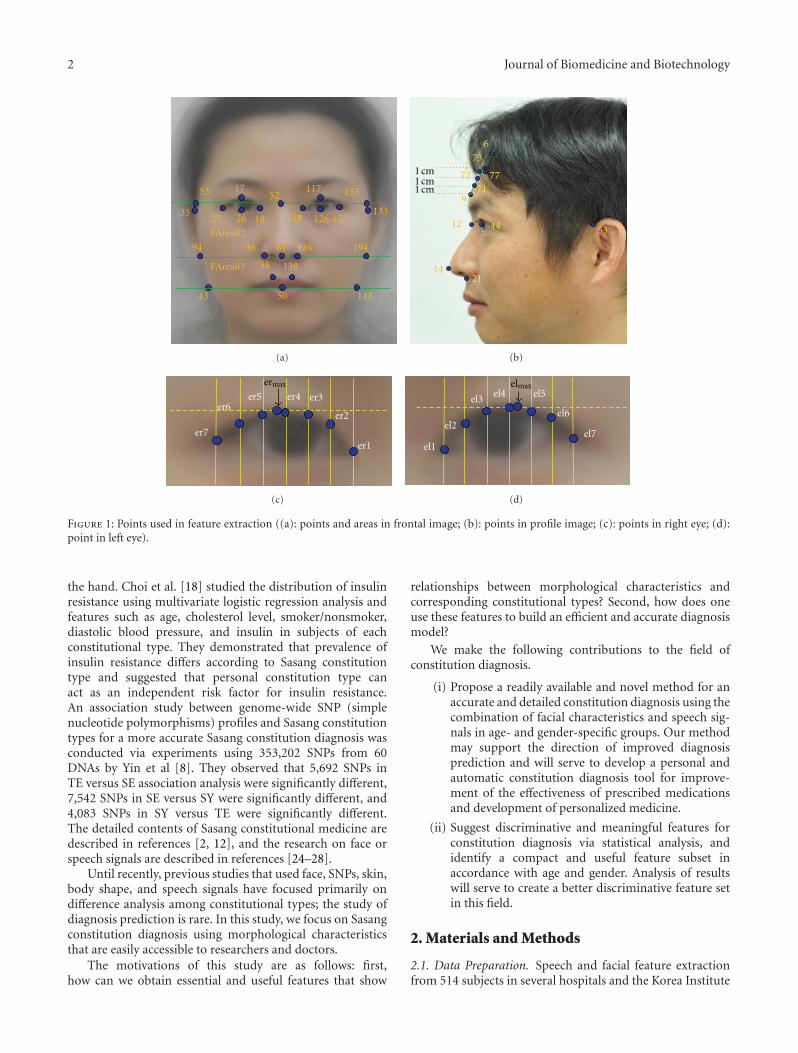
2 Journal of Biomedicine and Biotechnology
17
26
117
1261825
43 143
153
94 194
118 125
36 136
33 133
52
50
81
38 138
53
FArea02
FArea03
(a)
53
777
6
12
2114
44
72
73
719
1 cm
1 cm1 cm
(b)
er1
er2
er3er4er5er6
er7
ermax
(c)
el1
el2
el3el4 el5
el6
el7
elmax
(d)
Figure 1: Points used in feature extraction ((a): points and areas in frontal image; (b): points in profile image; (c): points in right eye; (d):point in left eye).
the hand. Choi et al. [18] studied the distribution of insulinresistance using multivariate logistic regression analysis andfeatures such as age, cholesterol level, smoker/nonsmoker,diastolic blood pressure, and insulin in subjects of eachconstitutional type. They demonstrated that prevalence ofinsulin resistance differs according to Sasang constitutiontype and suggested that personal constitution type canact as an independent risk factor for insulin resistance.An association study between genome-wide SNP (simplenucleotide polymorphisms) profiles and Sasang constitutiontypes for a more accurate Sasang constitution diagnosis wasconducted via experiments using 353,202 SNPs from 60DNAs by Yin et al [8]. They observed that 5,692 SNPs inTE versus SE association analysis were significantly different,7,542 SNPs in SE versus SY were significantly different, and4,083 SNPs in SY versus TE were significantly different.The detailed contents of Sasang constitutional medicine aredescribed in references [2, 12], and the research on face orspeech signals are described in references [24–28].
Until recently, previous studies that used face, SNPs, skin,body shape, and speech signals have focused primarily ondifference analysis among constitutional types; the study ofdiagnosis prediction is rare. In this study, we focus on Sasangconstitution diagnosis using morphological characteristicsthat are easily accessible to researchers and doctors.
The motivations of this study are as follows: first,how can we obtain essential and useful features that show
relationships between morphological characteristics andcorresponding constitutional types? Second, how does oneuse these features to build an efficient and accurate diagnosismodel?
We make the following contributions to the field ofconstitution diagnosis.
(i) Propose a readily available and novel method for anaccurate and detailed constitution diagnosis using thecombination of facial characteristics and speech sig-nals in age- and gender-specific groups. Our methodmay support the direction of improved diagnosisprediction and will serve to develop a personal andautomatic constitution diagnosis tool for improve-ment of the effectiveness of prescribed medicationsand development of personalized medicine.
(ii) Suggest discriminative and meaningful features forconstitution diagnosis via statistical analysis, andidentify a compact and useful feature subset inaccordance with age and gender. Analysis of resultswill serve to create a better discriminative feature setin this field.
2. Materials and Methods
2.1. Data Preparation. Speech and facial feature extractionfrom 514 subjects in several hospitals and the Korea Institute

Journal of Biomedicine and Biotechnology 3
Table 1: All features used in this study and brief descriptions.
Speech Brief descriptionxF0 Basic pitch of X. X is one of five vowels (A, E, I, O, and U).xF1 Formant of 1st in 4 frequency periods of XxF2 Formant of 2nd in 4 frequency periods of XxJITA Mean ratio of change in pitch period of XxRF60 120 F240 480 (Frequency band of 60∼120 Hz)/(frequency band of 240∼480 Hz) of XxRF240 480 960 1960 (Frequency band of 240∼480 Hz)/(frequency band of 960∼1960 Hz) of XaRF2 F1 Relative ratio between frequencies of A (aF2/aF1)iDF0 aF0 Difference of frequencies (iF0-aF0)uDF0 oF0 Difference of frequencies (uF0-oF0)xMFCC4 Mel frequency cepstral coefficients of XSITS Amplitude averageSISTD Standard deviation of amplitude averageSSPD Time to read one sentenceRSF60 120 240 480 (Power of frequency band of 60∼120)/(power of frequency band of 240∼480) (one sentence)RSF240 480 960 1960 (Power of frequency band of 240∼480)/(power of frequency band of 960∼1960) (one sentence)Face Brief descriptionHeight WeightWeight HeightFD n1 n2 Distance between point n1 and n2 in a frontal (or profile) imageFDH n1 n2 Horizontal distance between n1 and n2 in an imageFDV n1 n2 Vertical distance between n1 and n2 in a frontal (or profile) imageFA n1 n2 n3 Angle of three points n1, n2, and n3 in an imageFA n1 n2 Angle between the line through 2 points n1 and n2 and a horizontal lineFR02 psu FD(17,26)/FD(18,25)FR03 psu (FD [18, 25] + FD [118, 125])/FDH(33,133)FR05 psu FDH(33,133)/FD(43,143)FR06 psu FDH(33,133)/FDV(52,50)FR08 psu FD(43,143)/FDV(52,50)FArea02 Area of the contour formed by the points 53,153, 133, 194, 94, 33, and 53 in an imageFArea03 Area of the contour formed by the points 94, 194, 143, 43, and 94Fh Cur Max Distan Distance between points 7 and 77Fh Angle n1 n2 Angle between the line through 2 points n1 and n2 and a horizontal lineNose Angle n1 n2 Angle between the line through 2 points n1 and n2 and a horizontal lineNose Angle n1 n2 n3 Angle of 3 points n1, n2, and n3
SA n1 n2 Angle between the line through 2 points n1 and n2 and a horizontal lineFh Cur Max R79 69 FD(77,9)/FD(6,9)Nose Area n1 n2 n3 Area of the triangle formed by 3 points n1, n2, and n3 in an imageEUL L el1∼el7 Slope of the tangent at a point (el1∼el7) in an imageEUL R er1∼er7 Slope of the tangent at a point (er1∼er7) in an image
of Oriental Medicine in the Republic of Korea was carriedout. Constitutional types of all subjects were determinedby specialists and drug responses [21]. Speech recordconfigurations were no resonance, noise intensity from 40to 50 dB, room temperature of 20◦C± 5◦C and humidity of40%± 5%, Sennheiser e-835s microphone, Blaster Live 24-bit external sound card, and GoldWave recording program.Distance of the mouth of subjects and the microphone was4–6 cm, and features were extracted using five vowels (A, E,I, O, U) and one sentence. The extracted features consistedof pitch, average ratio of pitch period, Jita (absolute Jitter),MFCC (Mel frequency cepstral coefficients) [29, 30], and soforth.
We took photographs from the side and front of thesubject’s face using a digital camera with a ruler (Nikon
D700 with an 85 mm lens). Based on an identified featurepoint from a side- and front-face image, we obtained featuressuch as distance, distance ratios, angle, and area fromforehead, nose, mouth, face shape, and eye [20]. Doctorsdesignated the feature points (Figure 1). Height and weightof subject were measured by a digital scale (LG-150; GTech International Co., Ltd, Republic of Korea). A totalof 82 features were used in this study (29 features fromspeech signals, 51 features from face, and weight and heightfeatures). All feature measurements were done based onself-made tool using MATLAB on Window XP. The specificcontent of the extracted features was described in Table 1.
Since the face and speech signals are influenced by ageand gender [21, 31], experimental data were divided into fivecategories based on age and gender: Female-20 (women aged
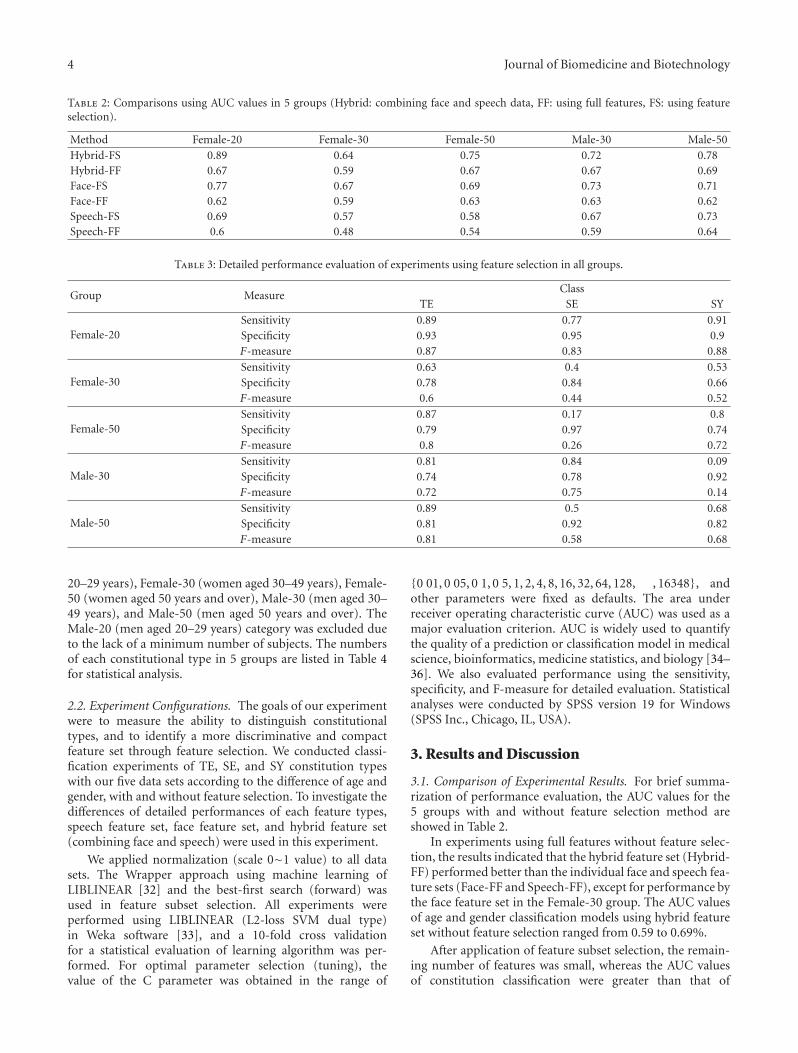
4 Journal of Biomedicine and Biotechnology
Table 2: Comparisons using AUC values in 5 groups (Hybrid: combining face and speech data, FF: using full features, FS: using featureselection).
Method Female-20 Female-30 Female-50 Male-30 Male-50Hybrid-FS 0.89 0.64 0.75 0.72 0.78Hybrid-FF 0.67 0.59 0.67 0.67 0.69Face-FS 0.77 0.67 0.69 0.73 0.71Face-FF 0.62 0.59 0.63 0.63 0.62Speech-FS 0.69 0.57 0.58 0.67 0.73Speech-FF 0.6 0.48 0.54 0.59 0.64
Table 3: Detailed performance evaluation of experiments using feature selection in all groups.
Group MeasureClass
TE SE SY
Female-20Sensitivity 0.89 0.77 0.91Specificity 0.93 0.95 0.9F-measure 0.87 0.83 0.88
Female-30Sensitivity 0.63 0.4 0.53Specificity 0.78 0.84 0.66F-measure 0.6 0.44 0.52
Female-50Sensitivity 0.87 0.17 0.8Specificity 0.79 0.97 0.74F-measure 0.8 0.26 0.72
Male-30Sensitivity 0.81 0.84 0.09Specificity 0.74 0.78 0.92F-measure 0.72 0.75 0.14
Male-50Sensitivity 0.89 0.5 0.68Specificity 0.81 0.92 0.82F-measure 0.81 0.58 0.68
20–29 years), Female-30 (women aged 30–49 years), Female-50 (women aged 50 years and over), Male-30 (men aged 30–49 years), and Male-50 (men aged 50 years and over). TheMale-20 (men aged 20–29 years) category was excluded dueto the lack of a minimum number of subjects. The numbersof each constitutional type in 5 groups are listed in Table 4for statistical analysis.
2.2. Experiment Configurations. The goals of our experimentwere to measure the ability to distinguish constitutionaltypes, and to identify a more discriminative and compactfeature set through feature selection. We conducted classi-fication experiments of TE, SE, and SY constitution typeswith our five data sets according to the difference of age andgender, with and without feature selection. To investigate thedifferences of detailed performances of each feature types,speech feature set, face feature set, and hybrid feature set(combining face and speech) were used in this experiment.
We applied normalization (scale 0∼1 value) to all datasets. The Wrapper approach using machine learning ofLIBLINEAR [32] and the best-first search (forward) wasused in feature subset selection. All experiments wereperformed using LIBLINEAR (L2-loss SVM dual type)in Weka software [33], and a 10-fold cross validationfor a statistical evaluation of learning algorithm was per-formed. For optimal parameter selection (tuning), thevalue of the C parameter was obtained in the range of
{0 01, 0 05, 0 1, 0 5, 1, 2, 4, 8, 16, 32, 64, 128, , 16348}, andother parameters were fixed as defaults. The area underreceiver operating characteristic curve (AUC) was used as amajor evaluation criterion. AUC is widely used to quantifythe quality of a prediction or classification model in medicalscience, bioinformatics, medicine statistics, and biology [34–36]. We also evaluated performance using the sensitivity,specificity, and F-measure for detailed evaluation. Statisticalanalyses were conducted by SPSS version 19 for Windows(SPSS Inc., Chicago, IL, USA).
3. Results and Discussion
3.1. Comparison of Experimental Results. For brief summa-rization of performance evaluation, the AUC values for the5 groups with and without feature selection method areshowed in Table 2.
In experiments using full features without feature selec-tion, the results indicated that the hybrid feature set (Hybrid-FF) performed better than the individual face and speech fea-ture sets (Face-FF and Speech-FF), except for performance bythe face feature set in the Female-30 group. The AUC valuesof age and gender classification models using hybrid featureset without feature selection ranged from 0.59 to 0.69%.
After application of feature subset selection, the remain-ing number of features was small, whereas the AUC valuesof constitution classification were greater than that of

Journal of Biomedicine and Biotechnology 5
Table 4: Statistical analysis by the one-way ANOVA test and the post-hoc Scheffe’s test.
Group Feature Class N Mean Std. F Sch.
Female-20
HeightTE 18 162.2 5.334
3.689∗A, B
SE 22 163.8 5.018 B
SY 23 159.7 4.979 A
WeightTE 18 62.26 7.328
19.85∗∗∗B
SE 22 52.09 4.689 A
SY 23 51.62 5.776 A
uF2TE 18 −0.613 0.750
4.975∗∗A
SE 22 −0.531 1.146 A
SY 23 0.249 0.999 B
aRF2 F1TE 18 −0.414 0.912
3.772∗A
SE 22 0.519 1.510 A, B
SY 23 1.225 2.644 B
FA18 25 43TE 18 95.28 4.945
3.520∗B
SE 22 91.29 4.927 A
SY 23 92.15 4.882 A, B
EUL L s6TE 18 0.427 0.102
5.346∗∗A
SE 22 0.523 0.099 B
SY 23 0.442 0.104 A
Female-30
FD43 143TE 57 133.0 5.985
23.55∗∗∗B
SE 53 124.4 7.085 A
SY 73 127.2 7.100 A
Fh Angle 6 7TE 57 61.78 8.052
5.039∗∗A
SE 53 65.59 9.818 B
SY 73 60.80 8.071 A, B
Female-50
WeightTE 46 0.615 0.194
25.64∗∗∗B
SE 24 0.375 0.144 A
SY 44 0.414 0.119 A
FD43 143TE 46 0.443 0.202
3.384∗B
SE 24 0.335 0.144 A
SY 44 0.384 0.142 A, B
Male-30 WeightTE 32 79.34 9.244
26.29∗∗∗C
SE 31 64.45 7.099 A
SY 22 71.22 7.868 B
Male-50
iJITATE 26 0.464 1.282
3.456∗A, B
SE 18 1.793 4.813 B
SY 25 −0.364 1.144 A
oJITATE 26 0.099 1.023
3.558∗A, B
SE 18 1.762 4.564 B
SY 25 −0.163 1.004 A
SITSTE 26 −0.730 1.182
5.088∗∗A
SE 18 0.252 0.763 B
SY 25 −0.042 1.123 A, B
RSF60 120 240 480TE 26 −0.148 1.033
3.382∗A
SE 18 0.628 1.411 A
SY 25 −0.217 1.025 A
FDV81 50TE 26 32.42 2.788
6.426∗∗B
SE 18 29.93 2.744 A
SY 25 29.86 2.953 A
FArea03TE 26 4898 556.8
14.23∗∗∗B
SE 18 4135 417.1 A
SY 25 4331 502.4 A
(N : number of samples, Std.: standard deviation, Sch.: Scheffe’s test, ∗P< 0.05, ∗∗P< 0.01, and ∗∗∗P< 0.001).

6 Journal of Biomedicine and Biotechnology
the full feature set in all the experiments. For example, theAUC values of classification models using hybrid featureset ranged from 0.64 to 0.89%. The values of classificationmodels using feature selection showed improvements of 0.22in the Female-20 group and 0.09 in Male-50.
When comparing the face (Face-FS), speech (Speech-FS), and hybrid feature sets (Hybrid-FS), the performanceof Hybrid-FS method was higher than that of Face-FS andSpeech-FS in the Female-20, Female-50, and Male-50 groups.However, performance of Face-FS method was higher thanthat of Hybrid-FS and Speech-FS in the Female-30 andMale-30 groups. Thus, it is preferable to use the Face-FSmethod in these two groups. The theoretical performanceof the Hybrid-FS method using feature selection is betterthan or equal to that of Face-FS and Speech-FS, because thehybrid feature set includes all the speech and face features.However, realistically, many of the feature selection methodsmay not ensure better performance because a greater numberof features add difficulty in building a classifier and leadto the curse of dimensionality and an NP problem [36–38]. Detailed performance evaluation of experiments usingfeature selection was showed in Table 3.
3.2. Statistical Analysis of Meaningful Features. For thestatistical analysis of features obtained from feature selectionin Hybrid-FS method, we carried out a one-way ANOVAtest, and for the post-hoc analysis, we performed the Scheffe’smultiple comparison test. The ANOVA test indicated thatthere was a significant difference among constitutional types.All features showing P values of <0.05 are shown in Table 4.
In this statistical analysis, we did not found featuresthat covered a broad range of applicability in predictingconstitutional types in the age- and gender-specific classifica-tion. However, we identified several features with an obviouspropensity for classifications of constitutional type.
In facial feature analysis using results from the Scheffe’smultiple comparison test, there was a statistically significantdifference in weight among constitutional types. Weightsbetween TE and the other types were significantly differentin the Female-20 group (F = 19.85, P = 0.0000). Weightsbetween TE and the other types in the Female-50 group weresignificantly different (F = 25.64, P = 0.0000). Weights amongTE, SE, and SY were significantly different in the Male-30 group (F = 26.298, P = 0.0000). There was a significantdifference in FD43 143 between TE and the other types inthe Female-30 group (F = 23.558, P = 0.0000) and betweenTE and SE in the Female-50 group (F = 3.384, P = 0.0374).FArea03 between TE and the other types was significantlydifferent in the Male-50 group (F = 14.231, P = 0.0000).
For speech features, there was a significant difference inSITS between TE and SE in the Male-50 group (F = 5.088,P = 0.0088). The uF2 value between SY and the othertypes was significantly different in the Female-20 group(F = 4.975, P = 0.0100), and aRF2 F1 between TE and SYwas significantly different in the Female-20 group (F = 3.772,P = 0.0286).
3.3. Limitations and Future Work. Constitution diagnosis isvery difficult in this area, because constitution type decisions
are dependent on qualitative judgments of doctors andinspectors [22]. We think that it is possible to develop anaccurate diagnosis method or standardization for constitu-tion diagnosis after collecting more diagnosis information bydoctors or inspectors.
Our experimental and statistical analysis showed animportant and useful feature for better diagnosis based ondifferences in age and gender. Since diagnosis performancesand selected features differ according to age and gender, itmakes constitution diagnosis difficult in the real world. Untilnow, features showing an obvious propensity for constitutiondiagnosis are not yet sufficient, and data sets to achieve diag-noses that are more accurate are insufficient. Accordingly,more research for constitution diagnosis is needed.
In future work, we will investigate the relationshipbetween constitution and improvement of the effectivenessof medications and explore the role of constitutional types incertain disease. We think that this is very important researchin clinical medicine, because the efficiency of prescribedmedicine can be improved if we know the patient’s consti-tution. For instance, Jeong et al. [9, 10] investigated changesin cytokine production in the acute stage of SY constitutionCI (cerebral infarction) patients after oral administration ofYangkyuk-Sanhwa-Tang water, and revealed that Yangkyuk-Sanhwa-Tang had a good effect on anti-inflammatorycytokines and a good CI treatment effect. The results of thesestudies may help to improve the effectiveness of prescribedmedications in Sasang constitutional types.
4. Conclusions
This study describes a novel prediction method for consti-tution diagnosis as an essential prerequisite for personalizedmedicine or alternative medicine. We demonstrated thepossibility and usefulness of constitution diagnosis using thecombination of face and speech feature sets in age- andgender-specific groups, identified a compact and discrim-inative feature subset, and included supporting statisticalanalysis of significant features. Our results could be usedfor developing an automatic constitution diagnostic tool forimproving the effectiveness of prescribed medications andcould be used in the fields of speech and face recognition.
Acknowledgments
This work was supported in part by National ResearchFoundation of Korea (NRF) Grant funded by the Koreagovernment (MEST) (20110027738).
References
[1] R. P. Ebstein, J. Benjamin, and R. H. Belmaker, “Person-ality and polymorphisms of genes involved in aminergicneurotransmission,” European Journal of Pharmacology, vol.410, no. 2-3, pp. 205–214, 2000.
[2] H. Chae, I. K. Lyoo, S. J. Lee et al., “An alternative way toindividualized medicine: psychological and physical traits ofSasang typology,” Journal of Alternative and ComplementaryMedicine, vol. 9, no. 4, pp. 519–528, 2003.

Journal of Biomedicine and Biotechnology 7
[3] V. Kaasinen, E. Nurmi, J. Bergman et al., “Personality traitsand brain dopaminergic function in Parkinson’s disease,”Proceedings of the National Academy of Sciences of the UnitedStates of America, vol. 98, no. 23, pp. 13272–13277, 2001.
[4] B. Y. Kim, S. Cha, H. J. Jin, and S. Jeong, “Genetic approach toelucidation of Sasang constitutional medicine,” Evidence-basedComplementary and Alternative Medicine, vol. 6, no. 1, pp. 51–57, 2009.
[5] J. C. Loehlin, Genes and Environment in Personality Develop-ment, Sage, Thousand Oaks, Calif, USA, 1992.
[6] P. Nowotny, J. M. Kwon, and A. M. Goate, “SNP analysis todissect human traits,” Current Opinion in Neurobiology, vol.11, no. 5, pp. 637–641, 2001.
[7] J. Paris, “Predispositions, personality traits, and posttraumaticstress disorder,” Harvard Review of Psychiatry, vol. 8, no. 4, pp.175–183, 2000.
[8] C. S. Yin, H. J. Park, J. H. Chung, H. J. Lee, and B. C.Lee, “Genome-wide association study of the four-constitu-tion medicine,” Journal of Alternative and ComplementaryMedicine, vol. 15, no. 12, pp. 1327–1333, 2009.
[9] H. J. Jeong, S. H. Hong, H. J. Park et al., “Yangkyuk-Sanhwa-Tang induces changes in serum cytokines and improvesoutcome in focal stroke patients,” Vascular Pharmacology, vol.39, no. 1-2, pp. 63–68, 2002.
[10] H. J. Jeong, H. J. Lee, S. H. Hong, H. M. Kim, and J. Y. Um,“Inhibitory effect of Yangkyuk-Sanhwa-Tang on inflammatorycytokine production in peripheral blood mononuclear cellsfrom the cerebral infarction patients,” International Journal ofNeuroscience, vol. 117, no. 4, pp. 525–537, 2007.
[11] H. J. Kim, S. Y. Hwang, J. H. Kim et al., “Associationbetween genetic polymorphism of multidrug resistance 1 geneand sasang constitutions,” Evidence-Based Complementary andAlternative Medicine, vol. 6, no. 1, pp. 73–80, 2009.
[12] J. Lee, Y. Jung, J. Yoo, E. Lee, and B. Koh, “Perspective ofthe human body in sasang constitutional medicine,” Evidence-Based Complementary and Alternative Medicine, vol. 6, no. 1,pp. 31–41, 2009.
[13] E. B. Shim, S. Lee, J. Y. Kim, and Y. E. Earm, “Physiomeand sasang constitutional medicine,” Journal of PhysiologicalSciences, vol. 58, no. 7, pp. 433–440, 2008.
[14] H. Y. Shin, H. J. Jeong, J. H. Lee et al., “Regulatory effect ofcytokine production in patients with cerebral infarction byYulda-Hanso-Tang,” Immunopharmacology and Immunotoxi-cology, vol. 22, no. 2, pp. 183–193, 2000.
[15] J. Y. Um, J. C. Joo, K. Y. Kim, K. M. Lee, and H. M. Kim,“Angiotensin converting enzyme gene polymorphism andtraditional Sasang classification in Koreans with cerebral in-farction,” Hereditas, vol. 138, no. 3, pp. 166–171, 2003.
[16] J. H. Yoo, E. J. Lee, C. K. Kwak et al., “Clinical trial of herbalformula on weight loss in obese Korean children,” AmericanJournal of Chinese Medicine, vol. 33, no. 5, pp. 713–722, 2005.
[17] Q. Wang, Theories of Physical Constitutions of TraditionalChinese Medicine, Chinese Medical Science and TechnologyPublishing Company, Beijing, China, 1995.
[18] K. Choi, J. Lee, J. Yoo, E. Lee, B. Koh, and J. Lee, “Sasang con-stitutional types can act as a risk factor for insulin resistance,”Diabetes Research and Clinical Practice, vol. 91, no. 3, pp. e57–e60, 2011.
[19] H. S. Jang, M. Y. Im, B. C. Shin, and M. S. Lee, “Menstrualcycle and Yin-Yang in healthy nursing college students,”Complementary Therapies in Clinical Practice, vol. 11, no. 4,pp. 266–269, 2005.
[20] I. Koo, J. Y. Kim, M. G. Kim, and K. H. Kim, “Feature selectionfrom a facial image for distinction of sasang constitution,”
Evidence-based Complementary and Alternative Medicine, vol.6, no. 1, pp. 65–71, 2009.
[21] D. D. Pham, J. H. Do, B. Ku, H. J. Lee, H. Kim, and J. Y.Kim, “Body mass index and facial cues in Sasang typology foryoung and elderly persons,” Evidence-based Complementaryand Alternative Medicine, vol. 2011, Article ID 749209, 9 pages,2011.
[22] H. W. Song, S. Lee, Y. K. Park, and S. Y. Woo, “Quantita-tive sasang constitution diagnosis method for distinguishingbetween tae-eumin and soeumin types based on elasticitymeasurements of the skin of the human hand,” Evidence-BasedComplementary and Alternative Medicine, vol. 6, no. 1, pp. 93–98, 2009.
[23] H. H. Won, S. Lee, E. Jang et al., “A genome-wide scan forthe sasang constitution in a korean family suggests significantlinkage at chromosomes 8q11.22–23 and 11q22.1–3,” Journalof Alternative and Complementary Medicine, vol. 15, no. 7, pp.765–769, 2009.
[24] M. Soltane, N. Doghmane, and N. Guersi, “Face and speechbased multi-modal biometric authentication,” InternationalJournal of Advanced Science and Technology, vol. 21, pp. 41–56,2010.
[25] G. A. Atkinson and M. L. Smith, “Using photometric stereofor face recognition,” International Journal of Bio-Science andBio-Technology, vol. 3, pp. 35–44, 2011.
[26] A. M. Lech and R. Johnston, “The relative utility of verbaldescriptions and facial composites in facial identifications,”International Journal of Bio-Science and Bio-Technology, vol. 3,pp. 1–16, 2011.
[27] Y. Faycal, Y. Farid, B. Mesaoud, and G. Mhania, “Pitch shiftingof arabic speech signal by source filter modelling for prosodictransformations,” International Journal of Software Engineeringand Its Applications, vol. 2, pp. 59–70, 2008.
[28] R. Ebrahimpour, M. Nazari, M. Azizi, and A. Amiri, “Singletraining sample face recognition using fusion of classifiers,”International Journal of Hybrid Information Technology, vol. 4,pp. 25–32, 2011.
[29] A. Gelzinis, A. Verikas, and M. Bacauskiene, “Automatedspeech analysis applied to laryngeal disease categorization,”Computer Methods and Programs in Biomedicine, vol. 91, no.1, pp. 36–47, 2008.
[30] J. Kang and H. Lee, “Automatic voice classification systembased on traditional Korean medicine,” Proceedings of WorldAcademy of Science, Engineering and Technology, vol. 56, pp.35–38, 2009.
[31] J. Gonzalez, “Formant frequencies and body size of speaker: aweak relationship in adult humans,” Journal of Phonetics, vol.32, no. 2, pp. 277–287, 2004.
[32] R. E. Fan, K. W. Chang, C. J. Hsieh, X. R. Wang, and C. J. Lin,“LIBLINEAR: a library for large linear classification,” Journalof Machine Learning Research, vol. 9, pp. 1871–1874, 2008.
[33] H. Ian, Data Mining: Practical Machine Learning Tools andTechniques, Morgan Kaufmann, San Francisco, Calif, USA,2005.
[34] E. Comak, K. Polat, S. Gunes, and A. Arslan, “A new medi-cal decision making system: least square support vectormachine (LSSVM) with Fuzzy Weighting Pre-processing,”Expert Systems with Applications, vol. 32, no. 2, pp. 409–414,2007.
[35] J. Huang and C. X. Ling, “Using AUC and accuracy in evaluat-ing learning algorithms,” IEEE Transactions on Knowledge andData Engineering, vol. 17, no. 3, pp. 299–310, 2005.
[36] B. J. Lee, M. S. Shin, Y. J. Oh, H. S. Oh, and K. H. Ryu,“Identification of protein functions using a machine-learning

8 Journal of Biomedicine and Biotechnology
approach based on sequence-derived properties,” ProteomeScience, vol. 7, article 27, 2009.
[37] I. Guyon and A. Elisseeff, “An introduction to variable andfeature selection,” Journal of Machine Learning Research, vol.3, pp. 1157–1182, 2003.
[38] J. Han and M. Kamber, Data Mining: Concepts and Techniques,Morgan Kaufmann, San Francisco, Calif, USA, 2nd edition,2006.

Hindawi Publishing CorporationJournal of Biomedicine and BiotechnologyVolume 2012, Article ID 954603, 7 pagesdoi:10.1155/2012/954603
Research Article
An Integrated Gateway for Various PHDs inU-Healthcare Environments
KeeHyun Park and JuGeon Pak
Computer Engineering Department, Keimyung University, Sindang-dong, Dalseo-gu, Daegu 704-701, Republic of Korea
Correspondence should be addressed to JuGeon Pak, [email protected]
Received 16 May 2012; Accepted 10 June 2012
Academic Editor: Sabah Mohammed
Copyright © 2012 K. Park and J. Pak. This is an open access article distributed under the Creative Commons Attribution License,which permits unrestricted use, distribution, and reproduction in any medium, provided the original work is properly cited.
We propose an integrated gateway for various personal health devices (PHDs). This gateway receives measurements fromvarious PHDs and conveys them to a remote monitoring server (MS). It provides two kinds of transmission modes: immediatetransmission and integrated transmission. The former mode operates if a measurement exceeds a predetermined threshold orin the case of an emergency. In the latter mode, the gateway retains the measurements instead of forwarding them. When thereporting time comes, the gateway extracts all the stored measurements, integrates them into one message, and transmits theintegrated message to the MS. Through this mechanism, the transmission overhead can be reduced. On the basis of the proposedgateway, we construct a u-healthcare system comprising an activity monitor, a medication dispenser, and a pulse oximeter. Theevaluation results show that the size of separate messages from various PHDs is reduced through the integration process, and theprocess does not require much time; the integration time is negligible.
1. Introduction
In recent years, the rapid emergence of population aging andchronic diseases on a global scale has contributed to socialissues by increasing health insurance costs and lowering thequality of life. Consequently, many researchers are focusingon ubiquitous healthcare (u-healthcare).
Owing to this trend, personal health devices (PHDs) haveemerged as key components of u-healthcare systems [1, 2].A PHD is a device that measures patient health data. Activitymonitors, medication dispensers, pulse oximeters, and bloodpressures are representative examples of PHDs.
In typical u-healthcare service architectures, PHDs mea-sure and acquire patient health data and transmit themto a compute engine (CE), such as a smartphone orpersonal computer. A CE collects health data from PHDsand transmits them to a remote monitoring server (MS). TheMS displays the received health data to medical staff, and itprovides the patients with the analysis via a web-based UI.
In this way, communication protocols between PHDsand CEs are very important for collecting health data fromvarious PHDs in a unified manner [3]. As a consequence, the
ISO/IEEE 11073 standard [4] was proposed to define howpersonal health data should be exchanged between a PHDand a CE, and what format should be used for the data.The standard specifies basic communication proceduresand data formats to support any type of PHD. It alsodefines device specialization protocols in consideration of thecharacteristics of each PHD.
In general, a logical point-to-point channel is establishedbetween a PHD and a CE, and the PHD communicates withsingle CE at any point in time. A CE may communicate withmore than one agent simultaneously using separate point-to-point connections. Therefore, the CE has a vital effect onthe efficiency of the u-healthcare system. For this reason,we developed a handheld CE and designed two kinds oftransmission modes: immediate transmission and integratedtransmission in the previous studies [3, 5].
In this paper, we present the implementation results of anintegrated gateway placed in a CE. The gateway receives mea-surements from PHDs and conveys them to an MS. On thebasis of the proposed gateway, we construct a u-healthcaresystem comprising three PHDs: an activity monitor [6], amedication dispenser [7], and a pulse oximeter [8]. Some

2 Journal of Biomedicine and Biotechnology
- Pulse oximeter
- Medication dispenser
- Activity monitor
· · ·
PHDs
ISO/IEEE 11073
Bluetooth, USB,
· · ·
CE
- Smartphone
- PC
- Set-top box
· · ·
CDMA, WLAN,
Service provider
MSEHR serverHL7, EN13606
- Web UI- Health records
ISO
/IE
EE
110
73
Patient’s home
LAN, . . .
Figure 1: General architecture of u-healthcare system.
experiments show that the size of separate messages fromthese PHDs is reduced through the integration process, andthe integration time does not increase significantly with anincrease in the number of separate messages.
The remainder of this paper is organized as follows.Section 2 introduces the architecture of existing u-healthcaresystems and discusses their improvement on the basis ofprevious studies. Section 3 describes the proposed methodand u-healthcare system. Section 4 presents the applicationand experimental results of the proposed gateway, andSection 5 summarizes and concludes the paper.
2. General Architecture of u-Healthcare System
The architectures of u-healthcare systems can be standard-ized or generalized by referring to previous studies onu-healthcare systems. PHDs for measuring and acquiringpatient health data have been proposed in the past [9–14]. Examples of PHDs are activity monitors, medicationdispensers, pulse oximeters, and blood pressures. Somestudies were conducted to construct a network for communi-cation between components of a u-healthcare system. Thesestudies proposed methods for applying body area networks(BANs), personal area networks (PANs), mobile networks(GSM, CDMA), wireless local area networks (WLANs), andWorldwide Interoperability for Microwave Access (WiMAX)[15–18] to u-healthcare systems. In addition, standardprotocols for transparent integration and plug-and-playinteroperability have been actively investigated [19–23]. Thearchitectures of u-healthcare systems can be generalized onthe basis of these studies; the generalized architecture isshown in Figure 1.
Figure 2: Architecture of the proposed u-healthcare system.
PHDs measure and acquire patient health data andtransmit them to CEs via wired/wireless communication,for example, Bluetooth and USB. CEs collect health datafrom PHDs and transmit them to a remote MS via mobilecommunication (GSM or CDMA) or WLAN (WiFi). TheMS displays the received health data to medical staff, and itprovides the patients with the analysis via a web-based UI. AnEHR server stores patient health data according to the EHRrules, but this is out of scope of this paper.
In this architecture, communication protocols amongcomponents are very important for collecting health datafrom various PHDs and CEs in a unified manner. As aconsequence, ISO/IEEE 11073 [4] was developed to definehow personal health data should be exchanged between

Journal of Biomedicine and Biotechnology 3
Integrated gateway
Message handler
Message analyzer Message generator
Database handler
Mode selector
PHD conf.
Configurations
Measurements
User interface
Anchor
Threshold Health data
Session
handler
Measurements
Measurements
Measurements
Database
PH
D n
o. 1
PH
D n
o. 2
PH
D n
o.n
Figure 3: Architecture of an integrated gateway.
a PHD and a CE, and what format should be used for thedata. The communication procedures are as follows.
(i) Association and setup phase: this phase associatescommunication sessions between a PHD and aCE. A PHD sends an association request messageincluding association information such as system IDand configuration ID to CE. The CE analyzes themessage, checks the configuration of the PHD, andsends an association response message to the PHD.
(ii) Operation phase: when a CE recognizes a PHD’sconfiguration, this phase is initiated. During thisphase, a PHD transmits measurements with a datareport message.
(iii) Configuration phase: when the CE does not recognizethe PHD’s configuration, this phase is initiated.During this phase, the PHD sends its configurationto the CE.
(iv) Disassociation phase: this phase is for disassociatinga communication session between a PHD and a CE.
In ISO/IEEE 11073, a logical point-to-point channelbetween a PHD and CE is established, and a PHD com-municates with a single CE at any point in time. A CEmay communicate with more than one agent simultaneouslyusing separate point-to-point connections.
Measurements from each PHD have different character-istics. For example, SpO2, pulse rate, and number of steps aresensed continuously, whereas the status of some medicationsand fall detection are sensed intermittently. Measurementcriticality also differs. A high level of SpO2, a high pulserate, or misdosing may cause fatal consequences in patients.On the other hand, violation of an exercise program is
a secondary risk. Therefore, a CE has to decide both whichmeasurements should be transferred to an MS and when.
3. Proposed u-Healthcare System
3.1. Architecture of the Proposed u-Healthcare System.Figure 2 shows the architecture for our proposed u-healthcare system. A PHD agent developed in a previousstudy [8] is assigned to each PHD, and this transfers themeasurements to the CE. An integrated gateway is placedin the CE to decide both which measurements should betransferred to an MS and when. It also integrates the differentkinds of 11073 messages received from PHDs into a single,integrated message, which is then transferred to an MS.PHD manager is assigned to an MS, and this analyzes theintegrated message from the CE.
3.2. Integrated Gateway. To improve transmission efficiency,we implement an integrated gateway and place it in a CE.This gateway receives measurements from various PHDs andconveys them to an external MS. In this process, we applytwo kinds of transmission modes: immediate transmissionand integrated transmission [3]. In the former mode, thegateway immediately conveys the measurements it receivesto an MS. This mode operates if a measurement exceedsa predetermined threshold or in the case of an emergency.Other than these cases, the gateway operates in the lattermode, whereby the measurements are stored instead ofbeing forwarded. Then, when the reporting time comes,all the stored measurements are extracted and integratedinto one message, and the integrated message is transmittedto the MS. Through this mechanism, the transmissionoverhead can be reduced. Figure 3 shows the architecture

4 Journal of Biomedicine and Biotechnology
Configuration messages
- Activity monitor
0x0001 //handle = 1 (1st measurement: exercise period)
0x0002 //handle = 2 (2nd measurement: calorie consumption)
0x0003 //handle = 3 (3rd measurement: distance)
- Medication dispenser
0x0001 //handle = 1 (1st measurement: medication status)
- Pulse oximeter
0x0002 //handle = 2 (2nd measurement: pulse rate)
. . .
. . .
. . .0x0002 //handle = 5 (5th measurement: SpO 2 )
(a) Configuration messages transmitted from the PHDs to the CE
Integrated configuration message
0x0001 //handle = 1 (1st measurement: exercise period)
0x0002 //handle = 2 (2nd measurement: calorie consumption)
0x0003 //handle = 3 (3rd measurement: distance)
0x0004 //handle = 4 (4th measurement: medication status)
0x0006 //handle = 6 (6th measurement: pulse rate)
0x0005 //handle = 5 (5th measurement: SpO 2 )
. . .
. . .
. . .
. . .
. . .
(b) Integrated configuration message transmitted from the CE tothe MS
Integrated message
0x0041 //exercise period (65 min)
0x000A //calorie consumption (10 cal)
0x00BF //distance (7 km)
0x0001 //medication status (taken)
0x005F //SpO2 (95%)
0x0050 //pulse rate (80 beat/min)
. . .
. . .
. . .
(c) Integrated message transmitted fromthe CE to the MS
Configuration messages
- Blood pressure monitor0x0001 //handle = 1 (1st measurement: systolic)
0x0002 //handle = 2 (2nd measurement: diastolic)
0x0003 //handle = 3 (3rd measurement: mean arterial pressure)
- Glucose meter
0x0001 //handle = 1 (1st measurement: blood glucose)
. . .
. . .
(d) Configuration messages transmitted from the added PHDs tothe CE
Integrated configuration message
0x0001 //handle = 1 (1st measurement is exercise period)
0x0002 //handle = 2 (2nd measurement is calorie consumption)
0x0003 //handle = 3 (3rd measurement is distance)
0x0004 //handle = 4 (4th measurement is medication status)
0x0005 //handle = 5 (5th measurement is SpO 2 )
0x0006 //handle = 6 (6th measurement is pulse rate)
0x0007 //handle = 7 (7th measurement is systolic)
0x0008 //handle = 8 (8th measurement is diastolic)
0x000A //handle = 10 (10th measurement is blood glucose)
0x0009 //handle = 9 (9th measurement is mean arterial pressure)
. . .
. . .
. . .
. . .
. . .
. . .
. . .
. . .
. . .
(e) Integrated configuration message transmitted from the CE to theMS
Integrated message
0x00 0x41 //exercise period (65 min)
0x00 0x0A //calorie consumption (10 cal)
0x00 0xBF //distance (7 km)
0x00 0x01 //medication status (taken)
0x00 0x5F //SpO2 (95%)
0x00 0x50 //pulse rate (80 beat/min)
0x00 0x78 //systolic (120 mmHg)
0x00 0x50 //diastolic (80 mmHg)
0x00 0x64 //mean arterial pressure (100 mmHg)
0xF4 0x4C //blood glucose (110 mmol/L)
. . .
. . .
. . .
. . .
. . .
. . .
. . .
(f) Integrated message transmitted from the CE tothe MS
Figure 4: Message integration scenario.
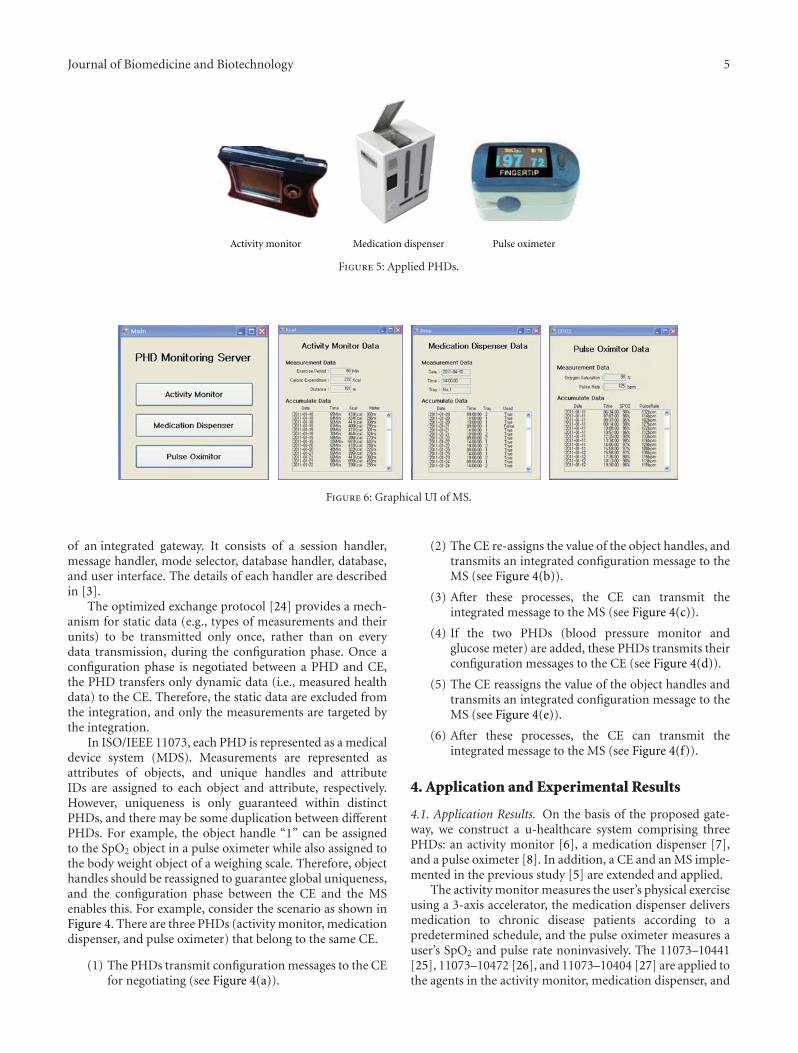
Journal of Biomedicine and Biotechnology 5
Medication dispenser Pulse oximeterActivity monitor
Figure 5: Applied PHDs.
Figure 6: Graphical UI of MS.
of an integrated gateway. It consists of a session handler,message handler, mode selector, database handler, database,and user interface. The details of each handler are describedin [3].
The optimized exchange protocol [24] provides a mech-anism for static data (e.g., types of measurements and theirunits) to be transmitted only once, rather than on everydata transmission, during the configuration phase. Once aconfiguration phase is negotiated between a PHD and CE,the PHD transfers only dynamic data (i.e., measured healthdata) to the CE. Therefore, the static data are excluded fromthe integration, and only the measurements are targeted bythe integration.
In ISO/IEEE 11073, each PHD is represented as a medicaldevice system (MDS). Measurements are represented asattributes of objects, and unique handles and attributeIDs are assigned to each object and attribute, respectively.However, uniqueness is only guaranteed within distinctPHDs, and there may be some duplication between differentPHDs. For example, the object handle “1” can be assignedto the SpO2 object in a pulse oximeter while also assigned tothe body weight object of a weighing scale. Therefore, objecthandles should be reassigned to guarantee global uniqueness,and the configuration phase between the CE and the MSenables this. For example, consider the scenario as shown inFigure 4. There are three PHDs (activity monitor, medicationdispenser, and pulse oximeter) that belong to the same CE.
(1) The PHDs transmit configuration messages to the CEfor negotiating (see Figure 4(a)).
(2) The CE re-assigns the value of the object handles, andtransmits an integrated configuration message to theMS (see Figure 4(b)).
(3) After these processes, the CE can transmit theintegrated message to the MS (see Figure 4(c)).
(4) If the two PHDs (blood pressure monitor andglucose meter) are added, these PHDs transmits theirconfiguration messages to the CE (see Figure 4(d)).
(5) The CE reassigns the value of the object handles andtransmits an integrated configuration message to theMS (see Figure 4(e)).
(6) After these processes, the CE can transmit theintegrated message to the MS (see Figure 4(f)).
4. Application and Experimental Results
4.1. Application Results. On the basis of the proposed gate-way, we construct a u-healthcare system comprising threePHDs: an activity monitor [6], a medication dispenser [7],and a pulse oximeter [8]. In addition, a CE and an MS imple-mented in the previous study [5] are extended and applied.
The activity monitor measures the user’s physical exerciseusing a 3-axis accelerator, the medication dispenser deliversmedication to chronic disease patients according to apredetermined schedule, and the pulse oximeter measures auser’s SpO2 and pulse rate noninvasively. The 11073–10441[25], 11073–10472 [26], and 11073–10404 [27] are applied tothe agents in the activity monitor, medication dispenser, and
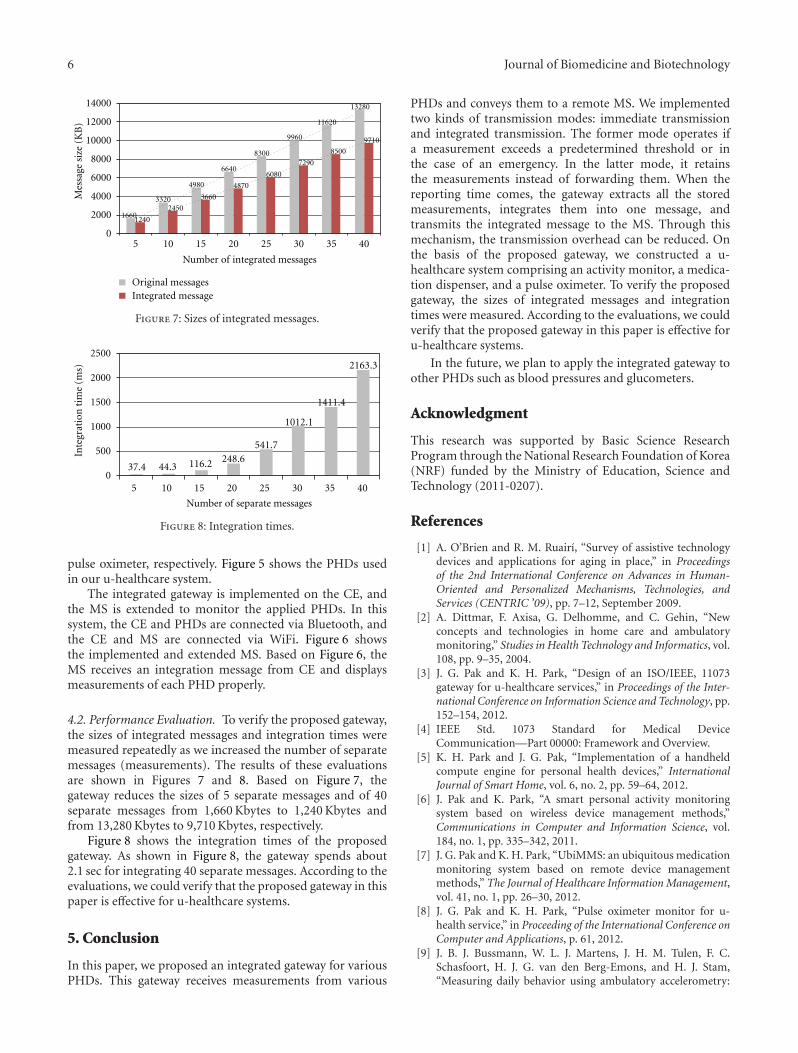
6 Journal of Biomedicine and Biotechnology
14000
12000
10000
8000
6000
4000
2000
05 10 15 20 25 30 35 40
Original messagesIntegrated message
Number of integrated messages
16601240
33202450
4980
3660
6640
4870
8300
6080
9960
7290
11620
8500
13280
9710
Mes
sage
siz
e (K
B)
Figure 7: Sizes of integrated messages.
2500
2000
1500
1000
500
037.4 44.3 116.2 248.6
541.7
1012.1
1411.4
2163.3
Number of separate messages
5 10 15 20 25 30 35 40
Inte
grat
ion
tim
e (m
s)
Figure 8: Integration times.
pulse oximeter, respectively. Figure 5 shows the PHDs usedin our u-healthcare system.
The integrated gateway is implemented on the CE, andthe MS is extended to monitor the applied PHDs. In thissystem, the CE and PHDs are connected via Bluetooth, andthe CE and MS are connected via WiFi. Figure 6 showsthe implemented and extended MS. Based on Figure 6, theMS receives an integration message from CE and displaysmeasurements of each PHD properly.
4.2. Performance Evaluation. To verify the proposed gateway,the sizes of integrated messages and integration times weremeasured repeatedly as we increased the number of separatemessages (measurements). The results of these evaluationsare shown in Figures 7 and 8. Based on Figure 7, thegateway reduces the sizes of 5 separate messages and of 40separate messages from 1,660 Kbytes to 1,240 Kbytes andfrom 13,280 Kbytes to 9,710 Kbytes, respectively.
Figure 8 shows the integration times of the proposedgateway. As shown in Figure 8, the gateway spends about2.1 sec for integrating 40 separate messages. According to theevaluations, we could verify that the proposed gateway in thispaper is effective for u-healthcare systems.
5. Conclusion
In this paper, we proposed an integrated gateway for variousPHDs. This gateway receives measurements from various
PHDs and conveys them to a remote MS. We implementedtwo kinds of transmission modes: immediate transmissionand integrated transmission. The former mode operates ifa measurement exceeds a predetermined threshold or inthe case of an emergency. In the latter mode, it retainsthe measurements instead of forwarding them. When thereporting time comes, the gateway extracts all the storedmeasurements, integrates them into one message, andtransmits the integrated message to the MS. Through thismechanism, the transmission overhead can be reduced. Onthe basis of the proposed gateway, we constructed a u-healthcare system comprising an activity monitor, a medica-tion dispenser, and a pulse oximeter. To verify the proposedgateway, the sizes of integrated messages and integrationtimes were measured. According to the evaluations, we couldverify that the proposed gateway in this paper is effective foru-healthcare systems.
In the future, we plan to apply the integrated gateway toother PHDs such as blood pressures and glucometers.
Acknowledgment
This research was supported by Basic Science ResearchProgram through the National Research Foundation of Korea(NRF) funded by the Ministry of Education, Science andTechnology (2011-0207).
References
[1] A. O’Brien and R. M. Ruairı, “Survey of assistive technologydevices and applications for aging in place,” in Proceedingsof the 2nd International Conference on Advances in Human-Oriented and Personalized Mechanisms, Technologies, andServices (CENTRIC ’09), pp. 7–12, September 2009.
[2] A. Dittmar, F. Axisa, G. Delhomme, and C. Gehin, “Newconcepts and technologies in home care and ambulatorymonitoring,” Studies in Health Technology and Informatics, vol.108, pp. 9–35, 2004.
[3] J. G. Pak and K. H. Park, “Design of an ISO/IEEE, 11073gateway for u-healthcare services,” in Proceedings of the Inter-national Conference on Information Science and Technology, pp.152–154, 2012.
[4] IEEE Std. 1073 Standard for Medical DeviceCommunication—Part 00000: Framework and Overview.
[5] K. H. Park and J. G. Pak, “Implementation of a handheldcompute engine for personal health devices,” InternationalJournal of Smart Home, vol. 6, no. 2, pp. 59–64, 2012.
[6] J. Pak and K. Park, “A smart personal activity monitoringsystem based on wireless device management methods,”Communications in Computer and Information Science, vol.184, no. 1, pp. 335–342, 2011.
[7] J. G. Pak and K. H. Park, “UbiMMS: an ubiquitous medicationmonitoring system based on remote device managementmethods,” The Journal of Healthcare Information Management,vol. 41, no. 1, pp. 26–30, 2012.
[8] J. G. Pak and K. H. Park, “Pulse oximeter monitor for u-health service,” in Proceeding of the International Conference onComputer and Applications, p. 61, 2012.
[9] J. B. J. Bussmann, W. L. J. Martens, J. H. M. Tulen, F. C.Schasfoort, H. J. G. van den Berg-Emons, and H. J. Stam,“Measuring daily behavior using ambulatory accelerometry:

Journal of Biomedicine and Biotechnology 7
The activity monitor,” Behavior Research Methods, Instru-ments, and Computers, vol. 33, no. 3, pp. 349–356, 2001.
[10] J. J. Segura-Juarez, D. Cuesta-Frau, L. Samblas-Pena, and M.Aboy, “A microcontroller-based portable electrocardiographrecorder,” IEEE Transactions on Biomedical Engineering, vol.51, no. 9, pp. 1686–1690, 2004.
[11] V. F. S. Fook, A. A. P. Wai, M. Jayachandran, B. Jit, P. H.Lee, and P. Y. L. Kiat, “Smart mote-based wireless medicationmanagement system for persons with dementia,” InternationalJournal of Assistive Robotics and Mechatronics, vol. 9, no. 1, pp.27–35, 2008.
[12] P. H. Tsai, T. Y. Chen, C. R. Yu, C. S. Shih, and J. W. S.Liu, “Smart medication dispenser: design, architecture andimplementation,” IEEE Systems Journal, vol. 5, no. 1, pp. 99–111, 2011.
[13] T. Pedersen, P. B. Dyrlund, and A. M. Moller, “Pulse oximetryfor perioperative monitoring,” Cochrane Database of System-atic Reviews, vol. 3, Article ID CD002013, 2003.
[14] N. Watthanawisuth, T. Lomas, A. Wisitsoraat, and A. Tuantra-nont, “Wireless wearable pulse oximeter for health monitoringusing ZigBee wireless sensor network,” in Proceedings of the7th Annual International Conference on Electrical Engineer-ing/Electronics, Computer, Telecommunications and Informa-tion Technology (ECTI-CON ’10), pp. 575–579, May 2010.
[15] P. Harvey, B. Woodward, S. Datta, and D. Mulvaney, “Dataacquisition in a wireless diabetic and cardiac monitoringsystem,” in Proceedings of the Engineering in Medicine andBiology Society, pp. 3154–3157, 2011.
[16] D. Niyato, E. Hossain, and S. Camorlinga, “Remote patientmonitoring service using heterogeneous wireless access net-works: architecture and optimization,” IEEE Journal onSelected Areas in Communications, vol. 27, no. 4, pp. 412–423,2009.
[17] I. Martiınez, P. del Valle, P. Munoz et al., “Interoperable andstandard e-health solution over Bluetooth,” in Proceedings ofthe Engineering in Medicine and Biology Society, pp. 2192–2195, 2010.
[18] D. Benhaddou, M. Balakrishnan, and X. Yuan, “Remotehealthcare monitoring system architecture using sensor net-works,” in Proceedings of the IEEE Region 5 Conference, pp. 1–6,April 2008.
[19] D. P. Bogia, “Supporting personal health devices throughstandardization and collaboration,” in Proceedings of the13th IEEE International Conference on e-Health NetworkingApplications and Services, pp. 338–343, 2011.
[20] M. Galarraga, I. Martinez, L. Serrano et al., “Proposal of anISO/IEEE11073 platform for healthcare telemonitoring: plug-and-play solution with new use cases,” in Proceedings of theEngineering in Medicine and Biology Society, pp. 10–13, 2007.
[21] I. Martinez, J. Fernandez, M. Galarraga et al., “Implemen-tation of an end-to-end standard-based patient monitoringsolution,” IET Communications, vol. 2, no. 2, pp. 6426–6429,2008.
[22] M. Galarraga, L. Serrano, I. Martinez, P. de Toledo, and M.Reynolds, “Telemonitoring systems interoperability challenge:an updated review of the applicability of ISO/IEEE, 11073standards for interoperability in telemonitoring,” in Proceed-ings of the Engineering in Medicine and Biology Society, pp.6162–6166.
[23] M. Clarke, D. Bogia, K. Hassing, L. Steubesand, T. Chan,and D. Ayyagari, “Developing a standard for personal healthdevices based on 11073,” in Proceedings of the Engineering inMedicine and Biology Society, pp. 6175–6177, 2007.
[24] IEEE Std. 11073–20601—2008 Health Informatics—PersonalHealth Device Communication—Application Profile—Optimized Exchange Protocol.
[25] IEEE Std. 11073–10441—2008 Health Informatics—PersonalHealth Device Communication—Device specialization—Cardiovascular fitness and activity monitor.
[26] IEEE Std. 11073–10472—2010 Health Informatics—PersonalHealth Device Communication—Device specialization—Medication Monitor.
[27] IEEE Std. 11073–10404—2008 Health Informatics—PersonalHealth Device Communication—Device specialization—Pulse oximeter.
Hindawi Publishing CorporationJournal of Biomedicine and BiotechnologyVolume 2012, Article ID 519723, 6 pagesdoi:10.1155/2012/519723
Research Article
Security Analysis and Enhancements of an EffectiveBiometric-Based Remote User Authentication Scheme UsingSmart Cards
Younghwa An
Division of Computer and Media Information Engineering, Kangnam University, 111, Gugal-dong, Giheung-gu, Yongin-si,Gyounggi-do, 446-702, Republic of Korea
Correspondence should be addressed to Younghwa An, [email protected]
Received 25 May 2012; Accepted 7 June 2012
Academic Editor: Sabah Mohammed
Copyright © 2012 Younghwa An. This is an open access article distributed under the Creative Commons Attribution License,which permits unrestricted use, distribution, and reproduction in any medium, provided the original work is properly cited.
Recently, many biometrics-based user authentication schemes using smart cards have been proposed to improve the securityweaknesses in user authentication system. In 2011, Das proposed an efficient biometric-based remote user authentication schemeusing smart cards that can provide strong authentication and mutual authentication. In this paper, we analyze the security of Das’sauthentication scheme, and we have shown that Das’s authentication scheme is still insecure against the various attacks. Also, weproposed the enhanced scheme to remove these security problems of Das’s authentication scheme, even if the secret informationstored in the smart card is revealed to an attacker. As a result of security analysis, we can see that the enhanced scheme is secureagainst the user impersonation attack, the server masquerading attack, the password guessing attack, and the insider attack andprovides mutual authentication between the user and the server.
1. Introduction
Recently, user authentication scheme in e-commerce and m-commerce has become one of important security issues.However, the security weaknesses in the remote user authen-tication scheme have been exposed seriously due to the care-less password management and the sophisticated attack tech-niques. Several schemes [1–6] have been proposed toenhance the various security problems in user authenticationschemes.
In traditional identity-based remote user authentica-tions, the security of the remote user authentication is basedon the passwords, but simple passwords are easy to breakby simple dictionary attacks. To resolve the single-passwordauthentication problems, several biometrics-based remoteuser authentication schemes [7–13] have been designed.Generally, biometrics-based remote user authentication isinherently more secure and reliable than the traditionalauthentication scheme. There are some advantages of usingbiometrics keys as compared to traditional passwords.
(i) Biometric keys cannot be lost or forgotten.
(ii) Biometric keys are very difficult to copy or share.
(iii) Biometric keys are extremely hard to forge or dis-tribute.
(iv) Biometric keys cannot be guessed easily.
(v) Someone’s biometrics is not easy to break thanothers.
In 2010, Li and Hwang [12] proposed an efficient bio-metrics-based remote user authentication scheme usingsmart cards. They claimed that their scheme not only keepsgood properties (e.g., without synchronized clock, freelychanges password, mutual authentication) but also providesnonrepudiation. But Das [13], in 2011, pointed out that Li-Hwang’s scheme does not resolve security drawbacks in loginand authentication, security drawbacks in password changephase, and security drawbacks in verification of biometrics.Then, Das proposed more efficient biometrics-based remoteuser authentication scheme using smart cards which issecure against the user impersonation attack, the servermasquerading attack, the parallel session attack, and thestolen password attack, and provide mutual authentication.
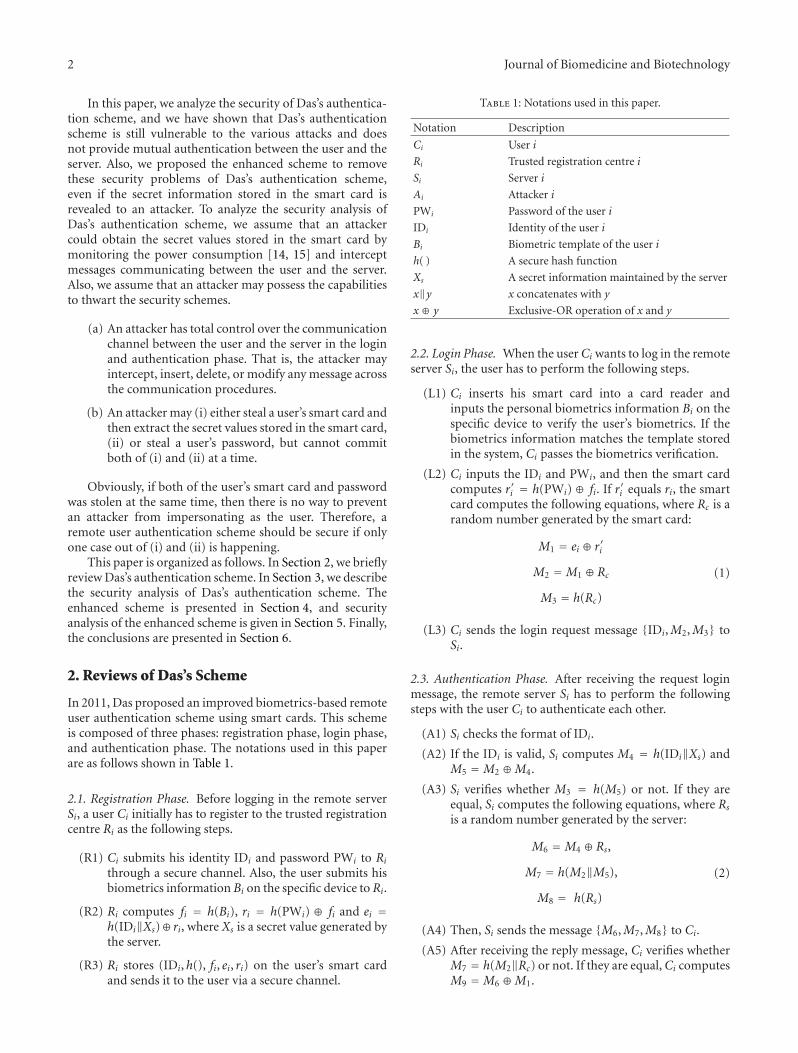
2 Journal of Biomedicine and Biotechnology
In this paper, we analyze the security of Das’s authentica-tion scheme, and we have shown that Das’s authenticationscheme is still vulnerable to the various attacks and doesnot provide mutual authentication between the user and theserver. Also, we proposed the enhanced scheme to removethese security problems of Das’s authentication scheme,even if the secret information stored in the smart card isrevealed to an attacker. To analyze the security analysis ofDas’s authentication scheme, we assume that an attackercould obtain the secret values stored in the smart card bymonitoring the power consumption [14, 15] and interceptmessages communicating between the user and the server.Also, we assume that an attacker may possess the capabilitiesto thwart the security schemes.
(a) An attacker has total control over the communicationchannel between the user and the server in the loginand authentication phase. That is, the attacker mayintercept, insert, delete, or modify any message acrossthe communication procedures.
(b) An attacker may (i) either steal a user’s smart card andthen extract the secret values stored in the smart card,(ii) or steal a user’s password, but cannot commitboth of (i) and (ii) at a time.
Obviously, if both of the user’s smart card and passwordwas stolen at the same time, then there is no way to preventan attacker from impersonating as the user. Therefore, aremote user authentication scheme should be secure if onlyone case out of (i) and (ii) is happening.
This paper is organized as follows. In Section 2, we brieflyreview Das’s authentication scheme. In Section 3, we describethe security analysis of Das’s authentication scheme. Theenhanced scheme is presented in Section 4, and securityanalysis of the enhanced scheme is given in Section 5. Finally,the conclusions are presented in Section 6.
2. Reviews of Das’s Scheme
In 2011, Das proposed an improved biometrics-based remoteuser authentication scheme using smart cards. This schemeis composed of three phases: registration phase, login phase,and authentication phase. The notations used in this paperare as follows shown in Table 1.
2.1. Registration Phase. Before logging in the remote serverSi, a user Ci initially has to register to the trusted registrationcentre Ri as the following steps.
(R1) Ci submits his identity IDi and password PWi to Ri
through a secure channel. Also, the user submits hisbiometrics information Bi on the specific device to Ri.
(R2) Ri computes fi = h(Bi), ri = h(PWi) ⊕ fi and ei =h(IDi‖Xs)⊕ ri, where Xs is a secret value generated bythe server.
(R3) Ri stores (IDi,h(), fi, ei, ri) on the user’s smart cardand sends it to the user via a secure channel.
Table 1: Notations used in this paper.
Notation Description
Ci User i
Ri Trusted registration centre i
Si Server i
Ai Attacker i
PWi Password of the user i
IDi Identity of the user i
Bi Biometric template of the user i
h( ) A secure hash function
Xs A secret information maintained by the server
x‖y x concatenates with y
x ⊕ y Exclusive-OR operation of x and y
2.2. Login Phase. When the user Ci wants to log in the remoteserver Si, the user has to perform the following steps.
(L1) Ci inserts his smart card into a card reader andinputs the personal biometrics information Bi on thespecific device to verify the user’s biometrics. If thebiometrics information matches the template storedin the system, Ci passes the biometrics verification.
(L2) Ci inputs the IDi and PWi, and then the smart cardcomputes r′i = h(PWi) ⊕ fi. If r′i equals ri, the smartcard computes the following equations, where Rc is arandom number generated by the smart card:
M1 = ei ⊕ r′i
M2 =M1 ⊕ Rc
M3 = h(Rc)
(1)
(L3) Ci sends the login request message {IDi,M2,M3} toSi.
2.3. Authentication Phase. After receiving the request loginmessage, the remote server Si has to perform the followingsteps with the user Ci to authenticate each other.
(A1) Si checks the format of IDi.
(A2) If the IDi is valid, Si computes M4 = h(IDi‖Xs) andM5 =M2 ⊕M4.
(A3) Si verifies whether M3 = h(M5) or not. If they areequal, Si computes the following equations, where Rs
is a random number generated by the server:
M6 =M4 ⊕ Rs,
M7 = h(M2‖M5),
M8 = h(Rs)
(2)
(A4) Then, Si sends the message {M6,M7,M8} to Ci.
(A5) After receiving the reply message, Ci verifies whetherM7 = h(M2‖Rc) or not. If they are equal,Ci computesM9 =M6 ⊕M1.

Journal of Biomedicine and Biotechnology 3
{IDi, M2, M3}Generates Rac
Generates Ras
Computes Ma1 = ei ⊕ ri
Computes Ma4 = ei ⊕ ri
Ma2 =Ma1 ⊕ Rac
Ma6 =Ma4 ⊕ Ras
Ma3 = h(Rac)
Ma8 = h(Ras)
Extracts ei, ri
Extracts ei, ri
Ma5 =M2 ⊕Ma4
Ma7 = h(M2//Ma5)
User
Loginphase
Authenticationphase
Attacker Server
{IDi,Ma2,Ma3}
{M10}
{M6,M7,M8}
{Ma6,Ma7,Ma8}
Figure 1: User impersonation attack and server masquerading attack.
(A6) Ci verifies whether M8 = h(M9) or not. If they areequal, Ci computes M10 = h(M6‖M9).
(A7) Then, Ci sends the message {M10} to Si.
(A8) After receiving the message, Si verifies whether M10 =h(M6‖Rs) or not. If they are equal, Si accepts theuser’s login request.
3. Security Analysis of Das’s Scheme
In this section, we will analyze the security of Das’s scheme.To analyze the security weaknesses, we assume that anattacker could obtain the secret values stored in the smartcard by monitoring the power consumption [14, 15] andintercepting messages communicating between the user andthe server. Under this assumption, we will discuss the variousattacks, such as the user impersonation attack, the servermasquerading attack, the password guessing attack, theinsider attack, and the mutual authentication between theuser and the server.
3.1. User Impersonation Attack. If the attacker can obtain thesecret values (ei, ri) from the user’s smart card illegally bysome means and intercept the message {IDi,M2,M3} in thelogin phase, the attacker can perform the user impersonationattack as the following steps. The procedure of the userimpersonation attack is illustrated in Figure 1.
(UA1) The attacker Ai computes the following equations,where Rac is a random number chosen by the attack-er:
Ma1 = ei ⊕ ri,
Ma2 =Ma1 ⊕ Rac,
Ma3 = h(Rac)
(3)
(UA2) Then, Ai sends the forged message {IDi,Ma2,Ma3} tothe remote server Si.
(UA3) Upon receiving the forged message, Si checks theformat of IDi. If it holds, Si computes M4 =h(IDi‖Xs) and M5 =Ma2 ⊕M4.
(UA4) Si verifies whether Ma3 = h(M5) or not. If they areequal, Si will be convinced the message {IDi,Ma2,Ma3} sent from the legal user.
(UA5) Then, Si makes the reply message {M6,M7,M8} bycomputing M6 = M4 ⊕ Rs, M7 = h(Ma2‖M5) andM8 = h(Rs) in the authentication phase.
3.2. Server Masquerading Attack. If the attacker can obtainthe secret values (ei, ri) from the user’s smart card illegallyby some means and intercept the message {M2} in the loginphase and {M6,M7,M8} in the authentication phase, theattacker can perform the server masquerading attack as thefollowing steps. The procedure of the server masqueradingattack is illustrated in Figure 1.
(SA1) The attacker Ai computes the following equations,whereRas is a random number chosen by the attacker:
Ma4 = ei ⊕ ri,
Ma5 =M2 ⊕Ma4,
Ma6 =Ma4 ⊕ Ras,
Ma7 = h(M2‖Ma5),
Ma8 = h(Ras)
(4)
(SA2) Then, Ai sends the forged message {Ma6,Ma7,Ma8}to the user Ci.
(SA3) Upon receiving the forged message, Ci checkswhether Ma7 = h(M2‖Rc) or not. If they are equal,Ci computes M9 =Ma6 ⊕M1.
(SA4) Ci verifies whether Ma8 = h(M9) or not. If it holds, Ci
will be convinced the message {Ma6,Ma7,Ma8} sentfrom the legal server.

4 Journal of Biomedicine and Biotechnology
(SA5) Then, Ci makes the reply massage {M10} by comput-ing M10 = h(Ma6‖M9) in the authentication phase.
3.3. Password Guessing Attack. If an attacker can extract thesecret values (ri, fi) from the legal user’s smart card by somemeans, the attacker can easily find out PWi by performingthe password guessing attack, in which each guess PW∗
i forPWi can be verified as the following steps.
(PA1) The attacker Ai computes the secret parameter ri∗ =h(PW∗
i )⊕ fi from the registration phase.
(PA2) Ai verifies the correctness of PW∗i by checking ri =
r∗i .
(PA3) Ai repeats the above steps until a correct passwordPW∗
i is found.
Thus, the attacker can perform the password guessingattack, and can successfully impersonate the legal user withthe guessed user password.
3.4. Insider Attack. In the registration phase, if the user’spassword PWi and biometrics information Bi are revealedto the server, the insider of the server may directly obtainthe user’s password and biometrics information. Thus, theinsider of the server as an attacker can impersonate as thelegal user to access the user’s other accounts in other server ifthe user uses the same password for the other accounts.
3.5. Mutual Authentication. Generally, if authenticationscheme is insecure against user impersonation attack andserver masquerading attack, the authentication schemescannot provide mutual authentication between the user andthe remote server. Therefore, Das’s scheme fails to providemutual authentication as described in Sections 3.1 and 3.2.Namely, if the attacker can obtain the secret values (ei,ri) from the legal user’s smart card by some means andintercept the messages communicating between the user andthe server, the attacker can make the forged messages easilyby computing Ma1 = ei ⊕ ri, Ma2 = Ma1 ⊕ Rac, and Ma3 =h(Rac) in the login phase. Also, the attacker can make theforged messages easily by computing Ma6 = Ma4 ⊕ Ras,Ma7 = h(M2‖Ma5), and Ma8 = h(Ras) in the authenticationphase.
4. The Enhanced Scheme
In this section, we propose an enhanced Das’s scheme whichnot only can withstand the various attacks, but also providemutual authentication between the user and the server. Theenhanced scheme is divided into three phases: registrationphase, login phase, and authentication phase.
4.1. Registration Phase. Before logging to the remote serverSi, a user Ci initially has to register to the trusted registrationcentre Ri as the following steps. The registration phase isillustrated in Figure 2.
(R1) Ci submits his identity IDi and password information(PWi ⊕ K) to Ri through a secure channel. Also the
Store K
User Ci Registration centre Ri
Smart card {IDi,h(), fi, ei}ei = h(IDi//Xs)⊕riri = (PWi ⊕ K)⊕ fi
IDi, (PWi ⊕ K), (Bi ⊕ K)
Computes fi = h(Bi ⊕ K)
Figure 2: Registration phase of the enhanced scheme.
user submits his biometrics information (Bi ⊕K) viathe specific device to Ri, where K is a random numbergenerated by Ci.
(R2) Ri computes fi = h(Bi ⊕ K), ri = h(PWi ⊕ K) ⊕ fiand ei = h(IDi‖Xs) ⊕ ri, where Xs is a secret valuegenerated by the server.
(R3) Ri stores (IDi,h(), fi, ei) on the user’s smart card andsends it to the user via a secure channel. And Ci storesrandom number K into the smart card issued by Ri.
4.2. Login Phase. When the user Ci wants to login theremote server Si, the user has to perform the following steps.The login phase and authentication phase are illustrated inFigure 3.
(L1) Ci inserts his smart card into a card reader andinputs the biometrics information Bi on the specificdevice to verify user’s biometrics. If the biometricsinformation h(Bi⊕K) matches fi stored in the system,Ci passes the biometrics verification.
(L2) Ci inputs the IDi and PWi, and then the smart cardcomputes the following equations, where Rc is arandom number generated by the user:
r′i = h(PWi ⊕ K)⊕ fi,
M1 = ei ⊕ r′i ,
M2 =M1 ⊕ Rc,
M3 = h(M1‖Rc)
(5)
(L3) Ci sends the login request message {IDi,M2,M3} to Si.
4.3. Authentication Phase. After receiving the request loginmessage, the remote server Si has to perform the followingsteps with the user Ci to authenticate each other.
(A1) Si checks the format of IDi.
(A2) If the IDi is valid, Si computes M4 = h(IDi‖Xs) andM5 =M2 ⊕M4.
(A3) Si verifies whether M3 = h(M4‖M5) or not. If they areequal, Si computes the following equations, where Rs
is a random number generated by the server:
M6 =M4 ⊕ Rs,
M7 = h(M4‖Rs)(6)
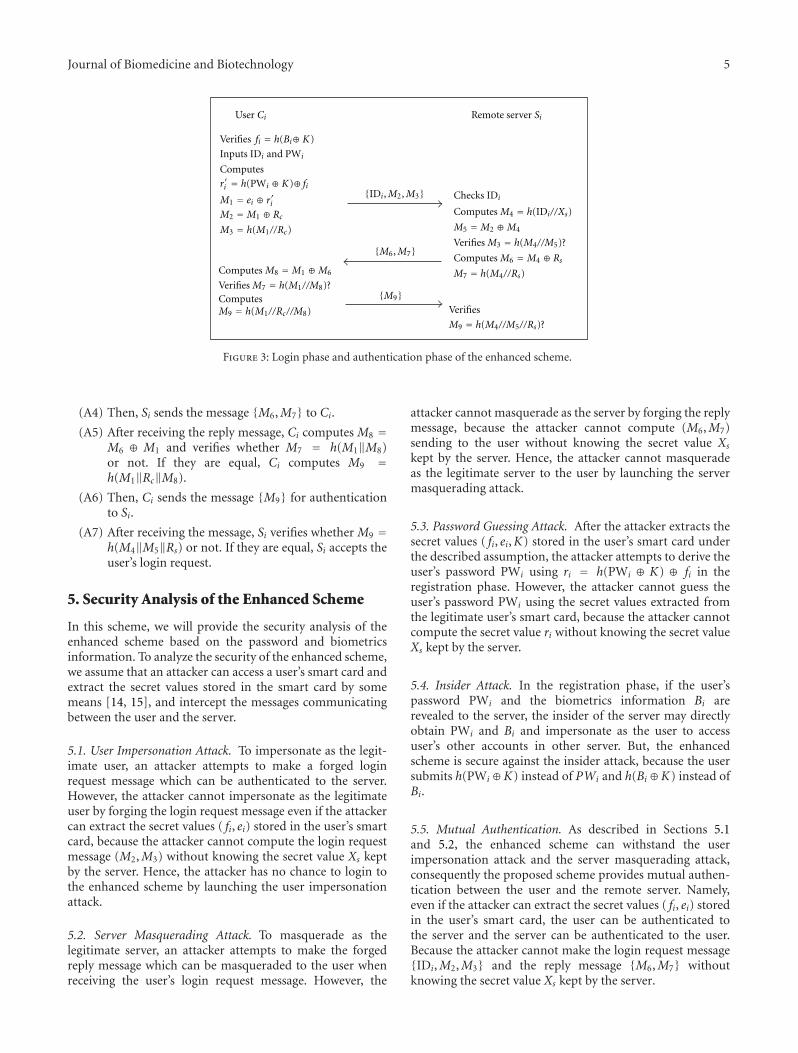
Journal of Biomedicine and Biotechnology 5
Inputs IDi and PWi
Computes
M1 = ei ⊕ riM2 =M1 ⊕ Rc
M3 = h(M1//Rc)
Computes M8 =M1 ⊕M6
Verifies M7 = h(M1//M8)?ComputesM9 = h(M1//Rc//M8)
{IDi,M2,M3}
{M6,M7}
{M9}
User Ci Remote server Si
Computes M4 = h(IDi//Xs)
M5 =M2 ⊕M4
Verifies M3 = h(M4//M5)?
Computes M6 =M4 ⊕ Rs
M7 = h(M4//Rs)
Verifies
Verifies fi = h(Bi⊕ K)
ri = h(PWi ⊕ K)⊕ fiChecks IDi
M9 = h(M4//M5//Rs)?
Figure 3: Login phase and authentication phase of the enhanced scheme.
(A4) Then, Si sends the message {M6,M7} to Ci.
(A5) After receiving the reply message, Ci computes M8 =M6 ⊕ M1 and verifies whether M7 = h(M1‖M8)or not. If they are equal, Ci computes M9 =h(M1‖Rc‖M8).
(A6) Then, Ci sends the message {M9} for authenticationto Si.
(A7) After receiving the message, Si verifies whether M9 =h(M4‖M5‖Rs) or not. If they are equal, Si accepts theuser’s login request.
5. Security Analysis of the Enhanced Scheme
In this scheme, we will provide the security analysis of theenhanced scheme based on the password and biometricsinformation. To analyze the security of the enhanced scheme,we assume that an attacker can access a user’s smart card andextract the secret values stored in the smart card by somemeans [14, 15], and intercept the messages communicatingbetween the user and the server.
5.1. User Impersonation Attack. To impersonate as the legit-imate user, an attacker attempts to make a forged loginrequest message which can be authenticated to the server.However, the attacker cannot impersonate as the legitimateuser by forging the login request message even if the attackercan extract the secret values ( fi, ei) stored in the user’s smartcard, because the attacker cannot compute the login requestmessage (M2,M3) without knowing the secret value Xs keptby the server. Hence, the attacker has no chance to login tothe enhanced scheme by launching the user impersonationattack.
5.2. Server Masquerading Attack. To masquerade as thelegitimate server, an attacker attempts to make the forgedreply message which can be masqueraded to the user whenreceiving the user’s login request message. However, the
attacker cannot masquerade as the server by forging the replymessage, because the attacker cannot compute (M6,M7)sending to the user without knowing the secret value Xs
kept by the server. Hence, the attacker cannot masqueradeas the legitimate server to the user by launching the servermasquerading attack.
5.3. Password Guessing Attack. After the attacker extracts thesecret values ( fi, ei,K) stored in the user’s smart card underthe described assumption, the attacker attempts to derive theuser’s password PWi using ri = h(PWi ⊕ K) ⊕ fi in theregistration phase. However, the attacker cannot guess theuser’s password PWi using the secret values extracted fromthe legitimate user’s smart card, because the attacker cannotcompute the secret value ri without knowing the secret valueXs kept by the server.
5.4. Insider Attack. In the registration phase, if the user’spassword PWi and the biometrics information Bi arerevealed to the server, the insider of the server may directlyobtain PWi and Bi and impersonate as the user to accessuser’s other accounts in other server. But, the enhancedscheme is secure against the insider attack, because the usersubmits h(PWi⊕K) instead of PWi and h(Bi⊕K) instead ofBi.
5.5. Mutual Authentication. As described in Sections 5.1and 5.2, the enhanced scheme can withstand the userimpersonation attack and the server masquerading attack,consequently the proposed scheme provides mutual authen-tication between the user and the remote server. Namely,even if the attacker can extract the secret values ( fi, ei) storedin the user’s smart card, the user can be authenticated tothe server and the server can be authenticated to the user.Because the attacker cannot make the login request message{IDi,M2,M3} and the reply message {M6,M7} withoutknowing the secret value Xs kept by the server.
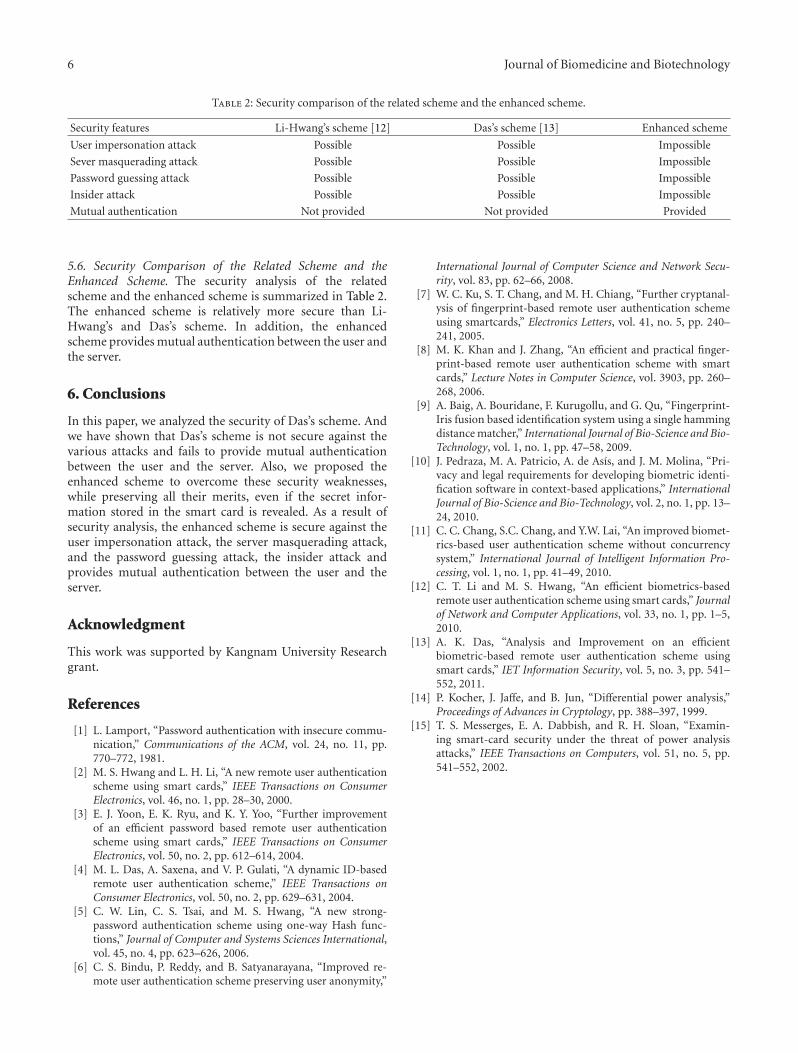
6 Journal of Biomedicine and Biotechnology
Table 2: Security comparison of the related scheme and the enhanced scheme.
Security features Li-Hwang’s scheme [12] Das’s scheme [13] Enhanced scheme
User impersonation attack Possible Possible Impossible
Sever masquerading attack Possible Possible Impossible
Password guessing attack Possible Possible Impossible
Insider attack Possible Possible Impossible
Mutual authentication Not provided Not provided Provided
5.6. Security Comparison of the Related Scheme and theEnhanced Scheme. The security analysis of the relatedscheme and the enhanced scheme is summarized in Table 2.The enhanced scheme is relatively more secure than Li-Hwang’s and Das’s scheme. In addition, the enhancedscheme provides mutual authentication between the user andthe server.
6. Conclusions
In this paper, we analyzed the security of Das’s scheme. Andwe have shown that Das’s scheme is not secure against thevarious attacks and fails to provide mutual authenticationbetween the user and the server. Also, we proposed theenhanced scheme to overcome these security weaknesses,while preserving all their merits, even if the secret infor-mation stored in the smart card is revealed. As a result ofsecurity analysis, the enhanced scheme is secure against theuser impersonation attack, the server masquerading attack,and the password guessing attack, the insider attack andprovides mutual authentication between the user and theserver.
Acknowledgment
This work was supported by Kangnam University Researchgrant.
References
[1] L. Lamport, “Password authentication with insecure commu-nication,” Communications of the ACM, vol. 24, no. 11, pp.770–772, 1981.
[2] M. S. Hwang and L. H. Li, “A new remote user authenticationscheme using smart cards,” IEEE Transactions on ConsumerElectronics, vol. 46, no. 1, pp. 28–30, 2000.
[3] E. J. Yoon, E. K. Ryu, and K. Y. Yoo, “Further improvementof an efficient password based remote user authenticationscheme using smart cards,” IEEE Transactions on ConsumerElectronics, vol. 50, no. 2, pp. 612–614, 2004.
[4] M. L. Das, A. Saxena, and V. P. Gulati, “A dynamic ID-basedremote user authentication scheme,” IEEE Transactions onConsumer Electronics, vol. 50, no. 2, pp. 629–631, 2004.
[5] C. W. Lin, C. S. Tsai, and M. S. Hwang, “A new strong-password authentication scheme using one-way Hash func-tions,” Journal of Computer and Systems Sciences International,vol. 45, no. 4, pp. 623–626, 2006.
[6] C. S. Bindu, P. Reddy, and B. Satyanarayana, “Improved re-mote user authentication scheme preserving user anonymity,”
International Journal of Computer Science and Network Secu-rity, vol. 83, pp. 62–66, 2008.
[7] W. C. Ku, S. T. Chang, and M. H. Chiang, “Further cryptanal-ysis of fingerprint-based remote user authentication schemeusing smartcards,” Electronics Letters, vol. 41, no. 5, pp. 240–241, 2005.
[8] M. K. Khan and J. Zhang, “An efficient and practical finger-print-based remote user authentication scheme with smartcards,” Lecture Notes in Computer Science, vol. 3903, pp. 260–268, 2006.
[9] A. Baig, A. Bouridane, F. Kurugollu, and G. Qu, “Fingerprint-Iris fusion based identification system using a single hammingdistance matcher,” International Journal of Bio-Science and Bio-Technology, vol. 1, no. 1, pp. 47–58, 2009.
[10] J. Pedraza, M. A. Patricio, A. de Asıs, and J. M. Molina, “Pri-vacy and legal requirements for developing biometric identi-fication software in context-based applications,” InternationalJournal of Bio-Science and Bio-Technology, vol. 2, no. 1, pp. 13–24, 2010.
[11] C. C. Chang, S.C. Chang, and Y.W. Lai, “An improved biomet-rics-based user authentication scheme without concurrencysystem,” International Journal of Intelligent Information Pro-cessing, vol. 1, no. 1, pp. 41–49, 2010.
[12] C. T. Li and M. S. Hwang, “An efficient biometrics-basedremote user authentication scheme using smart cards,” Journalof Network and Computer Applications, vol. 33, no. 1, pp. 1–5,2010.
[13] A. K. Das, “Analysis and Improvement on an efficientbiometric-based remote user authentication scheme usingsmart cards,” IET Information Security, vol. 5, no. 3, pp. 541–552, 2011.
[14] P. Kocher, J. Jaffe, and B. Jun, “Differential power analysis,”Proceedings of Advances in Cryptology, pp. 388–397, 1999.
[15] T. S. Messerges, E. A. Dabbish, and R. H. Sloan, “Examin-ing smart-card security under the threat of power analysisattacks,” IEEE Transactions on Computers, vol. 51, no. 5, pp.541–552, 2002.
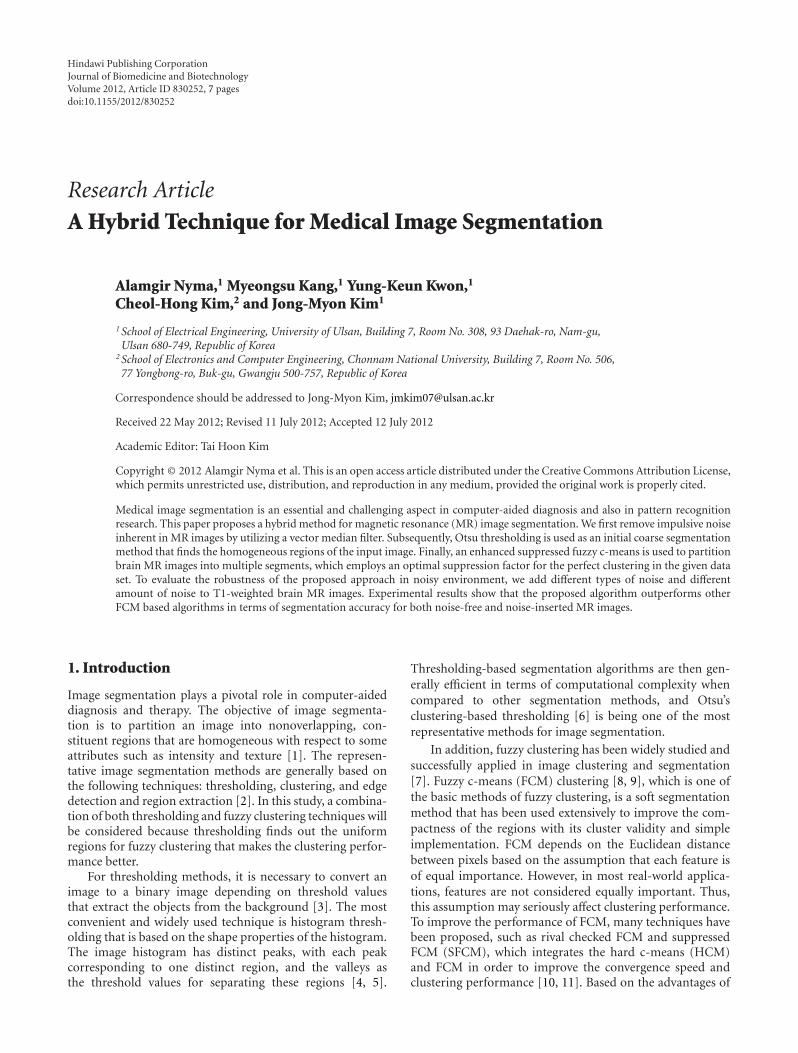
Hindawi Publishing CorporationJournal of Biomedicine and BiotechnologyVolume 2012, Article ID 830252, 7 pagesdoi:10.1155/2012/830252
Research Article
A Hybrid Technique for Medical Image Segmentation
Alamgir Nyma,1 Myeongsu Kang,1 Yung-Keun Kwon,1
Cheol-Hong Kim,2 and Jong-Myon Kim1
1 School of Electrical Engineering, University of Ulsan, Building 7, Room No. 308, 93 Daehak-ro, Nam-gu,Ulsan 680-749, Republic of Korea
2 School of Electronics and Computer Engineering, Chonnam National University, Building 7, Room No. 506,77 Yongbong-ro, Buk-gu, Gwangju 500-757, Republic of Korea
Correspondence should be addressed to Jong-Myon Kim, [email protected]
Received 22 May 2012; Revised 11 July 2012; Accepted 12 July 2012
Academic Editor: Tai Hoon Kim
Copyright © 2012 Alamgir Nyma et al. This is an open access article distributed under the Creative Commons Attribution License,which permits unrestricted use, distribution, and reproduction in any medium, provided the original work is properly cited.
Medical image segmentation is an essential and challenging aspect in computer-aided diagnosis and also in pattern recognitionresearch. This paper proposes a hybrid method for magnetic resonance (MR) image segmentation. We first remove impulsive noiseinherent in MR images by utilizing a vector median filter. Subsequently, Otsu thresholding is used as an initial coarse segmentationmethod that finds the homogeneous regions of the input image. Finally, an enhanced suppressed fuzzy c-means is used to partitionbrain MR images into multiple segments, which employs an optimal suppression factor for the perfect clustering in the given dataset. To evaluate the robustness of the proposed approach in noisy environment, we add different types of noise and differentamount of noise to T1-weighted brain MR images. Experimental results show that the proposed algorithm outperforms otherFCM based algorithms in terms of segmentation accuracy for both noise-free and noise-inserted MR images.
1. Introduction
Image segmentation plays a pivotal role in computer-aideddiagnosis and therapy. The objective of image segmenta-tion is to partition an image into nonoverlapping, con-stituent regions that are homogeneous with respect to someattributes such as intensity and texture [1]. The represen-tative image segmentation methods are generally based onthe following techniques: thresholding, clustering, and edgedetection and region extraction [2]. In this study, a combina-tion of both thresholding and fuzzy clustering techniques willbe considered because thresholding finds out the uniformregions for fuzzy clustering that makes the clustering perfor-mance better.
For thresholding methods, it is necessary to convert animage to a binary image depending on threshold valuesthat extract the objects from the background [3]. The mostconvenient and widely used technique is histogram thresh-olding that is based on the shape properties of the histogram.The image histogram has distinct peaks, with each peakcorresponding to one distinct region, and the valleys asthe threshold values for separating these regions [4, 5].
Thresholding-based segmentation algorithms are then gen-erally efficient in terms of computational complexity whencompared to other segmentation methods, and Otsu’sclustering-based thresholding [6] is being one of the mostrepresentative methods for image segmentation.
In addition, fuzzy clustering has been widely studied andsuccessfully applied in image clustering and segmentation[7]. Fuzzy c-means (FCM) clustering [8, 9], which is one ofthe basic methods of fuzzy clustering, is a soft segmentationmethod that has been used extensively to improve the com-pactness of the regions with its cluster validity and simpleimplementation. FCM depends on the Euclidean distancebetween pixels based on the assumption that each feature isof equal importance. However, in most real-world applica-tions, features are not considered equally important. Thus,this assumption may seriously affect clustering performance.To improve the performance of FCM, many techniques havebeen proposed, such as rival checked FCM and suppressedFCM (SFCM), which integrates the hard c-means (HCM)and FCM in order to improve the convergence speed andclustering performance [10, 11]. Based on the advantages of

2 Journal of Biomedicine and Biotechnology
thresholding and fuzzy clustering algorithms for image seg-mentation, some authors have proposed hybrid techniquescombining various FCM-based methods with thresholding.Histogram thresholding using fuzzy theory was proposedby Tobias and Seara [12] in which thresholding was doneaccording to the similarity between grey levels, and this sim-ilarity was accessed through a fuzzy measure. However, theapplication of this algorithm is limited based on the assump-tion that objects and background must occupy nonoverlap-ping regions. Chaabane Ben et al. proposed a hybrid methodthat combines automatic thresholding with FCM [13]. How-ever, this technique yielded good results such that significantpeaks and valleys are identified properly. Another hybridapproach was introduced by Tan and Isa, and it provided agood solution to overcome the FCM’s sensitiveness to theinitialization condition of cluster centroids and selection ofthe number of clusters by using the histogram thresholding[14]. This algorithm, however, has one drawback such thatsome flat portions of the histogram curves had been recog-nized as dominating peaks. To improve the performance ofmedical image segmentation, we propose a hybrid techniqueusing Otsu thresholding and enhanced SFCM (EnSFCM).Furthermore, we reduce impulsive noise that is widelypresented in magnetic resonance (MR) images by employingvector median filtering.
The rest of this paper is organized as follows. Section 2introduces the proposed image segmentation approach andSection 3 presents experimental results of the proposedapproach and well-known image segmentation algorithms.Finally, Section 4 concludes this paper.
2. Proposed Image Segmentation Framework
The proposed image segmentation approach consists ofvector median filtering, Otsu thresholding, and EnSFCM, asshown in Figure 1.
In the first step, vector median filtering is utilized toreduce impulsive noise in medical images. Otsu thresholdingis then employed for rough segmentation of brain MRimages, and finally EnSFCM is applied to have well-seg-mented images. More details about the proposed approachare described in the following sections.
2.1. Vector Median Filter. It is easily to see impulsive noisein medical images which is independent and uncorrelatedto the image pixels and is also randomly distributed overthe image. In the case of magnetic resonance (MR) images,uncertainty is widely presented because of impulsive noise inthe partial volume effects originating from the low resolutionof sensors [11, 15]. With these reasons, impulsive noiseinherent in brain MR images can result in low segmentationperformance. Thus this paper utilizes a vector median filter(VMF) to remove impulsive noise in images. VMF is avector processing operator that has been introduced as anextension of scalar median filter and preserves the imagewithout getting blurred and no shifting of boundary [16]. Itapproaches the problem of noise reduction by searching themost robust vector in the processing window. The process tofind the most robust vector is as follows.
Denote by I an image to be processed, and let W be theprocessing window centered on the pixel under processing ofsize N ×N , N = 3, 5, 7, . . ., and so forth. Let us consider thateach input vector xi is associated with the distance measure,
Li =N∑j=1
∥∥∥xi − xj∥∥∥γ
for i = 1, 2, . . . ,N , (1)
where γ represents the selected norm. The distance betweentwo samples can be defined by
∥∥∥xi − xj∥∥∥γ=⎛⎝ m∑k=1
∣∣∣xik − xjk∣∣∣γ⎞⎠
1/γ
, (2)
where m is the distance of the vectors and xik is the kthelement of xi. Thus distance Li serves as an ordering criterionof Lo ≤ L1 ≤ · · · ≤ LN−1 which implies the same ordering ofthe input vectors. The VMF output of the set {x0, x1, . . . , xN}is defined as the sample xVMF ∈ {x0, x1, . . . , xN} that satisfiesthe following condition:
N∑i=1
‖xVMF − xi‖γ ≤N∑i=1
∥∥∥xj − xi∥∥∥γ, for j = 1, 2, . . . ,N.
(3)
2.2. Otsu Thresholding. The Otsu’s algorithm is one of themost referenced thresholding methods to partition images byautomatically selecting threshold values from the histogramof the image. To find threshold values, the Otsu’s algorithmutilizes the variance property of the image because varianceis the measure of uniformity; the greater value of variancerepresents the greater difference between the backgroundand the object [4, 6]. Initially, two regions are separatedby the intensity threshold, and then the optimal thresholdis determined by minimizing the within-class variance ormaximizing the between-class variance.
Assume that {Pi}L−1i=0 are the probabilities of the gray-
level image histogram of an image, where L is the rangeof intensity levels. We can calculate the probabilities ofbackground (PB) and the probabilities of object (PO) of theimage with a threshold t as follows:
PB(t) =t∑
i=0
Pi,
PO(t) = 1− PB =L−1∑i=t+1
Pi.
(4)
The mean associated with the background and the objectcan be further calculated using the following equations:
μB(t) =t∑
i=0
i · PiPB(t)
,
μO(t) =L−1∑i=t+1
i · PiPO(t)
.
(5)

Journal of Biomedicine and Biotechnology 3
Medical image withimpulsive noise
Step1. preprocessing
Vector median filter
Reduces impulsive noisein medical image
Filtered medical image
Histogram of the filteredmedical image
2000
1500
1000
500
00 100 200
Step2. Otsu thresholding
Calculates meanand variances of thebackground and the
object
arg min1≤t≤L−1
(σwithin-class)
Medical image after rough
segmentation
10.90.80.70.60.50.40.30.20.1
010.90.80.70.60.50.40.30.20.10
Initialize centroids Step3. enhanced SFCM
Calculatesmembership andcentroid values
Segmented images
abs (vti − vt−1i ) < ε
Figure 1: Process of the proposed image segmentation approach.
By using values of mean, we can compute variance asfollows:
σB(t) =t∑
i=0
(i− μB
)2 · PiPB(t)
,
σO(t) =L−1∑i=t+1
(i− μO
)2 · PiPO(t)
.
(6)
The between-class variance (σbetween-class(t)) which is theweighted variance of the cluster means around the overallmean is defined as follows:
σbetween-class(t) = PB(μB(t)− μ
)2 + PO(μO(t)− μ
)2, (7)
where μ = ∑L−1i=0 i · Pi is the global mean of the image.
Furthermore, the within-class variance (σwithin-class(t)) can beexpressed as follows:
σwithin-class(t) = PB(t)× σB(t) + PO(t)× σO(t). (8)
Finally, the optimal threshold value, topt, can be deter-mined by maximizing the between-class variance or equiva-lently minimizing the with-class variance as follows:
topt = arg max1≤i≤L−1
(σbetween-class(t)),
= arg min1≤i≤L−1
(σwithin-class(t)).(9)
2.3. Enhanced Suppressed Fuzzy C-Means. Fuzzy c-means(FCM) is a data clustering algorithm in which data canbelong to several groups based on the membership value,and it is one of the most prominent clustering techniques forimage segmentation, feature extraction, and pattern recog-nition [9, 17]. However, the conventional FCM sometimesleads to accuracy degradation in segmentation. To solve thisproblem, suppressed FCM (SFCM) was proposed to improvethe clustering performance as well as convergence speed,which introduces the suppression factor for establishinga relationship between hard c-means (HCM) and FCMclustering algorithms [10]. However, there is no general con-sensus that the suppression factor for SFCM is optimal in anysense or suitable for any given purpose. Thus, we propose
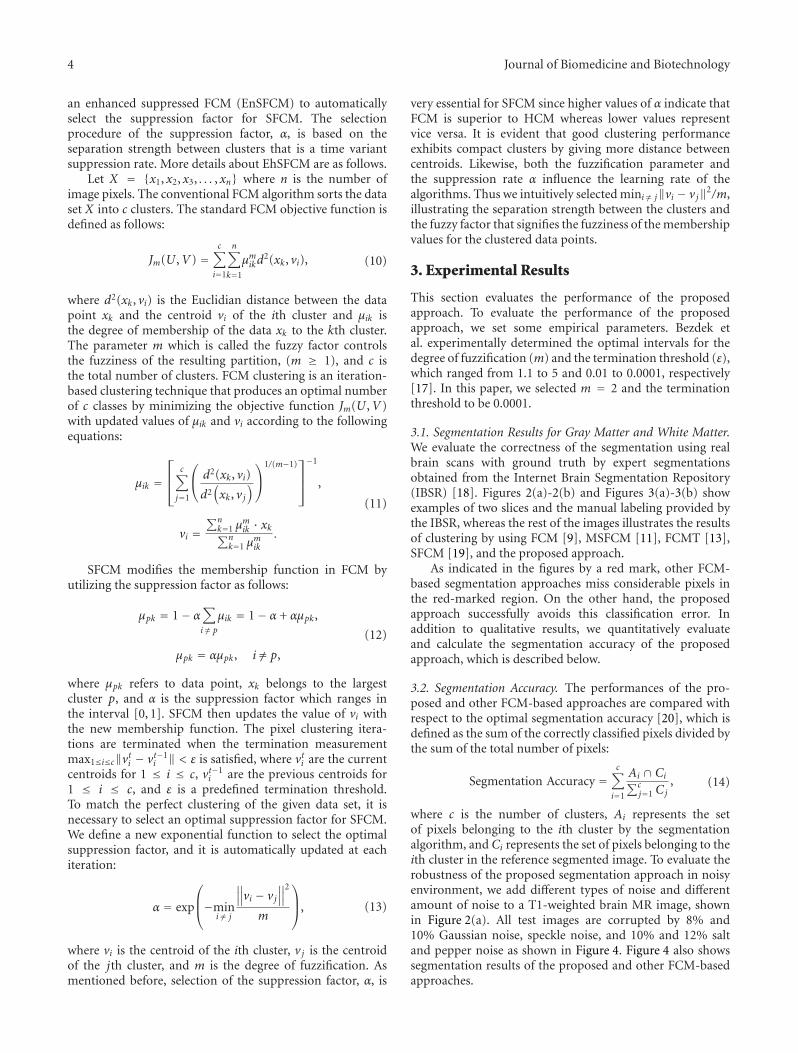
4 Journal of Biomedicine and Biotechnology
an enhanced suppressed FCM (EnSFCM) to automaticallyselect the suppression factor for SFCM. The selectionprocedure of the suppression factor, α, is based on theseparation strength between clusters that is a time variantsuppression rate. More details about EhSFCM are as follows.
Let X = {x1, x2, x3, . . . , xn} where n is the number ofimage pixels. The conventional FCM algorithm sorts the dataset X into c clusters. The standard FCM objective function isdefined as follows:
Jm(U ,V) =c∑
i=1
n∑k=1
μmikd2(xk, vi), (10)
where d2(xk, vi) is the Euclidian distance between the datapoint xk and the centroid vi of the ith cluster and μik isthe degree of membership of the data xk to the kth cluster.The parameter m which is called the fuzzy factor controlsthe fuzziness of the resulting partition, (m ≥ 1), and c isthe total number of clusters. FCM clustering is an iteration-based clustering technique that produces an optimal numberof c classes by minimizing the objective function Jm(U ,V)with updated values of μik and vi according to the followingequations:
μik =⎡⎢⎣ c∑
j=1
⎛⎝ d2(xk, vi)
d2(xk, vj
)⎞⎠
1/(m−1)⎤⎥⎦−1
,
vi =∑n
k=1 μmik · xk∑n
k=1 μmik
.
(11)
SFCM modifies the membership function in FCM byutilizing the suppression factor as follows:
μpk = 1− α∑i /= p
μik = 1− α + αμpk,
μpk = αμpk, i /= p,
(12)
where μpk refers to data point, xk belongs to the largestcluster p, and α is the suppression factor which ranges inthe interval [0, 1]. SFCM then updates the value of vi withthe new membership function. The pixel clustering itera-tions are terminated when the termination measurementmax1≤i≤c‖vti − vt−1
i ‖ < ε is satisfied, where vti are the currentcentroids for 1 ≤ i ≤ c, vt−1
i are the previous centroids for1 ≤ i ≤ c, and ε is a predefined termination threshold.To match the perfect clustering of the given data set, it isnecessary to select an optimal suppression factor for SFCM.We define a new exponential function to select the optimalsuppression factor, and it is automatically updated at eachiteration:
α = exp
⎛⎜⎝−min
i /= j
∥∥∥vi − vj∥∥∥2
m
⎞⎟⎠, (13)
where vi is the centroid of the ith cluster, vj is the centroidof the jth cluster, and m is the degree of fuzzification. Asmentioned before, selection of the suppression factor, α, is
very essential for SFCM since higher values of α indicate thatFCM is superior to HCM whereas lower values representvice versa. It is evident that good clustering performanceexhibits compact clusters by giving more distance betweencentroids. Likewise, both the fuzzification parameter andthe suppression rate α influence the learning rate of thealgorithms. Thus we intuitively selected mini /= j‖vi − vj‖2/m,illustrating the separation strength between the clusters andthe fuzzy factor that signifies the fuzziness of the membershipvalues for the clustered data points.
3. Experimental Results
This section evaluates the performance of the proposedapproach. To evaluate the performance of the proposedapproach, we set some empirical parameters. Bezdek etal. experimentally determined the optimal intervals for thedegree of fuzzification (m) and the termination threshold (ε),which ranged from 1.1 to 5 and 0.01 to 0.0001, respectively[17]. In this paper, we selected m = 2 and the terminationthreshold to be 0.0001.
3.1. Segmentation Results for Gray Matter and White Matter.We evaluate the correctness of the segmentation using realbrain scans with ground truth by expert segmentationsobtained from the Internet Brain Segmentation Repository(IBSR) [18]. Figures 2(a)-2(b) and Figures 3(a)-3(b) showexamples of two slices and the manual labeling provided bythe IBSR, whereas the rest of the images illustrates the resultsof clustering by using FCM [9], MSFCM [11], FCMT [13],SFCM [19], and the proposed approach.
As indicated in the figures by a red mark, other FCM-based segmentation approaches miss considerable pixels inthe red-marked region. On the other hand, the proposedapproach successfully avoids this classification error. Inaddition to qualitative results, we quantitatively evaluateand calculate the segmentation accuracy of the proposedapproach, which is described below.
3.2. Segmentation Accuracy. The performances of the pro-posed and other FCM-based approaches are compared withrespect to the optimal segmentation accuracy [20], which isdefined as the sum of the correctly classified pixels divided bythe sum of the total number of pixels:
Segmentation Accuracy =c∑
i=1
Ai ∩ Ci∑cj=1 Cj
, (14)
where c is the number of clusters, Ai represents the setof pixels belonging to the ith cluster by the segmentationalgorithm, and Ci represents the set of pixels belonging to theith cluster in the reference segmented image. To evaluate therobustness of the proposed segmentation approach in noisyenvironment, we add different types of noise and differentamount of noise to a T1-weighted brain MR image, shownin Figure 2(a). All test images are corrupted by 8% and10% Gaussian noise, speckle noise, and 10% and 12% saltand pepper noise as shown in Figure 4. Figure 4 also showssegmentation results of the proposed and other FCM-basedapproaches.
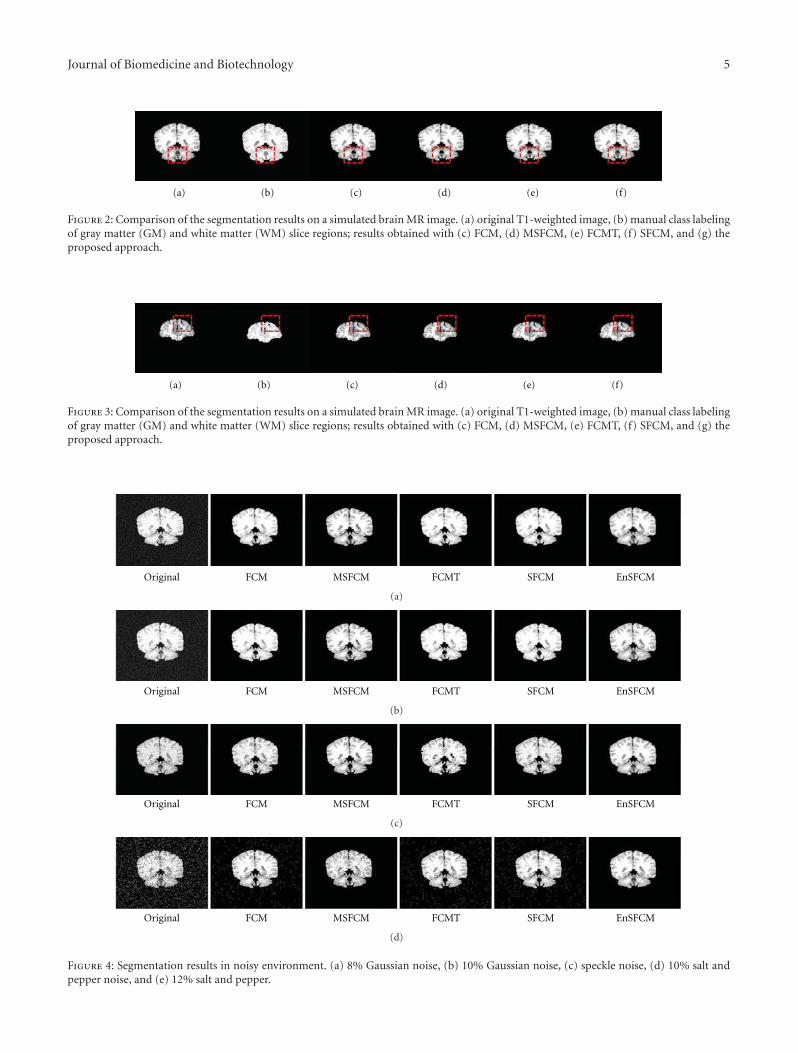
Journal of Biomedicine and Biotechnology 5
(a) (b) (c) (d) (e) (f)
Figure 2: Comparison of the segmentation results on a simulated brain MR image. (a) original T1-weighted image, (b) manual class labelingof gray matter (GM) and white matter (WM) slice regions; results obtained with (c) FCM, (d) MSFCM, (e) FCMT, (f) SFCM, and (g) theproposed approach.
(a) (b) (c) (d) (e) (f)
Figure 3: Comparison of the segmentation results on a simulated brain MR image. (a) original T1-weighted image, (b) manual class labelingof gray matter (GM) and white matter (WM) slice regions; results obtained with (c) FCM, (d) MSFCM, (e) FCMT, (f) SFCM, and (g) theproposed approach.
Original FCM MSFCM FCMT SFCM EnSFCM
(a)
Original FCM MSFCM FCMT SFCM EnSFCM
(b)
Original FCM MSFCM FCMT SFCM EnSFCM
(c)
Original FCM MSFCM FCMT SFCM EnSFCM
(d)
Figure 4: Segmentation results in noisy environment. (a) 8% Gaussian noise, (b) 10% Gaussian noise, (c) speckle noise, (d) 10% salt andpepper noise, and (e) 12% salt and pepper.
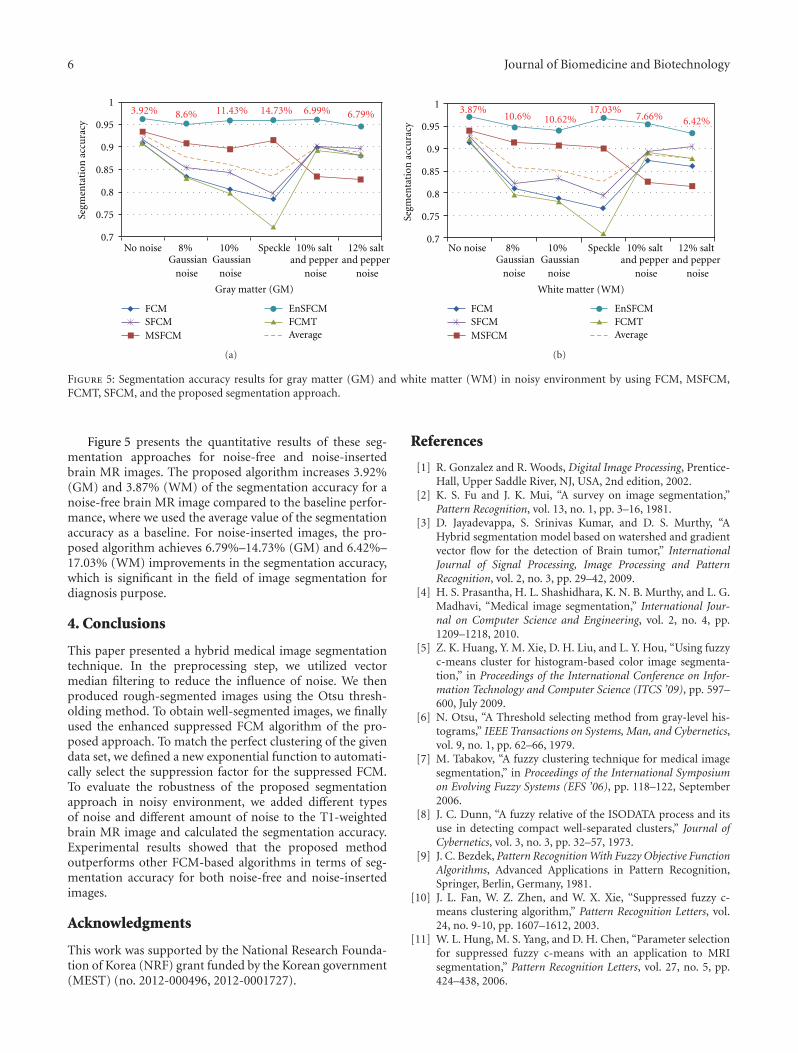
6 Journal of Biomedicine and Biotechnology
1
0.95
0.9
0.85
0.8
0.75
0.7
Segm
enta
tion
acc
ura
cy
Gray matter (GM)
FCMSFCMMSFCM
EnSFCMFCMTAverage
3.92% 8.6% 11.43% 14.73% 6.99% 6.79%
No noise 8%Gaussian
noise
10%Gaussian
noise
Speckle 10% saltand pepper
noise
12% saltand pepper
noise
(a)
White matter (WM)
FCMSFCMMSFCM
EnSFCMFCMTAverage
No noise 8%Gaussian
noise
10%Gaussian
noise
Speckle 10% saltand pepper
noise
12% saltand pepper
noise
1
0.95
0.9
0.85
0.8
0.75
0.7
Segm
enta
tion
acc
ura
cy
3.87%10.6% 10.62%
17.03%7.66% 6.42%
(b)
Figure 5: Segmentation accuracy results for gray matter (GM) and white matter (WM) in noisy environment by using FCM, MSFCM,FCMT, SFCM, and the proposed segmentation approach.
Figure 5 presents the quantitative results of these seg-mentation approaches for noise-free and noise-insertedbrain MR images. The proposed algorithm increases 3.92%(GM) and 3.87% (WM) of the segmentation accuracy for anoise-free brain MR image compared to the baseline perfor-mance, where we used the average value of the segmentationaccuracy as a baseline. For noise-inserted images, the pro-posed algorithm achieves 6.79%–14.73% (GM) and 6.42%–17.03% (WM) improvements in the segmentation accuracy,which is significant in the field of image segmentation fordiagnosis purpose.
4. Conclusions
This paper presented a hybrid medical image segmentationtechnique. In the preprocessing step, we utilized vectormedian filtering to reduce the influence of noise. We thenproduced rough-segmented images using the Otsu thresh-olding method. To obtain well-segmented images, we finallyused the enhanced suppressed FCM algorithm of the pro-posed approach. To match the perfect clustering of the givendata set, we defined a new exponential function to automati-cally select the suppression factor for the suppressed FCM.To evaluate the robustness of the proposed segmentationapproach in noisy environment, we added different typesof noise and different amount of noise to the T1-weightedbrain MR image and calculated the segmentation accuracy.Experimental results showed that the proposed methodoutperforms other FCM-based algorithms in terms of seg-mentation accuracy for both noise-free and noise-insertedimages.
Acknowledgments
This work was supported by the National Research Founda-tion of Korea (NRF) grant funded by the Korean government(MEST) (no. 2012-000496, 2012-0001727).
References
[1] R. Gonzalez and R. Woods, Digital Image Processing, Prentice-Hall, Upper Saddle River, NJ, USA, 2nd edition, 2002.
[2] K. S. Fu and J. K. Mui, “A survey on image segmentation,”Pattern Recognition, vol. 13, no. 1, pp. 3–16, 1981.
[3] D. Jayadevappa, S. Srinivas Kumar, and D. S. Murthy, “AHybrid segmentation model based on watershed and gradientvector flow for the detection of Brain tumor,” InternationalJournal of Signal Processing, Image Processing and PatternRecognition, vol. 2, no. 3, pp. 29–42, 2009.
[4] H. S. Prasantha, H. L. Shashidhara, K. N. B. Murthy, and L. G.Madhavi, “Medical image segmentation,” International Jour-nal on Computer Science and Engineering, vol. 2, no. 4, pp.1209–1218, 2010.
[5] Z. K. Huang, Y. M. Xie, D. H. Liu, and L. Y. Hou, “Using fuzzyc-means cluster for histogram-based color image segmenta-tion,” in Proceedings of the International Conference on Infor-mation Technology and Computer Science (ITCS ’09), pp. 597–600, July 2009.
[6] N. Otsu, “A Threshold selecting method from gray-level his-tograms,” IEEE Transactions on Systems, Man, and Cybernetics,vol. 9, no. 1, pp. 62–66, 1979.
[7] M. Tabakov, “A fuzzy clustering technique for medical imagesegmentation,” in Proceedings of the International Symposiumon Evolving Fuzzy Systems (EFS ’06), pp. 118–122, September2006.
[8] J. C. Dunn, “A fuzzy relative of the ISODATA process and itsuse in detecting compact well-separated clusters,” Journal ofCybernetics, vol. 3, no. 3, pp. 32–57, 1973.
[9] J. C. Bezdek, Pattern Recognition With Fuzzy Objective FunctionAlgorithms, Advanced Applications in Pattern Recognition,Springer, Berlin, Germany, 1981.
[10] J. L. Fan, W. Z. Zhen, and W. X. Xie, “Suppressed fuzzy c-means clustering algorithm,” Pattern Recognition Letters, vol.24, no. 9-10, pp. 1607–1612, 2003.
[11] W. L. Hung, M. S. Yang, and D. H. Chen, “Parameter selectionfor suppressed fuzzy c-means with an application to MRIsegmentation,” Pattern Recognition Letters, vol. 27, no. 5, pp.424–438, 2006.
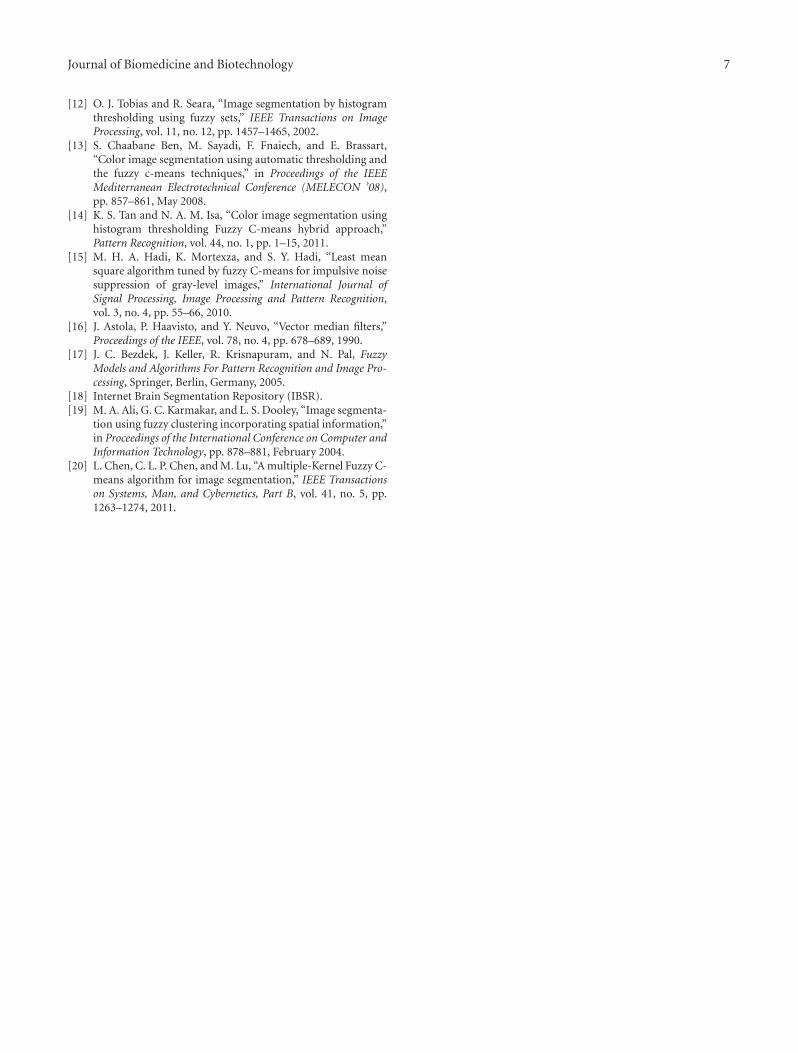
Journal of Biomedicine and Biotechnology 7
[12] O. J. Tobias and R. Seara, “Image segmentation by histogramthresholding using fuzzy sets,” IEEE Transactions on ImageProcessing, vol. 11, no. 12, pp. 1457–1465, 2002.
[13] S. Chaabane Ben, M. Sayadi, F. Fnaiech, and E. Brassart,“Color image segmentation using automatic thresholding andthe fuzzy c-means techniques,” in Proceedings of the IEEEMediterranean Electrotechnical Conference (MELECON ’08),pp. 857–861, May 2008.
[14] K. S. Tan and N. A. M. Isa, “Color image segmentation usinghistogram thresholding Fuzzy C-means hybrid approach,”Pattern Recognition, vol. 44, no. 1, pp. 1–15, 2011.
[15] M. H. A. Hadi, K. Mortexza, and S. Y. Hadi, “Least meansquare algorithm tuned by fuzzy C-means for impulsive noisesuppression of gray-level images,” International Journal ofSignal Processing, Image Processing and Pattern Recognition,vol. 3, no. 4, pp. 55–66, 2010.
[16] J. Astola, P. Haavisto, and Y. Neuvo, “Vector median filters,”Proceedings of the IEEE, vol. 78, no. 4, pp. 678–689, 1990.
[17] J. C. Bezdek, J. Keller, R. Krisnapuram, and N. Pal, FuzzyModels and Algorithms For Pattern Recognition and Image Pro-cessing, Springer, Berlin, Germany, 2005.
[18] Internet Brain Segmentation Repository (IBSR).[19] M. A. Ali, G. C. Karmakar, and L. S. Dooley, “Image segmenta-
tion using fuzzy clustering incorporating spatial information,”in Proceedings of the International Conference on Computer andInformation Technology, pp. 878–881, February 2004.
[20] L. Chen, C. L. P. Chen, and M. Lu, “A multiple-Kernel Fuzzy C-means algorithm for image segmentation,” IEEE Transactionson Systems, Man, and Cybernetics, Part B, vol. 41, no. 5, pp.1263–1274, 2011.

Hindawi Publishing CorporationJournal of Biomedicine and BiotechnologyVolume 2012, Article ID 381493, 10 pagesdoi:10.1155/2012/381493
Research Article
Construction of a Smart Medication Dispenser with High Degreeof Scalability and Remote Manageability
JuGeon Pak and KeeHyun Park
Computer Engineering Department, Keimyung University, Sindang-dong, Dalseo-gu, Daegu 704-701, Republic of Korea
Correspondence should be addressed to KeeHyun Park, [email protected]
Received 24 May 2012; Revised 2 June 2012; Accepted 2 June 2012
Academic Editor: Sabah Mohammed
Copyright © 2012 J. Pak and K. Park. This is an open access article distributed under the Creative Commons Attribution License,which permits unrestricted use, distribution, and reproduction in any medium, provided the original work is properly cited.
We propose a smart medication dispenser having a high degree of scalability and remote manageability. We construct the dispenserto have extensible hardware architecture for achieving scalability, and we install an agent program in it for achieving remotemanageability. The dispenser operates as follows: when the real-time clock reaches the predetermined medication time and theuser presses the dispense button at that time, the predetermined medication is dispensed from the medication dispensing tray(MDT). In the proposed dispenser, the medication for each patient is stored in an MDT. One smart medication dispenser containsmainly one MDT; however, the dispenser can be extended to include more MDTs in order to support multiple users using onedispenser. For remote management, the proposed dispenser transmits the medication status and the system configurations to themonitoring server. In the case of a specific event such as a shortage of medication, memory overload, software error, or non-adherence, the event is transmitted immediately. All these operations are performed automatically without the intervention ofpatients, through the agent program installed in the dispenser. Results of implementation and verification show that the proposeddispenser operates normally and performs the management operations from the medication monitoring server suitably.
1. Introduction
Medication nonadherence is a serious public health issuewith the increase in chronic diseases [1–3]. To improvepatient adherence, medication dispensers are often proposed[4–8]. A medication dispenser is a device that delivers medi-cation to the patient according to predetermined schedules; itis considered a very efficient device of improving medicationadherence [9–12].
However, there is some room for improvement in theexisting medication dispensers. (1) Most existing medicationdispensers are designed to support only a single user andhave a low degree of scalability. Thus, the assignment ofone medication dispenser to each patient would increasethe operation costs. (2) A correct medication schedule andsystem settings should be preconfigured in a medicationdispenser. However, most existing medication dispensersrequire users to configure the schedule and settings manually.This leads to inconvenience and errors due to mistyping.(3) An error in a medication dispenser can have fatal
consequences. Nonetheless, existing medication dispensersare not equipped with remote device management functions.Therefore, users must manage their medication dispenser bythemselves.
Moreover, considering that users of medication dis-pensers are typically in the older age group or are mostlypatients with chronic diseases, important investigationsshould be carried out for achieving the improvementsmentioned above.
In this paper, a smart medication dispenser with a highdegree of scalability and remote manageability is proposedand constructed. The proposed smart medication dispenserallows multiple users to use a single medication dispenser,thus providing scalability to the device. It also allows medicalstaff and system administrators, instead of end users, tomanage medication dispensers, thus leading to cost efficiencyand safe operation of the device. Medications for each patientare stored in a medication cartridge and a cartridge isplaced in a Medication dispenser tray (MDT). One smartmedication dispenser has basically one MDT, but it can be
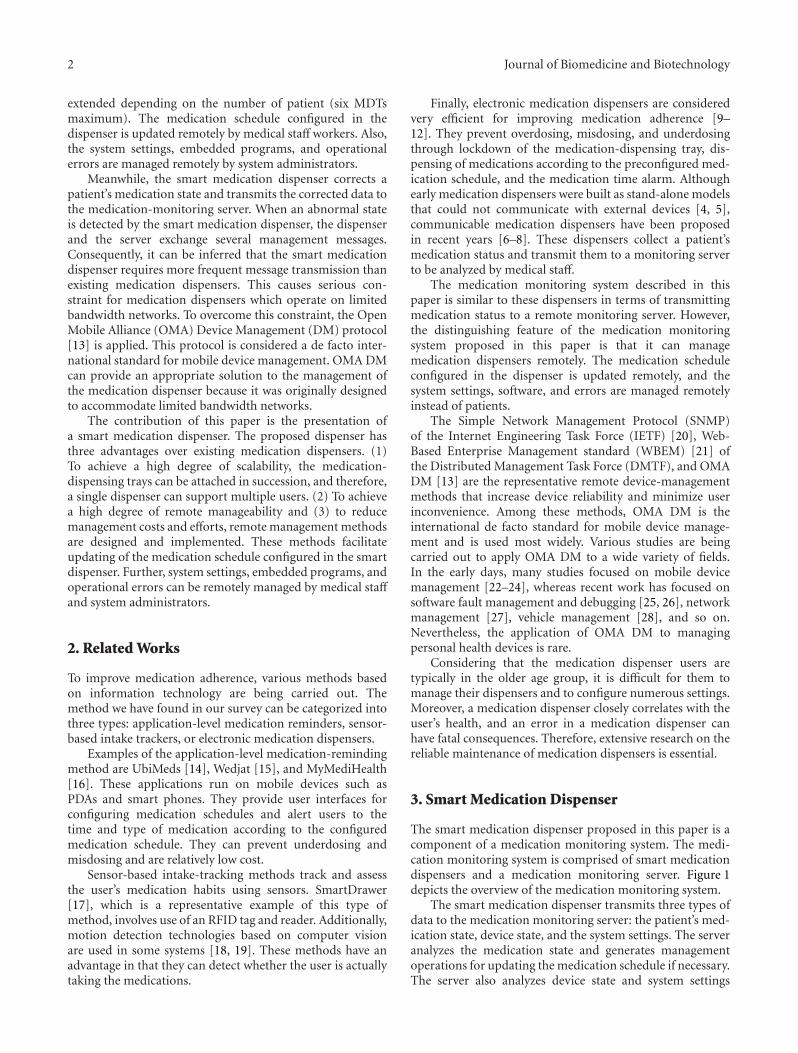
2 Journal of Biomedicine and Biotechnology
extended depending on the number of patient (six MDTsmaximum). The medication schedule configured in thedispenser is updated remotely by medical staff workers. Also,the system settings, embedded programs, and operationalerrors are managed remotely by system administrators.
Meanwhile, the smart medication dispenser corrects apatient’s medication state and transmits the corrected data tothe medication-monitoring server. When an abnormal stateis detected by the smart medication dispenser, the dispenserand the server exchange several management messages.Consequently, it can be inferred that the smart medicationdispenser requires more frequent message transmission thanexisting medication dispensers. This causes serious con-straint for medication dispensers which operate on limitedbandwidth networks. To overcome this constraint, the OpenMobile Alliance (OMA) Device Management (DM) protocol[13] is applied. This protocol is considered a de facto inter-national standard for mobile device management. OMA DMcan provide an appropriate solution to the management ofthe medication dispenser because it was originally designedto accommodate limited bandwidth networks.
The contribution of this paper is the presentation ofa smart medication dispenser. The proposed dispenser hasthree advantages over existing medication dispensers. (1)To achieve a high degree of scalability, the medication-dispensing trays can be attached in succession, and therefore,a single dispenser can support multiple users. (2) To achievea high degree of remote manageability and (3) to reducemanagement costs and efforts, remote management methodsare designed and implemented. These methods facilitateupdating of the medication schedule configured in the smartdispenser. Further, system settings, embedded programs, andoperational errors can be remotely managed by medical staffand system administrators.
2. Related Works
To improve medication adherence, various methods basedon information technology are being carried out. Themethod we have found in our survey can be categorized intothree types: application-level medication reminders, sensor-based intake trackers, or electronic medication dispensers.
Examples of the application-level medication-remindingmethod are UbiMeds [14], Wedjat [15], and MyMediHealth[16]. These applications run on mobile devices such asPDAs and smart phones. They provide user interfaces forconfiguring medication schedules and alert users to thetime and type of medication according to the configuredmedication schedule. They can prevent underdosing andmisdosing and are relatively low cost.
Sensor-based intake-tracking methods track and assessthe user’s medication habits using sensors. SmartDrawer[17], which is a representative example of this type ofmethod, involves use of an RFID tag and reader. Additionally,motion detection technologies based on computer visionare used in some systems [18, 19]. These methods have anadvantage in that they can detect whether the user is actuallytaking the medications.
Finally, electronic medication dispensers are consideredvery efficient for improving medication adherence [9–12]. They prevent overdosing, misdosing, and underdosingthrough lockdown of the medication-dispensing tray, dis-pensing of medications according to the preconfigured med-ication schedule, and the medication time alarm. Althoughearly medication dispensers were built as stand-alone modelsthat could not communicate with external devices [4, 5],communicable medication dispensers have been proposedin recent years [6–8]. These dispensers collect a patient’smedication status and transmit them to a monitoring serverto be analyzed by medical staff.
The medication monitoring system described in thispaper is similar to these dispensers in terms of transmittingmedication status to a remote monitoring server. However,the distinguishing feature of the medication monitoringsystem proposed in this paper is that it can managemedication dispensers remotely. The medication scheduleconfigured in the dispenser is updated remotely, and thesystem settings, software, and errors are managed remotelyinstead of patients.
The Simple Network Management Protocol (SNMP)of the Internet Engineering Task Force (IETF) [20], Web-Based Enterprise Management standard (WBEM) [21] ofthe Distributed Management Task Force (DMTF), and OMADM [13] are the representative remote device-managementmethods that increase device reliability and minimize userinconvenience. Among these methods, OMA DM is theinternational de facto standard for mobile device manage-ment and is used most widely. Various studies are beingcarried out to apply OMA DM to a wide variety of fields.In the early days, many studies focused on mobile devicemanagement [22–24], whereas recent work has focused onsoftware fault management and debugging [25, 26], networkmanagement [27], vehicle management [28], and so on.Nevertheless, the application of OMA DM to managingpersonal health devices is rare.
Considering that the medication dispenser users aretypically in the older age group, it is difficult for them tomanage their dispensers and to configure numerous settings.Moreover, a medication dispenser closely correlates with theuser’s health, and an error in a medication dispenser canhave fatal consequences. Therefore, extensive research on thereliable maintenance of medication dispensers is essential.
3. Smart Medication Dispenser
The smart medication dispenser proposed in this paper is acomponent of a medication monitoring system. The medi-cation monitoring system is comprised of smart medicationdispensers and a medication monitoring server. Figure 1depicts the overview of the medication monitoring system.
The smart medication dispenser transmits three types ofdata to the medication monitoring server: the patient’s med-ication state, device state, and the system settings. The serveranalyzes the medication state and generates managementoperations for updating the medication schedule if necessary.The server also analyzes device state and system settings
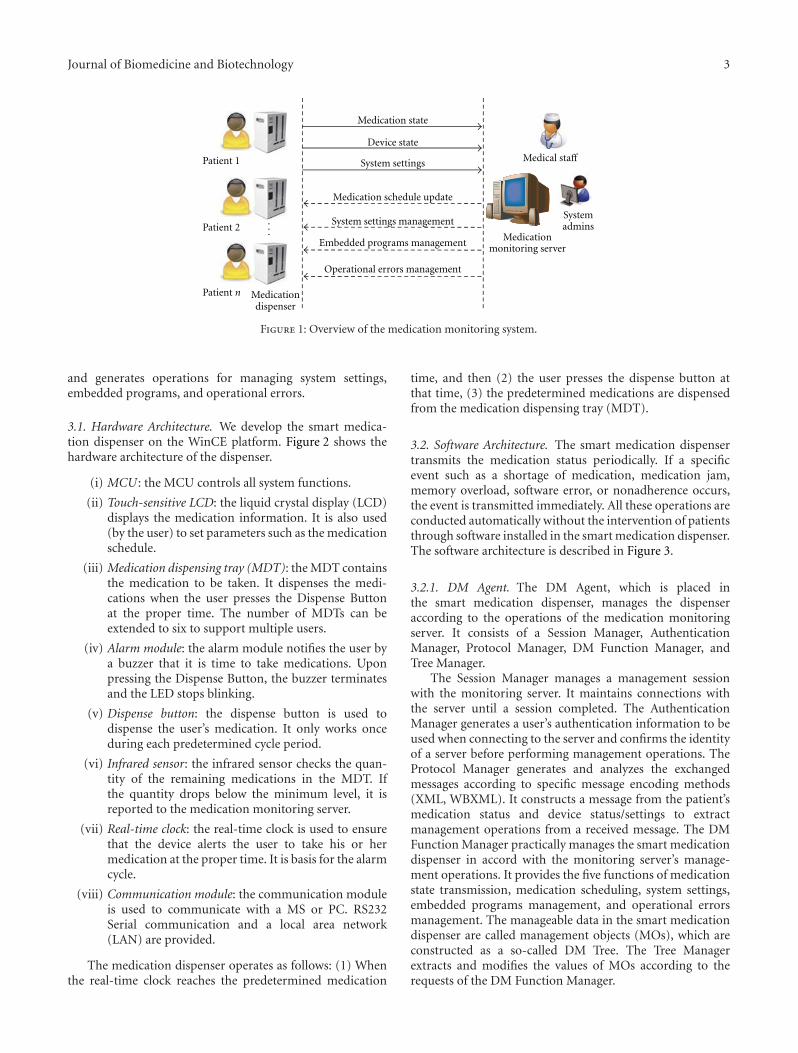
Journal of Biomedicine and Biotechnology 3
...
Medication state
System settings
Medication schedule update
System settings management
Embedded programs management
Operational errors management
Medical staff
Patient n
Patient 2
Patient 1
Device state
Medicationmonitoring server
Systemadmins
Medicationdispenser
Figure 1: Overview of the medication monitoring system.
and generates operations for managing system settings,embedded programs, and operational errors.
3.1. Hardware Architecture. We develop the smart medica-tion dispenser on the WinCE platform. Figure 2 shows thehardware architecture of the dispenser.
(i) MCU : the MCU controls all system functions.
(ii) Touch-sensitive LCD: the liquid crystal display (LCD)displays the medication information. It is also used(by the user) to set parameters such as the medicationschedule.
(iii) Medication dispensing tray (MDT): the MDT containsthe medication to be taken. It dispenses the medi-cations when the user presses the Dispense Buttonat the proper time. The number of MDTs can beextended to six to support multiple users.
(iv) Alarm module: the alarm module notifies the user bya buzzer that it is time to take medications. Uponpressing the Dispense Button, the buzzer terminatesand the LED stops blinking.
(v) Dispense button: the dispense button is used todispense the user’s medication. It only works onceduring each predetermined cycle period.
(vi) Infrared sensor: the infrared sensor checks the quan-tity of the remaining medications in the MDT. Ifthe quantity drops below the minimum level, it isreported to the medication monitoring server.
(vii) Real-time clock: the real-time clock is used to ensurethat the device alerts the user to take his or hermedication at the proper time. It is basis for the alarmcycle.
(viii) Communication module: the communication moduleis used to communicate with a MS or PC. RS232Serial communication and a local area network(LAN) are provided.
The medication dispenser operates as follows: (1) Whenthe real-time clock reaches the predetermined medication
time, and then (2) the user presses the dispense button atthat time, (3) the predetermined medications are dispensedfrom the medication dispensing tray (MDT).
3.2. Software Architecture. The smart medication dispensertransmits the medication status periodically. If a specificevent such as a shortage of medication, medication jam,memory overload, software error, or nonadherence occurs,the event is transmitted immediately. All these operations areconducted automatically without the intervention of patientsthrough software installed in the smart medication dispenser.The software architecture is described in Figure 3.
3.2.1. DM Agent. The DM Agent, which is placed inthe smart medication dispenser, manages the dispenseraccording to the operations of the medication monitoringserver. It consists of a Session Manager, AuthenticationManager, Protocol Manager, DM Function Manager, andTree Manager.
The Session Manager manages a management sessionwith the monitoring server. It maintains connections withthe server until a session completed. The AuthenticationManager generates a user’s authentication information to beused when connecting to the server and confirms the identityof a server before performing management operations. TheProtocol Manager generates and analyzes the exchangedmessages according to specific message encoding methods(XML, WBXML). It constructs a message from the patient’smedication status and device status/settings to extractmanagement operations from a received message. The DMFunction Manager practically manages the smart medicationdispenser in accord with the monitoring server’s manage-ment operations. It provides the five functions of medicationstate transmission, medication scheduling, system settings,embedded programs management, and operational errorsmanagement. The manageable data in the smart medicationdispenser are called management objects (MOs), which areconstructed as a so-called DM Tree. The Tree Managerextracts and modifies the values of MOs according to therequests of the DM Function Manager.
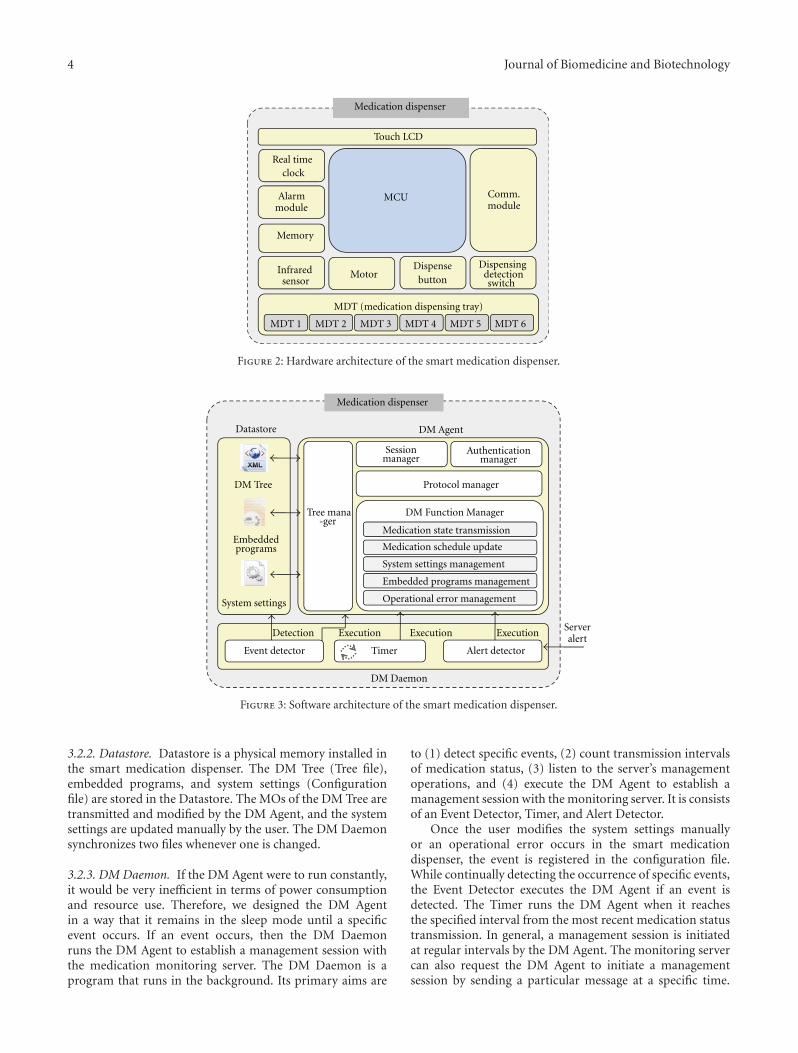
4 Journal of Biomedicine and Biotechnology
Touch LCD
MCU Comm.module
MDT 1 MDT 2 MDT 3 MDT 4 MDT 5 MDT 6
Medication dispenser
Real time
Memory
MotorDispensebutton
Dispensing
MDT (medication dispensing tray)
Infrared
Alarm
clock
detectionsensor
module
switch
Figure 2: Hardware architecture of the smart medication dispenser.
DM Agent
DM Function Manager
DM Daemon
Datastore
DM Tree
Timer
Medication dispenser
Detection Execution Execution Execution
Authenticationmanager
Sessionmanager
System settings management
Embedded programs management
Operational error management
Medication schedule update
Medication state transmission
Tree mana-ger
Embeddedprograms
System settings
Alert detectorEvent detector
Serveralert
Protocol manager
Figure 3: Software architecture of the smart medication dispenser.
3.2.2. Datastore. Datastore is a physical memory installed inthe smart medication dispenser. The DM Tree (Tree file),embedded programs, and system settings (Configurationfile) are stored in the Datastore. The MOs of the DM Tree aretransmitted and modified by the DM Agent, and the systemsettings are updated manually by the user. The DM Daemonsynchronizes two files whenever one is changed.
3.2.3. DM Daemon. If the DM Agent were to run constantly,it would be very inefficient in terms of power consumptionand resource use. Therefore, we designed the DM Agentin a way that it remains in the sleep mode until a specificevent occurs. If an event occurs, then the DM Daemonruns the DM Agent to establish a management session withthe medication monitoring server. The DM Daemon is aprogram that runs in the background. Its primary aims are
to (1) detect specific events, (2) count transmission intervalsof medication status, (3) listen to the server’s managementoperations, and (4) execute the DM Agent to establish amanagement session with the monitoring server. It is consistsof an Event Detector, Timer, and Alert Detector.
Once the user modifies the system settings manuallyor an operational error occurs in the smart medicationdispenser, the event is registered in the configuration file.While continually detecting the occurrence of specific events,the Event Detector executes the DM Agent if an event isdetected. The Timer runs the DM Agent when it reachesthe specified interval from the most recent medication statustransmission. In general, a management session is initiatedat regular intervals by the DM Agent. The monitoring servercan also request the DM Agent to initiate a managementsession by sending a particular message at a specific time.
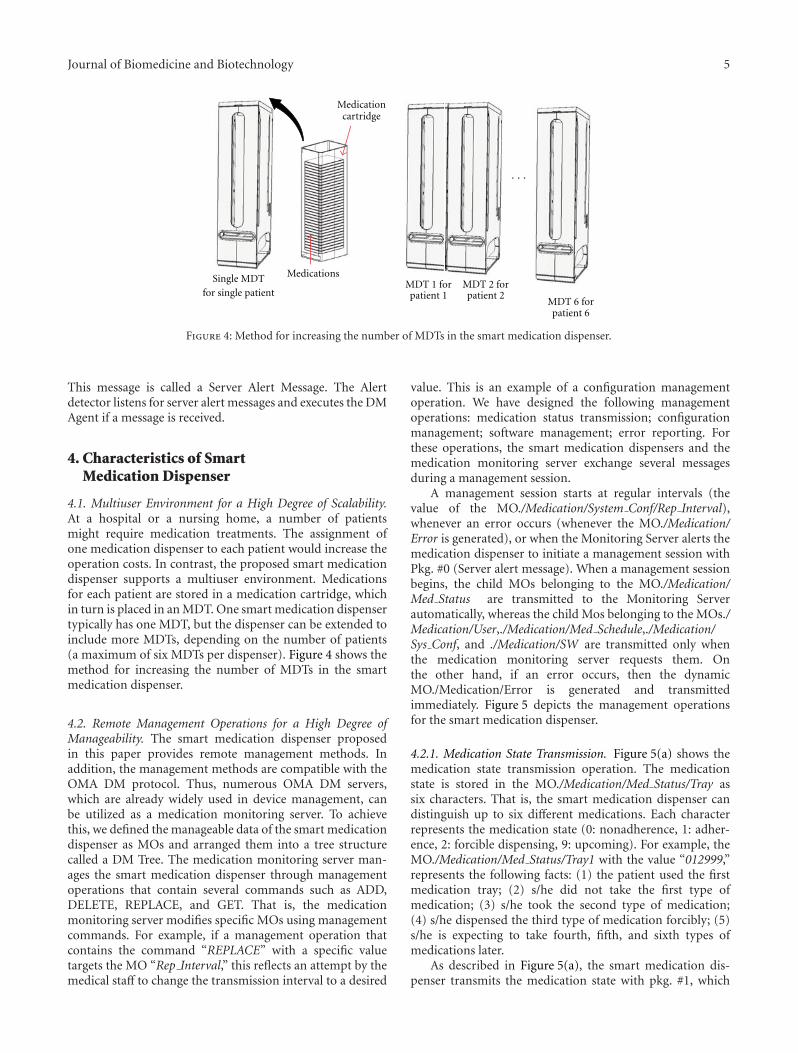
Journal of Biomedicine and Biotechnology 5
· · ·
Single MDTfor single patient
Medications
Medicationcartridge
MDT 1 for MDT 2 for
MDT 6 forpatient 1 patient 2
patient 6
Figure 4: Method for increasing the number of MDTs in the smart medication dispenser.
This message is called a Server Alert Message. The Alertdetector listens for server alert messages and executes the DMAgent if a message is received.
4. Characteristics of SmartMedication Dispenser
4.1. Multiuser Environment for a High Degree of Scalability.At a hospital or a nursing home, a number of patientsmight require medication treatments. The assignment ofone medication dispenser to each patient would increase theoperation costs. In contrast, the proposed smart medicationdispenser supports a multiuser environment. Medicationsfor each patient are stored in a medication cartridge, whichin turn is placed in an MDT. One smart medication dispensertypically has one MDT, but the dispenser can be extended toinclude more MDTs, depending on the number of patients(a maximum of six MDTs per dispenser). Figure 4 shows themethod for increasing the number of MDTs in the smartmedication dispenser.
4.2. Remote Management Operations for a High Degree ofManageability. The smart medication dispenser proposedin this paper provides remote management methods. Inaddition, the management methods are compatible with theOMA DM protocol. Thus, numerous OMA DM servers,which are already widely used in device management, canbe utilized as a medication monitoring server. To achievethis, we defined the manageable data of the smart medicationdispenser as MOs and arranged them into a tree structurecalled a DM Tree. The medication monitoring server man-ages the smart medication dispenser through managementoperations that contain several commands such as ADD,DELETE, REPLACE, and GET. That is, the medicationmonitoring server modifies specific MOs using managementcommands. For example, if a management operation thatcontains the command “REPLACE” with a specific valuetargets the MO “Rep Interval,” this reflects an attempt by themedical staff to change the transmission interval to a desired
value. This is an example of a configuration managementoperation. We have designed the following managementoperations: medication status transmission; configurationmanagement; software management; error reporting. Forthese operations, the smart medication dispensers and themedication monitoring server exchange several messagesduring a management session.
A management session starts at regular intervals (thevalue of the MO./Medication/System Conf/Rep Interval),whenever an error occurs (whenever the MO./Medication/Error is generated), or when the Monitoring Server alerts themedication dispenser to initiate a management session withPkg. #0 (Server alert message). When a management sessionbegins, the child MOs belonging to the MO./Medication/Med Status are transmitted to the Monitoring Serverautomatically, whereas the child Mos belonging to the MOs./Medication/User,./Medication/Med Schedule,./Medication/Sys Conf, and ./Medication/SW are transmitted only whenthe medication monitoring server requests them. Onthe other hand, if an error occurs, then the dynamicMO./Medication/Error is generated and transmittedimmediately. Figure 5 depicts the management operationsfor the smart medication dispenser.
4.2.1. Medication State Transmission. Figure 5(a) shows themedication state transmission operation. The medicationstate is stored in the MO./Medication/Med Status/Tray assix characters. That is, the smart medication dispenser candistinguish up to six different medications. Each characterrepresents the medication state (0: nonadherence, 1: adher-ence, 2: forcible dispensing, 9: upcoming). For example, theMO./Medication/Med Status/Tray1 with the value “012999,”represents the following facts: (1) the patient used the firstmedication tray; (2) s/he did not take the first type ofmedication; (3) s/he took the second type of medication;(4) s/he dispensed the third type of medication forcibly; (5)s/he is expecting to take fourth, fifth, and sixth types ofmedications later.
As described in Figure 5(a), the smart medication dis-penser transmits the medication state with pkg. #1, which
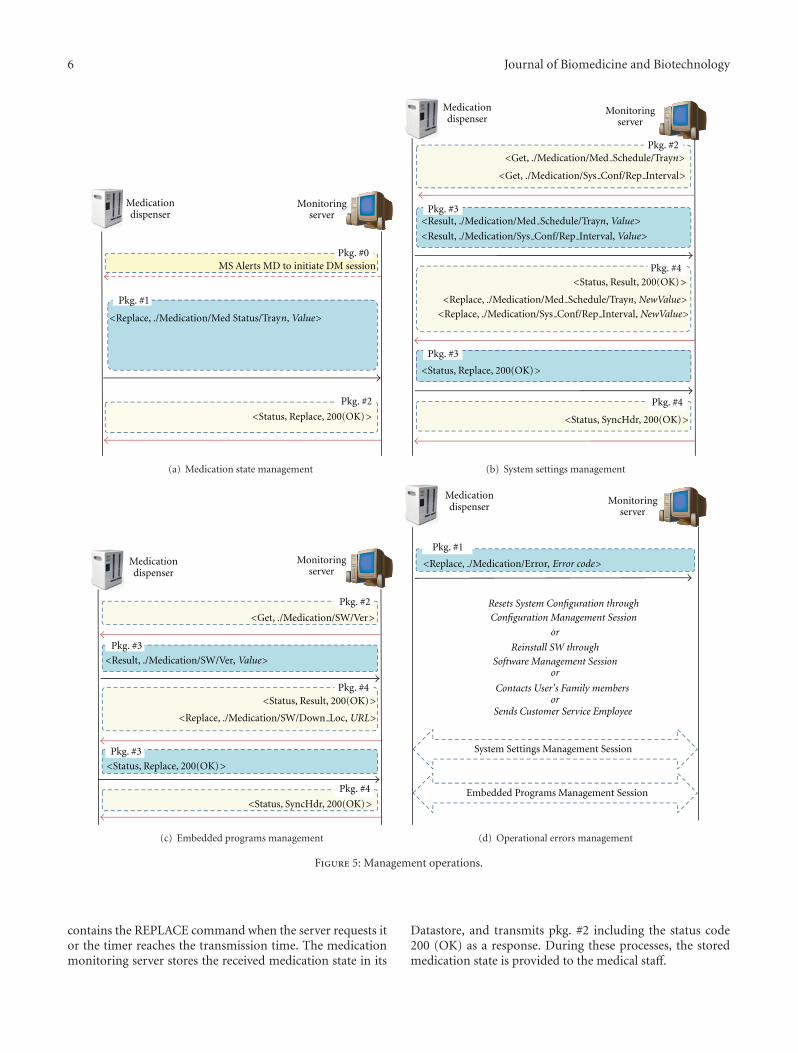
6 Journal of Biomedicine and Biotechnology
MS Alerts MD to initiate DM session
<Status, Replace, 200(OK)>
Medicationdispenser
Monitoringserver
Pkg. #0
Pkg. #1
Pkg. #2
<Replace, ./Medication/Med Status/Trayn, Value>
(a) Medication state management
Medicationdispenser
Monitoringserver
<Result, ./Medication/Sys Conf/Rep Interval, Value>
<Get, ./Medication/Sys Conf/Rep Interval>
Pkg. #3
Pkg. #4<Status, Result, 200(OK)>
Pkg. #2
Pkg. #3
<Status, Replace, 200(OK)>
Pkg. #4
<Replace, ./Medication/Sys Conf/Rep Interval, NewValue>
<Status, SyncHdr, 200(OK)>
<Get, ./Medication/Med Schedule/Trayn>
<Result, ./Medication/Med Schedule/Trayn, Value>
<Replace, ./Medication/Med Schedule/Trayn, NewValue>
(b) System settings management
Medicationdispenser
Monitoringserver
<Result, ./Medication/SW/Ver, Value>
<Get, ./Medication/SW/Ver>
<Status, Result, 200(OK)>
<Status, Replace, 200(OK)>
Pkg. #3
Pkg. #4
Pkg. #2
Pkg. #3
Pkg. #4
<Status, SyncHdr, 200(OK)>
<Replace, ./Medication/SW/Down Loc, URL>
(c) Embedded programs management
Medicationdispenser
Monitoringserver
Pkg. #1
Resets System Configuration throughConfiguration Management Session
or
Reinstall SW throughSoftware Management Session
or
or
System Settings Management Session
Embedded Programs Management Session
<Replace, ./Medication/Error, Error code>
Sends Customer Service Employee
Contacts User's Family members
(d) Operational errors management
Figure 5: Management operations.
contains the REPLACE command when the server requests itor the timer reaches the transmission time. The medicationmonitoring server stores the received medication state in its
Datastore, and transmits pkg. #2 including the status code200 (OK) as a response. During these processes, the storedmedication state is provided to the medical staff.
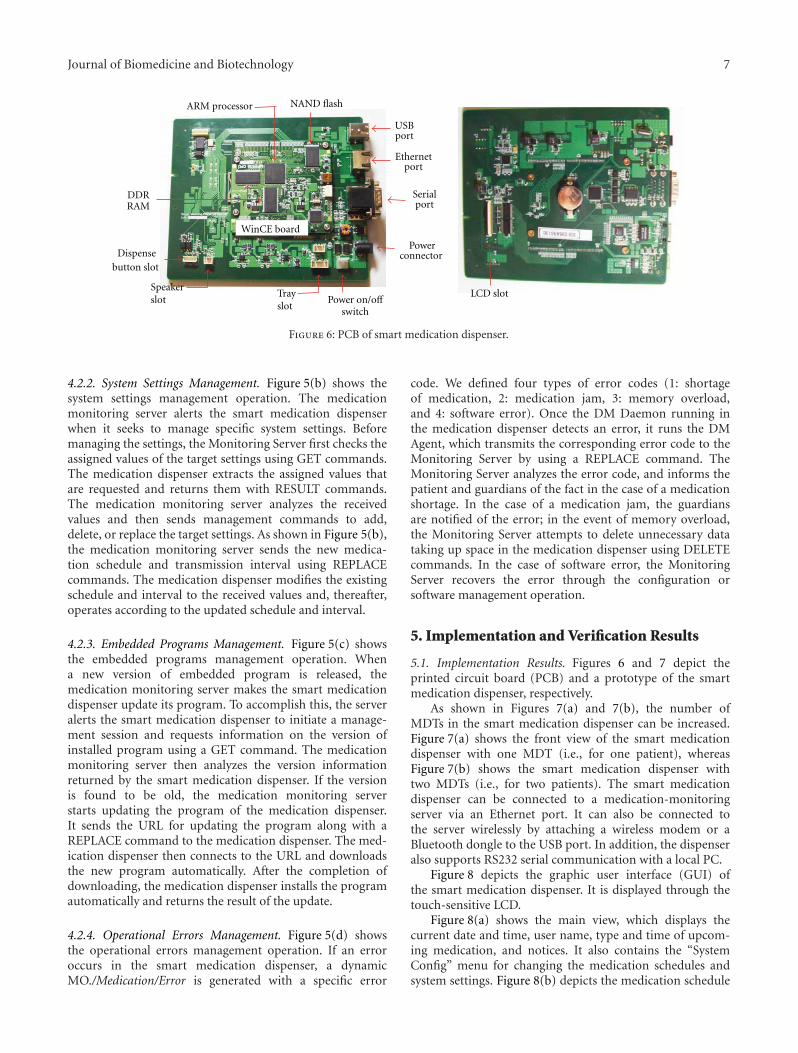
Journal of Biomedicine and Biotechnology 7
ARM processor
DDRRAM
NAND flash
USBport
Ethernetport
Serialport
Powerconnector
Power on/offswitch
Trayslot
Speakerslot
Dispensebutton slot
LCD slot
WinCE board
Figure 6: PCB of smart medication dispenser.
4.2.2. System Settings Management. Figure 5(b) shows thesystem settings management operation. The medicationmonitoring server alerts the smart medication dispenserwhen it seeks to manage specific system settings. Beforemanaging the settings, the Monitoring Server first checks theassigned values of the target settings using GET commands.The medication dispenser extracts the assigned values thatare requested and returns them with RESULT commands.The medication monitoring server analyzes the receivedvalues and then sends management commands to add,delete, or replace the target settings. As shown in Figure 5(b),the medication monitoring server sends the new medica-tion schedule and transmission interval using REPLACEcommands. The medication dispenser modifies the existingschedule and interval to the received values and, thereafter,operates according to the updated schedule and interval.
4.2.3. Embedded Programs Management. Figure 5(c) showsthe embedded programs management operation. Whena new version of embedded program is released, themedication monitoring server makes the smart medicationdispenser update its program. To accomplish this, the serveralerts the smart medication dispenser to initiate a manage-ment session and requests information on the version ofinstalled program using a GET command. The medicationmonitoring server then analyzes the version informationreturned by the smart medication dispenser. If the versionis found to be old, the medication monitoring serverstarts updating the program of the medication dispenser.It sends the URL for updating the program along with aREPLACE command to the medication dispenser. The med-ication dispenser then connects to the URL and downloadsthe new program automatically. After the completion ofdownloading, the medication dispenser installs the programautomatically and returns the result of the update.
4.2.4. Operational Errors Management. Figure 5(d) showsthe operational errors management operation. If an erroroccurs in the smart medication dispenser, a dynamicMO./Medication/Error is generated with a specific error
code. We defined four types of error codes (1: shortageof medication, 2: medication jam, 3: memory overload,and 4: software error). Once the DM Daemon running inthe medication dispenser detects an error, it runs the DMAgent, which transmits the corresponding error code to theMonitoring Server by using a REPLACE command. TheMonitoring Server analyzes the error code, and informs thepatient and guardians of the fact in the case of a medicationshortage. In the case of a medication jam, the guardiansare notified of the error; in the event of memory overload,the Monitoring Server attempts to delete unnecessary datataking up space in the medication dispenser using DELETEcommands. In the case of software error, the MonitoringServer recovers the error through the configuration orsoftware management operation.
5. Implementation and Verification Results
5.1. Implementation Results. Figures 6 and 7 depict theprinted circuit board (PCB) and a prototype of the smartmedication dispenser, respectively.
As shown in Figures 7(a) and 7(b), the number ofMDTs in the smart medication dispenser can be increased.Figure 7(a) shows the front view of the smart medicationdispenser with one MDT (i.e., for one patient), whereasFigure 7(b) shows the smart medication dispenser withtwo MDTs (i.e., for two patients). The smart medicationdispenser can be connected to a medication-monitoringserver via an Ethernet port. It can also be connected tothe server wirelessly by attaching a wireless modem or aBluetooth dongle to the USB port. In addition, the dispenseralso supports RS232 serial communication with a local PC.
Figure 8 depicts the graphic user interface (GUI) ofthe smart medication dispenser. It is displayed through thetouch-sensitive LCD.
Figure 8(a) shows the main view, which displays thecurrent date and time, user name, type and time of upcom-ing medication, and notices. It also contains the “SystemConfig” menu for changing the medication schedules andsystem settings. Figure 8(b) depicts the medication schedule

8 Journal of Biomedicine and Biotechnology
Dispense button
Touch LCD
Speaker
Medication outlet
MDT
(a) Front side with oneMDT
(b) Front side with twoMDTs
USB port
RS232 portPower switch
Powerconnector
Ethernet port
(c) Back side
Figure 7: Prototype of smart medication dispenser.
(a) Main GUI (b) Medication Schedule GUI (c) DM Agent GUI
Figure 8: Smart medication dispenser GUI.
GUI. The user can check the configured schedules andchange them through the touch-sensitive LCD. Figure 8(c)represents the DM Agent GUI. The user can change thesettings related to the Monitoring Server such as its IPaddress, port number, and authentication method throughthis GUI. The smart medication dispenser supports twotypes of authentication: BASIC and MD5. The GUI alsocontains the “Session Start” menu, which allows the user toinitiate a management session manually, and the “Tree view”menu to check the DM Tree and MOs. These programsare implemented in C# and the sizes of the firmware, DMAgent, and DM Daemon were 3.62 MB, 152 KB, and 40 KB,respectively.
5.2. Verification Results. To verify the typical operation ofthe proposed medication dispenser, the Funambol server[29] based on the OMA DM protocol is used as a centralDM server. The server provides the Web-based interface
for generating management commands. First, we verify thesystem settings management operation as shown in Figure 9.
The figures on the left show the screen of the medicationdispenser, and those on the right show the screen of theFunambol DM server. In Figure 9(a), the medicationschedule is configured as Type 0: 08:30 AM, Type 1:10:00 AM, Type 2: 01:30 PM, Type 3: 06:30 PM, and Type 4:10:30 PM. To modify the schedule, the server generatesthe following management command: <REPLACE,./Med-ication/TAKE/CH1,0070010900212003190042100>. Thiscommand replaces the values of the node./Medication/TAKE/CH1 (i.e., the medication schedule) with thefollowing new values: Type 0: 07:00 AM, Type 1: 09:00 AM,Type 2: 12:00 PM, Type 3: 07:00 PM, and Type 4: 09:00 PM.In Figure 9(b), the medication schedule configured on themedication dispenser is updated suitably. In addition, theagent programs return status code 200 (OK) according tothe server’s UI.

Journal of Biomedicine and Biotechnology 9
(a) Medication schedule with initial settings (b) Medication schedule with changed settings
Figure 9: Example of system settings management operations.
(a) Old version of UI software of medication dispenser (b) Download and install progresses of new version of UI software
Figure 10: Example of embedded programs management operations
Next, we verify the embedded programs manage-ment operations as shown in Figure 10. As shown inFigure 10(a), the old version of the UI software isinstalled in the medication dispenser. Before updatingthe software, the server generates the following manage-ment command: <REPLACE,./Medication/SW/DownURL,http://210.125.31.70/client.exe>. This command initiates thedownload of a new version of the UI software from theURL, and installs the downloaded software. Figure 10(b)shows that the agent program downloads the UI software,and installs the new version of the UI software according tothe server’s command. Based on the figure, the UI softwareinstalled on the medication dispenser is updated suitably. Inaddition, the agent programs return status code 200 (OK)according to the server’s UI.
From these figures, we can verify that the medicationdispenser performs the server’s management operations, andthe dispenser conforms to the OMA DM protocol.
6. Conclusion and Future Work
In this paper, we have proposed the smart medication dis-penser to overcome the problems of existing medication dis-pensers, such as their nonexpandability, inconvenience, lowreliability, and communication inefficiency. The proposeddispenser has three advantages over existing medicationdispensers. (1) To achieve a high degree of scalability, themedication-dispensing trays can be attached in succession,and therefore, a single dispenser can support multiple users.(2) To achieve a high degree of remote manageability and(3) to reduce management costs and efforts, remote manage-ment methods are designed and implemented. These meth-ods facilitate updating of the medication schedule configured
in the smart dispenser. Further, system settings, embeddedprograms, and operational errors can be remotely managedby medical staff and system administrators. Results ofimplementation and verification showed that the proposeddispenser operates normally and performs the managementoperations from the medication monitoring server suitably.
The smart medication dispenser can be used to improvemedication adherence. It prevents overdosing, misdosing,and underdosing. However, it cannot prevent voluntarynonadherence, such as pretending to take medication orspitting it out afterwards. For future work, we plan to developadditional functions that detect a patient’s motions using acamera sensor to verify actual compliance. We also plan toextend our method to apply the smart medication dispenserto other personal health devices such as activity monitors.
Acknowledgment
This research was supported by the Basic Science ResearchProgram through the National Research Foundation of Korea(NRF), funded by the Ministry of Education, Science andTechnology (no. 2012-013549)
References
[1] World Health Organization, “Adherence to long term thera-pies: evidence for action,” http://www.who.int/.
[2] R. L. Ownby, “Medication adherence and cognition: medical,personal and economic factors influence level of adherence inolder adults,” Geriatrics, vol. 61, no. 2, pp. 30–35, 2006.
[3] Pan American Health Organization, “Poor adherence to long-term treatment of chronic diseases is a worldwide problem,”Revista Panamericana de Salud Publica, vol. 14, no. 3, pp. 218–221, 2003.

10 Journal of Biomedicine and Biotechnology
[4] e-pill, http://www.epill.com/medtime.html.[5] P. O’Donnell, S. Crowell, G. Huffman, and N. Jones, “Auto-
mated medication dispenser system,” Technical Report ofMississippi State University, 2002.
[6] W. W. Changa, T. J. Sungb, H. W. Huanga et al., “A smart med-ication system using wireless sensor network technologies,”Sensors and Actuators A, vol. 172, no. 1, pp. 315–321, 2011.
[7] I. Sachpazidis and G. Sakas, “Medication intake assessment,”in Proceedings of the 1st International Conference on PervasiveTechnologies Related to Assistive Environments (PETRA ’08),July 2008.
[8] V. F. S. Fook, A. A. P. Wai, M. Jayachandran, B. Jit, P. H.Lee, and P. Y. L. Kiat, “Smart mote-based wireless medicationmanagement system for persons with dementia,” AssistiveRobotics and Mechatronics, vol. 9, no. 1, pp. 27–35, 2008.
[9] J. Dunbar-Jacob and M. K. Mortimer-Stephens, “Treatmentadherence in chronic disease,” Journal of Clinical Epidemiology,vol. 54, no. 12, supplement 1, pp. S57–S60, 2001.
[10] P. A. Frick, L. Lavreys, K. Mandaliya, and J. K. Kreiss, “Impactof an alarm device on medication compliance in women inMombasa, Kenya,” International Journal of STD and AIDS, vol.12, no. 5, pp. 329–333, 2001.
[11] S. F. Laster, J. L. Martin, and J. B. Fleming, “The effect of amedication alarm device on patient compliance with topicalpilocarpine,” Journal of the American Optometric Association,vol. 67, no. 11, pp. 654–658, 1996.
[12] J. A. Cramer and R. H. Mattson, “Monitoring compliance withantiepileptic drug therapy,” in Patient Compliance in MedicalPractice and Clinical Trials, pp. 123–137, 1991.
[13] Open Mobile Alliance (OMA), http://www.openmobileal-liance.org/.
[14] J. M. Silva, A. Mouttham, and A. El Saddik, “UbiMeds:a mobile application to improve accessibility and supportmedication adherence,” in Proceedings of the 1st ACM SIGMMInternational Workshop on Media Studies and Implementationsthat Help Improving Access to Disabled Users (MSIADU ’09),pp. 71–78, October 2009.
[15] W. Mei-Ying, P. H. Tsai, J. W. S. Liu, and K. Z. John, “Wedjat: amobile phone based medicine in-take reminder and monitor,”in Proceedings of the 9th IEEE International Conference onBioinformatics and BioEngineering (BIBE ’09), pp. 423–430,June 2009.
[16] J. M. Slagle, J. S. Gordon, C. E. Harris et al., “MyMediHealth—designing a next generation system for child-centered medica-tion management,” Journal of Biomedical Informatics, vol. 43,no. 5, pp. S27–S31, 2010.
[17] E. Becker, V. Metsis, R. Arora, J. Vinjumur, Y. Xu, and F.Makedon, “Smartdrawer: RFID-based smart medicine drawerfor assistive environments,” in Proceedings of the 2nd Interna-tional Conference on Pervasive Technologies Related to AssistiveEnvironments (PETRA ’09), pp. 1–8, June 2009.
[18] S. Ammouri and G. A. Bilodeau, “Face and hands detectionand tracking applied to the monitoring of medication intake,”in Proceedings of the 5th Canadian Conference on Computer andRobot Vision (CRV ’08), pp. 147–154, May 2008.
[19] D. Batz, M. Batz, N. D. V. Lobo, and M. Shah, “A computervision system for monitoring medication intake,” in Proceed-ings of the Canadian Conference on Computer and Robot Vision(CRV ’05), pp. 362–369, May 2005.
[20] J. Case, M. Fedor, M. Schoffstall, and J. Davin, “A SimpleNetwork Management Protocol (SNMP),” RFC 1157, IETFNetwork Working Group, 1990.
[21] Distributed management task force, web-based enterprisemanagement (WBEM), http://www.dmtf.org/standards/wbem.
[22] P. Jugeon, P. Keehyun, J. Daejin, J. Myungsook, and W.Jongjung, “Design of DM agent based on the WIPI,” Journalof Mobile Technologies, Knowledge and Society, vol. 4, pp. 61–67, 2007.
[23] P. Jugeon, P. Keehyun, J. Daejin, and J. Myungsook, “Designand implementation of wireless device management agentbased on OMA DM,” Korean Institute of Information Scientistsand Engineers, vol. 14, pp. 363–368, 2008.
[24] L. Jieun, S. Sunghak, and J. Byungduck, “WiBro devicemanagement system based on OMA DM protocol,” KNOMReview, vol. 10, no. 2, pp. 1–11, 2007.
[25] K. Joonmyung, J. Hongtaek, C. Mijung, W. H. James, and K.Jungu, “OMA DM-based remote software fault managementfor mobile devices,” International Journal of Network Manage-ment, vol. 19, no. 6, pp. 491–511, 2009.
[26] K. Joonmyung, J. Hongtaek, C. Mijung, and W. H. James,“OMA DM-based remote software debugging of mobiledevices,” Managing Next Generation Networks and Services,vol. 4773, pp. 51–61, 2007.
[27] C. Mijung, W. H. James, and J. Hongtaek, “XML-basednetwork management for IP networks,” ETRI Journal, vol. 25,no. 6, pp. 445–463, 2003.
[28] R. Hyunki, C. Sungrae, P. Shiquan, and K. Sungho, “Thedesign of remote vehicle management system based on OMADM protocol and AUTOSAR S/W architecture,” in Proceedingsof the 7th International Conference on Advanced LanguageProcessing and Web Information Technology (ALPIT ’08), pp.393–397, July 2008.
[29] Fumanbol DM Server, http://funambol.com/.

Hindawi Publishing CorporationJournal of Biomedicine and BiotechnologyVolume 2012, Article ID 580186, 8 pagesdoi:10.1155/2012/580186
Research Article
Real-Time Clinical Decision Support System withData Stream Mining
Yang Zhang,1 Simon Fong,1 Jinan Fiaidhi,2 and Sabah Mohammed2
1 Department of Computer and Information Science, University of Macau, Macau2 Department of Computer Science, Lakehead University, Thunder Bay, Canada
Correspondence should be addressed to Simon Fong, [email protected]
Received 24 May 2012; Accepted 27 May 2012
Academic Editor: Tai Hoon Kim
Copyright © 2012 Yang Zhang et al. This is an open access article distributed under the Creative Commons Attribution License,which permits unrestricted use, distribution, and reproduction in any medium, provided the original work is properly cited.
This research aims to describe a new design of data stream mining system that can analyze medical data stream and make real-timeprediction. The motivation of the research is due to a growing concern of combining software technology and medical functionsfor the development of software application that can be used in medical field of chronic disease prognosis and diagnosis, childrenhealthcare, diabetes diagnosis, and so forth. Most of the existing software technologies are case-based data mining systems. Theyonly can analyze finite and structured data set and can only work well in their early years and can hardly meet today’s medicalrequirement. In this paper, we describe a clinical-support-system based data stream mining technology; the design has taken intoaccount all the shortcomings of the existing clinical support systems.
1. Introduction
Data Stream Mining is the process of extracting useful infor-mation from continuous, rapid data streams. Data StreamMining is a very broad concept and it involves many technicalareas such as classification, detection, and clustering. In thispaper, the authors mainly focus on data stream classification,because clinical support systems usually require real-timemedical prediction and classification based on multivariatedata that have many attributes and terms. One of the mainalgorithms in clinical support system is decision tree and thatwill have to be improved in order to handle new applicationswhere data feed in as streams instead of a structured dataarchive. Traditional decision tree is known which has alimitation that its learning requires scanning through thewhole database many times. Data stream is a new dataconcept where segments of data can only be processed onepass at a time. The corresponding decision tree will haveto offer a best possible decision over such unbounded datastream, whenever it is being queried. Since about year 2000,there have been progressively a handful of decision treealgorithms for data stream mining emerged, such as Very FastDecision Tree (VFDT) [1] and Concept Adapting Very FastDecision Tree (CVFDT) [2]. However, these decision trees
may not be directly applied for medical use, many supportingtasks are needed, and they will be introduced in this paper.
In the commercial market there exist a number of clinicaldecision support systems. However, most of them are basedon traditional technologies, such as traditional decision tree,Bayesian Network and Neural Network. These technologiesare mature and reliable, but they all required consumingthe data as static database. Each model refreshing mayrequire going through the whole dataset again. More impor-tantly, most of these traditional systems can only makediagnosis, they cannot make prediction. There are veryfew systems that adopt data stream mining algorithms.Moreover these systems are either doing detection ordiagnosis. The most similar clinical decision system fromour survey based on data streams is the one developed byIBM (http://www.ibm.com/us/en/). It is a pioneer that iscapable of making prediction from medical data streams. TheIBM clinical decision support system is compared with ourproposed system in this paper. Table 1 shows some typicalexisting clinical decision support systems that are availablefrom the latest research work from the academics.
There are some defects in the above clinical decision sup-port systems mainly on traditional data mining algorithms.The limitations are described in Table 2.
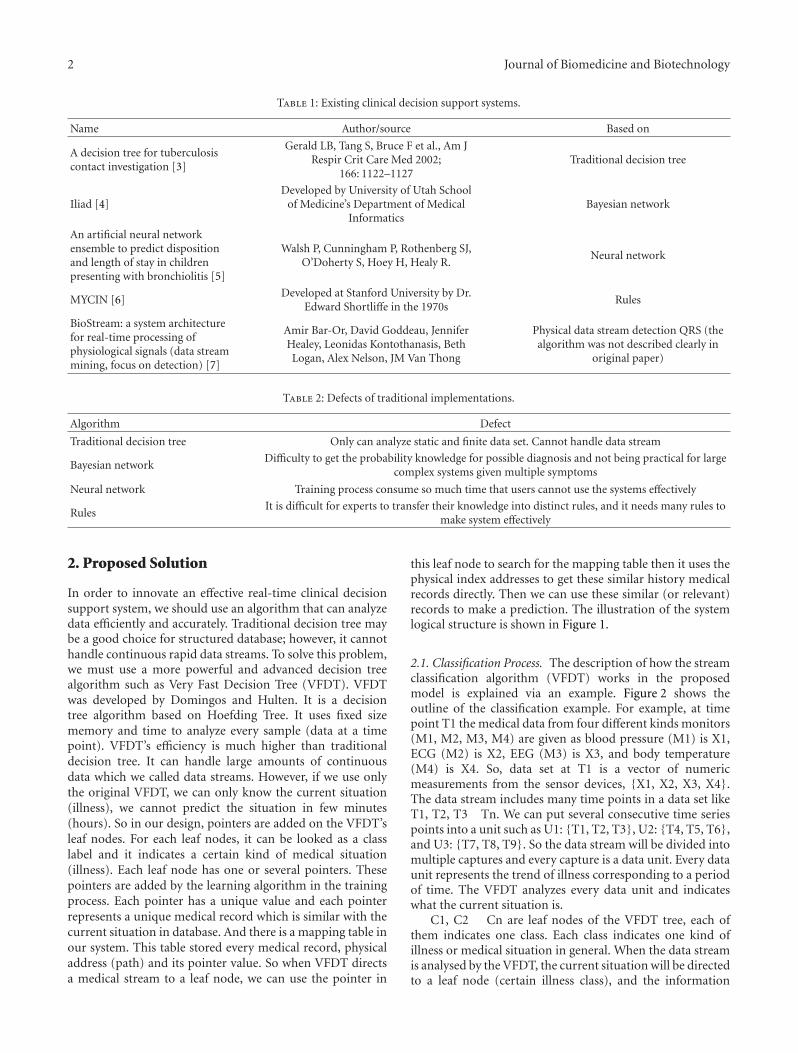
2 Journal of Biomedicine and Biotechnology
Table 1: Existing clinical decision support systems.
Name Author/source Based on
A decision tree for tuberculosiscontact investigation [3]
Gerald LB, Tang S, Bruce F et al., Am JRespir Crit Care Med 2002;
166: 1122–1127Traditional decision tree
Iliad [4]Developed by University of Utah School
of Medicine’s Department of MedicalInformatics
Bayesian network
An artificial neural networkensemble to predict dispositionand length of stay in childrenpresenting with bronchiolitis [5]
Walsh P, Cunningham P, Rothenberg SJ,O’Doherty S, Hoey H, Healy R.
Neural network
MYCIN [6]Developed at Stanford University by Dr.
Edward Shortliffe in the 1970sRules
BioStream: a system architecturefor real-time processing ofphysiological signals (data streammining, focus on detection) [7]
Amir Bar-Or, David Goddeau, JenniferHealey, Leonidas Kontothanasis, BethLogan, Alex Nelson, JM Van Thong
Physical data stream detection QRS (thealgorithm was not described clearly in
original paper)
Table 2: Defects of traditional implementations.
Algorithm Defect
Traditional decision tree Only can analyze static and finite data set. Cannot handle data stream
Bayesian networkDifficulty to get the probability knowledge for possible diagnosis and not being practical for large
complex systems given multiple symptoms
Neural network Training process consume so much time that users cannot use the systems effectively
RulesIt is difficult for experts to transfer their knowledge into distinct rules, and it needs many rules to
make system effectively
2. Proposed Solution
In order to innovate an effective real-time clinical decisionsupport system, we should use an algorithm that can analyzedata efficiently and accurately. Traditional decision tree maybe a good choice for structured database; however, it cannothandle continuous rapid data streams. To solve this problem,we must use a more powerful and advanced decision treealgorithm such as Very Fast Decision Tree (VFDT). VFDTwas developed by Domingos and Hulten. It is a decisiontree algorithm based on Hoefding Tree. It uses fixed sizememory and time to analyze every sample (data at a timepoint). VFDT’s efficiency is much higher than traditionaldecision tree. It can handle large amounts of continuousdata which we called data streams. However, if we use onlythe original VFDT, we can only know the current situation(illness), we cannot predict the situation in few minutes(hours). So in our design, pointers are added on the VFDT’sleaf nodes. For each leaf nodes, it can be looked as a classlabel and it indicates a certain kind of medical situation(illness). Each leaf node has one or several pointers. Thesepointers are added by the learning algorithm in the trainingprocess. Each pointer has a unique value and each pointerrepresents a unique medical record which is similar with thecurrent situation in database. And there is a mapping table inour system. This table stored every medical record, physicaladdress (path) and its pointer value. So when VFDT directsa medical stream to a leaf node, we can use the pointer in
this leaf node to search for the mapping table then it uses thephysical index addresses to get these similar history medicalrecords directly. Then we can use these similar (or relevant)records to make a prediction. The illustration of the systemlogical structure is shown in Figure 1.
2.1. Classification Process. The description of how the streamclassification algorithm (VFDT) works in the proposedmodel is explained via an example. Figure 2 shows theoutline of the classification example. For example, at timepoint T1 the medical data from four different kinds monitors(M1, M2, M3, M4) are given as blood pressure (M1) is X1,ECG (M2) is X2, EEG (M3) is X3, and body temperature(M4) is X4. So, data set at T1 is a vector of numericmeasurements from the sensor devices, {X1, X2, X3, X4}.The data stream includes many time points in a data set likeT1, T2, T3 Tn. We can put several consecutive time seriespoints into a unit such as U1: {T1, T2, T3}, U2: {T4, T5, T6},and U3: {T7, T8, T9}. So the data stream will be divided intomultiple captures and every capture is a data unit. Every dataunit represents the trend of illness corresponding to a periodof time. The VFDT analyzes every data unit and indicateswhat the current situation is.
C1, C2 Cn are leaf nodes of the VFDT tree, each ofthem indicates one class. Each class indicates one kind ofillness or medical situation in general. When the data streamis analysed by the VFDT, the current situation will be directedto a leaf node (certain illness class), and the information
Journal of Biomedicine and Biotechnology 3
VFDT
Trainer
Database
Prediction Memory
Diagnosis(user interface)
Feedback
Data streamClass label and pointer
Doctor
Training data and pointer
Training data
Prediction and medical advice
Diagnosis by doctor
New medical record
Use pointer to get records
Return records
Figure 1: Logical structure of our design.
M1
M2
M3
M4
DatasetDataset
X1
X2
X3
X4
C1 C2 C3 Cn−1 Cn
Classes (leaf)
VFTD
Tn · · · T3, T2, T1
Un · · · U2, U1: {T1, T2, T3}
· · ·
· · ·
Figure 2: Classification by VFDT.
Class ID: C1
Illness (situation) label: heart attack
Sum of pointer: n
Pointer list: P1, P2, P3, . . ., Pn
Figure 3: Leaf node structure.
in this leaf node will send it to prediction algorithm. Thestructure of leaf node (class) is shown in Figure 3.
P1, P2, P3, Pn are location pointers, they representdigital medical records which are similar to the current
situations that have happened in the past. Suppose the VFDTdirects the current situation to the leaf node C1, then theinformation of this leaf node will send it to the predictionalgorithm. The prediction algorithm will use the illness(situation) label to search through the cache memory forsimilar records. If there is a cache prediction that can matchthe label, the system will then use the records from thiscache as prediction result. If there is no predictions foundin the cache that can match the current label, the predictionalgorithm will use the pointer value to search across themapping table. It uses corresponding physical addresses toget these similar records for analysis. Here is an example ofthe mapping table. (see Table 3).
Every record has a unique pointer value which iscreated by the system in correspondence to its record ID.Suppose record ID (RID) is R1, then R1’s pointer is P1 and

4 Journal of Biomedicine and Biotechnology
Table 3: Mapping table example.
Pointer RID Physical address
P1 R1 00000C900000FFFF
P2 R2 000B80000000FFFF
· · ·· · ·
Class ID: C1
Illness (situation) label: heart attack
P3 P5 P6 P8
3 5 6 8
Pointer
List
Leaf node
Figure 4: Pointer list in leaf node.
its value is 1. When a new record is inserted into a database,its stored position (physical path) and the pointer value isrecorded in the mapping table. The training function will usethis new record to train the VFDT algorithm as the feedbackprocess. Here we have an example of structure of pointer listin a leaf node as depicted in Figure 4.
2.2. VFDT Training Process and Searching Process. How thepointer is added to the VFDT’s leaf nodes is describedas follows. The pointer is added on the leaf node duringthe training process. When the training algorithm uses aseries of medical records to train the VFDT, it will add therecord’s pointer to the result leaf node. The training processis run whenever there is a new medical record to be addedinto the database. For example the extractor in the trainingfunction wants to fetch a medical record R1 as a training data,then extractor sends R1’s medical data to VFDT algorithmand R1’s pointer to the Adder which is an internal datamanagement function. When VFDT finishes the analysis ofR1, it gives the result leaf node C2, the Adder adds a pointerP1 to the leaf node C2. When VFDT directs the currentsituation to a certain leaf node, the system will use the pointerstored in this leaf node to search across the mapping table.From the table, the physical address stored can be retrievedand subsequently it proceeds to collect the history record.Figure 5 shows this concept—about how a pointer adds toa leaf node and searches for a certain record.
At the initial stage, all medical records were stored intraditional way like shelves of archive. We use this libraryof existing medical records as initial data to train upthe VFDT decision tree. It is well popularly known thatVFDT decision tree needs many records to train up to asatisfactory classification performance. Once this incubationperiod is over, the decision tree model is adequately trained;classification can be used on the fly. The sensitivity of theVFDT that is related to how often it should readjust the rulesunder the tree so to reflect the updated relations of the newincoming to the actual rules can be configured by the user atwill. During this initial training process, all medical records
were added to a pointer. After initial training, one leaf nodecan represent one illness class and each leaf node can visitthe medical records in their class directly. Figure 6 show theVFDT, mapping and database after initial training process.
2.3. Prediction Process. How the prediction algorithm worksis introduced. When a classified result (leaf node) is sentto prediction algorithm, prediction will use pointers ofthis result (leaf node) to locate similar history of medicalrecords. These records have similar medical data. So thecommon illness description of these records can be usedfor current situation. The description covers treatment,diagnosis, and illness history and they are written by differentdoctors. So these descriptions will have little difference inexpression. For example, A : (heart attack, taking compoundreserpine tablets) and B : (treatment is used to record historyof treatment). So before we use frequency algorithm tofind the most common description, we need an algorithmto find the description which has the same meaning anddifferent expression. Fortunately, there are already manyuseful algorithms and applications in Natural LanguageProcessing, and, in my system, we used the sentence sim-ilarity [8] and semantic similarity [9] to find the similardescription for a certain kind of illness, then we markedthe similar description with the same color and extract themost frequent description. History of treatment is used formedical advice against current illness. History of diagnosiswill be used as the system diagnosis for current situation andhistory of illness description will be used for the predictionof the current situation. There is an example that shows howto extract the treatment information: suppose the leaf nodepoints to R1, R3, R6, and R7. Then prediction will extractmost frequency treatment actions. The linking of the leafnodes and the treatment actions are shown in Figure 7.
For this example, the treatment made by the system willbe in this shape: 1.XXXXXX 2.YYYYYY 3AAAAAA. Finally,prediction will use these extracted information as the result.And prediction will store this information in its memory asa cache. When the same classified result (leaf node) is sentfor prediction, the prediction function will use the cacheinformation directly. It can make the system more efficient.In order to keep up the accuracy of the system, system willclear the cache result when there are new pointers added tothe match leaf node. The system will use the new pointer listto get the corresponding history record again, and then itextracts new result and stores it in memory as a new cachefor this classified result (leaf node). For the process to extractuseful information in database, it will not cost much timeand system resource, because it is just a simple statisticalmethod and it just considers the data in a relatively small data
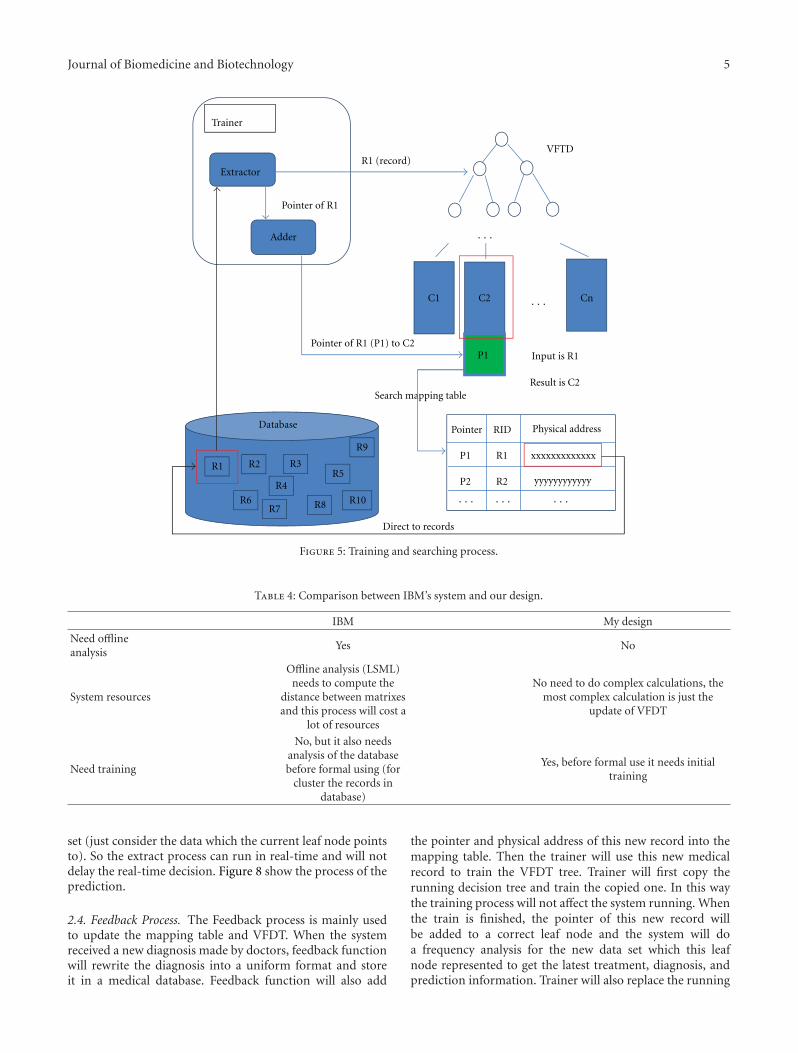
Journal of Biomedicine and Biotechnology 5
VFTD
R1
R6
R2
R7
R4
R3R5
R8
R9
R10
R1 (record)
C1 C2 Cn
Trainer
Extractor
Adder
Pointer of R1
P1
Pointer of R1 (P1) to C2
Database RID Physical addressPointer
R1
P1
xxxxxxxxxxxxx
R2 yyyyyyyyyyyyP2
Input is R1
Result is C2Search mapping table
Direct to records
·· ·
·· ·
·· · ·· · ·· ·
Figure 5: Training and searching process.
Table 4: Comparison between IBM’s system and our design.
IBM My design
Need offlineanalysis
Yes No
System resources
Offline analysis (LSML)needs to compute the
distance between matrixesand this process will cost a
lot of resources
No need to do complex calculations, themost complex calculation is just the
update of VFDT
Need training
No, but it also needsanalysis of the databasebefore formal using (for
cluster the records indatabase)
Yes, before formal use it needs initialtraining
set (just consider the data which the current leaf node pointsto). So the extract process can run in real-time and will notdelay the real-time decision. Figure 8 show the process of theprediction.
2.4. Feedback Process. The Feedback process is mainly usedto update the mapping table and VFDT. When the systemreceived a new diagnosis made by doctors, feedback functionwill rewrite the diagnosis into a uniform format and storeit in a medical database. Feedback function will also add
the pointer and physical address of this new record into themapping table. Then the trainer will use this new medicalrecord to train the VFDT tree. Trainer will first copy therunning decision tree and train the copied one. In this waythe training process will not affect the system running. Whenthe train is finished, the pointer of this new record willbe added to a correct leaf node and the system will doa frequency analysis for the new data set which this leafnode represented to get the latest treatment, diagnosis, andprediction information. Trainer will also replace the running

6 Journal of Biomedicine and Biotechnology
· · ·
· · ·
R2
R3
XXXXXXXXXX
ZZZZZZZZZZZ
SSSSSSSSSSS
C1 C2 Cn
R4
R3
R2R1
VFTD
Class label
(Leaf node)P3
P4
P1 P2
P1
P2
P3
P4
R1
R4
YYYYYYYYYYYMapping table
Database
Figure 6: How mapping works in the initial training stage for VFDT.
R1
R7
R3
R6
1.XXXXXX, 2.YYYYYY, 3.ZZZZZZ, 4.UUUUUU
TreatmentRecord index
1.XXXXXX, 2.AAAAAA, 3.YYYYYY, 4.EEEEEE
1.XXXXXX, 2.BBBBBB, 3.YYYYYY, 4.AAAAAA
1.YYYYYYY, 2.XXXXXX, 3.SSSSSSS
Figure 7: Extract most frequently used treatment from similarhistory records.
decision tree by this new trained one. The operational flowof the feedback process is shown in Figure 9.
3. Comparison with IBM’s
IBM lately published a paper in 2011 called “A system formining temporal physiological data streams for advancedprognostic decision Support” [10]. In their paper, theydesigned a system that can monitor data streams from ICUand make a prediction. This system is perfect; it almost takes
into all aspects. However, it needs an offline system to analyzethe medical database using cluster and Locally SupervisedMetric Learning (LSML). LSML is an algorithm to analyzethe data class to find the representative data matrix for thisclass. LSML calculates the distance between patients’ historyrecords (medical data stored in matrix) and the formula is
dm(xi, xj
)=
√(xi − xj
)TP(xi − xj
)(1)
We know that to compute large amounts of distancebetween two points will cost a lot of system resources.LSML needs to compute large amounts of distances betweenmatrixes (multidimensional point), so it needs a lot ofsystem resources and time. It is therefore speculated that theydesigned an offline system running independently from theonline system. In our design, there is no need for offlinesystems; all the systems are online and real-time. In ourdesign, the cluster process and initial training process will befinished at same time. The most complex calculations are justto update the VFDT (decision tree). So the proposed systemrequires much less system resources than IBM’s. However,the disadvantage in our design is that the initial system

Journal of Biomedicine and Biotechnology 7
VFDT
PREDICTION
Class ID: C1
Illness (situation) label: heart attack
Searcher
Memory
(cache)
Search cache for class ID C1
Return cache or not
ExtractorTranslator
Medical database
If no cache is available,ask to extract information by pointers
Readable prediction
Cache information (if exist)Add new cache
The medical records to which
the pointer points
Predictions
Doctors
Pointer list: P1, P2, P3, . . ., Pn
Figure 8: Prediction process.
needs a process of initial training. Although, it may not bea big problem, it spends some time on training before it isacceptable. IBM’s system also needs clustering process andthis process is also to operate offline. After training, theVFDT can classify the data stream and direct the currentsituation to similar medical record sets. The new diagnosismade by doctor will be a new medical record and it can befedback to system. VFDT will use this new record to update(training) itself and once VFDT finished the update, the dataclass in database will be updated naturally. As the VFDTcan update its decision tree very quickly, the update processcan run online (real-time). Table 4 compares our design andIBM’s.
4. Conclusion
In this paper, a new system is introduced that can analyzemedical data streams and can make real-time prediction.This system is based on stream mining algorithm called
VFDT. The VFDT is extended with the capability usingpointers to allow the decision tree to remember the mappingrelationship between leaf nodes and the history records.This way can save the need of the offline clustering processthat reduces the resource consumption for the system. Infact, the clustering process and initial training in theorycan be processed together at the beginning. After initialtraining, from any leaf node we can use its pointer list andmapping table to retrieve the corresponding history recordsdirectly. It is suggested that clustering and classificationshould be used together for a more accurate prediction—prediction of a new insight requires retrieving the past casesthat are represented as similar history records. Clusteringhelps grouping them, similar ones together. Prediction helpslocating them subsequently. The design as advocated in thispaper is at its initial phase and all these design elements arein conceptual stage. A system prototype is currently beingdeveloped so that soon experiments with suitable medicaldata can be performed in order to validate the efficacy of
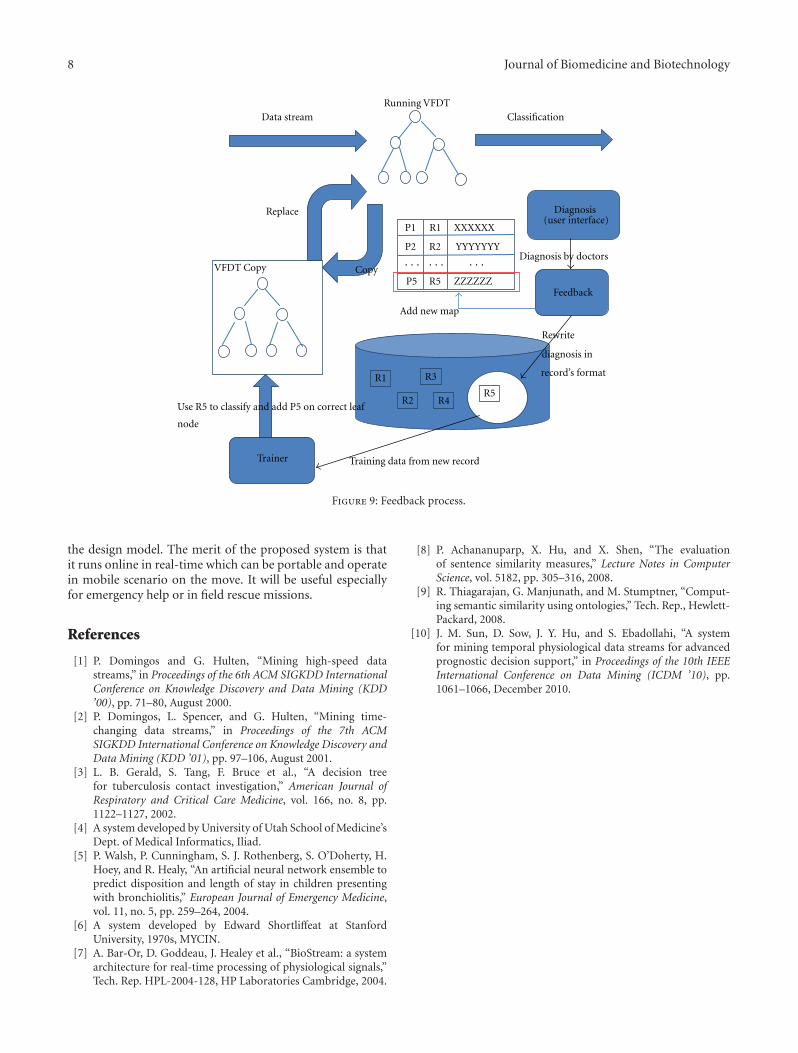
8 Journal of Biomedicine and Biotechnology
(user interface)
R1 record’s format
node
Running VFDT
P1
Diagnosis
Feedback
R2
R3
R5R4
VFDT Copy
Data stream Classification
Replace
Copy
Trainer
Diagnosis by doctors
Rewrite
diagnosis in
Training data from new record
Use R5 to classify and add P5 on correct leaf
R1
R2P2
R5P5
XXXXXX
YYYYYYY
ZZZZZZ
Add new map
· · ·· · ·· · ·
Figure 9: Feedback process.
the design model. The merit of the proposed system is thatit runs online in real-time which can be portable and operatein mobile scenario on the move. It will be useful especiallyfor emergency help or in field rescue missions.
References
[1] P. Domingos and G. Hulten, “Mining high-speed datastreams,” in Proceedings of the 6th ACM SIGKDD InternationalConference on Knowledge Discovery and Data Mining (KDD’00), pp. 71–80, August 2000.
[2] P. Domingos, L. Spencer, and G. Hulten, “Mining time-changing data streams,” in Proceedings of the 7th ACMSIGKDD International Conference on Knowledge Discovery andData Mining (KDD ’01), pp. 97–106, August 2001.
[3] L. B. Gerald, S. Tang, F. Bruce et al., “A decision treefor tuberculosis contact investigation,” American Journal ofRespiratory and Critical Care Medicine, vol. 166, no. 8, pp.1122–1127, 2002.
[4] A system developed by University of Utah School of Medicine’sDept. of Medical Informatics, Iliad.
[5] P. Walsh, P. Cunningham, S. J. Rothenberg, S. O’Doherty, H.Hoey, and R. Healy, “An artificial neural network ensemble topredict disposition and length of stay in children presentingwith bronchiolitis,” European Journal of Emergency Medicine,vol. 11, no. 5, pp. 259–264, 2004.
[6] A system developed by Edward Shortliffeat at StanfordUniversity, 1970s, MYCIN.
[7] A. Bar-Or, D. Goddeau, J. Healey et al., “BioStream: a systemarchitecture for real-time processing of physiological signals,”Tech. Rep. HPL-2004-128, HP Laboratories Cambridge, 2004.
[8] P. Achananuparp, X. Hu, and X. Shen, “The evaluationof sentence similarity measures,” Lecture Notes in ComputerScience, vol. 5182, pp. 305–316, 2008.
[9] R. Thiagarajan, G. Manjunath, and M. Stumptner, “Comput-ing semantic similarity using ontologies,” Tech. Rep., Hewlett-Packard, 2008.
[10] J. M. Sun, D. Sow, J. Y. Hu, and S. Ebadollahi, “A systemfor mining temporal physiological data streams for advancedprognostic decision support,” in Proceedings of the 10th IEEEInternational Conference on Data Mining (ICDM ’10), pp.1061–1066, December 2010.
Hindawi Publishing CorporationJournal of Biomedicine and BiotechnologyVolume 2012, Article ID 614146, 7 pagesdoi:10.1155/2012/614146
Research Article
A Survey and Proposed Framework onthe Soft Biometrics Technique for Human Identification inIntelligent Video Surveillance System
Min-Gu Kim,1 Hae-Min Moon,2 Yongwha Chung,3 and Sung Bum Pan4
1 Department of Control and Instrumentation Engineering, Chosun University, 375 Seosuk-dong, Dong-gu,Gwangju 501-759, Republic of Korea
2 Department of Information and Communication Engineering, Chosun University, 375 Seosuk-dong, Dong-gu,Gwangju 501-759, Republic of Korea
3 Department of Computer and Information Science, Korea University, Jochiwon-eup, Yeongi-gun,Chungnam 339-700, Republic of Korea
4 Department of Control, Instrumentation and Robot Engineering, Chosun University, 375 Seosuk-dong, Dong-gu,Gwangju 501-759, Republic of Korea
Correspondence should be addressed to Sung Bum Pan, [email protected]
Received 22 May 2012; Accepted 9 June 2012
Academic Editor: Sabah Mohammed
Copyright © 2012 Min-Gu Kim et al. This is an open access article distributed under the Creative Commons Attribution License,which permits unrestricted use, distribution, and reproduction in any medium, provided the original work is properly cited.
Biometrics verification can be efficiently used for intrusion detection and intruder identification in video surveillance systems.Biometrics techniques can be largely divided into traditional and the so-called soft biometrics. Whereas traditional biometrics dealswith physical characteristics such as face features, eye iris, and fingerprints, soft biometrics is concerned with such information asgender, national origin, and height. Traditional biometrics is versatile and highly accurate. But it is very difficult to get traditionalbiometric data from a distance and without personal cooperation. Soft biometrics, although featuring less accuracy, can be usedmuch more freely though. Recently, many researchers have been made on human identification using soft biometrics data collectedfrom a distance. In this paper, we use both traditional and soft biometrics for human identification and propose a framework forsolving such problems as lighting, occlusion, and shadowing.
1. Introduction
Recently, with the increase of international terrorism andviolence, the interest in identification technique using videosurveillance has greatly increased. Also, with widespread ofcomputers, biometric identification comes in demand insuch fields as home automation and health care. Recently,it has come about through pattern recognition, computervision, and image analysis automatically detecting physicalpresence and verifying one’s identity.
Biometrics aims to recognize a person through physi-ological or behavioral attributes, such as face, fingerprint,iris, retina, and DNA [1]. Biometrical methods can belargely divided into traditional technique that deals with
physical data such as face features and fingerprints, and theso called soft biometrics that is concerned about gender,ethnicity, height, tattoo, and signature as shown in Figure 1[2]. Traditional biometrics has excellent accuracy and greatversatility. However, it is difficult to collect physical data froma distance, and also cooperation is often required like withlifting fingerprint. On the other hand, soft biometrics has lessaccuracy, but it can be used in a large variety of environmentsand does not require cooperation. Since soft biometricdata are not totally dependable, person identification ismade based on multiple data. For example, only genderand ethnicity information is not enough to verify one’sidentity. Recently, multimodal biometric methods have beenextensively researched where traditional and soft biometrics

2 Journal of Biomedicine and Biotechnology
Figure 1: Example of discrete soft biometric traits.
Primarybiometric
system
Matchingmodule
Featureextraction
module
Secondarybiometric
system
Softbiometricextraction
module
Postprocessing
module
Templates
Decisionmodule
User identity(or)
accept/reject
x
y
P(ω | x) P(ω | x, y)
Figure 2: Integration of soft biometric traits with a biometric system.
CCA SVMFused
featuresGender
recognition
Figure 3: Gender recognition using face-gait combination.
work together in order to ensure best results for a specificenvironment. One of the major advantages of a multimodalapproach is that it is harder to circumvent or forge [3].
In this paper, we analyze how biometrics can be usedfor identification in video surveillance system and proposea framework to solve such problems as lighting, occlusion,and shadowing. Section 2 of this paper describes biometricidentification using video surveillance system. Section 3further proposes a framework for human identification froma distance. Future research directions and conclusion arepresented in Section 4.
2. Biometrics
2.1. Traditional Biometrics. Broadly speaking, biometrics isabout establishing personal identity using physical, physi-ological, and behavioral characteristics of the person. Themain reason why it is so popular is security: with biometrics
there is no risk something might be lost or stolen as is oftenthe case with traditional IDs and passwords.
Especially, identification using face features and finger-prints has been extensively researched and is currently usedin a wide variety of applications because of high accuracyrate. Then, attempts have been made to use face featuresand fingerprint in video surveillance systems that require,however, extra effort. On the one hand, identification usingface features is very convenient for the people as recognitionis made without physical contact [4]. On the other hand,this method is very sensitive to facial expression and changesin lighting. The accuracy also decreases as face features dochange over the years. Besides, as the distance between thecamera and the person increases, it becomes more difficultto extract face features needed for identification.
2.2. Identification Using Discrete Biometric Information. Asdiscussed above, traditional biometrics methods are veryaccurate and versatile. However, for the most part they canbe used only in controlled environment and in cooperationwith the person being investigated. On the contrary, softbiometrics can be used in any environment and requires nocooperation.
Wayman [5] has suggested a method for filtering alarge-scale biometric database containing such informationas gender and age. Thus, the possible candidates can bescreened depending on the specific feature. This methodimproves the speed of biometric system and the efficiencyof search. But, it appeared that the elements like age,gender, ethnicity, and occupation can affect performanceof biometric system [6]. For example, in young Asian

Journal of Biomedicine and Biotechnology 3
Figure 4: Examples of normalized and aligned gait image.
Identity verificationmodule with primary
biometric
Fusion+
classifier
Primarybiometric
featureextraction
Secondarybiometricmodule
Softbiometricextraction
module
Fusion+
classifier
Face-gaittemplates
User identity(or)
accept/reject
Figure 5: Identification using face-gait combination.
women workers of the mines, the difficult identificationproblem occurs in biometric system. Therefore, recentlythe methods that could verify identification by assigningdifferent weighted values to each of biometric features ina multimodal system have been researched. Jain et al. hasproposed a multimodal biometric system that uses BayesTheorem as shown in Figure 2 [7]. The Bayes Theorem usedin the proposed system can be shown in
P(ωi | x, y
) = p(y | ωi
)P(ωi | x)∑n
i=1 p(y | ωi
)P(ωi | x)
, (1)
where ωi is the number of test subjects in the database, xis the value of traditional biometric traits such as face andfingerprint, and y is the value of soft biometric traits thatcan be used additionally.
When multimodal biometric data is used, each piece ofdata can contribute differently to identification. For example,ethnicity is much more informative than gender. In addition,in case that forgery is possible using makeup or heel,biometric information and soft biometric information haveequal influence on identification, thus the recognition ratecan be reduced. As shown in (2), different weighted valuescan be assigned to different biometric data. Lightweightvalues are assigned to soft biometric data in contrast to moreaccurate biometric information. The total of weighted valuesassigned to each of biometric information is 1, a0 � a1, andi = 1, 2, . . . ,m :
gi(x, y
) = a0 logP(ωi | x) + a1 log p(y1 | ω1
)+ · · · + ak log p
(yk | ω1
)+ ak+1 logP
(yk+1 | ω1
)+ · · · + am logP
(ym | ωi
).
(2)
Hossain and Chetty has used the face features and gaitdata together to determine the gender [8]. Before, the genderwas determined by judging from face features only. By addinggait data, however, the accuracy has been greatly increased.Figure 3 shows a simple gender recognition workflow.
First, gait image and face image of the subject areobtained using background subtraction technique. Gait cycleis determined depending on the change in the number ofpixels in the lower part of the silhouette (Figure 4) as shown
G(x, y
) = 1N
N∑t=1
Bt(x, y
), (3)
where N is the number of image frames and Bt(x, y) are thecoordinates in the lower part of the silhouette (backgroundremoved).
Thereafter, the gender is checked based on correlationbetween the two images using canonical correlation analysis(CCA) and the database. Lastly, after going through the mainidentification step primarily using face information and gaitinformation obtained from remote camera as shown in Fig-ure 5, the recognition performance level was improved usingin conjunction with soft biometric information obtainedfrom the short distance camera.
2.3. Identification Using Continuous Biometric Information.Biometric identification is an important component ofsurveillance systems. There are, however, many constrains touse face recognition in real environments where biometricinformation should be obtained without interference [9].For this, a variety of biometrics suitable for environment ofsurveillance system has been researched.
For example, in case of height the specificity is low butit is not oppressive and it obtains relatively accurate height
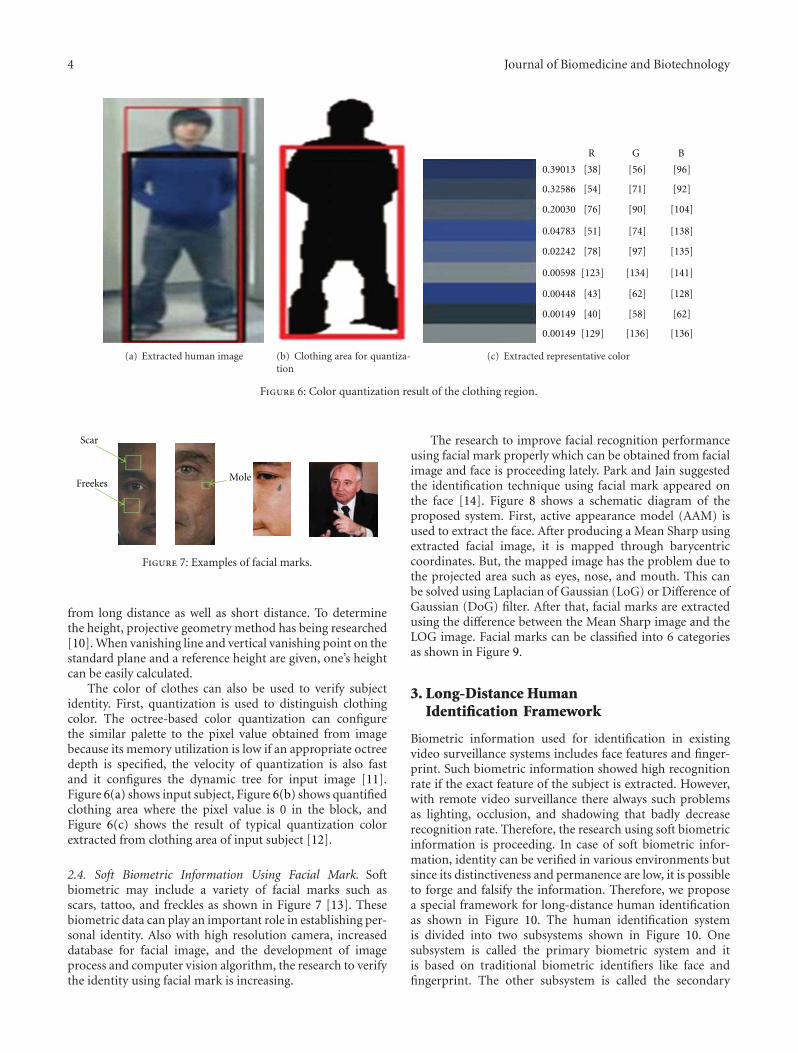
4 Journal of Biomedicine and Biotechnology
(a) Extracted human image (b) Clothing area for quantiza-tion
0.39013
0.32586
0.20030
0.04783
0.02242
0.00598
0.00448
0.00149
0.00149
R
[38]
[54]
[76]
[51]
[78]
[123]
[43]
[40]
[129]
G
[56]
[71]
[90]
[74]
[97]
[134]
[62]
[58]
[136]
B
[96]
[92]
[104]
[138]
[135]
[141]
[128]
[62]
[136]
(c) Extracted representative color
Figure 6: Color quantization result of the clothing region.
Scar
FreekesMole
Figure 7: Examples of facial marks.
from long distance as well as short distance. To determinethe height, projective geometry method has being researched[10]. When vanishing line and vertical vanishing point on thestandard plane and a reference height are given, one’s heightcan be easily calculated.
The color of clothes can also be used to verify subjectidentity. First, quantization is used to distinguish clothingcolor. The octree-based color quantization can configurethe similar palette to the pixel value obtained from imagebecause its memory utilization is low if an appropriate octreedepth is specified, the velocity of quantization is also fastand it configures the dynamic tree for input image [11].Figure 6(a) shows input subject, Figure 6(b) shows quantifiedclothing area where the pixel value is 0 in the block, andFigure 6(c) shows the result of typical quantization colorextracted from clothing area of input subject [12].
2.4. Soft Biometric Information Using Facial Mark. Softbiometric may include a variety of facial marks such asscars, tattoo, and freckles as shown in Figure 7 [13]. Thesebiometric data can play an important role in establishing per-sonal identity. Also with high resolution camera, increaseddatabase for facial image, and the development of imageprocess and computer vision algorithm, the research to verifythe identity using facial mark is increasing.
The research to improve facial recognition performanceusing facial mark properly which can be obtained from facialimage and face is proceeding lately. Park and Jain suggestedthe identification technique using facial mark appeared onthe face [14]. Figure 8 shows a schematic diagram of theproposed system. First, active appearance model (AAM) isused to extract the face. After producing a Mean Sharp usingextracted facial image, it is mapped through barycentriccoordinates. But, the mapped image has the problem due tothe projected area such as eyes, nose, and mouth. This canbe solved using Laplacian of Gaussian (LoG) or Difference ofGaussian (DoG) filter. After that, facial marks are extractedusing the difference between the Mean Sharp image and theLOG image. Facial marks can be classified into 6 categoriesas shown in Figure 9.
3. Long-Distance HumanIdentification Framework
Biometric information used for identification in existingvideo surveillance systems includes face features and finger-print. Such biometric information showed high recognitionrate if the exact feature of the subject is extracted. However,with remote video surveillance there always such problemsas lighting, occlusion, and shadowing that badly decreaserecognition rate. Therefore, the research using soft biometricinformation is proceeding. In case of soft biometric infor-mation, identity can be verified in various environments butsince its distinctiveness and permanence are low, it is possibleto forge and falsify the information. Therefore, we proposea special framework for long-distance human identificationas shown in Figure 10. The human identification systemis divided into two subsystems shown in Figure 10. Onesubsystem is called the primary biometric system and itis based on traditional biometric identifiers like face andfingerprint. The other subsystem is called the secondary

Journal of Biomedicine and Biotechnology 5
Input image Feature point
detection
Mapping to mean shape
Laplacian of Gaussian
filter
Subtract primary feature and any
connected
Salient region detection
Detected face marks
Figure 8: Schematic diagram of facial mark extraction process.
Freckle
Point, dark
Abrasion
Whitening
Dark skin
Wrinkle
Scar
Pockmark
Mole
AcnePoint, light
Linear, dark
Linear, light
Irregular, dark
Irregular, light
Figure 9: Classification of facial marks to the morphology and colorbased categories.
biometric system and it is based on soft biometric traitslike height and clothing color. After that, information onheight and clothing color obtained from video surveillancecamera is stored in the database and it is used for secondarybiometric information along with information on face andfingerprint for identification. The experimental environmentof the proposed framework is assumed to be inside the build-ing. Generally, for buildings requiring high level of securitysuch as companies, libraries, or broadcasting stations, asingle authentication system is not enough. Thus, both videosurveillance camera and a fingerprint sensor are installedat the entrance of the building. But inside the building,
the identity of the subject is further established from thedistance, using facial information obtained from videosurveillance cameras only. However, because of problemswith lighting, shadowing, and occlusion, it is difficult toobtain accurate facial data.
The proposed framework obtains information on pri-mary biometric traits like face and finger print and secondarybiometric traits like height and clothing needed for iden-tification from video surveillance camera and fingerprintsensor in short distance to determine the access of thesubject at the entrance of the building shown in Figure 11(a).Although height and clothing color are not as permanent andreliable as the traditional biometric identifiers like face andfingerprint, they provide some information about the humanidentification that leads to higher accuracy in establishingthe human identification system. Therefore, information onheight and clothing color obtained from entrance camera isstored in the database and is used for additional biometricinformation along with information on face and fingerprintfor identification. If the user is determined as unauthorized,the entry of the user will be controlled.
If a subject is working inside the building where nofingerprint sensor is installed such as Figure 11(b), thefingerprint information cannot be obtained because thefingerprint sensor is not used like the environment ofbuilding entrance. So information on face, height andclothing color is obtained only by video surveillance camera.However, if facial data needed for identification cannot beobtained when the distance between the camera and thesubject is too large or because of such problem as lighting,shadowing, or occlusion, the data about one’s height, andclothing color are stored in the database at the entrance ofthe building and information on height and clothing color isobtained from the inside. If a person reenters the building,height and clothing color data can change. In this case, the
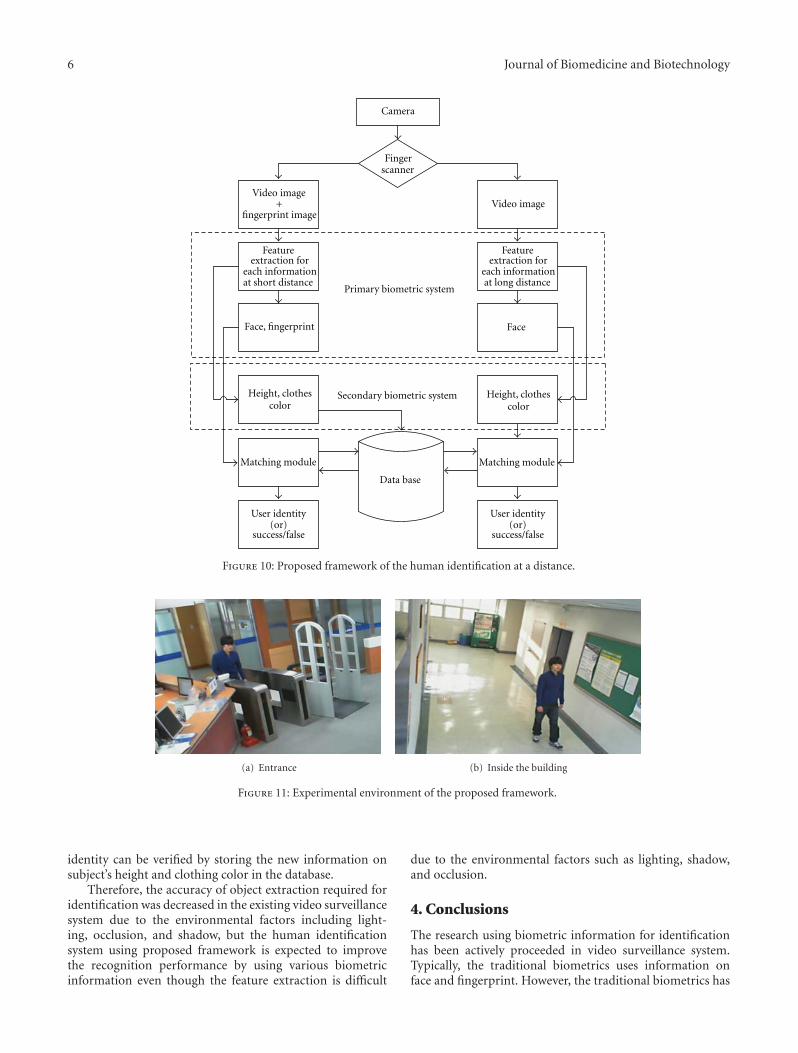
6 Journal of Biomedicine and Biotechnology
Primary biometric system
Secondary biometric system
Camera
Fingerscanner
Video image+
fingerprint imageVideo image
Feature extraction for
each information at short distance
Feature extraction for
each information at long distance
Face, fingerprint Face
Height, clothescolor
Matching module Matching module
User identity(or)
success/false
Data base
Height, clothescolor
User identity(or)
success/false
Figure 10: Proposed framework of the human identification at a distance.
(a) Entrance (b) Inside the building
Figure 11: Experimental environment of the proposed framework.
identity can be verified by storing the new information onsubject’s height and clothing color in the database.
Therefore, the accuracy of object extraction required foridentification was decreased in the existing video surveillancesystem due to the environmental factors including light-ing, occlusion, and shadow, but the human identificationsystem using proposed framework is expected to improvethe recognition performance by using various biometricinformation even though the feature extraction is difficult
due to the environmental factors such as lighting, shadow,and occlusion.
4. Conclusions
The research using biometric information for identificationhas been actively proceeded in video surveillance system.Typically, the traditional biometrics uses information onface and fingerprint. However, the traditional biometrics has
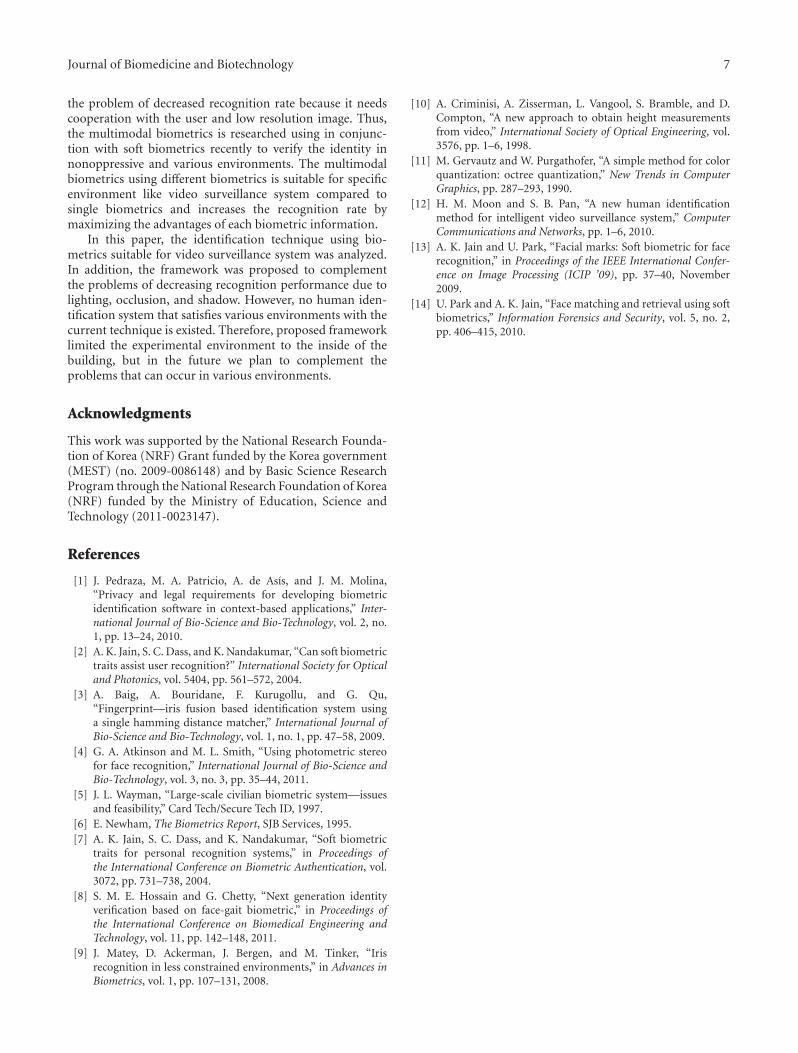
Journal of Biomedicine and Biotechnology 7
the problem of decreased recognition rate because it needscooperation with the user and low resolution image. Thus,the multimodal biometrics is researched using in conjunc-tion with soft biometrics recently to verify the identity innonoppressive and various environments. The multimodalbiometrics using different biometrics is suitable for specificenvironment like video surveillance system compared tosingle biometrics and increases the recognition rate bymaximizing the advantages of each biometric information.
In this paper, the identification technique using bio-metrics suitable for video surveillance system was analyzed.In addition, the framework was proposed to complementthe problems of decreasing recognition performance due tolighting, occlusion, and shadow. However, no human iden-tification system that satisfies various environments with thecurrent technique is existed. Therefore, proposed frameworklimited the experimental environment to the inside of thebuilding, but in the future we plan to complement theproblems that can occur in various environments.
Acknowledgments
This work was supported by the National Research Founda-tion of Korea (NRF) Grant funded by the Korea government(MEST) (no. 2009-0086148) and by Basic Science ResearchProgram through the National Research Foundation of Korea(NRF) funded by the Ministry of Education, Science andTechnology (2011-0023147).
References
[1] J. Pedraza, M. A. Patricio, A. de Asıs, and J. M. Molina,“Privacy and legal requirements for developing biometricidentification software in context-based applications,” Inter-national Journal of Bio-Science and Bio-Technology, vol. 2, no.1, pp. 13–24, 2010.
[2] A. K. Jain, S. C. Dass, and K. Nandakumar, “Can soft biometrictraits assist user recognition?” International Society for Opticaland Photonics, vol. 5404, pp. 561–572, 2004.
[3] A. Baig, A. Bouridane, F. Kurugollu, and G. Qu,“Fingerprint—iris fusion based identification system usinga single hamming distance matcher,” International Journal ofBio-Science and Bio-Technology, vol. 1, no. 1, pp. 47–58, 2009.
[4] G. A. Atkinson and M. L. Smith, “Using photometric stereofor face recognition,” International Journal of Bio-Science andBio-Technology, vol. 3, no. 3, pp. 35–44, 2011.
[5] J. L. Wayman, “Large-scale civilian biometric system—issuesand feasibility,” Card Tech/Secure Tech ID, 1997.
[6] E. Newham, The Biometrics Report, SJB Services, 1995.[7] A. K. Jain, S. C. Dass, and K. Nandakumar, “Soft biometric
traits for personal recognition systems,” in Proceedings ofthe International Conference on Biometric Authentication, vol.3072, pp. 731–738, 2004.
[8] S. M. E. Hossain and G. Chetty, “Next generation identityverification based on face-gait biometric,” in Proceedings ofthe International Conference on Biomedical Engineering andTechnology, vol. 11, pp. 142–148, 2011.
[9] J. Matey, D. Ackerman, J. Bergen, and M. Tinker, “Irisrecognition in less constrained environments,” in Advances inBiometrics, vol. 1, pp. 107–131, 2008.
[10] A. Criminisi, A. Zisserman, L. Vangool, S. Bramble, and D.Compton, “A new approach to obtain height measurementsfrom video,” International Society of Optical Engineering, vol.3576, pp. 1–6, 1998.
[11] M. Gervautz and W. Purgathofer, “A simple method for colorquantization: octree quantization,” New Trends in ComputerGraphics, pp. 287–293, 1990.
[12] H. M. Moon and S. B. Pan, “A new human identificationmethod for intelligent video surveillance system,” ComputerCommunications and Networks, pp. 1–6, 2010.
[13] A. K. Jain and U. Park, “Facial marks: Soft biometric for facerecognition,” in Proceedings of the IEEE International Confer-ence on Image Processing (ICIP ’09), pp. 37–40, November2009.
[14] U. Park and A. K. Jain, “Face matching and retrieval using softbiometrics,” Information Forensics and Security, vol. 5, no. 2,pp. 406–415, 2010.
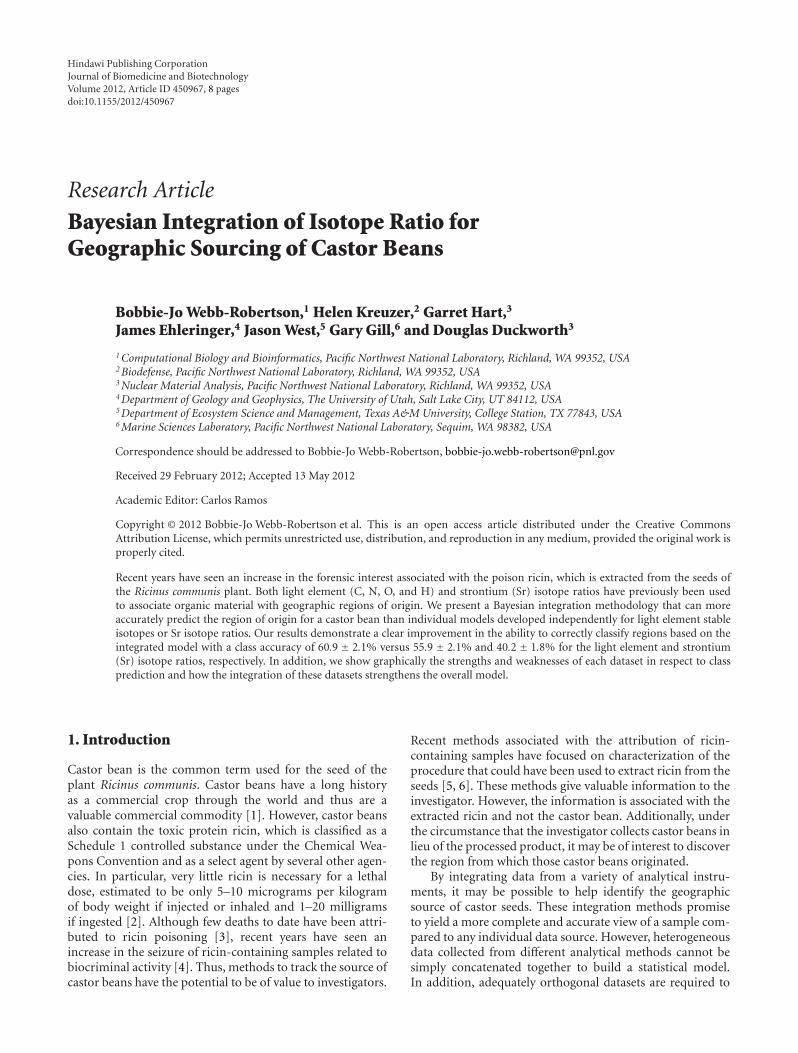
Hindawi Publishing CorporationJournal of Biomedicine and BiotechnologyVolume 2012, Article ID 450967, 8 pagesdoi:10.1155/2012/450967
Research Article
Bayesian Integration of Isotope Ratio forGeographic Sourcing of Castor Beans
Bobbie-Jo Webb-Robertson,1 Helen Kreuzer,2 Garret Hart,3
James Ehleringer,4 Jason West,5 Gary Gill,6 and Douglas Duckworth3
1 Computational Biology and Bioinformatics, Pacific Northwest National Laboratory, Richland, WA 99352, USA2 Biodefense, Pacific Northwest National Laboratory, Richland, WA 99352, USA3 Nuclear Material Analysis, Pacific Northwest National Laboratory, Richland, WA 99352, USA4 Department of Geology and Geophysics, The University of Utah, Salt Lake City, UT 84112, USA5 Department of Ecosystem Science and Management, Texas A&M University, College Station, TX 77843, USA6 Marine Sciences Laboratory, Pacific Northwest National Laboratory, Sequim, WA 98382, USA
Correspondence should be addressed to Bobbie-Jo Webb-Robertson, [email protected]
Received 29 February 2012; Accepted 13 May 2012
Academic Editor: Carlos Ramos
Copyright © 2012 Bobbie-Jo Webb-Robertson et al. This is an open access article distributed under the Creative CommonsAttribution License, which permits unrestricted use, distribution, and reproduction in any medium, provided the original work isproperly cited.
Recent years have seen an increase in the forensic interest associated with the poison ricin, which is extracted from the seeds ofthe Ricinus communis plant. Both light element (C, N, O, and H) and strontium (Sr) isotope ratios have previously been usedto associate organic material with geographic regions of origin. We present a Bayesian integration methodology that can moreaccurately predict the region of origin for a castor bean than individual models developed independently for light element stableisotopes or Sr isotope ratios. Our results demonstrate a clear improvement in the ability to correctly classify regions based on theintegrated model with a class accuracy of 60.9 ± 2.1% versus 55.9 ± 2.1% and 40.2 ± 1.8% for the light element and strontium(Sr) isotope ratios, respectively. In addition, we show graphically the strengths and weaknesses of each dataset in respect to classprediction and how the integration of these datasets strengthens the overall model.
1. Introduction
Castor bean is the common term used for the seed of theplant Ricinus communis. Castor beans have a long historyas a commercial crop through the world and thus are avaluable commercial commodity [1]. However, castor beansalso contain the toxic protein ricin, which is classified as aSchedule 1 controlled substance under the Chemical Wea-pons Convention and as a select agent by several other agen-cies. In particular, very little ricin is necessary for a lethaldose, estimated to be only 5–10 micrograms per kilogramof body weight if injected or inhaled and 1–20 milligramsif ingested [2]. Although few deaths to date have been attri-buted to ricin poisoning [3], recent years have seen anincrease in the seizure of ricin-containing samples related tobiocriminal activity [4]. Thus, methods to track the source ofcastor beans have the potential to be of value to investigators.
Recent methods associated with the attribution of ricin-containing samples have focused on characterization of theprocedure that could have been used to extract ricin from theseeds [5, 6]. These methods give valuable information to theinvestigator. However, the information is associated with theextracted ricin and not the castor bean. Additionally, underthe circumstance that the investigator collects castor beans inlieu of the processed product, it may be of interest to discoverthe region from which those castor beans originated.
By integrating data from a variety of analytical instru-ments, it may be possible to help identify the geographicsource of castor seeds. These integration methods promiseto yield a more complete and accurate view of a sample com-pared to any individual data source. However, heterogeneousdata collected from different analytical methods cannot besimply concatenated together to build a statistical model.In addition, adequately orthogonal datasets are required to

2 Journal of Biomedicine and Biotechnology
construct an integration-based classifier that is more accu-rate than the individual models.
Here, we investigate two sources of isotope ratio (IR) datathat may provide insight into the region of origin for castorbeans: (1) light element (C, N, O, and H) stable isotoperatios (LeIRs) and (2) Sr isotope ratios (SrIRs). Both datatypes have been used to associate plant and animal materialwith regions of origin [7–11]. Stable isotope ratios of C,O, and H in plants are influenced by climate [12], while87/86Sr isotope ratios are influenced by bedrock and soil [13],suggesting that they should be treated as independent data-sets. We find that each dataset can predict region of originmore accurately than expected by chance, but with moderatesuccess. Further, we present a statistical integration approachbased on a simple Bayesian network to utilize the two data-sets in combination to predict region of origin (Figure 1).The integrated classification model significantly improvesour capability to predict region of origin. In addition, thisstatistical integration approach simultaneously yields a clas-sification prediction as well as a probabilistic confidence inthe identification.
2. Experimental Material and Methods
The castor seeds used for this study were a subset of alarger collection assembled by various means including pur-chasing seeds in various locales, accepting donations of seedsfrom collaborators, and sending seeds to volunteer growersthroughout the United States [14]. The collection includesornamental and agricultural varieties of castor seeds; ourgoal was to gather seeds from as geographically diverseregions as possible, and we accepted all acquisitions regard-less of strain. Consequently, the collection is geneticallyvariable. The actual growth conditions of the seeds werealso not controlled; seeds could have been from irrigatedplots, watered only by precipitation or any other method.From this broader collection, we subsampled seeds from 8geographic regions from which we had multiple acquisitionsto determine whether, despite the variation in geneticsand potential cultivation method, there were characteristicisotope ratio values that linked the seeds to their regions oforigin.
The nature of the seed collection imposed significantlimitations in our definition of growth region. Ideally, agrowth region would consist of an area homogeneous ingeology, climate, and isotope ratios of precipitation andsurface water from which we would have multiple seedacquisitions. Given the opportunistic nature of the castorseed collection, however, it lacked the sampling density intightly constrained geographic regions required for the idealexperimental design. We therefore defined regions fromdiverse global locations in which we had multiple acquisi-tions in relatively limited areas. The sample set used in ouranalyses consisted of 68 castor seed acquisitions from 8 suchgeographic regions (Table 1).
We defined two categories of data: (1) δ13C, δ15N, δ18O,and δ2H isotope ratios (LeIRs) of the seeds and (2) 87Sr/86Srisotope ratios (SrIRs) of the seeds. The average value of the
Table 1: Sample sizes and average values for each of the 8 regionsfor the LeIR and SrIR data.
Region No. ObsAvg. IR of seed Avg.
δ13C δ15N δ18O δ2H 87/86Sr
US01 (CA) 7 −26.26 5.97 23.27 −121.89 0.710
US02 (AZ) 4 −27.15 8.04 24.20 −157.90 0.711
US03 (UT) 7 −28.57 7.50 19.11 −183.42 0.709
US04 (TX) 8 −26.63 4.34 22.52 −143.75 0.711
BRAZ01 15 −27.07 8.47 21.88 −136.45 0.715
BRAZ02 7 −27.17 7.74 22.55 −136.17 0.726
CHIN 9 −27.62 5.98 17.72 −171.66 0.711
INDI 11 −27.85 8.22 23.72 −138.34 0.715
Region (R)
C, N, O, Hisotope
ratios (LeIR)
Srisotoperatios
(SrIR)
Figure 1: Basic Bayesian network formulation used for integrationof the light element and Sr isotope ratios, LeIR and SrIR, respec-tively.
observations within each of these data categories is sum-marized in Table 1. Boxplots of the data are given in Figures2 and 3 for the observed LeIRs and SrIR data, respectively.
2.1. Light Element (C, N, O, and H) Isotope Ratios. Lightelement stable isotope ratios of castor beans were measuredby isotope ratio mass spectrometry as described in [14, 15].In brief, five castor beans from a single geographic sourcewere homogenized using a Retsch MM200 machine (RetschGmbH & Co., Germany). The C and N stable isotope ratiosof the paste were determined on a Finnegan MAT Delta Xisotope ratio mass spectrometer (Bremen, Germany) coupledto a Carlo Erba Elemental Analyzer 1108. The O and H stableisotope ratios of the paste were determined using a Thermo-Finnegan Delta Plus XL isotope ratio mass spectrometer(Bremen, Germany) equipped with a thermal conversion ele-mental analyzer (TC/EA). Stable isotope content is measuredas a ratio, R (e.g., 13C/12C), and reported as a delta (δ) valuewhere δ = [(Rsample/Rstandard)− 1]∗1, 000%. In this equation,Rsample is the measured isotope ratio of the sample, andRstandard is the isotope ratio of an internationally recognizedstandard. The standard for C isotope ratio measurement isVienna PeeDee Belemnite (VPDB), for N is air (AIR), and forO and H is Vienna Standard Mean Ocean Water (VSMOW)[16].
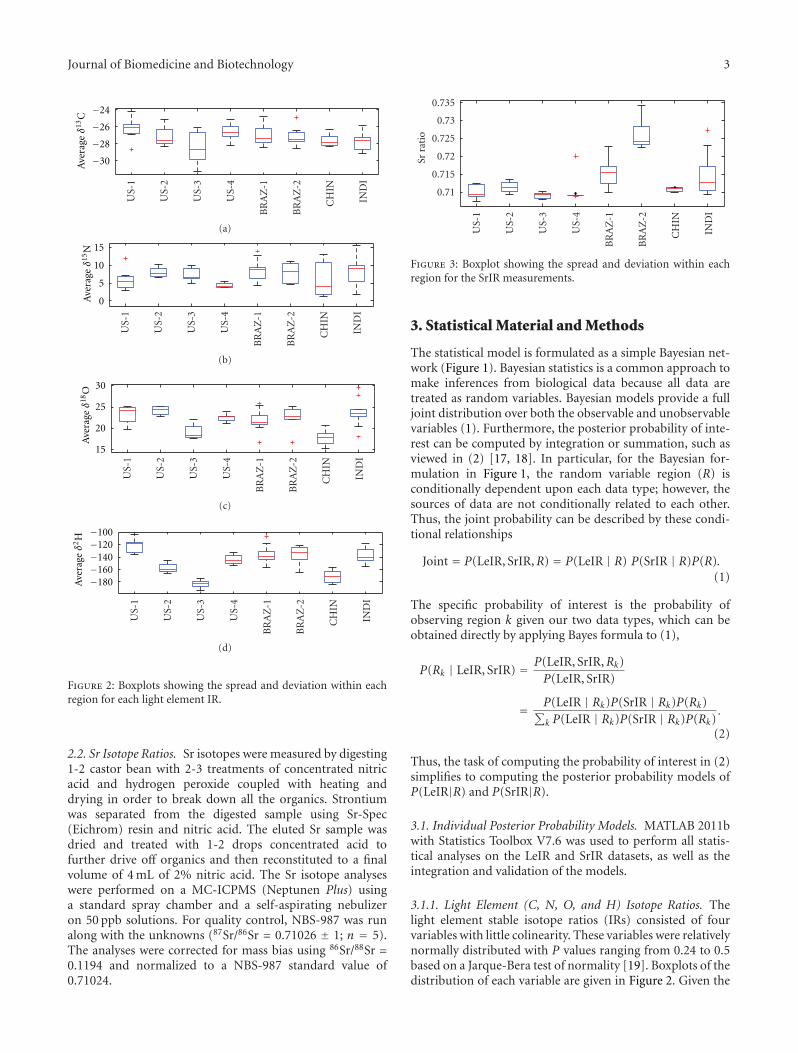
Journal of Biomedicine and Biotechnology 3
US-
1
US-
2
US-
3
US-
4
BR
AZ
-1
BR
AZ
-2
CH
IN
IND
I
−30
−28
−26
−24
Ave
rage
δ13
C
(a)
US-
1
US-
2
US-
3
US-
4
BR
AZ
-1
BR
AZ
-2
CH
IN
IND
I
0
5
10
15
Ave
rage
δ15
N
(b)
US-
1
US-
2
US-
3
US-
4
BR
AZ
-1
BR
AZ
-2
CH
IN
IND
I
15
20
25
30
Ave
rage
δ18
O
(c)
Ave
rage
δ2H
US-
1
US-
2
US-
3
US-
4
BR
AZ
-1
BR
AZ
-2
CH
IN
IND
I
−180−160−140−120−100
(d)
Figure 2: Boxplots showing the spread and deviation within eachregion for each light element IR.
2.2. Sr Isotope Ratios. Sr isotopes were measured by digesting1-2 castor bean with 2-3 treatments of concentrated nitricacid and hydrogen peroxide coupled with heating anddrying in order to break down all the organics. Strontiumwas separated from the digested sample using Sr-Spec(Eichrom) resin and nitric acid. The eluted Sr sample wasdried and treated with 1-2 drops concentrated acid tofurther drive off organics and then reconstituted to a finalvolume of 4 mL of 2% nitric acid. The Sr isotope analyseswere performed on a MC-ICPMS (Neptunen Plus) usinga standard spray chamber and a self-aspirating nebulizeron 50 ppb solutions. For quality control, NBS-987 was runalong with the unknowns (87Sr/86Sr = 0.71026 ± 1; n = 5).The analyses were corrected for mass bias using 86Sr/88Sr =0.1194 and normalized to a NBS-987 standard value of0.71024.
0.71
0.715
0.72
0.725
0.73
0.735
Sr r
atio
US-
1
US-
2
US-
3
US-
4
BR
AZ
-1
BR
AZ
-2
CH
IN
IND
I
Figure 3: Boxplot showing the spread and deviation within eachregion for the SrIR measurements.
3. Statistical Material and Methods
The statistical model is formulated as a simple Bayesian net-work (Figure 1). Bayesian statistics is a common approach tomake inferences from biological data because all data aretreated as random variables. Bayesian models provide a fulljoint distribution over both the observable and unobservablevariables (1). Furthermore, the posterior probability of inte-rest can be computed by integration or summation, such asviewed in (2) [17, 18]. In particular, for the Bayesian for-mulation in Figure 1, the random variable region (R) isconditionally dependent upon each data type; however, thesources of data are not conditionally related to each other.Thus, the joint probability can be described by these condi-tional relationships
Joint = P(LeIR, SrIR,R) = P(LeIR | R) P(SrIR | R)P(R).(1)
The specific probability of interest is the probability ofobserving region k given our two data types, which can beobtained directly by applying Bayes formula to (1),
P(Rk | LeIR, SrIR) = P(LeIR, SrIR,Rk)P(LeIR, SrIR)
= P(LeIR | Rk)P(SrIR | Rk)P(Rk)∑k P(LeIR | Rk)P(SrIR | Rk)P(Rk)
.
(2)
Thus, the task of computing the probability of interest in (2)simplifies to computing the posterior probability models ofP(LeIR|R) and P(SrIR|R).
3.1. Individual Posterior Probability Models. MATLAB 2011bwith Statistics Toolbox V7.6 was used to perform all statis-tical analyses on the LeIR and SrIR datasets, as well as theintegration and validation of the models.
3.1.1. Light Element (C, N, O, and H) Isotope Ratios. Thelight element stable isotope ratios (IRs) consisted of fourvariables with little colinearity. These variables were relativelynormally distributed with P values ranging from 0.24 to 0.5based on a Jarque-Bera test of normality [19]. Boxplots of thedistribution of each variable are given in Figure 2. Given the
4 Journal of Biomedicine and Biotechnology
normal structure of the data and a categorically distributeddependent variable (regions), linear discriminant analysis(LDA) was used to derive a statistical classification model.LDA is a multivariate discrimination method commonlyused for classification in chemometrics [20]. LDA uses statis-tical learning to infer an optimal linear combination of thefeatures to separate the regions. The “classify” function inMATLAB was used to obtain the probability of region k(Rk)given a set of IR values. The statistical model based ontraining data can be described as
P(Rk | δ13C, δ15N, δ18O, δ2H
) = fk(LeIR), (3)
where fk(LeIR) is computed from a multivariate normal dis-tribution. The posterior probability of interest (2) for a testsample j(LeIR j) is computed directly from the “classify”function
P(δ13C, δ15N, δ18O, δ2H | Rk
) = P(
LeIR j | Rk
). (4)
3.1.2. Sr Isotope Ratios. The SrIR data is described by a singleobserved value, and unlike the LeIR, the observed data forSr is not normally distributed (P value of approximately0.001). A boxplot of the distribution of Sr across regions isgiven in Figure 3. Given that the data is non-normal witha single independent variable and categorically distributeddependent variable, multinomial logistic regression (MLR)was used to derive a statistical classification model [21] usingthe “mrnfit” function in MatLab
P(Rk | Sr) = e(Sr•βk)
1 +∑
k e(Sr•βk) , (5)
where βk is the vector of regression coefficients for regionk. Again the posterior is computed in MATLAB using the“mrnval” function to obtain P(SrIR | Rk).
3.2. Classification Model Evaluation Metrics. Each model isevaluated independently using a leave-one-out bootstrap-ping cross-validation approach (LOOB-CV) with resampling[22] to obtain the full set of posterior probabilities for eachsample in our datasets. The LOOB-CV method was selectedto reduce the likelihood of overtraining the model, andresampling is performed to acquire uncertainty estimateson the metrics of model accuracy. In particular, for theLOOB-CV method, each sample is left out to create N data-sets [X−1,X−2, . . . ,X−N ], where N = 68 for the data des-cribed in Section 2. A set of 100 bootstrap samples, eachcontaining 50 samples, are randomly selected for each X−i,[B(1)−i ,B(2)
−i , . . . ,B(100)−i ]. The model is trained on each B(k)
−i , andthe posterior of sample i is obtained. The posteriors acrossthe 100 bootstrap samples are averaged to obtain a moreaccurate estimate of the posterior probability.
The results are evaluated using two approaches: (1) ave-rage classification accuracy (CA) and (2) average area undera receiver operating characteristic curve (AUC). To computethese, each sample was defined by a binary vector whereall values are initialized to zero. The probabilities for thesample were sorted, and all locations equal to or greater
than the correct answer were set to 1. For example, supposethe correct region has the third largest probability of the8, then it is set to Si = [0, 0, 1, 1, 1, 1, 1, 1]. If the correctregion is identified as the most probable then this becomesSi = [1, 1, 1, 1, 1, 1, 1, 1]. The CA is defined as the fractionof samples that are correctly classified into the appropriateregion
CA =∑
i Si1N
. (6)
The AUC is computed based on a modified receiver operatingcharacteristic (ROC) curve. ROC curves traditionally plotthe false positive rate (FPR) versus true positive rate (TPR)of a binary classifier. For this data, there are 8 possible classeswith one correct answer and seven potential false identifica-tions. Thus, there may be 0, 1, 2, 3, 4, 5, 6 or 7 regionsincorrectly identified prior to correct answer, which meansthat each sample may have an FPR defined as one of theseeight values [0, 1/7, 2/7, 3/7, 4/7, 5/7, 6/7, 1]. Based on theseFPR states, the associated TPR for the full dataset is com-puted as the total number of samples that have an FPR lessthan or equal to the defined value,
tprm =∑
i SimN
. (7)
Note that CA = tpr1. Similar to a binary ROC curve, a per-fect classifier would identify all samples correctly with noregions correctly identified ahead of the true classification,which would result in an AUC of 1.0. Additionally, a randompermutation would yield a linear relationship between theFPR and the TPR and an AUC of 0.5.
4. Results and Discussion
Prior to evaluation of the improvement in classification accu-racy based on the integrated model, an exhaustive evaluationof the variables that could be used for the LeIR data modelis performed. There are 15 possible combinations of thefour light element IRs (Table 2). For each combination, theaverage CA and the average AUC are computed (6) and (7)and are ordered in Table 2 by average CA. The most accuratemodel is the one that includes all variables, although themodels excluding either O, H, or both are very similar. Theaverage ROC, however, is nearly identical for these top fourmodels. This result is consistent with past observations thatclimatic factors and thus geography influence the C, O, andH isotope ratios of plants [23–28]. These effects are likely tobe similar for plants growing in similar geographic locales. Nisotope ratios of a single species, in contrast, are a functionof N sources such as fertilizer (if any) and are likely tobe independent of geography, at least in most cases [29].However, since the inclusion of N improves our ability toclassify these regions and the IR of O may be highly valuableto regions not included in our sample dataset and it does notdecrease accuracy, we utilize the LDA model that included allfour variables for the development of statistical models forthe purposes of integration.
The LOOB-CV analysis was performed 100 times, whichyielded an average CA of 55.9% ± 2.1% and 40.2% ± 1.8%

Journal of Biomedicine and Biotechnology 5
Table 2: The average CA and AUC for all possible combination ofthe variables in the LeIR data.
Variables Average CA Average AUC
δ2H δ18O δ13C δ15N 55.9% 0.88
δ2H δ13C δ15N 55.2% 0.87
δ18O δ13C δ15N 53.3% 0.88
δ13C δ15N 52.2% 0.87
δ2H δ18O δ15N 45.1% 0.84
δ18O δ15N 42.8% 0.83
δ2H δ15N 36.8% 0.83
δ2H δ13C 35.8% 0.78
δ2H δ18O δ13C 35.0% 0.78
δ18O δ13C 33.9% 0.78
δ13C 31.4% 0.75
δ15N 30.7% 0.82
δ2H δ18O 23.5% 0.67
δ18O 23.0% 0.63
δ2H 19.1% 0.69
for the LeIR and SrIR datasets, respectively. The integratedposterior probability was computed as described in (2), andthe overall classification accuracy improved to 60.9%±2.1%.This is a significant improvement over the individual IRmodel; the null hypothesis that the average difference in themeans between the two models is equal to zero is rejectedwith a P value less than 1e − 40 (based on a two-samplet-test). The ROC curve (Figure 4), shows this is a cleartrend with an improvement of the AUC to 0.94 versus 0.88and 0.80 for LeIR and SrIR, respectively. The 100 sampledobservations of the AUC of the integrated model are signi-ficant larger than the LeIR model at a P value < 1e−10 (basedon a two-sample t-test), and the curves depicted in Figure 4are significantly different at a P value of 0.06 (based on asign rank nonparametric paired test) [30]. Thus, althoughSrIR does not perform well alone, it does offer a significantcontribution if integrated with the LeIR data.
The evaluation of the datasets via the CA and AUC givesan overall view of the predictability of the datasets with res-pect to region but does not give insight across the regions.The improved accuracy of the integrated model points toa capability of one dataset to correctly predict the appro-priate region with higher probability than the misclassifiedprobability of the other dataset. To evaluate the classificationaccuracy in respect to region, a visualization akin to that usedin Visual Integration for Bayesian Evaluation (VIBE) wasemployed [31]. Figure 5 gives classification accuracy plotacross the 8 regions as the true class on the y-axis andpredicted class on the x-axis. A perfect classifier would havea diagonal of solid black since all of the predicted classeswould be equal to the true classes and have a value of 1. Theclassification accuracies observed in Figure 5 are slightly dif-ferent than above since this is a single sample from the 100iterations performed. However, a similar trend is observedin which the IR data has a larger CA than the Sr data andthe integrated model outperforms either alone. The class
0 0.1 0.2 0.3 0.4 0.5 0.6 0.7 0.8 0.9 10
0.1
0.2
0.3
0.4
0.5
0.6
0.7
0.8
0.9
1
False positive rate (fraction of regions incorrectly scored ahead of true class)
Tru
e po
siti
ve r
ate
RandomSrIR (AUC= 0.8)
LeIR (AUC = 0.88)
Integration (AUC = 0.94)
Figure 4: Modified ROC curves to evaluate the overall capability ofeach data type to predict region versus the integrated model.
accuracy plot quickly demonstrates that the IR data has themost challenge distinguishing regions 5 through 8 (outsideof the united states), and most often regions are misclassifiedinto region 4 (US04 = TX)—see Table 1. The Sr data hasa completely different profile in terms of how it correctlyand incorrectly classifies samples. It most often misclassifiessamples into either the third or fifth regions, US03 (UT) andBRAZ01. In addition, it never correctly classifies any samplesfrom regions 1, 2, 4, and 8. The integrated model on theright corrects many of the imbalances observed from theindividual datasets. The specific geographic regions that arebeing correctly classified are easily distinguished from theclass accuracy plot, as well as those regions that cannot beeasily distinguished by isotope ratios.
The relative lack of power of the O and H isotope ratiodata to link seeds to their regions of origin initially appearedsurprising, as O and H isotope ratios of plant material havebeen shown to be linked to geographic region of origin[12]. Plants derive O and H atoms from their water sources,while there is a strong and well-recognized link between theisotope ratios of precipitation and geography [32]. However,the limitations on experimental design imposed by natureof the seed collection might lead one to expect this effect.Some of the defined growth regions spanned a gradient ofclimate. For example, the “Texas” region included samplesfrom the vicinity of Lubbock, which has an arid climate, andHouston, which is quite humid. The surface water isotoperatios of these two parts of the state are predicted to differsomewhat, based on US Geological Survey data [33]. Thus,the source water accessed the plants as well as the extent ofevaporative enrichment of plant leaf water, a source used forbiosynthesis of many plant organic components [12], wouldlikely be expected to differ and result in differing O andH isotope ratios in the seeds. A higher sampling densityin strictly limited geographic regions would permit a betteranalysis of the effect of O and H isotope ratios on regionof origin association. Another possible reason for the lackof power of O and H isotope ratios to associate seeds with

6 Journal of Biomedicine and Biotechnology
Tru
e cl
ass
Predicted class
US0
1
US0
2
US0
3
US0
4
BR
AZ
01
BR
AZ
02
CH
IN
IND
I
Predicted class
US0
1
US0
2
US0
3
US0
4
BR
AZ
01
BR
AZ
02
CH
IN
IND
I
US01
US02
US03
US04
BRAZ01
BRAZ02
CHIN
INDI
Tru
e cl
ass
Predicted class
US0
1
US0
2
US0
3
US0
4
BR
AZ
01
BR
AZ
02
CH
IN
IND
IUS01
US02
US03
US04
BRAZ01
BRAZ02
CHIN
INDI
Tru
e cl
ass
Integrated model (60.3%)
US01
US02
US03
US04
BRAZ01
BRAZ02
CHIN
INDI0
0.1
0.2
0.3
0.4
0.5
0.6
0.7
0.8
0.9
1
LeIR (CA = 55.9%)
SrIR (CA = 41.2%)
Figure 5: Class accuracy plots show what fractions of the samples are being classified into specific groups, allowing a direct comparisonof the true versus predicted classes: the integrated model on the right shows a clear improvement in overall matches between the true andpredicted classes.
regions of origin is the potential variation in cultivationconditions of the seeds. Even if a region could be more tightlydefined, cultivation practices could influence the actual iso-tope ratios of the water used by the castor plants. For exam-ple, irrigation via open ditches could result in significantevaporative enrichment in isotopic content of the water takenup by the plants, while drawing water from a deep well couldprovide them with water isotopically different from surfacewater. Controlling the environmental variation imposed bycultivation conditions might also improve the discriminationpower of the O and H isotope ratios. Finally, the genetic vari-ability of the castor seeds may affect water dynamics withinthe individual plants, which could impart some variation tothe O and H isotope ratios of plants growing in identicalenvironments.
The ability of isotope ratios to associate castor seeds withregion of origin despite the limitations imposed by samplingdensity, the genetic variability of the seeds, and the probablevariation in cultivation methods is noteworthy. Presumably,if we had been able to more strictly define geographic regionsto those with homogenous climate and geology and controlthe variables of genetics and growth conditions, the accuracyof the association would be improved, perhaps significantly.
Further experiments with multiple seed acquisitions fromtightly defined source regions could address this question.For real-world application of isotope ratios for assigningregion of origin, however, it is unlikely that either the geneticstrain of the sample (whether of castor seeds or some otherplant product such as a food) or its cultivation method wouldbe controllable. Demonstrating that integrated isotopic datacan associate a plant product with its region of origin in theabsence of such control suggests that this approach could bebroadly useful for geographic sourcing.
5. Conclusion
Both light element (C, N, O, and H) stable isotope ratios and87/86Sr isotope ratios have been used to associate plant andanimal materials with its geographic region of origin. Here,we show that each of these datasets independently canassociate castor seeds with region of origin more accuratelythan would be expected by chance, as shown by both classi-fication accuracy and a modified ROC curve model. Bayesianintegration of these two data streams yielded results that weresignificantly better than those from either individual dataset.

Journal of Biomedicine and Biotechnology 7
This approach illustrates the benefits afforded by a rigorousapproach to data integration and its application to forensicscommunity.
Acknowledgments
This work was supported in part by Laboratory DirectedResearch and Development at Pacific Northwest NationalLaboratory (PNNL) and the National Science Foundation(Grant 0743543). PNNL is a multiprogram national labora-tory operated by Battelle for the U.S. Department of Energyunder Contract DE-AC06-76RL01830.
References
[1] E. A. Weiss, Castor. Oilseed Crops, Longman, London, UK,1983.
[2] S. M. Bradberry, K. J. Dickers, P. Rice, G. D. Griffiths, and J.A. Vale, “Ricin poisoning,” Toxicological Reviews, vol. 22, no.1, pp. 65–70, 2003.
[3] K. R. Challoner and M. M. McCarron, “Castor bean intoxica-tion,” Annals of Emergency Medicine, vol. 19, no. 10, pp. 1177–1183, 1990.
[4] J. M. Bale et al., Ricin Found in London: An al-Qa’ida Con-nection? James Martin Center for Nonproliferation Studies,Monterey, Calif, USA, 2002.
[5] H. A. Colburn, D. S. Wunschel, H. W. Kreuzer, J. J. Moran,K. C. Antolick, and A. M. Melville, “Analysis of carbohydrateand fatty acid marker abundance in ricin toxin preparationsfor forensic information,” Analytical Chemistry, vol. 82, no. 14,pp. 6040–6047, 2010.
[6] H. W. Kreuzer, J. H. Wahl, C. N. Metoyer, H. A. Colburn, andK. L. Wahl, “Detection of acetone processing of castor beanmash for forensic investigation of ricin preparation methods,”Journal of Forensic Sciences, vol. 55, no. 4, pp. 908–914, 2010.
[7] T. E. Cerling, G. Wittemyer, H. B. Rasmussen et al., “Stable iso-topes in elephant hair document migration patterns and dietchanges,” Proceedings of the National Academy of Sciences of theUnited States of America, vol. 103, no. 2, pp. 371–373, 2006.
[8] J. R. Ehleringer, J. F. Casale, M. J. Lott, and V. L. Ford,“Tracing the geographical origin of cocaine: Cocaine carriesa chemical fingerprint from the region where the coca wasgrown,” Nature, vol. 408, no. 6810, pp. 311–312, 2000.
[9] J. R. Ehleringer, D. A. Cooper, M. J. Lott, and C. S. Cook,“Geo-location of heroin and cocaine by stable isotope ratios,”Forensic Science International, vol. 106, no. 1, pp. 27–35, 1999.
[10] S. Swoboda, M. Brunner, S. F. Boulyga, P. Galler, M. Horacek,and T. Prohaska, “Identification of Marchfeld asparagus usingSr isotope ratio measurements by MC-ICP-MS,” Analyticaland Bioanalytical Chemistry, vol. 390, no. 2, pp. 487–494, 2008.
[11] J. B. West, J. R. Ehleringer, and T. E. Cerling, “Geography andvintage predicted by a novel GIS model of wine δ18O,” Journalof Agricultural and Food Chemistry, vol. 55, no. 17, pp. 7075–7083, 2007.
[12] J. B. West, H. W. Kreuzer, J. R. Ehleringer et al., “Approachesto plant hydrogen and oxygen isoscapes generation,” in Iso-scapes: Understanding Movement, Pattern, and Process on Earththrough Isotope Mapping, J. B. West, Ed., pp. 161–178, Sprin-ger, Monterey, Calif, USA, 2010.
[13] B. L. Beard and C. M. Johnson, “Strontium isotope composi-tion of skeletal material can determine the birth place and geo-graphic mobility of humans and animals,” Journal of ForensicSciences, vol. 45, no. 5, pp. 1049–1061, 2000.
[14] H. W. Kreuzer, J. B. West, and J. R. Ehleringer, “Forensicapplications of light-element stable isotope ratios of Ricinuscommunis seeds and ricin preparations ,” Journal of ForensicSciences. In press.
[15] J. R. Ehleringer et al., “Stable isotope ratio analyses of castorbean: a ricin signature program,” in Federal Bureau of Inves-tigation, 2006.
[16] T. B. Coplen, “New guidelines for reporting stable hydrogen,carbon and oxygen isotope-ratio data,” Geochimica et Cosmo-chimica Acta, vol. 60, no. 17, pp. 3359–3360, 1996.
[17] J. M. Bernardo and A. F. M. Smith, Bayesian Theory, JohnWiley & Sons, New York, 2000.
[18] B. J. Webb-Robertson, L. A. McCue, N. Beagley et al., “A Baye-sian integration model of high-throughput proteomics andmetabolomics data for improved early detection of microbialinfections,” Pacific Symposium on Biocomputing, pp. 451–463,2009.
[19] C. M. Jarque and A. K. Bera, “A test for normality of obser-vations and regression residuals,” International StatisticalReview, vol. 55, no. 2, pp. 163–172, 1987.
[20] K. R. Beebe, R. J. Pell, and M. B. Seasholtz, Chemometrics:A Practical Guide, John Wiley & Sons, Hoboken, NJ, USA,1998.
[21] P. McCullagh and J. A. Nelder, Generalized Linear Models,Chapman & Hall, New York, NY, USA, 1990.
[22] W. Jiang and R. Simon, “A comparison of bootstrap methodsand an adjusted bootstrap approach for estimating the predic-tion error in microarray classification,” Statistics in Medicine,vol. 26, no. 29, pp. 5320–5334, 2007.
[23] G. D. Farquhar, J. R. Ehleringer, and K. T. Hubick, “Carbonisotope discrimination and photosynthesis,” Annual Review ofPlant Physiology and Molecular Biology, vol. 40, pp. 503–537,1989.
[24] G. D. Farquhar and R. A. Richards, “Isotopic compositionof plant carbon correlates with water-use efficiency of wheatgenotypes,” Australian Journal of Plant Physiology, vol. 11, no.6, pp. 539–552, 1984.
[25] G. D. Farquhar, M. H. O’Leary, and J. A. Berry, “On therelationship between carbon isotope discrimination and theintercellular carbon dioxide concentration in leaves,” Austra-lian Journal of Plant Physiology, vol. 9, no. 2, pp. 121–137,1982.
[26] L. Sternberg, M. DeNiro, and R. Savidge, “Oxygen isotopeexchange between metabolites and water during biochemicalreactions leading to cellulose synthesis,” Plant Physiology, vol.82, pp. 423–427, 1986.
[27] J. Gray and P. Thompson, “Climatic information from 18O/16O ratios of cellulose in tree rings,” Nature, vol. 262, no. 5568,pp. 481–482, 1976.
[28] S. Epstein, P. Thompson, and C. J. Yapp, “Oxygen and hydro-gen isotopic ratios in plant cellulose,” Science, vol. 198, no.4323, pp. 1209–1215, 1977.
[29] L. H. Pardo and K. J. Nadelhoffer et al., “Using nitrogenisotope ratios to assess terrestrial ecosystems at regional andglobal scales,” in Isoscapes: Understanding Movement, Pattern,and Process on Earth through Isotope Mapping, J. B. Westet al., Ed., pp. 221–250, Springer, Dordrecht, The Netherlands,2010.

8 Journal of Biomedicine and Biotechnology
[30] R. L. Ott and M. Longnecker, An Introduction to StatisticalMethods and Data Analysis, Brooks/Cole, Belmont, 6th edi-tion, 2010.
[31] N. Beagley, K. G. Stratton, and B. J. Webb-Robertson, “VIBE2.0: visual integration for bayesian evaluation,” Bioinformatics(Oxford, England), vol. 26, no. 2, pp. 280–282, 2010.
[32] H. Craig, “Isotopic variations in meteoric waters,” Science, vol.133, no. 3465, pp. 1702–1703, 1961.
[33] C. Kendall and T. B. Coplen, “Distribution of oxygen-18 anddeuteriun in river waters across the United States,” Hydro-logical Processes, vol. 15, no. 7, pp. 1363–1393, 2001.
Hindawi Publishing CorporationJournal of Biomedicine and BiotechnologyVolume 2012, Article ID 546021, 5 pagesdoi:10.1155/2012/546021
Research Article
Secure Remote Health Monitoring withUnreliable Mobile Devices
Minho Shin
Myongji University, Yongin, Gyeonggi-do 449-728, Republic of Korea
Correspondence should be addressed to Minho Shin, [email protected]
Received 17 May 2012; Accepted 28 May 2012
Academic Editor: Sabah Mohammed
Copyright © 2012 Minho Shin. This is an open access article distributed under the Creative Commons Attribution License, whichpermits unrestricted use, distribution, and reproduction in any medium, provided the original work is properly cited.
As the nation’s healthcare information infrastructure continues to evolve, new technologies promise to provide readily accessiblehealth information that can help people address personal and community health concerns. In particular, wearable and implantablemedical sensors and portable computing devices present many opportunities for providing timely health information to healthproviders, public health professionals, and consumers. Concerns about privacy and information quality, however, may impedethe development and deployment of these technologies for remote health monitoring. Patients may fail to apply sensors correctly,device can be stolen or compromised (exposing the medical data therein to a malicious party), low-cost sensors controlled by acapable attacker might generate falsified data, and sensor data sent to the server can be captured in the air by an eavesdropper;there are many opportunities for sensitive health data to be lost, forged, or exposed. In this paper, we design a framework for secureremote health-monitoring systems; we build a realistic risk model for sensor-data quality and propose a new health-monitoringarchitecture that is secure despite the weaknesses of common personal devices. For evaluation, we plan to implement a proof ofconcept for secure health monitoring.
1. Introduction
The nation has an urgent need to build a national healthcareinformation infrastructure (NHII) that provides healthinformation to all who need to make sound decisions abouthealth [1]. Readily accessible and reliable health informationwould greatly improve everyone’s ability to address personaland community health concerns. Health emergencies alsorequire prompt and authoritative information about the sit-uation to be readily available to those involved. Fortunately,present information technology brings us the hope thatsignificant improvements in the public’ health and wellbeingare not only possible but close at hand.
Wearable and implantable medical sensors and portablecomputing devices present many opportunities for provid-ing timely health information to health providers, publichealth professionals, and consumers [2]. By supplyingreal-time health information, or extensive measurementscollected continuously, a sensor-based health-monitoringsystem complements the current healthcare informationinfrastructure, which is based on relatively static, sparsely
collected information in the patient’s medical records. Aremote health-monitoring system may help to reduce thecost of healthcare [3] and to simultaneously improve thequality of the healthcare; patients may spend less timein the hospital and yet have more detailed health data,measured by wearable sensors as they go about their dailyactivities; caregivers can more quickly react to the medicalemergencies of elders; trainers can analyze a trainee’s fitnesslevel; consumers can maintain their own health and wellness.
Privacy and information quality, however, are two majorconcerns in the development and deployment of remotehealth-monitoring systems [4, 5]. To be viable, any such sys-tem must provide usable devices that respect patient privacywhile also retaining data quality required for the medicalpurpose it serves. There are many opportunities for the datato become lost, damaged, forged, or exposed: patients mayfail to apply sensors correctly, leading to medically incorrectreadings; the patient’s device may be misplaced, stolen,or compromised, causing the medical data stored in thedevice to be divulged [6]; the sensor data may travel acrossmultiple devices and networks before it is presented to the

2 Journal of Biomedicine and Biotechnology
medical team. The problem is especially challenging, giventhe difficulty of hardening low-cost sensors and the personaldevices that collect, process, and forward the medical data,and given that all such devices will communicate overwireless networks.
When such a system is compromised, the consequencesmay be dire. Incorrect sensor data, whether it is inaccurate,manipulated, delayed, or originating from the wrong patient,can lead to incorrect diagnosis or inappropriate treatments.When the data is used for medical research or epidemio-logical studies, public health can be endangered. When thedata is inappropriately disclosed, it may expose the patient’smedical problems, and details of treatments underway.Insufficient data integrity may cause health professionalsto mistrust the data and may make them reluctant to usedevices that may, otherwise, be beneficial to patient health.Insufficient protection of patient privacy may reduce thepatients’ willingness to wear medical sensors, or even inspirethem to cause the sensors to report incorrect data, againreducing the health benefit of these technologies.
The problem is difficult due to the lack of control overthe situation at the patient’s end. Correct application ofsensors and proper configuration of the device depend on thepatient’s ability and diligence. Education helps, but peoplemake mistakes and many fail to implement security practices[7]. The problem becomes harder when the hardware orsoftware components are integrated into a personal devicesuch as a cellular phone, a PDA, or a smart watch. Suchdevices have limited security features and are vulnerable tounauthorized access; some security mechanisms (like TPM[8, 9]) may be too restrictive and difficult to use. The useof dedicated devices, however, would be costly, has limitedflexibility, and may reduce patient participation.
In this paper, we will address these issues by designinga framework for secure remote health-monitoring systems.Given the time available (one year), we will focus most on thedata-quality issues. Specifically, we want to (i) build a realisticrisk model for sensor-data quality, by interacting with healthprofessionals, (ii) develop protocols and mechanisms fordata protection and quality assurance, and (iii) propose anew health-monitoring architecture that is secure despitethe weaknesses of common personal devices. For evaluation,we will implement a proof of concept for secure healthmonitoring.
2. Risk Analysis
First, we define some terminology.
(i) Medical Sensor Data. Data generated by sensors that candirectly describe some physiological condition of a person orcan describe the context of the person or the situation, suchas movement, location, temperature, or noise level.
(ii) Monitoring Software. A software component that per-forms health-monitoring tasks at the patient’s end; it controlssensors, collects medical sensor data from sensors, processesthe data, and reports the data to the server.
(iii) Monitoring Device. A portable device that can beconnected to the Internet through a wireless connection andcan communicate with wearable sensors through short-rangewireless connection; the monitoring software runs within themonitoring device.
(iv) Patient. The person whose medical condition is mon-itored by the health-monitoring system, who wears thesensors and carries the monitoring device; the monitoringdevice may be owned by the patient and used for othernonmedical purposes.
(v) Provider. The party who deploys the health-monitoringsystem and collects the medical sensor data of the patient,based on which it provides health services to the patient suchas medical diagnosis [10], emergency response, or fitnesstraining; examples include physicians, nursing homes, orpersonal trainers.
To design a secure health-monitoring system, we firstneed to understand what determines the quality of themedical sensor data and how we can quantify the degreeof the data quality. Specifically, we want to identify factorsthat affect the data quality and then analyze to what extentthey influence the data quality. Others have described overallsecurity challenges in health-monitoring systems [4], andinitial ideas for protecting health-data integrity [11], but anin-depth and realistic analysis of the problem is lacking in theliterature.
As a preliminary analysis, we recently identified elevenfactors that can affect the quality of medical sensor data [5](see next section for detail). To ensure or evaluate the dataquality of a health-monitoring system, one should take thesefactors into account. Without knowledge of physiology andpractical concerns, however, it is difficult to quantify to whatextent each factor will contribute to the data quality.
3. Quality Control Framework
In this section, we design a quality-control framework basedon the risk analysis in the previous section. The frameworkis a set of processes that ensure, verify, and evaluate the dataquality.
To design a quality-control framework, we first analyzedthe health-monitoring system as a sequence of processes,assigned related factors to each process, and then identifiedpossible methods for the quality control of individual factors.Figure 1 illustrates our analysis. Medical sensing begins withsensing the physiology of the patient (sense process). Eachsensor generates sensor data at a certain rate and transmitsthem to the device through a wireless connection (transferprocess). The monitoring device collects data from sensors,processes them as needed (collect process), and then forwardsthem to the provider (transfer process). Upon receiving thedata from the device, the provider’s server evaluates thevalidity of the data (verify process) and then presents the datato the provider. When it presents the data, the server alsopresents the level of the data quality to the provider (assessprocess). Figure 1 lists the factors that are related to each

Journal of Biomedicine and Biotechnology 3
process. For each factor, the possible methods for qualitycontrol are shown. In the following, we discuss our analysisin more detail. (For brevity, we skip the factors that are self-explanatory.)
(i) Accuracy. The accuracy of a sensor depends on its designand manufacturer (i.e., sensor profile), the time since thelatest calibration, and the age of the sensor. The data qualitydepends on the accuracy expressed by the expected errorbound.
(ii) Granularity. The quality of sensor data also depends onthe level of detail that a sensor can provide.
(iii) Application. The data quality also depends on correctapplication of the sensor to the body; if the sensor is notcorrectly applied to the body, it generates incorrect sensordata. If the patient is responsible for the application, thequality of sensor application depends on the patient’s abilityand diligence. The patient’s ability depends on the education,age, and prior experience. When a sensor is incorrectlyapplied, the data is likely to deviate from the range ofvalues that are considered reasonable as a physiological value.We call this reasonableness of the medical data soundness.The soundness of data includes physiological soundness andcontextual soundness; we explain these in more detail belowwhere we explain the verification process.
(iv) Synchronization. It is often medically necessary to collectmultiple sensor readings of different modalities, and a healthprofessional can derive a medical condition from theircombination. For the combination to be useful, the sensorreadings should be temporally synchronized. If sensorscannot time-stamp each data, the device should do so, butit should also make sure that the sensor data is sampled atthat moment (i.e., not replayed by an adversary). The dataquality depends on the granularity of the synchronization.
(v) Information Loss by Aggregation. Communication iscostly. To save the amount of information to be sent,the device can aggregate sensor readings before sending(e.g., reporting the average per minute). However, everyaggregation loses some information in data, and the qualityof data depends on the amount of information lost by theaggregation.
Most factors related to sense, collect, and transfer pro-cesses are syntactic (except sensor application); they dependlittle on the semantics of the medical data. For example, onecan protect message integrity without knowing the meaningof the data contained in the message. However, medical datahas rich semantics that can determine what data is sound asmedical data. The verification process exploits the semanticsof the medical sensor data to verify if the data is appropriate,useful, or acceptable for the purpose of health monitoring.
(i) Patient Authentication: patient authentication verifieswhether the sensors are monitoring the right person. Bio-metric data (e.g., fingerprint [12]) is simple and accurate but
its permanence can raise a privacy issue [13]. We can alsocompare the data with the patient’s past data or the medicalprofile (e.g., disease or weakness) to verify the patient’sidentity. The data quality depends on the likelihood that weare monitoring the right person.
(ii) Physiological Soundness: a physiological data cannottake arbitrary values. One can check if the value falls ina reasonable range (range check), if it is coherent withthe known probability distribution (probability distribu-tion), if its temporal change exhibits a reasonable behavior(autocorrelation), or if sensor values of different modalitiesaccord with the known correlations between them. (Such ananomaly can also signify a medical problem of the patient,and the verification methods can also apply to the problemof anomaly detection. However, such “emergency detection”is outside the scope of this work).
(iii) Contextual Soundness: like physiological soundness, wecan verify the data quality by comparing the medical datawith some context data such as body movement, location, ortemperature. For example, the acceptable values for heart-rate or blood pressure are different when the patient isrunning or sleeping.
When quality verification fails, the quality of incomingdata becomes uncertain. Even if all the verifications succeed,there are many opportunities for data to become incorrect(see Figure 1). To deal with the uncertainty, the providersneed to know how much they can trust the data and whatis causing the problem. The assessment process takes all thefactors into account, judges the current level of the dataquality, and presents that judgment to the provider.
Prior work on data integrity in health-monitoring sys-tems focused on detecting packet loss [14], improving falsepositives using sensor correlation [15], or categorizing thedata quality into four discrete states based on observed errorand lack of data [16]. Giani et al. [11] proposed a broad rangeof methods for data validation, but only basic concepts wereproposed. Compared to prior work, our approach providesa generic framework for the quality control of a health-monitoring system.
DS theory has many uses; for example, it was recentlyused for evaluating the performance of intrusion detectionsystems (IDS) [17]. While they simply combined the partialjudgments that are provided by existing IDS schemes, ourfuture work will actually define belief functions for eachfactor and also explore other possibilities for combiningpartial results, seeking methods that fit better to health-monitoring applications.
4. Architecture
So that patients need not to carry a dedicated monitoringdevice, we want to leverage the mobile device they alreadycarry—their cellphone. Mobile phones are increasinglypowerful, effectively personal computing devices with sub-stantial computation, storage, and networking capabilities.Furthermore, they are increasingly able to sense location

4 Journal of Biomedicine and Biotechnology
• Factors • Sensor authenticity
• Sensor integrity
• Accuracy
• Granularity
• Frequency
• Application
•Message integrity
• Confidentiality
• Timeliness
• Device authenticity
• Device integrity
• Data confidentiality
• Synchronization
• Information loss
• Patient authentication
• Physiological soundness
• Contextual soundness
Sense Transfer Collect Transfer Verify Assess
Patient ServerServerDevice ProviderSensor Wireless Wireless/internet
∗Semantic methods
–MAC
–encryption
–delay
–device authentication
–device security
–device security
–aggregation method
–time-stamping–time measurement
–biometric–Methods
–autocorrelation∗
–intercorrelation∗
–intercorrelation∗
–patient profile∗
–range check∗
–patient history∗
–prob. distribution∗
–sensor security
–calibration date–age
–patients ability
–authentication
–sampling rate
–sensor profile
–sensor profile
–data soundness∗
Figure 1: Quality control of remote health monitoring.
S1
S2
S3
S4
Authenticator
Key
Monitoring S/W
Auditor
Server
Storage Fusor
Internet
Inte
rfac
e
Monitoring unitMobile deviceSensors
Figure 2: Health monitoring architecture.
(GPS), motion (accelerometer), light, proximity, tempera-ture, sound (microphone), and video (camera). The useof existing devices has advantages in deployment cost andusability [18].
On the contrary, turning a personal device to a health-monitoring device also has challenges. First, personal devicesare diverse in software platform and security mechanism.The developer must adapt to the wide variety of features (andvarying degrees of security) on mobile platforms such asWindows Mobile, Mac OS X, and Symbian. Although somefuture platforms may have strong security support such asa TPM [8, 9], a TPM may not allow the patient to installmonitoring software without going through a complicatedplatform-certification process.
To address these challenges and yet still leverage thepatient’s mobile phone as a platform, we design a novelarchitecture that decouples the monitoring component fromthe personal device. Suppose that the health providerdistributes small health-monitoring units (HMUs) to patientsand asks them to keep the unit plugged into the device
through a common interface such as SD card, miniUSB, orSIM card. (Although not all current phones have expansionslots, and GSM phones only have one SIM-card interface,we imagine next-generation mobile phones that have astandard expansion slot of similar form factor and capabilityto these examples). The HMU can store secret keys andcompute some cryptographic functions (as SIM card can doin today’s GSM phones). As shown in Figure 2, the unit canauthenticate sensors (authenticator) and verify the authen-ticity of sensor data forwarded by the monitoring software(auditor). When needed, it aggregates sensor data beforesending to the provider (fusor). The HMU adds messageauthentication codes to messages sent to the provider, and,without HMU, the device cannot prove authenticity of thesensor data to the provider. The HMU makes the health-monitoring portable from device to device, easy to manage,and hard to compromise; there are many opportunities foradversaries to access the device through software attacks [6],while it requires a hardware attack to compromise the HMU[19].
Journal of Biomedicine and Biotechnology 5
5. Implementation Plan
To evaluate the potential for our approach in real applica-tions, we plan to implement the framework using currentmobile-phone and smart-card technology. For test platform,we will use G1 and Nexus One Android-based phones. Formonitoring unit, we consider Giesecke and Devrient (G&D)smart card [20]. The software running within the monitoringunit will be implemented as a Java applet for the JavaCardplatform. Collected data will be sent to the central server via3G network.
As an application, we plan to implement Sleep Actigra-phy using accelerometer readings to measure the patient’ssleep pattern. In addition to security analysis, we plan toevaluate the feasibility of the platform in terms of energyconsumption and usability.
6. Conclusion
Although advances of information technology and mobilecomputing present many opportunities for providing timelyhealth services, the use of unreliable devices for remotehealth monitoring opens vulnerabilities for privacy andinformation quality. In this paper, we provided risk anal-ysis and present a framework for secure remote health-monitoring systems. We also designed a health monitoringarchitecture that leverages a special monitoring unit thatplays the central role of the security by providing criticalsecurity services including authentication, audit, key man-agement, and data fusion. In future, we plan to implementthe framework and evaluate in a real setting.
Acknowledgment
This research was supported by Basic Science ResearchProgram through the National Research Foundation of Korea(NRF) funded by the Ministry of Education, Science andTechnology (2012-0172), and by 2011 Research Fund ofMyongji University.
References
[1] D. E. Detmer, “Building the national health informationinfrastructure for personal health, health care services, publichealth, and research,” BMC Medical Informatics and DecisionMaking, vol. 3, article 1, 2003.
[2] A. D. Jurik and A. C. Weaver, “Remote medical monitoring,”Computer, vol. 41, no. 4, pp. 96–99, 2008.
[3] S. L. Dimmick, S. G. Burgiss, S. Robbins, D. Black, B. Jarna-gin, and M. Anders, “Outcomes of an integrated telehealthnetwork demonstration project,” Telemedicine Journal and E-Health, vol. 9, no. 1, pp. 13–23, 2003.
[4] V. Stanford, “Pervasive health care applications face toughsecurity challenges,” IEEE Pervasive Computing, vol. 1, no. 2,pp. 8–12, 2002.
[5] J. Sriram, M. Shin, D. Kotz, A. Rajan, M. Sastry, and M.Yarvis, “Challenges in data quality assurance in pervasivehealth monitoring systems,” in Future of Trust in Computing.Lecture Notes in Computer Science, D. Gawrock, H. Reimer, A.R. Sadeghi, and C. Vishik, Eds., 2009.
[6] A. K. Ghosh and T. M. Swaminatha, “Software security andprivacy risks in mobile e-commerce,” Communications of theACM, vol. 44, no. 2, pp. 51–57, 2001.
[7] B. Schneier, “The psychology of security,” Communications ofthe ACM, vol. 50, no. 5, p. 128, 2007.
[8] Mobile Phone Work Group, Trusted Computing Group,https://www.trustedcomputinggroup.org/groups/mobile.
[9] TCG Mobile Trusted Module Specification, “Revision 1,”http://www.trustedcomputinggroup.org/specs/mobilephone/tcg-mobile-trustedmodule- 1.0.pdf.
[10] Y. Han, “Bioworks: a workflow system for automation ofbioinformatics analysis processes,” International Journal ofBio-Science and Bio-Technology, vol. 3, no. 4, pp. 59–68, 2011.
[11] A. Giani, T. Roosta, and S. Sastry, “Integrity checker forwireless sensor networks in health care applications,” inProceedings of the 2nd International Conference on PervasiveComputing Technologies for Healthcare, PervasiveHealth, pp.135–138, February 2008.
[12] A. Baig, A. Bouridane, F. Kurugollu, and G. Qu, “Finger-print—Iris fusion based identification system using a singlehamming distance matcher,” International Journal of Bio-Science and Bio-Technology, vol. 1, no. 1, pp. 46–58, 2009.
[13] J. Pedraza, M. A. Patricio, A. de Asıs, and J. M. Molina,“Privacy and legal requirements for developing biometricidentification software in context-based applications,” Inter-national Journal of Bio-Science and Bio-Technology, vol. 2, no.1, pp. 13–24, 2010.
[14] J. O’Donoghue, J. Herbert, R. Fensli, and S. Dineen, “Sensorvalidation within a pervasive medical environment,” in Pro-ceedings of the 5th IEEE Conference on Sensors, pp. 972–975,October 2006.
[15] C. M. Chen, H. Agrawal, M. Cochinwala, and D. Rosenbluth,“Stream query processing for healthcare bio-sensor applica-tions,” in Proceedings of the 20th International Conference onData Engineering (ICDE ’04), pp. 791–794, April 2004.
[16] C. Peter, E. Ebert, and H. Beikirch, “A wearable multi-sensorsystem for mobile acquisition of emotion-related physiologicaldata,” in Proceedings of the 1st International Conference onAffective Computing and Intelligent Interaction (ACII ’05), J.Tao, T. Tan, and R. W. Picard, Eds., vol. 3784 of Lecture Notesin Computer Science, pp. 691–698, Springer, 2005.
[17] C. Thomas and N. Balakrishnan, “Mathematical analysis ofsensor fusion for intrusion detection systems,” in Proceedingsof the 1st International Conference on Communication Systemsand Networks and Workshops (COMSNETS ’09), January 2009.
[18] W. Mann and S. Helal, “Smart phones for the elders: boostingthe intelligence of smart homes,” in Proceedings of the AAAIWorkshop Automation as Caregiver: The Role of IntelligentTechnology in Elder Care, pp. 74–79, AAAI Press, 2002.
[19] C. Clavier, “Side channel analysis for reverse engineering(SCARE)—an improved attack against a secret A3/A8 GSMalgorithm Cryptology ePrint Archive,” Report 2004/049, 2004.
[20] Giesecke and devrient gmbh, 2011, http://www.gi-de.com/.

Hindawi Publishing CorporationJournal of Biomedicine and BiotechnologyVolume 2012, Article ID 592364, 5 pagesdoi:10.1155/2012/592364
Research Article
Criminal Genomic Pragmatism: Prisoners’ Representations ofDNA Technology and Biosecurity
Helena Machado1 and Susana Silva2
1 Department of Sociology, Research Center for the Social Sciences (CICS), Institute for Social Sciences, University of Minho,4710-057 Braga, Portugal
2 Department of Clinical Epidemiology, Predictive Medicine and Public Health, Institute of Public Health of the University ofPorto (ISPUP), University of Porto Medical School, 4050-600 Porto, Portugal
Correspondence should be addressed to Helena Machado, [email protected]
Received 1 March 2012; Accepted 12 April 2012
Academic Editor: Carlos Ramos
Copyright © 2012 H. Machado and S. Silva. This is an open access article distributed under the Creative Commons AttributionLicense, which permits unrestricted use, distribution, and reproduction in any medium, provided the original work is properlycited.
Background. Within the context of the use of DNA technology in crime investigation, biosecurity is perceived by differentstakeholders according to their particular rationalities and interests. Very little is known about prisoners’ perceptions andassessments of the uses of DNA technology in solving crime. Aim. To propose a conceptual model that serves to analyse andinterpret prisoners’ representations of DNA technology and biosecurity. Methods. A qualitative study using an interpretativeapproach based on 31 semi-structured tape-recorded interviews was carried out between May and September 2009, involvingmale inmates in three prisons located in the north of Portugal. The content analysis focused on the following topics: the meaningsattributed to DNA and assessments of the risks and benefits of the uses of DNA technology and databasing in forensic applications.Results. DNA was described as a record of identity, an exceptional material, and a powerful biometric identifier. The intervieweesbelieved that DNA can be planted to incriminate suspects. Convicted offenders argued for the need to extend the criteria forthe inclusion of DNA profiles in forensic databases and to restrict the removal of profiles. Conclusions. The conceptual modelentitled criminal genomic pragmatism allows for an understanding of the views of prison inmates regarding DNA technology andbiosecurity.
1. Introduction
Physical and biological traces left by the human body candetermine whether a person has been in a particular placeor in contact with another person or object and may includeDNA and fingerprints (trace evidence), iris scanning, pho-tographs, or images on CCTV cameras. Chief amongst thesebiometric identifiers has been DNA profiling, frequentlydescribed as the gold standard for identifying individuals [1]and thus an important tool in crime prevention, detection,and deterrence [2–4]. An increasing number of countriesare investing in computerised forensic databases containinga variety of bioinformation, which enables law enforcementagents and forensic experts for instance to compare DNAprofiles and fingerprints from crime scenes and subjects onan automated basis.
Due to the high potential of genetic information toprovide data that extends beyond the purposes of criminalinvestigation, the most controversial aspects of forensic DNAdatabases concern regulatory and ethical issues, leadingto the question of the legitimacy, benefits, and risks ofusing DNA technology in crime prevention, detection, anddeterrence. Stakeholders in the field of politics, forensicsciences, and the justice system typically argue that thecreation and expansion of DNA databases will help fightcrime more efficiently [5], prevent miscarriages of justice[6], and potentially deter offenders from further criminalactivity [7]. Some academic researchers (mostly, althoughnot exclusively, in the social sciences and humanities), ethicscommittees, and human rights groups generally claim thatgenetic information needs additional protection and arguethat criminal investigation activities must be exercised with
2 Journal of Biomedicine and Biotechnology
due respect for a number of ethical values, in particular,liberty, autonomy, privacy, informed consent, and equality[8]. Previous literature on prisoners’ views of DNA technol-ogy and forensic databases indicates that this specific groupfears that agents of the criminal justice system do not use thistechnology in a neutral and fair way [9–12].
Within the context of the uses of DNA technology incrime investigation, biosecurity is, therefore, perceived bydifferent groups according to their particular rationalitiesand interests [13]. Given the relatively scarce information onprison inmates’ perspectives, this paper analyses convictedoffenders’ representations of DNA technology and biosecu-rity, aiming to propose a conceptual model that serves tointerpret their assessment of the meanings and uses of DNAcriminal investigation work.
2. Materials and Methods
2.1. Study Design and Participants. A qualitative study wascarried out using an interpretative approach. After obtainingauthorisation from the Portuguese General Board of PrisonServices, 31 semistructured interviews, lasting 34 minuteson average, were conducted with inmates in three prisonsfor adult males in the north of Portugal between May andSeptember 2009 by three interviewers, all duly trained inaccordance with the objectives of the study [11, 14]. Theinterviewees were all male, since 94.5% of all prisoners inPortugal were male at the time the interviews were carriedout, according to official statistics provided by the PortugueseGeneral Board of Prison Services on 31 December 2009 [15].
The prison administrators were approached by theresearch team with a request to provide a list of interviewees.A theoretical sample was devised, based on representative-ness in terms of diversity and exemplariness [16], combinedwith convenience sampling. We interviewed prisoners forwhom bioinformation (fingerprints and DNA evidence) hadplayed a role in their criminal investigation and/or trial (n7), and others for whom this had not been the case (n 24)[10]. Seven of the 31 prison inmates mentioned personalexperiences of giving DNA samples. In all cases, it was thepolice who collected the sample by means of a buccal swab. Intwo cases, the prisoners stated that the DNA evidence clearedthem of rape charges. One prisoner mentioned that a DNAsample had been collected from him by force and one otherprisoner stated that he had not consented to the collection ofsaliva.
The prisoners interviewed were mostly first offenders(n 24) serving prison sentences for the following crimes:homicide (n 11), rape and/or sexual abuse of minors(n 8), theft (n 8), drug trafficking (n 4), drivingwithout a licence (n 2), and qualified fraud (n 1). Thelength of the sentences varied from less than 3 years to 25years. Twenty of the 31 interviewed inmates had been givensentences of 5 to 20 years.
All the prisoners affirmed that they knew what DNA was,although only 22 of the 31 individuals were actually able tospontaneously indicate at least one of the following biologicalmaterials as containing DNA: hair, blood, skin, fingernails,
and saliva. There were also references to sweat (n 3) andteeth (n 1) as bodily sources of DNA.
2.2. Data Collection. The interview guide contained a listof open-ended questions covering the following themes:(1) knowledge of the uses of DNA technology in criminalinvestigation; (2) assessment of the benefits and risks ofthe use of DNA technology by law enforcement agents andforensic experts; (3) opinions on the value of DNA evidencein criminal investigations and trials and its effectiveness inpreventing and deterring crime; (4) management of crimescenes in order to avoid leaving traces of a crime; (5) opinionson the criteria for including and removing DNA profilesfrom forensic DNA databases. For the purposes of thispaper, the data relating to the core theme of biosecurity willbe discussed by exploring the answers obtained from thefollowing topic questions: “What is DNA?” and “What arethe dangers and benefits of the uses of DNA technology andDNA databases in criminal investigation?”.
All the interviews were tape-recorded after an informedconsent form had been completed by the participants.The interviewees were told that their participation wasvoluntary; they could refuse to answer any question andcould withdraw from the study at any moment. The tapeswere transcribed verbatim and the transcripts checked foraccuracy. Anonymity was guaranteed through the use ofpseudonyms.
2.3. Content Analysis. On the basis of topics previouslyestablished in the interview guide and the categories thatemerged from the interviews, the central issues and con-cepts were identified and the data assembled according tothematic categories. Conceptual differences were examinedand resolved by further joint debate. The qualitative datawas then systematically coded and synthesised around corethemes and categories.
The data was analysed based on the model proposedby Williams and Johnson [17] for the conceptualisation ofmeanings and uses attributed to DNA in forensic applica-tions by the various stakeholders, which is summarised inTable 1.
The data is presented by quantification of the mostrelevant cases in relation to each topic of analysis and,whenever relevant, by selecting one interview extract that isparticularly representative of our qualitative analysis of thediscourses produced by the prison inmates.
3. Results and Discussion
All the prisoners mentioned that DNA was a powerfulidentifier that was unique to each individual, but none ofthem referred to the possibility of identical twins havingthe same DNA. Although this view corresponds in part tothe position of “genomic minimalism” [17], according towhich DNA is a mere identifier in itself, the prison inmatesexpressed concern about the possible uses of this technologyas an incriminating tool that could be used by the police toproduce evidence against a suspect.
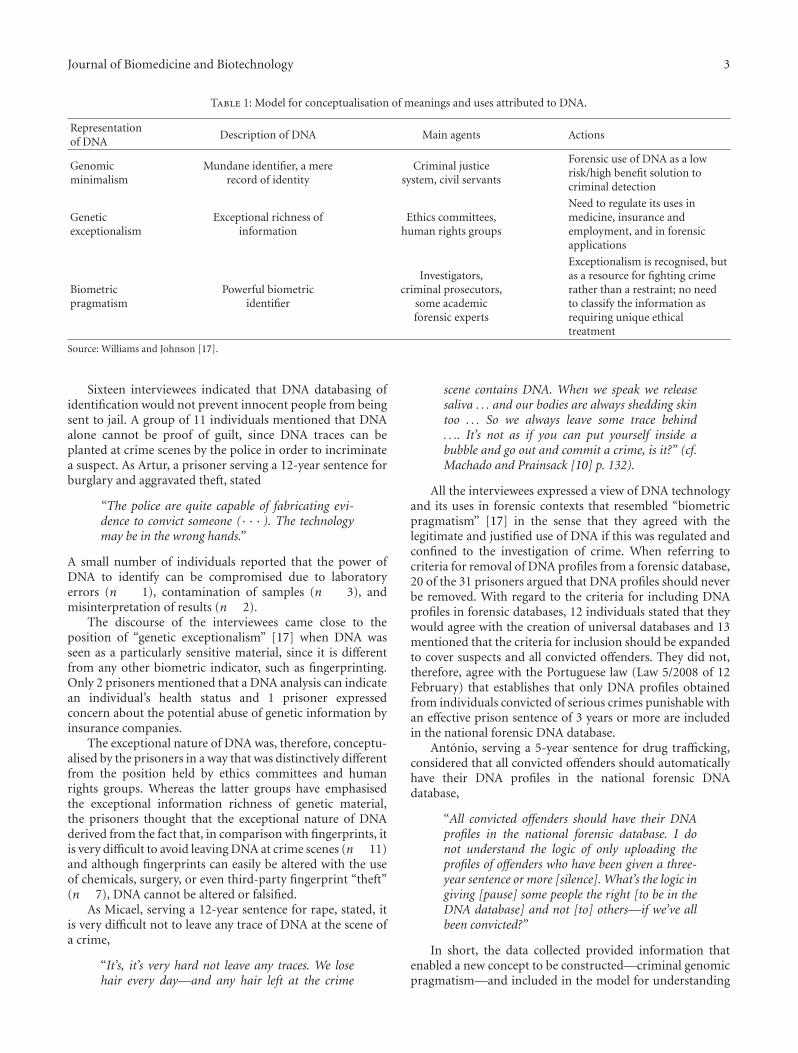
Journal of Biomedicine and Biotechnology 3
Table 1: Model for conceptualisation of meanings and uses attributed to DNA.
Representationof DNA
Description of DNA Main agents Actions
Genomicminimalism
Mundane identifier, a mererecord of identity
Criminal justicesystem, civil servants
Forensic use of DNA as a lowrisk/high benefit solution tocriminal detection
Geneticexceptionalism
Exceptional richness ofinformation
Ethics committees,human rights groups
Need to regulate its uses inmedicine, insurance andemployment, and in forensicapplications
Biometricpragmatism
Powerful biometricidentifier
Investigators,criminal prosecutors,
some academicforensic experts
Exceptionalism is recognised, butas a resource for fighting crimerather than a restraint; no needto classify the information asrequiring unique ethicaltreatment
Source: Williams and Johnson [17].
Sixteen interviewees indicated that DNA databasing ofidentification would not prevent innocent people from beingsent to jail. A group of 11 individuals mentioned that DNAalone cannot be proof of guilt, since DNA traces can beplanted at crime scenes by the police in order to incriminatea suspect. As Artur, a prisoner serving a 12-year sentence forburglary and aggravated theft, stated
“The police are quite capable of fabricating evi-dence to convict someone (· · · ). The technologymay be in the wrong hands.”
A small number of individuals reported that the power ofDNA to identify can be compromised due to laboratoryerrors (n 1), contamination of samples (n 3), andmisinterpretation of results (n 2).
The discourse of the interviewees came close to theposition of “genetic exceptionalism” [17] when DNA wasseen as a particularly sensitive material, since it is differentfrom any other biometric indicator, such as fingerprinting.Only 2 prisoners mentioned that a DNA analysis can indicatean individual’s health status and 1 prisoner expressedconcern about the potential abuse of genetic information byinsurance companies.
The exceptional nature of DNA was, therefore, conceptu-alised by the prisoners in a way that was distinctively differentfrom the position held by ethics committees and humanrights groups. Whereas the latter groups have emphasisedthe exceptional information richness of genetic material,the prisoners thought that the exceptional nature of DNAderived from the fact that, in comparison with fingerprints, itis very difficult to avoid leaving DNA at crime scenes (n 11)and although fingerprints can easily be altered with the useof chemicals, surgery, or even third-party fingerprint “theft”(n 7), DNA cannot be altered or falsified.
As Micael, serving a 12-year sentence for rape, stated, itis very difficult not to leave any trace of DNA at the scene ofa crime,
“It’s, it’s very hard not leave any traces. We losehair every day—and any hair left at the crime
scene contains DNA. When we speak we releasesaliva . . . and our bodies are always shedding skintoo . . . So we always leave some trace behind. . .. It’s not as if you can put yourself inside abubble and go out and commit a crime, is it?” (cf.Machado and Prainsack [10] p. 132).
All the interviewees expressed a view of DNA technologyand its uses in forensic contexts that resembled “biometricpragmatism” [17] in the sense that they agreed with thelegitimate and justified use of DNA if this was regulated andconfined to the investigation of crime. When referring tocriteria for removal of DNA profiles from a forensic database,20 of the 31 prisoners argued that DNA profiles should neverbe removed. With regard to the criteria for including DNAprofiles in forensic databases, 12 individuals stated that theywould agree with the creation of universal databases and 13mentioned that the criteria for inclusion should be expandedto cover suspects and all convicted offenders. They did not,therefore, agree with the Portuguese law (Law 5/2008 of 12February) that establishes that only DNA profiles obtainedfrom individuals convicted of serious crimes punishable withan effective prison sentence of 3 years or more are includedin the national forensic DNA database.
Antonio, serving a 5-year sentence for drug trafficking,considered that all convicted offenders should automaticallyhave their DNA profiles in the national forensic DNAdatabase,
“All convicted offenders should have their DNAprofiles in the national forensic database. I donot understand the logic of only uploading theprofiles of offenders who have been given a three-year sentence or more [silence]. What’s the logic ingiving [pause] some people the right [to be in theDNA database] and not [to] others—if we’ve allbeen convicted?”
In short, the data collected provided information thatenabled a new concept to be constructed—criminal genomicpragmatism—and included in the model for understanding
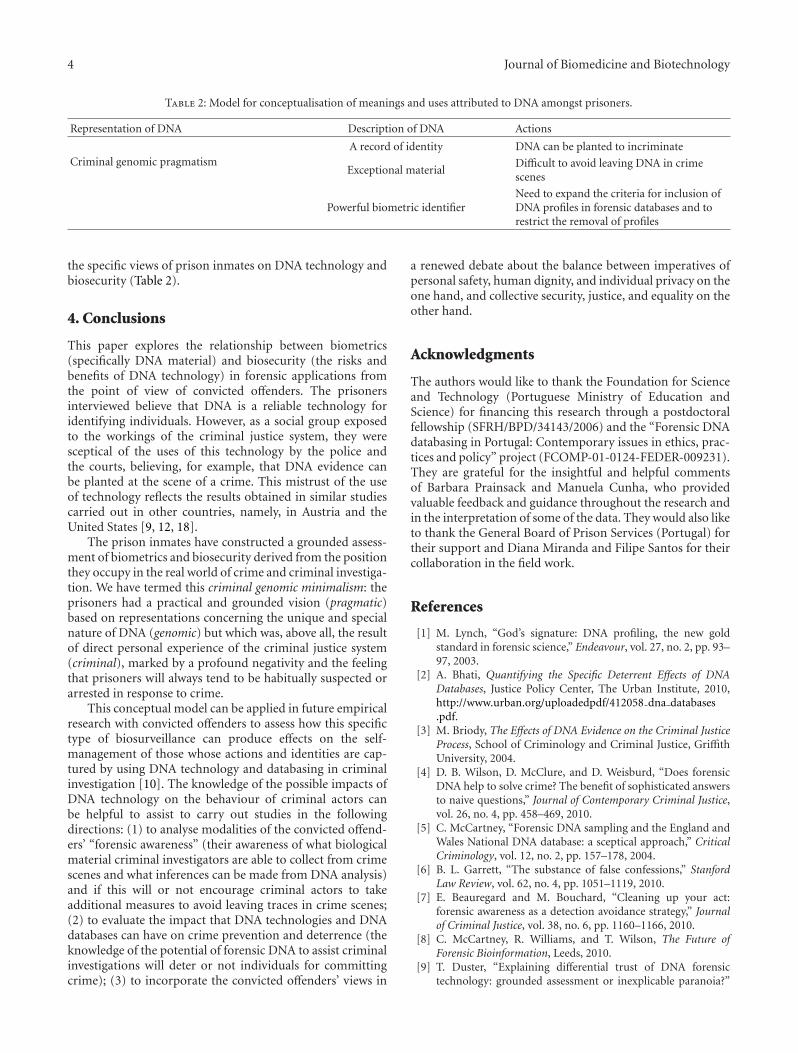
4 Journal of Biomedicine and Biotechnology
Table 2: Model for conceptualisation of meanings and uses attributed to DNA amongst prisoners.
Representation of DNA Description of DNA Actions
Criminal genomic pragmatismA record of identity DNA can be planted to incriminate
Exceptional materialDifficult to avoid leaving DNA in crimescenes
Powerful biometric identifierNeed to expand the criteria for inclusion ofDNA profiles in forensic databases and torestrict the removal of profiles
the specific views of prison inmates on DNA technology andbiosecurity (Table 2).
4. Conclusions
This paper explores the relationship between biometrics(specifically DNA material) and biosecurity (the risks andbenefits of DNA technology) in forensic applications fromthe point of view of convicted offenders. The prisonersinterviewed believe that DNA is a reliable technology foridentifying individuals. However, as a social group exposedto the workings of the criminal justice system, they weresceptical of the uses of this technology by the police andthe courts, believing, for example, that DNA evidence canbe planted at the scene of a crime. This mistrust of the useof technology reflects the results obtained in similar studiescarried out in other countries, namely, in Austria and theUnited States [9, 12, 18].
The prison inmates have constructed a grounded assess-ment of biometrics and biosecurity derived from the positionthey occupy in the real world of crime and criminal investiga-tion. We have termed this criminal genomic minimalism: theprisoners had a practical and grounded vision (pragmatic)based on representations concerning the unique and specialnature of DNA (genomic) but which was, above all, the resultof direct personal experience of the criminal justice system(criminal), marked by a profound negativity and the feelingthat prisoners will always tend to be habitually suspected orarrested in response to crime.
This conceptual model can be applied in future empiricalresearch with convicted offenders to assess how this specifictype of biosurveillance can produce effects on the self-management of those whose actions and identities are cap-tured by using DNA technology and databasing in criminalinvestigation [10]. The knowledge of the possible impacts ofDNA technology on the behaviour of criminal actors canbe helpful to assist to carry out studies in the followingdirections: (1) to analyse modalities of the convicted offend-ers’ “forensic awareness” (their awareness of what biologicalmaterial criminal investigators are able to collect from crimescenes and what inferences can be made from DNA analysis)and if this will or not encourage criminal actors to takeadditional measures to avoid leaving traces in crime scenes;(2) to evaluate the impact that DNA technologies and DNAdatabases can have on crime prevention and deterrence (theknowledge of the potential of forensic DNA to assist criminalinvestigations will deter or not individuals for committingcrime); (3) to incorporate the convicted offenders’ views in
a renewed debate about the balance between imperatives ofpersonal safety, human dignity, and individual privacy on theone hand, and collective security, justice, and equality on theother hand.
Acknowledgments
The authors would like to thank the Foundation for Scienceand Technology (Portuguese Ministry of Education andScience) for financing this research through a postdoctoralfellowship (SFRH/BPD/34143/2006) and the “Forensic DNAdatabasing in Portugal: Contemporary issues in ethics, prac-tices and policy” project (FCOMP-01-0124-FEDER-009231).They are grateful for the insightful and helpful commentsof Barbara Prainsack and Manuela Cunha, who providedvaluable feedback and guidance throughout the research andin the interpretation of some of the data. They would also liketo thank the General Board of Prison Services (Portugal) fortheir support and Diana Miranda and Filipe Santos for theircollaboration in the field work.
References
[1] M. Lynch, “God’s signature: DNA profiling, the new goldstandard in forensic science,” Endeavour, vol. 27, no. 2, pp. 93–97, 2003.
[2] A. Bhati, Quantifying the Specific Deterrent Effects of DNADatabases, Justice Policy Center, The Urban Institute, 2010,http://www.urban.org/uploadedpdf/412058 dna databases.pdf.
[3] M. Briody, The Effects of DNA Evidence on the Criminal JusticeProcess, School of Criminology and Criminal Justice, GriffithUniversity, 2004.
[4] D. B. Wilson, D. McClure, and D. Weisburd, “Does forensicDNA help to solve crime? The benefit of sophisticated answersto naive questions,” Journal of Contemporary Criminal Justice,vol. 26, no. 4, pp. 458–469, 2010.
[5] C. McCartney, “Forensic DNA sampling and the England andWales National DNA database: a sceptical approach,” CriticalCriminology, vol. 12, no. 2, pp. 157–178, 2004.
[6] B. L. Garrett, “The substance of false confessions,” StanfordLaw Review, vol. 62, no. 4, pp. 1051–1119, 2010.
[7] E. Beauregard and M. Bouchard, “Cleaning up your act:forensic awareness as a detection avoidance strategy,” Journalof Criminal Justice, vol. 38, no. 6, pp. 1160–1166, 2010.
[8] C. McCartney, R. Williams, and T. Wilson, The Future ofForensic Bioinformation, Leeds, 2010.
[9] T. Duster, “Explaining differential trust of DNA forensictechnology: grounded assessment or inexplicable paranoia?”

Journal of Biomedicine and Biotechnology 5
Journal of Law, Medicine and Ethics, vol. 34, no. 2, pp. 293–300, 2006.
[10] H. Machado and B. Prainsack, Tracing Technologies: Prisoners’Views in the Era of CSI, Ashgate, UK, 2012.
[11] H. Machado, F. Santos, and S. Silva, “Prisoners’ expectationsof the national forensic DNA database: surveillance and recon-figuration of individual rights,” Forensic Science International,vol. 210, no. 1–3, pp. 139–143, 2011.
[12] B. Prainsack, “Partners in crime: the use of forensic DNAtechnologies in Austria,” in Genetic Suspects: Global Gover-nance of DNA Profiling and Databasing, R. Hindmarsh andB. Prainsack, Eds., pp. 153–174, Cambrige University Press,Cambrige, UK, 2010.
[13] F. Lentzos, “Rationality, risk and response: a research agendafor biosecurity,” BioSocieties, vol. 1, no. 4, pp. 453–464, 2006.
[14] H. Machado, M. I. Cunha, D. Miranda, and F. Santos,“Stained Bodies: prisoners’ perceptions of the DNAdatabase for criminal investigation purposes and theirperspectives of social reintegration,” 2011, http://dnadatabase.ces.uc.pt/list documents.php.
[15] DGSP, Existing Inmates on 31 December, According toEducation, Sex and Nationality, 2009, http://www.dgsp.mj.pt/backoffice/uploads/anuais/20100302020332RecExist Inst-Sex-Nac.pdf.
[16] J. Hamel, S. Dufour, and D. Fortin, Case Study Methods, Sage,London, UK, 1993.
[17] R. Williams and P. Johnson, ““Wonderment and dread”:representations of DNA in ethical disputes about forensicDNA databases,” New Genetics and Society, vol. 23, no. 2, pp.205–223, 2004.
[18] B. Prainsack and M. Kitzberger, “DNA behind bars: otherways of knowing forensic DNA technologies,” Social Studies ofScience, vol. 39, no. 1, pp. 51–79, 2009.

Hindawi Publishing CorporationJournal of Biomedicine and BiotechnologyVolume 2012, Article ID 831052, 8 pagesdoi:10.1155/2012/831052
Research Article
Comparison of Two Suspension Arrays for SimultaneousDetection of Five Biothreat Bacterial in Powder Samples
Yu Yang,1 Jing Wang,1 Haiyan Wen,2 and Hengchuan Liu3
1 Institute of Health Quarantine, Chinese Academy of Inspection and Quarantine, Beijing 100123, China2 Chongqing International Travel Healthcare Center, Chongqing 400020, China3 West China School of Public Health, Sichuan University, Chengdu 610041, China
Correspondence should be addressed to Jing Wang, [email protected]
Received 2 December 2011; Accepted 28 February 2012
Academic Editor: Sabah Mohammed
Copyright © 2012 Yu Yang et al. This is an open access article distributed under the Creative Commons Attribution License, whichpermits unrestricted use, distribution, and reproduction in any medium, provided the original work is properly cited.
We have developed novel Bio-Plex assays for simultaneous detection of Bacillus anthracis, Yersinia pestis, Brucella spp., Francisellatularensis, and Burkholderia pseudomallei. Universal primers were used to amplify highly conserved region located within the16S rRNA amplicon, followed by hybridized to pathogen-specific probes for identification of these five organisms. The otherassay is based on multiplex PCR to simultaneously amplify five species-specific pathogen identification-targeted regions unique toindividual pathogen. Both of the two arrays are validated to be flexible and sensitive for simultaneous detection of bioterrorismbacteria. However, universal primer PCR-based array could not identify Bacillus anthracis, Yersinia pestis, and Brucella spp. at thespecies level because of the high conservation of 16S rDNA of the same genus. The two suspension arrays can be utilized to detectBacillus anthracis sterne spore and Yersinia pestis EV76 from mimic “write powder” samples, they also proved that the suspensionarray system will be valuable tools for diagnosis of bacterial biothreat agents in environmental samples.
1. Introduction
The threat of bioterrorism has attracted great attention afterthe letter containing anthrax spore terrified the USA andthe letters with “white powder” flied all over the world[1]. When a bioterrorism attack occurred, rapid detectionand identification of biothreat agents are important todetermine that the suitable actions should be implementedto disinfect pollution and cure infected people. Now, greaterthan 160 species of microorganisms have been recognized tobe pathogenic. Thirty of them could be used as bioweapons.Bacillus anthracis, Yersinia pestis, Brucella spp., Francisellatularensis, and Burkholderia pseudomallei were the typicalexamples among the list [2]. The development of rapid,sensitive, and high-throughput diagnostic methods to fightagainst bioterrorism and prevent serious epidemic diseases isunder urgent needs.
With the application of PCR and DNA sequencing tech-nologies, comparison of the genome sequences of bacterialspecies showed that the 16S rDNA gene is highly conserved
among individuals of the same species and among speciesof the same genus and hence can be used as the “goldstandard” for classification of bacteria [3–6]. Here, we reporta suspension array based on the 16S rDNA gene amplifiedby universal primers, which is also called universal primerPCR-based array. Due to the scope of the detection specificityof our array design principles, the universal primer PCR-based array cannot specifically distinguish certain speciesfrom bacteria of the same genus because of the conservationof 16S rDNA sequences. Alternatively, a suspension-array-based multiplex PCR was developed which amplifies species-specific regions of above five bioterrorism bacteria. Biotinlabeled PCR products were hybridized to correspondingprobes coupling on the unique sets of fluorescent beads. Thehybridized beads were processed through the Bioplex, whichidentified the presence of PCR products. The hybridizationresults of above two Luminex xMAP arrays showed sensitiv-ity from 2.5 fg (Yersinia pestis) to 30 pg (Bacillus anthracis)bacterial DNA.
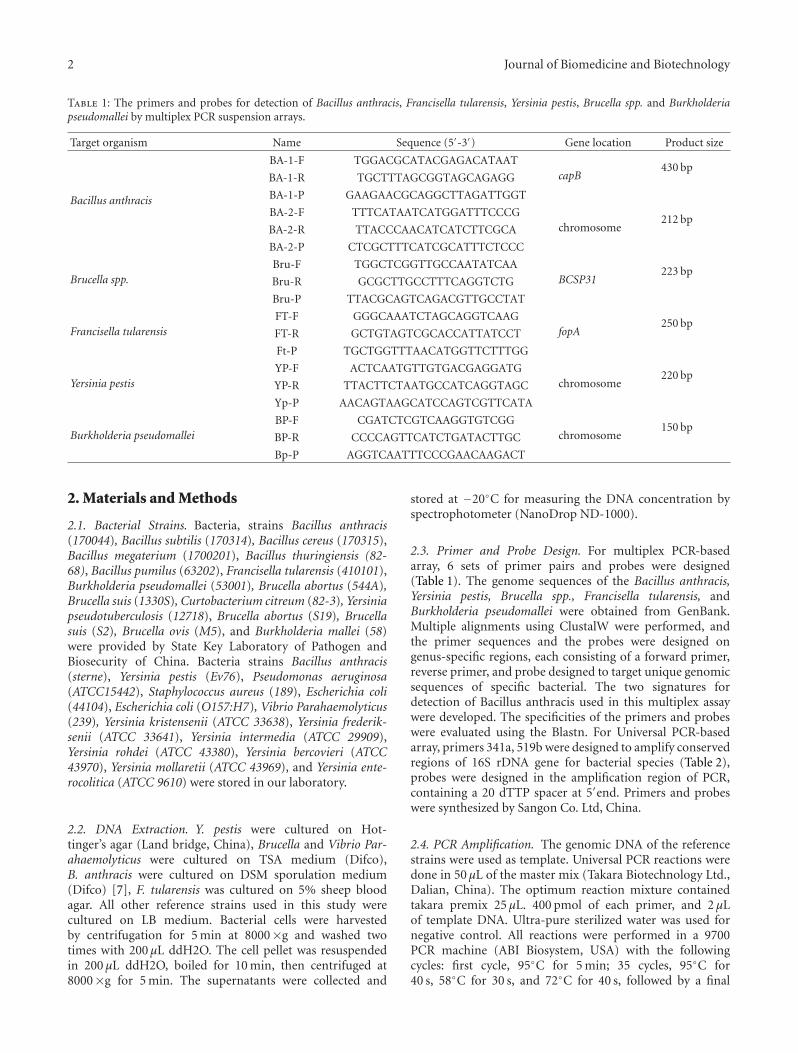
2 Journal of Biomedicine and Biotechnology
Table 1: The primers and probes for detection of Bacillus anthracis, Francisella tularensis, Yersinia pestis, Brucella spp. and Burkholderiapseudomallei by multiplex PCR suspension arrays.
Target organism Name Sequence (5′-3′) Gene location Product size
Bacillus anthracis
BA-1-F TGGACGCATACGAGACATAATcapB
430 bpBA-1-R TGCTTTAGCGGTAGCAGAGG
BA-1-P GAAGAACGCAGGCTTAGATTGGT
BA-2-F TTTCATAATCATGGATTTCCCGchromosome
212 bpBA-2-R TTACCCAACATCATCTTCGCA
BA-2-P CTCGCTTTCATCGCATTTCTCCC
Brucella spp.Bru-F TGGCTCGGTTGCCAATATCAA
BCSP31223 bp
Bru-R GCGCTTGCCTTTCAGGTCTG
Bru-P TTACGCAGTCAGACGTTGCCTAT
Francisella tularensisFT-F GGGCAAATCTAGCAGGTCAAG
fopA250 bp
FT-R GCTGTAGTCGCACCATTATCCT
Ft-P TGCTGGTTTAACATGGTTCTTTGG
Yersinia pestisYP-F ACTCAATGTTGTGACGAGGATG
chromosome220 bp
YP-R TTACTTCTAATGCCATCAGGTAGC
Yp-P AACAGTAAGCATCCAGTCGTTCATA
Burkholderia pseudomalleiBP-F CGATCTCGTCAAGGTGTCGG
chromosome150 bp
BP-R CCCCAGTTCATCTGATACTTGC
Bp-P AGGTCAATTTCCCGAACAAGACT
2. Materials and Methods
2.1. Bacterial Strains. Bacteria, strains Bacillus anthracis(170044), Bacillus subtilis (170314), Bacillus cereus (170315),Bacillus megaterium (1700201), Bacillus thuringiensis (82-68), Bacillus pumilus (63202), Francisella tularensis (410101),Burkholderia pseudomallei (53001), Brucella abortus (544A),Brucella suis (1330S), Curtobacterium citreum (82-3), Yersiniapseudotuberculosis (12718), Brucella abortus (S19), Brucellasuis (S2), Brucella ovis (M5), and Burkholderia mallei (58)were provided by State Key Laboratory of Pathogen andBiosecurity of China. Bacteria strains Bacillus anthracis(sterne), Yersinia pestis (Ev76), Pseudomonas aeruginosa(ATCC15442), Staphylococcus aureus (189), Escherichia coli(44104), Escherichia coli (O157:H7), Vibrio Parahaemolyticus(239), Yersinia kristensenii (ATCC 33638), Yersinia frederik-senii (ATCC 33641), Yersinia intermedia (ATCC 29909),Yersinia rohdei (ATCC 43380), Yersinia bercovieri (ATCC43970), Yersinia mollaretii (ATCC 43969), and Yersinia ente-rocolitica (ATCC 9610) were stored in our laboratory.
2.2. DNA Extraction. Y. pestis were cultured on Hot-tinger’s agar (Land bridge, China), Brucella and Vibrio Par-ahaemolyticus were cultured on TSA medium (Difco),B. anthracis were cultured on DSM sporulation medium(Difco) [7], F. tularensis was cultured on 5% sheep bloodagar. All other reference strains used in this study werecultured on LB medium. Bacterial cells were harvestedby centrifugation for 5 min at 8000×g and washed twotimes with 200 μL ddH2O. The cell pellet was resuspendedin 200 μL ddH2O, boiled for 10 min, then centrifuged at8000×g for 5 min. The supernatants were collected and
stored at −20◦C for measuring the DNA concentration byspectrophotometer (NanoDrop ND-1000).
2.3. Primer and Probe Design. For multiplex PCR-basedarray, 6 sets of primer pairs and probes were designed(Table 1). The genome sequences of the Bacillus anthracis,Yersinia pestis, Brucella spp., Francisella tularensis, andBurkholderia pseudomallei were obtained from GenBank.Multiple alignments using ClustalW were performed, andthe primer sequences and the probes were designed ongenus-specific regions, each consisting of a forward primer,reverse primer, and probe designed to target unique genomicsequences of specific bacterial. The two signatures fordetection of Bacillus anthracis used in this multiplex assaywere developed. The specificities of the primers and probeswere evaluated using the Blastn. For Universal PCR-basedarray, primers 341a, 519b were designed to amplify conservedregions of 16S rDNA gene for bacterial species (Table 2),probes were designed in the amplification region of PCR,containing a 20 dTTP spacer at 5′end. Primers and probeswere synthesized by Sangon Co. Ltd, China.
2.4. PCR Amplification. The genomic DNA of the referencestrains were used as template. Universal PCR reactions weredone in 50 μL of the master mix (Takara Biotechnology Ltd.,Dalian, China). The optimum reaction mixture containedtakara premix 25 μL. 400 pmol of each primer, and 2 μLof template DNA. Ultra-pure sterilized water was used fornegative control. All reactions were performed in a 9700PCR machine (ABI Biosystem, USA) with the followingcycles: first cycle, 95◦C for 5 min; 35 cycles, 95◦C for40 s, 58◦C for 30 s, and 72◦C for 40 s, followed by a final
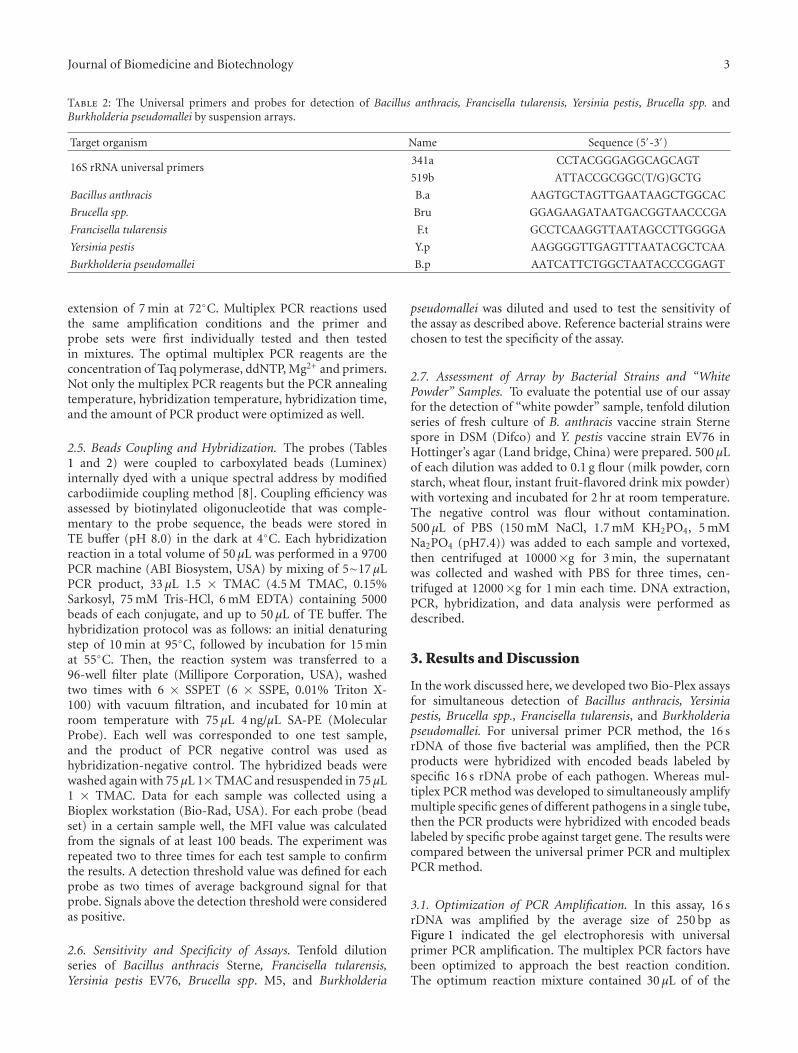
Journal of Biomedicine and Biotechnology 3
Table 2: The Universal primers and probes for detection of Bacillus anthracis, Francisella tularensis, Yersinia pestis, Brucella spp. andBurkholderia pseudomallei by suspension arrays.
Target organism Name Sequence (5′-3′)
16S rRNA universal primers341a CCTACGGGAGGCAGCAGT
519b ATTACCGCGGC(T/G)GCTG
Bacillus anthracis B.a AAGTGCTAGTTGAATAAGCTGGCAC
Brucella spp. Bru GGAGAAGATAATGACGGTAACCCGA
Francisella tularensis F.t GCCTCAAGGTTAATAGCCTTGGGGA
Yersinia pestis Y.p AAGGGGTTGAGTTTAATACGCTCAA
Burkholderia pseudomallei B.p AATCATTCTGGCTAATACCCGGAGT
extension of 7 min at 72◦C. Multiplex PCR reactions usedthe same amplification conditions and the primer andprobe sets were first individually tested and then testedin mixtures. The optimal multiplex PCR reagents are theconcentration of Taq polymerase, ddNTP, Mg2+ and primers.Not only the multiplex PCR reagents but the PCR annealingtemperature, hybridization temperature, hybridization time,and the amount of PCR product were optimized as well.
2.5. Beads Coupling and Hybridization. The probes (Tables1 and 2) were coupled to carboxylated beads (Luminex)internally dyed with a unique spectral address by modifiedcarbodiimide coupling method [8]. Coupling efficiency wasassessed by biotinylated oligonucleotide that was comple-mentary to the probe sequence, the beads were stored inTE buffer (pH 8.0) in the dark at 4◦C. Each hybridizationreaction in a total volume of 50 μL was performed in a 9700PCR machine (ABI Biosystem, USA) by mixing of 5∼17 μLPCR product, 33 μL 1.5 × TMAC (4.5 M TMAC, 0.15%Sarkosyl, 75 mM Tris-HCl, 6 mM EDTA) containing 5000beads of each conjugate, and up to 50 μL of TE buffer. Thehybridization protocol was as follows: an initial denaturingstep of 10 min at 95◦C, followed by incubation for 15 minat 55◦C. Then, the reaction system was transferred to a96-well filter plate (Millipore Corporation, USA), washedtwo times with 6 × SSPET (6 × SSPE, 0.01% Triton X-100) with vacuum filtration, and incubated for 10 min atroom temperature with 75 μL 4 ng/μL SA-PE (MolecularProbe). Each well was corresponded to one test sample,and the product of PCR negative control was used ashybridization-negative control. The hybridized beads werewashed again with 75 μL 1×TMAC and resuspended in 75 μL1 × TMAC. Data for each sample was collected using aBioplex workstation (Bio-Rad, USA). For each probe (beadset) in a certain sample well, the MFI value was calculatedfrom the signals of at least 100 beads. The experiment wasrepeated two to three times for each test sample to confirmthe results. A detection threshold value was defined for eachprobe as two times of average background signal for thatprobe. Signals above the detection threshold were consideredas positive.
2.6. Sensitivity and Specificity of Assays. Tenfold dilutionseries of Bacillus anthracis Sterne, Francisella tularensis,Yersinia pestis EV76, Brucella spp. M5, and Burkholderia
pseudomallei was diluted and used to test the sensitivity ofthe assay as described above. Reference bacterial strains werechosen to test the specificity of the assay.
2.7. Assessment of Array by Bacterial Strains and “WhitePowder” Samples. To evaluate the potential use of our assayfor the detection of “white powder” sample, tenfold dilutionseries of fresh culture of B. anthracis vaccine strain Sternespore in DSM (Difco) and Y. pestis vaccine strain EV76 inHottinger’s agar (Land bridge, China) were prepared. 500 μLof each dilution was added to 0.1 g flour (milk powder, cornstarch, wheat flour, instant fruit-flavored drink mix powder)with vortexing and incubated for 2 hr at room temperature.The negative control was flour without contamination.500 μL of PBS (150 mM NaCl, 1.7 mM KH2PO4, 5 mMNa2PO4 (pH7.4)) was added to each sample and vortexed,then centrifuged at 10000×g for 3 min, the supernatantwas collected and washed with PBS for three times, cen-trifuged at 12000×g for 1 min each time. DNA extraction,PCR, hybridization, and data analysis were performed asdescribed.
3. Results and Discussion
In the work discussed here, we developed two Bio-Plex assaysfor simultaneous detection of Bacillus anthracis, Yersiniapestis, Brucella spp., Francisella tularensis, and Burkholderiapseudomallei. For universal primer PCR method, the 16 srDNA of those five bacterial was amplified, then the PCRproducts were hybridized with encoded beads labeled byspecific 16 s rDNA probe of each pathogen. Whereas mul-tiplex PCR method was developed to simultaneously amplifymultiple specific genes of different pathogens in a single tube,then the PCR products were hybridized with encoded beadslabeled by specific probe against target gene. The results werecompared between the universal primer PCR and multiplexPCR method.
3.1. Optimization of PCR Amplification. In this assay, 16 srDNA was amplified by the average size of 250 bp asFigure 1 indicated the gel electrophoresis with universalprimer PCR amplification. The multiplex PCR factors havebeen optimized to approach the best reaction condition.The optimum reaction mixture contained 30 μL of of the
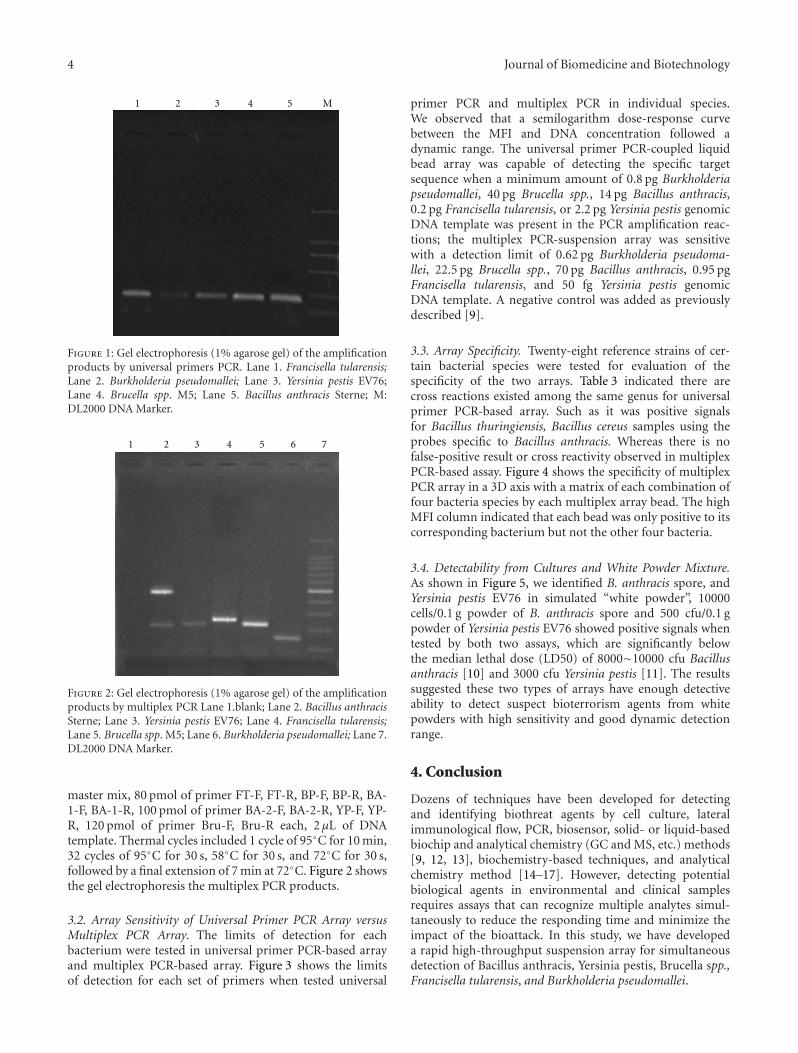
4 Journal of Biomedicine and Biotechnology
1 2 3 4 5 M
Figure 1: Gel electrophoresis (1% agarose gel) of the amplificationproducts by universal primers PCR. Lane 1. Francisella tularensis;Lane 2. Burkholderia pseudomallei; Lane 3. Yersinia pestis EV76;Lane 4. Brucella spp. M5; Lane 5. Bacillus anthracis Sterne; M:DL2000 DNA Marker.
1 32 4 5 6 7
Figure 2: Gel electrophoresis (1% agarose gel) of the amplificationproducts by multiplex PCR Lane 1.blank; Lane 2. Bacillus anthracisSterne; Lane 3. Yersinia pestis EV76; Lane 4. Francisella tularensis;Lane 5. Brucella spp. M5; Lane 6. Burkholderia pseudomallei; Lane 7.DL2000 DNA Marker.
master mix, 80 pmol of primer FT-F, FT-R, BP-F, BP-R, BA-1-F, BA-1-R, 100 pmol of primer BA-2-F, BA-2-R, YP-F, YP-R, 120 pmol of primer Bru-F, Bru-R each, 2 μL of DNAtemplate. Thermal cycles included 1 cycle of 95◦C for 10 min,32 cycles of 95◦C for 30 s, 58◦C for 30 s, and 72◦C for 30 s,followed by a final extension of 7 min at 72◦C. Figure 2 showsthe gel electrophoresis the multiplex PCR products.
3.2. Array Sensitivity of Universal Primer PCR Array versusMultiplex PCR Array. The limits of detection for eachbacterium were tested in universal primer PCR-based arrayand multiplex PCR-based array. Figure 3 shows the limitsof detection for each set of primers when tested universal
primer PCR and multiplex PCR in individual species.We observed that a semilogarithm dose-response curvebetween the MFI and DNA concentration followed adynamic range. The universal primer PCR-coupled liquidbead array was capable of detecting the specific targetsequence when a minimum amount of 0.8 pg Burkholderiapseudomallei, 40 pg Brucella spp., 14 pg Bacillus anthracis,0.2 pg Francisella tularensis, or 2.2 pg Yersinia pestis genomicDNA template was present in the PCR amplification reac-tions; the multiplex PCR-suspension array was sensitivewith a detection limit of 0.62 pg Burkholderia pseudoma-llei, 22.5 pg Brucella spp., 70 pg Bacillus anthracis, 0.95 pgFrancisella tularensis, and 50 fg Yersinia pestis genomicDNA template. A negative control was added as previouslydescribed [9].
3.3. Array Specificity. Twenty-eight reference strains of cer-tain bacterial species were tested for evaluation of thespecificity of the two arrays. Table 3 indicated there arecross reactions existed among the same genus for universalprimer PCR-based array. Such as it was positive signalsfor Bacillus thuringiensis, Bacillus cereus samples using theprobes specific to Bacillus anthracis. Whereas there is nofalse-positive result or cross reactivity observed in multiplexPCR-based assay. Figure 4 shows the specificity of multiplexPCR array in a 3D axis with a matrix of each combination offour bacteria species by each multiplex array bead. The highMFI column indicated that each bead was only positive to itscorresponding bacterium but not the other four bacteria.
3.4. Detectability from Cultures and White Powder Mixture.As shown in Figure 5, we identified B. anthracis spore, andYersinia pestis EV76 in simulated “white powder”, 10000cells/0.1 g powder of B. anthracis spore and 500 cfu/0.1 gpowder of Yersinia pestis EV76 showed positive signals whentested by both two assays, which are significantly belowthe median lethal dose (LD50) of 8000∼10000 cfu Bacillusanthracis [10] and 3000 cfu Yersinia pestis [11]. The resultssuggested these two types of arrays have enough detectiveability to detect suspect bioterrorism agents from whitepowders with high sensitivity and good dynamic detectionrange.
4. Conclusion
Dozens of techniques have been developed for detectingand identifying biothreat agents by cell culture, lateralimmunological flow, PCR, biosensor, solid- or liquid-basedbiochip and analytical chemistry (GC and MS, etc.) methods[9, 12, 13], biochemistry-based techniques, and analyticalchemistry method [14–17]. However, detecting potentialbiological agents in environmental and clinical samplesrequires assays that can recognize multiple analytes simul-taneously to reduce the responding time and minimize theimpact of the bioattack. In this study, we have developeda rapid high-throughput suspension array for simultaneousdetection of Bacillus anthracis, Yersinia pestis, Brucella spp.,Francisella tularensis, and Burkholderia pseudomallei.
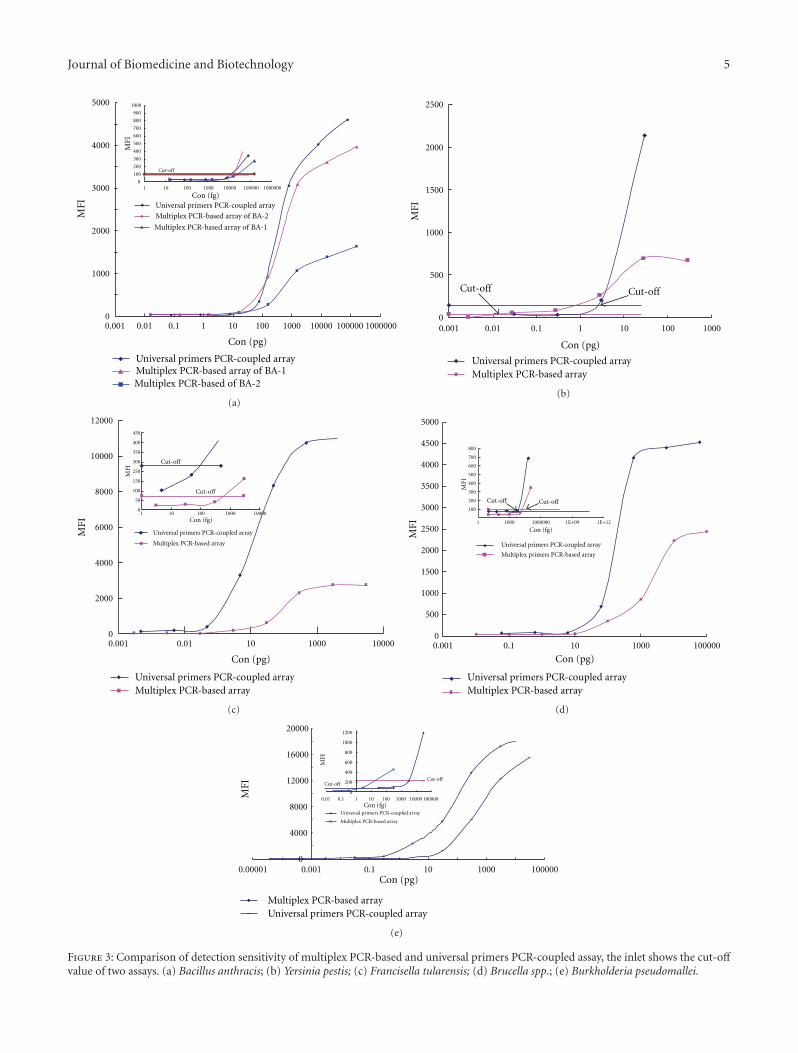
Journal of Biomedicine and Biotechnology 5
Cut-off
MFI
MFI
Con (pg)
Con (fg)
5000
3000 10
100
200
300
400
500
600
700
800
900
1000
10 100 1000 10000 100000 1000000
2000
00.001 0.01 0.1 1 10 1000000100000100001000100
1000
4000
Universal primers PCR-coupled array
Multiplex PCR-based array of BA-2
Multiplex PCR-based array of BA-1
Universal primers PCR-coupled arrayMultiplex PCR-based array of BA-1Multiplex PCR-based of BA-2
(a)
00.001 0.01 0.1 1
Cut-offCut-off
10 100 1000
500
MFI
Con (pg)
1000
1500
2000
2500
Universal primers PCR-coupled arrayMultiplex PCR-based array
(b)
Universal primers PCR-coupled array
Cut-off
Cut-off
10
50
100
250
300
350
400
450
150
10
0.01 10 1000 100000.0010
2000
4000
6000
8000
10000
12000
MFI
MFI
Con (fg)
Con (pg)
100 1000 10000
Multiplex PCR-based array
Universal primers PCR-coupled arrayMultiplex PCR-based array
(c)
Cut-offCut-off
5000
800
700
600
500
400
300
200
100
1 1000 1000000 1E+09 1E+12
4000
4500
3500
3000
MFI
MFI
Con (fg)
Con (pg)
2500
2000
1500
1000
500
01000001000100.10.001
Universal primers PCR-coupled array
Multiplex primers PCR-based array
Universal primers PCR-coupled arrayMultiplex PCR-based array
(d)
20000
600
200
00.01 0.1 1 100 1000
Cut-offCut-off
10000 10000010
400
800
1000
1200
16000
12000
8000
4000
00.00001 0.001
Con (fg)
Con (pg)
MFI
Universal primers PCR-coupled arrayMultiplex PCR-based array
Universal primers PCR-coupled array
Multiplex PCR-based array
MFI
0.1 10 1000 100000
(e)
Figure 3: Comparison of detection sensitivity of multiplex PCR-based and universal primers PCR-coupled assay, the inlet shows the cut-offvalue of two assays. (a) Bacillus anthracis; (b) Yersinia pestis; (c) Francisella tularensis; (d) Brucella spp.; (e) Burkholderia pseudomallei.
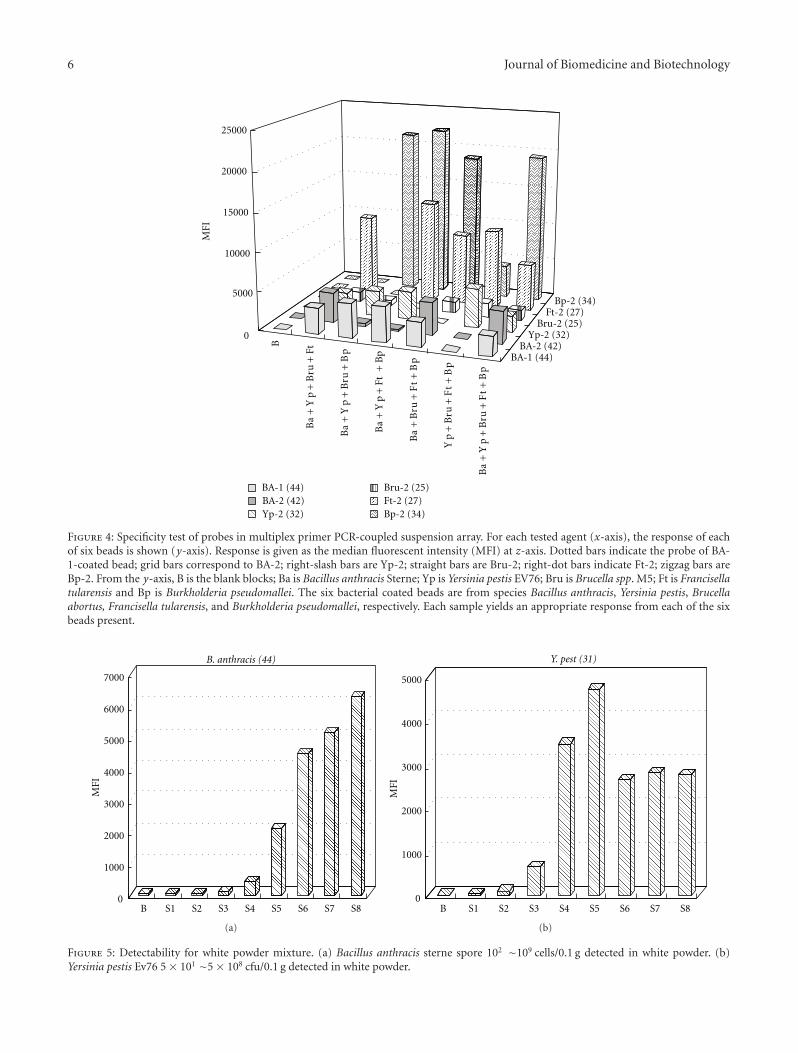
6 Journal of Biomedicine and Biotechnology
B
BA-1 (44)BA-2 (42)
Yp-2 (32)Bru-2 (25)
Ft-2 (27)Bp-2 (34)
0
5000
10000
15000
20000
25000
MFI
BA-1 (44)BA-2 (42)Yp-2 (32)
Bru-2 (25)Ft-2 (27)Bp-2 (34)
Ba
+Y
p+
Bru
+B
p
Ba
+Y
p+
Ft +
Bp
Ba
+Y
p+
Bru
+Ft
Ba
+B
ru+
Ft
+B
p
Yp
+B
ru+
Ft
+B
p
Ba
+Y
p+
Bru
+F
t+
Bp
Figure 4: Specificity test of probes in multiplex primer PCR-coupled suspension array. For each tested agent (x-axis), the response of eachof six beads is shown (y-axis). Response is given as the median fluorescent intensity (MFI) at z-axis. Dotted bars indicate the probe of BA-1-coated bead; grid bars correspond to BA-2; right-slash bars are Yp-2; straight bars are Bru-2; right-dot bars indicate Ft-2; zigzag bars areBp-2. From the y-axis, B is the blank blocks; Ba is Bacillus anthracis Sterne; Yp is Yersinia pestis EV76; Bru is Brucella spp. M5; Ft is Francisellatularensis and Bp is Burkholderia pseudomallei. The six bacterial coated beads are from species Bacillus anthracis, Yersinia pestis, Brucellaabortus, Francisella tularensis, and Burkholderia pseudomallei, respectively. Each sample yields an appropriate response from each of the sixbeads present.
0
1000
2000
3000
4000
5000
6000
7000
MFI
B S1 S2 S3 S4 S5 S6 S7 S8
B. anthracis (44)
(a)
0
1000
2000
3000
4000
5000
MFI
B S1 S2 S3 S4 S5 S6 S7 S8
Y. pest (31)
(b)
Figure 5: Detectability for white powder mixture. (a) Bacillus anthracis sterne spore 102 ∼109 cells/0.1 g detected in white powder. (b)Yersinia pestis Ev76 5 × 101 ∼5 × 10⁸ cfu/0.1 g detected in white powder.

Journal of Biomedicine and Biotechnology 7
Table 3: Specificity test of universal primer PCR-coupled suspension array.
Species Strain Brucella Spp.Bacillus
anthracisFrancisellatularensis
Yersinia pestisBurkholderiapseudomallei
BSA
Bacillus anthracis 170044 − + − − − −Bacillus subtilis 170314 − − − − − −Bacillus cereus 170315 − + − − − −Bacillus megaterium 1700201 − − − − − −Bacillus thuringiensis 82–68 − + − − − −Bacillus pumilus 63202 − − − − − −Francisella tularensis 410101 − − + − − −Burkholderiapseudomallei
53001 − − − − + −Brucella abortus 544A + − − − − −Brucella suis 1330S + − − − − −Curtobacteriumcitreum
82-3 − − − − − −Yersiniapseudotuberculosis
12718 − − − + − −Brucella abortus S19 + − − − − −Brucella suis S2 + − − − − −Brucella ovis M5 − − − − − −Burkholderia mallei 58 − − − − + −Bacillus anthracis sterne − + − − − −Yersinia pestis Ev76 − − − + − −Pseudomonasaeruginosa
ATCC15442 − − − − − −Staphylococcus aureus 189 − − − − − −Escherichia coli 44104 − − − − − −Escherichia coli O157 : H7 − − − − − −VibrioParahaemolyticus
239 − − − − − −Yersinia kristensenii ATCC 33638 − − − − − −Yersinia frederiksenii ATCC 33641 − − − + − −Yersinia intermedia ATCC 29909 − − − − − −Yersinia rohdei ATCC 43380 − − − − − −Yersinia bercovieri ATCC 43970 − − − − − −Yersinia mollaretii ATCC 43969 − − − − − −Yersinia enterocolitica ATCC 9610 − − − − − −
The highly conserved 16S rRNA gene makes a remarkablerole in analysis of evolutionary distance and relatednessof organisms and has a widespread use for bacterial iden-tification and taxonomy determination. The results from16 s rRNA universal primer PCR-based suspension arraysuggested that this method could be used to detect almost allof the bacterial. However, it should be noted that this methodcould not identify bacterial species with highly conserved16 s rDNA sequence. In our study, Bacillus anthracis, Bacillusthuringiensis, and Bacillus cereus belong to same genus,which has 99% identity of 16 s rDNA [18]. The resultsalso showed high positive signals for Bacillus thuringiensis,Bacillus cereus samples using the probes specific to Bacil-lus anthracis. The similar results were also observed for
Yersinia pestis and Brucella spp. It suggested that the universalprimer PCR-based suspension array could not be used todetermine different bacteria in the same genus. In an effortto distinguish five bioterrorism bacteria specific to speciesas list above, we conducted multiplex PCR to target onunique genomic sequence of specific pathogen in a samesuspension array. Those signature primers target on differentgenomic regions of the pathogen, increased the specificityof an array, and reduced the risk of false-positive results.Two detectable targets of B. anthracis, signature gene on thebacteria genome and capB gene [19] located on plasmidpXO2, were chosen, as the pXO2 plasmid is important tothe virulence of B. anthracis. Brucella spp. target in BCSP31gene [20], Francisella tularensis target in fopA gene [21],
8 Journal of Biomedicine and Biotechnology
the detection targets in chromosome of Y. pestis [22] andBurkholderia pseudomallei [23] were both specific on thegenome. However, not as universal primer PCR-based array,we could not continuously increase signature targets in themultiplex PCR-based suspension array system due to theincreased complexity of multiplexed reaction.
Powders were one of the most common nonclinicalspecimens submitted to designated laboratories. Artificiallycontaminated samples were prepared as simulated fieldsamples to access the feasibility of the assay established above.In this study, we developed two suspension array methods forrapid detection of Bacillus anthracis, Yersinia pestis, Brucellaspp., Francisella tularensis, and Burkholderia pseudomallei.with good sensitivity and specificity, which significantlyreduces the detection time due to simultaneous detectionof five pathogens. The results suggest the feasibility of usingsuspension array system in biological weapons diagnosis forenvironmental samples.
Acknowledgments
This work was supported by Grant 30900053 from NationalNatural Science Foundation of China, Grant 2006BAK10B07from the National Key Technology R&D Program of China,Grant 2007GYJ023 from the Public Walfare Program ofChina, and Grant 2009JK027 from CAIQ Foundation. Theauthors would like to acknowledge Dr. Yang Ruifu, DuanQing, Song Yajun, Zai Junhui, and Guo Zhaobiao for helpfulassistance and suggestions.
References
[1] J. L. Mothershead, K. Tonat, and K. L. Koenig, “Bioterrorismpreparedness III: state and federal programs and response,”Emergency Medicine Clinics of North America, vol. 20, no. 2,pp. 477–500, 2002.
[2] D. V. Lim, J. M. Simpson, E. A. Kearns, and M. F. Kram-er, “Current and developing technologies for monitoringagents of bioterrorism and biowarfare,” Clinical MicrobiologyReviews, vol. 18, no. 4, pp. 583–607, 2005.
[3] J. E. Clarridge Jr., “Impact of 16S rRNA gene sequence analysisfor identification of bacteria on clinical microbiology andinfectious diseases,” Clinical Microbiology Reviews, vol. 17, no.4, pp. 840–862, 2004.
[4] S. K. P. Lau, P. C. Y. Woo, and B. Y. L. Chan, “Haemophilus seg-nis polymicrobial and monomicrobial bacteraemia identifiedby 16S ribosomal RNA gene sequencing,” Journal of MedicalMicrobiology, vol. 51, no. 8, pp. 635–640, 2002.
[5] K. Nakanaga, N. Ishii, K. Suzuki et al., “‘Mycobacterium ul-cerans subsp. shinshuense’ isolated from a skin ulcer lesion:identification based on 16S rRNA gene sequencing,” Journalof Clinical Microbiology, vol. 45, no. 11, pp. 3840–3843, 2007.
[6] P. C. Y. Woo, A. M. Y. Fung, S. K. P. Lau, and K. Y. Yuen,“Identification by 16S rRNA gene sequencing of Lactobacillussalivarius bacteremic cholecystitis,” Journal of Clinical Micro-biology, vol. 40, no. 1, pp. 265–267, 2002.
[7] E. M. Lai, N. D. Phadke, M. T. Kachman et al., “Proteomicanalysis of the spore coats of Bacillus subtilis and Bacillusanthracis,” Journal of Bacteriology, vol. 185, no. 4, pp. 1443–1454, 2003.
[8] R. J. Fulton, R. L. McDade, P. L. Smith, and L. J. Kienker,“Advanced multiplexed analysis with the FlowMetrix(TM)system,” Clinical Chemistry, vol. 43, no. 9, pp. 1749–1756,1997.
[9] M. T. McBride, S. Gammon, M. Pitesky et al., “Multiplexedliquid arrays for simultaneous detection of simulants ofbiological warfare agents,” Analytical Chemistry, vol. 75, no.8, pp. 1924–1930, 2003.
[10] T. J. Cieslak and E. M. Eitzen Jr., “Clinical and epidemiologicprinciples of anthrax,” Emerging Infectious Diseases, vol. 5, no.4, pp. 552–555, 1999.
[11] W. D. Burrows and S. E. Renner, “Biological warfare agentsas threats to potable water,” Environmental Health Perspectives,vol. 107, no. 12, pp. 975–984, 1999.
[12] N. M. Cirino, K. A. Musser, and C. Egan, “Multiplex diagnosticplatforms for detection of biothreat agents,” Expert Review ofMolecular Diagnostics, vol. 4, no. 6, pp. 841–857, 2004.
[13] C. Ryu, K. Lee, C. Yoo, W. K. Seong, and H. B. Oh, “Sensitiveand rapid quantitative detection of anthrax spores isolatedfrom soil samples by real-time PCR,” Microbiology and Im-munology, vol. 47, no. 10, pp. 693–699, 2003.
[14] N. Balaban and A. Rasooly, “Analytical chromatography for re-covery of small amounts of staphylococcal enterotoxins fromfood,” International Journal of Food Microbiology, vol. 64, no.1-2, pp. 33–40, 2001.
[15] C. A. Bell, J. R. Uhl, T. L. Hadfield et al., “Detection ofBacillus anthracis DNA by LightCycler PCR,” Journal of Clin-ical Microbiology, vol. 40, no. 8, pp. 2897–2902, 2002.
[16] A. Curry, H. Appleton, and B. Dowsett, “Application of trans-mission electron microscopy to the clinical study of viral andbacterial infections: present and future,” Micron, vol. 37, no. 2,pp. 91–106, 2006.
[17] J. L. Versage, D. D. M. Severin, M. C. Chu, and J. M. Petersen,“Development of a multitarget real-time TaqMan PCR assayfor enhanced detection of Francisella tularensis in complexspecimens,” Journal of Clinical Microbiology, vol. 41, no. 12,pp. 5492–5499, 2003.
[18] E. Helgason, O. A. Qkatad, and D. A. Caugant, “Bacil-lus anthracis, Bacillus cereus and Bacillus thuringiensis—onespecies on the basis of genetic evidence,” Applied and Environ-mental Microbiology, vol. 66, no. 6, pp. 2627–2630, 2000.
[19] S. E. J. Bell, J. N. Mackle, and N. M. S. Sirimuthu, “Quan-titative surface-enhanced Raman spectroscopy of dipicolinicacid—towards rapid anthrax endospore detection,” Analyst,vol. 130, no. 4, pp. 545–549, 2005.
[20] G. M. Matar, I. A. Khneisser, and A. M. Abdelnoor, “Rapidlaboratory confirmation of human brucellosis by PCR analysisof a target sequence on the 31-kilodalton Brucella antigenDNA,” Journal of Clinical Microbiology, vol. 34, no. 2, pp. 477–478, 1996.
[21] C. Abril, H. Nimmervoll, P. Pilo et al., “Rapid diagnosis andquantification of Francisella tularensis in organs of naturallyinfected common squirrel monkeys (Saimiri sciureus),” Vet-erinary Microbiology, vol. 127, no. 1-2, pp. 203–208, 2008.
[22] L. Radnedge, S. Gamez-Chin, P. M. Mccready, P. L. Worsham,and G. L. Andersen, “Identification of nucleotide sequencesfor the specific and rapid detection of Yersinia pestis,” Appliedand Environmental Microbiology, vol. 67, no. 8, pp. 3759–3762,2001.
[23] C. Supaprom, D. Wang, C. Leelayuwat et al., “Development ofreal-time PCR assays and evaluation of their potential use forrapid detection of Burkholderia pseudomallei in clinical bloodspecimens,” Journal of Clinical Microbiology, vol. 45, no. 9, pp.2894–2901, 2007.
Hindawi Publishing CorporationJournal of Biomedicine and BiotechnologyVolume 2012, Article ID 324249, 9 pagesdoi:10.1155/2012/324249
Research Article
Finger Vein Recognition Based on (2D)2 PCA and Metric Learning
Gongping Yang, Xiaoming Xi, and Yilong Yin
School of Computer Science and Technology, Shandong University, Jinan 250101, China
Correspondence should be addressed to Yilong Yin, [email protected]
Received 22 February 2012; Accepted 19 March 2012
Academic Editor: Sabah Mohammed
Copyright © 2012 Gongping Yang et al. This is an open access article distributed under the Creative Commons AttributionLicense, which permits unrestricted use, distribution, and reproduction in any medium, provided the original work is properlycited.
Finger vein recognition is a promising biometric recognition technology, which verifies identities via the vein patterns in thefingers. In this paper, (2D)2 PCA is applied to extract features of finger veins, based on which a new recognition method is proposedin conjunction with metric learning. It learns a KNN classifier for each individual, which is different from the traditional methodswhere a fixed threshold is employed for all individuals. Besides, the SMOTE technology is adopted to solve the class-imbalanceproblem. Our experiments show that the proposed method is effective by achieving a recognition rate of 99.17%.
1. Introduction
Finger vein recognition is a promising biometric recognitiontechnology which verifies identities through finger veinpatterns. Medical studies have shown that the finger veinpattern is unique and stable. In detail, the finger veins of anindividual are different from the others’, and even the veinscaptured from a single individual are quite different from onefinger to another. Furthermore, the finger veins are alsoinvariant for healthy adults.
Compared with fingerprints, finger veins are hard to beforged or stolen as they are hidden inside the fingers. Thecontactless captures of finger veins also ensure both con-venience and cleanliness, and they are user-friendly. Fur-thermore, Finger veins are less affected by physiology andenvironment factors such as dry skin and dirt.
A typical finger vein recognition process is composed ofthe following four steps. Firstly, the finger vein images areobtained via the finger vein capturing devices. Secondly, thefinger vein images are preprocessed. Thirdly, the features areextracted. Finally, the finger vein images are matched basedon the extracted features.
The preprocessing procedure includes image enhance-ment, normalization, and segmentation. For image enhance-ment, Yang and Yan incorporated directional decompositionand Frangi filtering to enhance the image quality [1].
Yu et al. proposed an enhancement algorithm based onmulti-threshold combination [2]. Yang and Yang introducedmulti-channel Gabor filter to enhance the images andobtained better performance [3]. Finger vein segmentationis also a very important step, and there are some typicalmethods including line tracking [4], mean curvatures [5],and region growth-based feature [6]. A detailed descriptionof these approaches is beyond the scope of this paper.However, a summary of these approaches with the typicalreferences is provided in Table 1.
PCA is a popular linear dimensionality reduction andfeature extraction technology. It has extensive applicationsin image processing. Wu and Liu extracted the PCA featuresand then trained a neural network for matching, whichresults in a high recognition rate [7]. Since PCA transformsthe 2-dimensional image matrix to a 1-dimensional vector,the covariance matrix is always large in size and it is timeintensive to obtain the projection matrix which is composedof the covariance matrix’s eigenvectors. Yang et al. proposed2DPCA to reduce the size of the covariance matrix and savetime for computing projection matrices [8]. In order torepresent the characteristics of the 2-dimensional imagesmore accurately, Zhang and Zhou introduced (2D)2 PCAwhich can reflect the information of the image in row andcolumn directions, respectively, use less time to compute theprojection matrix, and get better experimental results onface recognition [9].

2 Journal of Biomedicine and Biotechnology
Table 1: Methods for personal authentication using finger vein recognition.
References Method Database fingers × samples per each Performance
[4] Linetracking 339× 2 images EER: 0.145%
[5] Mean curvature 125× 9 images EER: 0.25%
[13] Wide line detector 10, 140× 5 images EER: 0.87%
[14] Statistical vein energy 100× 10 images CCR: 98.7%
[15] Moment invariants 50× 4 images EER: 8.93%
[16] Sliding window matching 76× 6 images EER: 0.54%
[10] Manifold learning 164× 70 images EER: 0.8%
[7] PCA + BP network 10× 10 images CCR: 99%
[11] PCA + LDA + SVM 10× 10 images CCR: 98%
Recently, more and more researchers apply machinelearning methods to finger vein recognition. Liu et al. intro-duced manifold learning to finger vein recognition [10]. Wuand Liu used PCA and LDA to extract features and traina SVM model for recognition [11]. Measuring the distanceof the two samples is the premise of machine learning. Forexample, KNN requires a distance metric to find the neigh-bors of the target instance and then conducts classificationor regression based on the distance metric. Typical distancemetrics, such as Euclidean distance, make significant con-tribution in some application domains. In some conditions,these metrics cannot satisfy the assumption that the distancesbetween instances from the same class are small while thosefrom different classes are large. It limits the utilities of mostmachine learning methods.
There are two challenges for finger vein recognition: (1)how to efficiently extract distinguishing features and (2) howto design a strong classifier with high recognition rate andfast recognition speed to make the system more practical inreal-world applications.
To overcome these two challenges, in this paper weapply (2D)2 PCA to extract the features from finger veinimages. In order to address the shortcoming of traditionaldistance-metric-based classifiers, we build a classifier for eachindividual based on metric learning. With regard to trainingsamples of each classifier, the number of positive samples isinadequate as compared to the negative samples. Thus, weuse SMOTE technology to oversample the positive samplesto balance the two classes before training the classifier. Theexperimental results show that the proposed method hasgood performance on finger vein recognition.
The rest of this paper is organized as follows. The tech-nical background is briefly introduced in Section 2. The pro-posed method is described in Section 3. Experimental resultsare provided in Section 4. Finally, this paper is concludedin Section 5.
2. Technical Background
2.1. (2D)2 PCA. PCA is a typical linear dimensionalityreduction and feature extraction method. Due to the trans-formation from the 2-dimensional image matrix into a1-dimensional column vector, PCA often makes the sizeof the corresponding covariance matrix too large, and
computing the eigenvectors and eigenvalues becomes time-consuming. In order to solve this problem, Yang et al.proposed 2DPCA to extract the features [8]. 2DPCA directlyuses the image matrix to compute PCA features withouttransforming the 2-dimensional image matrix into a 1-dimensional column vector. Therefore, it reduces the size ofcorresponding covariance matrix and obtains the featureprojection matrix with less time. However, 2DPCA worksonly for the row direction of images. To address the problem,Zhang and Zhou proposed (2D)2 PCA which captures theimage information from not only the row direction but alsothe column direction [9]. The experimental results show that(2D)2 PCA outperforms 2DPCA and PCA in terms of bothrecognition rate and running time. The process of (2D)2 PCAis described as follows.
Considering M finger vein images, which are denotedby A1, . . . , AM , we compute the mean image matrix as A =(1/M)
∑j A j and the image covariance matrix G as
G = 1M
M∑j=1
(A j − A
)T(A j − A
). (1)
For a random image matrix A, the key of obtaining thenew features is to get the projection matrix X ∈ Rn×d, n � d.Then the new features are calculated as Y = AX. The totalscatter of the projected samples is used to determine a goodprojection matrix X, where the total scatter of the projectedsamples can be characterized by the trace of the covariancematrix of the projected feature vectors. From this point ofview, we adopt the following criterion:
J(X) = trace{E[
(Y− E(Y))(Y− E(Y))T]}
= trace{E[
(AX − E(AX))(AX − E(AX))T]}
= trace{
XTE[
(A− E(A))T(A− E(A))]
X}.
(2)
So,
J(X) = trace{
XTGX}. (3)
It has been proven that J(X) gets the maximum whenthe projection matrix X is composed by the d orthonormaleigenvectors coupled to the d largest eigenvalues. In so

Journal of Biomedicine and Biotechnology 3
After linear transformation, get newdistance metric
Before linear transformation,traditional distance metric
Figure 1: An example of LMNN.
saying, X obtains the optional value, and d can be controlledby setting a threshold as follows:
∑di=1 λi∑nj=1 λj
� θ, (4)
where θ is a user-specific threshold and λ1, λ2, . . . , λn is thetop-n largest eigenvalues of G.
Because X only reflects the information in the rowdirection, Zhang and Zhou proposed alternative 2DPCAwhich reflects the information in the column directionand combines 2DPCA with alternative 2DPCA to obtain anew method called (2D)2 PCA [9]. Here is the process ofalternative 2DPCA.
Let the image matrix A j = [(A(1)j )
T, . . . , (A(n)
j )T
]T
, and
the mean image matrix A = [(A(1)
)T
, . . . , (A(n)
)T
]T
,
where A(i)j and A
(i), denote the ith row vector of A(i)
j and A(i)
respectively. The image covariance matrix can be rewritten as
G1 = 1M
M∑j=1
m∑k=1
(A(k)
j − A(k))T(
A(k)j − A
(k)). (5)
Similarly, to achieve the projected matrix X in 2DPCA,we can obtain the projection matrix Z ∈ Rm×q from (2)and (5). We can also compute q in the same manner as wecompute d in 2DPCA.
Using the projected matrix X, Z in 2DPCA and alterna-tive 2DPCA, respectively, we can obtain the new feature
C = ZTAX. (6)
We can see from (6) that the new feature C reflects moreinformation of the image than the features obtained by2DPCA and alternative 2DPCA. Furthermore, the dimensionof C is smaller, and thus (2D)2 PCA costs less time than2DPCA and alternative 2DPCA for image processing.
2.2. Metric Learning. Most machine learning methods usedistance metrics to measure the dissimilarity of instances.Metric learning is able to learn an appropriate distancemetric. The main task of the metric learning is to find abetter distance metric, based on which the distances betweenthe samples from same class become small while those fromdifferent classes become large. This helps to improve theperformance of the machine learning methods.
To overcome the shortage of the KNN classifier usingEuclidean distance, Weinberge et al. proposed a metric learn-ing method called LMNN (Large Margin Nearest Neighbor)[12] which learns a distance metric to improve the perfor-mance of KNN classifiers. The metric is obtained by learninga linear transformation matrix L. With this distance metric,the distance between the same-class instances becomessmaller, and they are separated from the other instances bya large margin. The details are as follows.
Let Xi ∈ Rd (i = 1, . . . ,n) denote the feature vector oftraining instances and let yi be the corresponding label. Theessence of LMNN is to obtain a new distance D(xi, xj) =‖L(xi − xj)‖2 = (xi − xj)
TLTL(xi− xj) after learning a lineartransformation L matrix. With this distance metric, thedistance between the instance and its k nearest neighborswill be minimized and the distance between the instances indifferent classes will be larger. Figure 1 shows an example ofLMNN.
In Figure 1, green circles denote instances from the firstclass, yellow squares denote instances from the second class,and red squares denote instances from the third class.Consider the instance denoted by the white circle, which istreated as a test instance from the first class, in our followinganalysis. Based on Euclidean distance, we find 4 nearestneighbors, and this test instance is misclassified into thesecond class. However, using the LMNN-learned metric; thisinstance is separated from the second and the third instances.The distance between this instance and its neighbor is small.Now it is correctly classified into the first class.
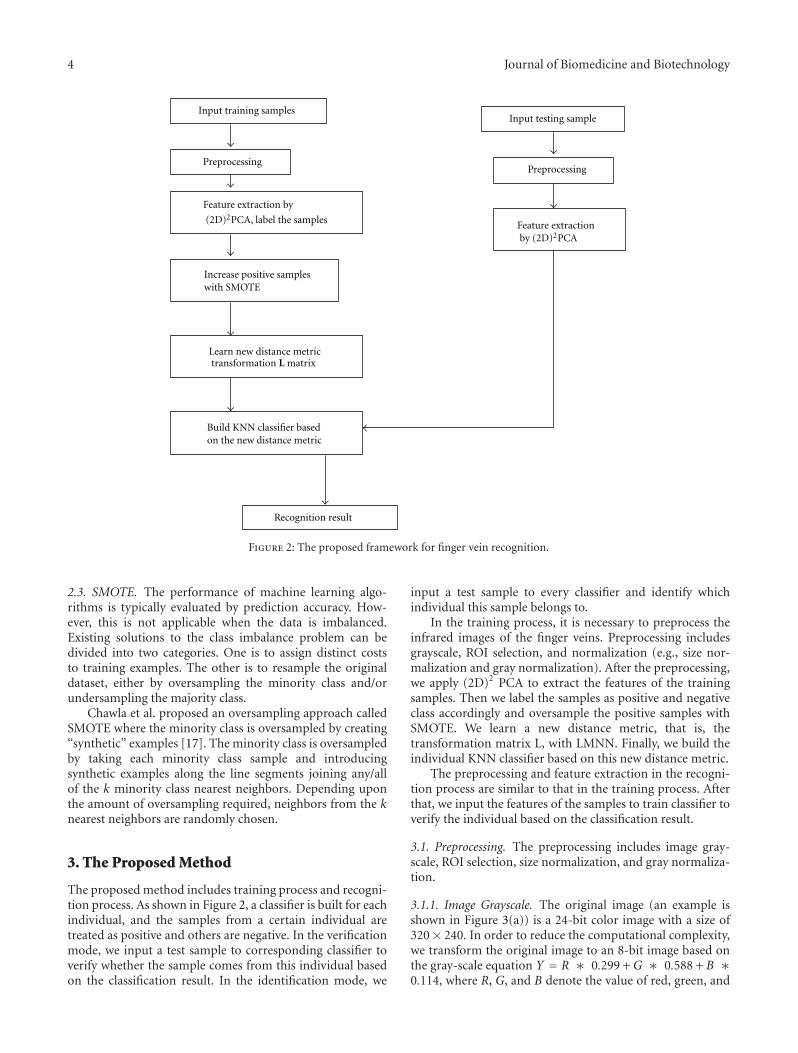
4 Journal of Biomedicine and Biotechnology
Input training samples
PreprocessingPreprocessing
Increase positive sampleswith SMOTE
Build KNN classifier basedon the new distance metric
Recognition result
Input testing sample
Feature extractionby (2D)2PCA
Feature extraction by
(2D)2PCA, label the samples
Learn new distance metrictransformation L matrix
Figure 2: The proposed framework for finger vein recognition.
2.3. SMOTE. The performance of machine learning algo-rithms is typically evaluated by prediction accuracy. How-ever, this is not applicable when the data is imbalanced.Existing solutions to the class imbalance problem can bedivided into two categories. One is to assign distinct coststo training examples. The other is to resample the originaldataset, either by oversampling the minority class and/orundersampling the majority class.
Chawla et al. proposed an oversampling approach calledSMOTE where the minority class is oversampled by creating“synthetic” examples [17]. The minority class is oversampledby taking each minority class sample and introducingsynthetic examples along the line segments joining any/allof the k minority class nearest neighbors. Depending uponthe amount of oversampling required, neighbors from the knearest neighbors are randomly chosen.
3. The Proposed Method
The proposed method includes training process and recogni-tion process. As shown in Figure 2, a classifier is built for eachindividual, and the samples from a certain individual aretreated as positive and others are negative. In the verificationmode, we input a test sample to corresponding classifier toverify whether the sample comes from this individual basedon the classification result. In the identification mode, we
input a test sample to every classifier and identify whichindividual this sample belongs to.
In the training process, it is necessary to preprocess theinfrared images of the finger veins. Preprocessing includesgrayscale, ROI selection, and normalization (e.g., size nor-malization and gray normalization). After the preprocessing,we apply (2D)2 PCA to extract the features of the trainingsamples. Then we label the samples as positive and negativeclass accordingly and oversample the positive samples withSMOTE. We learn a new distance metric, that is, thetransformation matrix L, with LMNN. Finally, we build theindividual KNN classifier based on this new distance metric.
The preprocessing and feature extraction in the recogni-tion process are similar to that in the training process. Afterthat, we input the features of the samples to train classifier toverify the individual based on the classification result.
3.1. Preprocessing. The preprocessing includes image gray-scale, ROI selection, size normalization, and gray normaliza-tion.
3.1.1. Image Grayscale. The original image (an example isshown in Figure 3(a)) is a 24-bit color image with a size of320× 240. In order to reduce the computational complexity,we transform the original image to an 8-bit image based onthe gray-scale equation Y = R ∗ 0.299 + G ∗ 0.588 + B ∗0.114, where R, G, and B denote the value of red, green, and
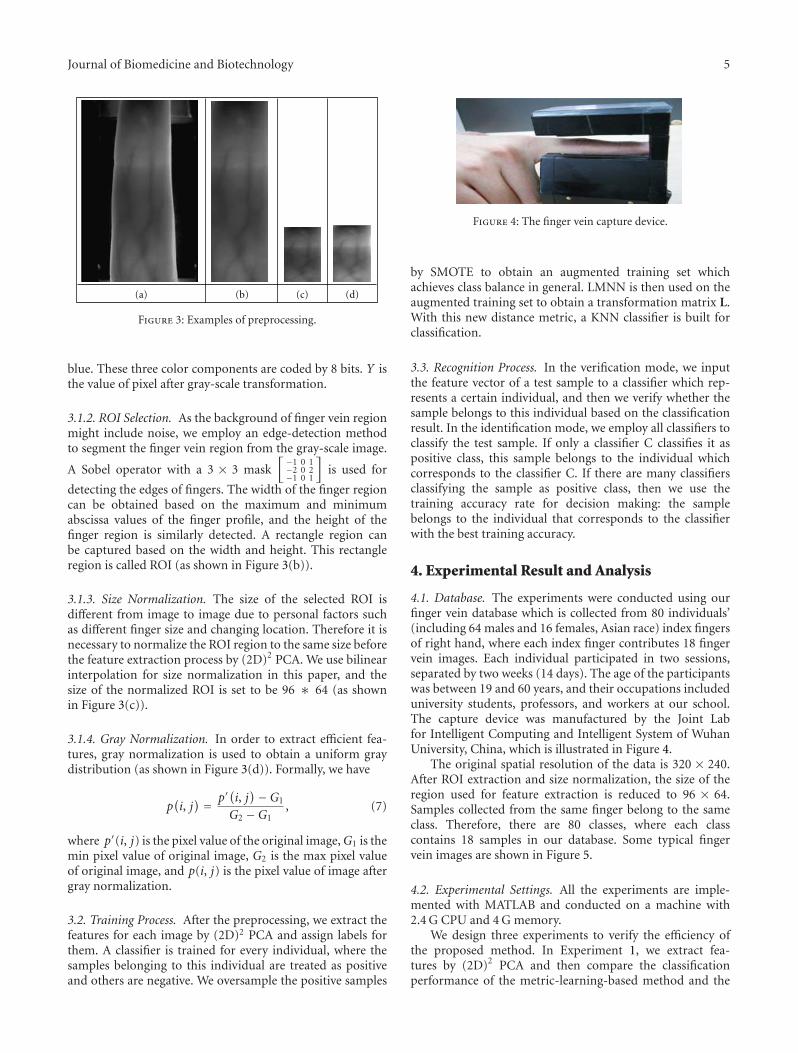
Journal of Biomedicine and Biotechnology 5
(a) (b) (c) (d)
Figure 3: Examples of preprocessing.
blue. These three color components are coded by 8 bits. Y isthe value of pixel after gray-scale transformation.
3.1.2. ROI Selection. As the background of finger vein regionmight include noise, we employ an edge-detection methodto segment the finger vein region from the gray-scale image.
A Sobel operator with a 3 × 3 mask[−1 0 1−2 0 2−1 0 1
]is used for
detecting the edges of fingers. The width of the finger regioncan be obtained based on the maximum and minimumabscissa values of the finger profile, and the height of thefinger region is similarly detected. A rectangle region canbe captured based on the width and height. This rectangleregion is called ROI (as shown in Figure 3(b)).
3.1.3. Size Normalization. The size of the selected ROI isdifferent from image to image due to personal factors suchas different finger size and changing location. Therefore it isnecessary to normalize the ROI region to the same size beforethe feature extraction process by (2D)2 PCA. We use bilinearinterpolation for size normalization in this paper, and thesize of the normalized ROI is set to be 96 ∗ 64 (as shownin Figure 3(c)).
3.1.4. Gray Normalization. In order to extract efficient fea-tures, gray normalization is used to obtain a uniform graydistribution (as shown in Figure 3(d)). Formally, we have
p(i, j) = p′
(i, j)−G1
G2 −G1, (7)
where p′(i, j) is the pixel value of the original image,G1 is themin pixel value of original image, G2 is the max pixel valueof original image, and p(i, j) is the pixel value of image aftergray normalization.
3.2. Training Process. After the preprocessing, we extract thefeatures for each image by (2D)2 PCA and assign labels forthem. A classifier is trained for every individual, where thesamples belonging to this individual are treated as positiveand others are negative. We oversample the positive samples
Figure 4: The finger vein capture device.
by SMOTE to obtain an augmented training set whichachieves class balance in general. LMNN is then used on theaugmented training set to obtain a transformation matrix L.With this new distance metric, a KNN classifier is built forclassification.
3.3. Recognition Process. In the verification mode, we inputthe feature vector of a test sample to a classifier which rep-resents a certain individual, and then we verify whether thesample belongs to this individual based on the classificationresult. In the identification mode, we employ all classifiers toclassify the test sample. If only a classifier C classifies it aspositive class, this sample belongs to the individual whichcorresponds to the classifier C. If there are many classifiersclassifying the sample as positive class, then we use thetraining accuracy rate for decision making: the samplebelongs to the individual that corresponds to the classifierwith the best training accuracy.
4. Experimental Result and Analysis
4.1. Database. The experiments were conducted using ourfinger vein database which is collected from 80 individuals’(including 64 males and 16 females, Asian race) index fingersof right hand, where each index finger contributes 18 fingervein images. Each individual participated in two sessions,separated by two weeks (14 days). The age of the participantswas between 19 and 60 years, and their occupations includeduniversity students, professors, and workers at our school.The capture device was manufactured by the Joint Labfor Intelligent Computing and Intelligent System of WuhanUniversity, China, which is illustrated in Figure 4.
The original spatial resolution of the data is 320 × 240.After ROI extraction and size normalization, the size of theregion used for feature extraction is reduced to 96 × 64.Samples collected from the same finger belong to the sameclass. Therefore, there are 80 classes, where each classcontains 18 samples in our database. Some typical fingervein images are shown in Figure 5.
4.2. Experimental Settings. All the experiments are imple-mented with MATLAB and conducted on a machine with2.4 G CPU and 4 G memory.
We design three experiments to verify the efficiency ofthe proposed method. In Experiment 1, we extract fea-tures by (2D)2 PCA and then compare the classificationperformance of the metric-learning-based method and the

6 Journal of Biomedicine and Biotechnology
(a) (b) (c) (d)
(e) (f)
Figure 5: Sample finger vein images.
classic Euclidean-distance-based method. In Experiment 2,we compare the classification performance of KNN classifiercombined with LMNN using different number of trainingsamples. In Experiment 3, we employ the SMOTE technologyto further boost the performance.
Experiment 1. In this experiment, we first generate four datasets as follows. We select 480, 720, 960, and 1200 images (i.e.,6, 9, 12, and 15 images for each individual) for training, andthe rest of 960, 720, 480, and 240 images (i.e., 12, 9, 6, and3 images for each individual) are left for testing, respectively.The Euclidean-distance-based recognition method works inthe following way. We treat the training samples from eachindividual as the positive class and construct a center pointfor each class, where the ith feature of the center point iscalculated by averaging the corresponding feature values ofthe training samples. As there are 80 individuals, we thenobtain 80 center point Ci (i = 1, 2, . . . , 80). For any testingsample C, we estimate the Euclidean distances from sample C
to each center point, D(C, Ci) = ‖C− Ci‖2(i = 1, 2, . . . , 80).
If (C, C j) = minD(C, Ci)(i = 1, 2, . . . , 80), then C goes to thejth class.
The metric-learning-based method works similarly as theEuclidean-distance-based method except for the usage of
the learned distance metric D(C, Ci) = ‖L(C− Ci)‖2(i =
1, 2, . . . , 80). The recognition rates of these two methods arecompared in Table 2.
It is clearly seen that the recognition rate of the metric-learning-based method is higher than the Euclidean-dis-tance-based method. With distance metric transformation,two samples from different classes with small Euclidean dis-tance are dragged farther. On the other hand, two samplesfrom the same class with large Euclidean distance are pulledcloser. Furthermore, the samples from different classes areseparated by a large margin. Next we are going to provide anintuitive explanation based on the example shown in Figures6 and 7.
These two figures show the data distribution of the dataset with 480 training samples and 960 testing samples. Weobtain 25 features for each sample using (2D)2 PCA andselect 2 features with the largest contribution to Euclideandistance metric. These two features constitute the verticaland horizontal coordinates of Figure 6. Similarly, these two

Journal of Biomedicine and Biotechnology 7
Table 2: The recognition rates of the compared methods.
Euclidean-distance-based method Metric-learning-based method
480 training, 960 testing 78.96% 86.46%
720 training, 720 testing 82.08% 91.25%
960 training, 480 testing 86.25% 92.29%
1200 training, 240 testing 84.58% 93.75%
0
0
200
400
600
800
100 200 300 400 500 600−300 −200 −100−800
−600
−400
−200
Positive training instancesPositive testing instancesNegative training instancesNegative testing instances
Figure 6: Samples distribution with Euclidean distance metric.
features are transformed to a new metric space using LMNN,as shown in Figure 7. The samples of the first individual(including 6 training images and 12 testing images) aretreated as positive, and the rest of them are considered asnegative. In Figures 6 and 7, we use red plus to denotepositive training samples, green plus for positive testingsamples, blue star for negative training samples, and yellowstar for negative testing samples. It is shown from Figure 6that it is difficult to distinguish the first class from theothers because the distances between samples in the firstclass and the other classes are indiscriminating. This inherentdrawback of the Euclidean distance significantly reduces therecognition performance. However, by using LMNN, thesamples in the first class are gathered together, as shown inFigure 7. In detail, the positive samples are located mainly inthe area of abscissa value between 0 and 10. On the contrary,most negative samples are scattered out. This makes it easierto discriminate samples in the first class from samples in theother classes.
Experiment 2. In this experiment, we select 6, 9, 12, and15 images from each individual as training samples tobuild a KNN classifier. The underlying distance metric foreach individual is learned by LMNN. Here the number ofneighbors, that is, k, is empirically set to be 3 in KNN. We
0 50 100 150 200 250 300
0
50
100
150
200
250
300
Positive training instancesPositive testing instancesNegative training instancesNegative testing instances
−100−50
−50
Figure 7: Samples distribution with new distance metric usingLMNN.
6 7 8 9 10 11 12 13 14 150.9
0.91
0.92
0.93
0.94
0.95
0.96
0.97
The number of the training samples of each individual
Rec
ogn
itio
n r
ate
Figure 8: The recognition rates with different numbers of trainingimages.
obtain different recognition rates with different numbers oftraining samples, and the experimental results are shown inFigure 8.
Overall, the recognition rate increases with the numberof training images increases. When the number of thetraining images goes to 15, the recognition rate reaches96.67%. It is also worth noting that, as compared to Table 2,
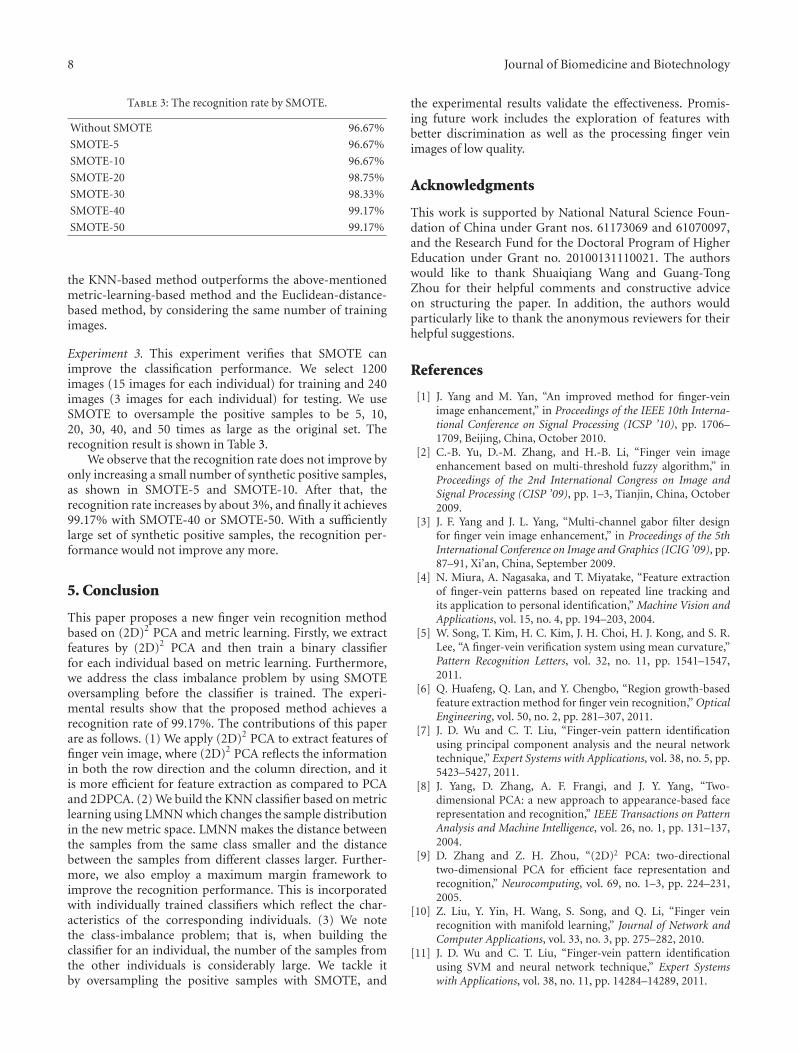
8 Journal of Biomedicine and Biotechnology
Table 3: The recognition rate by SMOTE.
Without SMOTE 96.67%
SMOTE-5 96.67%
SMOTE-10 96.67%
SMOTE-20 98.75%
SMOTE-30 98.33%
SMOTE-40 99.17%
SMOTE-50 99.17%
the KNN-based method outperforms the above-mentionedmetric-learning-based method and the Euclidean-distance-based method, by considering the same number of trainingimages.
Experiment 3. This experiment verifies that SMOTE canimprove the classification performance. We select 1200images (15 images for each individual) for training and 240images (3 images for each individual) for testing. We useSMOTE to oversample the positive samples to be 5, 10,20, 30, 40, and 50 times as large as the original set. Therecognition result is shown in Table 3.
We observe that the recognition rate does not improve byonly increasing a small number of synthetic positive samples,as shown in SMOTE-5 and SMOTE-10. After that, therecognition rate increases by about 3%, and finally it achieves99.17% with SMOTE-40 or SMOTE-50. With a sufficientlylarge set of synthetic positive samples, the recognition per-formance would not improve any more.
5. Conclusion
This paper proposes a new finger vein recognition methodbased on (2D)2 PCA and metric learning. Firstly, we extractfeatures by (2D)2 PCA and then train a binary classifierfor each individual based on metric learning. Furthermore,we address the class imbalance problem by using SMOTEoversampling before the classifier is trained. The experi-mental results show that the proposed method achieves arecognition rate of 99.17%. The contributions of this paperare as follows. (1) We apply (2D)2 PCA to extract features offinger vein image, where (2D)2 PCA reflects the informationin both the row direction and the column direction, and itis more efficient for feature extraction as compared to PCAand 2DPCA. (2) We build the KNN classifier based on metriclearning using LMNN which changes the sample distributionin the new metric space. LMNN makes the distance betweenthe samples from the same class smaller and the distancebetween the samples from different classes larger. Further-more, we also employ a maximum margin framework toimprove the recognition performance. This is incorporatedwith individually trained classifiers which reflect the char-acteristics of the corresponding individuals. (3) We notethe class-imbalance problem; that is, when building theclassifier for an individual, the number of the samples fromthe other individuals is considerably large. We tackle itby oversampling the positive samples with SMOTE, and
the experimental results validate the effectiveness. Promis-ing future work includes the exploration of features withbetter discrimination as well as the processing finger veinimages of low quality.
Acknowledgments
This work is supported by National Natural Science Foun-dation of China under Grant nos. 61173069 and 61070097,and the Research Fund for the Doctoral Program of HigherEducation under Grant no. 20100131110021. The authorswould like to thank Shuaiqiang Wang and Guang-TongZhou for their helpful comments and constructive adviceon structuring the paper. In addition, the authors wouldparticularly like to thank the anonymous reviewers for theirhelpful suggestions.
References
[1] J. Yang and M. Yan, “An improved method for finger-veinimage enhancement,” in Proceedings of the IEEE 10th Interna-tional Conference on Signal Processing (ICSP ’10), pp. 1706–1709, Beijing, China, October 2010.
[2] C.-B. Yu, D.-M. Zhang, and H.-B. Li, “Finger vein imageenhancement based on multi-threshold fuzzy algorithm,” inProceedings of the 2nd International Congress on Image andSignal Processing (CISP ’09), pp. 1–3, Tianjin, China, October2009.
[3] J. F. Yang and J. L. Yang, “Multi-channel gabor filter designfor finger vein image enhancement,” in Proceedings of the 5thInternational Conference on Image and Graphics (ICIG ’09), pp.87–91, Xi’an, China, September 2009.
[4] N. Miura, A. Nagasaka, and T. Miyatake, “Feature extractionof finger-vein patterns based on repeated line tracking andits application to personal identification,” Machine Vision andApplications, vol. 15, no. 4, pp. 194–203, 2004.
[5] W. Song, T. Kim, H. C. Kim, J. H. Choi, H. J. Kong, and S. R.Lee, “A finger-vein verification system using mean curvature,”Pattern Recognition Letters, vol. 32, no. 11, pp. 1541–1547,2011.
[6] Q. Huafeng, Q. Lan, and Y. Chengbo, “Region growth-basedfeature extraction method for finger vein recognition,” OpticalEngineering, vol. 50, no. 2, pp. 281–307, 2011.
[7] J. D. Wu and C. T. Liu, “Finger-vein pattern identificationusing principal component analysis and the neural networktechnique,” Expert Systems with Applications, vol. 38, no. 5, pp.5423–5427, 2011.
[8] J. Yang, D. Zhang, A. F. Frangi, and J. Y. Yang, “Two-dimensional PCA: a new approach to appearance-based facerepresentation and recognition,” IEEE Transactions on PatternAnalysis and Machine Intelligence, vol. 26, no. 1, pp. 131–137,2004.
[9] D. Zhang and Z. H. Zhou, “(2D)2 PCA: two-directionaltwo-dimensional PCA for efficient face representation andrecognition,” Neurocomputing, vol. 69, no. 1–3, pp. 224–231,2005.
[10] Z. Liu, Y. Yin, H. Wang, S. Song, and Q. Li, “Finger veinrecognition with manifold learning,” Journal of Network andComputer Applications, vol. 33, no. 3, pp. 275–282, 2010.
[11] J. D. Wu and C. T. Liu, “Finger-vein pattern identificationusing SVM and neural network technique,” Expert Systemswith Applications, vol. 38, no. 11, pp. 14284–14289, 2011.

Journal of Biomedicine and Biotechnology 9
[12] K. Weinberge, J. Blitzer, and L. Saul, “Distance metric learningfor large margin nearest neighbor classification,” in Proceed-ings of the Advances in Neural Information Processing Systems(NIPS ’06), 2006.
[13] B. Huang, Y. Dai, R. Li, D. Tang, and W. Li, “Finger-veinauthentication based on wide line detector and pattern nor-malization,” in Proceedings of the 20th International Conferenceon Pattern Recognition (ICPR ’10), pp. 1269–1272, Istanbul,Turkey, August 2010.
[14] J. Yang and X. Li, “Efficient finger vein localization and recog-nition,” in Proceedings of the 20th International Conferenceon Pattern Recognition (ICPR ’10), pp. 1148–1151, Istanbul,Turkey, August 2010.
[15] X. Qian, S. Guo, X. Li, F. Zhong, and X. Shao, “Finger-vein recognition based on the score level moment invariantsfusion,” in Proceedings of the International Conference on Com-putational Intelligence and Software Engineering (CiSE ’09), pp.1–4, Wuhan, China, December 2009.
[16] C. Liukui and Z. Hong, “Finger vein image recognition basedon tri-value template fuzzy matching,” in Proceedings of the 9thWSEAS International Conference on Multimedia Systems andSignal Processing (MUSP ’09), pp. 206–211, Hangzhou, China,May 2009.
[17] N. V. Chawla, K. W. Bowyer, L. O. Hall, and W. P. Kegelmeyer,“SMOTE: synthetic minority over-sampling technique,” Jour-nal of Artificial Intelligence Research, vol. 16, pp. 321–357, 2002.

Hindawi Publishing CorporationJournal of Biomedicine and BiotechnologyVolume 2012, Article ID 626148, 14 pagesdoi:10.1155/2012/626148
Research Article
Influence of Skin Diseases on Fingerprint Recognition
Martin Drahansky,1 Michal Dolezel,1 Jaroslav Urbanek,2
Eva Brezinova,3 and Tai-hoon Kim4
1 Faculty of Information Technology, Brno University of Technology, Bozetechova 2, 61266 Brno, Czech Republic2 Faculty of Medicine and Dentistry, Palacky University and Faculty Hospital, I. P. Pavlova 6, 77520 Olomouc, Czech Republic3 Faculty of Medicine, Masaryk University, Komenskeho namestı 2, 66243 Brno, Czech Republic4 Department of Multimedia Engineering, Hannam University, 133 Ojeong-dong, Daedeok-gu, Daejeon 306791, Republic of Korea
Correspondence should be addressed to Martin Drahansky, [email protected]
Received 25 February 2012; Accepted 26 February 2012
Academic Editor: Sabah Mohammed
Copyright © 2012 Martin Drahansky et al. This is an open access article distributed under the Creative Commons AttributionLicense, which permits unrestricted use, distribution, and reproduction in any medium, provided the original work is properlycited.
There are many people who suffer from some of the skin diseases. These diseases have a strong influence on the process offingerprint recognition. People with fingerprint diseases are unable to use fingerprint scanners, which is discriminating for them,since they are not allowed to use their fingerprints for the authentication purposes. First in this paper the various diseases,which might influence functionality of the fingerprint-based systems, are introduced, mainly from the medical point of view.This overview is followed by some examples of diseased finger fingerprints, acquired both from dactyloscopic card and electronicsensors. At the end of this paper the proposed fingerprint image enhancement algorithm is described.
1. Introduction
Skin diseases represent very important but often neglectedfactor of the fingerprint acquirement. It is impossible to sayin general how many people suffer from skin diseases, be-cause there are so many various skin diseases [1–5]. In a gen-eral medical practice, about 20–25% of patients with skincomplaints are referred. When discussing whether the finger-print recognition technology is a perfect solution capable toresolve all our security problems, we should always keep inmind those potential users who suffer from some skindisease.
In the following text, several skin diseases, which attackhand palms and fingertips, are introduced from the medicalpoint of view.
The situation after successful recovery of a potential userfrom such skin diseases is, however, very important for thepossible further use of fingerprint recognition devices. If thedisease has attacked and destroyed the structure of papillarylines in the epidermis and underlying dermis (top two layersof the skin), the papillary lines will not grow in the sameform as before (if at all), and therefore such users could berestricted in their future life by being excluded from the use
of fingerprint recognition systems, though their fingers donot have any symptoms of the skin disease anymore.
2. Skin Diseases
In the process of the fingerprint image acquirement, the skinstructure on the fingertip is being scanned. Skin is remark-able organ of the body, which is able to perform various vitalfunctions. It can mold to different shapes, stretch, and hard-en, but can also feel a delicate touch, pain, pressure, hot, andcold, and is an effective communicator between the outsideenvironment and the brain.
Skin makes up to 12–15% of an adult’s body weight. Eachsquare centimeter has 6 million cells, 5,000 sensory points,100 sweat glands, and 15 sebaceous glands. It consists of threelayers (see Figure 1) [6]: epidermis (the outer layer), dermis(“true skin”), and subcutaneous (fat) layer.
Skin is constantly being regenerated [6]. A skin cell startsits life at the lower layer of the skin (the basal layer of thedermis), which is supplied with blood vessels and nerve end-ings. The cell migrates upward for about two weeks until itreaches the bottom portion of the epidermis, which is the
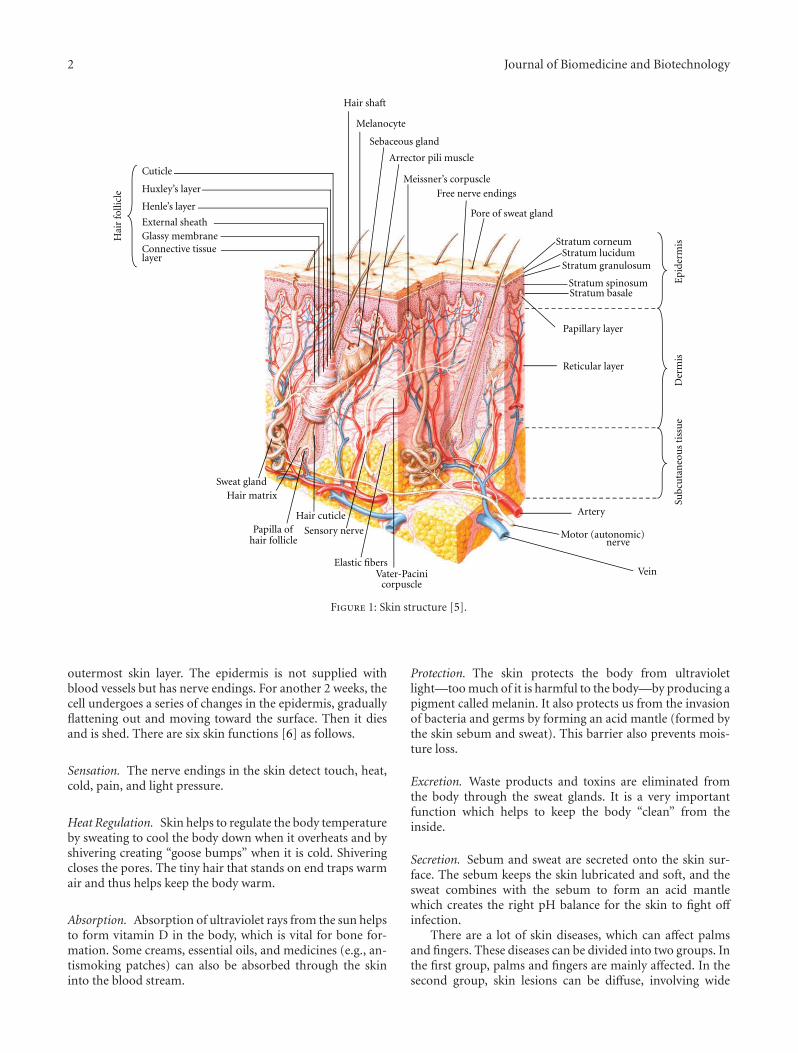
2 Journal of Biomedicine and Biotechnology
Hai
r fo
llicl
e
Artery
Motor (autonomic)
VeinVater-Pacinicorpuscle
Elastic fibers
Sensory nerve
Hair cuticlePapilla of
hair follicle
Hair matrixSweat gland
nerve
Reticular layer
Papillary layer
Stratum basaleStratum spinosum
Stratum granulosumStratum lucidum
Epi
derm
isD
erm
isSu
bcu
tan
eou
s ti
ssu
e
Stratum corneumConnective tissuelayer
Glassy membraneExternal sheath
Henle’s layer
Huxley’s layer
Cuticle
Pore of sweat gland
Free nerve endings
Meissner’s corpuscle
Arrector pili muscle
Sebaceous gland
Melanocyte
Hair shaft
Figure 1: Skin structure [5].
outermost skin layer. The epidermis is not supplied withblood vessels but has nerve endings. For another 2 weeks, thecell undergoes a series of changes in the epidermis, graduallyflattening out and moving toward the surface. Then it diesand is shed. There are six skin functions [6] as follows.
Sensation. The nerve endings in the skin detect touch, heat,cold, pain, and light pressure.
Heat Regulation. Skin helps to regulate the body temperatureby sweating to cool the body down when it overheats and byshivering creating “goose bumps” when it is cold. Shiveringcloses the pores. The tiny hair that stands on end traps warmair and thus helps keep the body warm.
Absorption. Absorption of ultraviolet rays from the sun helpsto form vitamin D in the body, which is vital for bone for-mation. Some creams, essential oils, and medicines (e.g., an-tismoking patches) can also be absorbed through the skininto the blood stream.
Protection. The skin protects the body from ultravioletlight—too much of it is harmful to the body—by producing apigment called melanin. It also protects us from the invasionof bacteria and germs by forming an acid mantle (formed bythe skin sebum and sweat). This barrier also prevents mois-ture loss.
Excretion. Waste products and toxins are eliminated fromthe body through the sweat glands. It is a very importantfunction which helps to keep the body “clean” from theinside.
Secretion. Sebum and sweat are secreted onto the skin sur-face. The sebum keeps the skin lubricated and soft, and thesweat combines with the sebum to form an acid mantlewhich creates the right pH balance for the skin to fight offinfection.
There are a lot of skin diseases, which can affect palmsand fingers. These diseases can be divided into two groups. Inthe first group, palms and fingers are mainly affected. In thesecond group, skin lesions can be diffuse, involving wide
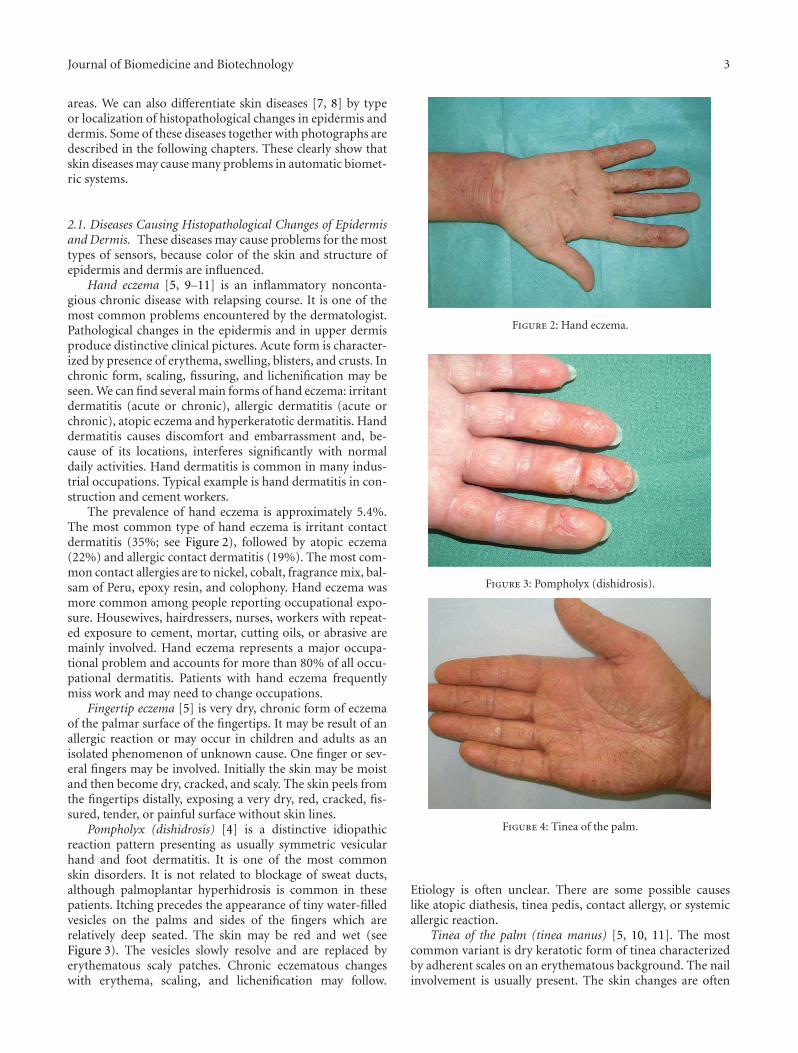
Journal of Biomedicine and Biotechnology 3
areas. We can also differentiate skin diseases [7, 8] by typeor localization of histopathological changes in epidermis anddermis. Some of these diseases together with photographs aredescribed in the following chapters. These clearly show thatskin diseases may cause many problems in automatic biomet-ric systems.
2.1. Diseases Causing Histopathological Changes of Epidermisand Dermis. These diseases may cause problems for the mosttypes of sensors, because color of the skin and structure ofepidermis and dermis are influenced.
Hand eczema [5, 9–11] is an inflammatory nonconta-gious chronic disease with relapsing course. It is one of themost common problems encountered by the dermatologist.Pathological changes in the epidermis and in upper dermisproduce distinctive clinical pictures. Acute form is character-ized by presence of erythema, swelling, blisters, and crusts. Inchronic form, scaling, fissuring, and lichenification may beseen. We can find several main forms of hand eczema: irritantdermatitis (acute or chronic), allergic dermatitis (acute orchronic), atopic eczema and hyperkeratotic dermatitis. Handdermatitis causes discomfort and embarrassment and, be-cause of its locations, interferes significantly with normaldaily activities. Hand dermatitis is common in many indus-trial occupations. Typical example is hand dermatitis in con-struction and cement workers.
The prevalence of hand eczema is approximately 5.4%.The most common type of hand eczema is irritant contactdermatitis (35%; see Figure 2), followed by atopic eczema(22%) and allergic contact dermatitis (19%). The most com-mon contact allergies are to nickel, cobalt, fragrance mix, bal-sam of Peru, epoxy resin, and colophony. Hand eczema wasmore common among people reporting occupational expo-sure. Housewives, hairdressers, nurses, workers with repeat-ed exposure to cement, mortar, cutting oils, or abrasive aremainly involved. Hand eczema represents a major occupa-tional problem and accounts for more than 80% of all occu-pational dermatitis. Patients with hand eczema frequentlymiss work and may need to change occupations.
Fingertip eczema [5] is very dry, chronic form of eczemaof the palmar surface of the fingertips. It may be result of anallergic reaction or may occur in children and adults as anisolated phenomenon of unknown cause. One finger or sev-eral fingers may be involved. Initially the skin may be moistand then become dry, cracked, and scaly. The skin peels fromthe fingertips distally, exposing a very dry, red, cracked, fis-sured, tender, or painful surface without skin lines.
Pompholyx (dishidrosis) [4] is a distinctive idiopathicreaction pattern presenting as usually symmetric vesicularhand and foot dermatitis. It is one of the most commonskin disorders. It is not related to blockage of sweat ducts,although palmoplantar hyperhidrosis is common in thesepatients. Itching precedes the appearance of tiny water-filledvesicles on the palms and sides of the fingers which arerelatively deep seated. The skin may be red and wet (seeFigure 3). The vesicles slowly resolve and are replaced byerythematous scaly patches. Chronic eczematous changeswith erythema, scaling, and lichenification may follow.
Figure 2: Hand eczema.
Figure 3: Pompholyx (dishidrosis).
Figure 4: Tinea of the palm.
Etiology is often unclear. There are some possible causeslike atopic diathesis, tinea pedis, contact allergy, or systemicallergic reaction.
Tinea of the palm (tinea manus) [5, 10, 11]. The mostcommon variant is dry keratotic form of tinea characterizedby adherent scales on an erythematous background. The nailinvolvement is usually present. The skin changes are often
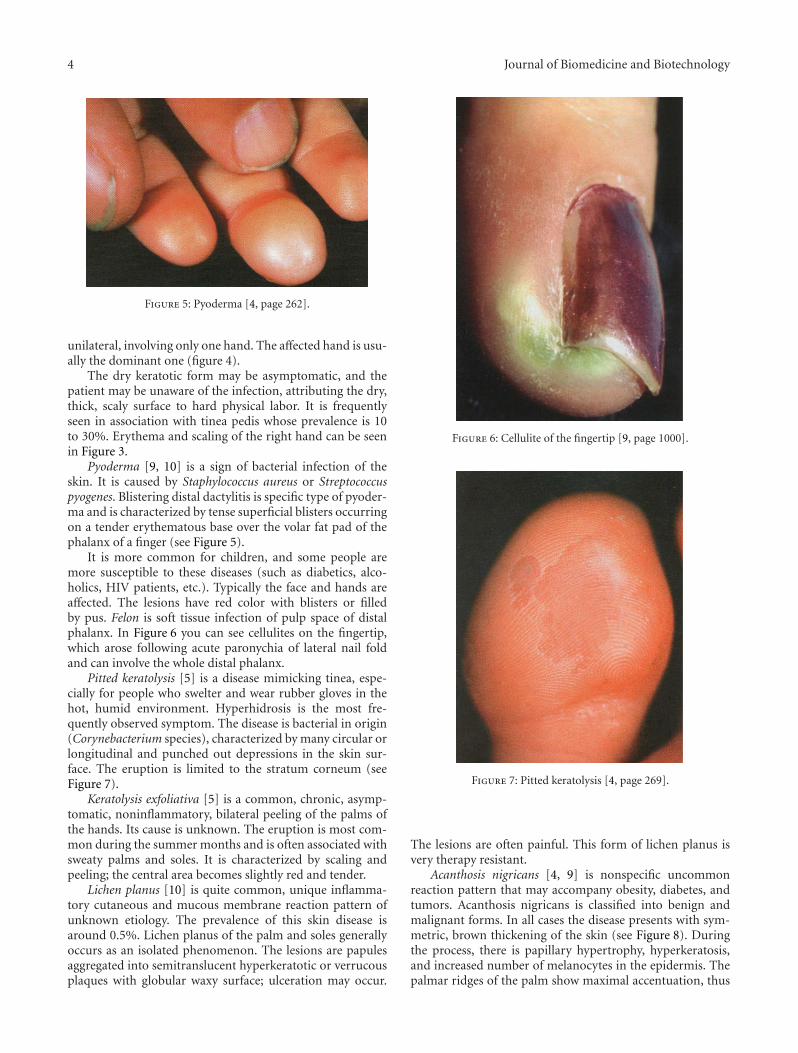
4 Journal of Biomedicine and Biotechnology
Figure 5: Pyoderma [4, page 262].
unilateral, involving only one hand. The affected hand is usu-ally the dominant one (figure 4).
The dry keratotic form may be asymptomatic, and thepatient may be unaware of the infection, attributing the dry,thick, scaly surface to hard physical labor. It is frequentlyseen in association with tinea pedis whose prevalence is 10to 30%. Erythema and scaling of the right hand can be seenin Figure 3.
Pyoderma [9, 10] is a sign of bacterial infection of theskin. It is caused by Staphylococcus aureus or Streptococcuspyogenes. Blistering distal dactylitis is specific type of pyoder-ma and is characterized by tense superficial blisters occurringon a tender erythematous base over the volar fat pad of thephalanx of a finger (see Figure 5).
It is more common for children, and some people aremore susceptible to these diseases (such as diabetics, alco-holics, HIV patients, etc.). Typically the face and hands areaffected. The lesions have red color with blisters or filledby pus. Felon is soft tissue infection of pulp space of distalphalanx. In Figure 6 you can see cellulites on the fingertip,which arose following acute paronychia of lateral nail foldand can involve the whole distal phalanx.
Pitted keratolysis [5] is a disease mimicking tinea, espe-cially for people who swelter and wear rubber gloves in thehot, humid environment. Hyperhidrosis is the most fre-quently observed symptom. The disease is bacterial in origin(Corynebacterium species), characterized by many circular orlongitudinal and punched out depressions in the skin sur-face. The eruption is limited to the stratum corneum (seeFigure 7).
Keratolysis exfoliativa [5] is a common, chronic, asymp-tomatic, noninflammatory, bilateral peeling of the palms ofthe hands. Its cause is unknown. The eruption is most com-mon during the summer months and is often associated withsweaty palms and soles. It is characterized by scaling andpeeling; the central area becomes slightly red and tender.
Lichen planus [10] is quite common, unique inflamma-tory cutaneous and mucous membrane reaction pattern ofunknown etiology. The prevalence of this skin disease isaround 0.5%. Lichen planus of the palm and soles generallyoccurs as an isolated phenomenon. The lesions are papulesaggregated into semitranslucent hyperkeratotic or verrucousplaques with globular waxy surface; ulceration may occur.
Figure 6: Cellulite of the fingertip [9, page 1000].
Figure 7: Pitted keratolysis [4, page 269].
The lesions are often painful. This form of lichen planus isvery therapy resistant.
Acanthosis nigricans [4, 9] is nonspecific uncommonreaction pattern that may accompany obesity, diabetes, andtumors. Acanthosis nigricans is classified into benign andmalignant forms. In all cases the disease presents with sym-metric, brown thickening of the skin (see Figure 8). Duringthe process, there is papillary hypertrophy, hyperkeratosis,and increased number of melanocytes in the epidermis. Thepalmar ridges of the palm show maximal accentuation, thus
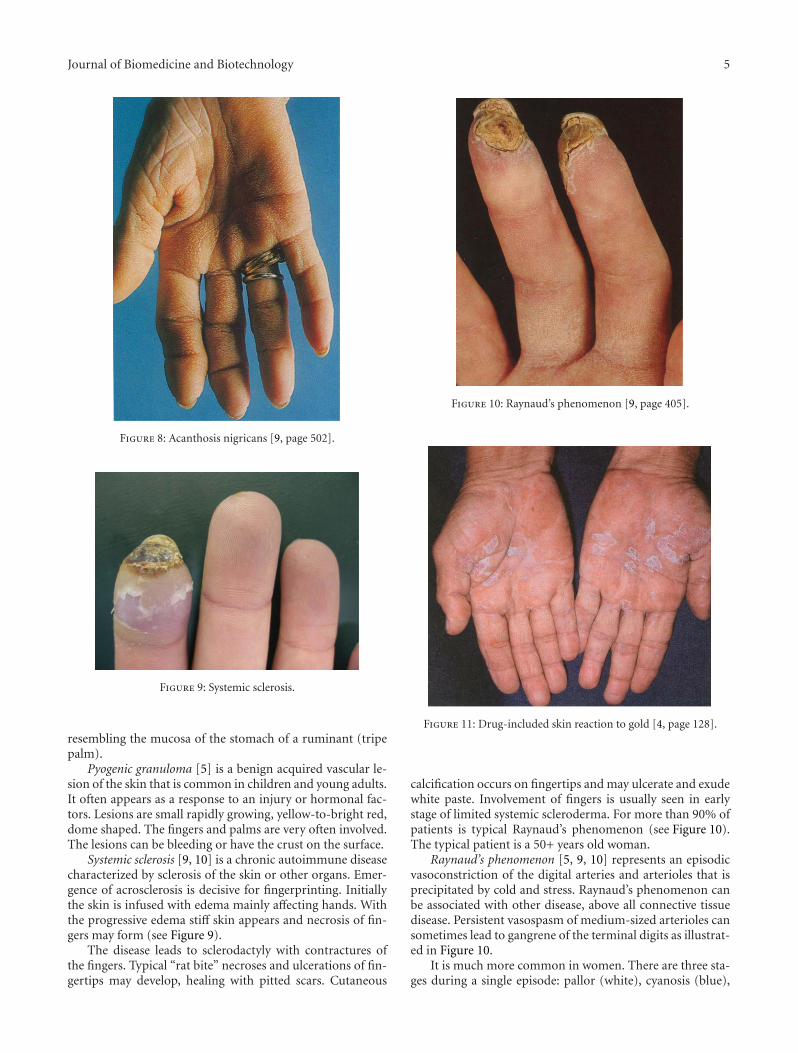
Journal of Biomedicine and Biotechnology 5
Figure 8: Acanthosis nigricans [9, page 502].
Figure 9: Systemic sclerosis.
resembling the mucosa of the stomach of a ruminant (tripepalm).
Pyogenic granuloma [5] is a benign acquired vascular le-sion of the skin that is common in children and young adults.It often appears as a response to an injury or hormonal fac-tors. Lesions are small rapidly growing, yellow-to-bright red,dome shaped. The fingers and palms are very often involved.The lesions can be bleeding or have the crust on the surface.
Systemic sclerosis [9, 10] is a chronic autoimmune diseasecharacterized by sclerosis of the skin or other organs. Emer-gence of acrosclerosis is decisive for fingerprinting. Initiallythe skin is infused with edema mainly affecting hands. Withthe progressive edema stiff skin appears and necrosis of fin-gers may form (see Figure 9).
The disease leads to sclerodactyly with contractures ofthe fingers. Typical “rat bite” necroses and ulcerations of fin-gertips may develop, healing with pitted scars. Cutaneous
Figure 10: Raynaud’s phenomenon [9, page 405].
Figure 11: Drug-included skin reaction to gold [4, page 128].
calcification occurs on fingertips and may ulcerate and exudewhite paste. Involvement of fingers is usually seen in earlystage of limited systemic scleroderma. For more than 90% ofpatients is typical Raynaud’s phenomenon (see Figure 10).The typical patient is a 50+ years old woman.
Raynaud’s phenomenon [5, 9, 10] represents an episodicvasoconstriction of the digital arteries and arterioles that isprecipitated by cold and stress. Raynaud’s phenomenon canbe associated with other disease, above all connective tissuedisease. Persistent vasospasm of medium-sized arterioles cansometimes lead to gangrene of the terminal digits as illustrat-ed in Figure 10.
It is much more common in women. There are three sta-ges during a single episode: pallor (white), cyanosis (blue),

6 Journal of Biomedicine and Biotechnology
Figure 12: Leprosy—loss of tissue [4, page 351].
and hyperemia (red). Estimates of the prevalence of Ray-naud’s phenomenon ranged between 5 and 20%. The therapyof this disorder is not quite satisfactory and problems areusually long lasting. There are a lot of causes of Raynaud’sphenomenon—connective tissue diseases, obstructive arte-rial diseases, neurogenic disorders, drugs as beta-adrenergicblockers and ergot preparations, cytostatics, trauma, hema-tologic causes, and so forth.
Drug-induced skin reactions [5] are among the most com-mon adverse drug reactions. They occur in many forms andcan mimic virtually any dermatosis and occur in 2-3% ofhospitalized patients. Sulfonamides, NSAIDs, and anticon-vulsants are most often applied in the etiology. Figure 11shows lichenoid drug reaction to gold.
Leprosy [9] is a chronic granulomatous disease causedby M. leprae, principally acquired during childhood/youngadulthood. Clinical manifestations, natural history, andprognosis of leprosy are related to the host response, and var-ious types of leprosy represent the spectra of the host’s im-munologic response. It is disease of developing world,600,000 new cases annually and 1.5 to 8 million total casesworldwide. More than 80% of cases occur in India, China,Myanmar, Indonesia, Brazil, and Nigeria. Lepromatous typecan lead to loss of tissue of fingertips (see Figure 12).
Herpes simplex virus [4, 9] in the host with systemic im-mune-compromise may cause chronic ulcerations as you cansee by the patient with advanced HIV disease in Figure 13(a).
Herpetic infection may uncommonly occur on the fin-gers or periungually. Lesions begin with tenderness, and er-ythema- and deep-seated blisters develop 24 to 48 h aftersymptoms begin (see Figure 13(b)).
Scabies [10, 12] is highly contagious disease caused bythe mite Sarcoptes scabiei. It is characterized by red papules,vesicles, and crusts located usually on the areas with tenderskin, palms, and soles especially in infants.
Erythema multiforme [10, 11] is quite common skin dis-order with multifactorial cause (see Figure 14). The mostcommon triggering agents are infections (in the first placeherpes virus) and drugs. Minor and major variant of this
(a)
(b)
Figure 13: Herpes simplex virus. (a) patient with HIV [9, page813]; (b) deep-seated blisters [4, page 369].
disease is described. Both forms are characterized by erythe-matous target-shaped lesions with a center with hemorrhage,blistering, necrosis, or crust. When the trigger is herpeticinfection, frequent recurrences come.
Dermatitis artefacta [11] are changes of skin due to themanipulation by patient. Patients often have psychosomatic,psychiatric, or drug-abuse problems.
2.2. Diseases Causing Skin Discoloration. These diseases arefocused mainly on optical sensors.

Journal of Biomedicine and Biotechnology 7
Figure 14: Erythema multiforme.
Hand, foot, and mouth disease (HFMD) [4, 5] is a con-tagious enteroviral infection occurring primarily in childrenand characterized by a vesicular palmoplantar eruption. Theskin lesions begin as red macules that rapidly become pale,white, oval vesicles with red areola.
Xanthomas [5, 9, 10] are lipid deposits in the skin andtendons that occur secondary to abnormalities of lipid me-tabolism. Xanthoma striatum palmare is pathognomonic forfamilial dysbetalipidemia, which is prone to atheroscleroticcardiovascular disease. Palmar xanthomas can also followmultiple myeloma and biliary cirrhosis. These localized de-posits are yellow-orange, flat or elevated, and are frequentlyvery firm, localized on the volar creases of palms and fingers.
Carotenosis [4] is yellowish discoloration of the skin, es-pecially of the palms and soles that is sometimes seen in dia-betic patients.
Scarlet fever (scarlatina) [5, 10] is contagious worldwidedisease caused by β-hemolytic Streptococcus that produces anerythrogenic toxin. It is most common in children (ages 1 to10 years). In the ending stages of the disease, large sheets ofepidermis may be shed from the palms in glove-like cast,exposing new tender and red epidermis beneath.
Kawasaki’s disease [9] is an acute febrile illness of infantsand children, characterized by cutaneous and mucosal ery-thema and edema with subsequent desquamation and cervi-cal lymphadenitis and complicated by coronary artery aneu-rysms (20%). Most cases of Kawasaki’s disease in adults rep-resent toxic shock syndrome. Erythematous macules appear1 to 3 days after onset of fever, enlarge, and become more nu-merous; then desquamation beginning on tips of fingers ishighly characteristic (see Figure 15).
Secondary syphilis [9, 10] (see Figure 16) starts at aboutthe 9th week of infection and is characterized by mucocuta-neous lesions, which may assume a variety of shapes, includ-ing round, elliptic, or annular. These lesions are called syphi-lids. Semirigid small lesions of red-brown color with scalingmay be observed on palms, soles, and fingers. Papulosqua-mous eruption can be similar to psoriasis.
Hereditary hemorrhagic telangiectasia [9] is an autosomaldominant condition affecting blood vessels, especially in themucous membranes of the mouth and the gastrointestinal
Figure 15: Kawasaki’s disease [9, page 425].
Figure 16: Secondary syphilis.
(a) (b)
Figure 17: Hereditary hemorrhagic Telangiectasia ((a) [4, page844], (b) [9, page 468]).
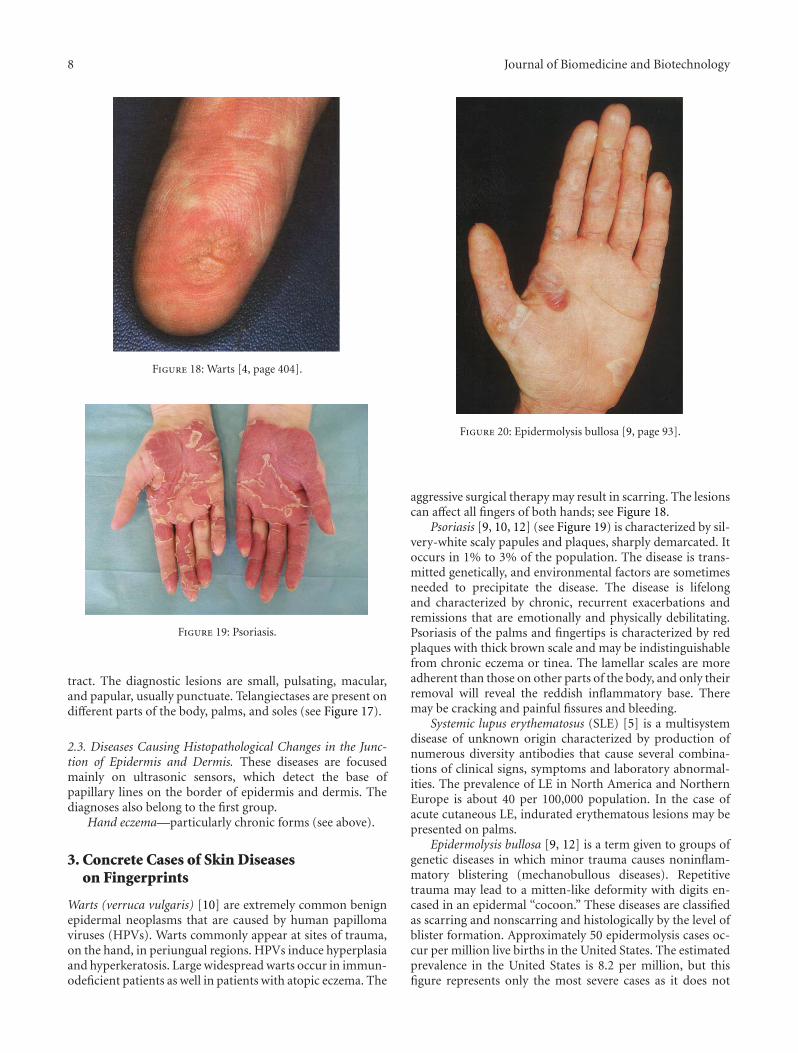
8 Journal of Biomedicine and Biotechnology
Figure 18: Warts [4, page 404].
Figure 19: Psoriasis.
tract. The diagnostic lesions are small, pulsating, macular,and papular, usually punctuate. Telangiectases are present ondifferent parts of the body, palms, and soles (see Figure 17).
2.3. Diseases Causing Histopathological Changes in the Junc-tion of Epidermis and Dermis. These diseases are focusedmainly on ultrasonic sensors, which detect the base ofpapillary lines on the border of epidermis and dermis. Thediagnoses also belong to the first group.
Hand eczema—particularly chronic forms (see above).
3. Concrete Cases of Skin Diseaseson Fingerprints
Warts (verruca vulgaris) [10] are extremely common benignepidermal neoplasms that are caused by human papillomaviruses (HPVs). Warts commonly appear at sites of trauma,on the hand, in periungual regions. HPVs induce hyperplasiaand hyperkeratosis. Large widespread warts occur in immun-odeficient patients as well in patients with atopic eczema. The
Figure 20: Epidermolysis bullosa [9, page 93].
aggressive surgical therapy may result in scarring. The lesionscan affect all fingers of both hands; see Figure 18.
Psoriasis [9, 10, 12] (see Figure 19) is characterized by sil-very-white scaly papules and plaques, sharply demarcated. Itoccurs in 1% to 3% of the population. The disease is trans-mitted genetically, and environmental factors are sometimesneeded to precipitate the disease. The disease is lifelongand characterized by chronic, recurrent exacerbations andremissions that are emotionally and physically debilitating.Psoriasis of the palms and fingertips is characterized by redplaques with thick brown scale and may be indistinguishablefrom chronic eczema or tinea. The lamellar scales are moreadherent than those on other parts of the body, and only theirremoval will reveal the reddish inflammatory base. Theremay be cracking and painful fissures and bleeding.
Systemic lupus erythematosus (SLE) [5] is a multisystemdisease of unknown origin characterized by production ofnumerous diversity antibodies that cause several combina-tions of clinical signs, symptoms and laboratory abnormal-ities. The prevalence of LE in North America and NorthernEurope is about 40 per 100,000 population. In the case ofacute cutaneous LE, indurated erythematous lesions may bepresented on palms.
Epidermolysis bullosa [9, 12] is a term given to groups ofgenetic diseases in which minor trauma causes noninflam-matory blistering (mechanobullous diseases). Repetitivetrauma may lead to a mitten-like deformity with digits en-cased in an epidermal “cocoon.” These diseases are classifiedas scarring and nonscarring and histologically by the level ofblister formation. Approximately 50 epidermolysis cases oc-cur per million live births in the United States. The estimatedprevalence in the United States is 8.2 per million, but thisfigure represents only the most severe cases as it does not
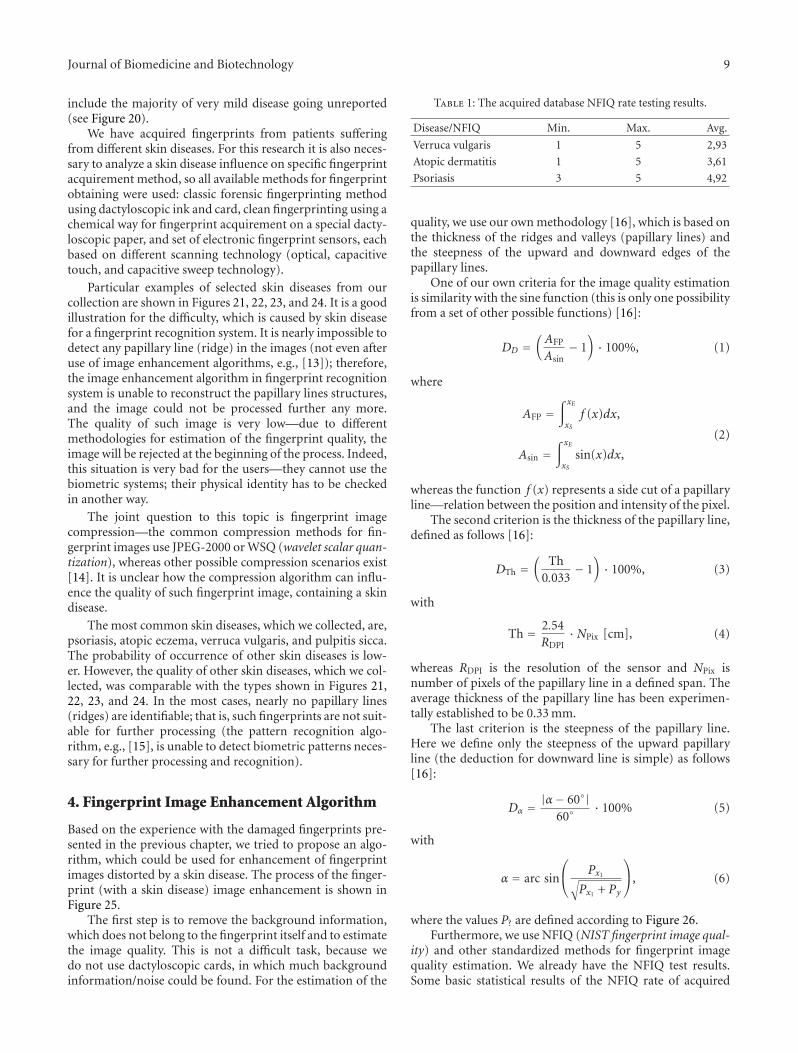
Journal of Biomedicine and Biotechnology 9
include the majority of very mild disease going unreported(see Figure 20).
We have acquired fingerprints from patients sufferingfrom different skin diseases. For this research it is also neces-sary to analyze a skin disease influence on specific fingerprintacquirement method, so all available methods for fingerprintobtaining were used: classic forensic fingerprinting methodusing dactyloscopic ink and card, clean fingerprinting using achemical way for fingerprint acquirement on a special dacty-loscopic paper, and set of electronic fingerprint sensors, eachbased on different scanning technology (optical, capacitivetouch, and capacitive sweep technology).
Particular examples of selected skin diseases from ourcollection are shown in Figures 21, 22, 23, and 24. It is a goodillustration for the difficulty, which is caused by skin diseasefor a fingerprint recognition system. It is nearly impossible todetect any papillary line (ridge) in the images (not even afteruse of image enhancement algorithms, e.g., [13]); therefore,the image enhancement algorithm in fingerprint recognitionsystem is unable to reconstruct the papillary lines structures,and the image could not be processed further any more.The quality of such image is very low—due to differentmethodologies for estimation of the fingerprint quality, theimage will be rejected at the beginning of the process. Indeed,this situation is very bad for the users—they cannot use thebiometric systems; their physical identity has to be checkedin another way.
The joint question to this topic is fingerprint imagecompression—the common compression methods for fin-gerprint images use JPEG-2000 or WSQ (wavelet scalar quan-tization), whereas other possible compression scenarios exist[14]. It is unclear how the compression algorithm can influ-ence the quality of such fingerprint image, containing a skindisease.
The most common skin diseases, which we collected, are,psoriasis, atopic eczema, verruca vulgaris, and pulpitis sicca.The probability of occurrence of other skin diseases is low-er. However, the quality of other skin diseases, which we col-lected, was comparable with the types shown in Figures 21,22, 23, and 24. In the most cases, nearly no papillary lines(ridges) are identifiable; that is, such fingerprints are not suit-able for further processing (the pattern recognition algo-rithm, e.g., [15], is unable to detect biometric patterns neces-sary for further processing and recognition).
4. Fingerprint Image Enhancement Algorithm
Based on the experience with the damaged fingerprints pre-sented in the previous chapter, we tried to propose an algo-rithm, which could be used for enhancement of fingerprintimages distorted by a skin disease. The process of the finger-print (with a skin disease) image enhancement is shown inFigure 25.
The first step is to remove the background information,which does not belong to the fingerprint itself and to estimatethe image quality. This is not a difficult task, because wedo not use dactyloscopic cards, in which much backgroundinformation/noise could be found. For the estimation of the
Table 1: The acquired database NFIQ rate testing results.
Disease/NFIQ Min. Max. Avg.
Verruca vulgaris 1 5 2,93
Atopic dermatitis 1 5 3,61
Psoriasis 3 5 4,92
quality, we use our own methodology [16], which is based onthe thickness of the ridges and valleys (papillary lines) andthe steepness of the upward and downward edges of thepapillary lines.
One of our own criteria for the image quality estimationis similarity with the sine function (this is only one possibilityfrom a set of other possible functions) [16]:
DD =(AFP
Asin− 1
)· 100%, (1)
where
AFP =∫ xE
xSf (x)dx,
Asin =∫ xE
xSsin(x)dx,
(2)
whereas the function f (x) represents a side cut of a papillaryline—relation between the position and intensity of the pixel.
The second criterion is the thickness of the papillary line,defined as follows [16]:
DTh =(
Th0.033
− 1)· 100%, (3)
with
Th = 2.54RDPI
·NPix [cm], (4)
whereas RDPI is the resolution of the sensor and NPix isnumber of pixels of the papillary line in a defined span. Theaverage thickness of the papillary line has been experimen-tally established to be 0.33 mm.
The last criterion is the steepness of the papillary line.Here we define only the steepness of the upward papillaryline (the deduction for downward line is simple) as follows[16]:
Dα = |α− 60◦|60◦
· 100% (5)
with
α = arc sin
⎛⎝ Px1√
Px1 + Py
⎞⎠, (6)
where the values P? are defined according to Figure 26.Furthermore, we use NFIQ (NIST fingerprint image qual-
ity) and other standardized methods for fingerprint imagequality estimation. We already have the NFIQ test results.Some basic statistical results of the NFIQ rate of acquired
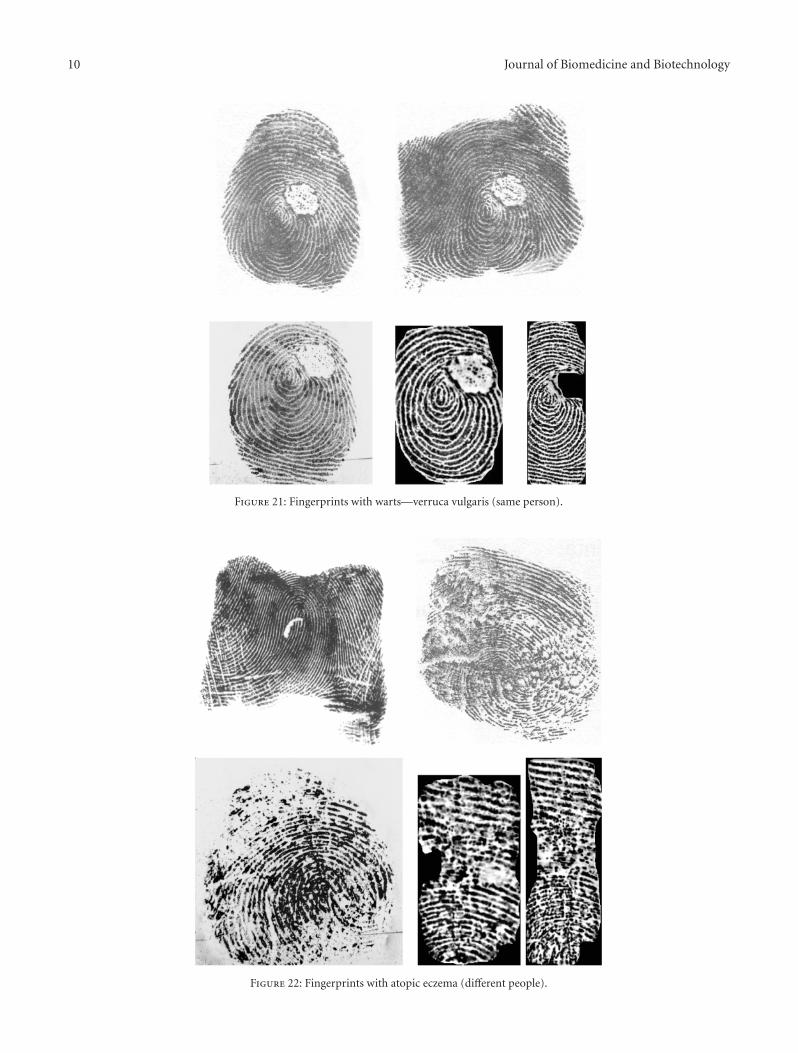
10 Journal of Biomedicine and Biotechnology
Figure 21: Fingerprints with warts—verruca vulgaris (same person).
Figure 22: Fingerprints with atopic eczema (different people).

Journal of Biomedicine and Biotechnology 11
Figure 23: Fingerprints with light psoriasis (same person).
Figure 24: Fingerprints with advanced psoriasis (different people).
database are shown in Table 1. NFIQ rate marks the topquality fingerprints with number 1 and the worst quality fin-gerprints with number 5. The performed testing confirmedthat the amount of damages on the finger corresponds tothe NFIQ rate, because the least invasive diseases (verrucavulgaris) have statistically better results than the serious inva-sive diseases like psoriasis. All other methods are being testedat the moment; that is, we are trying to find such solution,which would be reliable and quick enough to be usable in astand-alone device operated by a microcontroller unit with arelatively low processing power.
There are three possible results given by the image qual-ity estimator—LOW, MIDDLE, HIGH. If the quality isHIGH, then there is no need for any complex image qualityenhancement; that is, in this case the image could be directlyprocessed by a minutia extraction algorithm. If the quality isLOW, the image contains irrecoverable fragments in thefingerprint; that is, the enhancement is unreasonable in thiscase. Our enhancement algorithm is needed for the imagesclassified as MIDDLE quality images, of which the quality isinsufficient for a direct processing and is not that bad not tobe possible to enhance.

12 Journal of Biomedicine and Biotechnology
Noise removal
Quality checking
Equalized image
DFT
significant frequencies
IDFT
Template storage
Middle
Extraction of 5% most
Imag
e en
han
cem
ent
un
it
Rej
ect
extr
acti
onM
inu
tiae Low High
Figure 25: Process of the fingerprint image enhancement.
200180160140120100
80604020
0βα
Py
130 134 138 142 146 150 154 158 162
Px2Px1
Figure 26: Determination of the upward and downward sections ofthe curve in a side cut of a papillary line provided by the fingerprintimage.
The input image of our image quality enhancement algo-rithm should be an equalized image. The extractor finds thefirst stable point in the image. Then it cuts a subarea of animage undersampled to 100×100 pixels. This subarea is proc-essed by a local equalization algorithm (see Figure 27). Then,a phase image is obtained by the discrete fourier transform(DFT). In our case, only 5% of the most significantfrequencies (see Figure 2(b)) are being taken into account forthe further processing. We use these frequencies as an add-onfor the later comparison as well.
Our extractor undersamples the fingerprint image, andthen it extracts the background of the image—there arevalleys for standard fingerprints, scars, wrinkles, and otherdamages for critical fingerprints. Only the smaller part of theimage (around expected core position) is used for creation ofthe phase images.
(a)
(b)
Figure 27: Phase image (a) and phase image with most significantfrequencies (b).
Each feature extractor outputs a vector of numbers. Tomeasure similarity of the vectors, the Euclidian distance andsquare error between two vectors are calculated. For the con-tour shape, a special comparator was designed, which putsgreater weights to the tangents that are near the fingertip.They characterize more the uniqueness of the contour shape,in our opinion.
Hence, the template is represented by 5% of the most sig-nificant frequencies. The feature image of current record isrepresented by all of frequencies (100%). Now we calculatethe phase correlation of these two images:
Cphase =DFTimage ·DFT∗template∣∣∣DFTimage ·DFT∗template
∣∣∣ , (7)
where DFT is the discrete Fourier transform of the respectiveimage and DFT∗ is its complex conjugate. All multiplicationsin the equation are simple per element operations, which canbe finished really quickly.
After the phase correlation of the template image andthe current image, the Cphase is transformed by applying theinverse DFT to get the normalized cross-correlation Ccolor ofboth of the images (see Figure 28). The image Ccolor is thennormalized again to transform the values to an interval from

Journal of Biomedicine and Biotechnology 13
Figure 28: Normalized cross-correlation image in the color spacewith a marked global peak in it (upper left corner).
0 to 1. The goal is to determine the location of the globalpeak in the Ccolor image. Based on the value of the peak andaccording to the mean value, the final score is obtained as
score = 1Peak−Mean
− 1. (8)
The best final score is 0; the Mean value is computed fromthe selected pixel intensities. The selected pixels have theirintensities from 2% to 98%. In that case the highest and thelowest peak intensities are avoided for the computation ofthe Mean value. Therefore, Ccolor images with obvious peaksgenerate scores that are better separated from those withlower peaks or without peaks at all. In other words, the genu-ine images are better separated from the impostor images.
5. Conclusion
It is clear that either the color of the skin or the structureof papillary lines on the fingertip could be influenced bythe skin diseases. If only the color has changed, some ofoptical fingerprint scanners might be influenced, and sothis change is not crucial. On the other hand, the changeof skin structure is very significant, because, if papillarylines are damaged, it is impossible to find the minutiaeand therefore to recognize the person. If we are unableto recognize/enroll a person, then such person cannot usethe biometric system based on the fingerprint recognitiontechnology, and therefore there is a big problem securityissue—how to authorize such person, if use of PINs (personalidentification numbers) or other authorization methods is outof question? We do not consider other security issues, likesecure communication [17], revocable biometrics, templateprotection, and so forth—these are out of scope of this paper.
Some of these diseases are only temporary; that is, afterthe healing of such disease, the papillary line structure orcolor is restored and the user is again able to use their fingersfor the fingerprint recognition for the authorization tasks insecurity systems. However, some diseases leave irrecoverablefinger damage restraining new growth of papillary lines, and
respective user is then unable to use their fingerprints forappropriate recognition tasks in automated fingerprint secu-rity systems.
We prepare a new collection of fingerprints with skin dis-eases from patients, oriented not only on dactyloscopic fin-gerprints but also on live fingerprint images from differentfingerprint scanners. The resulting images will be used forquality assessment and, if the quality will be acceptable, forminutiae extraction and comparison based on minutiae.Maybe, we will consider other methods, based not only onminutiae but on correlation or other methods as well.
Acknowledgments
This research has been realized under the support of thefollowing grants: “Security-Oriented Research in InformationTechnologys-” MSM0021630528 (CZ), “Information Technol-ogy in Biomedical Engineering-” GD102/09/H083 (CZ) and“Advanced secured, reliable and adaptive IT-” FIT-S-11-1and “The IT4Innovations Centre of Excellence-” IT4I-CZ1.05/1.1.00/02.0070.
References
[1] “Evaluation of Fingerprint Recognition Technologies - Bio-Finger,” Public Final Report, version 1.1, Bundesamt fur Siche-rheit in der Informationstechnik, p. 122, 2004.
[2] A. K. Jain, P. Flynn, and A. A. Ross, Handbook of Biometrics,Springer, New York, NY, USA, 2008.
[3] R. M. Bolle, J. H. Connell, S. Pankanti, N. K. Ratha, and A. W.Senior, Guide to Biometrics, Springer, New York, NY, USA,2004.
[4] W. D. James, T. G. Berger, and D. M. Elston, Andrew’s Diseasesof the Skin—Clinical Dermatology, Elsevier Saunders, Ontario,Canada, 10th edition, 2006.
[5] T. P. Habif, Clinical Dermatology, Mosby, Hong Kong, China,4th edition, 2004.
[6] “The Science of the Skin,” http://www.naturalrussia.com/nat-ural/skin/structure.html.
[7] M. Drahansky, E. Brezinova, D. Lodrova, and F. Orsag, “Fin-gerprint recognition influenced by skin diseases,” InternationalJournal of Bio-Science and Bio-Technology, vol. 3, no. 4, pp. 11–22, 2010.
[8] E. Brezinova, M. Drahansky, and F. Orsag, “Dermatologic dis-eases and fingerprint recognition,” in Database Theory and Ap-plication, Bio-Science and Bio-Technology 2010, pp. 251–257,Springer, Berlin, Germnay, 2010.
[9] K. Wolff, R. A. Johnson, and D. Suurmond, Fitzpatrick’s ColorAtlas and Synopsis of Clinical Dermatology, McGraw-Hill, NewYork, NY, USA, 5th edition, 2005.
[10] J. Stork et al., Dermatovenerologie, Galen, Prague, Czech Re-public, 2008.
[11] O. Braun-Falco, G. Plewig, H. H. Wolff, and W. H. C.Burgdorf, Eds., Dermatology, Springer, Heidelberg, Germany,2nd edition, 2000.
[12] W. L. Weston, A. T. Lane, and J. G. Morelli,, Color Textbookof Pediatric Dermatology, Mosby Elsevier, Hong Kong, China,2007.
[13] I. Jafar and H. Ying, “New algorithms for contrast enhance-ment in grayscale images based on the variational definition

14 Journal of Biomedicine and Biotechnology
of histogram equalization,” Integrated Computer-Aided Engi-neering, vol. 15, no. 2, pp. 131–147, 2008.
[14] A. A. Mohammed, R. Minhas, Q. M. J. Wu, and M. A. Sid-Ahmed, “An efficient fingerprint image compression tech-nique based on wave atoms decomposition and multistagevector quantization,” Integrated Computer-Aided Engineering,vol. 17, no. 1, pp. 29–40, 2010.
[15] H. Lee, E. Kim, and M. Park, “A genetic feature weightingscheme for pattern recognition,” Integrated Computer-AidedEngineering, vol. 14, no. 2, pp. 161–171, 2007.
[16] M. Drahansky, Fingerprint recognition technology: liveness de-tection, image quality and skin diseases, Habilitation thesis,Brno, Czech Republic, 2010.
[17] D. Neumann, R. Eckmiller, and O. Baruth, “Combination ofbiometric data and learning algorithms for both generationand application of a secure communication link,” IntegratedComputer-Aided Engineering, vol. 14, no. 4, pp. 345–353, 2007.

Hindawi Publishing CorporationJournal of Biomedicine and BiotechnologyVolume 2012, Article ID 215019, 12 pagesdoi:10.1155/2012/215019
Research Article
Using Hierarchical Time Series Clustering Algorithm andWavelet Classifier for Biometric Voice Classification
Simon Fong
Department of Computer and Information Science, University of Macau, Taipa, Macau
Correspondence should be addressed to Simon Fong, [email protected]
Received 22 December 2011; Accepted 25 December 2011
Academic Editor: Sabah Mohammed
Copyright © 2012 Simon Fong. This is an open access article distributed under the Creative Commons Attribution License, whichpermits unrestricted use, distribution, and reproduction in any medium, provided the original work is properly cited.
Voice biometrics has a long history in biosecurity applications such as verification and identification based on characteristics of thehuman voice. The other application called voice classification which has its important role in grouping unlabelled voice samples,however, has not been widely studied in research. Lately voice classification is found useful in phone monitoring, classifyingspeakers’ gender, ethnicity and emotion states, and so forth. In this paper, a collection of computational algorithms are proposedto support voice classification; the algorithms are a combination of hierarchical clustering, dynamic time wrap transform, discretewavelet transform, and decision tree. The proposed algorithms are relatively more transparent and interpretable than the existingones, though many techniques such as Artificial Neural Networks, Support Vector Machine, and Hidden Markov Model (whichinherently function like a black box) have been applied for voice verification and voice identification. Two datasets, one that isgenerated synthetically and the other one empirically collected from past voice recognition experiment, are used to verify anddemonstrate the effectiveness of our proposed voice classification algorithm.
1. Introduction
Every human voice is unique [1] as it was found to be quan-titatively composed of components called phonemes thathave a pitch, cadence, and inflection. Hence human voicehas been used as one of the popular biometrics in biosecurityapplications; it can be used to authenticate a person’s identity(identification) and control access (authentication and verifi-cation) to a protected resource. Unlike other biological traits,like fingerprints and iris scans, voiceprints are relativelyvulnerable to replay attack. Much of the research works havebeen devoted to finding improved solutions in the hopeof strengthening voiceprints for meeting high demands ofsecurity applications. Some popular techniques include mul-timodal authentication that fused audio, visual, and otherforms of biometrics into one [2]. Since then, voice biometricshas been largely geared towards the security directions ofbiometric identification and biometric verification. Voicebiometrics is used either alone or in combination with otherbiometrics. In voice verification (VV), a voiceprint of a
speaker who claims to be who he is, is presented to the bio-metrics system for a one-to-one checking of the referencevoiceprint which is stored in a database. Once he is succes-sfully verified with a match, subsequent access rights wouldbe granted to him. The other type of checking called voiceidentification (VI) relies on a one-to-many checking foridentifying a previously unknown voiceprint. The unlabelledvoiceprint under question is searching through the wholedatabase with the aim of finding a match of an already knownsample.
We can see that both VV and VI require a priori condi-tion that a set of voiceprints must have already been knownfor the matching of new samples to proceed. This is akinto database query or supervised learning where preknownsamples must be initially used to train up a decision model,so testing and matching of new sample can follow. A genericexample is illustrated in Figure 1. What if in a scenariowhere a handful of unknown voiceprints are collected, butwe wish to obtain some information about them? Such sce-narios may include but not limited to security surveillance

2 Journal of Biomedicine and Biotechnology
With an alleged identity
Verification
With identity unknown
Identification
A
B
C...
Z
A
B
C...
Z
Bξ
?ξ∈[A,B,C, . . . ,Z]?[B = B]
Figure 1: Workings of voice verification and voice identification systems.
where∅ is an empty set
Secured Compromised
where⊗
means perturbation
AA
B
C
A
C
B
C
A
B
C
A∩ B ∩ C = ∅
A ∩ B ∩ C
B∧
[B∧ ← A⊗
B] or [B∧ ← A]
[A or B∧] ∩C = ∅A∩ B∧! = ∅
Figure 2: Example that shows a voice-biometric system is compromised, and a voiceprint is counterfeited.
problems [3] where a list of voice traces are captured from amonitored area, how many unique speakers there are, theirages, and genders, and from their speech accents which eth-nic backgrounds these people belong to; customer-serviceapplications where callers will be automatically classifiedfrom their tones to categories of their needs and emotions.It was only until recently, voice classification (VC) thatattempts to determine if a speaker should be classified toa particular characteristic group rather than to a particularindividual has gained popularity. VC can help complementthe security of VV and VI systems too. In Figure 2 an exampleof a voice biometric system is being compromised; throughhacking, the content of a voiceprint B is modified to thatof another voiceprint (let us say A) that has a higher accessauthority. That can be done by replay attack or injecting vocalfeatures of A into B. Because the database of the voiceprintsjust like an encrypted list of passwords in a file system isaccessed individually, each voiceprint is protected indepen-dently; allowing the existence of two same voiceprints goesundetected. So an imposter with B′ can cheat gaining arestricted access right by matching B′ to A in a VI system. VCcould be used to prevent this fraud by checking how manyunique items there are in different groups. If extra voiceprintssuddenly emerge or have gone missing from a group, theintegrities of the voiceprints must have changed.
For developing a VC system, several approaches havebeen studied, such as Artificial Neural Networks (ANN),Support Vector Machines (SVMs), Hidden Markov Models(HMMs) and Gaussian Mixture Models (GMMs). Theyhave been used heavily for training up a model with pre-
defined voice samples for voice recognition. Table 1 showsa summary of the techniques by which majority of researchworks used. These techniques generally function like a blackbox; for instance, the weights for mapping the relations ofthe inputs to the outputs are in plain numeric, the kernelparameters are used for low-level computation, and so forth.They require a full set of known samples to be availablebefore they can be tuned up for actual use. In this paper wepropose a fundamentally new approach by using unsuper-vised learning—clustering, where priori labeled samples arenot needed—the characteristic groupings will be dedicatedby the samples themselves. Voiceprints who share similarfeatures will be placed into distinctive groups that representsome labels about the speakers. Subsequently a decision tree(classifier) can be built after studying and confirming thecharacteristic groups. The classifier will then be used for clas-sifying new samples into the groups. The advantage of deci-sion tree is that easily comprehensible rules in terms of IF-THEN-ELSE conditions can be generated when the decisiontree is constructed. That gives an edge over the aforemen-tioned black-box types of classification algorithms. Using thefeatures of a human voice as a voice classifier for classifyingspeakers has not been researched a great extent although ithas a large implication in voice biometrics applications. Tothe best of the author’s knowledge, nobody has applied suchtechniques of VC before. This is the research focus of thispaper; a collection of algorithms are introduced for support-ing grouping unlabeled voiceprints and then subsequentlyclassifying new incoming voiceprints. They can be used forchecking the integrity of the groups of voiceprints for solving
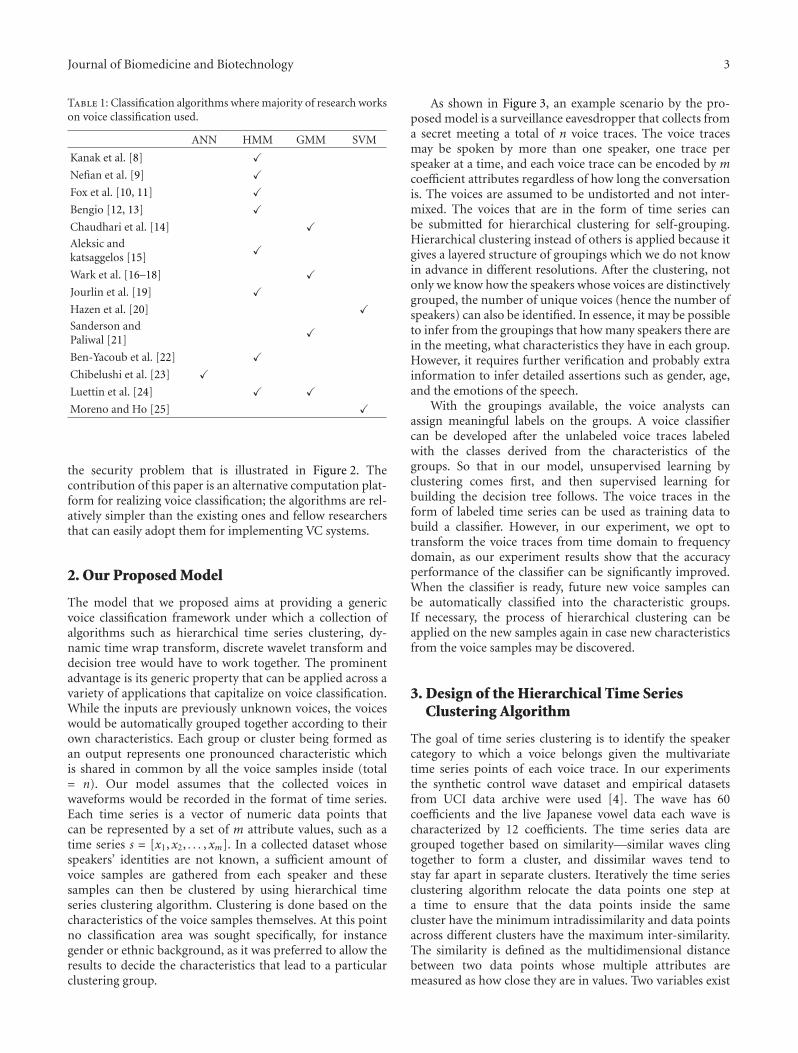
Journal of Biomedicine and Biotechnology 3
Table 1: Classification algorithms where majority of research workson voice classification used.
ANN HMM GMM SVM
Kanak et al. [8] �Nefian et al. [9] �Fox et al. [10, 11] �Bengio [12, 13] �Chaudhari et al. [14] �Aleksic andkatsaggelos [15]
�
Wark et al. [16–18] �Jourlin et al. [19] �Hazen et al. [20] �Sanderson andPaliwal [21]
�
Ben-Yacoub et al. [22] �Chibelushi et al. [23] �Luettin et al. [24] � �Moreno and Ho [25] �
the security problem that is illustrated in Figure 2. Thecontribution of this paper is an alternative computation plat-form for realizing voice classification; the algorithms are rel-atively simpler than the existing ones and fellow researchersthat can easily adopt them for implementing VC systems.
2. Our Proposed Model
The model that we proposed aims at providing a genericvoice classification framework under which a collection ofalgorithms such as hierarchical time series clustering, dy-namic time wrap transform, discrete wavelet transform anddecision tree would have to work together. The prominentadvantage is its generic property that can be applied across avariety of applications that capitalize on voice classification.While the inputs are previously unknown voices, the voiceswould be automatically grouped together according to theirown characteristics. Each group or cluster being formed asan output represents one pronounced characteristic whichis shared in common by all the voice samples inside (total= n). Our model assumes that the collected voices inwaveforms would be recorded in the format of time series.Each time series is a vector of numeric data points thatcan be represented by a set of m attribute values, such as atime series s = [x1, x2, . . . , xm]. In a collected dataset whosespeakers’ identities are not known, a sufficient amount ofvoice samples are gathered from each speaker and thesesamples can then be clustered by using hierarchical timeseries clustering algorithm. Clustering is done based on thecharacteristics of the voice samples themselves. At this pointno classification area was sought specifically, for instancegender or ethnic background, as it was preferred to allow theresults to decide the characteristics that lead to a particularclustering group.
As shown in Figure 3, an example scenario by the pro-posed model is a surveillance eavesdropper that collects froma secret meeting a total of n voice traces. The voice tracesmay be spoken by more than one speaker, one trace perspeaker at a time, and each voice trace can be encoded by mcoefficient attributes regardless of how long the conversationis. The voices are assumed to be undistorted and not inter-mixed. The voices that are in the form of time series canbe submitted for hierarchical clustering for self-grouping.Hierarchical clustering instead of others is applied because itgives a layered structure of groupings which we do not knowin advance in different resolutions. After the clustering, notonly we know how the speakers whose voices are distinctivelygrouped, the number of unique voices (hence the number ofspeakers) can also be identified. In essence, it may be possibleto infer from the groupings that how many speakers there arein the meeting, what characteristics they have in each group.However, it requires further verification and probably extrainformation to infer detailed assertions such as gender, age,and the emotions of the speech.
With the groupings available, the voice analysts canassign meaningful labels on the groups. A voice classifiercan be developed after the unlabeled voice traces labeledwith the classes derived from the characteristics of thegroups. So that in our model, unsupervised learning byclustering comes first, and then supervised learning forbuilding the decision tree follows. The voice traces in theform of labeled time series can be used as training data tobuild a classifier. However, in our experiment, we opt totransform the voice traces from time domain to frequencydomain, as our experiment results show that the accuracyperformance of the classifier can be significantly improved.When the classifier is ready, future new voice samples canbe automatically classified into the characteristic groups.If necessary, the process of hierarchical clustering can beapplied on the new samples again in case new characteristicsfrom the voice samples may be discovered.
3. Design of the Hierarchical Time SeriesClustering Algorithm
The goal of time series clustering is to identify the speakercategory to which a voice belongs given the multivariatetime series points of each voice trace. In our experimentsthe synthetic control wave dataset and empirical datasetsfrom UCI data archive were used [4]. The wave has 60coefficients and the live Japanese vowel data each wave ischaracterized by 12 coefficients. The time series data aregrouped together based on similarity—similar waves clingtogether to form a cluster, and dissimilar waves tend tostay far apart in separate clusters. Iteratively the time seriesclustering algorithm relocate the data points one step ata time to ensure that the data points inside the samecluster have the minimum intradissimilarity and data pointsacross different clusters have the maximum inter-similarity.The similarity is defined as the multidimensional distancebetween two data points whose multiple attributes aremeasured as how close they are in values. Two variables exist
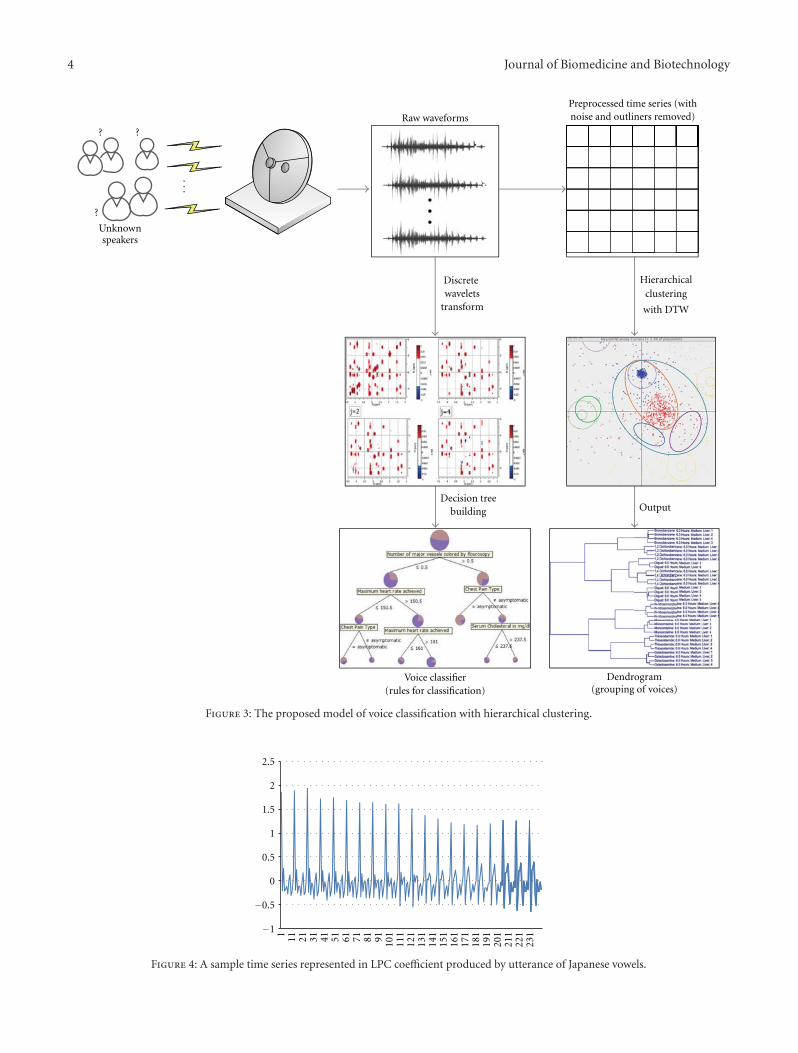
4 Journal of Biomedicine and Biotechnology
...
??
?
Unknownspeakers
Raw waveforms
Preprocessed time series (withnoise and outliners removed)
Discretewavelets
transform
Hierarchicalclustering
with DTW
Decision treebuilding Output
Voice classifier(rules for classification)
Dendrogram(grouping of voices)
Figure 3: The proposed model of voice classification with hierarchical clustering.
−1
−0.5
0
0.5
1
1.5
2
2.5
1 11 21 31 41 51 61 71 81 91 101
111
121
131
141
151
161
171
181
191
201
211
221
231
Figure 4: A sample time series represented in LPC coefficient produced by utterance of Japanese vowels.
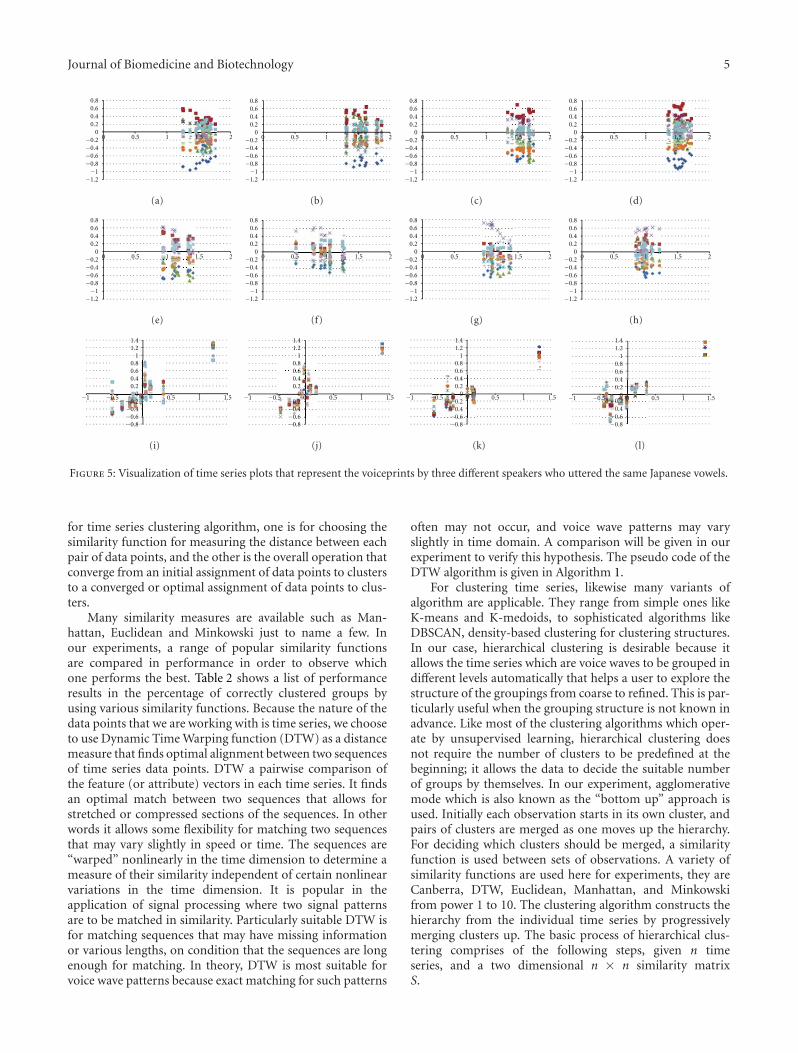
Journal of Biomedicine and Biotechnology 5
0.80.60.40.2
00−0.2
−0.4−0.6−0.8−1
−1.2
0.5 1 1.5 2
(a)
0.80.60.40.2
0−0.2−0.4−0.6−0.8−1
−1.2
0 0.5 1 1.5 2
(b)
0.80.60.40.2
0−0.2−0.4−0.6−0.8−1
−1.2
0 0.5 1 1.5 2
(c)
0.80.60.40.2
0−0.2−0.4−0.6−0.8−1
−1.2
0 0.5 1 1.5 2
(d)
0.80.60.40.2
0−0.2−0.4−0.6−0.8−1
−1.2
0 0.5 1 1.5 2
(e)
0.80.60.40.2
0−0.2−0.4−0.6−0.8−1
−1.2
0 0.5 1 1.5 2
(f)
0.80.60.40.2
0−0.2−0.4−0.6−0.8−1
−1.2
0 0.5 1 1.5 2
(g)
0.80.60.40.2
0−0.2−0.4−0.6−0.8−1
−1.2
0 0.5 1 1.5 2
(h)
−1 −0.5 0 0.5 1 1.5
1.41.2
10.80.60.40.2
0−0.2−0.4−0.6−0.8
(i)
−1 −0.5 0 0.5 1 1.5
1.41.2
10.80.60.40.2
0−0.2−0.4−0.6−0.8
(j)
−1 −0.5 0 0.5 1 1.5
1.41.2
10.80.60.40.2
0−0.2−0.4−0.6−0.8
(k)
−1 −0.5 0 0.5 1 1.5
1.41.2
10.80.60.40.2
0−0.2−0.4−0.6−0.8
(l)
Figure 5: Visualization of time series plots that represent the voiceprints by three different speakers who uttered the same Japanese vowels.
for time series clustering algorithm, one is for choosing thesimilarity function for measuring the distance between eachpair of data points, and the other is the overall operation thatconverge from an initial assignment of data points to clustersto a converged or optimal assignment of data points to clus-ters.
Many similarity measures are available such as Man-hattan, Euclidean and Minkowski just to name a few. Inour experiments, a range of popular similarity functionsare compared in performance in order to observe whichone performs the best. Table 2 shows a list of performanceresults in the percentage of correctly clustered groups byusing various similarity functions. Because the nature of thedata points that we are working with is time series, we chooseto use Dynamic Time Warping function (DTW) as a distancemeasure that finds optimal alignment between two sequencesof time series data points. DTW a pairwise comparison ofthe feature (or attribute) vectors in each time series. It findsan optimal match between two sequences that allows forstretched or compressed sections of the sequences. In otherwords it allows some flexibility for matching two sequencesthat may vary slightly in speed or time. The sequences are“warped” nonlinearly in the time dimension to determine ameasure of their similarity independent of certain nonlinearvariations in the time dimension. It is popular in theapplication of signal processing where two signal patternsare to be matched in similarity. Particularly suitable DTW isfor matching sequences that may have missing informationor various lengths, on condition that the sequences are longenough for matching. In theory, DTW is most suitable forvoice wave patterns because exact matching for such patterns
often may not occur, and voice wave patterns may varyslightly in time domain. A comparison will be given in ourexperiment to verify this hypothesis. The pseudo code of theDTW algorithm is given in Algorithm 1.
For clustering time series, likewise many variants ofalgorithm are applicable. They range from simple ones likeK-means and K-medoids, to sophisticated algorithms likeDBSCAN, density-based clustering for clustering structures.In our case, hierarchical clustering is desirable because itallows the time series which are voice waves to be grouped indifferent levels automatically that helps a user to explore thestructure of the groupings from coarse to refined. This is par-ticularly useful when the grouping structure is not known inadvance. Like most of the clustering algorithms which oper-ate by unsupervised learning, hierarchical clustering doesnot require the number of clusters to be predefined at thebeginning; it allows the data to decide the suitable numberof groups by themselves. In our experiment, agglomerativemode which is also known as the “bottom up” approach isused. Initially each observation starts in its own cluster, andpairs of clusters are merged as one moves up the hierarchy.For deciding which clusters should be merged, a similarityfunction is used between sets of observations. A variety ofsimilarity functions are used here for experiments, they areCanberra, DTW, Euclidean, Manhattan, and Minkowskifrom power 1 to 10. The clustering algorithm constructs thehierarchy from the individual time series by progressivelymerging clusters up. The basic process of hierarchical clus-tering comprises of the following steps, given n timeseries, and a two dimensional n × n similarity matrixS.

6 Journal of Biomedicine and Biotechnology
DTW(v1, v2) {//where the vectors v1=(a1,. . .,an), v2=(b1,. . .,bm) are the time series with n and m
time points
Let a two dimensional data matrix S be the store of similarity measures
such that S[0,. . .,n, 0,. . .,m], and i, j, are loop index, cost is an integer.
// initialize the data matrix
S[0, 0] := 0
FOR i := 1 to m DO LOOP
S[0, i] := ∞END
FOR i := 1 to n DO LOOP
S[i, 0] := ∞END
// Using pairwise method, incrementally fill in the similarity matrix
with the differences of the two time series
FOR i := 1 to n DO LOOP
FOR j := 1 to m DO LOOP
// function to measure the distance between the two points
cost := d(v1[i], v2[j])S[i, j] := cost + MIN(S[i-1, j], // increment
S[i, j−1], // decrement
S[i-1, j−1]) // match
END
END
Return S[n, m]}
Algorithm 1: Pseudo code of dynamic time wrap algorithm.
Table 2: Percentage of correctly clustered groups in various similarity functions.
Canberra DTW Euclidean Manhattan Minkowski Minkow. 2 Minkow. 3
86.67 91.67 63.33 63.33 63.33 63.33 66.67
Minkow. 4 Minkow. 5 Minkow. 6 Minkow. 7 Minkow. 8 Minkow. 9 Minkow. 10
78.33 83.33 86.67 76.67 66.67 66.67 66.67
Step 1. Each time series is assigned to a cluster of its own,with a total of n clusters for n time series. Initialize S withsimilarity measures between the clusters which are the sameas the similarity measure between the time series that theycontain.
Step 2. The most similar pair of clusters are merged into asingle cluster. Retain the current level of clusters and moveup a level in the hierarchy.
Step 3. Calculate the new similarity measures in S betweenthe new clusters and each of the old clusters.
Step 4. Finally repeat Step 2 and Step 3 until all the timeseries are clustered into a single cluster of size n. When thishappens, the highest level of the hierarchy is attained.
4. Experiments
4.1. Datasets. Two experiments are conducted for testing theperformance of the algorithm over a synthetic control dataset[5] and a live dataset [6]. The synthetic control dataset
contains 600 examples of time series wave forms syntheticallygenerated by the process in Alcock and Manolopoulos(1999) [7]. There are six different classes of control chartsthat represent generally different shapes of time series waves.Each wave is characterized by 60 coefficients in the formof temporal data points, each different group (or class) has100 samples and total there are 600 samples in the dataset.Each class has an essentially unique bunch of waveforms thatare different from those of the other classes; hence, we canassume the six classes represent six different types of speakerswho have different voiceprints from one another. For exam-ple, it could be speakers who come from six different geo-graphical locations therefore different ascents, speakers whospeak in six different emotions/languages, or speakers of sixdistinctively different age groups. We generalize the namesof these characteristic groups as speech types.
The other empirical dataset contains 640 time series of12 linear prediction cepstrum coefficients (LPCs) taken fromnine male speakers. The data was initially collected by aJapanese research team for examining a newly developedclassifier for multidimensional curves (multidimensionaltime series). The volunteered speakers uttered two Japanese

Journal of Biomedicine and Biotechnology 7
DistMatrixhclust (∗, “average”)
Hei
ght
1000
800
600
400
200
0
5 5 5 55 5 5 5 55 3 3 3 3 3 3 3 3 3
3
6 6 6 6 6 6 6 6
6 64 4 4 4 4 4 4 4 4 4 1 1 11 1 1 1 1 1 1
22 2 2 2 2
2 2 2 2
(a)
DistMatrixhclust (∗, “average”)
Cluster dendrogram
Hei
ght
1000
800
600
400
200
0 429
475
495
492
486 42
242
622
228
028
648
043
045
4 292
229
275
254
226
295
230
595
580
522
526
529
575
586
554 386
380
322
326
329
395
330
375
392
354
22 75 26 29 86 80 92 30 95 5453
059
219
212
912
618
019
512
2 130
175
186
154
(b)
Figure 6: (a) Six characteristic groups at the dendrogram by using DTW similarity function. (b) The corresponding row numbers of thedataset at the dendrogram by using DTW similarity function.
vowels /ae /successively. For each utterance, a 12-degreelinear prediction analysis was applied to obtain a discrete-time series with 12 LPC cepstrum coefficients. This meansthat one utterance by a speaker forms a time series whoselength is in the range 7–29, and each point of a time seriesis of 12 features (12 coefficients). Analysis parameters are asfollows: sampling rate = 10 kHz, frame length = 25.6 ms, andshift length = 6.4 ms. So for the dataset, a set of consecutiveblocks represents a unique speaker. There are 30 blocks foreach speaker. Blocks 1–30 represent speaker 1, blocks 31–60represent speaker 2, and so on up to speaker 9. A sample ofthe time series taken from one of the voice trace is shown inFigure 4.
Just as shown in our model in Figure 3, the raw voiceseries are formatted and processed into records that haveexactly 12 coefficients (attributes). Hierarchical time seriesclustering is applied over the processed data, so that eachdata point that the clustering algorithm works with hasidentical attributes and scales for similarities measures. Byplotting the processed data with x-axis as the first column
of a consecutive block against the rest of the series withvalues within the range at the y-axis, we generate somevisualization of the time series points with distinguishableshapes. Figure 5 shows three groups of voice series that aretaken from the dataset blocks from three different speakers.Just by visual inspection, we could observe their differencesin appearance. The four voice utterances on the top row sit atabout three quarters on the x-axis, the cap of the data clustersis dominated by small square dots (that just represent oneof the coefficient values of the block of the sample), thenfollowed by other shapes of dots and diamond shaped dotsat the bottom. Though each of the four clusters on the toprow is not exactly identical to each other, they roughly havea similar structure. In the middle row, the voice visualizationby another speaker has the data near the middle of x-axis,and the outlined structure has the cross-shaped markers onthe cap. And the visualization on the bottom row has anobviously different formation than the other two. That showsthe voices of the three speakers are essentially different as bytheir voice characteristics, and the differences can be visually
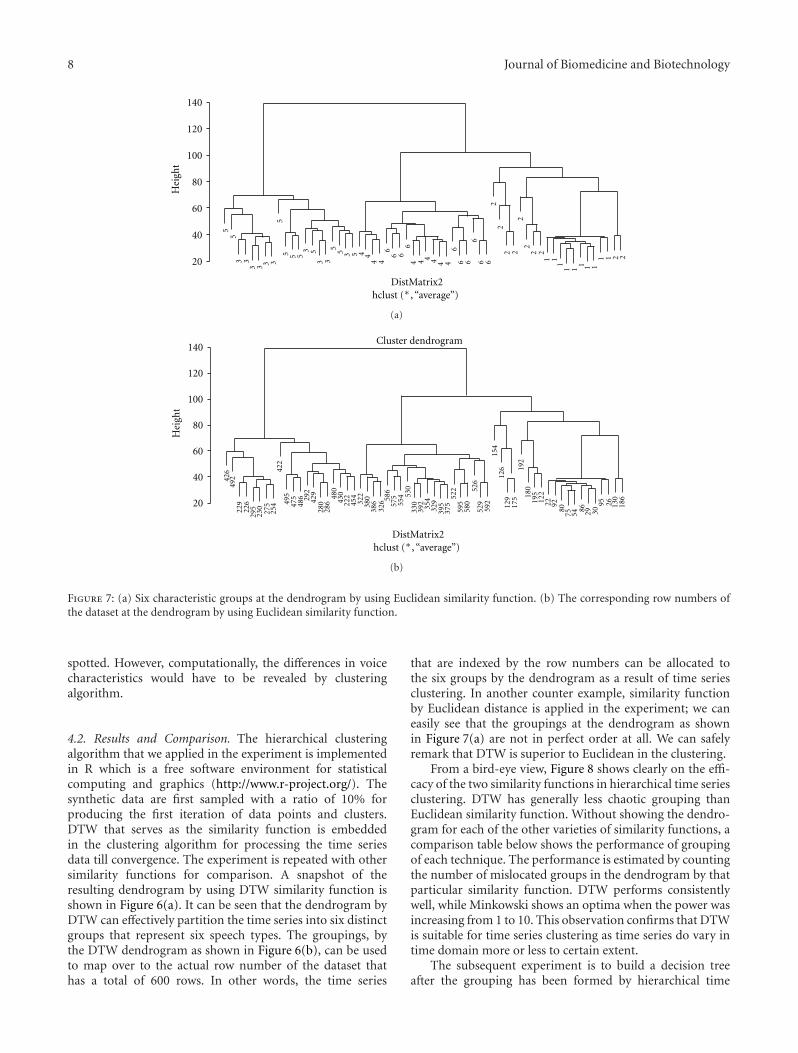
8 Journal of Biomedicine and Biotechnology
DistMatrix2hclust (∗, “average”)
Hei
ght
140
120
100
80
60
40
20
55 5 5
5 5 55
55
3
3
3
3
333 3 3 3
66 6
66 6
66 6
6
4 44 4 4 4 4 4 4
4 11
1 11 1 1
111
22
22
2 2
2 2
2 2
(a)
DistMatrix2hclust (∗, “average”)
Cluster dendrogram
Hei
ght
140
120
100
80
60
40
20
426
492
229
226
295
230
275
254
422
495
475
486 29
242
928
028
648
043
022
245
432
238
038
632
6 586
575
554 53
033
039
235
432
939
537
552
259
558
052
652
959
215
412
612
917
519
218
019
512
222 92
8075 54
86 29 3095 26 13
018
6
(b)
Figure 7: (a) Six characteristic groups at the dendrogram by using Euclidean similarity function. (b) The corresponding row numbers ofthe dataset at the dendrogram by using Euclidean similarity function.
spotted. However, computationally, the differences in voicecharacteristics would have to be revealed by clusteringalgorithm.
4.2. Results and Comparison. The hierarchical clusteringalgorithm that we applied in the experiment is implementedin R which is a free software environment for statisticalcomputing and graphics (http://www.r-project.org/). Thesynthetic data are first sampled with a ratio of 10% forproducing the first iteration of data points and clusters.DTW that serves as the similarity function is embeddedin the clustering algorithm for processing the time seriesdata till convergence. The experiment is repeated with othersimilarity functions for comparison. A snapshot of theresulting dendrogram by using DTW similarity function isshown in Figure 6(a). It can be seen that the dendrogram byDTW can effectively partition the time series into six distinctgroups that represent six speech types. The groupings, bythe DTW dendrogram as shown in Figure 6(b), can be usedto map over to the actual row number of the dataset thathas a total of 600 rows. In other words, the time series
that are indexed by the row numbers can be allocated tothe six groups by the dendrogram as a result of time seriesclustering. In another counter example, similarity functionby Euclidean distance is applied in the experiment; we caneasily see that the groupings at the dendrogram as shownin Figure 7(a) are not in perfect order at all. We can safelyremark that DTW is superior to Euclidean in the clustering.
From a bird-eye view, Figure 8 shows clearly on the effi-cacy of the two similarity functions in hierarchical time seriesclustering. DTW has generally less chaotic grouping thanEuclidean similarity function. Without showing the dendro-gram for each of the other varieties of similarity functions, acomparison table below shows the performance of groupingof each technique. The performance is estimated by countingthe number of mislocated groups in the dendrogram by thatparticular similarity function. DTW performs consistentlywell, while Minkowski shows an optima when the power wasincreasing from 1 to 10. This observation confirms that DTWis suitable for time series clustering as time series do vary intime domain more or less to certain extent.
The subsequent experiment is to build a decision treeafter the grouping has been formed by hierarchical time

Journal of Biomedicine and Biotechnology 9
1000
800
600
400
200
0
1
2
3
4
5
6
Hei
ght
5 5 5 5 55 5 5 5 53 3 3
33 3 3 3 3 3 6 6 6 6 6 6 6 6
6 64 4 4 44 4 4 4 4 4 1 1 1 1 1 1 1 1 11
22 2 2 2 2
2 2 2 2
“Confusion matrix”
“Confusion matrix”
Classified as99
1
11
0 0 0
0
000
00
000
00 0
0000
0
0
||||||
||||||
2 2
2
2
951
1 1
10 0 0
0 0
0 0
2 2
0 0 0 0
0 0 0 0 0
94 6
6 937
66
93
963
3
3
Dendrograms by DTW similarity functions
(almost perfect grouping)
55
55 5 5
5
555
3 33 3 3 3
3
3 3
3 4 44 4 4 4 4 4 4 4
66 6
6 66 6
66 6
22
2 22
22 2
2 21 11
1 11 1 1
11140
120
100
80
60
40
20
Hei
ght
Dendrograms by Euclidean similarity functions(chaotic grouping)
100
9191
89 912
91
88
Classified as
a b c d e fa = 1b = 2c = 3d = 4e = 5f = 6
a b c d e fa = 1b = 2c = 3d = 4e = 5f = 6
Figure 8: A bird-eye view of the comparison of the dendrograms which are produced by DTW and Euclidean similarity functionsrespectively.
series clustering. There are two choices of decision trees tobe recommended. RIPPER function is suggested to be runfor generated comprehensible rules that are in the form ofIF-THEN-ELSE. The rules specify a sequence of conditionsmeeting which in order lead to a predefined class label. Whena new voiceprint is received, pass it over the rules by checkingits coefficient values that can determine which class labelthe voiceprint fits in. The other decision tree algorithm isthe classical C5.0 or J48 with pruning mode on, in WEKAwhich is an open source of machine learning algorithms forsolving data mining problems implemented in Java and opensourced under the GPL (http://archive.ics.uci.edu/ml). Thetime series data, however, are converted to their correspond-ing frequency domain by Discrete Wavelet Transformation
(DWT). DWT applies the the Haar wavelet transform whichwas invented by Kristian Sandberg from University of Col-orado at Boulder, USA in year 2000. DWT in principle worksbetter than time series points in classification because DWTcan find where the energies are concentrated in the frequencydomain, and remarkable coefficients called Haar attributesare well describing the characteristics of the time series.A comparison of the original coefficients in time domainand transformed coefficient in frequency domain can beseen that wavelets after the transformation have sharperand narrower statistical distribution than the time seriespoints, in Figure 9. DWT is implemented in the plug-in filterin WEKA called “weka.filters.unsupervised.attribute.Wave-let.”
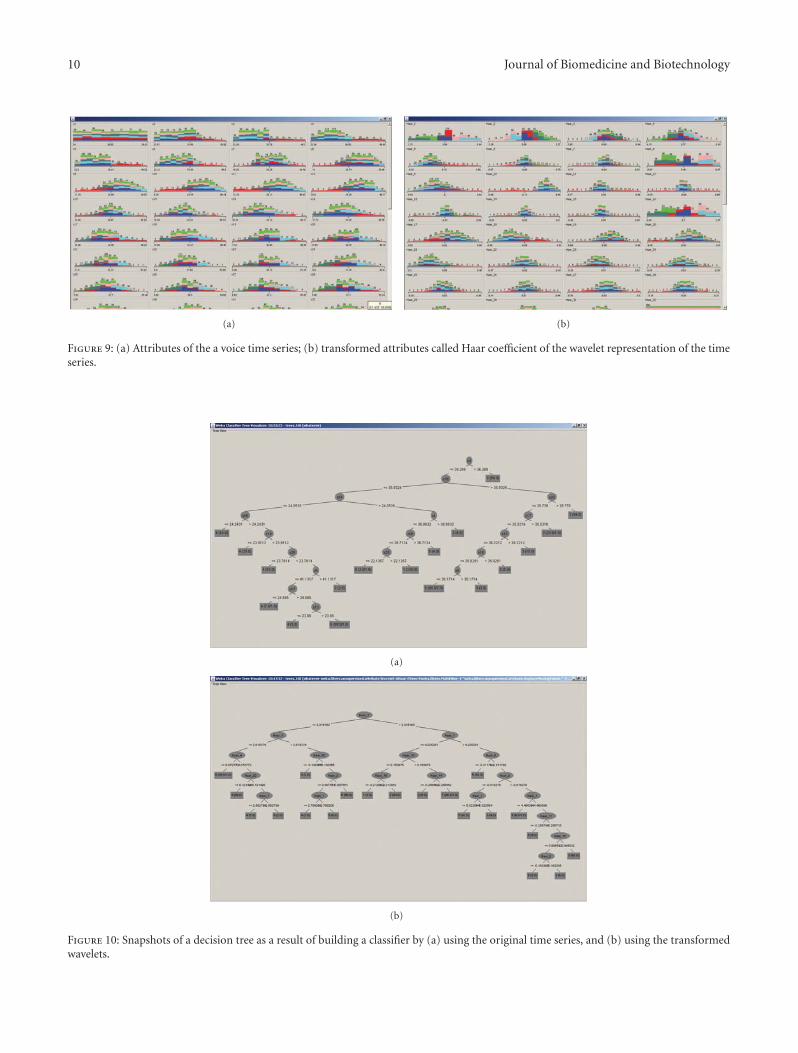
10 Journal of Biomedicine and Biotechnology
(a) (b)
Figure 9: (a) Attributes of the a voice time series; (b) transformed attributes called Haar coefficient of the wavelet representation of the timeseries.
(a)
(b)
Figure 10: Snapshots of a decision tree as a result of building a classifier by (a) using the original time series, and (b) using the transformedwavelets.
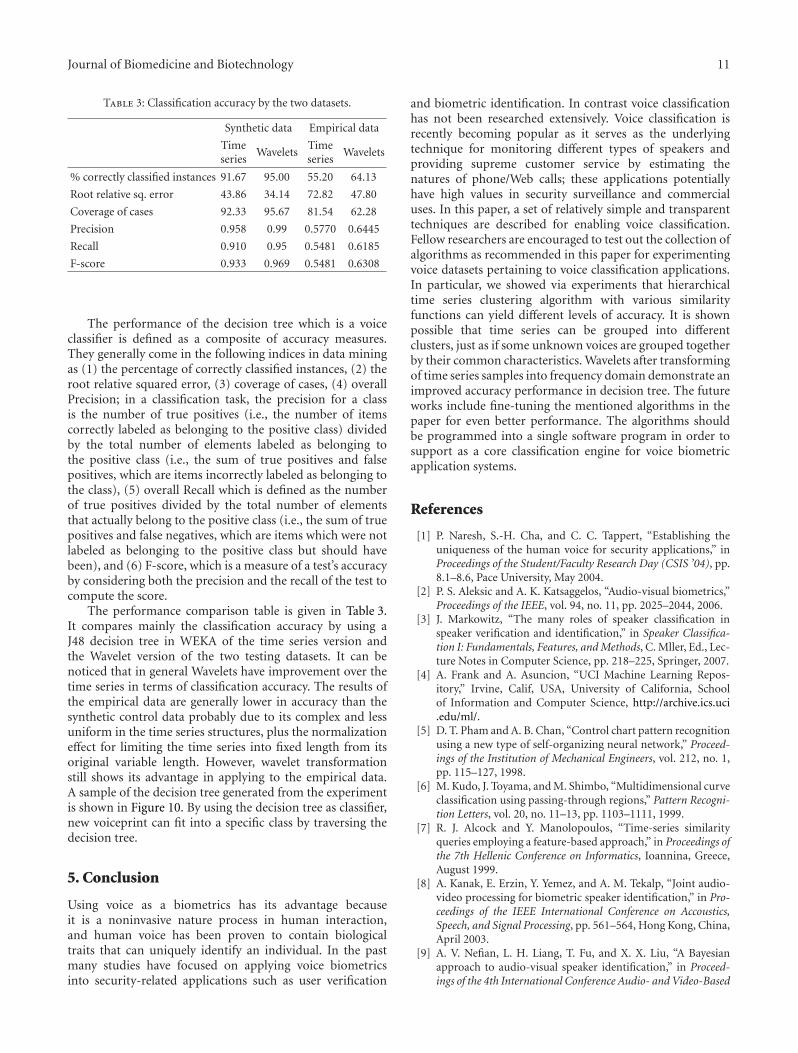
Journal of Biomedicine and Biotechnology 11
Table 3: Classification accuracy by the two datasets.
Synthetic data Empirical data
Timeseries
WaveletsTimeseries
Wavelets
% correctly classified instances 91.67 95.00 55.20 64.13
Root relative sq. error 43.86 34.14 72.82 47.80
Coverage of cases 92.33 95.67 81.54 62.28
Precision 0.958 0.99 0.5770 0.6445
Recall 0.910 0.95 0.5481 0.6185
F-score 0.933 0.969 0.5481 0.6308
The performance of the decision tree which is a voiceclassifier is defined as a composite of accuracy measures.They generally come in the following indices in data miningas (1) the percentage of correctly classified instances, (2) theroot relative squared error, (3) coverage of cases, (4) overallPrecision; in a classification task, the precision for a classis the number of true positives (i.e., the number of itemscorrectly labeled as belonging to the positive class) dividedby the total number of elements labeled as belonging tothe positive class (i.e., the sum of true positives and falsepositives, which are items incorrectly labeled as belonging tothe class), (5) overall Recall which is defined as the numberof true positives divided by the total number of elementsthat actually belong to the positive class (i.e., the sum of truepositives and false negatives, which are items which were notlabeled as belonging to the positive class but should havebeen), and (6) F-score, which is a measure of a test’s accuracyby considering both the precision and the recall of the test tocompute the score.
The performance comparison table is given in Table 3.It compares mainly the classification accuracy by using aJ48 decision tree in WEKA of the time series version andthe Wavelet version of the two testing datasets. It can benoticed that in general Wavelets have improvement over thetime series in terms of classification accuracy. The results ofthe empirical data are generally lower in accuracy than thesynthetic control data probably due to its complex and lessuniform in the time series structures, plus the normalizationeffect for limiting the time series into fixed length from itsoriginal variable length. However, wavelet transformationstill shows its advantage in applying to the empirical data.A sample of the decision tree generated from the experimentis shown in Figure 10. By using the decision tree as classifier,new voiceprint can fit into a specific class by traversing thedecision tree.
5. Conclusion
Using voice as a biometrics has its advantage becauseit is a noninvasive nature process in human interaction,and human voice has been proven to contain biologicaltraits that can uniquely identify an individual. In the pastmany studies have focused on applying voice biometricsinto security-related applications such as user verification
and biometric identification. In contrast voice classificationhas not been researched extensively. Voice classification isrecently becoming popular as it serves as the underlyingtechnique for monitoring different types of speakers andproviding supreme customer service by estimating thenatures of phone/Web calls; these applications potentiallyhave high values in security surveillance and commercialuses. In this paper, a set of relatively simple and transparenttechniques are described for enabling voice classification.Fellow researchers are encouraged to test out the collection ofalgorithms as recommended in this paper for experimentingvoice datasets pertaining to voice classification applications.In particular, we showed via experiments that hierarchicaltime series clustering algorithm with various similarityfunctions can yield different levels of accuracy. It is shownpossible that time series can be grouped into differentclusters, just as if some unknown voices are grouped togetherby their common characteristics. Wavelets after transformingof time series samples into frequency domain demonstrate animproved accuracy performance in decision tree. The futureworks include fine-tuning the mentioned algorithms in thepaper for even better performance. The algorithms shouldbe programmed into a single software program in order tosupport as a core classification engine for voice biometricapplication systems.
References
[1] P. Naresh, S.-H. Cha, and C. C. Tappert, “Establishing theuniqueness of the human voice for security applications,” inProceedings of the Student/Faculty Research Day (CSIS ’04), pp.8.1–8.6, Pace University, May 2004.
[2] P. S. Aleksic and A. K. Katsaggelos, “Audio-visual biometrics,”Proceedings of the IEEE, vol. 94, no. 11, pp. 2025–2044, 2006.
[3] J. Markowitz, “The many roles of speaker classification inspeaker verification and identification,” in Speaker Classifica-tion I: Fundamentals, Features, and Methods, C. Mller, Ed., Lec-ture Notes in Computer Science, pp. 218–225, Springer, 2007.
[4] A. Frank and A. Asuncion, “UCI Machine Learning Repos-itory,” Irvine, Calif, USA, University of California, Schoolof Information and Computer Science, http://archive.ics.uci.edu/ml/.
[5] D. T. Pham and A. B. Chan, “Control chart pattern recognitionusing a new type of self-organizing neural network,” Proceed-ings of the Institution of Mechanical Engineers, vol. 212, no. 1,pp. 115–127, 1998.
[6] M. Kudo, J. Toyama, and M. Shimbo, “Multidimensional curveclassification using passing-through regions,” Pattern Recogni-tion Letters, vol. 20, no. 11–13, pp. 1103–1111, 1999.
[7] R. J. Alcock and Y. Manolopoulos, “Time-series similarityqueries employing a feature-based approach,” in Proceedings ofthe 7th Hellenic Conference on Informatics, Ioannina, Greece,August 1999.
[8] A. Kanak, E. Erzin, Y. Yemez, and A. M. Tekalp, “Joint audio-video processing for biometric speaker identification,” in Pro-ceedings of the IEEE International Conference on Accoustics,Speech, and Signal Processing, pp. 561–564, Hong Kong, China,April 2003.
[9] A. V. Nefian, L. H. Liang, T. Fu, and X. X. Liu, “A Bayesianapproach to audio-visual speaker identification,” in Proceed-ings of the 4th International Conference Audio- and Video-Based

12 Journal of Biomedicine and Biotechnology
Biometric Person Authentication, pp. 761–769, Guildford, UK,2003.
[10] N. A. Fox, R. Gross, P. de Chazal, J. F. Cohn, and R. B. Reilly,“Person identification using automatic integration of speech,lip and face experts,” in Proceedings of the ACM SIGMM Multi-media Biometrics Methods and Applications Workshop (WBMA’03), pp. 25–32, Berkeley, Calif, USA, 2003.
[11] N. A. Fox and R. B. Reilly, “Audio-visual speaker identificationbased on the use of dynamic audio and visual features,” in Pro-ceedings of the 4th International Conference Audio- and Video-Based Biometric Person Authentication, pp. 743–751, Guild-ford, UK, 2003.
[12] S. Bengio, “Multimodal authentication using asynchronousHMMs,” in Proceedings of the 4th International ConferenceAudio- and Video-Based Biometric Person Authentication, pp.770–777, Guildford, UK, 2003.
[13] S. Bengio, “Multimodal speech processing using asynchronoushidden Markov models,” Information Fusion, vol. 5, no. 2, pp.81–89, 2004.
[14] U. V. Chaudhari, G. N. Ramaswamy, G. Potamianos, and C.Neti, “Information fusion and decision cascading for audio-visual speaker recognition based on time-varying stream reli-ability prediction,” in Proceedings of the International Confer-ence on Multimedia & Expo, pp. 9–12, Baltimore, Md, USA,July 2003.
[15] P. S. Aleksic and A. K. Katsaggelos, “An audio-visual personidentification and verification system using FAPs as visualfeatures,” in Proceedings of the Works Multimedia User Authen-tication, pp. 80–84, Santa Barbara, Calif, USA, 2003.
[16] T. Wark, S. Sridharan, and V. Chandran, “Robust speakerverification via fusion of speech and lip modalities,” in Pro-ceedings of the IEEE International Conference on Acoustics,Speech, and Signal Processing (ICASSP ’99), pp. 3061–3064,Phoenix, Ariz, USA, March 1999.
[17] T. Wark, S. Sridharan, and V. Chandran, “Robust speaker ver-ification via asynchronous fusion of speech and lip informa-tion,” in Proceedings of the 2th International Conference Audio-and Video-Based Biometric Person Authentication, pp. 37–42,Washington, DC, USA, 1999.
[18] T. Wark, S. Sridharan, and V. Chandran, “Use of temporalspeech and lip information for multi-modal speaker iden-tification via multi-stream HMM’s,” in Proceedings of theIEEE Interntional Conference on Acoustics, Speech, and SignalProcessing, pp. 2389–2392, Istanbul, Turkey, June 2000.
[19] P. Jourlin, J. Luettin, D. Genoud, and H. Wassner, “Integratingacoustic and labial information for speaker identification andverification,” in Proceedings of the 5th EUR Conference SpeechCommunication Technology, pp. 1603–1606, Rhodes, Greece,1997.
[20] T. J. Hazen, E. Weinstein, R. Kabir, A. Park, and B. Heisele,“Multi-modal face and speaker identification on a handhelddevice,” in Proceedings of the Workshop on Multimodal UserAuthentication, pp. 113–120, Santa Barbara, Calif, USA, 2003.
[21] C. Sanderson and K. K. Paliwal, “Identity verification usingspeech and face information,” Digital Signal Processing, vol. 14,no. 5, pp. 449–480, 2004.
[22] S. Ben-Yacoub, Y. Abdeljaoued, and E. Mayoraz, “Fusion offace and speech data for person identity verification,” IEEETransactions on Neural Networks, vol. 10, no. 5, pp. 1065–1074,1999.
[23] C. C. Chibelushi, F. Deravi, and J. S. Mason, “Voice and facialimage integration for speaker recognition,” in Proceedings ofthe IEEE International Symposium on Multimedia Technologiesand Future Applications, Southampton, UK, 1993.
[24] J. Luettin, N. Thacker, and S. Beet, “Speaker identification bylipreading,” in Proceedings of the International Conference onSpoken Language Processing (ICSLP ’96), pp. 62–65, October1996.
[25] P. Moreno and P. Ho, “SVM kernel adaptation in speakerclassification and verification,” in Proceedings of the INTER-SPEECH 2004-ICSLP, pp. 1413–1416, INTERSPEECH 2004-ICSLP, Jeju Island, Korea, 2004.

Hindawi Publishing CorporationJournal of Biomedicine and BiotechnologyVolume 2012, Article ID 989235, 7 pagesdoi:10.1155/2012/989235
Research Article
FGF Receptor-Mediated Gene Delivery Using LigandsCoupled to PEI-β-CyD
Yiping Hu,1 Guping Tang,2 Jun Liu,2 Wenxiang Cheng,1 Ye Yue,1 Jinchao Li,1 and Peng Zhang1
1 Center for Translational Medicine Research and Development, Shenzhen Institutes of Advanced Technology,Chinese Academy of Science, Shen Zhen, Guangdong 518055, China
2 Institute of Chemical Biology and Pharmaceutical Chemistry, Zhejiang University, Hangzhou 310028, China
Correspondence should be addressed to Peng Zhang, [email protected]
Received 20 December 2011; Revised 9 February 2012; Accepted 14 February 2012
Academic Editor: Sabah Mohammed
Copyright © 2012 Yiping Hu et al. This is an open access article distributed under the Creative Commons Attribution License,which permits unrestricted use, distribution, and reproduction in any medium, provided the original work is properly cited.
A novel vector with high gene delivery efficiency and special cell-targeting ability was developed using a good strategy thatutilized low-molecular-weight polyethylenimine (PEI; molecular weight: 600 KDa [PEI600]) crosslinked to β-cyclodextrin (β-CyD) via a facile synthetic route. Fibroblast growth factor receptors (FGFRs) are highly expressed in a variety of human cancercells and are potential targets for cancer therapy. In this paper, CY11 peptides, which have been proven to combine especiallywith FGFRs on cell membranes were coupled to PEI-β-CyD using N-succinimidyl-3-(2-pyridyldithio) propionate as a linker. Theratios of PEI600, β-CyD, and peptide were calculated based on proton integral values obtained from the 1H-NMR spectra ofthe resulting products. Electron microscope observations showed that CY11-PEI-β-CyD can efficiently condense plasmid DNA(pDNA) into nanoparticles of about 200 nm, and MTT assays suggested the decreased toxicity of the polymer. Experiments ongene delivery efficiency in vitro showed that CY11-PEI-β-CyD/pDNA polyplexes had significantly greater transgene activities thanPEI-β-CyD/pDNA in the COS-7 and HepG2 cells, which positively expressed FGFR, whereas no such effect was observed in thePC-3 cells, which negatively expressed FGFR. Our current research indicated that the synthesized nonviral vector shows improvedgene delivery efficiency and targeting specificity in FGFR-positive cells.
1. Introduction
Numerous vectors have been explored for use in gene deliv-ery. An ideal vector system efficiently uptakes and deliversdrugs to target cells without stimulating significant immuneresponses, inflammation reactions, or cytotoxicity [1].Although viruses are known to facilitate the entry of pDNAinto cells, great concern about the safety and immuno-genicity of viral vectors has made nonviral vectors a moreattractive option than viral ones. Thus, there is a growingneed to develop biocompatible polymeric gene carriers thatwill not elicit immune responses and toxic side effects [2, 3].
Among the nonviral vectors available, polyethylenimine(PEI) has shown high gene delivery efficiency both in vitroand in vivo [4]; as such, it has received significant attentionas a research subject. PEI molecules consist of repeatedbasic units with a backbone of two carbons followed by
one nitrogen atom and contain primary, secondary, and, inthe case of branched PEIs, tertiary amino groups, each ofwhich has the potential to be protonated [5, 6]. Positivelycharged amino groups may interact with negatively chargedphosphate groups of DNA molecules to form polymer-DNApolyplexes with sizes in the nanometer range that can beinternalized by cells [7]. β-CyD-modified polymers havebeen shown to be able to stabilize cationic polymer/DNAcomplexes under physiological conditions, increase watersolubility, show minimal cytotoxicity, and demonstrate goodtransfection efficiencies in many cell lines [8]. In improvingthe gene transfection efficiency of nonviral carriers, newstrategies have been put forward to enhance the cellu-lar uptake of PEI-based polyplexes; modification of thepolymer must be done [9], such that specific ligands canbe incorporated into the gene carriers. Several targetingmoieties, including folic acid, transferrin, RGD peptide, HER

2 Journal of Biomedicine and Biotechnology
peptide, EGF, and sugar moieties, have been employed inpolymeric gene carriers to enhance target cell specificity andtransfection efficiency.
Among these strategies, the ligand linkage strategyappears to be the most attractive [7]. Receptor-meditatedgene delivery enhances the targeting ability and gene deliveryefficiency of PEI-β-CyD/pDNA polyplexes. However, whenligands, especially those with high molecular weights, areconjugated with PEI, the gene delivery efficiency of thepolyplexes may be affected by a lower DNA condensation,larger particle size, and increased spatial steric hindrance [10,11]. Many functional peptides that specifically target tumorswere recently identified and applied as substitutes of wholemolecular ligands for the construction of targeting vectors toovercome some disadvantages of nonviral polyplexes. In thepresent study, a CY11 peptide-mediated nanopolymer wasprepared, its physicochemical properties were characterized,and its transfection activities in FGF receptors (FGFRs)overexpressing and under expressing cells were determined[12]. The results indicated that FGFR-targeted polyplexeshad high gene efficiency and low cytotoxicity.
2. Materials and Methods
2.1. Chemicals and Reagents. PEI (branched 600 KDa or PEI25 KDa), N-succinimidyl-3-(2-pyridyldithio) propionate(SPDP, Molecular weight= 312.4 Da), 1-(4, 5-dimethylthia-zol-2-yl)-3,5-diphenylformazan (MTT), dimethyl sulfoxide(DMSO), and triethylamine (TEA) were obtained fromSigma-Aldrich. The oligopeptide (CY11: CGMQLPLATWY)was synthesized by GL Biochem (Shanghai, China), andits amino acid sequence was confirmed using massspectrography. 1,1-Carbonyldiimidazole (CDI) was obtainedfrom Pierce (Rockford, IL, USA). Plasmid pCAG-Luc-encod-ing luciferase activity assay kits were obtained from Promega(Madison, WI, USA). The plasmid pEGFP encoding greenfluorescence protein (GFP) was provided by the Institute ofImmunology, Zhe Jiang university, Hangzhou, China.
COS-7 (FGFR positive; a continuous cell line derivedfrom an African green monkey kidney), HepG2 (FGFRpositive; a human hepatocellular cancer cell line), andPC-3 (FGFR negative; a human prostate adenocarcinomacell line) were obtained from the American Type CultureCollection (ATCC, Rockville, MD, USA). These cell lineswere maintained in RPMI1640 supplemented with 10% fetalcalf serum (FCS), 2 mM glutamine, 100 units/mL penicillin,and 100 μg/mL streptomycin in a 37◦C incubator with 5%CO2.
2.2. Synthesis of PEI-β-CyD and CY11-PEI-β-CyD. PEI-β-CyD was prepared according to the method of Tang et al.[13].
SPDP (3.6 mg, 0.01 mmol) was dissolved in DMSO(0.3 mL), and PEI-β-CyD (120 mg, 0.65 mmol) was dissolvedin DMSO (3 mL). The activation reaction proceeded under anitrogen atmosphere in the dark for 1 h at room temperature.Peptide (12 mg, 12.3 μmol) was dissolved in 1 × PBS buffer(1 mL). The peptide solution was dropped slowly into
the SPDP-activated PEI-β-CyD solution under stirring atroom temperature under nitrogen for 3 h. The productwas dialyzed against pure running water with a dialysismembrane (molecular weight cutoff= (8,000–14,000)) andlyophilized for 48 h. The final product was stored at −80◦C.
2.3. 1H-Nuclear Magnetic Resonance (1H-NMR) Analysis.The structures of CY11, PEI-β-CyD, and CY11-PEI-β-CyDwere ascertained by studying their 1H-NMR spectra. Samples(5 mg) were dissolved in 0.7 mL deuterium oxide (D2O).The spectra were recorded using a Bruker 400 MHz NMRspectrometer with 32 scans at room temperature.
2.4. Agarose Gel Electrophoresis Assay. The electrophoreticmobility of the polymer/pDNA polyplexes was measuredusing a gel electrophoresis system. An appropriate amount ofpolymer was added to an equal volume of pDNA solution toachieve the desired polymer/pDNA ratio. Gel electrophoresiswas conducted at room temperature in TEA buffer with 1%(w/w) agarose gel at 100 V for 45 min. DNA bands werevisualized by an UV illuminator.
2.5. Electron Microscope Detection. Polyplexes of CY11-PEI-β-CyD/pDNA at a N/P ratio of 25 were prepared in 0.9%saline. After vortexing for 1 min and standing for 30 min,the polyplexes were observed under a transmission electronmicroscope (JEOL, JEM-2010 TEM, JPN).
2.6. Cell Viability Assay. COS-7, HepG2, and PC-3 cellswere grown in RPMI1640 supplemented with 10% FCSat 37◦C and 5% CO2 in 96-well plates (Falcon; BectonDickinson, USA) at an initial density of 8,000 cells/well to10,000 cells/well. The growth medium was replaced with200 μL serum-free RPMI1640 containing PEI 25 KDa,PEI600, PEI-β-CyD, and CY11-PEI-β-CyD at differentconcentrations (5, 10, 20, 40, 80, 120, and 160 nmol/mL).After 4 h of incubation, the medium was replaced with200 μL freshly grown medium; following another 24 h ofincubation, the cells were washed once with PBS. Then90 μL fresh medium and 10 μL MTT solution (5 mg/mL)were added to each well. The plates were vigorously shakenbefore measurement. Cell viability was assessed by obtainingthe absorbance of the products at 570 nm as measuredby a BioRad microplate reader (Model 550, BioRad). Cellgrowth (%) relative to the control cells cultured in themedia without PEI25KDa, PEI600, PEI-β-CyD, or CY11-PEI-β-CyD was calculated using the following formula:[A]test/[A]control × 100.
2.7. In Vitro Gene Delivery. COS-7, HepG2, and PC-3 cellswere used for gene delivery tests. The cells were seeded in24-well plates at a density of 1.0 × 10⁵/well with 0.6 mLRPMI1640 containing 10% FCS. After 24 h of incuba-tion, the culture media were replaced with 0.6 mL serum-free RPMI1640. Polyplexes of PEI600/PCAG-luc, PEI-β-CyD/PCAG-luc, and CY11-PEI-β-CyD/PCAG-luc with dif-ferent N/P ratios (20, 25, 30, 35, 40) containing 1 μgPCAG-luc were added to each well, where as polyplexes of

Journal of Biomedicine and Biotechnology 3
–(CH2CH2NH)n––CONHCH2–O
O
H
H
HHO
OH
OH
1
25
64
3
H11
8.84
7
8 7 6 5 4 3 2 1
–CONHCH2––(CH2CH2NH)n–
–CH2–
(c)
(b)
(a)
O
7
–CONHCH2––(CH2CH2NH
–CH2–
c)
–(CH2CH2NH)n–CONHCH2–O
O
H
H
HHO
OH
OH
1
25
64
3
H11
8.84
b)O
)
Figure 1: 1H-NMR analysis of (a) CY11, (b) PEI-β-CyD, and (c)CY11-PEI-β-CyD. The peaks at 2.5–3.2 ppm are assigned to theprotons of PEI600 in (b) and (c). At 0.8–1.3 and 6.7–7.6 ppm, thenew peaks are assigned to the protons of the amino acids of CY11in (a) and (c).
PEI25KDa/PCAG-luc at an N/P ratio of 10 were included inthe control group. After a 4 h of incubation, the medium wasremoved and supplemented with fresh medium containing10% FBS. Luciferase gene expression was determined 36 hafter transfection using a commercial luciferase assay kit(Promega, USA). The transfection efficiency was expressedas relative light units per milligram of cell protein, theconcentration of which was determined using a protein assaykit (BCA, Pierce, USA).
pEGFP plasmids were used to detect the green fluo-rescence emitted by green fluorescence proteins after theplasmids were delivered to the COS-7, HepG2, and PC-3 cellsat an N/P ratio of 25.
2.8. Statistical Analysis. Unless otherwise noted, the resultsfrom in vitro experiments represent at least two independentexperiments. All results were expressed as means± standarderror of mean (SEM). Statistical analysis was performedusing one-way analysis of variance (ANOVA) and the LSDtest. Analysis was conducted using SPSS12.0.A mean withP < 0.05 considered statistically significant.
3. Results
3.1. Synthesis and Characterization of CY11-PEI-β-CyD.CY11-PEI-β-CyD synthesis was conducted according toTang et al. [13]. The 1H-NMR spectra of PEI-β-CyDwere obtained to determine the ratio of PEI600 and β-CyD (Figure 1(b)). The stoichiometry between PEI600 andβ-CyD was calculated using the characteristic peaks ofPEI600 (–CH2CH2NH–) and the C-1 hydrogen in β-CyD.In our experiment, the molar ratio of PEI600 and β-CyDwas approximately 1 : 1.2.
The CY11 with a single cysteine at the end was directlycoupled onto the SPDP-activated PEI-β-CyD to produce theCY11-PEI-β-CyD. The successful synthesis of CY11-PEI-β-CyD was confirmed using 1H-NMR spectra, as shown inFigure 1(c). The characteristic peaks of PEI (–NHCH2CH2–)appeared at δ2.5 ppm to 3.3 ppm, those of β-CyD appearedat δ5.0 ppm and δ3.4 ppm to 4.0 ppm, and those of the CY11peptide appeared at δ0.8 ppm to 1.3 ppm and 6.7 ppm to7.6 ppm (–CH2–protons of peptide) of CY11-PEI-β-CyD.These findings suggest the successful conjugation of CY11 toPEI-β-CyD.
3.2. Complex Formation of CY11-PEI-β-CyD/DNA. Thebinding capability of PEI-β-CyD and CY11-PEI-β-CyDto DNA was evaluated using agarose gel electrophoresis(Figure 2), and CY11-PEI-β-CyD was found to stably forman N/P ratio of 4 (Figure 2(b)). However, the ability tobinding DNA was delayed, which was likely caused by thesteric hindrance of the conjugated peptides. Comparisonof PEI-β-CyD with condensed DNA at an N/P ratio of3 (Figure 2(a)) showed that the peptide converted thePEI primary amine into an amide, but the efficiency ofmodification was very low (<5% of the primary aminesmodified).
The particle size of the copolymer/DNA complexes isan important factor that affects transfection activity. Themorphology of the CY11-PEI-β-CyD/DNA complex wasobserved under TEM (Figure 3). The particle size of thecomplexes at an N/P ratio of 25/1 was approximately 200 nm,which was a suitable diameter for gene delivery.
3.3. Toxicity Assay of Copolymer. MTT assays of the COS-7, HepG2, and PC-3 cells were performed to evaluate thecytotoxicity of PEI600, PEI-β-CyD, CY11-PEI-β-CyD, andPEI25KDa over an incubation period of 4 h at concentrationsranging from 0 to 160 nmol/mL, as shown in Figure 4. Inthe present study, CY11-PEI-β-CyD showed low toxicityagainst the COS-7, HepG2, and PC-3 cell lines comparedwith the control group (PEI25KDa). When the concentrationwas over 120 nmol/mL, the percentage of cell viabilityremained above 60%. A very sharp drop in the number ofviable cells was observed for PEI25KDa with increasing theconcentration. Furthermore, the modification of PEI with β-CyD led to a reduction in toxic side effects in vitro.
3.4. Gene Transfer In Vitro. In verifying the enhanced genedelivery ability of CY11-PEI-β-CyD and the targeting abilityof the CY11 motif, gene delivery experiments in vitrowere conducted in COS-7 (FGFR-positive), HepG2 (FGFR-positive), and PC-3 (FGFR-negative) cells using plasmidpCAG-Luc. The transfection efficiency of the CY11-PEI-β-CyD/DNA complex in the COS-7 cells is shown inFigure 5(a). The data demonstrated that the transfectionefficiency of CY11-PEI-β-CyD was twofold higher thanthat of PEI-β-CyD at an N/P ratio of 25 achieved at4.13 × 1010 RLU/mg protein. Similarly, an improvementin transfection efficiency was observed with CY11-PEI-β-CyD in HepG2 cells (Figure 5(b)). By contrast, in PC3 cells

4 Journal of Biomedicine and Biotechnology
N/P ratios
1/1 2/1 3/1 4/1 6/1 7/15/1
(a)
N/P ratios
1/1 2/1 3/1 4/1 6/1 7/15/1
(b)
Figure 2: Agarose gel electrophoresis of 0.5 μg DNA complexed with (a) PEI-β-CyD and (b) CY11-PEI-β-CyD at N/P ratios from 1 to 7.
300 nm
Figure 3: Transmission electron micrograph of the CY11-PEI-β-CyD/DNA polyplex. The polyplex is spherical with a diameter ofabout 200 nm.
(Figure 5(c)) and at an N/P ratio of 20, the efficiency of PEI-β-CyD was about one and a half-fold higher than that ofCY11-PEI-β-CyD. Even at other N/P ratios, including 25, 30,35, and 40, the efficiency of PEI-β-CyD was higher than thatof CY11-PEI-β-CyD. “Gold standard” branched PEI25KDaexhibited the highest gene expression at N/P ratio of 10 anddecreased with higher N/P [13]. PEI-β-CyD and CY11-PEI-β-CyD complexes showed higher transfection efficiency atN/P ratios of 20, 25, and 30 than PEI25KDa complex at itsoptimal N/P of 10.
In order to further study the gene delivery capabilityof CY11-PEI-β-CyD, pEGFP plasmids were transferred tothe COS-7, HepG2, and PC-3 cells to enable the directobservation of green fluorescence under a fluorescencemicroscope (Figures 5(d), 5(e) and 5(f)). The transferefficiency was far higher in COS-7 and HepG2 cells than inPC-3 cells. In summary, the transfection study demonstratedthat CY-11 peptide-mediated PEI-β-CyD vectors could offera strategy for targeted gene delivery, especially for FGFRhighly expressing tumor cells.
4. Discussion
The gene delivery ability of PEI was first discovered byBoussif et al. in 1995 [14]. Since then, the mechanism has
been extensively explored, and many strategies have beenundertaken in attempts to improve its efficiency of PEI.PEI is widely used as a nonviral gene transfer vector. Inthe field of biomedical science, PEI could be an effectivegene delivery vector for in vitro and in vivo transfection.However, like other general nonviral vectors [15], PEIshows low gene delivery efficiency and high cytotoxicitycompared with viral vectors. One of the strategies thatmay be used to improve the efficiency of PEI is to modifyPEI with ligands that target specific receptors on cellmembranes [16]. Many peptides function as ligands fortargeted nonviral gene delivery systems to specific cell and/ortissue types within the body and enhance the deliveryof nonviral vectors. EGF, folate, Her-2, transferring, andantibodies are commonly used as such ligands, but obtain-ing, identifying, and isolating these ligands are complicatedand tedious [12]. More importantly, the combination ofligands, especially those with high molecular weights, maypotentially affect the biological behavior of the vectorand decrease gene delivery efficiency due to steric affects[7].
FGFRs are highly expressed in many tumor cells andare upregulated in proliferating endothelial cells duringangiogenesis [17]. They can improve gene delivery byovercoming identified cellular barriers and targets for cancergene therapy. Maruta et al. [12] found that the oligopeptideCY11 binds to FGFR receptors with high affinity via a novelphage display technology and verified the occurrence ofenhanced gene expression using polylysine-based complexeswith the oligopeptides.
In the present study, the oligopeptide CY11 was selectedto conjugate with PEI-β-CyD, and the chemical and biolog-ical characteristics of the resulting CY11-PEI-β-CyD/pDNApolyplexes were investigated. PEI-β-CyD has an abundanceof amine groups, much higher than the number of sulfhydrylgroups in CY11, such that the complete conjugation ofCY11 with PEI-β-CyD is possible. The molar ratio ofCY11 to PEI-β-CyD in the CY11-PEI-β-CyD complexequaled that found in theoretical calculations from 1H-NMRresults.
DNA condensation, particle size, and toxicity of the poly-plexes are closely related to delivery efficiency [18]. Ideally,polyplexes should be homogeneous, soluble, stable, small,
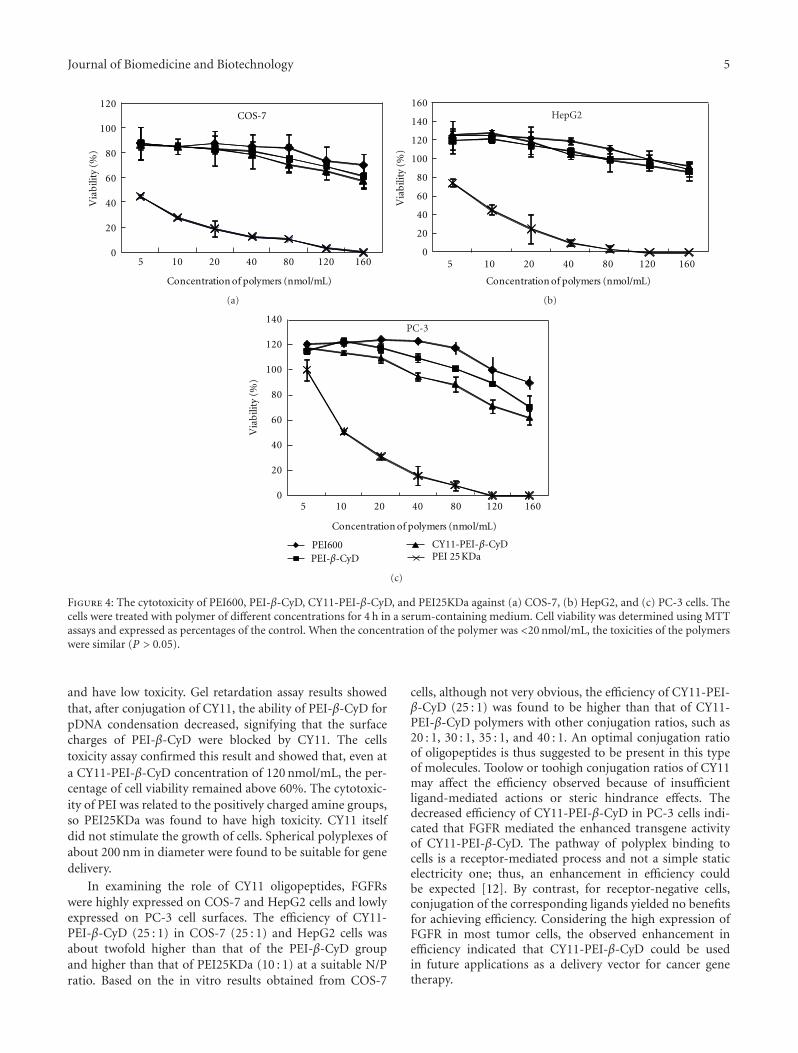
Journal of Biomedicine and Biotechnology 5
0
20
40
60
80
100
120
5 10 20 40 80 120 160
Via
bili
ty (
%)
Concentration of polymers (nmol/mL)
COS-7
(a)
0
20
40
60
80
100
120
140
160
5 10 20 40 80 120 160
Concentration of polymers (nmol/mL)
HepG2
Via
bili
ty (
%)
(b)
PEI 25 KDa
0
20
40
60
80
100
120
140
5 10 20 40 80 120 160
Via
bili
ty (
%)
Concentration of polymers (nmol/mL)
PC-3
PEI600PEI-β-CyD
CY11-PEI-β-CyD
(c)
Figure 4: The cytotoxicity of PEI600, PEI-β-CyD, CY11-PEI-β-CyD, and PEI25KDa against (a) COS-7, (b) HepG2, and (c) PC-3 cells. Thecells were treated with polymer of different concentrations for 4 h in a serum-containing medium. Cell viability was determined using MTTassays and expressed as percentages of the control. When the concentration of the polymer was <20 nmol/mL, the toxicities of the polymerswere similar (P > 0.05).
and have low toxicity. Gel retardation assay results showedthat, after conjugation of CY11, the ability of PEI-β-CyD forpDNA condensation decreased, signifying that the surfacecharges of PEI-β-CyD were blocked by CY11. The cellstoxicity assay confirmed this result and showed that, even ata CY11-PEI-β-CyD concentration of 120 nmol/mL, the per-centage of cell viability remained above 60%. The cytotoxic-ity of PEI was related to the positively charged amine groups,so PEI25KDa was found to have high toxicity. CY11 itselfdid not stimulate the growth of cells. Spherical polyplexes ofabout 200 nm in diameter were found to be suitable for genedelivery.
In examining the role of CY11 oligopeptides, FGFRswere highly expressed on COS-7 and HepG2 cells and lowlyexpressed on PC-3 cell surfaces. The efficiency of CY11-PEI-β-CyD (25 : 1) in COS-7 (25 : 1) and HepG2 cells wasabout twofold higher than that of the PEI-β-CyD groupand higher than that of PEI25KDa (10 : 1) at a suitable N/Pratio. Based on the in vitro results obtained from COS-7
cells, although not very obvious, the efficiency of CY11-PEI-β-CyD (25 : 1) was found to be higher than that of CY11-PEI-β-CyD polymers with other conjugation ratios, such as20 : 1, 30 : 1, 35 : 1, and 40 : 1. An optimal conjugation ratioof oligopeptides is thus suggested to be present in this typeof molecules. Toolow or toohigh conjugation ratios of CY11may affect the efficiency observed because of insufficientligand-mediated actions or steric hindrance effects. Thedecreased efficiency of CY11-PEI-β-CyD in PC-3 cells indi-cated that FGFR mediated the enhanced transgene activityof CY11-PEI-β-CyD. The pathway of polyplex binding tocells is a receptor-mediated process and not a simple staticelectricity one; thus, an enhancement in efficiency couldbe expected [12]. By contrast, for receptor-negative cells,conjugation of the corresponding ligands yielded no benefitsfor achieving efficiency. Considering the high expression ofFGFR in most tumor cells, the observed enhancement inefficiency indicated that CY11-PEI-β-CyD could be usedin future applications as a delivery vector for cancer genetherapy.
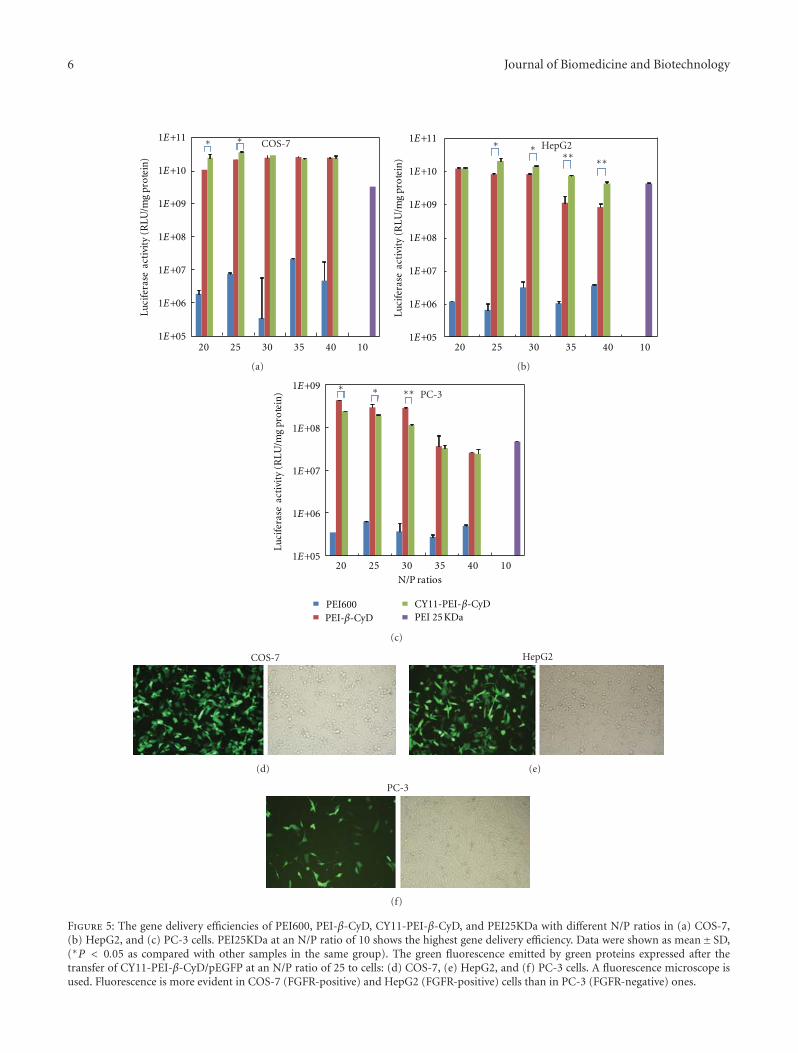
6 Journal of Biomedicine and Biotechnology
20 25 30 35 40 10
Luci
fera
se a
ctiv
ity
(RLU
/mg
pro
tein
)COS-7
1E+11
1E+10
1E+09
1E+08
1E+07
1E+06
1E+05
∗ ∗
(a)
20 25 30 35 40 10
Luci
fera
se a
ctiv
ity
(RLU
/mg
pro
tein
)
HepG21E+11
1E+10
1E+09
1E+08
1E+07
1E+06
1E+05
∗ ∗∗∗ ∗∗
(b)
PEI600PEI-β-CyD
CY11-PEI-β-CyD
20 25 30 35 40 10
Luci
fera
se a
ctiv
ity
(RLU
/mg
pro
tein
)
N/P ratios
PC-31E+09
1E+08
1E+07
1E+06
1E+05
∗ ∗∗∗
PEI 25 KDa
(c)
COS-7
(d)
HepG2
(e)
PC-3
(f)
Figure 5: The gene delivery efficiencies of PEI600, PEI-β-CyD, CY11-PEI-β-CyD, and PEI25KDa with different N/P ratios in (a) COS-7,(b) HepG2, and (c) PC-3 cells. PEI25KDa at an N/P ratio of 10 shows the highest gene delivery efficiency. Data were shown as mean± SD,(∗P < 0.05 as compared with other samples in the same group). The green fluorescence emitted by green proteins expressed after thetransfer of CY11-PEI-β-CyD/pEGFP at an N/P ratio of 25 to cells: (d) COS-7, (e) HepG2, and (f) PC-3 cells. A fluorescence microscope isused. Fluorescence is more evident in COS-7 (FGFR-positive) and HepG2 (FGFR-positive) cells than in PC-3 (FGFR-negative) ones.

Journal of Biomedicine and Biotechnology 7
In summary, the successfully synthesized CY11-PEI-β-CyD polymer can efficiently condense DNA plasmids intospherical particles of about 200 nm in diameter and withpositive zeta potential. The polymer has less cytotoxicity andmore efficient gene delivery capabilities than PEI-β-CyD invitro. It also has FGFR-targeting ability.
Conflict of Interests
The authors declare that there is no conflict of interests inthis paper.
References
[1] D. Li, H. Yu, H. Huang et al., “FGF receptor-mediated genedelivery using ligands coupled to polyethylenimine,” Journalof Biomaterials Applications, vol. 22, no. 2, pp. 163–180, 2007.
[2] D. W. Pack, A. S. Hoffman, S. Pun, and P. S. Stayton, “Designand development of polymers for gene delivery,” NatureReviews Drug Discovery, vol. 4, no. 7, pp. 581–593, 2005.
[3] M. Lee and S. W. Kim, “Polyethylene glycol-conjugatedcopolymers for plasmid DNA delivery,” PharmaceuticalResearch, vol. 22, no. 1, pp. 1–10, 2005.
[4] R. Goyal, S. K. Tripathi, S. Tyagi et al., “Gellan gum blendedPEI nanocomposites as gene delivery agents: evidences from invitro and in vivo studies,” European Journal of Pharmaceuticsand Biopharmaceutics, vol. 79, no. 1, pp. 3–14, 2011.
[5] A. Swami, R. K. Kurupati, A. Pathak, Y. Singh, P. Kumar,and K. C. Gupta, “A unique and highly efficient non-viral DNA/siRNA delivery system based on PEI-bisepoxidenanoparticles,” Biochemical and Biophysical Research Commu-nications, vol. 362, no. 4, pp. 835–841, 2007.
[6] K. C. R. Bahadur and H. Uludag, “A comparative evaluationof disulfide-linked and hydrophobically-modified PEI forplasmid delivery,” Journal of Biomaterials Science, PolymerEdition, vol. 22, no. 7, pp. 873–892, 2011.
[7] O. V. Chumakova, A. V. Liopo, V. G. Andreev et al.,“Composition of PLGA and PEI/DNA nanoparticles improvesultrasound-mediated gene delivery in solid tumors in vivo,”Cancer Letters, vol. 261, no. 2, pp. 215–225, 2008.
[8] K. Wada, H. Arima, T. Tsutsumi et al., “Improvementof gene delivery mediated by mannosylated dendrimer/α-cyclodextrin conjugates,” Journal of Controlled Release, vol.104, no. 2, pp. 397–413, 2005.
[9] B. Chertok, A. E. David, and V. C. Yang, “Polyethyleneimine-modified iron oxide nanoparticles for brain tumor drugdelivery using magnetic targeting and intra-carotid adminis-tration,” Biomaterials, vol. 31, no. 24, pp. 6317–6324, 2010.
[10] M. Neu, D. Fischer, and T. Kissel, “Recent advances in rationalgene transfer vector design based on poly(ethylene imine) andits derivatives,” Journal of Gene Medicine, vol. 7, no. 8, pp. 992–1009, 2005.
[11] J. A. Fortune, T. I. Novobrantseva, and A. M. Klibanov,“Highly effective gene transfection in vivo by alkylatedpolyethylenimine,” Journal of Drug Delivery, vol. 20, pp. 40–58, 2011.
[12] F. Maruta, A. L. Parker, K. D. Fisher et al., “Identificationof FGF receptor-binding peptides for cancer gene therapy,”Cancer Gene Therapy, vol. 9, no. 6, pp. 543–552, 2002.
[13] G. P. Tang, H. Y. Guo, F. Alexis et al., “Low molecular weightpolyethylenimines linked by β-cyclodextrin for gene transfer
into the nervous system,” Journal of Gene Medicine, vol. 8, no.6, pp. 736–744, 2006.
[14] O. Boussif, F. LezoualC’H, M. A. Zanta et al., “A versatile vectorfor gene and oligonucleotide transfer into cells in cultureand in vivo: polyethylenimine,” Proceedings of the NationalAcademy of Sciences of the United States of America, vol. 92, no.16, pp. 7297–7301, 1995.
[15] G. Liu, J. Xie, F. Zhang et al., “N-Alkyl-PEI-functionalized ironoxide nanoclusters for efficient siRNA delivery,” Small, vol. 7,no. 19, pp. 2742–2749, 2011.
[16] X. Bai, D. Miao, J. Li, D. Goltzman, and A. C. Karaplis, “Trans-genic mice overexpressing human fibroblast growth factor 23(R176Q) delineate a putative role for parathyroid hormone inrenal phosphate wasting disorders,” Endocrinology, vol. 145,no. 11, pp. 5269–5279, 2004.
[17] L. Cai, N. Qiu, X. Li et al., “A novel truncated basic fibroblastgrowth factor fragment-conjugated poly (ethylene glycol)-cholesterol amphiphilic polymeric drug delivery system fortargeting to the FGFR-overexpressing tumor cells,” Interna-tional Journal of Pharmaceutics, vol. 408, no. 1-2, pp. 173–182,2011.
[18] B. Liang, M. L. He, Z. P. Xiao et al., “Synthesis and character-ization of folate-PEG-grafted-hyperbranched-PEI for tumor-targeted gene delivery,” Biochemical and Biophysical ResearchCommunications, vol. 367, no. 4, pp. 874–880, 2008.
Hindawi Publishing CorporationJournal of Biomedicine and BiotechnologyVolume 2012, Article ID 403987, 11 pagesdoi:10.1155/2012/403987
Research Article
Using Medical History Embedded in Biometrics MedicalCard for User Identity Authentication: Privacy PreservingAuthentication Model by Features Matching
Simon Fong and Yan Zhuang
Department of Computer and Information Science, University of Macau, Taipa, Macau
Correspondence should be addressed to Simon Fong, [email protected]
Received 20 December 2011; Accepted 25 December 2011
Academic Editor: Sabah Mohammed
Copyright © 2012 S. Fong and Y. Zhuang. This is an open access article distributed under the Creative Commons AttributionLicense, which permits unrestricted use, distribution, and reproduction in any medium, provided the original work is properlycited.
Many forms of biometrics have been proposed and studied for biometrics authentication. Recently researchers are looking intolongitudinal pattern matching that based on more than just a singular biometrics; data from user’s activities are used to characterisethe identity of a user. In this paper we advocate a novel type of authentication by using a user’s medical history which can beelectronically stored in a biometric security card. This is a sequel paper from our previous work about defining abstract format ofmedical data to be queried and tested upon authentication. The challenge to overcome is preserving the user’s privacy by choosingonly the useful features from the medical data for use in authentication. The features should contain less sensitive elements andthey are implicitly related to the target illness. Therefore exchanging questions and answers about a few carefully chosen featuresin an open channel would not easily or directly expose the illness, but yet it can verify by inference whether the user has a recordof it stored in his smart card. The design of a privacy preserving model by backward inference is introduced in this paper. Somelive medical data are used in experiments for validation and demonstration.
1. Introduction
The latest trend in biometrics authentication nowadays is touse multiple biometrics [1, 2] for extra security and users’longitudinal activity patters for identifying the users. Thelatter one appears to be appealing because it is generallymore difficult to erase or forge a full history record about aperson as history involves event records in multiple partiesover a long period of time. Recently some advances inbiometrics theories are based on one’s email history patterns,online activity log patterns, and other personal historyevents [3, 4]. In this paper, we advocate the use of medicalhistory data as biometrics as they may equally well indistinguishing a person and they are not easily counterfeited.Each medical record is handled supposedly by licensedmedical professional (compare to a log on email file serveror other public online platforms), hence medical recordsshould be quite credible. Two adults are hardly having exactlythe same medical history in terms of conditions, prognosis,
treatment procedures, times, and places over a certain lengthof time.
One of the major challenges in using medical historyfor authentication, however, is privacy issue. Humans arenaturally reluctant to reveal their private medical records andthey may feel inferior if such data are openly communicatedin the public for authentication. As shown in Figure 1,the medical history data that is stored in a smart cardcould be used for both medical consultations in differentclinics where they may not be able to access a commonpatients’ database and for authentication in addition topasswords or other forms of biometrics like fingerprintsand iris scan. The authenticator in this case may be amachine device or a human officer that is able to generatesome question-and-answer type of challenges to the testinguser about his medical history. Only the authentic useris supposed to possess the knowledge of his own medicalhistory, and he would be able to correctly answer thequestions.
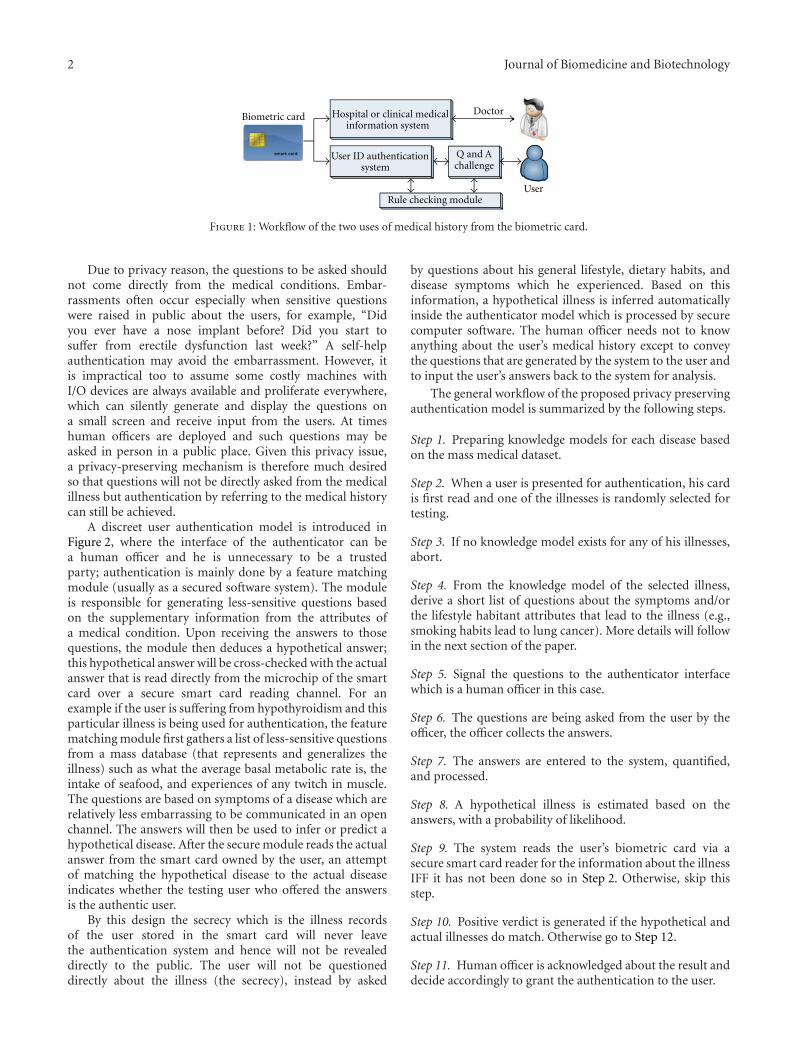
2 Journal of Biomedicine and Biotechnology
Hospital or clinical medical information system
User ID authentication system
Rule checking module
challenge
Biometric card
User
Doctor
Q and A
Figure 1: Workflow of the two uses of medical history from the biometric card.
Due to privacy reason, the questions to be asked shouldnot come directly from the medical conditions. Embar-rassments often occur especially when sensitive questionswere raised in public about the users, for example, “Didyou ever have a nose implant before? Did you start tosuffer from erectile dysfunction last week?” A self-helpauthentication may avoid the embarrassment. However, itis impractical too to assume some costly machines withI/O devices are always available and proliferate everywhere,which can silently generate and display the questions ona small screen and receive input from the users. At timeshuman officers are deployed and such questions may beasked in person in a public place. Given this privacy issue,a privacy-preserving mechanism is therefore much desiredso that questions will not be directly asked from the medicalillness but authentication by referring to the medical historycan still be achieved.
A discreet user authentication model is introduced inFigure 2, where the interface of the authenticator can bea human officer and he is unnecessary to be a trustedparty; authentication is mainly done by a feature matchingmodule (usually as a secured software system). The moduleis responsible for generating less-sensitive questions basedon the supplementary information from the attributes ofa medical condition. Upon receiving the answers to thosequestions, the module then deduces a hypothetical answer;this hypothetical answer will be cross-checked with the actualanswer that is read directly from the microchip of the smartcard over a secure smart card reading channel. For anexample if the user is suffering from hypothyroidism and thisparticular illness is being used for authentication, the featurematching module first gathers a list of less-sensitive questionsfrom a mass database (that represents and generalizes theillness) such as what the average basal metabolic rate is, theintake of seafood, and experiences of any twitch in muscle.The questions are based on symptoms of a disease which arerelatively less embarrassing to be communicated in an openchannel. The answers will then be used to infer or predict ahypothetical disease. After the secure module reads the actualanswer from the smart card owned by the user, an attemptof matching the hypothetical disease to the actual diseaseindicates whether the testing user who offered the answersis the authentic user.
By this design the secrecy which is the illness recordsof the user stored in the smart card will never leavethe authentication system and hence will not be revealeddirectly to the public. The user will not be questioneddirectly about the illness (the secrecy), instead by asked
by questions about his general lifestyle, dietary habits, anddisease symptoms which he experienced. Based on thisinformation, a hypothetical illness is inferred automaticallyinside the authenticator model which is processed by securecomputer software. The human officer needs not to knowanything about the user’s medical history except to conveythe questions that are generated by the system to the user andto input the user’s answers back to the system for analysis.
The general workflow of the proposed privacy preservingauthentication model is summarized by the following steps.
Step 1. Preparing knowledge models for each disease basedon the mass medical dataset.
Step 2. When a user is presented for authentication, his cardis first read and one of the illnesses is randomly selected fortesting.
Step 3. If no knowledge model exists for any of his illnesses,abort.
Step 4. From the knowledge model of the selected illness,derive a short list of questions about the symptoms and/orthe lifestyle habitant attributes that lead to the illness (e.g.,smoking habits lead to lung cancer). More details will followin the next section of the paper.
Step 5. Signal the questions to the authenticator interfacewhich is a human officer in this case.
Step 6. The questions are being asked from the user by theofficer, the officer collects the answers.
Step 7. The answers are entered to the system, quantified,and processed.
Step 8. A hypothetical illness is estimated based on theanswers, with a probability of likelihood.
Step 9. The system reads the user’s biometric card via asecure smart card reader for the information about the illnessIFF it has not been done so in Step 2. Otherwise, skip thisstep.
Step 10. Positive verdict is generated if the hypothetical andactual illnesses do match. Otherwise go to Step 12.
Step 11. Human officer is acknowledged about the result anddecide accordingly to grant the authentication to the user.

Journal of Biomedicine and Biotechnology 3
Insecure channel
questionsQuestionsgenerator
UserOfficer
Answers estimator
Hypothetical illness
Actual illness
Mass medicaldataset
questions
AnswersAnswers
ResultOwned
by
Smart card reader
Direct data retrieval
(secured channel)
Ok?
Match?
Nonsensitive Nonsensitive
Pri
vacy
-pre
serv
ing
auth
enti
cato
r
Figure 2: Privacy-preserving authentication model using medical history from biometric card.
Step 12. Case is rejected or is repeated from Step 2 bychoosing another illness.
2. Design of the Privacy-PreservingAuthentication Model
The prime challenge to be overcome by our proposed modelis preserving the user’s privacy by selecting a short list ofuseful features which are extracted from the medical datafor use in authentication. The features which are beingused instead of the direct information about the illnessmust satisfy two conditions: first, they should contain lesssensitive elements and only a few of them should be used;using too many or a complete set of features will ultimatelyreveal the identification of the illness. Second, not only thefeatures must be controlled in quantity but also they mustbe strongly relevant to the target illness such that the illnesscan be sufficiently characterized by only a handful of thesefeatures.
The principle for the protection of privacy to work isfounded on causality which is defined as the relationshipbetween an event (the cause) and a second event (the effect),where the second event is a consequence of the first. Theterm “feature” which we use here is the direct factor whichis a factor that affects an effect directly, that is, withoutany intervening factors. For instance, lung cancer is due tosmoking habit. The feature or direct factor in this example issmoking, and the effect as the consequence is lung cancer asthe illness. The true identification of an illness is describedby only a number of significant features. The features areallowed to be queried and responded in open, and theanswers (values) to the features could effectively refer backto the same illness.
The design of the model which is shown in Figure 3 com-bines the three analytic approaches for supporting definingcausality relations of medical attributes from some givenclinical history data. The data are collectively accumulatedfrom a sizeable population as reference, which is called massmedical data. The mass medical data are fed to a sequenceof processes to generate five main types of information for
quantitatively describing the causality among the featuresand the illness. We call this causality information whichcomes in four types: (1) correlation counts. The countsrepresent the linear relationships for each pair of featuresincluding the features to the class illness. (2) The optimalnumber of features that can be used to describe an ill-ness. (3) The significance value of each feature; nonlinearrelationships are inferred by decision tree induction whichresults in dependency network that shows the factors andtheir significances pertaining to the outcome of a disease,and a set of decision rules that represent the nonlinear andsometimes even complex relationships of the factors. (4)the relation strength between each pair of features. (5) Thecooccurrences of the features with values that describe a stateof the illness. Nonlinear relationships refer to a varying trendthat describes the outcome, often by more than one factor.These five types of causality information would be used alongwith the new input testing values of the features (resultedfrom asking the user the questions) to estimate a hypotheticillness by summarization in data mining. If the hypotheticillness is the same as the target illness, the feature valueswhich are provided from the authentication questions wouldalso be the same as the feature values derived from the targetillness. Our model should be extensive enough to cover theattributes’ relations/dependencies both linear and nonlinearand by finding such relations quantified for matching forauthentication.
2.1. Building Knowledge Models. Knowledge models mustinitially be built prior to authentication application. Massmedical history data collected from the public consists ofmany patients’ past records, each record spanning acrossa collection of attributes, that are to be used in buildingdecision trees for finding the underlying relations. Eachrecord often includes attributes taken from measurements oftests, diagnosis and demographic attributes of the patients’profiles. The records from the mass database should be inthe same format as the medical history database embedded inthe card of the testing user. Our proposed model has a workflow that accepts medical history datasets that are structured

4 Journal of Biomedicine and Biotechnology
Historical disease datasets
Correlationanalysis
Feature selection analysis
NodeXLvisualization
Building dependency network diagram
Constructing accurate and compact decision trees
Estimating the relations of symptoms over one or
more diseases
Interactive dependency network
visualization
Network graph Dependency network Classifier/predictor
For facilitating the correlation checks of the features to the
(1) Correlation counts
For finding the relevance of
(2) The optimal number of features (3) Significance value of each feature(4) The relation strength of each pairof features
For finding the cooccurrence conditions in terms of rules
(5) The cooccurrences of thetarget class
the features to the target classbetween the features and the target class
features with values that describe a state of the illness
Figure 3: Model for deriving the attribute relations via Network Graph, Dependency Network and Rule-based Decision Tree.
in columns as attributes and rows as patients’ records;computational processes that transform them into resultantoutputs. There are mainly three streams of processing: (1)correlation analysis, with the aid of NodeXL visualizationfor generating Network Graph; (2) feature selection analysis,building an accurate and compact rule-based decision tree,extracting rules that show conditional relations among theattributes; (3) after feature selection analysis, merge multi-ple disease datasets, construct a dependency network andcompute relation strengths among the attributes. From topto bottom, the original historical datasets are transformedthrough a sequence of subtasks which are described in detailsin the following sections. In our experiment here we verifiedthis model by using two datasets lung cancer and heartdisease, acquired from UCI Dataset Repository which is wellknown for benchmarking machine-learning techniques incomputer science research community [5].
Pertaining to knowledge discovery in medical field,Ohsaki et al. compared the performance of 40 differentinterestingness measures via a rule-discovery experimenton clinical datasets of meningitis and hepatitis [6]. Theresults supported that a stable and reasonable performanceis achieved by chi-square measure which is a prominentmember of the family of information gain methods. Thisencourages us to follow along this direction for deriving use-ful rules for representing the relations between attributes andthe class illness. Applying information theoretic techniqueshas its edge over frequency or statistical due to the nature ofthe data; linear trend implies a direct relation between a pairof univariate attributes. For multivariate attributes whichare usually the case for high-dimensional medical data, therelations are cross-dependent among the attributes. Some
recent work applied computational intelligence techniquesthat include Artificial Neural Network combined with RoughSet Theory [7] for extracting decision rules from medicaldata, Classification Rules with aid of Concept Lattice [8] foranalyzing medical diagnostic data. The learning techniquesbased on information theoretic have been proved theirusefulness as a tool for drawing conclusions from medicaldata. Ohsaki et al. [6] expanded the work by consideringthat attributes of different significances may be conditional(interdependent) in data classification and decision making.An attribute that has low significance close to zero may getomitted in the feature selection process but this attributewhen used together with others may consequently leadto an important rule that represents useful knowledge.Therefore experiments were conducted in [6] that proved:if an attribute group which contains significant attributes,the attribute group must be significant and if an attributegroup includes attributes with low significance individually,the attribute group possibly may have high significance.Subsequently this proof advocates that taking a singular viewon the significance of individual attributes is not enough.Conditional relations among those attributes regardless oftheir significances must be taken into account in analyzingmedical data. Therefore the three levels of analysis wereproposed in our model design that allows users to find linearand nonlinear relations among data via Network Graph andDependency Network, respectively as well as a rule-baseddecision tree that extracts and exhibits conditional rules forstudying the conditional relations among the attributes.
2.2. Correlation Model. By computing the correlation coeffi-cients over the dataset, the strengths of the relations between
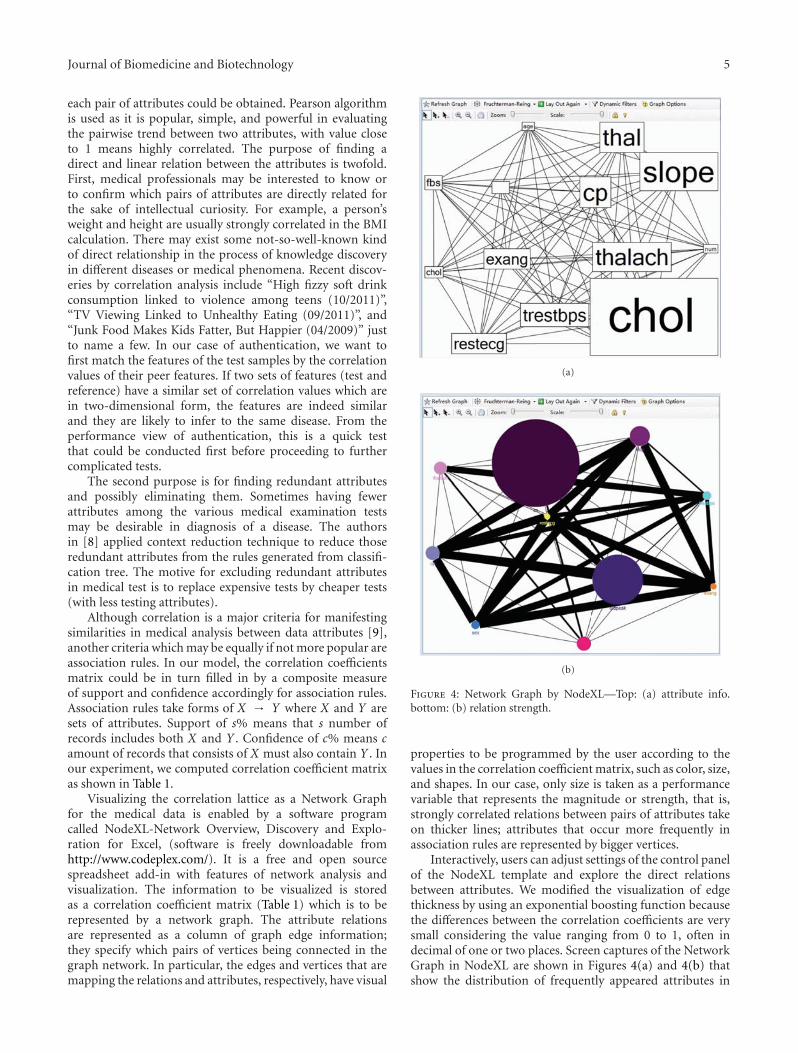
Journal of Biomedicine and Biotechnology 5
each pair of attributes could be obtained. Pearson algorithmis used as it is popular, simple, and powerful in evaluatingthe pairwise trend between two attributes, with value closeto 1 means highly correlated. The purpose of finding adirect and linear relation between the attributes is twofold.First, medical professionals may be interested to know orto confirm which pairs of attributes are directly related forthe sake of intellectual curiosity. For example, a person’sweight and height are usually strongly correlated in the BMIcalculation. There may exist some not-so-well-known kindof direct relationship in the process of knowledge discoveryin different diseases or medical phenomena. Recent discov-eries by correlation analysis include “High fizzy soft drinkconsumption linked to violence among teens (10/2011)”,“TV Viewing Linked to Unhealthy Eating (09/2011)”, and“Junk Food Makes Kids Fatter, But Happier (04/2009)” justto name a few. In our case of authentication, we want tofirst match the features of the test samples by the correlationvalues of their peer features. If two sets of features (test andreference) have a similar set of correlation values which arein two-dimensional form, the features are indeed similarand they are likely to infer to the same disease. From theperformance view of authentication, this is a quick testthat could be conducted first before proceeding to furthercomplicated tests.
The second purpose is for finding redundant attributesand possibly eliminating them. Sometimes having fewerattributes among the various medical examination testsmay be desirable in diagnosis of a disease. The authorsin [8] applied context reduction technique to reduce thoseredundant attributes from the rules generated from classifi-cation tree. The motive for excluding redundant attributesin medical test is to replace expensive tests by cheaper tests(with less testing attributes).
Although correlation is a major criteria for manifestingsimilarities in medical analysis between data attributes [9],another criteria which may be equally if not more popular areassociation rules. In our model, the correlation coefficientsmatrix could be in turn filled in by a composite measureof support and confidence accordingly for association rules.Association rules take forms of X → Y where X and Y aresets of attributes. Support of s% means that s number ofrecords includes both X and Y . Confidence of c% means camount of records that consists of X must also contain Y . Inour experiment, we computed correlation coefficient matrixas shown in Table 1.
Visualizing the correlation lattice as a Network Graphfor the medical data is enabled by a software programcalled NodeXL-Network Overview, Discovery and Explo-ration for Excel, (software is freely downloadable fromhttp://www.codeplex.com/). It is a free and open sourcespreadsheet add-in with features of network analysis andvisualization. The information to be visualized is storedas a correlation coefficient matrix (Table 1) which is to berepresented by a network graph. The attribute relationsare represented as a column of graph edge information;they specify which pairs of vertices being connected in thegraph network. In particular, the edges and vertices that aremapping the relations and attributes, respectively, have visual
(a)
(b)
Figure 4: Network Graph by NodeXL—Top: (a) attribute info.bottom: (b) relation strength.
properties to be programmed by the user according to thevalues in the correlation coefficient matrix, such as color, size,and shapes. In our case, only size is taken as a performancevariable that represents the magnitude or strength, that is,strongly correlated relations between pairs of attributes takeon thicker lines; attributes that occur more frequently inassociation rules are represented by bigger vertices.
Interactively, users can adjust settings of the control panelof the NodeXL template and explore the direct relationsbetween attributes. We modified the visualization of edgethickness by using an exponential boosting function becausethe differences between the correlation coefficients are verysmall considering the value ranging from 0 to 1, often indecimal of one or two places. Screen captures of the NetworkGraph in NodeXL are shown in Figures 4(a) and 4(b) thatshow the distribution of frequently appeared attributes in

6 Journal of Biomedicine and Biotechnology
Ta
ble
1:C
orre
lati
onco
effici
ent
mat
rix
show
sa
segm
ent
ofco
rrel
ated
attr
ibu
tes
from
our
exp
erim
enta
ldat
a.
Item
1It
em2
Item
3It
em4
Item
5It
em6
Item
7It
em8
Item
9It
em10
Item
11It
em12
Item
13It
em14
Item
11
Item
20.
3046
281
Item
30.
0868
590.
9554
841
Item
40.
2688
03−0
.640
95−0
.837
11
Item
5−0
.166
710.
8768
190.
9042
09−0
.692
521
Item
6−0
.838
93−0
.504
37−0
.424
440.
2559
24−0
.040
981
Item
7−0
.167
830.
8802
650.
9138
95−0
.713
130.
9995
67−0
.055
1It
em8
−0.7
6751
0.15
1117
0.22
6658
−0.2
1787
0.59
8202
0.77
5897
0.58
6164
1It
em9
−0.1
6533
0.88
728
0.93
3745
−0.7
5615
0.99
5487
−0.0
8997
0.99
7845
0.55
4419
1It
em10
−0.1
4374
0.89
6828
0.96
3708
−0.8
260.
9758
86−0
.167
90.
9818
330.
4776
190.
9921
281
Item
11−0
.169
870.
8819
410.
9209
22−0
.729
70.
9985
66−0
.065
350.
9997
080.
5767
890.
9991
270.
9860
371
Item
12−0
.845
19−0
.405
5−0
.328
660.
1940
640.
0683
30.
9938
080.
0537
540.
8403
390.
0172
42−0
.064
680.
0428
581
Item
13−0
.381
020.
7596
330.
8438
87−0
.742
260.
9739
580.
1260
830.
9751
930.
7125
660.
9739
040.
9564
820.
9758
490.
2290
561
Item
14#D
IV/0
!#D
IV/0
!#D
IV/0
!#D
IV/0
!#D
IV/0
!#D
IV/0
!#D
IV/0
!#D
IV/0
!#D
IV/0
!#D
IV/0
!#D
IV/0
!#D
IV/0
!#D
IV/0
!1

Journal of Biomedicine and Biotechnology 7
association rules and correlation of attributes, respectively.For simplicity in the illustration, only the top 10 items(attributes) are shown in bold. The heart disease datasetoriginally has 76 attributes, describing the patients’ healthbackground, blood pulse rates and other measurements, andso forth.
2.3. Feature Selection Analysis. Along with the Correlationanalysis which is an independent process by itself, our modelsuggests Feature Selection Analysis to be done before com-mencing to analysing nonlinear relations. Feature selectionprocess has a long history in data mining whose aim is toselectively retain only the “useful” attributes, which are alsoknown as features, in characterization of the data modelprior to training a data mining model. In our case, featureselection allows us to compute a significance value for eachfeature, thereafter the selected features and their significancevalues will be used to construct a dependency network anda decision tree. For authentication, the matching will bedone upon only a set of selected or “qualified” features thathave high significance. By using a shorter list of importantfeatures, the time taken for the authentication process can beshortened.
A comprehensive survey on feature selection [10]describes many types of techniques for selecting usefulattributes while filtering irrelevant ones. The technique thatwe adopted here is Information Gain that is shown tooffer consistent performance from a collection of medicaldatasets from UCI. The characteristics of some widely usedfeature selection techniques are briefly listed in Table 1.What they have in common is the ability to evaluate theinformation entropy in such a way whether including theattribute under test would contribute to reducing the chaosof information or not. At the same time, this measure implieshow much this particular attribute contributes to increasingthe predictive power of the training model, therefore itis taken as a performance indicator for evaluating how aprediction outcome would depend on each attribute.
The method of using feature selection is slightly differentin our model than in traditional data mining. Instead ofdirectly short-listing top-k worthy attributes to build adecision tree, in between we tried out all these algorithmsand plot out three performance charts on worthiness ofattribute, prediction accuracy, and decision tree size, byvarying the number of the short-listed attributes whopassed the feature selection test in ascending order. Theattributes are first ranked and progressively one by one beingadded to the decision tree building process. The motive ofthis novel technique is to find a just enough amount ofmost highly contributing attributes. And also the attributesyield an optimal balance of accuracy and decision treesize.
From Figure 5, we can clearly see that an optimal numberof qualified attributes to be used is 13, that is where thecross-point for the curves used by different feature selectionalgorithms. It is obvious that using too few would result inan inaccurate model, too many attributes mean expensivediagnosis tests. The number 13 which is deemed appropriatefor including the most qualified attributes in training
Info gain attribute
Chi-squareRelief FSVM
Poly. (info gain attribute)Poly. (chi-square)Poly. (relief F)Poly. (SVM)
R2 = 0.9157
R2 = 0.9009R2 = 0.9971
R2 = 0.914
1 4 7 10 13 16 19 22 25 28 31 34 37 400
2
4
6
8
10
12
14
Wor
thin
ess
(%)
Feature worthiness curve
Attributes
Figure 5: Worthiness measure of varying number of features beingadded into training a decision tree.
1 5 9 13 17 21 25 29 33 37 41
R2 = 0.7442
Decision tree accuracy
Acc
ura
cy (
%)
65666768697071727374
Attributes
Figure 6: The accuracy of the decision tree model trained by usingdifferent number of qualified features.
a decision tree model is unanimously agreed to be theoptimal point for accuracy (in Figure 6) and for tree size (inFigure 7) as well.
To recap, finding the significance values via FeatureSelection analysis helps estimating the optimal number ofmost contributing features in building a decision tree and thesignificance values would be passed on to the next process,building a dependency network diagram. More importantly,from a handful of important features the authenticationsystem can randomly set a subset from them for formulatingquestions every time.
2.4. Dependency Model. After obtaining a rule-based deci-sion tree model, such as Ripper (Pruning to Produce ErrorReduction) by William Cohen of AT and T Laboratorieswhich is chosen in our model because of its suitabilityand relatively high accuracy, the information about theinformation gain for each attribute would be used for
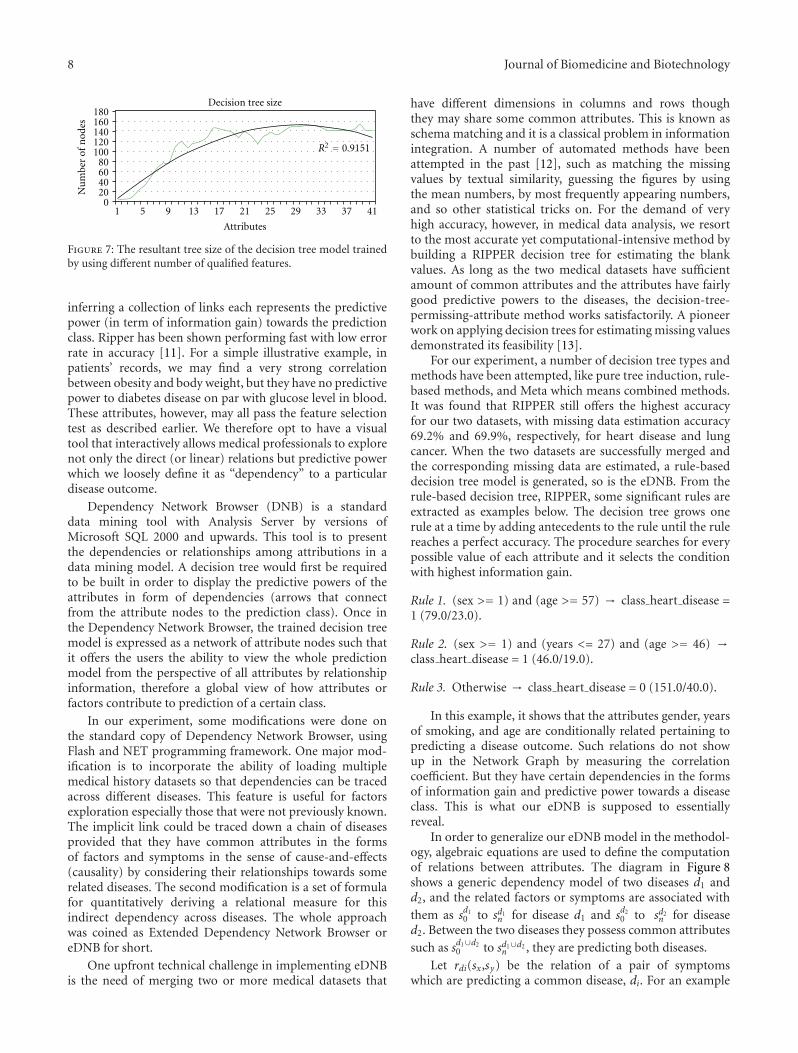
8 Journal of Biomedicine and Biotechnology
1 5 9 13 17 21 25 29 33 37 41
Attributes
Decision tree size
R2 = 0.9151
Nu
mbe
r of
nod
es
020406080
100120140160180
Figure 7: The resultant tree size of the decision tree model trainedby using different number of qualified features.
inferring a collection of links each represents the predictivepower (in term of information gain) towards the predictionclass. Ripper has been shown performing fast with low errorrate in accuracy [11]. For a simple illustrative example, inpatients’ records, we may find a very strong correlationbetween obesity and body weight, but they have no predictivepower to diabetes disease on par with glucose level in blood.These attributes, however, may all pass the feature selectiontest as described earlier. We therefore opt to have a visualtool that interactively allows medical professionals to explorenot only the direct (or linear) relations but predictive powerwhich we loosely define it as “dependency” to a particulardisease outcome.
Dependency Network Browser (DNB) is a standarddata mining tool with Analysis Server by versions ofMicrosoft SQL 2000 and upwards. This tool is to presentthe dependencies or relationships among attributions in adata mining model. A decision tree would first be requiredto be built in order to display the predictive powers of theattributes in form of dependencies (arrows that connectfrom the attribute nodes to the prediction class). Once inthe Dependency Network Browser, the trained decision treemodel is expressed as a network of attribute nodes such thatit offers the users the ability to view the whole predictionmodel from the perspective of all attributes by relationshipinformation, therefore a global view of how attributes orfactors contribute to prediction of a certain class.
In our experiment, some modifications were done onthe standard copy of Dependency Network Browser, usingFlash and NET programming framework. One major mod-ification is to incorporate the ability of loading multiplemedical history datasets so that dependencies can be tracedacross different diseases. This feature is useful for factorsexploration especially those that were not previously known.The implicit link could be traced down a chain of diseasesprovided that they have common attributes in the formsof factors and symptoms in the sense of cause-and-effects(causality) by considering their relationships towards somerelated diseases. The second modification is a set of formulafor quantitatively deriving a relational measure for thisindirect dependency across diseases. The whole approachwas coined as Extended Dependency Network Browser oreDNB for short.
One upfront technical challenge in implementing eDNBis the need of merging two or more medical datasets that
have different dimensions in columns and rows thoughthey may share some common attributes. This is known asschema matching and it is a classical problem in informationintegration. A number of automated methods have beenattempted in the past [12], such as matching the missingvalues by textual similarity, guessing the figures by usingthe mean numbers, by most frequently appearing numbers,and so other statistical tricks on. For the demand of veryhigh accuracy, however, in medical data analysis, we resortto the most accurate yet computational-intensive method bybuilding a RIPPER decision tree for estimating the blankvalues. As long as the two medical datasets have sufficientamount of common attributes and the attributes have fairlygood predictive powers to the diseases, the decision-tree-permissing-attribute method works satisfactorily. A pioneerwork on applying decision trees for estimating missing valuesdemonstrated its feasibility [13].
For our experiment, a number of decision tree types andmethods have been attempted, like pure tree induction, rule-based methods, and Meta which means combined methods.It was found that RIPPER still offers the highest accuracyfor our two datasets, with missing data estimation accuracy69.2% and 69.9%, respectively, for heart disease and lungcancer. When the two datasets are successfully merged andthe corresponding missing data are estimated, a rule-baseddecision tree model is generated, so is the eDNB. From therule-based decision tree, RIPPER, some significant rules areextracted as examples below. The decision tree grows onerule at a time by adding antecedents to the rule until the rulereaches a perfect accuracy. The procedure searches for everypossible value of each attribute and it selects the conditionwith highest information gain.
Rule 1. (sex >= 1) and (age >= 57) → class heart disease =1 (79.0/23.0).
Rule 2. (sex >= 1) and (years <= 27) and (age >= 46) →class heart disease = 1 (46.0/19.0).
Rule 3. Otherwise → class heart disease = 0 (151.0/40.0).
In this example, it shows that the attributes gender, yearsof smoking, and age are conditionally related pertaining topredicting a disease outcome. Such relations do not showup in the Network Graph by measuring the correlationcoefficient. But they have certain dependencies in the formsof information gain and predictive power towards a diseaseclass. This is what our eDNB is supposed to essentiallyreveal.
In order to generalize our eDNB model in the methodol-ogy, algebraic equations are used to define the computationof relations between attributes. The diagram in Figure 8shows a generic dependency model of two diseases d1 andd2, and the related factors or symptoms are associated withthem as sd1
0 to sd1n for disease d1 and sd2
0 to sd2n for disease
d2. Between the two diseases they possess common attributessuch as sd1∪d2
0 to sd1∪d2n , they are predicting both diseases.
Let rdi(sx,sy) be the relation of a pair of symptomswhich are predicting a common disease, di. For an example

Journal of Biomedicine and Biotechnology 9
...
d1d2
sd11
sd10
sd1n
sd2n
rdi (s , sy)
sd20
sd21
sd1∪d20
sd1∪d21
sd1∪d2n
rd1,d2(sd1 , sd2
y )
...
...
Figure 8: A network dependency model for two diseases andassociated factors.
of disease d1, the relation between symptoms s0 and s2 isexpressed as:
rd1 (s0, s2) =Id1g
(sd1
0
)+ Id1
g
(sd1
2
)∑n
i=0 Id1g
(sd1i
) , (1)
where n is the number of attributes predicting d1. Igis the information gain value calculated in the featureselection process and decision-tree-building process for each
attribution. Let r′di,dj(sdix , s
djy ) be the indirect relation of a pair
of symptoms which are predicting two different diseases. Forexample, the indirect relation between s3 from d1 and s5 fromd2 can be expressed as follow:
r′d1,d2
(sd1
3 , sd25
)=
⎧⎪⎪⎪⎪⎪⎪⎪⎪⎪⎪⎪⎪⎨⎪⎪⎪⎪⎪⎪⎪⎪⎪⎪⎪⎪⎩
0 condition
wd1
Id1g
(sd1
3
)∑nd1
i=0 Id1g
(sd1i
)
+wd2
Id2g
(sd2
5
)∑nd2
i=0 Id2g
(sd2i
) otherwise,
(2)
where condition = if d1 and d2 have no predicting attributein common, and wd1 and wd2 are weights proportional tothe relative importance of the diseases that the commonattributes are predicting about. The sum of the weightsequals to 1. The weights are needed because the commonattributes are assumed to be the only linkage between the twodiseases and the relative portions of predictive powers by thecommon attributes deciding how important the disease is inrelation to the symptoms.
wd1 =∑nd1∪d2
i=0 Id1g
(sd1∪d2i
)∑nd1∪d2
i=0 Id1g
(sd1∪d2i
)+∑nd1∪d2
i=0 Id2g
(sd1∪d2i
) ,
wd2 =∑nd1∪d2
i=0 Id2g
(sd1∪d2i
)∑nd1∪d2
i=0 Id1g
(sd1∪d2i
)+∑nd1∪d2
i=0 Id2g
(sd1∪d2i
) .(3)
The current model can be extended to a chain of diseasesthat go beyond two adjacent diseases. So we let r′′di···dk be an
indirect relation of a pair of symptoms which predict morethan two diseases.
r′′dα···dΩ(sdαx , sdΩy
)=
⎧⎪⎪⎪⎪⎪⎪⎪⎨⎪⎪⎪⎪⎪⎪⎪⎩
0 condition∑m( j:α···Ω)
j=0 Sig j∑m( j:α···Ω)j=0
∑nj
i=0 Idjg
(sdji
)otherwise,
(4)
where condition = if the relation chain of any two disease isbroken, that is, common symptoms of any two diseases alongthe chain are missing or do not have sufficient worthinessvalues. The chain is defined by the link of possessingcommon attributes from dα to dΩ.
Sig j =
⎧⎪⎪⎪⎪⎪⎪⎪⎪⎪⎪⎪⎪⎨⎪⎪⎪⎪⎪⎪⎪⎪⎪⎪⎪⎪⎩
wdj · Idαg(sdαx)
if j = α,
wd1 · IdΩg(sdΩy)
if j = Ω,
Sig1 = Y1, For p > 1,
Sigp = β · Yp−1 +(1− β
) · Sigp−1
if j ∈ [α + 1 · · ·Ω− 1].(5)
Sigp = β · (Yp−1 + (1 − β) ·Yp−2 + (1 − β)2 ·Yp−3 + · · ·+
(1 − β)k ·Yp−(k+1))+(1 − β)k+1 ·Sigp−(k+1) for any suitablek = 0, 1, 2, . . . The weight of the general significance of thelink between two diseases Yp−i is β(1 − β)i−1 where, thecoefficient β represents the degree of weighting decrease,a constant smoothing factor between 0 and 1. A higherβ discounts further linkages faster. Sigp is the value ofsignificance at any position p along the disease chain.
Yp is the linkage strength at any position p, along thechain. Yp is defined by the proportion of common symptomsand their predictability powers in disease p, in relation todisease p − 1 and disease p + 1.
Yp =∑ndp
i=0
⟨Idpg
(sdp∪dp+1
i
)+ I
dpg
(sdp∪dp−1
i
)�∑2
j=0
∑nd(p+ j−1)
i=0 Id(p+ j−1)g
(sd(p+ j−1)
i
) . (6)
For demonstration purposes, we used two medicaldatasets whose attributes and significances towards a diseaseare displayed in an eDNB. Figure 9 shows that all the selectedattributes of the two diseases are fully displayed. A smallpanel at the bottom of eDNB allows user to choose twosymptom attributes; then automatically the correspondingrelation of the two symptoms are displayed.
Figures 10 and 11 demonstrate the operation of eDNBin a mode where only common attributes are displayed ofthe two diseases. There is a slide-bar by which a user canadjust the viewing by the strength of the dependencies. Whenthe slide bar moves down the minimum requirement fordependencies strength increases, such that only the attributesthat have strong dependencies would remain. Attributesof relatively weaker dependencies fade away. This way, the
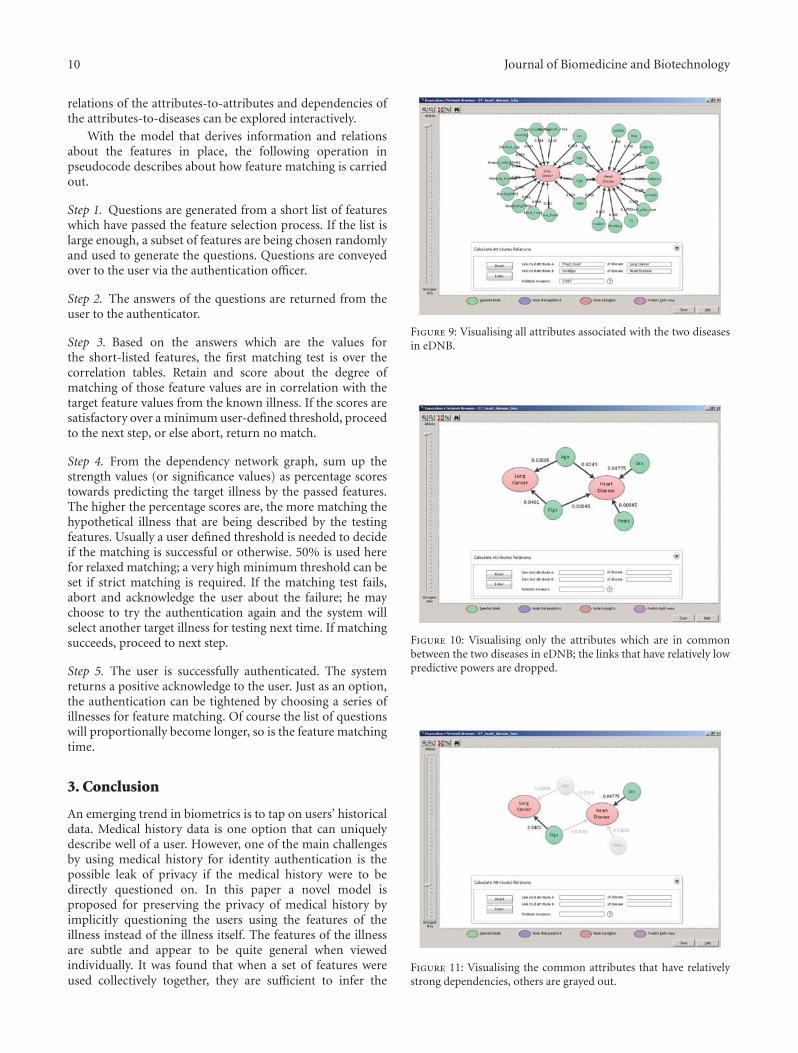
10 Journal of Biomedicine and Biotechnology
relations of the attributes-to-attributes and dependencies ofthe attributes-to-diseases can be explored interactively.
With the model that derives information and relationsabout the features in place, the following operation inpseudocode describes about how feature matching is carriedout.
Step 1. Questions are generated from a short list of featureswhich have passed the feature selection process. If the list islarge enough, a subset of features are being chosen randomlyand used to generate the questions. Questions are conveyedover to the user via the authentication officer.
Step 2. The answers of the questions are returned from theuser to the authenticator.
Step 3. Based on the answers which are the values forthe short-listed features, the first matching test is over thecorrelation tables. Retain and score about the degree ofmatching of those feature values are in correlation with thetarget feature values from the known illness. If the scores aresatisfactory over a minimum user-defined threshold, proceedto the next step, or else abort, return no match.
Step 4. From the dependency network graph, sum up thestrength values (or significance values) as percentage scorestowards predicting the target illness by the passed features.The higher the percentage scores are, the more matching thehypothetical illness that are being described by the testingfeatures. Usually a user defined threshold is needed to decideif the matching is successful or otherwise. 50% is used herefor relaxed matching; a very high minimum threshold can beset if strict matching is required. If the matching test fails,abort and acknowledge the user about the failure; he maychoose to try the authentication again and the system willselect another target illness for testing next time. If matchingsucceeds, proceed to next step.
Step 5. The user is successfully authenticated. The systemreturns a positive acknowledge to the user. Just as an option,the authentication can be tightened by choosing a series ofillnesses for feature matching. Of course the list of questionswill proportionally become longer, so is the feature matchingtime.
3. Conclusion
An emerging trend in biometrics is to tap on users’ historicaldata. Medical history data is one option that can uniquelydescribe well of a user. However, one of the main challengesby using medical history for identity authentication is thepossible leak of privacy if the medical history were to bedirectly questioned on. In this paper a novel model isproposed for preserving the privacy of medical history byimplicitly questioning the users using the features of theillness instead of the illness itself. The features of the illnessare subtle and appear to be quite general when viewedindividually. It was found that when a set of features wereused collectively together, they are sufficient to infer the
Figure 9: Visualising all attributes associated with the two diseasesin eDNB.
Figure 10: Visualising only the attributes which are in commonbetween the two diseases in eDNB; the links that have relatively lowpredictive powers are dropped.
Figure 11: Visualising the common attributes that have relativelystrong dependencies, others are grayed out.
Journal of Biomedicine and Biotechnology 11
identification of the illness. Taking the illness as the secrecythat is supposedly known only by the user, the questionsthat are derived from the selected features can be used toorally verify if the user knows of his past medical history:the experience of the illness indeed. From the answers ofthe questions that are derived from the selected features,a hypothetical illness is generated and it would be cross-verified by the illness data that was stored in a smartcard. The emphasis of this authentication model is thecausality that is the basis for quantifying relations betweenthe features and the target illness. It is like a one-way hashthat transforms a set of information into a target (illness)which we could use for matching it with the actual targetstored on the card. A number of technical support functionsare described in this paper; they are feature selection,correlation values computation, and dependency network.Though the foundation is laid by the contribution of thispaper in preserving privacy in user authentication overmedical history, a number of future works are possible. Thematching process can be fine tuned by considering morethan one illness, as the current limitation of the modelis testing by one illness at a time. Some automated andintelligent process is needed to derive suitable questions fromthe selected features. And a performance evaluation shouldbe conducted for checking the accuracy and speed of thewhole authentication process too. These should be addressedin future works.
References
[1] S. Mohamed, D. Noureddine, and G. Noureddine, “Faceand speech based multi-modal biometric authentication,”International Journal of Advanced Science and Technology, vol.21, no. 6, pp. 41–56, 2010.
[2] A. Jagadeesan, T. Thillaikkarasi, and K. Duraiswamy, “Cryp-tographic key generation from multiple biometric modalities:fusing minutiae with iris feature,” International Journal ofComputer Applications, vol. 2, no. 6, pp. 16–26, 2010.
[3] N. Ann and T. Sotirios, “A study in authentication via elec-tronic personal history questions,” in Proceedings of the 12thInternational Conference on Enterprise Information Systems(ICEIS ’10), pp. 63–70, June 2010.
[4] M. Nishigaki and K. Makoto, “A user authentication based onpersonal history- a user authentication system using E-mailhistory,” The Journal on Systemics, Cybernetics and Informatics,vol. 5, no. 2, pp. 18–23, 2007.
[5] C. J. Merz and P. Murthy, “UCI repository of machine learningdatabase,” ftp://ftp.ics.uci.edu/pub/machine-learning-databas-es/.
[6] M. Ohsaki, H. Abe, S. Tsumoto, H. Yokoi, and T. Yamaguchi,“Evaluation of rule interestingness measures in medicalknowledge discovery in databases,” Artificial Intelligence inMedicine, vol. 41, no. 3, pp. 177–196, 2007.
[7] A. Sakr and D. Mosa, “Dealing medical data with funda-mentals of new artificial intelligence,” International Journal ofEngineering Science and Technology, vol. 2, no. 9, pp. 4406–4417, 2010.
[8] A. Gupta, N. Kumar, and V. Bhatnagar, “Analysis of medicaldata using data mining and formal concept analysis, worldacademy of science,” Engineering and Technology, vol. 11, pp.61–64, 2005.
[9] M. Strickert, F. M. Schleif, T. Villmann, and U. Seifferta,Unleashing Pearson Correlation for Faithful Analysis of Biomed-ical Data, Similarity-Based Clustering, Springer, Berlin, Ger-many, 2009.
[10] M. Dash and H. Liu, “Feature selection for classification,”Intelligent Data Analysis, vol. 1, pp. 131–156, 1997.
[11] R. Abraham, J. B. Simha, and S. Iyengar, “Medical dataminingwith probabilistic classifiers,” in Proceedings of the 9th Interna-tional Conference on Information Technology (ICIT ’07), 2007.
[12] K. Jaewoo and J. F. Naughton, “Schema matching usinginterattribute dependencies,” IEEE Transactions on Knowledgeand Data Engineering, vol. 20, no. 10, Article ID 4527243, pp.1393–1407, 2008.
[13] Y. Hang and S. Fong, “Aerial root classifiers for predictingmissing values in data stream decision tree classification,”in Proceedings of the SIAM International Conference on DataMining (SDM ’11), vol. WS03, pp. 1–10, Mesa, April 2011.
Hindawi Publishing CorporationJournal of Biomedicine and BiotechnologyVolume 2012, Article ID 539395, 11 pagesdoi:10.1155/2012/539395
Research Article
Using Medical History Embedded in Biometrics MedicalCard for User Identity Authentication: Data Representationby AVT Hierarchical Data Tree
Simon Fong and Yan Zhuang
Department of Computer and Information Science, University of Macau, Taipa, Macau
Correspondence should be addressed to Simon Fong, [email protected]
Received 19 December 2011; Accepted 25 December 2011
Academic Editor: Sabah Mohammed
Copyright © 2012 S. Fong and Y. Zhuang. This is an open access article distributed under the Creative Commons AttributionLicense, which permits unrestricted use, distribution, and reproduction in any medium, provided the original work is properlycited.
User authentication has been widely used by biometric applications that work on unique bodily features, such as fingerprints,retina scan, and palm vessels recognition. This paper proposes a novel concept of biometric authentication by exploiting a user’smedical history. Although medical history may not be absolutely unique to every individual person, the chances of having twopersons who share an exactly identical trail of medical and prognosis history are slim. Therefore, in addition to common biometricidentification methods, medical history can be used as ingredients for generating Q&A challenges upon user authentication. Thisconcept is motivated by a recent advancement on smart-card technology that future identity cards are able to carry patents’ medicalhistory like a mobile database. Privacy, however, may be a concern when medical history is used for authentication. Therefore inthis paper, a new method is proposed for abstracting the medical data by using attribute value taxonomies, into a hierarchicaldata tree (h-Data). Questions can be abstracted to various level of resolution (hence sensitivity of private data) for use in theauthentication process. The method is described and a case study is given in this paper.
1. Introduction
Biometrics has become increasingly common nowadays inauthenticating users in security applications. There are manyapplications based on fingerprints, retina scans, voice wave-forms, behavioural patterns and palm vessels recognition,and so forth. They work by the assumption that biometricresembles a bodily feature that uniquely belongs to anindividual person and hardly anybody else. This biologicalfeature is neither transferrable nor easily forged. A newkind of biometrics is devised in this paper, established onthe information of one’s medical history. Although medicalhistory may not be absolutely unique to every individualperson, it is very rare to have two persons who share exactlyan identical trail of medical and prognosis. In fact, it isdifficult to find any pair of persons who own exactly thesame medical patterns in details that are described by time,location, age, diagnosis results, treatment dates and recovery
progress, and so forth. It is therefore believed to be possiblefor using the pattern of medical history as a biometric in userauthentication, at least in theory, in addition to the popularbiometric identification methods. Similar biometrics theo-ries are those based on one’s email history patterns, onlineactivity log patterns, and other personal history events [1, 2].But medical history has its advantage because such history isrelatively more difficult to be biologically forged, there arehard evidences that could be found from the wounds andscares; ultimate authentication by medical examination canbe made possible for further verification, if necessary. Theunique inerasable physiological feature favours biometricsauthentication over other type of personal activities logs.The use of medical history can be implemented in a formof question-and-answer (Q&A) type of interactive challengeupon authentication, by supposing that only the authenticuser has the secret (personal) knowledge about his or her pastmedical conditions. The information about one’s medical

2 Journal of Biomedicine and Biotechnology
history can be a rich resource for generating Q&A challengesprovided that the user has accumulated certain length ofmedical history.
This biometrics concept is motivated by a recent ad-vancement on smart-card technology that future identitycards with gigabytes of in-built memory are able to carrypatents’ medical history like a mobile database [3]. Canadianairports are the pioneer that accept this kind of biometricsecurity card for authentication and access control [4]; itis anticipated that many other countries and organizationswill surely follow. The advantage of the original idea ofembedding the medical history in a biometrics card isto allow medical rescue personnel access to this portablemedical history from his card in case of emergency. Alsothe medical history on a card serves as a centralizeddepository because it could be handy when medical recordsare often stored in different hospitals. The history datastored in the card in principle shall be updated at the endof every visit to a clinic. With the full and latest medicalrecords already in place in a portable biometrics card,ideally they offer a readily available resource for biometricauthentication. Usually these medical records are stored inthe memory chip of the card along with other populardigitized biometric data like fingerprint features too. Avail-ability of the data is readily there on a portable biometricsecurity card, what left of a research question is how thesedata could be used appropriately as biometrics for userauthentication.
Two major challenges are projected here pertaining tousing medical history as biometrics although the underlyingarchiving technology in a smart card can be safely assumedavailable. First is the process of matching and verification oflengthy medical history patterns in the task of authentica-tion. Even it is technologically possible to store a longitudinalpattern of medical cases for a patient, obtaining a currentpattern in the same longitudinal format (e.g., illness recordsfrom infant to current age) from a user as a test subjectfor testing or verification against his stored pattern duringauthentication task is almost impossible let alone accuratematching. If the testing pattern was to be acquired from oralinterview with the user under authentication, it will surelybe a very time consuming process. A quick method is neededfor instant or almost instant authentication just like howprominent features of a thumb print are extracted from ascanned image in a very short time.
Sampling is one technique to tackle this problem whena full length of detailed data is not suitable for completematching. More often, feature sampling which requiresonly a set of significant features to be matched has beenused for biometric authentication [5]. Feature sampling isa general theme that includes using statistics, importantevents, and approximate outline of a series of events forinstant authentication at a compromise of losing or omittingsome details. Usually its efficacy is satisfactorily meetingsome minimum performance expectation. Similar to featuresampling, sampling concept is to be applied on medicalhistory data here, however, not by random; only someprominent features would be selected for authentication.This implies some mechanism is required for abstracting the
medical history dataset into a lightweight representative pat-tern that can support efficient authentication. For example,a medical record that has specific attributes and values of thefollowing: American, female, aged 19 months, suffered frommeningitis, deaf and blind, would lead one to speculate sheis Helen Keller.
The second challenge is privacy problem that is inheritedfrom the nature of the medical history itself. Humans aregenerally uncomfortable to reveal too much detail of theirprivate illnesses that show a sign of physiological weakness asa matter of ego. Since certain details of one’s medical historyare being taken as a personal secrecy for authentication, thissecrecy would have to be confessed upon the authentication:the authenticator could be a machine or a human officer.Naturally this process of authentication operates in a form ofexchanging simple questions and answers about the secrecythat the user holds, and it has to be fast and concise. Theprivacy challenge we face is to hide sensitive elements asmuch as possible in the message exchanges. In other wordsthe questions would have to be asked implicitly withoutcompromising the leak of the sensitive medical conditions.
If medical history was to be used as authentication dataas an extra security measure, a special mechanism wouldbe needed to protect the privacy of the data as well as anefficient data structure that can effectively hide and facilitateapproximate matching of the medical patterns. Therefore inthis paper, a new method is proposed for abstracting themedical data by using attribute value taxonomies (AVT), intoa hierarchical data tree (h-Data). Questions can be abstractedto various levels of resolution (hence sensitivity of privatedata) for use in the authentication process. The method isdescribed and a case study is given in the following section.
2. Proposed Solution
The solution for tackling the resolution of details regardingthe medical history and privacy is to use h-Data by thetransformation of AVT. Once the data are constructed inhierarchical format with the abstract data in a higher tiersupported and related to the detailed data in a lower tier,questions can be derived selectively for user authentication.Figure 1 shows the process of converting a copy of thecomputerized patient’s records into an h-Data that are storedtogether in a biometric smart card. The conversion processwould be done at the level of certificate authority that can betrusted by users for data confidentiality. This paper focuseson how structured data with attributes in columns andinstances in rows are converted to h-Data via aggregation andabstraction techniques.
After the h-Data are embedded in the biometric securitycard, it could be used for question-based authentication.Direct questioning can be done on the history data directlythat is stored in structured format. Direct questioning isrelatively simple because the questions can be randomlychosen from a set of facts from the structured table, anda binary verdict will return, should the answer matchesor otherwise. Likewise, direct questioning can be done bysimple visual inspection if the validator is a human officer,
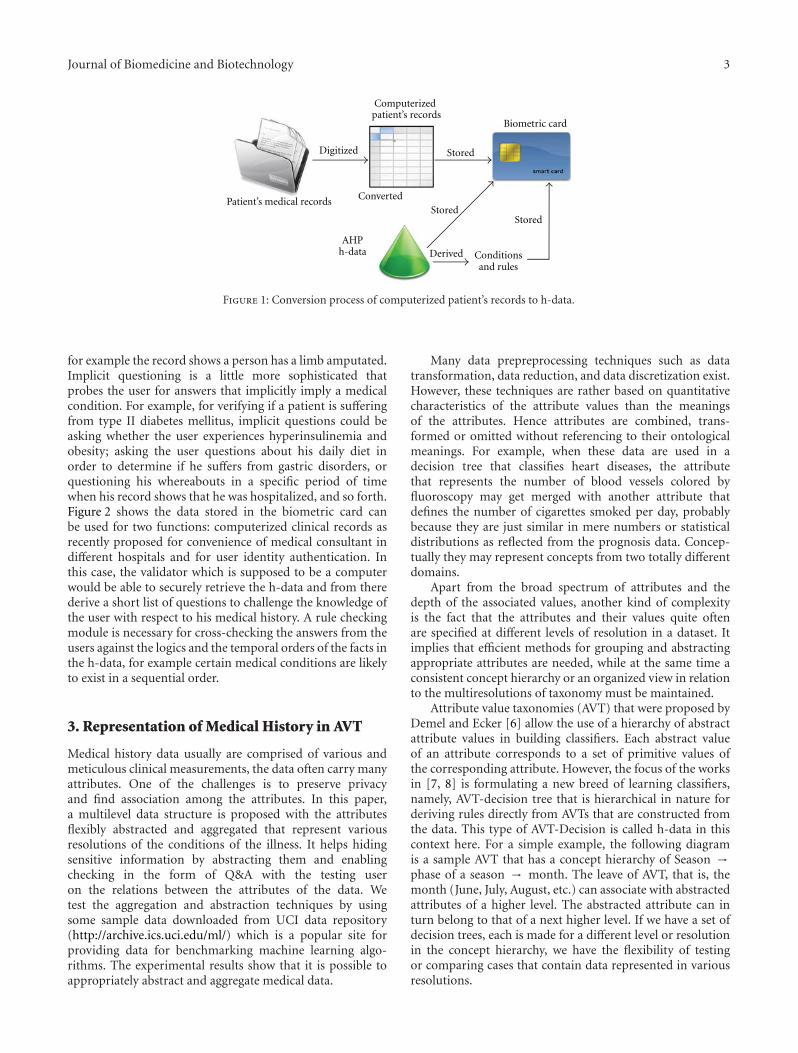
Journal of Biomedicine and Biotechnology 3
Computerizedpatient’s records
Digitized
Patient’s medical records ConvertedStored
Stored
Stored
Derived
Biometric card
Conditionsand rules
AHPh-data
Figure 1: Conversion process of computerized patient’s records to h-data.
for example the record shows a person has a limb amputated.Implicit questioning is a little more sophisticated thatprobes the user for answers that implicitly imply a medicalcondition. For example, for verifying if a patient is sufferingfrom type II diabetes mellitus, implicit questions could beasking whether the user experiences hyperinsulinemia andobesity; asking the user questions about his daily diet inorder to determine if he suffers from gastric disorders, orquestioning his whereabouts in a specific period of timewhen his record shows that he was hospitalized, and so forth.Figure 2 shows the data stored in the biometric card canbe used for two functions: computerized clinical records asrecently proposed for convenience of medical consultant indifferent hospitals and for user identity authentication. Inthis case, the validator which is supposed to be a computerwould be able to securely retrieve the h-data and from therederive a short list of questions to challenge the knowledge ofthe user with respect to his medical history. A rule checkingmodule is necessary for cross-checking the answers from theusers against the logics and the temporal orders of the facts inthe h-data, for example certain medical conditions are likelyto exist in a sequential order.
3. Representation of Medical History in AVT
Medical history data usually are comprised of various andmeticulous clinical measurements, the data often carry manyattributes. One of the challenges is to preserve privacyand find association among the attributes. In this paper,a multilevel data structure is proposed with the attributesflexibly abstracted and aggregated that represent variousresolutions of the conditions of the illness. It helps hidingsensitive information by abstracting them and enablingchecking in the form of Q&A with the testing useron the relations between the attributes of the data. Wetest the aggregation and abstraction techniques by usingsome sample data downloaded from UCI data repository(http://archive.ics.uci.edu/ml/) which is a popular site forproviding data for benchmarking machine learning algo-rithms. The experimental results show that it is possible toappropriately abstract and aggregate medical data.
Many data prepreprocessing techniques such as datatransformation, data reduction, and data discretization exist.However, these techniques are rather based on quantitativecharacteristics of the attribute values than the meaningsof the attributes. Hence attributes are combined, trans-formed or omitted without referencing to their ontologicalmeanings. For example, when these data are used in adecision tree that classifies heart diseases, the attributethat represents the number of blood vessels colored byfluoroscopy may get merged with another attribute thatdefines the number of cigarettes smoked per day, probablybecause they are just similar in mere numbers or statisticaldistributions as reflected from the prognosis data. Concep-tually they may represent concepts from two totally differentdomains.
Apart from the broad spectrum of attributes and thedepth of the associated values, another kind of complexityis the fact that the attributes and their values quite oftenare specified at different levels of resolution in a dataset. Itimplies that efficient methods for grouping and abstractingappropriate attributes are needed, while at the same time aconsistent concept hierarchy or an organized view in relationto the multiresolutions of taxonomy must be maintained.
Attribute value taxonomies (AVT) that were proposed byDemel and Ecker [6] allow the use of a hierarchy of abstractattribute values in building classifiers. Each abstract valueof an attribute corresponds to a set of primitive values ofthe corresponding attribute. However, the focus of the worksin [7, 8] is formulating a new breed of learning classifiers,namely, AVT-decision tree that is hierarchical in nature forderiving rules directly from AVTs that are constructed fromthe data. This type of AVT-Decision is called h-data in thiscontext here. For a simple example, the following diagramis a sample AVT that has a concept hierarchy of Season →phase of a season → month. The leave of AVT, that is, themonth (June, July, August, etc.) can associate with abstractedattributes of a higher level. The abstracted attribute can inturn belong to that of a next higher level. If we have a set ofdecision trees, each is made for a different level or resolutionin the concept hierarchy, we have the flexibility of testingor comparing cases that contain data represented in variousresolutions.

4 Journal of Biomedicine and Biotechnology
Biometric card Hospital or clinical medicalinformation system
User ID authenticationsystem
Q and Achallenge
Rule checking module
Doctor
User
Figure 2: Workflow of the two uses of the h-data from the biometric card.
Date
Summer Fall
July August
April September October
May June
PostfallPostspring
Prespring
Figure 3: Sample AVT for date attribute of a dataset [6].
This approach is especially useful when we deal withdata whose attributes have complex contextual resolutions.For clinical data records, a subset of attributes in the recordmay describe the body mass index (weight, height, plus evenage, gender and race), another subset of attribute in thesame record may represent the characteristic of a cell nucleus(radius, perimeter, area, smoothness, texture, etc.). The samegoes forth for attributes that may describe other conceptsin the context of clinical measurement, for example, insulindose, (Regular, NPH, UltraLente dose). All these attributemay reside in a single record as a complete diagnosis. Someof the values and the units of these attributes may be thesame, just like in Figure 3, but they belong to differentconcept groups, placed in different levels. Authenticators,however, are interested in knowing the interrelations amongthe attributes at different abstract levels, and in relation tothe recorded decision, for deriving authentication questions.The decision tree which is represented by h-data serves as ahierarchical data structure that shows the causality (cause-and-effect) relations of the attribute data. The implicitquestioning is based on principle of causality.
On the other hand, by generalizing and grouping attrib-utes and their values to specific concept levels, the anonymityof the data can be enhanced, that satisfies one of the aimshere for protecting one’s privacy. Medical data are usuallyhierarchical. When the data are mapped into hierarchies, thespecific data can become more general nodes in the hierar-chy; hence the privacy can be better conserved. Sometimessome aspects of the data may be sufficient to identify a personespecially rare illness.
In this paper, we devise a special hierarchical data mod-el for allowing users to group data from a large set ofattributes of heterogeneous natures, to organized conceptviews, similar to an AVT. The grouped attributes in abstractlevels could be used for formulating questions during theauthentication process in terms of how details the attributesare pertaining to a specific medical condition as the targetclass, and other interattributes relations. The challenge tobe met in this model is grouping the attributes and thenabstracting them to a higher level, which often requiresexpert knowledge or some common medical ontologicaldatabases. We used a collection of medical datasets as a casestudy, for evaluating the performance of the model.
4. Generation of Multilevel h-Data
The framework of the multilevel h-data generation model isshown in Figure 4. The central component in the frameworkis the preprocessing mechanism that receives two sets of dataas inputs and transforms them into several datasets priorto decision tree building process. Decision tree is used herefor knitting up the causality relations between the attributes,with a target class to which the model maps with the attributedata. For example, an illness of lung cancer would requireinference from a number of smoking-related attributes, suchas number of cigarette smoked per day, and years of beinga smoker. The two input datasets are as follows, one isthe original dataset with all the attributes, the other is aconcept hierarchy represented in AVT format. The input ofthe concept hierarchy also specifies the number of levels

Journal of Biomedicine and Biotechnology 5
Model construction phase
Raw dataset
Feature selection
Transformed
Transformeddataset 2
Transformeddataset n
· · ·
Concept hierarchy
Computation ofthe attributesinformation
dataset 1Build DT1
Build DT2
Build DTn
Preprocessing by abstraction and grouping
Figure 4: Framework of the Multilevel h-data generation process.
and what are the subgroups in each level. The concept ofhierarchy is assumed to be defined by some domain expertssuch as medical doctors. The other input dataset is a fulllongitudinal history record of a particular person.
The output of the preprocessing is a set of transformeddatasets that have been abstracted and aggregated accordingto their respective levels of abstraction at the concepthierarchy. There will be n number of transformed datasets(L1, L2, Ln), one dataset is for each layer of abstract concepts.The dimensions of the transformed datasets should belowered down to the abstract concepts in the correspondingAVT level, such that M = Mn ≥ M2 ≥ M1, where M isthe original dimension of the initial dataset, Mi is the newdimension of the transformed dataset Li at level i. L1 is theroot of the AVT which also is the highest level, Ln is thedataset that has the M number of original attributes.
With the transformed datasets L1 to Ln, traditional treebuilding process for example, C4.5 algorithm is used toinduce the corresponding decision trees, DT to DTn asoutputs. Because of the reduced dimensionality the sizesof the trees follow this pattern: C(DT1) ≤ C(DT2) · · · ≤C(DTn) where C(DT) is the size of the DT in terms of thesum of nodes and leaves. Once the DT1,2...n are constructedthey could be used for classification or prediction jobs bytesting new data records. However, new data records nowhave the flexibility and options of taking any abstract formfrom whichever level of the concept hierarchy. The new datarecord needs to be transformed by the same preprocessingprocess (as in the model construction phase) unless it takesthe same original dimensionality M as the original trainingdataset, prior to testing by the DT models.
The performance results as well as the information ofthe attributes during the model construction phase wouldbe collected for visualization. With a large amount ofdescription features, visualization in a hierarchy and groupsof concepts offers easy comprehension to human readersof attributes information and the relations among them.One would be interested to know the general relations oftwo abstract concepts instead of the linkage of two detailedattributes. For an example of an authentication questionbased on medical history, whether and how much a seasonalclimate that the user lives with or some general patternsof lifestyle that he is undertaking would contribute to hismedical condition over time, make more sense, and are better
interpretable than reading the measurements or very specificinformation on the individual attributes.
A compact decision tree that is built from abstract classesand attributes could potentially provide answers to high-levelquestions such as the example above.
Authenticators can try to find clues in the correct con-textual level from the rules derived from such decision trees.And the questions can be derived from the relations ofabstract concepts and their relations of prediction targets,instead of going to finer level attribute information, forformulating some general authentication questions.
The key mechanisms in the preprocessing process arethe abstraction and aggregation methods. The two methodsiterate from the lowest level to the highest up along thehierarchy specified in the given h-data according to thegiven concept hierarchy. The details of the two methodsare discussed below. The overall operation of the model isdepicted in pseudo code:
4.1. Aggregation Method. Aggregation is a common datatransformation process in which information is gatheredand expressed in a summary form, for purposes such ascategorizing numeric data and reducing the dimensionalityin data mining. Another common aggregation purpose isto acquire more information about particular groups basedon specific variables such as age, profession, or income.Sometimes new variables would be created that representthe old ones while the new variables can better capture themeanings and the regularity of their data distributions.
We used two examples in our case study of organizing upsome live medical data downloaded from UCI. One exampleis combining two attributes in the original data into a newattribute called body mass index that is more descriptive thanthe original ones. The two original attributes are weight (inkg) and height (in meters) to be put into a simple calculation.Sometimes categorical attributes are in text labels, crudelywritten; the language structures and grammars can be quitevague, depending on the sources. By using a lexical parserand analyzer, we analyze and rank the values of the multiplecombined variables into a discrete measure of informationcompleteness. New ordinal data may result, for examplehighly contagious, contagious, neutral; another example isbenign, malignant, when specific formula is used to evaluate
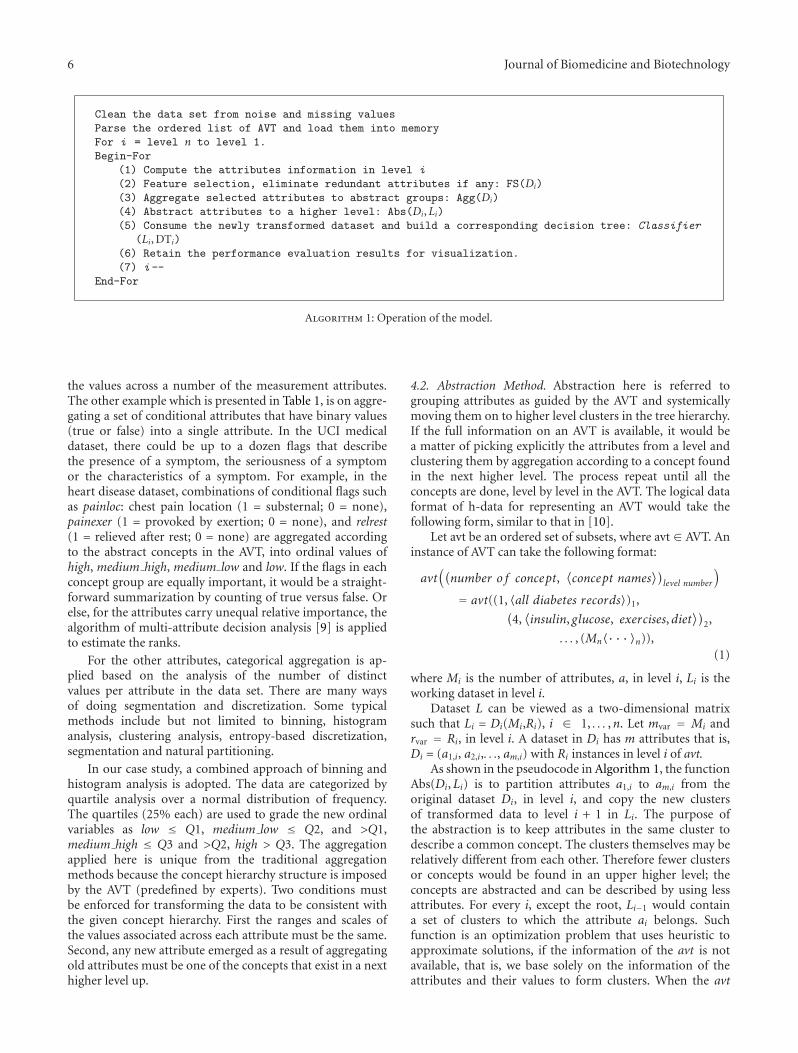
6 Journal of Biomedicine and Biotechnology
Clean the data set from noise and missing values
Parse the ordered list of AVT and load them into memory
For i = level n to level 1.
Begin-For
(1) Compute the attributes information in level i
(2) Feature selection, eliminate redundant attributes if any: FS(Di)
(3) Aggregate selected attributes to abstract groups: Agg(Di)
(4) Abstract attributes to a higher level: Abs(Di,Li)(5) Consume the newly transformed dataset and build a corresponding decision tree: Classifier
(Li, DTi)
(6) Retain the performance evaluation results for visualization.
(7) i --
End-For
Algorithm 1: Operation of the model.
the values across a number of the measurement attributes.The other example which is presented in Table 1, is on aggre-gating a set of conditional attributes that have binary values(true or false) into a single attribute. In the UCI medicaldataset, there could be up to a dozen flags that describethe presence of a symptom, the seriousness of a symptomor the characteristics of a symptom. For example, in theheart disease dataset, combinations of conditional flags suchas painloc: chest pain location (1 = substernal; 0 = none),painexer (1 = provoked by exertion; 0 = none), and relrest(1 = relieved after rest; 0 = none) are aggregated accordingto the abstract concepts in the AVT, into ordinal values ofhigh, medium high, medium low and low. If the flags in eachconcept group are equally important, it would be a straight-forward summarization by counting of true versus false. Orelse, for the attributes carry unequal relative importance, thealgorithm of multi-attribute decision analysis [9] is appliedto estimate the ranks.
For the other attributes, categorical aggregation is ap-plied based on the analysis of the number of distinctvalues per attribute in the data set. There are many waysof doing segmentation and discretization. Some typicalmethods include but not limited to binning, histogramanalysis, clustering analysis, entropy-based discretization,segmentation and natural partitioning.
In our case study, a combined approach of binning andhistogram analysis is adopted. The data are categorized byquartile analysis over a normal distribution of frequency.The quartiles (25% each) are used to grade the new ordinalvariables as low ≤ Q1, medium low ≤ Q2, and >Q1,medium high ≤ Q3 and >Q2, high > Q3. The aggregationapplied here is unique from the traditional aggregationmethods because the concept hierarchy structure is imposedby the AVT (predefined by experts). Two conditions mustbe enforced for transforming the data to be consistent withthe given concept hierarchy. First the ranges and scales ofthe values associated across each attribute must be the same.Second, any new attribute emerged as a result of aggregatingold attributes must be one of the concepts that exist in a nexthigher level up.
4.2. Abstraction Method. Abstraction here is referred togrouping attributes as guided by the AVT and systemicallymoving them on to higher level clusters in the tree hierarchy.If the full information on an AVT is available, it would bea matter of picking explicitly the attributes from a level andclustering them by aggregation according to a concept foundin the next higher level. The process repeat until all theconcepts are done, level by level in the AVT. The logical dataformat of h-data for representing an AVT would take thefollowing form, similar to that in [10].
Let avt be an ordered set of subsets, where avt ∈ AVT. Aninstance of AVT can take the following format:
avt((number o f concept,
⟨concept names
⟩)level number
)= avt((1, 〈all diabetes records〉)1,(
4,⟨insulin, glucose, exercises,diet
⟩)2,
. . . , (Mn〈· · · 〉n)),(1)
where Mi is the number of attributes, a, in level i, Li is theworking dataset in level i.
Dataset L can be viewed as a two-dimensional matrixsuch that Li = Di(Mi,Ri), i ∈ 1, . . . ,n. Let mvar = Mi andrvar = Ri, in level i. A dataset in Di has m attributes that is,Di = (a1,i, a2,i,. . ., am,i) with Ri instances in level i of avt.
As shown in the pseudocode in Algorithm 1, the functionAbs(Di,Li) is to partition attributes a1,i to am,i from theoriginal dataset Di, in level i, and copy the new clustersof transformed data to level i + 1 in Li. The purpose ofthe abstraction is to keep attributes in the same cluster todescribe a common concept. The clusters themselves may berelatively different from each other. Therefore fewer clustersor concepts would be found in an upper higher level; theconcepts are abstracted and can be described by using lessattributes. For every i, except the root, Li−1 would containa set of clusters to which the attribute ai belongs. Suchfunction is an optimization problem that uses heuristic toapproximate solutions, if the information of the avt is notavailable, that is, we base solely on the information of theattributes and their values to form clusters. When the avt
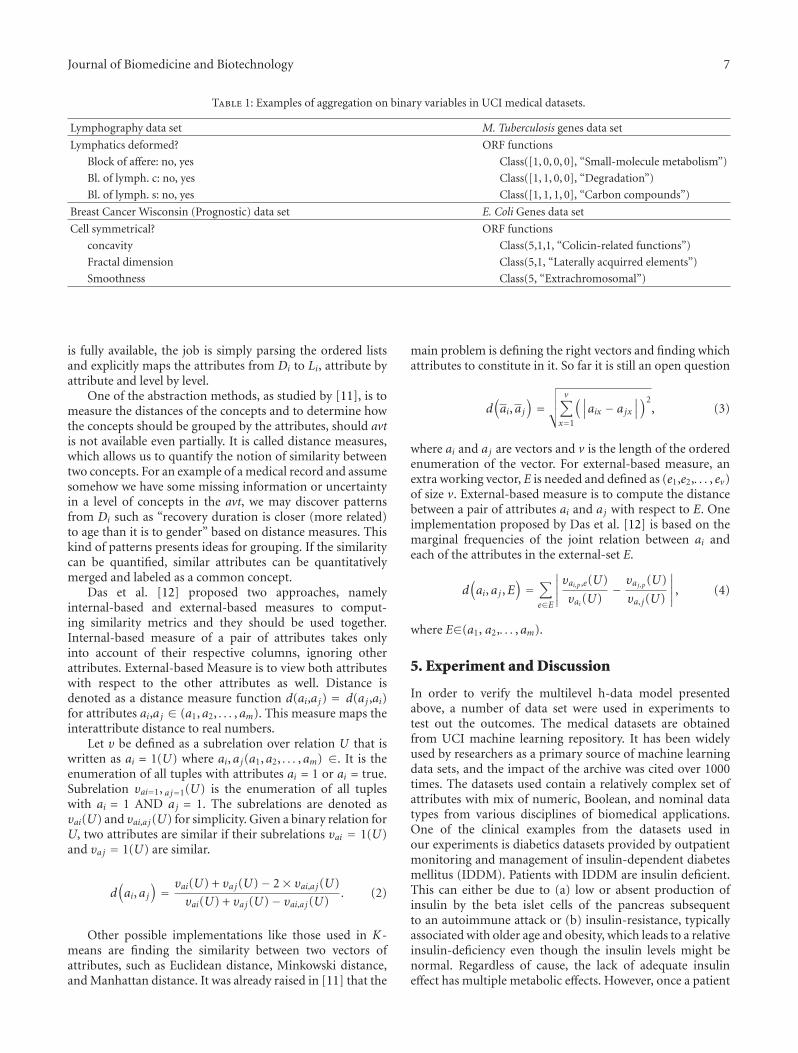
Journal of Biomedicine and Biotechnology 7
Table 1: Examples of aggregation on binary variables in UCI medical datasets.
Lymphography data set M. Tuberculosis genes data set
Lymphatics deformed? ORF functions
Block of affere: no, yes Class([1, 0, 0, 0], “Small-molecule metabolism”)
Bl. of lymph. c: no, yes Class([1, 1, 0, 0], “Degradation”)
Bl. of lymph. s: no, yes Class([1, 1, 1, 0], “Carbon compounds”)
Breast Cancer Wisconsin (Prognostic) data set E. Coli Genes data set
Cell symmetrical? ORF functions
concavity Class(5,1,1, “Colicin-related functions”)
Fractal dimension Class(5,1, “Laterally acquirred elements”)
Smoothness Class(5, “Extrachromosomal”)
is fully available, the job is simply parsing the ordered listsand explicitly maps the attributes from Di to Li, attribute byattribute and level by level.
One of the abstraction methods, as studied by [11], is tomeasure the distances of the concepts and to determine howthe concepts should be grouped by the attributes, should avtis not available even partially. It is called distance measures,which allows us to quantify the notion of similarity betweentwo concepts. For an example of a medical record and assumesomehow we have some missing information or uncertaintyin a level of concepts in the avt, we may discover patternsfrom Di such as “recovery duration is closer (more related)to age than it is to gender” based on distance measures. Thiskind of patterns presents ideas for grouping. If the similaritycan be quantified, similar attributes can be quantitativelymerged and labeled as a common concept.
Das et al. [12] proposed two approaches, namelyinternal-based and external-based measures to comput-ing similarity metrics and they should be used together.Internal-based measure of a pair of attributes takes onlyinto account of their respective columns, ignoring otherattributes. External-based Measure is to view both attributeswith respect to the other attributes as well. Distance isdenoted as a distance measure function d(ai,aj) = d(aj ,ai)for attributes ai,aj ∈ (a1, a2, . . . , am). This measure maps theinterattribute distance to real numbers.
Let υ be defined as a subrelation over relation U that iswritten as ai = 1(U) where ai, aj(a1, a2, . . . , am) ∈. It is theenumeration of all tuples with attributes ai = 1 or ai = true.Subrelation υai=1, a j=1(U) is the enumeration of all tupleswith ai = 1 AND aj = 1. The subrelations are denoted asυai(U) and υai,a j(U) for simplicity. Given a binary relation forU, two attributes are similar if their subrelations υai = 1(U)and υaj = 1(U) are similar.
d(ai, aj
)= υai(U) + υaj(U)− 2× υai,a j(U)
υai(U) + υaj(U)− υai,a j(U). (2)
Other possible implementations like those used in K-means are finding the similarity between two vectors ofattributes, such as Euclidean distance, Minkowski distance,and Manhattan distance. It was already raised in [11] that the
main problem is defining the right vectors and finding whichattributes to constitute in it. So far it is still an open question
d(ai, aj
)=√√√√ v∑
x=1
(∣∣∣aix − ajx
∣∣∣)2, (3)
where ai and aj are vectors and v is the length of the orderedenumeration of the vector. For external-based measure, anextra working vector, E is needed and defined as (e1,e2,. . . , ev)of size v. External-based measure is to compute the distancebetween a pair of attributes ai and aj with respect to E. Oneimplementation proposed by Das et al. [12] is based on themarginal frequencies of the joint relation between ai andeach of the attributes in the external-set E.
d(ai, aj ,E
)=∑e∈E
∣∣∣∣∣υai,p ,e(U)
υai(U)− υaj,p(U)
υa, j(U)
∣∣∣∣∣, (4)
where E∈(a1, a2,. . . , am).
5. Experiment and Discussion
In order to verify the multilevel h-data model presentedabove, a number of data set were used in experiments totest out the outcomes. The medical datasets are obtainedfrom UCI machine learning repository. It has been widelyused by researchers as a primary source of machine learningdata sets, and the impact of the archive was cited over 1000times. The datasets used contain a relatively complex set ofattributes with mix of numeric, Boolean, and nominal datatypes from various disciplines of biomedical applications.One of the clinical examples from the datasets used inour experiments is diabetics datasets provided by outpatientmonitoring and management of insulin-dependent diabetesmellitus (IDDM). Patients with IDDM are insulin deficient.This can either be due to (a) low or absent production ofinsulin by the beta islet cells of the pancreas subsequentto an autoimmune attack or (b) insulin-resistance, typicallyassociated with older age and obesity, which leads to a relativeinsulin-deficiency even though the insulin levels might benormal. Regardless of cause, the lack of adequate insulineffect has multiple metabolic effects. However, once a patient
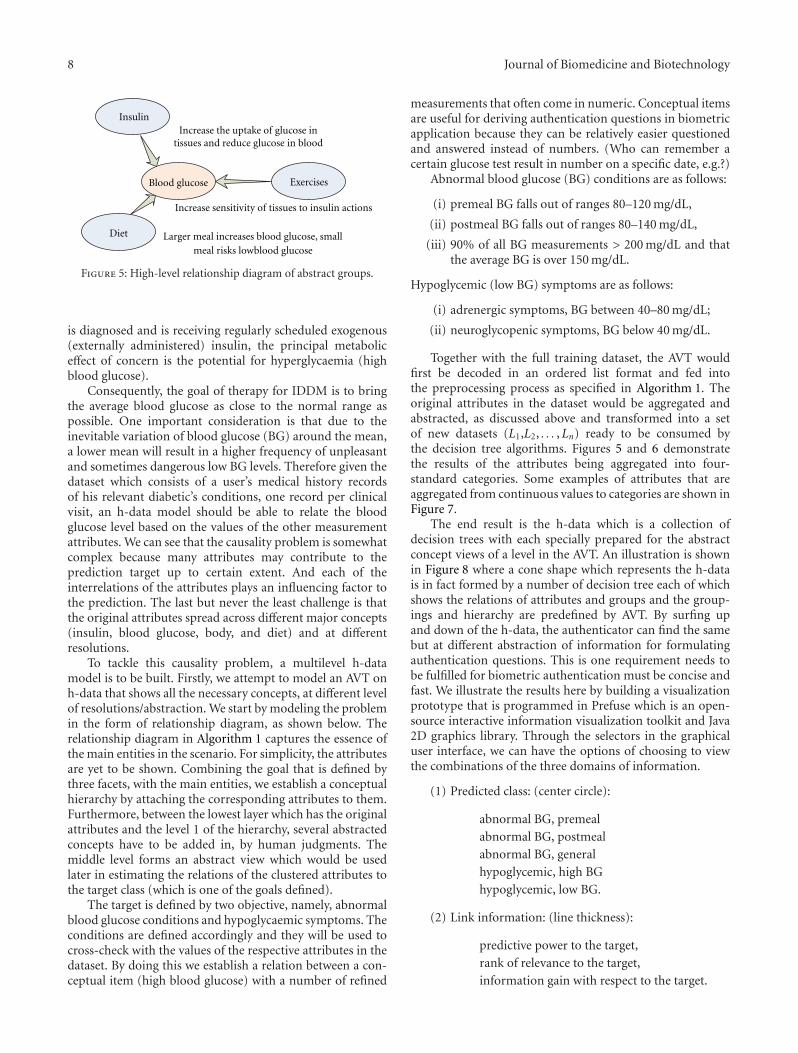
8 Journal of Biomedicine and Biotechnology
Insulin
Diet
Blood glucose
Increase sensitivity of tissues to insulin actions
Exercises
Larger meal increases blood glucose, smallmeal risks lowblood glucose
Increase the uptake of glucose intissues and reduce glucose in blood
Figure 5: High-level relationship diagram of abstract groups.
is diagnosed and is receiving regularly scheduled exogenous(externally administered) insulin, the principal metaboliceffect of concern is the potential for hyperglycaemia (highblood glucose).
Consequently, the goal of therapy for IDDM is to bringthe average blood glucose as close to the normal range aspossible. One important consideration is that due to theinevitable variation of blood glucose (BG) around the mean,a lower mean will result in a higher frequency of unpleasantand sometimes dangerous low BG levels. Therefore given thedataset which consists of a user’s medical history recordsof his relevant diabetic’s conditions, one record per clinicalvisit, an h-data model should be able to relate the bloodglucose level based on the values of the other measurementattributes. We can see that the causality problem is somewhatcomplex because many attributes may contribute to theprediction target up to certain extent. And each of theinterrelations of the attributes plays an influencing factor tothe prediction. The last but never the least challenge is thatthe original attributes spread across different major concepts(insulin, blood glucose, body, and diet) and at differentresolutions.
To tackle this causality problem, a multilevel h-datamodel is to be built. Firstly, we attempt to model an AVT onh-data that shows all the necessary concepts, at different levelof resolutions/abstraction. We start by modeling the problemin the form of relationship diagram, as shown below. Therelationship diagram in Algorithm 1 captures the essence ofthe main entities in the scenario. For simplicity, the attributesare yet to be shown. Combining the goal that is defined bythree facets, with the main entities, we establish a conceptualhierarchy by attaching the corresponding attributes to them.Furthermore, between the lowest layer which has the originalattributes and the level 1 of the hierarchy, several abstractedconcepts have to be added in, by human judgments. Themiddle level forms an abstract view which would be usedlater in estimating the relations of the clustered attributes tothe target class (which is one of the goals defined).
The target is defined by two objective, namely, abnormalblood glucose conditions and hypoglycaemic symptoms. Theconditions are defined accordingly and they will be used tocross-check with the values of the respective attributes in thedataset. By doing this we establish a relation between a con-ceptual item (high blood glucose) with a number of refined
measurements that often come in numeric. Conceptual itemsare useful for deriving authentication questions in biometricapplication because they can be relatively easier questionedand answered instead of numbers. (Who can remember acertain glucose test result in number on a specific date, e.g.?)
Abnormal blood glucose (BG) conditions are as follows:
(i) premeal BG falls out of ranges 80–120 mg/dL,
(ii) postmeal BG falls out of ranges 80–140 mg/dL,
(iii) 90% of all BG measurements > 200 mg/dL and thatthe average BG is over 150 mg/dL.
Hypoglycemic (low BG) symptoms are as follows:
(i) adrenergic symptoms, BG between 40–80 mg/dL;
(ii) neuroglycopenic symptoms, BG below 40 mg/dL.
Together with the full training dataset, the AVT wouldfirst be decoded in an ordered list format and fed intothe preprocessing process as specified in Algorithm 1. Theoriginal attributes in the dataset would be aggregated andabstracted, as discussed above and transformed into a setof new datasets (L1,L2, . . . ,Ln) ready to be consumed bythe decision tree algorithms. Figures 5 and 6 demonstratethe results of the attributes being aggregated into four-standard categories. Some examples of attributes that areaggregated from continuous values to categories are shown inFigure 7.
The end result is the h-data which is a collection ofdecision trees with each specially prepared for the abstractconcept views of a level in the AVT. An illustration is shownin Figure 8 where a cone shape which represents the h-datais in fact formed by a number of decision tree each of whichshows the relations of attributes and groups and the group-ings and hierarchy are predefined by AVT. By surfing upand down of the h-data, the authenticator can find the samebut at different abstraction of information for formulatingauthentication questions. This is one requirement needs tobe fulfilled for biometric authentication must be concise andfast. We illustrate the results here by building a visualizationprototype that is programmed in Prefuse which is an open-source interactive information visualization toolkit and Java2D graphics library. Through the selectors in the graphicaluser interface, we can have the options of choosing to viewthe combinations of the three domains of information.
(1) Predicted class: (center circle):
abnormal BG, premeal
abnormal BG, postmeal
abnormal BG, general
hypoglycemic, high BG
hypoglycemic, low BG.
(2) Link information: (line thickness):
predictive power to the target,
rank of relevance to the target,
information gain with respect to the target.
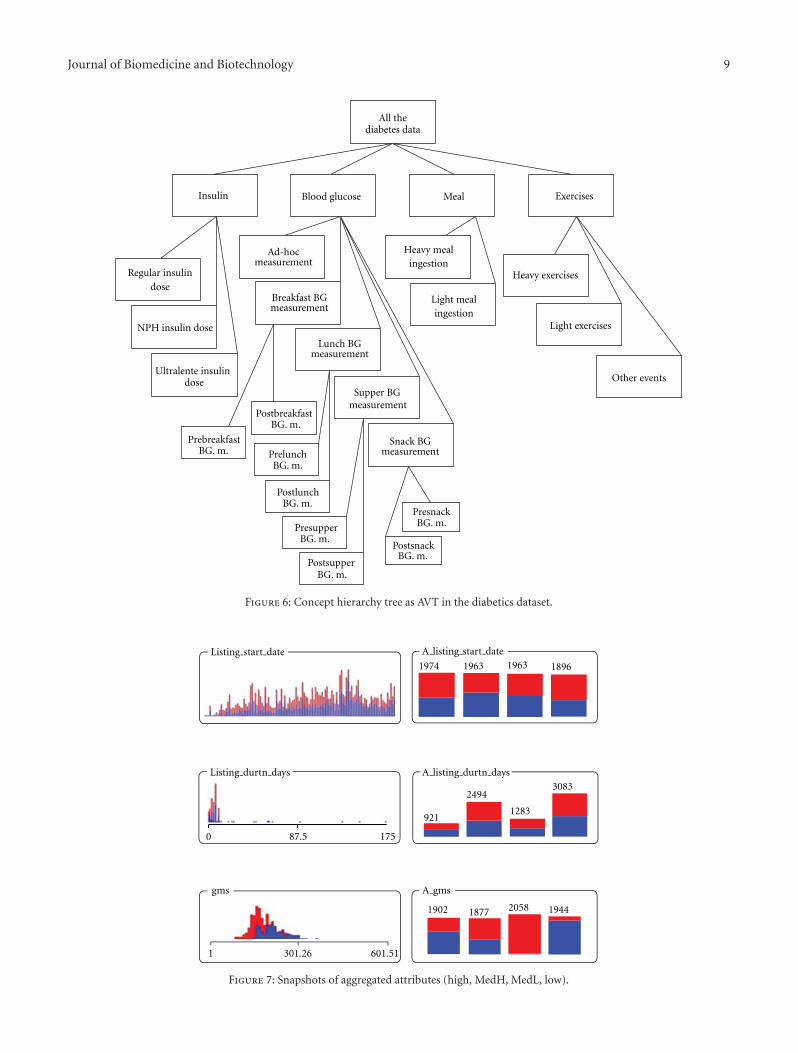
Journal of Biomedicine and Biotechnology 9
All thediabetes data
Insulin Blood glucose Meal
Regular insulindose
NPH insulin dose
Ultralente insulindose
Ad-hocmeasurement
Breakfast BGmeasurement
Lunch BGmeasurement
Supper BGmeasurement
Snack BGmeasurement
Other events
Heavy mealingestion
Light mealingestion
Exercises
PrebreakfastBG. m. Prelunch
BG. m.
PostbreakfastBG. m.
PostlunchBG. m.
PresupperBG. m.
PresnackBG. m.
PostsnackBG. m.
Heavy exercises
Light exercises
PostsupperBG. m.
Figure 6: Concept hierarchy tree as AVT in the diabetics dataset.
1974 1963 1896
0 175
921
2494
1283
3083
1 301.26 601.51
1902 1877 1944
gms
1963
2058
87.5
Listing start date
A listing durtn days
A gms
A listing start date
Listing durtn days
Figure 7: Snapshots of aggregated attributes (high, MedH, MedL, low).
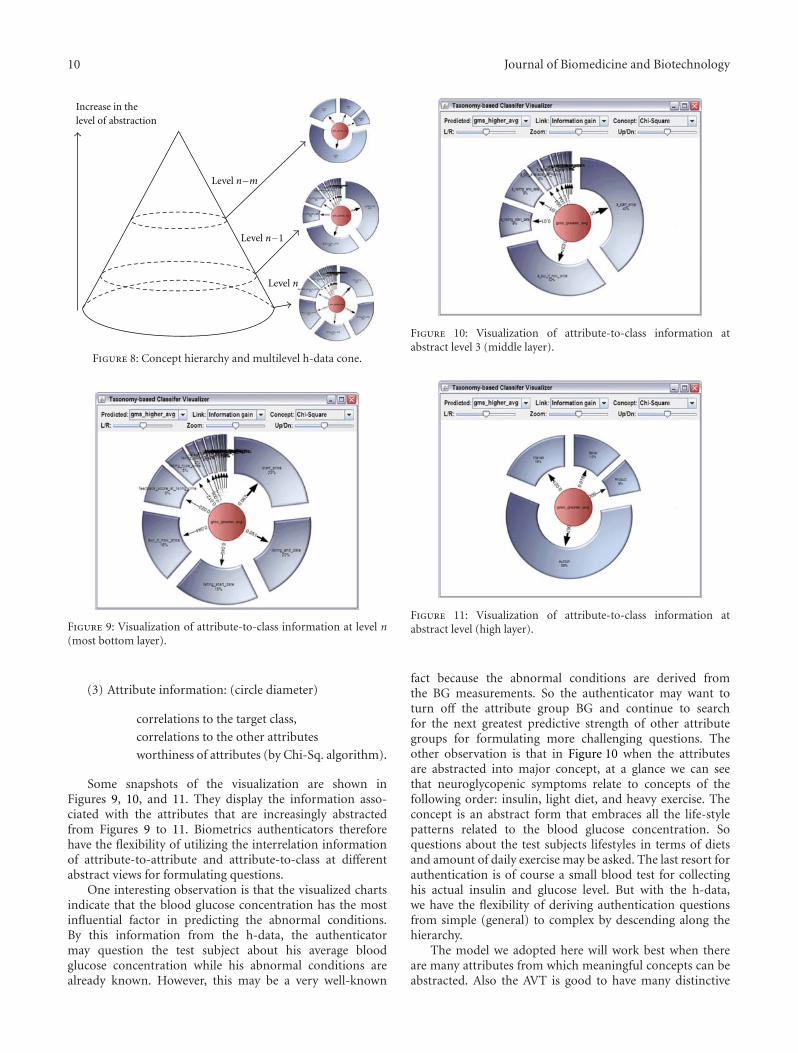
10 Journal of Biomedicine and Biotechnology
Increase in thelevel of abstraction
Level n−m
Level n−1
Level n
Figure 8: Concept hierarchy and multilevel h-data cone.
Figure 9: Visualization of attribute-to-class information at level n(most bottom layer).
(3) Attribute information: (circle diameter)
correlations to the target class,
correlations to the other attributes
worthiness of attributes (by Chi-Sq. algorithm).
Some snapshots of the visualization are shown inFigures 9, 10, and 11. They display the information asso-ciated with the attributes that are increasingly abstractedfrom Figures 9 to 11. Biometrics authenticators thereforehave the flexibility of utilizing the interrelation informationof attribute-to-attribute and attribute-to-class at differentabstract views for formulating questions.
One interesting observation is that the visualized chartsindicate that the blood glucose concentration has the mostinfluential factor in predicting the abnormal conditions.By this information from the h-data, the authenticatormay question the test subject about his average bloodglucose concentration while his abnormal conditions arealready known. However, this may be a very well-known
Figure 10: Visualization of attribute-to-class information atabstract level 3 (middle layer).
Figure 11: Visualization of attribute-to-class information atabstract level (high layer).
fact because the abnormal conditions are derived fromthe BG measurements. So the authenticator may want toturn off the attribute group BG and continue to searchfor the next greatest predictive strength of other attributegroups for formulating more challenging questions. Theother observation is that in Figure 10 when the attributesare abstracted into major concept, at a glance we can seethat neuroglycopenic symptoms relate to concepts of thefollowing order: insulin, light diet, and heavy exercise. Theconcept is an abstract form that embraces all the life-stylepatterns related to the blood glucose concentration. Soquestions about the test subjects lifestyles in terms of dietsand amount of daily exercise may be asked. The last resort forauthentication is of course a small blood test for collectinghis actual insulin and glucose level. But with the h-data,we have the flexibility of deriving authentication questionsfrom simple (general) to complex by descending along thehierarchy.
The model we adopted here will work best when thereare many attributes from which meaningful concepts can beabstracted. Also the AVT is good to have many distinctive

Journal of Biomedicine and Biotechnology 11
levels, thus many levels of resolutions can be generatedfor use in question searching upon authentication. Somecommon levels of resolutions that we encountered fromattributes of datasets in data analytics include:
continent −→ country −→ province −→ city −→ streetyear −→ sason/quarter −→month −→ week −→ daypopulation −→ clan −→ body −→ organ −→ cell.
6. Conclusion
Biometric authentication in the past has taken many formsof unique bodily features. In this paper a novel conceptof biometric authentication by exploiting a user’s medicalhistory is proposed. Similar concepts have been raisedrecently by using information about the user’s uniqueonline activities and email logs. However, medical history isrelatively stronger than activity events because each medicalevent is supposedly verified by medical professionals—therecords can be traced, the medical history can hardly forgedand instant testing can be made available (when necessary)by a body examination on the spot. The application ofmedical history in user authentication is suggested toassume a question-based form; few short questions must beanswered by the testing subject upon authentication. Directquestioning is believed to be inappropriate because usersmay be reluctant to confess his medical conditions especiallyin front of a human validator, and security of the medicalhistory may be comprised if they are used explicitly in theauthentication process. Hence, in this paper we stress on aneed that authentication should take on an implicit formsuch that users will no longer have to be confronted withhis medical conditions. Instead general questions such as hislifestyle and dietary habits would be asked whose answerswill be then inferred to the priori answer (the illness andits extents, etc.) for authentication matching. To facilitatesuch implicit questioning, a new type of data representation,namely h-Data is introduced. h-Data has a hierarchy ofresolution for defining the information about the medicalcondition. A biometric security card can store a numberof h-Data, corresponding to each of the user’s medicalillness if he ever suffered from multiple major illnesses.Essentially each layer of h-Data is a relation-map that mapsthe attributes while specifying their relations and theirstrengths to the target class. With h-Data the authenticatorcan have the flexibility of gliding along the hierarchy insearch of questions ranging from general to specific. Becausethe medical conditions are already known, inferring from theanswers to those general questions can lead to a hypotheticalanswer (medical condition) that could be used to test if itmatches with the actual one stored. This paper contributes tothe original idea which is believed to be the pioneer in usingmedical history for user authentication. What follows willbe extensive research from the authors and hopefully fromthe scientific community to further perfect this technologicalinnovation. Many future areas revolving this concept exist,such as applying natural language in deriving authenticationquestions, security and usability evaluation, and accuracy
testing of the said technology, hardware and software systemdesign, messaging protocols, and so forth, just to name a few.
References
[1] A. Nosseir and S. Terzis, “A study in authentication via elec-tronic personal history questions,” in Proceedings of the 12thInternational Conference on Enterprise Information Systems(ICEIS ’10), vol. 5, pp. 63–70, June 2010.
[2] M. Nishigaki and M. Koike, “A user authentication based onpersonal history- a user authentication system using e-mailhistory,” The Journal on Systemics, Cybernetics and Informatics,vol. 5, no. 2, pp. 18–23, 2007.
[3] “SmartMetric Announces Its Fingerprint Biometric CardCan Now Be Used to Hold Personal Medical RecordsWithout Security Compromise,” August 2010, http://www.smartmetric.com/.
[4] “New biometric security card in force at Canada’s largestairports,” Wings Magazine, Annex Business Media , 2011,http://www.wingsmagazine.com/.
[5] S. A. Samad, D. A. Ramli, and A. Hussain, “A multi-sam-ple single-source model using spectrographic features forbiometric authentication,” in Proceedings of the 6th Interna-tional Conference on Information, Communications and SignalProcessing (ICICS ’07), pp. 1–5, December 2007.
[6] M. Demel and G. Ecker, “New challenges for feature selection:on the relationship between feature selection and classificationaccuracy,” in Proceedings of the JMLR Workshop, pp. 90–105,2008.
[7] J. Zhang and V. Honavar, “Learning decision tree classifiersfrom attribute value taxonomies and partially specified data,”in Proceedings of the 20th International Conference on MachineLearning, pp. 880–887, August 2003.
[8] H. Jo, Y. C. Na, B. Oh, J. Yang, and V. Honavar, “Attribute valuetaxonomy generation through matrix based adaptive geneticalgorithm,” in Proceedings of the 20th IEEE InternationalConference on Tools with Artificial Intelligence (ICTAI ’08), pp.393–400, Dayton, Ohio, USA, November 2008.
[9] M. Guo, J. B. Yang, K. S. Chin, H. W. Wang, and X. B. Liu, “Theevidential reasoning approach for multi-attribute decisionanalysis under interval uncertainty,” IEEE Transactions onFuzzy Systems, vol. 17, no. 3, pp. 683–697, 2009.
[10] Z. Lin, M. Hewett, and R. B. Altman, “Using binning tomaintain confidentiality of medical data,” in Proceedings of theAmerican Medical Informatics Association Annual Symposium(AMIA ’02), pp. 454–458, 2002.
[11] S. Dawara, Grouping related attributes, M.S. thesis, TheRochester Institute of Technology, 2004.
[12] G. Das, H. Mannila, and P. Ronkainen, “Context basedsimilarity measures for categorical databases,” in Proceedingsof the 4th European Conference on Principles and Practice ofKnowledge Discovery in Databases (PKDD ’00), pp. 201–210,September 2000.
Hindawi Publishing CorporationJournal of Biomedicine and BiotechnologyVolume 2012, Article ID 376428, 8 pagesdoi:10.1155/2012/376428
Research Article
Antilisterial Activity of Nisin-Like Bacteriocin-ProducingLactococcus lactis subsp. lactis Isolated from TraditionalSardinian Dairy Products
Sofia Cosentino, Maria Elisabetta Fadda, Maura Deplano,Roberta Melis, Rita Pomata, and Maria Barbara Pisano
Department of Experimental Biology, Section of Hygiene, University of Cagliari, Cittadella Universitaria, S.S. 554, Km. 4,5,09042 Monserrato, Italy
Correspondence should be addressed to Sofia Cosentino, [email protected]
Received 30 November 2011; Accepted 11 January 2012
Academic Editor: Tai Hoon Kim
Copyright © 2012 Sofia Cosentino et al. This is an open access article distributed under the Creative Commons AttributionLicense, which permits unrestricted use, distribution, and reproduction in any medium, provided the original work is properlycited.
With the aim of selecting LAB strains with antilisterial activity to be used as protective cultures to enhance the safety of dairyproducts, the antimicrobial properties of 117 Lactococcus lactis subsp. lactis isolated from artisanal Sardinian dairy productswere evaluated, and six strains were found to produce bacteriocin-like substances. The capacity of these strains to antagonizeListeria monocytogenes during cocultivation in skimmed milk was evaluated, showing a reduction of L. monocytogenes counts ofapproximately 4 log units compared to the positive control after 24 h of incubation. In order for a strain to be used as bioprotectiveculture, it should be carefully evaluated for the presence of virulence factors, to determine what potential risks might be involvedin its use. None of the strains tested was found to produce biogenic amines or to possess haemolytic activity. In addition, all strainswere sensitive to clinically important antibiotics such as ampicillin, tetracycline, and vancomycin. Our results suggest that thesebac+ strains could be potentially applied in cheese manufacturing to control the growth of L. monocytogenes.
1. Introduction
In modern societies, the increasing consumer demand fornatural and additive-free products has led food industry toresearch novel and alternative technologies in food preserva-tion, with the objective to improve quality and safety of theirproducts.
The use of microorganisms and/or their natural metabo-lites to inhibit the growth of pathogenic and spoilage bacteriahas appeared as a promising tool and is also perceived by theconsumer as a lower-risk food preservation [1]. In particular,lactic acid bacteria (LAB) have acquired considerable rele-vance in the food industry and in public health, since theyare widely used in fermented foods, have a long history ofsafe use, and are commonly given the Generally RecognizedAs Safe (GRAS) status [2]. The preservative ability of LABin food is attributed mainly to the production of antimi-crobial substances, including organic acid, hydrogen per-oxide, and bacteriocins [3, 4]. The latter are ribosomally
synthesized, biologically active peptides or proteins with an-tagonistic activity against specific microorganisms [5, 6].Many bacteriocin-producing LAB strains have proven effec-tive against spoilage and pathogenic microorganisms in foodproducts [7–9].
In the last decades, Listeria monocytogenes has becomeone of the most significant foodborne pathogens due to itswidespread occurrence and its ability to tolerate environ-mental stresses such as low pH, low temperatures, and saltconcentration up to 10% [10, 11]. These characteristicsenable its frequent contamination of food products, particu-larly those minimally processed and refrigerated. Foodbornelisteriosis is known to pose a serious health hazard when itoccurs in newborns, pregnant women, and immunocompro-mised subjects [12, 13].
Since dairy products have been frequently reportedas contaminated and associated with listeriosis outbreaks[11, 14], new preservation strategies to control growth of
2 Journal of Biomedicine and Biotechnology
L. monocytogenes have been developed, including the directapplication of bacteriocins as purified compound or theinoculation with a bacteriocin-producer LAB strain underconditions that favour production of the bacteriocin in situ[15–17]. Nisin, produced by Lactococcus lactis, is currentlythe only bacteriocin approved as preservative for utilizationas direct human food ingredient [18, 19]. The in-situ pro-duction of a bacteriocin by potential adjuncts or starter cul-tures in fermentation processes requires a bacteriocinogenicstrain that is well adapted to the particular food environmentin which it will be used, that is able to grow under thefood processing and/or storage conditions, and that producesbacteriocin in sufficient amounts to inhibit the target bac-teria. LAB originally isolated from certain food productswould be the best choice as starter cultures for these sameproducts, because they would be more competitive than LABfrom other sources [20].
With the aim of selecting LAB strains with antilisterialactivity to be used as protective cultures to enhance the safetyof dairy products, the antimicrobial properties of 117 L. lactissubsp. lactis isolated from artisanal Sardinian dairy productswere evaluated, and six strains were found to produce bacte-riocin-like substances. The capacity of these strains to antag-onize L. monocytogenes during cocultivation in skimmedmilk was also assessed. In addition, basic safety aspects of thestrains such as production of biogenic amines, haemolyticactivity, and antibiotic susceptibility were addressed. To ourknowledge, this is the first report on the isolation of bacte-riocin-like inhibitory substances from LAB strains isolatedfrom artisanal Sardinian dairy products.
2. Materials and Methods
2.1. Bacterial Strains and Culture Conditions. Bacteriocinproducer and indicator strains used in this study are listedin Table 1. Lactococcus lactis subsp. lactis strains were iden-tified on the basis of their morphological and biochemicalcharacteristics as previously reported [21]; the identificationwas confirmed by PCR analysis using species-specific prim-ers derived from 16S rRNA sequences, according to Pu et al.[22]. They were maintained at −20◦C in M17 broth (Micro-biol, Cagliari, Italy) with 15% (v/v) glycerol (Microbiol) andsubcultured twice as 1% inoculums in M17 broth at 30◦Cfor 24 h prior to experimental use. Listeria monocytogenesATCC 7644, Escherichia coli ATCC 35150, Enterococcusfaecalis ATCC 29212, Staphylococcus aureus ATCC 25923,Lactobacillus plantarum DSMZ 20174, and Lactobacillus sakeisubsp. sakei DSMZ 20017 were used as indicators. All indi-cator strains were stored on nutrient broth (Microbiol) plus20% (v/v) glycerol at −20◦C except LAB strains which weremaintained in MRS broth (Microbiol) with 15% (v/v) glyc-erol. Before use, they were subcultured twice in appropriatemedium.
2.2. Screening of Lactococcus lactis Strains for AntimicrobialCompound Production. A total of 117 L. lactis subsp. lactisstrains, previously isolated from Sardinian dairy productsincluding raw ewes and goat milk, and artisanal ewes andgoat cheeses, were preliminarily screened for antimicrobial
Table 1: Bacteriocinogenic strains of Lactococcus lactis subsp. lactisand indicator bacteria used in this study.
Species Strain Origin
Bacteriocinogenic strains
Lactococcus lactis subsp. lactis 9FS16 Ewes cheese
Lactococcus lactis subsp. lactis 16FS16 Ewes cheese
Lactococcus lactis subsp. lactis 9/20234 Raw ewes milk
Lactococcus lactis subsp. lactis 6LS5 Raw ewes milk
Lactococcus lactis subsp. lactis 3LC39 Raw goat milk
Lactococcus lactis subsp. lactis 1LC18 Raw goat milk
Indicator strains
Listeria monocytogenes 7644 ATCC
Escherichia coli 35150 ATCC
Enterococcus faecalis 29212 ATCC
Staphylococcus aureus 25923 ATCC
Lactobacillus plantarum 20174 DSMZ
Lactobacillus sakei subsp. sakei 20017 DSMZ
compound production against the indicator strains using anagar spot method [23]. Overnight cultures of lactococci werespotted (10 μL) onto the surface of MRS agar (1.2% (w/v)agar—0.2% (w/v) glucose) plates, which were then incubatedanaerobically for 24 h at 37◦C. The indicator strains wereinoculated into 7 mL of soft agar medium (MRS or nutrientbroth containing 0.7% w/v agar) to a final concentrationof approximately 107 CFU/mL. The soft media were pouredon the plates which were incubated for 24 h at the optimalgrowth temperature and atmosphere for the indicatorstrains. Inhibition was scored positive in the presence of adetectable clear zone around the colony of the producerstrain.
2.3. Antimicrobial Activity Assay. The lactococcal strainsexhibiting an inhibitory activity against at least three indica-tor strains, among which are L. monocytogenes ATCC 7644and the bacteriocin-sensitive strain L. sakei subsp. sakeiDSMZ 20017, were further tested for their antimicrobial ac-tivity against L. monocytogenes ATCC 7644 using the well-diffusion method as described by Shillinger and Lucke [23]with some modifications. Briefly, 1% (v/v) aliquot of over-night culture of the indicator strain was inoculated into20 mL of appropriate soft agar medium and poured into Petridishes. After cooling, wells (6 mm diameter) were cut into theagar and filled with 100 μL aliquots of cell-free supernatantof the potential producer strain collected by centrifugation(10000×g, 15 min). In order to eliminate the inhibitoryeffect of lactic acid and/or H2O2, the supernatants were ad-justed to pH 6.5 with 5 M NaOH, treated with catalase(1 mg/mL, Sigma, Milan, Italy), and then filtered through a0.45 μm pore-size cellulose acetate filter (Millipore, BedfordMA, USA) prior to use. The plates were refrigerated for 4 hto allow the radial diffusion of the compounds contained inthe supernatant prior to incubation for 24 h at 37◦C. Theantimicrobial activity was expressed as the diameter of theinhibition zones around the wells. The nisin-positive L. lactis
Journal of Biomedicine and Biotechnology 3
subsp. lactis ATCC 11454 was used as positive control. SterileM17 broth was used as negative control.
Sensitivity to proteolytic enzymes of the cell-free super-natants of bacteriocin producer strains was tested by treat-ment with pronase E, proteinase K, α-chymotrypsin, trypsin,and papain (Sigma). All enzymes (10 mg/mL in sterile dis-tilled water) were filter sterilized and added to supernatantsat a final concentration of 1 mg/mL in phosphate buffer (pH6.5). Following incubation at 37◦C for 2 h, enzymes weredenatured by heating at 100◦C for 5 min. Untreated sampleswere used as controls. The residual activity of enzyme-treated samples against L. monocytogenes ATCC 7644 wasdetermined by the well-diffusion method.
2.4. Antilisterial Activity: Coculture Tests in Skimmed Milk.Bacteriocinogenic L. lactis subsp. lactis strains were separatelycocultured with L. monocytogenes ATCC 7644 in 100 mL of10% reconstituted skimmed milk (RSM; Oxoid, Basingstoke,UK) at 30◦C for 24 h. Bacteriocinogenic strains were inocu-lated at about 5 × 10⁶ CFU/mL, and L. monocytogenes hada final count of 106 CFU/mL. In each experiment, negativecontrol without bacteria, control inoculated with L. monocy-togenes alone, and control inoculated with bacteriocinogenicstrain alone were included. After 0, 5, 10, and 24 h, sampleswere taken, serially diluted in sterile saline solution, andplated onto M17 agar plates for the enumeration of L. lactisand on PALCAM (Microbiol) agar plates for the enumera-tion of L. monocytogenes. Values of pH were also monitoredby using a HI8520 pH meter (P.B.I., Milan, Italy).
2.5. Safety Assessment of Strains. The method of Bover-Cidand Holzapfel [24] was used to screen Lactococcus strains forthe production of biogenic amines. Briefly, the test strainswere subcultured twice at 24 h intervals in M17 brothcontaining 1% of each precursor amino acid: tyrosine di-sodium salt, L−histidine monohydrochloride, L−ornithinemonohydrochloride and lysine monohydrochloride (Sigma),and 0.005% pyridoxal-5-phosphate (Sigma) as a codecar-boxylase factor. All strains were then streaked in duplicateon decarboxylase medium plates each containing only one ofthe above-mentioned amino acids and bromocresol purpleas pH indicator and incubated for 4 days in anaerobic con-ditions at 37◦C. Decarboxylase medium without amino acidswas used as control. A colour change from brown to purple inthe medium indicated an increase in pH and was considereda positive result.
Haemolytic activity was determined by streaking thestrains on Columbia Blood (Microbiol) agar plates supple-mented with 5% defibrinated sheep blood after 48 h ofincubation at 37◦C. The haemolytic reaction was recorded byobservation of a clear zone of hydrolysis around the colonies(β-haemolysis), a partial hydrolysis, and greenish zone (α-haemolysis) or no reaction.
Antibiotic susceptibility testing was carried out by discdiffusion method according to the Clinical and LaboratoryStandards Institute (CLSI) guidelines [25], but Mueller-Hinton agar was replaced by M17 agar. The following antibi-otics (Oxoid or BBL) were tested: ampicillin (AM; 10 μg),vancomycin (VA; 30 μg) (inhibitors of cell wall synthesis),
streptomycin (S; 10 μg), tetracycline (TE; 30 μg), gentamicin(GM; 10 μg), kanamycin (K; 30 μg), erythromycin (E; 15 μg),chloramphenicol (C; 30 μg), clindamycin (CM; 2 μg) (in-hibitors of protein synthesis), ciprofloxacin (CIP; 5 μg), andtrimethoprim/sulphamethoxazole (SXT; 25 μg) (inhibitorsof nucleic acids). A suspension from fresh overnight cultureswith a density of McFarland 0.5 in buffered saline was platedon M17 agar plates; then, antibiotic discs were dispensedonto the plates. After incubation at 37◦C for 24 h in anaerobi-osis, the diameters of the bacterial-free zone were measured,and results were expressed in terms of resistance according tothe interpretative criteria issued by the CLSI [26].
3. Results and Discussion
The antagonistic effect of LAB dairy strains on pathogenicmicroorganisms could be used for expanding the range ofhealthful dairy foods. LAB, originally isolated from raw milkor artisanal dairy products, are probably the best candidatefor improving the microbiological safety of these foods, be-cause they are well adapted to the conditions of the substrate.
In this study a total of 117 Lactococcus lactis subsp. lactisstrains, isolated from artisanal Sardinian dairy products,were preliminarily screened for antimicrobial compoundproduction against six indicator strains, including well-recognized foodborne pathogens, by means of an agar spotmethod (Figure 1). Twenty-eight strains were found to pro-duce an inhibition zone against at least three indicators,among which are Listeria monocytogenes ATCC 7644 and thebacteriocin-sensitive strain Lactobacillus sakei subsp. sakeiDSMZ 20017, and were selected for further investigation.Subsequently, the cell-free supernatants from these strainswere treated with catalase, neutralized, sterilized by filtration,and tested by well-diffusion assay against L. monocytogenesATCC 7644. Six L. lactis subsp. lactis, representing 5% ofthe strain tested, were found to retain antimicrobial activity,showing around the well a measurable clear zone with meanvalues ranging from 2.3 to 3.7 mm (Table 2, control). Thesubstances produced by these strains were neither hydrogenperoxide nor organic acid since the inhibitory activity wasnot affected by catalase and was maintained in neutralizedsupernatants.
Several studies have demonstrated the antagonistic activ-ity of autochthonous cultures isolated from dairy productsagainst L. monocytogenes [27–29]. The occurrence of bacte-riocin-producing Lactococcus strains found in our study islower than previously reported [27, 28]. On the other hand,the frequency of isolation of bacteriocin-producing strainsis variable and could be attributed to differences such as theorigin of the strains, the isolation media and technique usedto detect antibacterial activity, and the diversity of indicatormicroorganisms used for initial screening.
The cell-free supernatants from the six strains producingantimicrobial compounds were assayed for sensitivity toproteolytic enzymes. The antimicrobial substances from allstrains were completely inactivated by treatment with pro-nase E and proteinase K and partially eliminated with α-chymotrypsin. However, no loss of activity was observedwhen the supernatants were treated with trypsin and papain
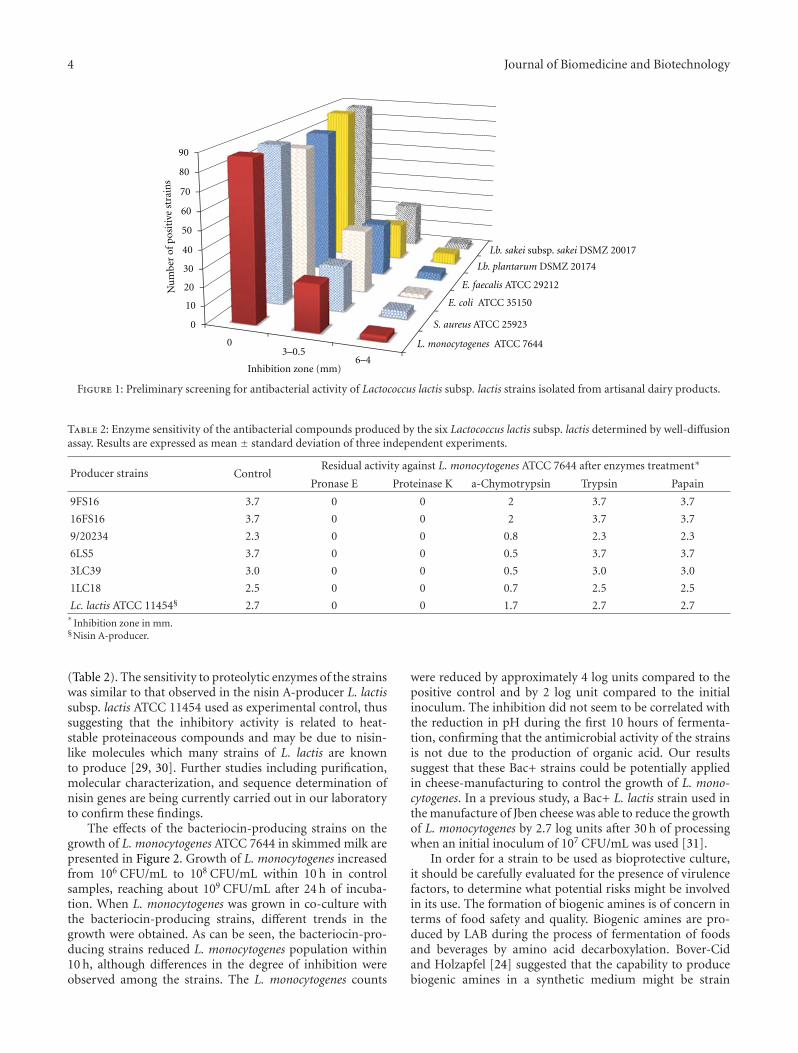
4 Journal of Biomedicine and Biotechnology
L. monocytogenes ATCC 7644
S. aureus ATCC 25923
E. coli ATCC 35150
E. faecalis ATCC 29212
Lb. plantarum DSMZ 20174
Lb. sakei subsp. sakei DSMZ 20017
90
80
70
60
50
40
30
20
10
0
0
Inhibition zone (mm)
3–0.56–4
Nu
mbe
rof
posi
tive
stra
ins
Figure 1: Preliminary screening for antibacterial activity of Lactococcus lactis subsp. lactis strains isolated from artisanal dairy products.
Table 2: Enzyme sensitivity of the antibacterial compounds produced by the six Lactococcus lactis subsp. lactis determined by well-diffusionassay. Results are expressed as mean ± standard deviation of three independent experiments.
Producer strains ControlResidual activity against L. monocytogenes ATCC 7644 after enzymes treatment∗
Pronase E Proteinase K a-Chymotrypsin Trypsin Papain
9FS16 3.7 0 0 2 3.7 3.7
16FS16 3.7 0 0 2 3.7 3.7
9/20234 2.3 0 0 0.8 2.3 2.3
6LS5 3.7 0 0 0.5 3.7 3.7
3LC39 3.0 0 0 0.5 3.0 3.0
1LC18 2.5 0 0 0.7 2.5 2.5
Lc. lactis ATCC 11454§ 2.7 0 0 1.7 2.7 2.7∗
Inhibition zone in mm.§Nisin A-producer.
(Table 2). The sensitivity to proteolytic enzymes of the strainswas similar to that observed in the nisin A-producer L. lactissubsp. lactis ATCC 11454 used as experimental control, thussuggesting that the inhibitory activity is related to heat-stable proteinaceous compounds and may be due to nisin-like molecules which many strains of L. lactis are knownto produce [29, 30]. Further studies including purification,molecular characterization, and sequence determination ofnisin genes are being currently carried out in our laboratoryto confirm these findings.
The effects of the bacteriocin-producing strains on thegrowth of L. monocytogenes ATCC 7644 in skimmed milk arepresented in Figure 2. Growth of L. monocytogenes increasedfrom 106 CFU/mL to 108 CFU/mL within 10 h in controlsamples, reaching about 109 CFU/mL after 24 h of incuba-tion. When L. monocytogenes was grown in co-culture withthe bacteriocin-producing strains, different trends in thegrowth were obtained. As can be seen, the bacteriocin-pro-ducing strains reduced L. monocytogenes population within10 h, although differences in the degree of inhibition wereobserved among the strains. The L. monocytogenes counts
were reduced by approximately 4 log units compared to thepositive control and by 2 log unit compared to the initialinoculum. The inhibition did not seem to be correlated withthe reduction in pH during the first 10 hours of fermenta-tion, confirming that the antimicrobial activity of the strainsis not due to the production of organic acid. Our resultssuggest that these Bac+ strains could be potentially appliedin cheese-manufacturing to control the growth of L. mono-cytogenes. In a previous study, a Bac+ L. lactis strain used inthe manufacture of Jben cheese was able to reduce the growthof L. monocytogenes by 2.7 log units after 30 h of processingwhen an initial inoculum of 107 CFU/mL was used [31].
In order for a strain to be used as bioprotective culture,it should be carefully evaluated for the presence of virulencefactors, to determine what potential risks might be involvedin its use. The formation of biogenic amines is of concern interms of food safety and quality. Biogenic amines are pro-duced by LAB during the process of fermentation of foodsand beverages by amino acid decarboxylation. Bover-Cidand Holzapfel [24] suggested that the capability to producebiogenic amines in a synthetic medium might be strain
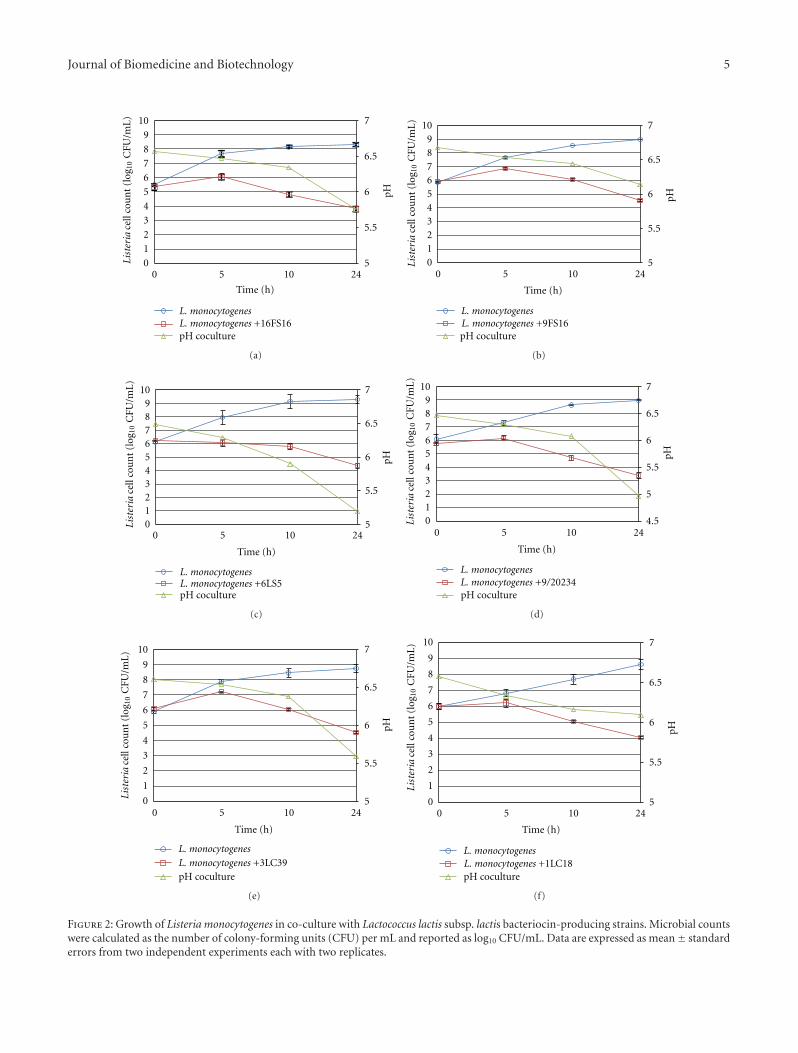
Journal of Biomedicine and Biotechnology 5
L. monocytogenes +16FS16
10
9
8
7
6
5
4
3
2
1
0List
eria
cell
cou
nt
(log
1 0C
FU/m
L) 7
6.5
6
5.5
50 5 10 24
Time (h)
L. monocytogenes
pH
pH coculture
(a)
109876543210Li
ster
iace
llco
un
t(l
og1 0
CFU
/mL) 7
6.5
6
5.5
50 5 10 24
Time (h)
L. monocytogenesL. monocytogenes +9FS16
pH
pH coculture
(b)
109876543210Li
ster
iace
llco
un
t(l
og10
CFU
/mL) 7
6.5
6
5.5
5
pH
0 5 10 24
Time (h)
L. monocytogenesL. monocytogenes +6LS5pH coculture
(c)
7
6.5
6
5.5
5
109876543210
0 5 10 24
pH
Time (h)
L. monocytogenesL. monocytogenes +9/20234
List
eria
cell
cou
nt
(log
10C
FU/m
L)
4.5
pH coculture
(d)
10
9
8
7
6
5
4
3
2
1
0Lis
teri
ace
llco
un
t(l
og1 0
CFU
/mL)
7
6.5
6
5.5
5
pH
0 5 10 24
Time (h)
L. monocytogenesL. monocytogenes +3LC39pH coculture
(e)
10
9
8
7
6
5
4
3
2
1
0
List
eria
cell
cou
nt
(log
10C
FU/m
L)
7
6.5
6
5.5
5
pH
0 5 10 24
Time (h)
L. monocytogenesL. monocytogenes +1LC18pH coculture
(f)
Figure 2: Growth of Listeria monocytogenes in co-culture with Lactococcus lactis subsp. lactis bacteriocin-producing strains. Microbial countswere calculated as the number of colony-forming units (CFU) per mL and reported as log10 CFU/mL. Data are expressed as mean± standarderrors from two independent experiments each with two replicates.
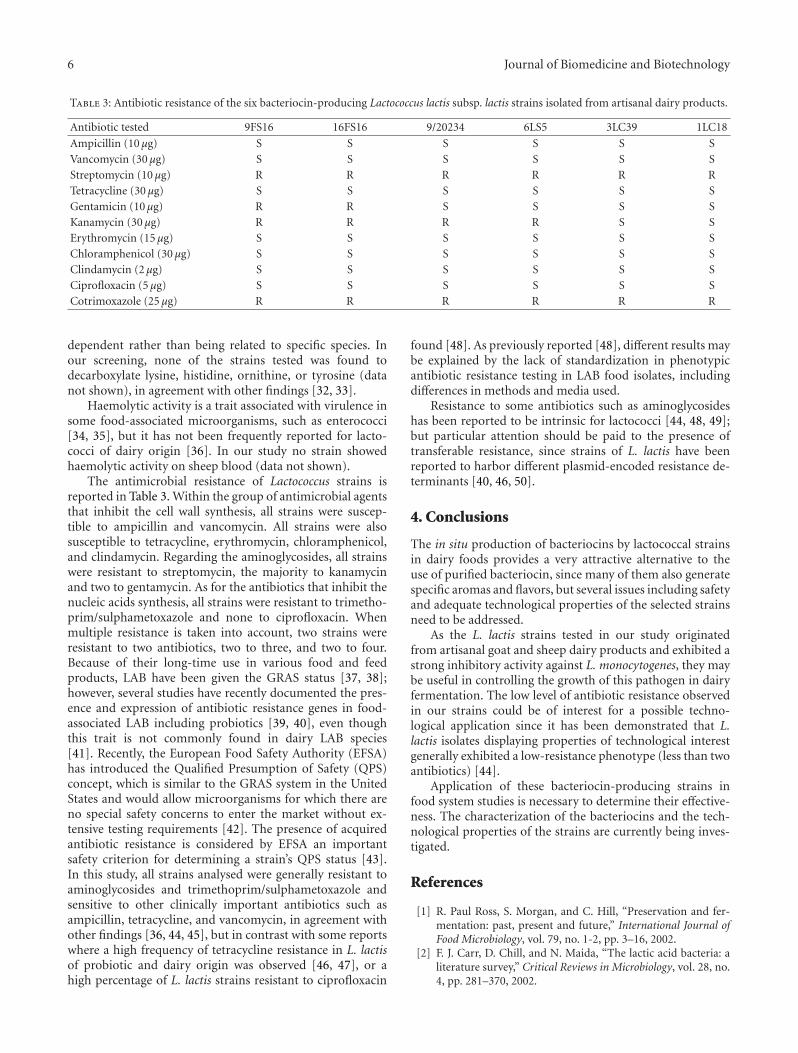
6 Journal of Biomedicine and Biotechnology
Table 3: Antibiotic resistance of the six bacteriocin-producing Lactococcus lactis subsp. lactis strains isolated from artisanal dairy products.
Antibiotic tested 9FS16 16FS16 9/20234 6LS5 3LC39 1LC18
Ampicillin (10 μg) S S S S S SVancomycin (30 μg) S S S S S SStreptomycin (10 μg) R R R R R RTetracycline (30 μg) S S S S S SGentamicin (10 μg) R R S S S SKanamycin (30 μg) R R R R S SErythromycin (15 μg) S S S S S SChloramphenicol (30 μg) S S S S S SClindamycin (2 μg) S S S S S SCiprofloxacin (5 μg) S S S S S SCotrimoxazole (25 μg) R R R R R R
dependent rather than being related to specific species. Inour screening, none of the strains tested was found todecarboxylate lysine, histidine, ornithine, or tyrosine (datanot shown), in agreement with other findings [32, 33].
Haemolytic activity is a trait associated with virulence insome food-associated microorganisms, such as enterococci[34, 35], but it has not been frequently reported for lacto-cocci of dairy origin [36]. In our study no strain showedhaemolytic activity on sheep blood (data not shown).
The antimicrobial resistance of Lactococcus strains isreported in Table 3. Within the group of antimicrobial agentsthat inhibit the cell wall synthesis, all strains were suscep-tible to ampicillin and vancomycin. All strains were alsosusceptible to tetracycline, erythromycin, chloramphenicol,and clindamycin. Regarding the aminoglycosides, all strainswere resistant to streptomycin, the majority to kanamycinand two to gentamycin. As for the antibiotics that inhibit thenucleic acids synthesis, all strains were resistant to trimetho-prim/sulphametoxazole and none to ciprofloxacin. Whenmultiple resistance is taken into account, two strains wereresistant to two antibiotics, two to three, and two to four.Because of their long-time use in various food and feedproducts, LAB have been given the GRAS status [37, 38];however, several studies have recently documented the pres-ence and expression of antibiotic resistance genes in food-associated LAB including probiotics [39, 40], even thoughthis trait is not commonly found in dairy LAB species[41]. Recently, the European Food Safety Authority (EFSA)has introduced the Qualified Presumption of Safety (QPS)concept, which is similar to the GRAS system in the UnitedStates and would allow microorganisms for which there areno special safety concerns to enter the market without ex-tensive testing requirements [42]. The presence of acquiredantibiotic resistance is considered by EFSA an importantsafety criterion for determining a strain’s QPS status [43].In this study, all strains analysed were generally resistant toaminoglycosides and trimethoprim/sulphametoxazole andsensitive to other clinically important antibiotics such asampicillin, tetracycline, and vancomycin, in agreement withother findings [36, 44, 45], but in contrast with some reportswhere a high frequency of tetracycline resistance in L. lactisof probiotic and dairy origin was observed [46, 47], or ahigh percentage of L. lactis strains resistant to ciprofloxacin
found [48]. As previously reported [48], different results maybe explained by the lack of standardization in phenotypicantibiotic resistance testing in LAB food isolates, includingdifferences in methods and media used.
Resistance to some antibiotics such as aminoglycosideshas been reported to be intrinsic for lactococci [44, 48, 49];but particular attention should be paid to the presence oftransferable resistance, since strains of L. lactis have beenreported to harbor different plasmid-encoded resistance de-terminants [40, 46, 50].
4. Conclusions
The in situ production of bacteriocins by lactococcal strainsin dairy foods provides a very attractive alternative to theuse of purified bacteriocin, since many of them also generatespecific aromas and flavors, but several issues including safetyand adequate technological properties of the selected strainsneed to be addressed.
As the L. lactis strains tested in our study originatedfrom artisanal goat and sheep dairy products and exhibited astrong inhibitory activity against L. monocytogenes, they maybe useful in controlling the growth of this pathogen in dairyfermentation. The low level of antibiotic resistance observedin our strains could be of interest for a possible techno-logical application since it has been demonstrated that L.lactis isolates displaying properties of technological interestgenerally exhibited a low-resistance phenotype (less than twoantibiotics) [44].
Application of these bacteriocin-producing strains infood system studies is necessary to determine their effective-ness. The characterization of the bacteriocins and the tech-nological properties of the strains are currently being inves-tigated.
References
[1] R. Paul Ross, S. Morgan, and C. Hill, “Preservation and fer-mentation: past, present and future,” International Journal ofFood Microbiology, vol. 79, no. 1-2, pp. 3–16, 2002.
[2] F. J. Carr, D. Chill, and N. Maida, “The lactic acid bacteria: aliterature survey,” Critical Reviews in Microbiology, vol. 28, no.4, pp. 281–370, 2002.

Journal of Biomedicine and Biotechnology 7
[3] A. Galvez, H. Abriouel, R. L. Lopez, and N. B. Omar, “Bacte-riocin-based strategies for food biopreservation,” InternationalJournal of Food Microbiology, vol. 120, no. 1-2, pp. 51–70, 2007.
[4] W. H. Holzapfel, “Biological preservation of foods with ref-erence to protective cultures, bacteriocins and food-gradeenzymes,” International Journal of Food Microbiology, vol. 24,no. 3, pp. 343–362, 1995.
[5] J. Cleveland, T. J. Montville, I. F. Nes, and M. L. Chikindas,“Bacteriocins: safe, natural antimicrobials for food preserva-tion,” International Journal of Food Microbiology, vol. 71, no. 1,pp. 1–20, 2001.
[6] L. De Vuyst and E. Vandamme, “Antimicrobial potential oflactic acid bacteria,” in Bacteriocins of Lactic Acid Bacteria,L. De Vuyst and E. Vandamme, Eds., pp. 91–142, Blackie,London, UK, 1994.
[7] L. De Vuyst and F. Leroy, “Bacteriocins from lactic acid bacte-ria: production, purification, and food applications,” Journalof Molecular Microbiology and Biotechnology, vol. 13, no. 4, pp.194–199, 2007.
[8] A. Allende, E. Aguayo, and F. Artes, “Microbial and sensoryquality of commercial fresh processed red lettuce throughoutthe production chain and shelf life,” International Journal ofFood Microbiology, vol. 91, no. 2, pp. 109–117, 2004.
[9] M. P. Ryan, M. C. Rea, C. Hill, and R. P. Ross, “An applicationin cheddar cheese manufacture for a strain of Lactococcus lactisproducing a novel broad-spectrum bacteriocin, lacticin 3147,”Applied and Environmental Microbiology, vol. 62, no. 2, pp.612–619, 1996.
[10] M. Gandhi and M. L. Chikindas, “Listeria: a foodbornepathogen that knows how to survive,” International Journal ofFood Microbiology, vol. 113, no. 1, pp. 1–15, 2007.
[11] M. B. Cole, M. V. Jones, and C. Holyoak, “The effect of pH,salt concentration and temperature on the survival and growthof Listeria monocytogenes,” Journal of Applied Bacteriology, vol.69, no. 1, pp. 63–72, 1990.
[12] P. S. Mead, E. F. Dunne, L. Graves et al., “Nationwide outbreakof listeriosis due to contaminated meat,” Epidemiology andInfection, vol. 134, no. 4, pp. 744–751, 2006.
[13] J. McLauchlin, “The pathogenicity of Listeria monocytogenes:a public health perspective,” Reviews in Medical Microbiology,vol. 8, no. 1, pp. 1–14, 1997.
[14] M. Rudolf and S. Scherer, “High incidence of Listeria monocy-togenes in European red smear cheese,” International Journal ofFood Microbiology, vol. 63, no. 1-2, pp. 91–98, 2001.
[15] L. Liu, P. O’Conner, P. D. Cotter, C. Hill, and R. P. Ross,“Controlling Listeria monocytogenes in Cottage cheese throughheterologous production of enterocin a by Lactococcus lactis,”Journal of Applied Microbiology, vol. 104, no. 4, pp. 1059–1066,2008.
[16] J. Samelis, A. Kakouri, K. J. Rogga, I. N. Savvaidis, and M. G.Kontominas, “Nisin treatments to control Listeria mono-cytogenes post-processing contamination on Anthotyros, atraditional Greek whey cheese, stored at 4◦C in vacuumpackages,” Food Microbiology, vol. 20, no. 6, pp. 661–669, 2003.
[17] P. M. Muriana, “Bacteriocins for control of Listeria spp. infood,” Journal of Food Protection, vol. 59, no. 3, pp. 54–63,1996.
[18] Food and Drug Administration, “Nisin preparation: affirma-tion of GRAS status as a direct human food ingredient,” Fed-eral Registry, vol. 53, pp. 11247–11251, 1998.
[19] J. Delves-Broughton, “Nisin and its uses as a food preserva-tive,” Food Technology, vol. 44, pp. 100–117, 1990.
[20] R. Trias, E. Badosa, E. Montesinos, and L. Baneras, “Bio-protective Leuconostoc strains against Listeria monocytogenes
in fresh fruits and vegetables,” International Journal of FoodMicrobiology, vol. 127, no. 1-2, pp. 91–98, 2008.
[21] M. B. Pisano, M. E. Fadda, M. Deplano, A. Corda, and S.Cosentino, “Microbiological and chemical characterization ofFiore Sardo, a traditional Sardinian cheese made from ewe’smilk,” International Journal of Dairy Technology, vol. 59, no. 3,pp. 171–179, 2006.
[22] Z. Y. Pu, M. Dobos, G. K. Y. Limsowtin, and I. B. Powell,“Integrated polymerase chain reaction-based procedures forthe detection and identification of species and subspeciesof the Gram-positive bacterial genus Lactococcus,” Journal ofApplied Microbiology, vol. 93, no. 2, pp. 353–361, 2002.
[23] U. Schillinger and F. K. Lucke, “Antibacterial activity of Lacto-bacillus sake isolated from meat,” Applied and EnvironmentalMicrobiology, vol. 55, no. 8, pp. 1901–1906, 1989.
[24] S. Bover-Cid and W. H. Holzapfel, “Improved screeningprocedure for biogenic amine production by lactic acidbacteria,” International Journal of Food Microbiology, vol. 53,no. 1, pp. 33–41, 1999.
[25] Clinical and Laboratory Standard Institute, Performance Stan-dards for Antimicrobial Disk Susceptibility Tests, ApprovedStandard, Clinical and Laboratory Standard Institute, Wayne,Ill, USA, 10th edition, (CLSI document M02-A10), 2009.
[26] Clinical and Laboratory Standard Institute, PerformanceStandards for Antimicrobial Disk Susceptibility Tests, 12thInformational Supplement, Clinical and Laboratory StandardInstitute, Wayne, Ill, USA, (CLSI document M100-S20), 2010.
[27] M. B. T. Ortolani, P. M. Moraes, L. M. Perin et al., “Molecularidentification of naturally occurring bacteriocinogenic andbacteriocinogenic-like lactic acid bacteria in raw milk and softcheese,” Journal of Dairy Science, vol. 93, no. 7, pp. 2880–2886,2010.
[28] L. A. Nero, M. R. Mattos, V. Beloti, M. A. F. Barros, M. B. T.Ortolani, and B. D. G. M. Franco, “Autochthonous microbiotaof raw milk with antagonistic activity against Listeria monocy-togenes and salmonella enteritidis,” Journal of Food Safety, vol.29, no. 2, pp. 261–270, 2009.
[29] M. J. Coventry, J. B. Gordon, A. Wilcock et al., “Detectionof bacteriocins of lactic acid bacteria isolated from foodsand comparison with pediocin and nisin,” Journal of AppliedMicrobiology, vol. 83, no. 2, pp. 248–258, 1997.
[30] A. Alegrıa, S. Delgado, C. Roces, B. Lopez, and B. Mayo,“Bacteriocins produced by wild Lactococcus lactis strainsisolated from traditional, starter-free cheeses made of rawmilk,” International Journal of Food Microbiology, vol. 143, no.1-2, pp. 61–66, 2010.
[31] N. Benkerroum, H. Oubel, M. Zahar, S. Dlia, and A. Filali-Maltouf, “Isolation of a bacteriocin-producing Lactococcuslactis subsp. lactis and applicatin to control Listeria monocyto-genes in Moroccan jben,” Journal of Applied Microbiology, vol.89, no. 6, pp. 960–968, 2000.
[32] W. M. Deepika Priyadarshani and S. K. Rakshit, “Screeningselected strains of probiotic lactic acid bacteria for theirability to produce biogenic amines (histamine and tyramine),”International Journal of Food Science and Technology, vol. 46,no. 10, pp. 2062–2069, 2011.
[33] S. Novella-Rodrıguez, M. T. Veciana-Nogues, A. X. Roig-Sagues, A. J. Trujillo-Mesa, and M. C. Vidal-Carou, “Influenceof starter and nonstarter on the formation of biogenic aminein goat cheese during ripening,” Journal of Dairy Science, vol.85, no. 10, pp. 2471–2478, 2002.
[34] C. M. A. P. Franz, W. H. Holzapfel, and M. E. Stiles,“Enterococci at the crossroads of food safety?” InternationalJournal of Food Microbiology, vol. 47, no. 1-2, pp. 1–24, 1999.
8 Journal of Biomedicine and Biotechnology
[35] B. D. Jett, M. M. Huycke, and M. S. Gilmore, “Virulence ofEnterococci,” Clinical Microbiology Reviews, vol. 7, no. 4, pp.462–478, 1994.
[36] P. A. Maragkoudakis, K. C. Mountzouris, D. Psyrras et al.,“Functional properties of novel protective lactic acid bacteriaand application in raw chicken meat against Listeria monocyto-genes and Salmonella enteritidis,” International Journal of FoodMicrobiology, vol. 130, no. 3, pp. 219–226, 2009.
[37] S. P. Borriello, W. P. Hammes, W. Holzapfel et al., “Safety ofprobiotics that contain lactobacilli or bifidobacteria,” ClinicalInfectious Diseases, vol. 36, no. 6, pp. 775–780, 2003.
[38] S. Salminen, A. Von Wright, L. Morelli et al., “Demonstrationof safety of probiotics—a review,” International Journal of FoodMicrobiology, vol. 44, no. 1-2, pp. 93–106, 1998.
[39] S. Mathur and R. Singh, “Antibiotic resistance in foodlactic acid bacteria—a review,” International Journal of FoodMicrobiology, vol. 105, no. 3, pp. 281–295, 2005.
[40] V. Perreten, F. Schwarz, L. Cresta, M. Boeglin, G. Dasen, andM. Teuber, “Antibiotic resistance spread in food,” Nature, vol.389, no. 6653, pp. 801–802, 1997.
[41] M. S. Ammor, A. B. Florez, A. H. A. M. Van Hoek et al., “Mo-lecular characterization of intrinsic and acquired antibioticresistance in lactic acid bacteria and bifidobacteria,” Journalof Molecular Microbiology and Biotechnology, vol. 14, no. 1–3,pp. 6–15, 2008.
[42] European Food Safety Authority, “EFSA Scientific ColloquiumSummary Report. QPS: qualified presumption of safety ofmicroorganisms in food and feed,” Tech. Rep., European FoodSafety Authority, Brussels, Belgium, 2004.
[43] European Food Safety Authority, “The maintenance of the listof QPS microorganisms intentionally added to food or feed,”European Food Safety Authority Journal, vol. 923, pp. 1–48,2008.
[44] P. Rodrıguez-Alonso, C. Fernandez-Otero, J. A. Centeno, andJ. I. Garabal, “Antibiotic resistance in lactic acid bacteria andmicrococcaceae/ staphylococcaceae isolates from artisanal rawmilk cheeses, and potential implications on cheese making,”Journal of Food Science, vol. 74, no. 6, pp. M284–M293, 2009.
[45] C. Liu, Z. Y. Zhang, K. Dong, J. P. Yuan, and X. K. Guo,“Antibiotic resistance of probiotic strains of lactic acid bacteriaisolated from marketed foods and drugs,” Biomedical andEnvironmental Sciences, vol. 22, no. 5, pp. 401–412, 2009.
[46] C. Devirgiliis, S. Barile, A. Caravelli, D. Coppola, and G.Perozzi, “Identification of tetracycline- and erythromycin-resistant Gram-positive cocci within the fermenting micro-flora of an Italian dairy food product,” Journal of AppliedMicrobiology, vol. 109, no. 1, pp. 313–323, 2010.
[47] R. Temmerman, B. Pot, G. Huys, and J. Swings, “Identificationand antibiotic susceptibility of bacterial isolates from probioticproducts,” International Journal of Food Microbiology, vol. 81,no. 1, pp. 1–10, 2003.
[48] A. S. Hummel, C. Hertel, W. H. Holzapfel, and C. M. A. P.Franz, “Antibiotic resistances of starter and probiotic strains oflactic acid bacteria,” Applied and Environmental Microbiology,vol. 73, no. 3, pp. 730–739, 2007.
[49] M. S. Ammor, A. Belen Florez, and B. Mayo, “Antibiotic re-sistance in non-enterococcal lactic acid bacteria and bifidobac-teria,” Food Microbiology, vol. 24, no. 6, pp. 559–570, 2007.
[50] A. B. Florez, M. S. Ammor, and B. Mayo, “Identificationof tet(M) in two Lactococcus lactis strains isolated from aSpanish traditional starter-free cheese made of raw milk andconjugative transfer of tetracycline resistance to lactococci andenterococci,” International Journal of Food Microbiology, vol.121, no. 2, pp. 189–194, 2008.


