35
(Principles, Study Design, Quality Assurance and Quality Control) Susan M. Pinney, PhD Department of Environmental Health University of Cincinnati [email protected] BIOSMONITORING
(Principles, Study Design, Quality Assurance and Quality Control)
Susan M. Pinney, PhDDepartment of Environmental Health
University of Cincinnati
BIOSMONITORING

BiomonitoringPresentation Outline
A. General information about biomarkers.A biomarker is a chemical measure used to detect genetic, cellular or molecular alterations.
B. Collecting, processing and storing biomarkersC. Quality Assurance and Quality Control
Not Discussing: Specific information about specific environmental biomarkers.
• An environmental biomarker is a measure of an environmental chemical or its metabolite in biomedia. Represents internal exposure to the chemical.
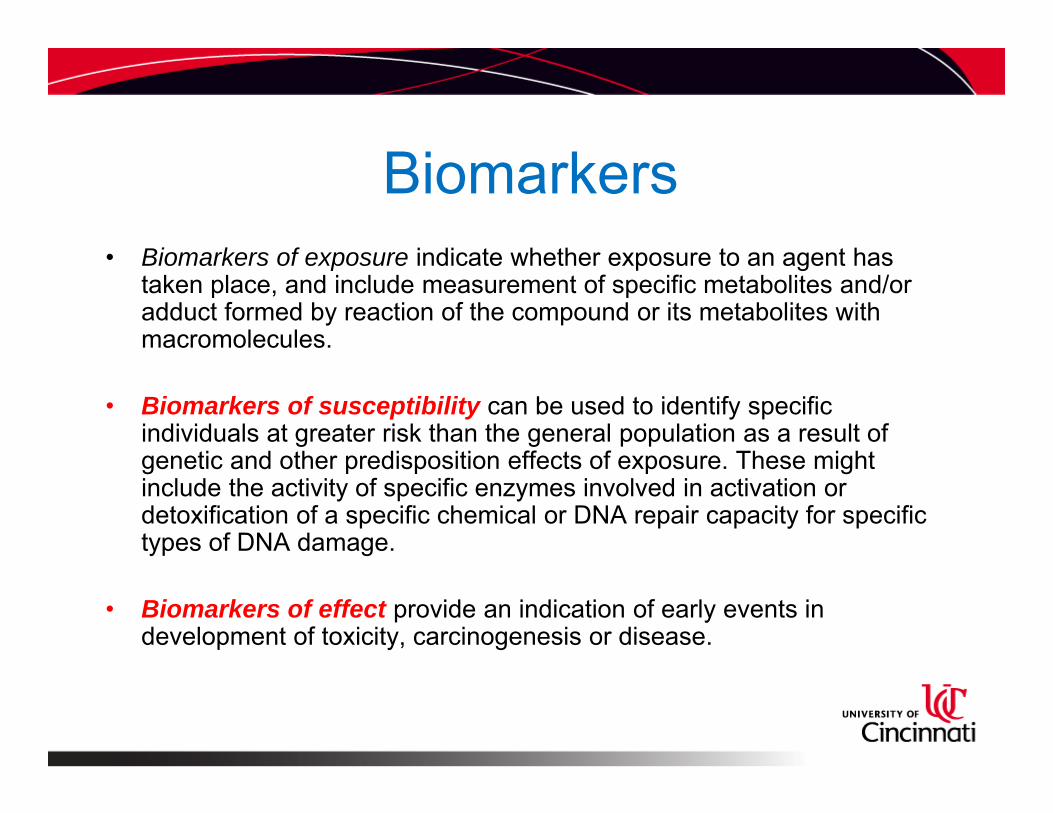
Biomarkers• Biomarkers of exposure indicate whether exposure to an agent has
taken place, and include measurement of specific metabolites and/or adduct formed by reaction of the compound or its metabolites with macromolecules.
• Biomarkers of susceptibility can be used to identify specific individuals at greater risk than the general population as a result of genetic and other predisposition effects of exposure. These might include the activity of specific enzymes involved in activation or detoxification of a specific chemical or DNA repair capacity for specific types of DNA damage.
• Biomarkers of effect provide an indication of early events in development of toxicity, carcinogenesis or disease.
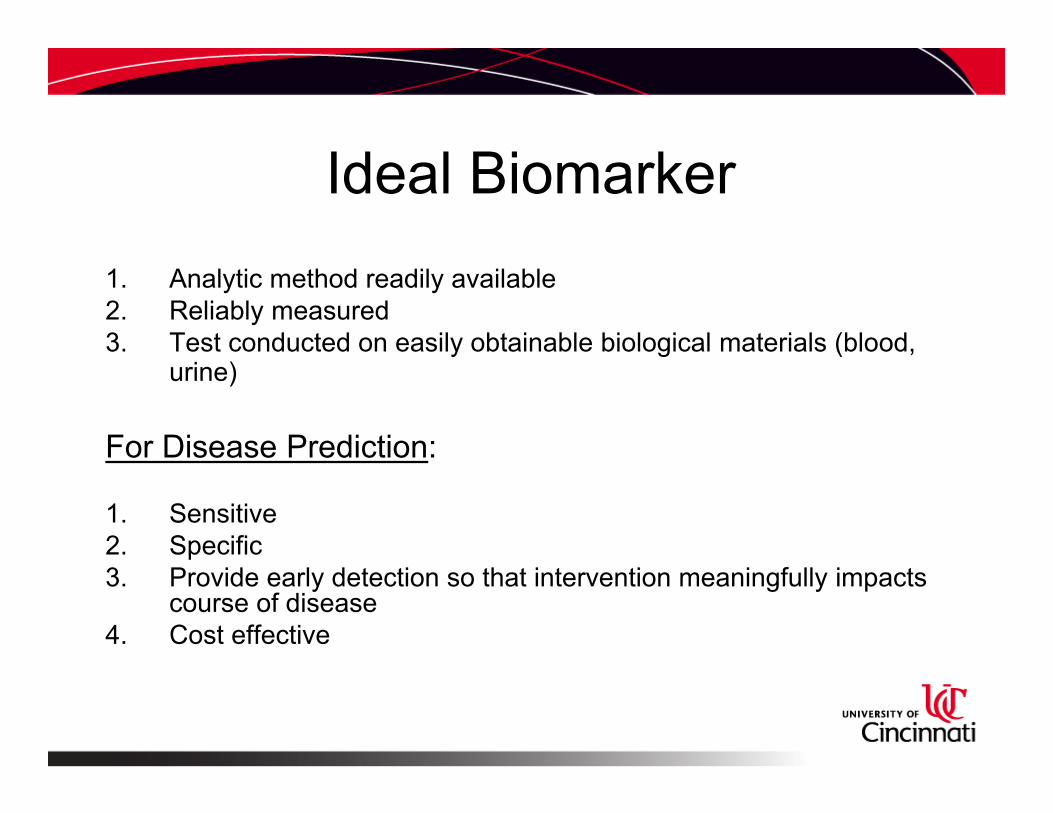
Ideal Biomarker1. Analytic method readily available 2. Reliably measured3. Test conducted on easily obtainable biological materials (blood,
urine)
For Disease Prediction:
1. Sensitive2. Specific3. Provide early detection so that intervention meaningfully impacts
course of disease4. Cost effective

Decisions, decisions…..Choices vary by biomedia and what you want to
measure.
• Collection– Sample type– Timing of collection
• Processing– Additives – Laboratory selection– Delayed processing
• Storage– Liquid nitrogen– Mechanical freezers
• Carefully selecting the biomarker and methods of your study minimizes mistakes and maximizes the information from your study!

Figure source: Human Biomonitoring for Environmental Chemicals. www.nap.edu/catalog/11700.html.
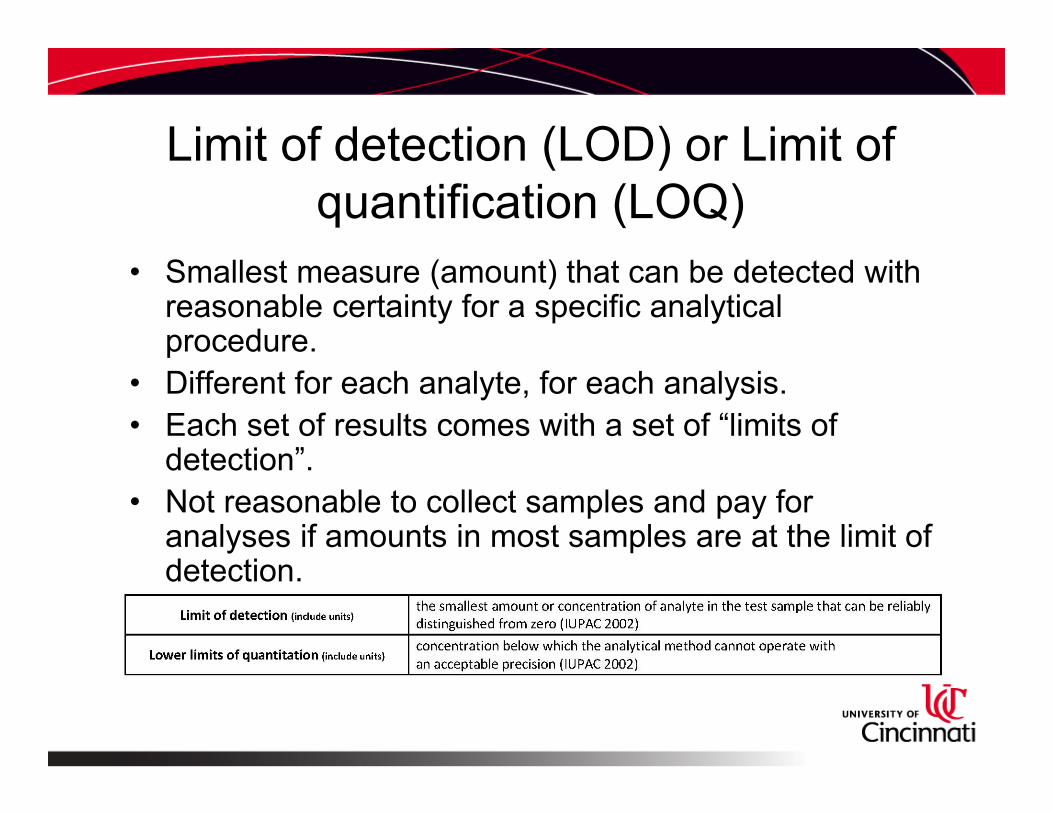
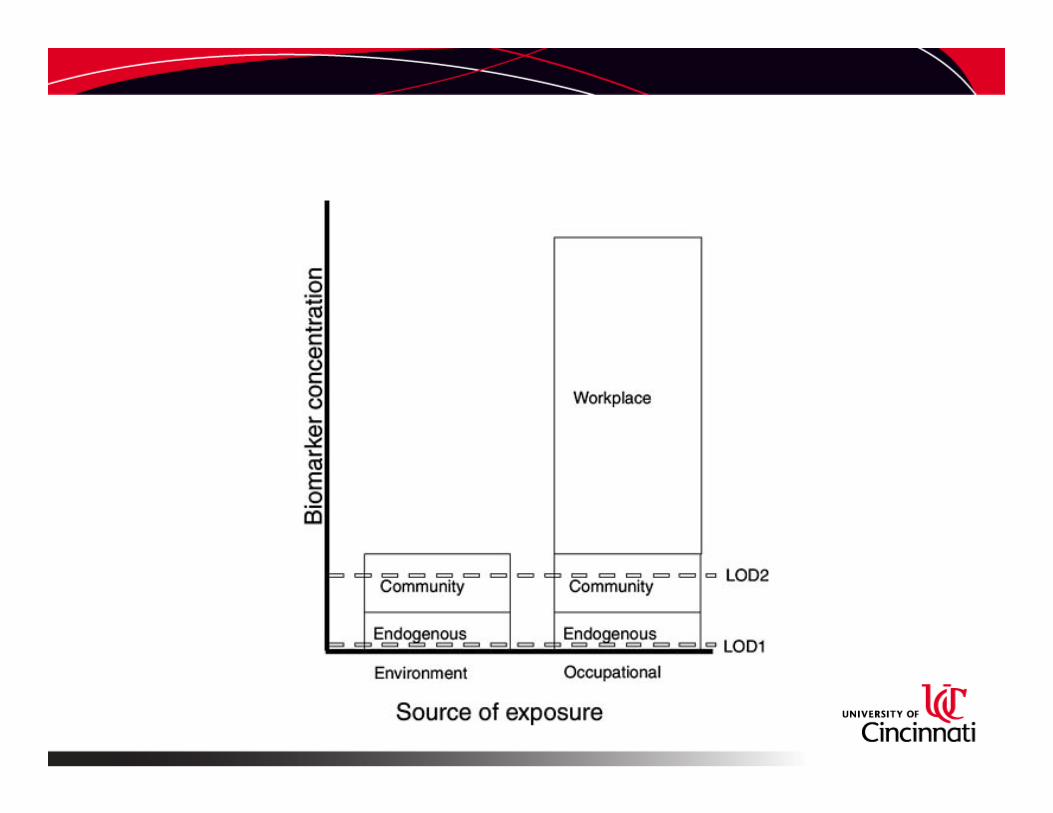
Limit of detection (LOD) or Limit of quantification (LOQ)
• Smallest measure (amount) that can be detected with reasonable certainty for a specific analytical procedure.
• Different for each analyte, for each analysis.• Each set of results comes with a set of “limits of
detection”.• Not reasonable to collect samples and pay for
analyses if amounts in most samples are at the limit of detection.
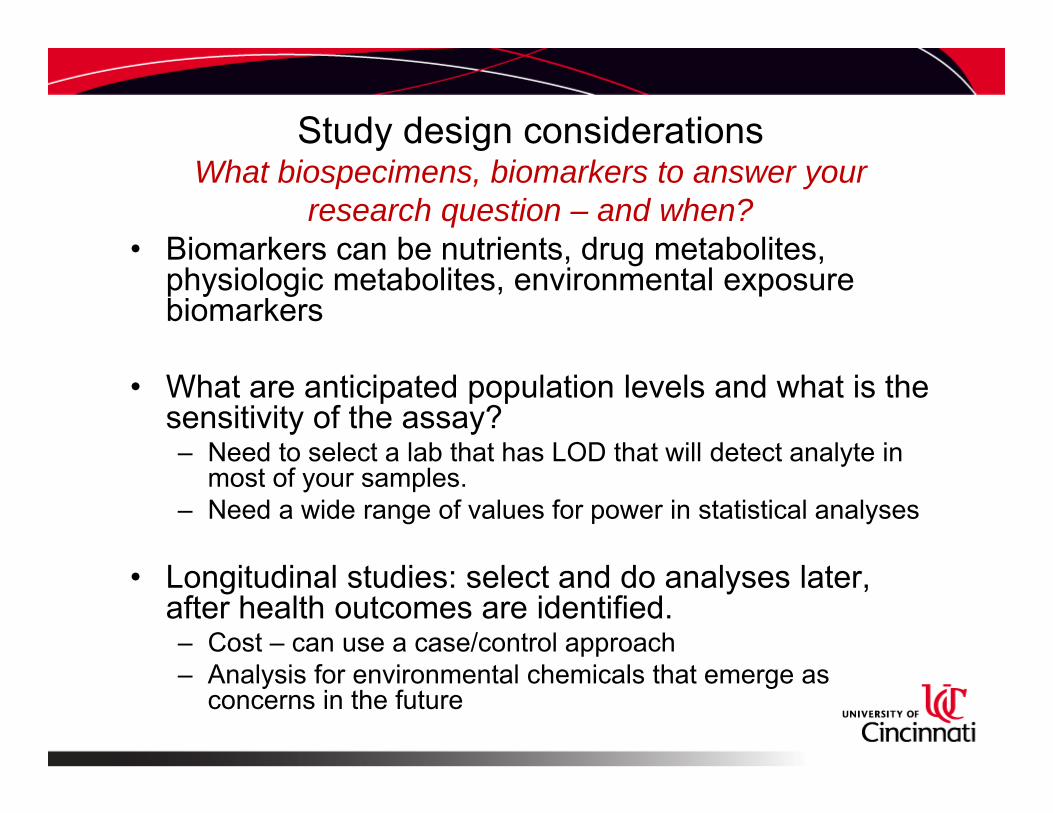
Study design considerationsWhat biospecimens, biomarkers to answer your
research question – and when?• Biomarkers can be nutrients, drug metabolites,
physiologic metabolites, environmental exposure biomarkers
• What are anticipated population levels and what is the sensitivity of the assay?– Need to select a lab that has LOD that will detect analyte in
most of your samples.– Need a wide range of values for power in statistical analyses
• Longitudinal studies: select and do analyses later, after health outcomes are identified.– Cost – can use a case/control approach– Analysis for environmental chemicals that emerge as
concerns in the future
Consent for biospecimen collection and analysis
• Consent should be as general as possible but still inform human subjects of the use of their biospecimens in research.– Study chemicals in the environment and their effects on your
health– Study variations in genetic material among study participants
and their effects on health.– If your study design includes reporting back individual results,
consent should provide opportunity to elect to receive or not receive individual results.
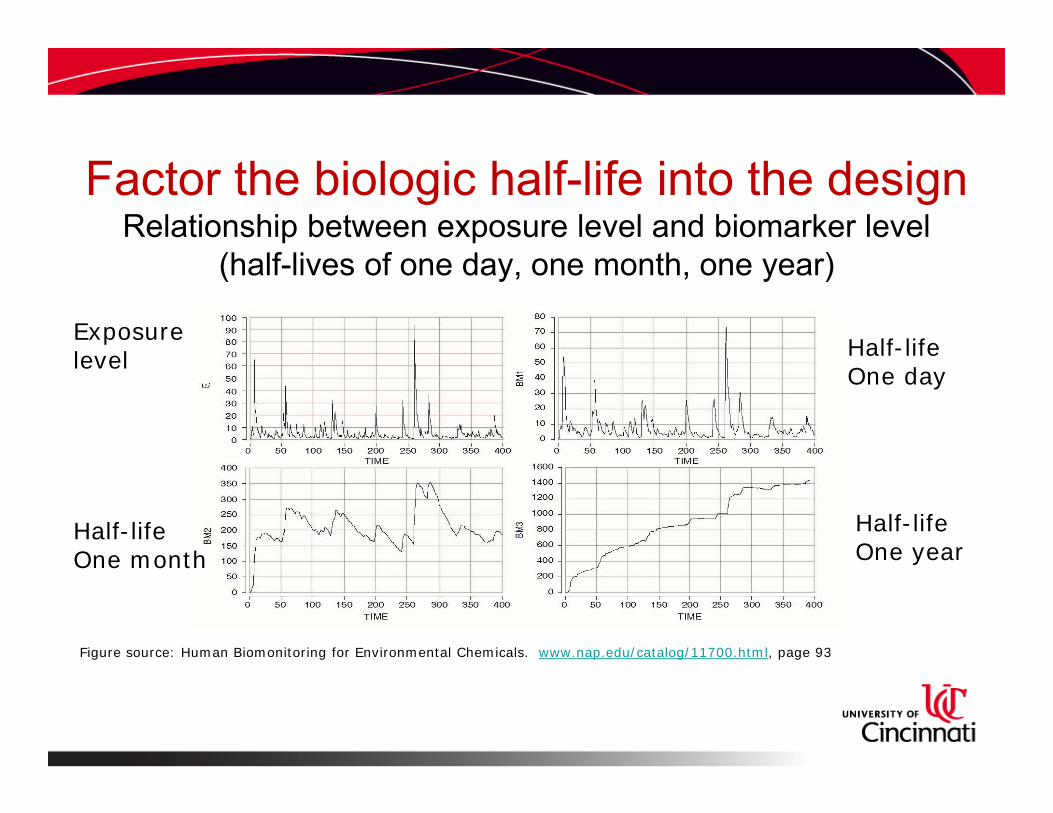
Factor the biologic half-life into the designRelationship between exposure level and biomarker level
(half-lives of one day, one month, one year)
Figure source: Human Biomonitoring for Environmental Chemicals. www.nap.edu/catalog/11700.html, page 93
Exposurelevel
Half-life One month
Half-lifeOne year
Half-life One day
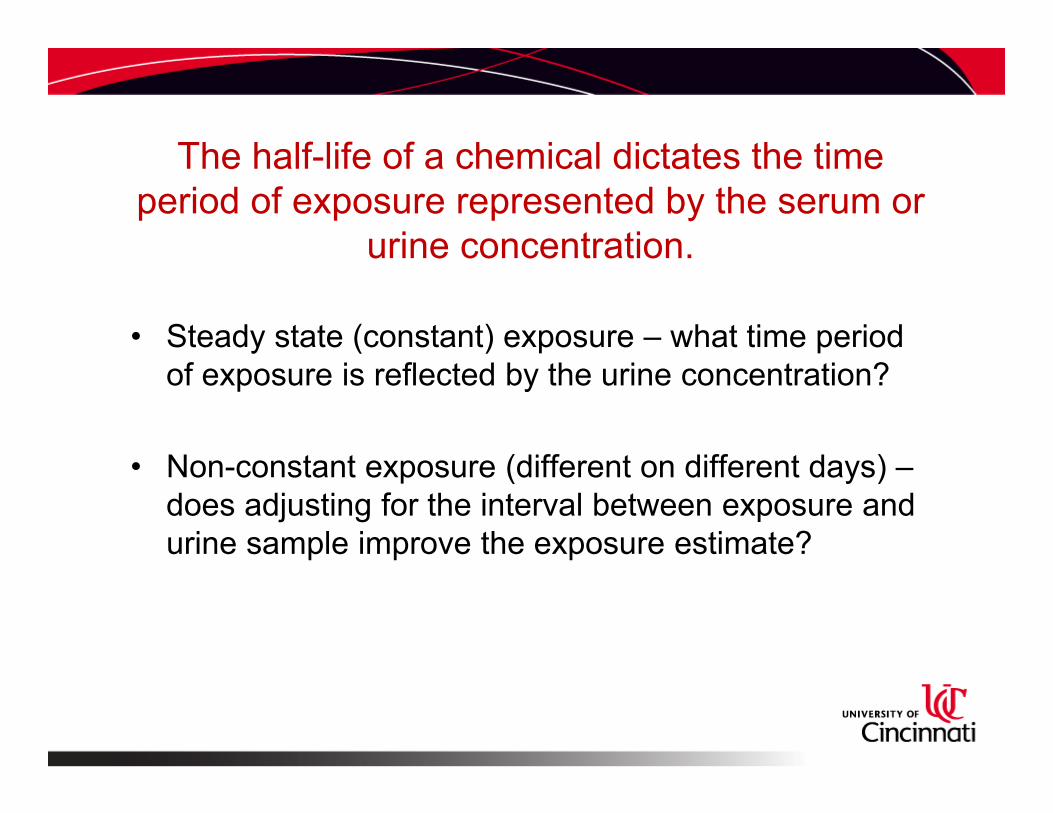
The half-life of a chemical dictates the time period of exposure represented by the serum or
urine concentration.
• Steady state (constant) exposure – what time period of exposure is reflected by the urine concentration?
• Non-constant exposure (different on different days) –does adjusting for the interval between exposure and urine sample improve the exposure estimate?
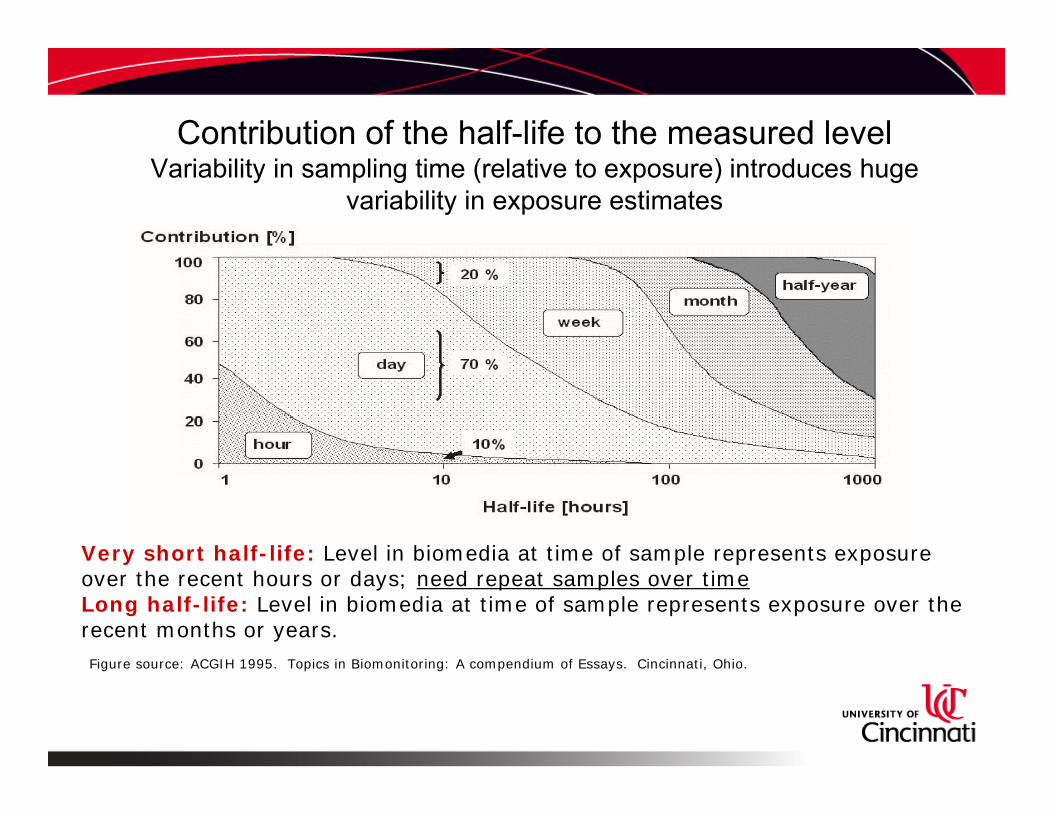
Contribution of the half-life to the measured levelVariability in sampling time (relative to exposure) introduces huge
variability in exposure estimates
Very short half-life: Level in biomedia at time of sample represents exposure over the recent hours or days; need repeat samples over timeLong half-life: Level in biomedia at time of sample represents exposure over the recent months or years. Figure source: ACGIH 1995. Topics in Biomonitoring: A compendium of Essays. Cincinnati, Ohio.

Sample collection:Examples of factors to consider
• Sex Hormones
• Similar whether collected in serum, EDTA plasma or heparinized plasma
• Timing difficult in pre-menopausal women– Collect at early follicular and
mid-luteal with postcard with date of menstrual period
– Collect any day and provide specific dates of their cycle
– Circadian rhythm for dehydroepiandrosterone (DHEAS), so time of day of blood collection
• Ascorbic Acid and Carotenoids
• Can be measured in either serum or plasma and not affected by anticoagulant use.
• Carotene and retinol have substantial seasonal variations. Control in design or in analysis
• Benzophenone-3• Great seasonal variation
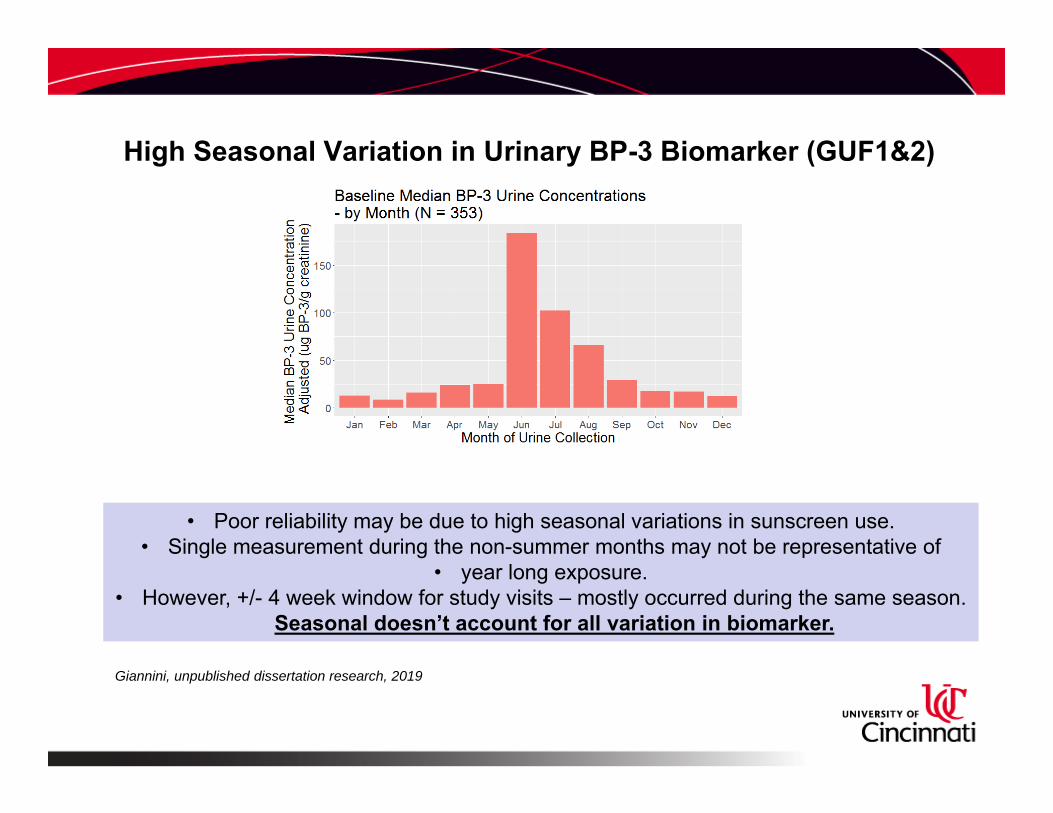
High Seasonal Variation in Urinary BP-3 Biomarker (GUF1&2)
• Poor reliability may be due to high seasonal variations in sunscreen use. • Single measurement during the non-summer months may not be representative of
• year long exposure.• However, +/- 4 week window for study visits – mostly occurred during the same season.
Seasonal doesn’t account for all variation in biomarker.
Giannini, unpublished dissertation research, 2019
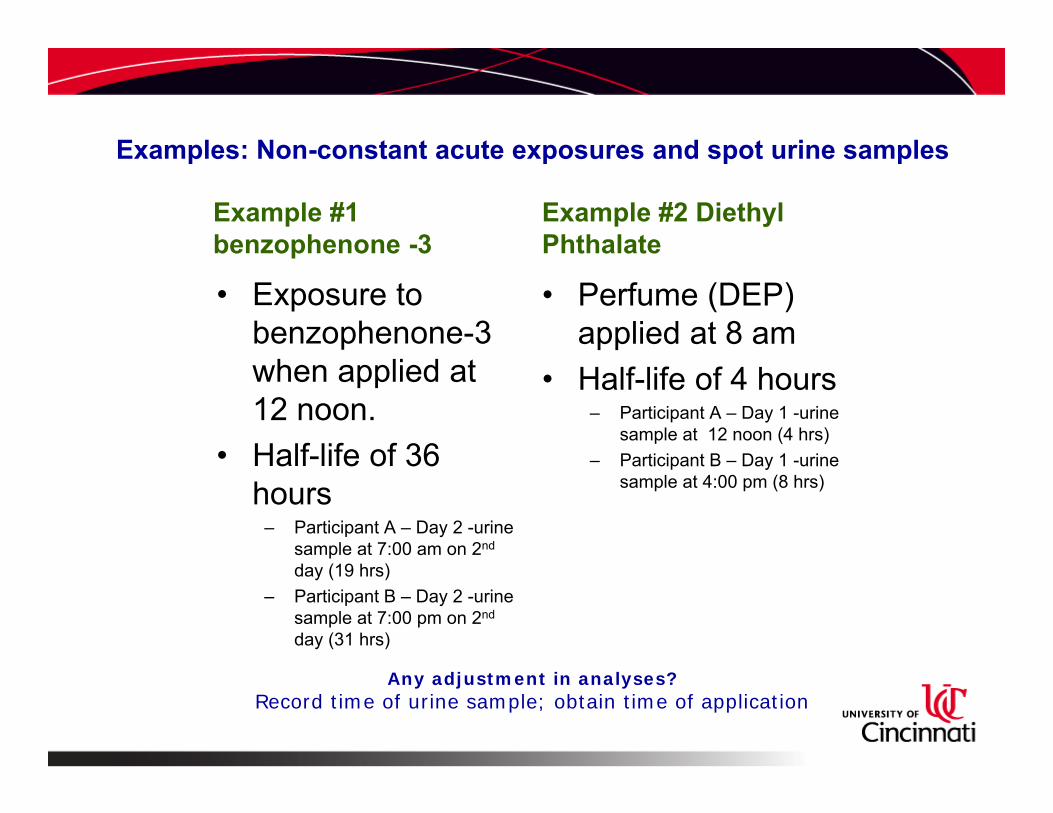
Examples: Non-constant acute exposures and spot urine samples
Example #1 benzophenone -3
• Exposure to benzophenone-3 when applied at 12 noon.
• Half-life of 36 hours
– Participant A – Day 2 -urine sample at 7:00 am on 2nd
day (19 hrs)– Participant B – Day 2 -urine
sample at 7:00 pm on 2nd
day (31 hrs)
Example #2 Diethyl Phthalate
• Perfume (DEP) applied at 8 am
• Half-life of 4 hours– Participant A – Day 1 -urine
sample at 12 noon (4 hrs)– Participant B – Day 1 -urine
sample at 4:00 pm (8 hrs)
Any adjustment in analyses?Record time of urine sample; obtain time of application

Sample collection, cont.• Inflammatory markers
• Most studies suggest that EDTA plasma is optimal
• Little is known about the best time for collecting inflammatory biomarkers – might be more prevalent later in day.
• Standardize time of data collection, such as for first morning sample.
• Proteomics
• Serum samples may not be best for proteomic studies because
– large number of serum-specific clot-related peptides produced.
– can account for 40% of all peptide peaks in assays.
– Anticoagulated plasma works better.
• Fasting, time of day and medication use may all affect the measurement of proteomes.

Laboratory selection• Experience; publications• Willing to provide methodology in detail; published methodology
• COV for the method; do they have COV for each batch?• Method that is sufficiently sensitive to detect the levels of the
biomarker you expect (LOD and LOQ).
• Reasonable turn-around time
• CLIA certification – necessary if you want to return any results to study participants.
• If not CLIA, what are their QA/QC procedures?

Sample Processing• Processing should be:
– Rigorous– Standardized (clear protocols, for both study
coordinators and lab personnel)
• Alternate strategies– Plan for delayed processing – always happens in
epidemiology studies.

Processing• Sex hormones
• Delayed processing up to 72 hours does not seem to affect concentrations
• Sample should be aliquotted into airtight tubes to prevent degredation with long term freezing.
• Ascorbic Acid and Carotenoids
• Carotenoids stable up to 1 week if blood kept chilled; at room temp can degrade.
• Delay of >24 hours may degrade ascorbic acid levels even if samples are chilled.
• May want to add an acid stabilizer such as metaphosphoric acid.
• Oxidative damage with exposure to light, heat or oxygen (for either).

Processing, cont.• Inflammatory markers
• Samples kept refrigerated while processing
• Can degrade or increase at room temp
• Both interleukin-6 and tumor necrosis factor-ά degrade after 4-6 hours at room temp.
• Proteomics
• Need to be processed immediately if at room temp.– (Cool temps can activate
platelets and release peptides into the sample)
• May want to make the sample platelet poor by additional centrifuging or filtering.
• Add protease inhibitor to reduce cleavage of proteins– Care in analyzing results:
Molecular mass of protease inhibitors can overlap those of the proteome.
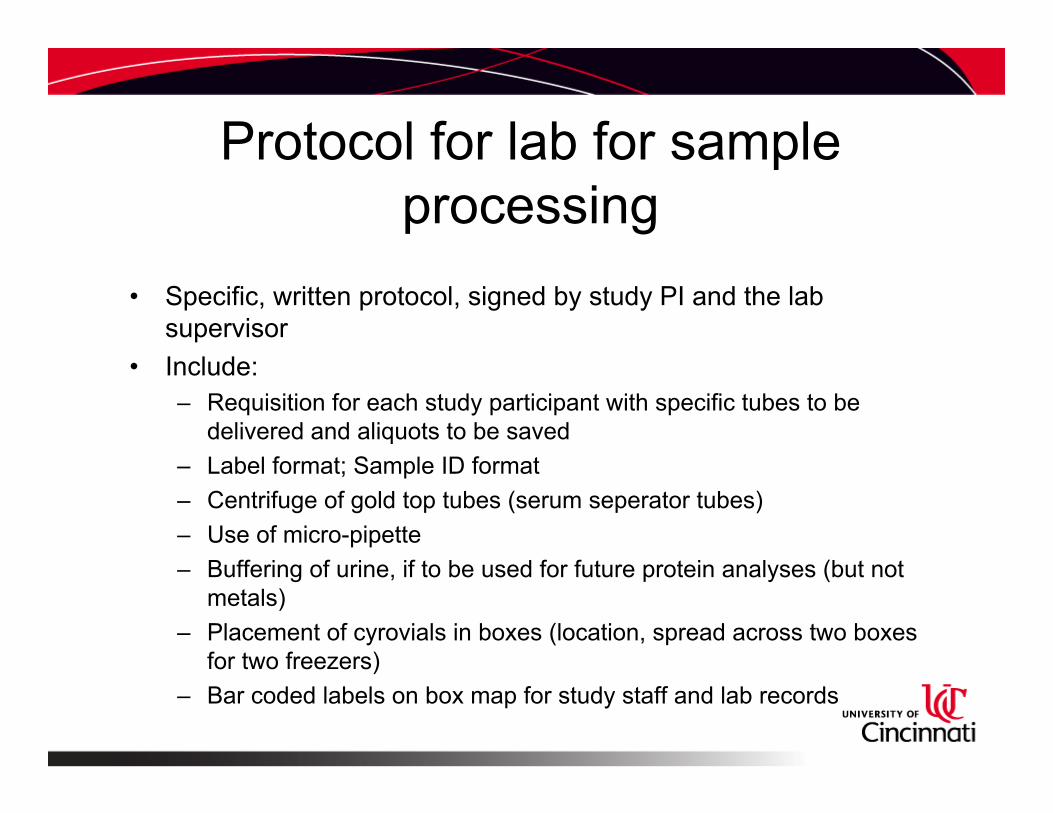
Protocol for lab for sample processing
• Specific, written protocol, signed by study PI and the lab supervisor
• Include:– Requisition for each study participant with specific tubes to be
delivered and aliquots to be saved– Label format; Sample ID format– Centrifuge of gold top tubes (serum seperator tubes)– Use of micro-pipette– Buffering of urine, if to be used for future protein analyses (but not
metals)– Placement of cyrovials in boxes (location, spread across two boxes
for two freezers)– Bar coded labels on box map for study staff and lab records

Special sample collection procedures and precautions
• For metals analyses, use metal free phlebotomy tubes and cryovials
• Draw any blood sample for metals analysis first.
• If you use a syringe for blood draw, use new needle for transferring to vacutainer tubes; transfer to purple top tube first (for metals).
• Collection log – record as samples are collected. Include bar code label on log. (Redundancy always good.)
• Use new pipette for each serum transfer for a person (avoid contamination with red cells).
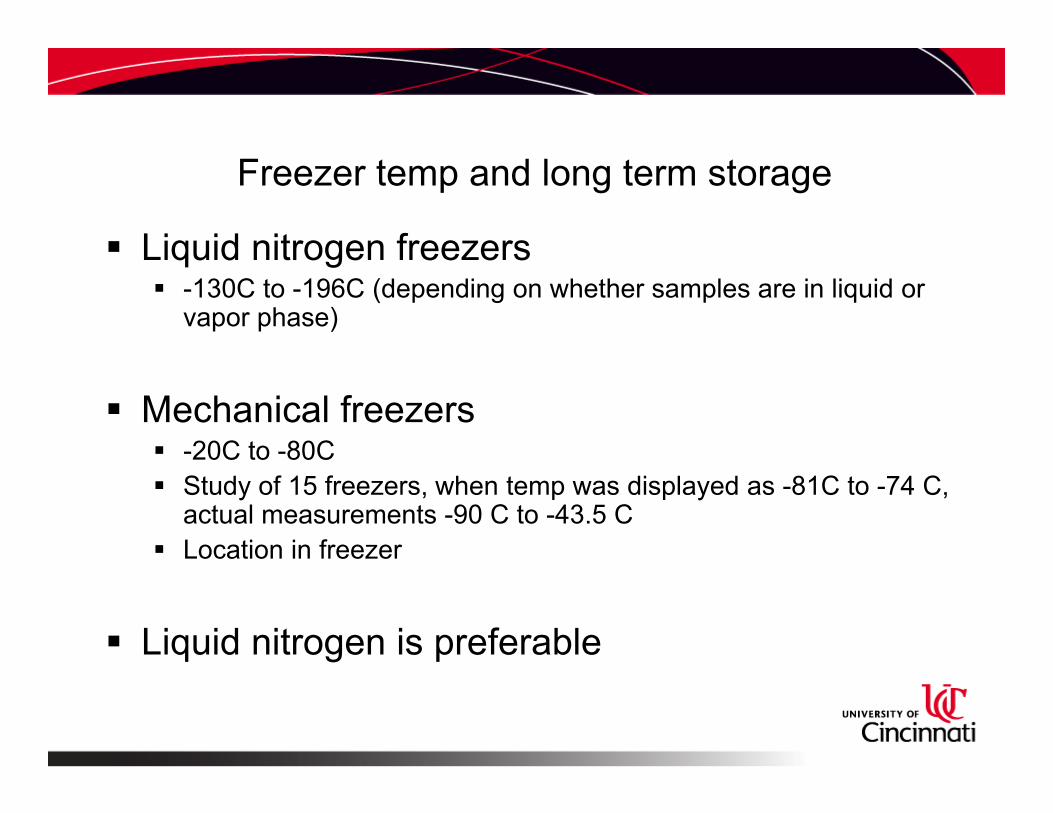
Freezer temp and long term storage
Liquid nitrogen freezers -130C to -196C (depending on whether samples are in liquid or
vapor phase)
Mechanical freezers -20C to -80C Study of 15 freezers, when temp was displayed as -81C to -74 C,
actual measurements -90 C to -43.5 C Location in freezer
Liquid nitrogen is preferable

Freezer temp and long term storage• Sex Hormones• Store at -80C
• If stored at -20C, sex hormone binding globulin may disassociate from estradiol and testosterone.
• Increases measureable non-bound concentrations of these hormones.
• Ascorbic Acid and Carotenoids
• Substantial decreases in carotenoid levels can occurred at -20C for only 6 months; 97% decrease over 10 years.
• Stable for up to 10 years at -80C.
• Long term storage of ascorbic acid requires an acid stabilizer.
• Can assay after two or fewer freeze-thaw cycles
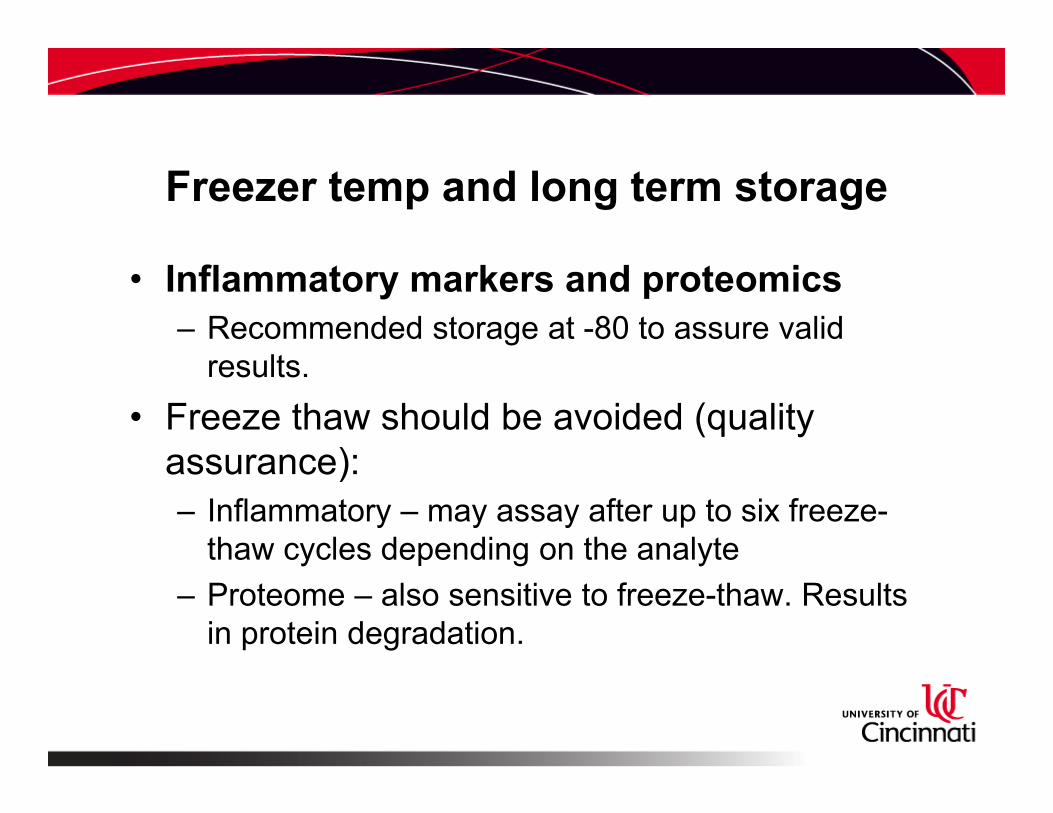
Freezer temp and long term storage
• Inflammatory markers and proteomics– Recommended storage at -80 to assure valid
results.• Freeze thaw should be avoided (quality
assurance):– Inflammatory – may assay after up to six freeze-
thaw cycles depending on the analyte– Proteome – also sensitive to freeze-thaw. Results
in protein degradation.
Quality Control of Biospecimens and Inventory
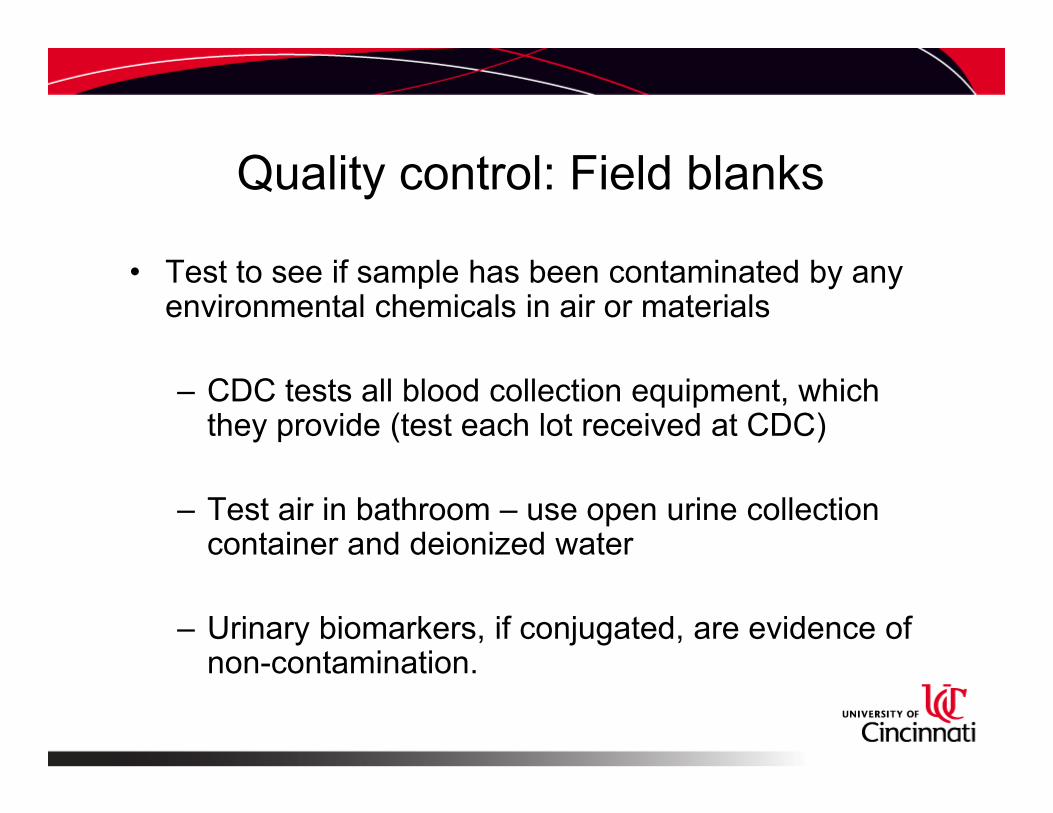
Quality control: Field blanks
• Test to see if sample has been contaminated by any environmental chemicals in air or materials
– CDC tests all blood collection equipment, which they provide (test each lot received at CDC)
– Test air in bathroom – use open urine collection container and deionized water
– Urinary biomarkers, if conjugated, are evidence of non-contamination.
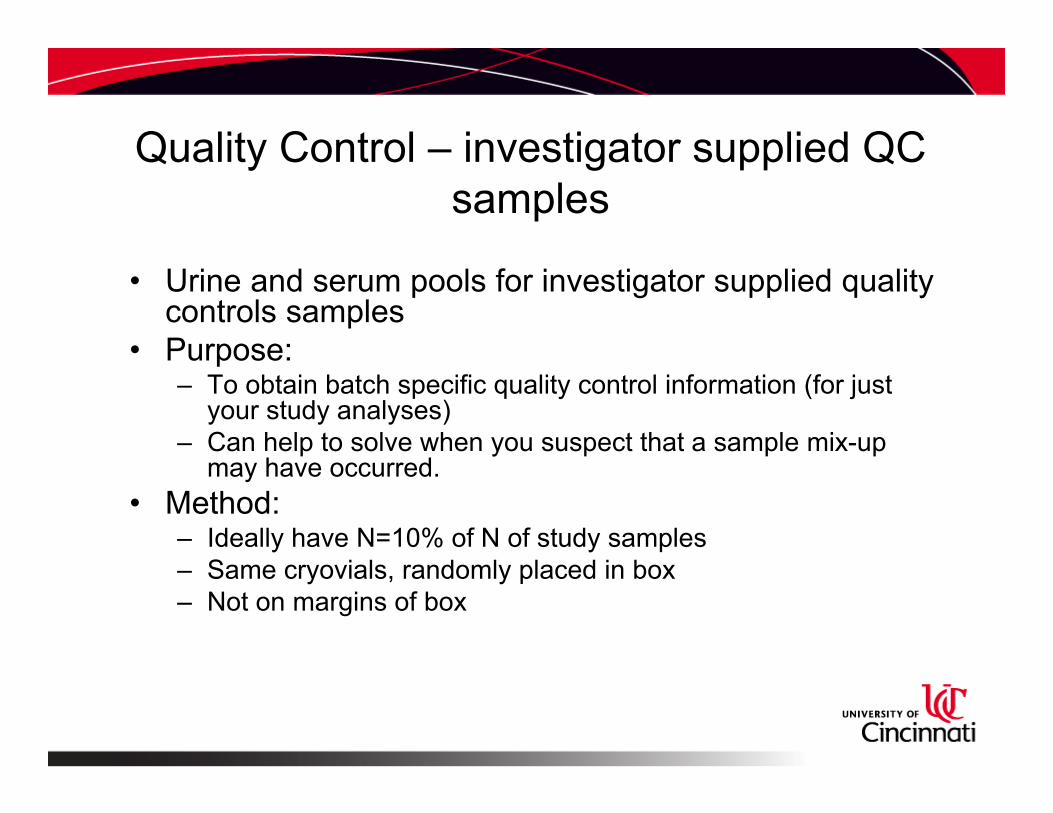
Quality Control – investigator supplied QC samples
• Urine and serum pools for investigator supplied quality controls samples
• Purpose:– To obtain batch specific quality control information (for just
your study analyses)– Can help to solve when you suspect that a sample mix-up
may have occurred.• Method:
– Ideally have N=10% of N of study samples– Same cryovials, randomly placed in box– Not on margins of box
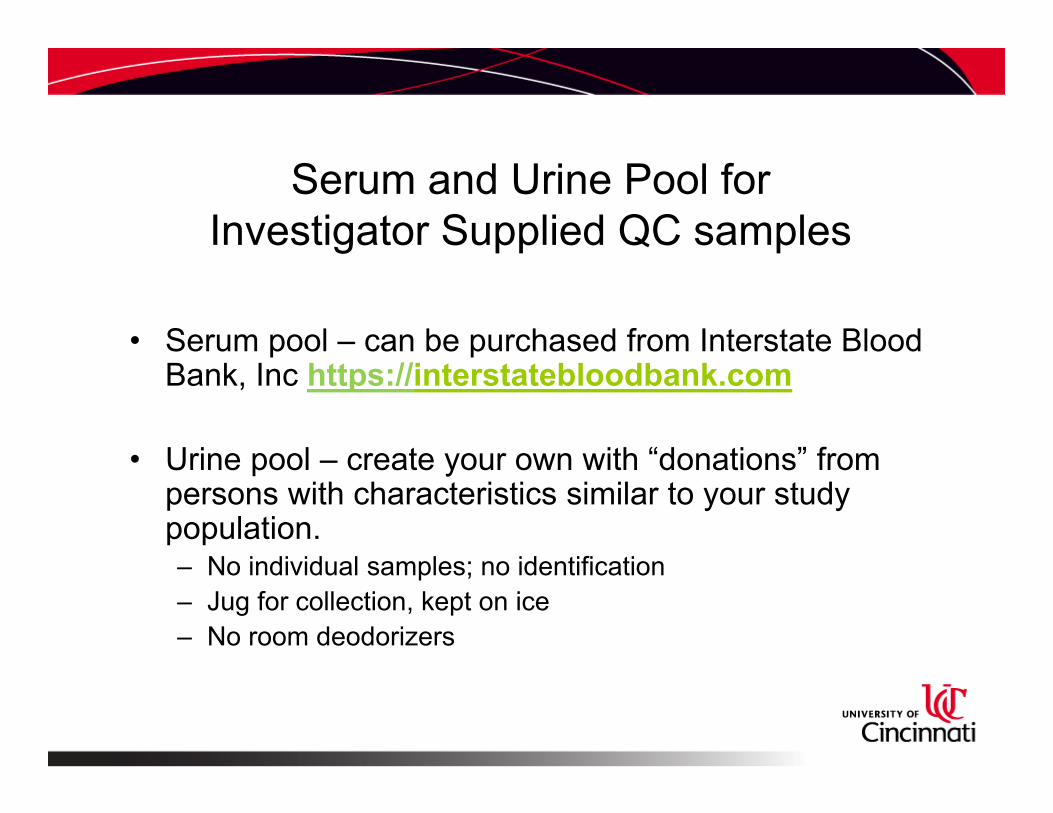
Serum and Urine Pool for Investigator Supplied QC samples
• Serum pool – can be purchased from Interstate Blood Bank, Inc https://interstatebloodbank.com
• Urine pool – create your own with “donations” from persons with characteristics similar to your study population.– No individual samples; no identification– Jug for collection, kept on ice– No room deodorizers

Quality Control: Measure analytes in serum and urine
Compare values with clinical labs at time of sample collection
(10/2016)
• Urine creatinine– 20 samples– Pearson R– 0.953, p=0.0001
• Serum– 20 samples– Serum albumin and ALT– Increased concentration– Spearman Correlation– p=0.0002 and 0.0006

HD 67753
DD 67839
KC 66257
EC 64635
BB 60411
AB 60246
FB 61271
GD 67727
BB 60281
ED 67523
Sample ID
HD 67753DD 67839KC 66257EC 64635BB 60411AB 60246FB 61271GD 67727BB 60281ED 67523
Concentration (ng/ul)17.6615.5314.1416.2227.9113.3120.3510.3125.0511.95
Total amount (ug in 100ul blood)
3.53.12.83.25.62.74.12.15.02.4
DNA extracted from Pinney’s 10 blood samples
• 100 ul blood used• No RNA contamination• No genomic DNA degradation

Chemokines
Lessons learned…….• Carefully research the biomarker you are considering.• Hourly and daily variability • Half-life and contributions of past time • Optimal biomedia for measurement• Use of anticoagulants or stabilizers at collection or
processing• Chemical stability at room temperature• Temperature storage requirements• Tolerable number of freeze-thaw cycles (volume of sample
aliquots)• Laboratory assay and limit of detection• Choose wisely!

The moral of the story….
• Think Ahead !


