Bioproducts from agroindustrial residues Luiziana Ferreira da SILVA Lab of Bioproducts Institute of Biomedical Sciences University of São Paulo USP Brazil PRIBOP CYTED-IBEROAMERICAN BIOPLASTIC NETWORK
Transcript
Bioproducts from agroindustrial residues
Luiziana Ferreira da SILVA
Lab of Bioproducts
Institute of Biomedical Sciences University of São Paulo USP
Brazil
PRIBOP CYTED-IBEROAMERICAN BIOPLASTIC NETWORK
Some bioproducts under study
• Polyhydroxyalkanoates (PHA)
• Ethanol
• 1,2 propanediol
• Rhamnolipids
PHA are accumulated as intracelular granules by bacteria
C4 & C5 Short-chain length monomers PHA scl
C6 & C12 Medium-chain length monomers PHA mcl
Features influencing PHA monomer composition
Monomer composition is responsible for PHA properties and applications
PHA production integrated to a sugar and etanol mill.
Glycerol
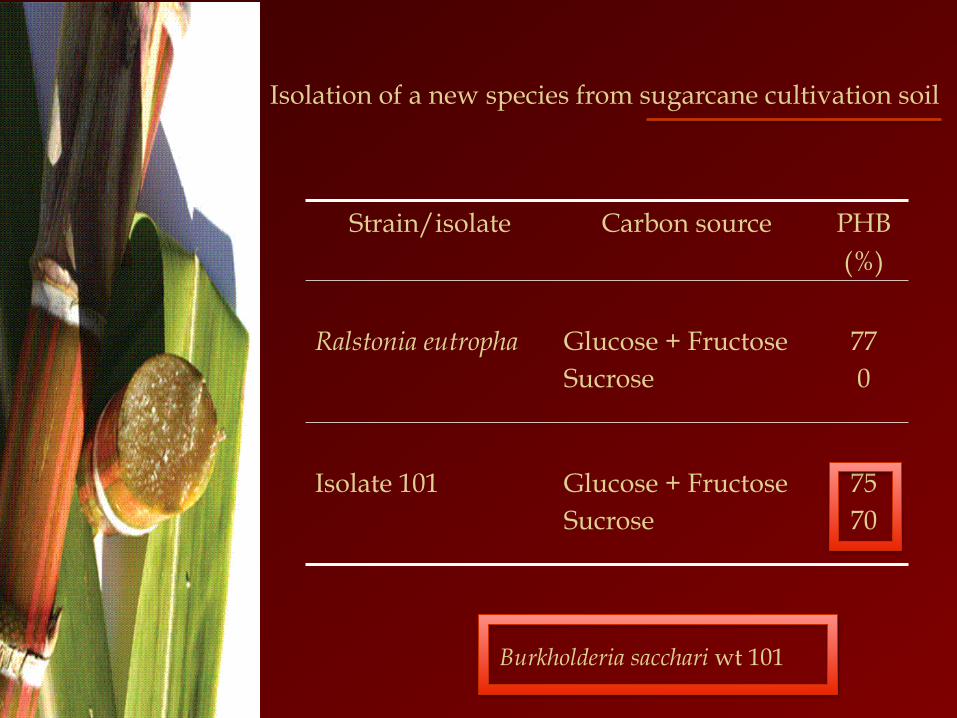
Isolation of a new species from sugarcane cultivation soil
Strain/isolate Carbon source PHB (%)
Ralstonia eutropha
Glucose + Fructose Sucrose
77 0
Isolate 101
Glucose + Fructose Sucrose
75 70
Burkholderia sacchari wt 101
Improvement to
incorporate 3HV units
Strain Phenotype/ strategy
3HB mol%
3HV mol%
Y3HV/prp* g/g
B. sacchari wild type 93.8 6.2 0.10
189 prp UV mutant 43.6 56.4 0.90
189 Sucrose:propionate feeding rates
92.0 18.0 1.27
*Y3HV/prp = 3HV yield from propionic acid
Maximum theoretical yield = 1.35 g/g
P3HB-co-3HV from sucrose and propionic acid
Inactivation on the propionate
catabolic pathway
2MCC = 2 methyl citrate cycle
3HV content is dependent on propionic acid concentration
acnM/prpC deletion
2MCC is more operative
at low prp concentrations.
A second prp catabolic
pathway do exist?
Control on 3HV content
Sucrose:propionic ratio in the feeding media
B. sacchari accumulates up o 2 mol% 3HHx from hexanoic acid
0
0,5
1
1,5
2
2,5
0 0,5 1 1,5 2
3HH
x (m
ol%
)
Hexanoic acid (g/L)
Glucose 10 g/L
B. sacchari can incorporate 3HHx from butyric acid
Glucose (5 g/L), 72 h experiment, CDW= cell dry weigth, average of 3 experiments
3HHx fraction on PHA can be controlled Different fatty acids can be used as precursors
Collaboration submitted to FAPESP BE-Basic Call: Biological production of medium-chain fatty acids from low-grade biomass and its application to produce biodegradable polyesters by bacteria USP & Waste2Chemical - LF Silva & K. Steinbusch
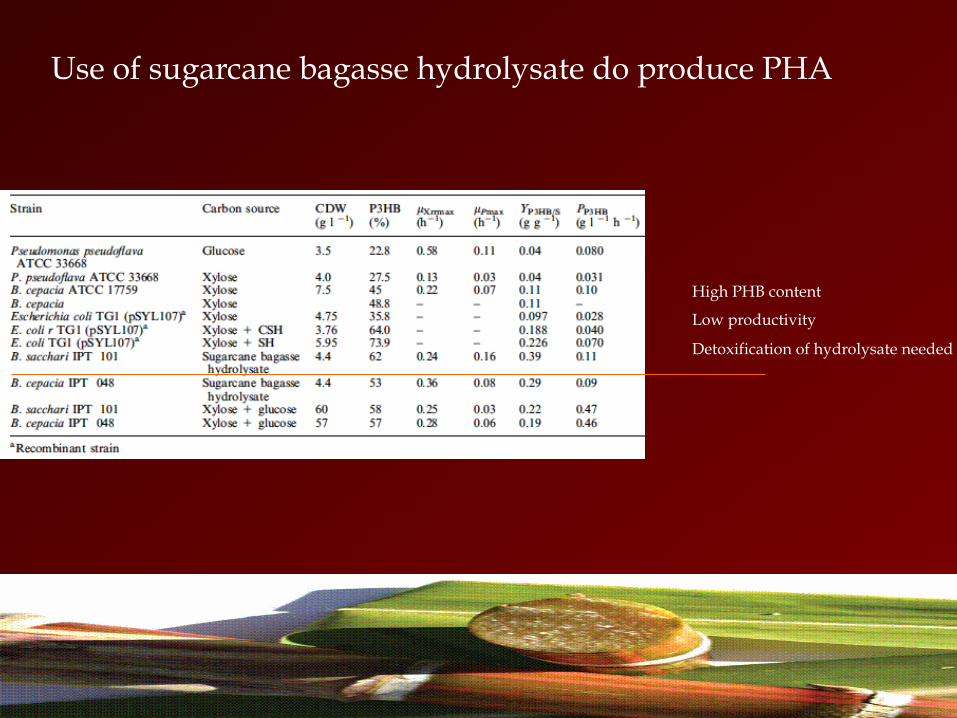
Use of sugarcane bagasse hydrolysate do produce PHA
Performance in sugar mixtures (bagasse hydrolysate main sugars)
- PPHB is 40% lower in xylose than in glucose
- In sugar mixtures parameters were lower: %PHB, YPHB/C e PPHB.
Bacillus megaterium
Abolishing catabolite repression of natural PHB+ isolates
Growth experiments in triple sugar mixtures with wild type B. sacchari wild type (solid line) and B. sacchari PTS-Glucose+ (dotted line): (▲) biomass, (-) glucose, (+) arabinose and (●) xylose.
Deletion on PTS genes B. sacchari
Abolishing catabolite repression of natural PHB+ isolates
PHB production experiment in triple sugar mixture with ammonium for wild type B. sacchari IPT101 (solid line) and B. sacchari LFM828 PTS-Glucose+ (dotted line): (-) glucose, (+) arabinose, (●) xylose, (▲) biomass, and (■) PHB content of the cell dry weight (%PHB).
PHB% PPHB were not improved
Abolishing catabolite repression of natural PHB+ isolates
PHB production by B. megaterium (solid line) andB. megaterium ΔccpA MSL7 (dashed line) in mineral media supplemented with glutamate and sugar mixtures: (♦) glucose, (+) arabinose, (■) xylose, (▲) cell dry weight (CDW), (x) PHB content from cell dry weight (%PHB) and, (○) CO2 production.
Deletion on ccpA genes B. megaterium
New screening from hawaiian soil Back to biodiversity
PHA production experiments with soil isolates in mineral media supplemented with xylose (20 g l-1). The initial inocullum was around 1.5 g l-1 for all cultures.
Burkholderia sp
Isolate F24 (Burkholderia sp) can use toxic compounds from sugarcane hydrolysate
Growth experiment with F24 in mineral media with xylose (10 g l-1) and individual compounds: (■) 2.5 g l-1 of acetic acid, (▲) 1.25 g l-1 of formic acid, (♦) control experiment only with xylose, (●) 0.5 g l-1 of HMF, and (x) 0.5 g l-1 of furfural.
Effect of the inoculum size (g l-1) on utilization of hydrolysates (g l-1), cell growth (g l-1) and PHA biosynthesis (% of PHA of the cell dry weight) in hydrolysate medium after 48 hours
Effect of hydrolysate concentration in high cell density cultivation with Burkholderia sp. F24: (♦) cell dry weight (■) percentage of PHA .of cell dry weight. Solid line represents the hydrolysate and the dotted line represents de hydrolysate concentrated 3 times.
Burkholderia sp F24 using sugarcane bagasse hdrolysate to produce PHB
PPHB= 0.28 g.l-1 h-1
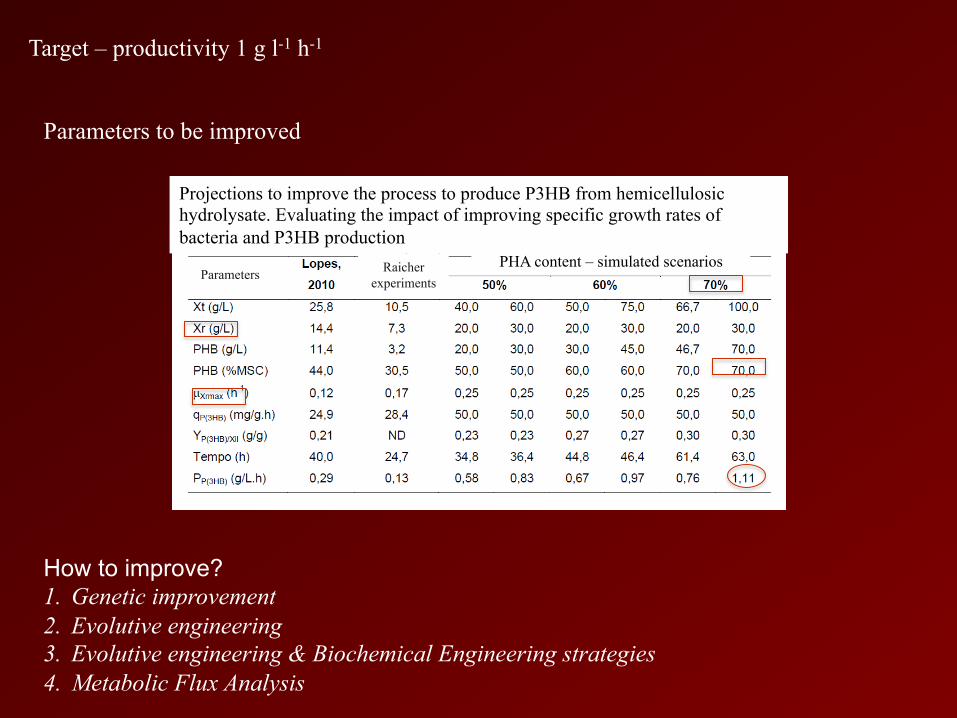
Economic assessment of biopolymer production integrated to a sugar and ethanol mill
Raicher, 2012
Projections to improve the process to produce P3HB from hemicellulosic hydrolysate. Evaluating the impact of improving specific growth rates of bacteria and P3HB production
How to improve? 1. Genetic improvement 2. Evolutive engineering 3. Evolutive engineering & Biochemical Engineering strategies 4. Metabolic Flux Analysis
Team and Financial Support
Dr. J.Gregório C. Gomez Dr. Luiziana F. Silva Dr. Marilda Keico Taciro Dr. Ruben Sanchez (UENF) Dr. Rogério S. Gomes Dr. Gil Raicher MSc. Thatiane T. Mendonça MSc. Daniela C. P. Lício MSc. Y. Paola Galindo-Rozo MSc. Karen L. Almeida MSc. Linda Guaman
Johana K. Bocanegra-Rodriguez Rominne K.B. Freire Karinna Chouman Liege A. Kawai Nathália G.F. Machado Débora Parrine Sant’ana Amanda B. Flora Kelli Lopes Gabriela Lozano Carlos Fajardo Juliano Cherix Thandara Garcia Rafaela Tavares Mariana N. Limas Lucas Cespedes Elisa Gragnani Aelson L. Santos
Colaboration
• Zanotto, S.P. University of the Amazon Estate, Brazil
• Lopes, MSG. Braskem Brazil • Sanchez, R. Advanced Materials Laboratory, UENF Rio de Janeiro, Brazil • Gosset, G. Cell Biology and Biocatalysis Lab, UNAM, Mexico • Hillen, W. Microbiology Institut, Friedrich-Alexander University ,Germany • Yu, J. Hawaii Natural Energy Institute, University of Hawaii
• Steinbusch, K, van Stralen, N. Waste2Chemical, The Netherlands